quantitative assessment of selected policy instruments using
TRANSCRIPT

IIIEE Reports 2004: 10
Quantitative assessment of selected policy instruments using the Western European MARKAL
model
Phase III EU SAVE “White and Green” Project: Comparison of market-based instruments to promote energy efficiency
Luis Mundaca
Federico Santi

This report is part of the third phase of the EU SAVE project N° 4.1031/Z/02-005: Comparison of market-based instruments to promote energy efficiency (so-called the “White and Green” Project). The partners in the consortium are the International Institute for Industrial Environmental Economics at Lund University, Copernicus Institute at Utrecht University, the Italian Association of Energy Economists and Sydkraft AB. Financial support from the EU Commission is gratefully acknowledged. The views and opinions expressed in this report are those of the individual authors only. Neither the EU Commission nor the International Institute for Industrial Environmental Economics (IIIEE) at Lund University are liable for any use that may be made of the information contained herein. This report is believed to contain correct information. However no warranty is made, or legal responsibility assumed, for the accuracy, completeness or usefulness of any information enclosed in this report. © You may use the contents of the IIIEE publications for informational purposes only. You may not copy, lend, hire, transmit or redistribute these materials for commercial purposes or for compensation of any kind without written permission from IIIEE. When using IIIEE material you must include the following copyright notice: ‘Copyright © IIIEE, Lund University. All rights reserved’ in any copy that you make in a clearly visible position. You may not modify the materials without the permission of IIIEE.
Published in 2004 by IIIEE, Lund University, P.O. Box 196, S-221 00 LUND, Sweden,
Tel: +46 – 46 222 02 00, Fax: +46 – 46 222 02 10, e-mail: [email protected]://www.iiiee.lu.se
ISSN 1650-1675
- i -

Acknowledgements The authors of this report want to give a special recognition to Mr. GianCarlo Tosato (Energy Technology Systems Analysis Programme) for his endless and great support during the development of this modelling work. We would also like to thank Mr. Thomas B. Johansson, Mr. Ugo Farinelli, Mr. Kes McCormick (IIIEE at Lund University), Mr. Vlasis Oikonomou and Mr. Martin Patel (Copernicus Institute at Utrecht University) for useful comments and suggestions on draft version of this report.
Lund, December 2004
- ii -

Summary This report summarises the modelling exercise carried out in order to assess the implications of selected policy instruments using the energy model of Western Europe (WEU) generated by the Market Allocation (MARKAL) modelling tool. The chosen methodology was the usage of the WEU MARKAL model for analysing the response of this energy system to the following policy instruments: “White Certificates”, “Green Certificates”, and “Carbon Dioxide (CO2) emissions trading”. Results show that the order of magnitude of the effects of the analysed instruments depends on the target/cap that is applied. For the case of “White Certificates”, it can be observed that up to certain level (i.e., around 15% of cumulated energy savings by 2020 compared to the base case) energy savings are obtained at negative costs. Major savings occur in the residential sector for all the applied targets. Results for CO2 emissions appear to be robust for the years 2015 and 2020, but it should also be observed that these emission trends are less robust for the years 2005 and 2010. Energy efficiency improvements for the WEU economy that are policy-induced around 6%, 9% and 15% for the low, medium and high target scenarios respectively. For the case of “Green Certificates”, results show that the sustained penetration of renewable energy sources (RES) is dominated by wind and biomass. By examining the autonomous fossil fuel intensity of the WEU economy, energy efficiency improvements that are policy induced account for around 1%, 4% and 6% for each scenario respectively. All the targets are technically possible. For the case of “CO2 emissions trading”, due to the fact that these results address just the power sector, they must be seen as complementary of other modelling works that deal with a wider industrial coverage. In our case, the more ambitious the cap is, the lower the share of fossil fuels in electricity production becomes. The different trends for the electricity production seem to be less robust. Compared to the base case, electricity production is higher for the period 2010-2020 in all the analysed scenarios but lower for the period 2025-2030. Efficiency improvements that are induced by this instrument accounted for 2%, 5% and 7% for the low, medium and high target scenarios respectively. The results presented in this report should be interpreted carefully. As any energy system modelling effort, there are some limitations to be considered when interpreting results and drawing policy conclusions. Keywords: CO2 emissions trading, Energy Efficiency, Green Certificates, MARKAL, Western Europe, White Certificates
- iii -

Table of Contents
1. Introduction .............................................................................................................................. 1 2. Main assumptions of the Western European MARKAL Model ...............................................2
2.1 Origin of the model ..................................................................................................................................2 2.2 Geographic considerations ......................................................................................................................2 2.3 End-use sectors and structure of the model .........................................................................................3 2.4 Environmental emissions.........................................................................................................................5 2.5 Economic and demographic drivers ......................................................................................................5 2.6 Energy service demands (2000-2025) ....................................................................................................6
3. Policy instruments under analysis ............................................................................................9 3.1 White Certificate Scheme.........................................................................................................................9 3.2 Black Certificate Scheme..........................................................................................................................9 3.3 Green Certificate Scheme ......................................................................................................................10
4. Main findings.......................................................................................................................... 12 4.1 White Certificate Scheme.......................................................................................................................12
4.1.1 Analysed scenarios .............................................................................................................................12 4.1.2 Summary of results.............................................................................................................................13 4.1.3 Results for the residential sector ......................................................................................................16 4.1.4 Results for the commercial sector ...................................................................................................21 4.1.5 Financial aspects .................................................................................................................................26 4.1.6 Energy intensity ..................................................................................................................................26
4.2 Black Certificate Scheme........................................................................................................................28 4.2.1 Analysed scenarios .............................................................................................................................28 4.2.2 Electricity production fuel selections ..............................................................................................29 4.2.3 Financial aspects .................................................................................................................................35 4.2.4 Energy intensity (fossil fuels)............................................................................................................36
4.3 Green Certificate Scheme ......................................................................................................................38 4.3.1 Analysed scenarios .............................................................................................................................38 4.3.2 Electricity production fuel selection................................................................................................38 4.3.3 Financial aspects .................................................................................................................................41 4.3.4 Energy intensity (fossil fuels)............................................................................................................42
5. Conclusions.............................................................................................................................44 References .......................................................................................................................................46 Annex 1: A brief introduction to MARKAL.....................................................................................47 Annex 2: Supportive tools................................................................................................................50 Annex 3: White Certificates scenarios results .................................................................................54
a) Comparison of four scenarios ....................................................................................................................54 b) Detailed results for each scenario ..............................................................................................................65 c) Financial aspects ...........................................................................................................................................97 d) Data tables .................................................................................................................................................. 100
- iv -

List of Figures Figure 1: Schematic representation of the WEU energy system ...........................................................................4 Figure 2: Final energy consumption for the residential and commercial sectors under different energy
savings scenarios (All fuels) .............................................................................................................................13 Figure 3: Energy consumption by fuel in the residential and commercial sector - BASE case......................15 Figure 4: Energy consumption by fuel in the residential and commercial sector – Medium target scenario
for White Certificates........................................................................................................................................15 Figure 5: Energy consumption by fuel in the residential sector - BASE case ...................................................16 Figure 6: Energy consumption by fuel in the residential sector - Medium target scenario for White
Certificates ..........................................................................................................................................................17 Figure 7: Natural Gas consumption by service demand in the residential sector under BASE case ............18 Figure 8: Natural Gas consumption by service demand in the residential sector – Medium target scenario
for White Certificates........................................................................................................................................18 Figure 9: Electricity consumption by service demand in the residential sector under BASE case ................20 Figure 10: Electricity consumption by service demand in the residential sector – Medium target scenario20 Figure 11: Energy consumption by fuel in the Commercial sector - BASE case .............................................21 Figure 12: Energy consumption by fuel in the Commercial sector – Medium target scenario for White
Certificates ..........................................................................................................................................................22 Figure 13: Natural Gas consumption by service demand in the commercial sector under BASE case........24 Figure 14: Natural Gas consumption by service demand in the commercial sector – Medium target
scenario for White Certificates ........................................................................................................................24 Figure 15: Electricity consumption by service demand in the commercial sector under BASE case ...........25 Figure 16: Electricity consumption by service demand in the commercial sector – Medium target scenario
for White Certificates........................................................................................................................................25 Figure 17: Trade-off curve - Energy savings vs. average energy system costs ..................................................26 Figure 18: Energy intensities for various White Certificate scenarios ................................................................27 Figure 19: Analysed CO2 emissions scenarios for the power sector...................................................................29 Figure 20: Electricity production fuel selections – BASE case............................................................................31 Figure 21: Electricity production fuel selections – High target scenario on CO2 emissions ..........................31 Figure 22: RES Electricity production fuel selections – Base case .....................................................................32 Figure 23: RES Electricity production fuel selections – Low target scenario ...................................................33 Figure 24: RES Electricity production fuel selections – Medium target scenario ............................................33 Figure 25: RES Electricity production fuel selections – High target scenario ..................................................34 Figure 26: Estimated value of Black Certificates under different CO2 caps for the power sector ................35 Figure 27: Electricity price under different CO2 caps ...........................................................................................36 Figure 28: Fossil fuel intensities for various Black Certificate scenarios............................................................37 Figure 29: Electricity production fuel selections – BASE case............................................................................39 Figure 30: Electricity production fuel selections – Medium target scenario for RES (non-hydro) ...............39 Figure 31: CO2 emissions from the electricity sector ............................................................................................41 Figure 32: Estimated value of Green Certificates and electricity.........................................................................42 Figure 33: Fossil fuel intensities for various Green Certificate scenarios ..........................................................43 Figure 34: MARKAL Building Blocks .....................................................................................................................48 Figure 35: Energy intensity for WEU MARKAL model and PRIMES .............................................................53 List of Tables Table 1: Data sources of SAGE..................................................................................................................................5 Table 2: Demand drivers for the WEU BASE Case scenario................................................................................5 Table 3: Energy service demands in the WEU MARKAL Model (PJ if not indicated) ....................................7 Table 4: Units of measurement in SAGE & MARKAL.........................................................................................8 Table 5: Tradable Green Certificates Schemes in some European countries ...................................................10 Table 6: Summarized set of results for White Certificates ...................................................................................14 Table 7: Electricity production fuel selections in Black Certificate Scheme......................................................30 Table 8: Electricity production from RES under Black Certificates ...................................................................34 Table 9: Electricity production from RES under Green Certificates..................................................................40 Table 10: Measures for residential and commercial sectors not included in WEU MARKAL......................51
- v -

1. INTRODUCTION This report summarises the modelling exercise carried out in order to assess the implications of selected policy instruments using the energy model of Western Europe (WEU) generated by the Market Allocation (MARKAL) modelling tool. This modelling exercise was done as part of Phase 3 of the EU SAVE project entitled, A Comparison of Market Mechanisms for Energy Efficiency (also known as the “White and Green” project).1 The “White and Green” project aims at identifying the best characteristics of a market-based mechanism to increase the efficiency of final energy utilisation and analyse the effect of the various choices, using the experience obtained with instruments that are already implemented and assessment of innovative policies and measures, which have been proposed. During Phase 1 of the “White and Green” project, an inventory of innovative policy and measures (P&M) for increasing efficiency of energy use, with an emphasis on market-based mechanisms, was developed. In Phase 2, three P&M were selected for in-depth analysis. Phase 3 of the “White and Green” project entails the quantitative analysis of the effects of the three selected P&M by optimisation and simulation modelling.2 Under this modelling exercise project, the usage of MARKAL (see Annex 1: A brief introduction to MARKAL) was envisaged for carrying out the quantitative analysis of the effects of selected P&M addressing energy efficiency, in order to compare the response of the energy system of Western European to the following policy instruments: a) Energy Efficiency Certificate Schemes (so-called “White Certificate” schemes); b) Renewable Energy Certificate Scheme (so-called “Green Certificate” schemes); and c) Carbon Dioxide (CO2) Emissions Trading Scheme (so-called “Black Certificate” schemes). This report aims at summarizing the extensive results generated by this modelling exercise, which evaluates the selected policies and measures using the WEU MARKAL model. The first section of the report is devoted to the description of the WEU MARKAL model, which was used to assess the above mentioned policy instruments. The second section briefly describes the selected P&M under analysis. The third section of this report focuses on the results of the modelling work. Detailed results can be found in the annexes. Finally, the fourth section of the report draws some conclusions.
1 For further information visit www.iiiee.lu.se/whiteandgreen2 The “White and Green” project envisaged the assessment of selected policies and measures addressing directly or indirectly higher energy efficiency in different countries (Italy, Germany, Estonia), including the Western Europe as a single region.
- 1 -

2. MAIN ASSUMPTIONS OF THE WESTERN EUROPEAN MARKAL MODEL
2.1 Origin of the model The Western European (WEU) MARKAL model used in this modelling exercise builds on the work carried out by the Energy Information Administration of the US Department of Energy (EIA-DOE) for the production of the International Energy Outlook, starting in 2003.3 This organization has developed the System for Analysis of Global Energy markets (also called SAGE) in order to examine a wide range of global energy issues, integrating a set of regional models. In SAGE, 15 regions are identified based upon political, geographical and environmental factors. Each region of SAGE is either a country or a group of countries, as follows:
• Africa • Australia-New Zealand • Canada • Central and South America • China • Eastern Europe • Former Soviet Union • India • Japan • Mexico • Middle-East • Rest of Asia • South Korea • United States • Western Europe
For each region in SAGE, input information regarding energy service demands are developed using economic and demographic projections. Furthermore, projections of energy consumption to meet these needs are estimated from information on energy use patterns, existing and available new technologies, and potential sources of primary energy supply. The following section depicts general information and summaries the data concerning the WEU MARKAL model, including the changes, developments and improvements over the original brought on during the execution of this project. In addition, Annex 2: Supportive tools gives an overview of the usage of MURE, ICARUS and PRIMES as supportive tools for the development of this modelling exercise. The utilization of these tools was an important research step, in particular for the crosscheck of technology databases.
2.2 Geographic considerations First, the energy system in the Western European is treated as a single geographic region rather than distinct countries. The WEU MARKAL model, developed for SAGE, includes the following countries:
• Austria • Belgium
3 This section gives an overview of the WEU MARKAL model. For further technical details please visit Model Documentation Report: System for the Analysis of Global Energy Markets Volume I & II. Available [online]: http://www.eia.doe.gov/bookshelf/docs.html [Accessed: 28 October, 2003]
- 2 -

• Denmark • Finland • France a • Germany • Gibraltar • Greece • Greenland • Iceland • Ireland • Italy b • Luxembourg • Malta • Netherlands • Norway • Portugal • Spain • Sweden • Switzerland c • United Kingdom
a Includes Monaco b Includes San Marino and Vatican City c Includes Liechtenstein Although greater geographic details might be desirable, a multi-regional WEU MARKAL model does not yet exist4. Among the disadvantages of using a non-disaggregate model is that locally energy-related opportunities cannot be identified (Zongxin et al., 2001). However, its main advantage is that the complexity of the model is reduced as well as the required input data.
2.3 End-use sectors and structure of the model With regard to the structure and terminology of the model, the demands for energy services are grouped in five energy consumption or end-use sectors: residential (RES), commercial (COM), agriculture (AGR), industrial (IND) and transportation (TRA). The energy system that supplies the 5 end-use sectors is split in electricity production (ELC) and upstream/downstream (UPS) producing primary and secondary energy carriers other than electricity.5 The WEU energy system entails the energy commodities that are extracted or imported, processed by technologies, and ultimately consumed by end-use technologies to satisfy a set of demands for energy services. When it comes to the electricity sector, this entails electricity production, co-generation and heat production. Attention should be given to the fact that self-production of electricity in the industrial sector and heat by power plants or by co-generation is excluded from the electricity sector and is included in the specific sectors. The different resources used by the electricity sector are aggregated into different categories, including fossil fuels, biomass fuels, and non-fossil fuels (hydro, nuclear, non-conventional renewables). The EIA-DOE estimates the ratios based on data provided by the International Energy Agency (IEA). The WEU MARKAL model entails the following elements (also known as the ‘Reference Energy System’):
• Resources • Conversion and process technologies
4 Such disaggregated model will be developed by NEEDS, another EC funded project. After two years 25 national TIMES models will be made available, as well as a pan-European disaggregated model. 5 In the WEU MARKAL model, the production of electricity and consuming technologies involves six time-slices resulting from the combination of three seasons (winter, intermediate, summer) and two daily divisions (day, night).
- 3 -
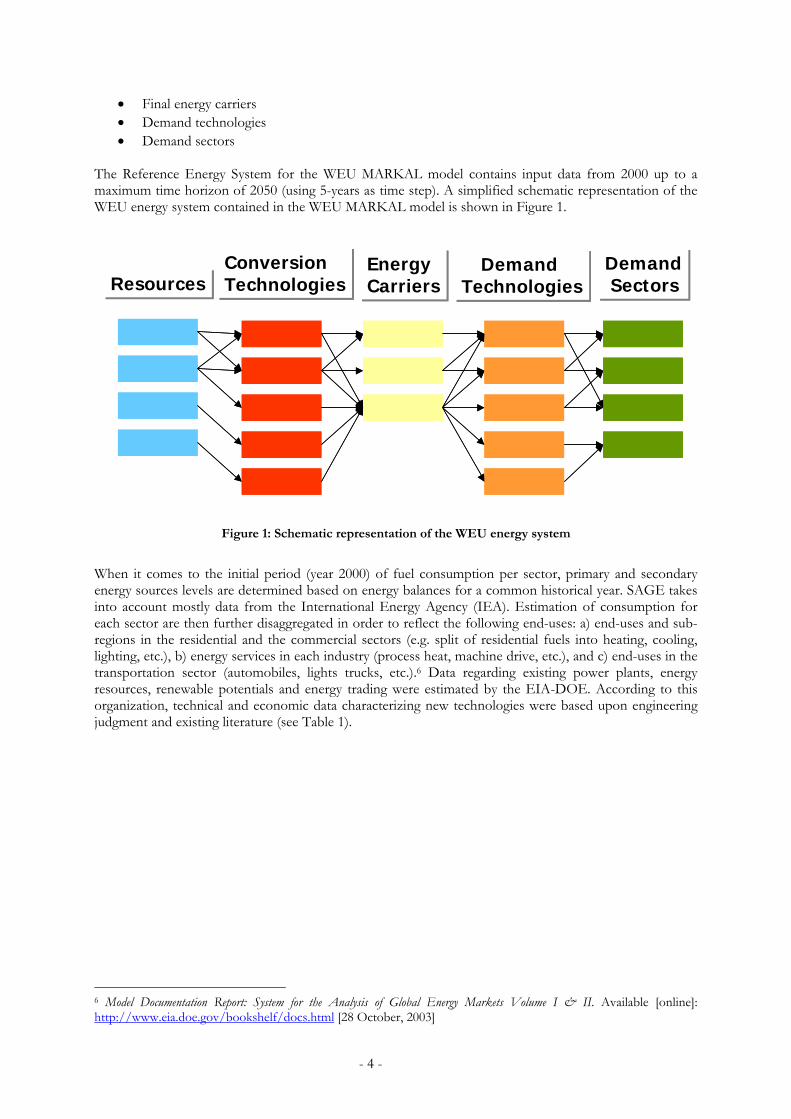
• Final energy carriers • Demand technologies • Demand sectors
The Reference Energy System for the WEU MARKAL model contains input data from 2000 up to a maximum time horizon of 2050 (using 5-years as time step). A simplified schematic representation of the WEU energy system contained in the WEU MARKAL model is shown in Figure 1.
ResourcesResourcesDemandSectors
DemandSectors
EnergyCarriersEnergyCarriers
ConversionTechnologiesConversionTechnologies
Demand Technologies
Demand TechnologiesResourcesResources
DemandSectors
DemandSectors
EnergyCarriersEnergyCarriers
ConversionTechnologiesConversionTechnologies
Demand Technologies
Demand Technologies
Figure 1: Schematic representation of the WEU energy system
When it comes to the initial period (year 2000) of fuel consumption per sector, primary and secondary energy sources levels are determined based on energy balances for a common historical year. SAGE takes into account mostly data from the International Energy Agency (IEA). Estimation of consumption for each sector are then further disaggregated in order to reflect the following end-uses: a) end-uses and sub-regions in the residential and the commercial sectors (e.g. split of residential fuels into heating, cooling, lighting, etc.), b) energy services in each industry (process heat, machine drive, etc.), and c) end-uses in the transportation sector (automobiles, lights trucks, etc.).6 Data regarding existing power plants, energy resources, renewable potentials and energy trading were estimated by the EIA-DOE. According to this organization, technical and economic data characterizing new technologies were based upon engineering judgment and existing literature (see Table 1).
6 Model Documentation Report: System for the Analysis of Global Energy Markets Volume I & II. Available [online]: http://www.eia.doe.gov/bookshelf/docs.html [28 October, 2003]
- 4 -

Table 1: Data sources of SAGE
Data Source Existing (2000) fuel consumption per sector IEA, 2001, calibrated to EIA totals Split of energy consumption for sub-sectors Analyst assumptions GDP, Population (used for demand projections) EIA, United Nations (UN) Number of households, industrial production, vehicle-km driven (current situation)
United Nations, 1997, 2000 and 2001
Primary energy production and secondary energy production (electricity sector, refinery)
IEA, 2001 calibrated to EIA totals
Fossil and renewable resources EIA Existing power plants capacity EIA Refinery capacity EIA, Oil and Gas Journal Energy trading (amount and prices) EIA Existing technologies (cost data) Expert judgment New technologies (technical and cost data) Available literature, SAIC report Emission coefficients NEMS and Environment Canada, 1992,
1997 Source: Energy Information Administration - US Department of Energy. (2003b) Model Documentation Report: System for the Analysis of Global Energy Markets (SAGE). Volume 2. Washington: EIA-DOE.
2.4 Environmental emissions With regard to these emissions as such, they are directly linked at the technology level and at the end-use sectors level. In the WEU MARKAL model, sector emissions are converted into CO2 equivalents by using their Global Warming Potential (GWP) (21 for CH4 and 310 for N2O). As environmental and health impacts are concerned, it is worth to be mentioned that although the model calculates the abatement costs regarding environmental emissions (e.g. € per ton of CO2), related costs and benefits of environmental and health impacts resulting from such emissions are not calculated. Therefore, caution is needed for the added costs to the total energy system costs that the model calculates for limiting atmospheric emissions (e.g. CO2, N2O, etc.).
2.5 Economic and demographic drivers When it comes the used discount rate, the WEU MARKAL model has a 10% as default figure, which serves as a common ground for comparison for all the SAGE MARKAL regional models. However, in our case the WEU MARKAL does not interact with other SAGE regional models giving room for using a more suitable value for the case of Europe. Following the discount rates provided by Central European Bank a 5% discount rate is finally used in all our modeled scenarios, including the base case. In order to project energy service demand for the different end-use energy sectors, economic and demographic drivers are used. These drivers underlie the demand projections (see Table 2). Population and GDP projections are based on official data from UN and EIA. Table 2: Demand drivers for the WEU BASE Case scenario
Driver No 2000 2005 2010 2015 2020 2025 GDP (1997 Billions US$) 1 9312 10378 11694 13125 14724 16395Population (Millions) 2 389 391 391 389 387 385GDP/Population 3 24 27 30 34 38 43Housing Stock Total (Millions) 4 148 152 155 158 161 164
Source: Energy Information Administration - US Department of Energy. (2003b) Model Documentation Report: System for the Analysis of Global Energy Markets (SAGE). Volume 2. Washington: EIA-DOE.
- 5 -

2.6 Energy service demands (2000-2025) In the WEU MARKAL, energy service demands of the base case are exogenous variables (user-defined). The developers of the WEU MARKAL model forecast future energy service demands by using estimates of demand drivers (as presented in Table 2) such as population, GDP and housing stocks. Further figures were estimated based on IEA documents. Table 3 shows all energy service demands for each sector. With the exemption of the agriculture sector, the rest contains different segments for specific energy demands. One column indicates the driver used to project each energy service demand. The actual demands for energy services in each scenario are different: each exogenous demand in each time period fluctuates around the base case value, because it depends on own prices with elasticities specified in the last column of Table 3.
- 6 -
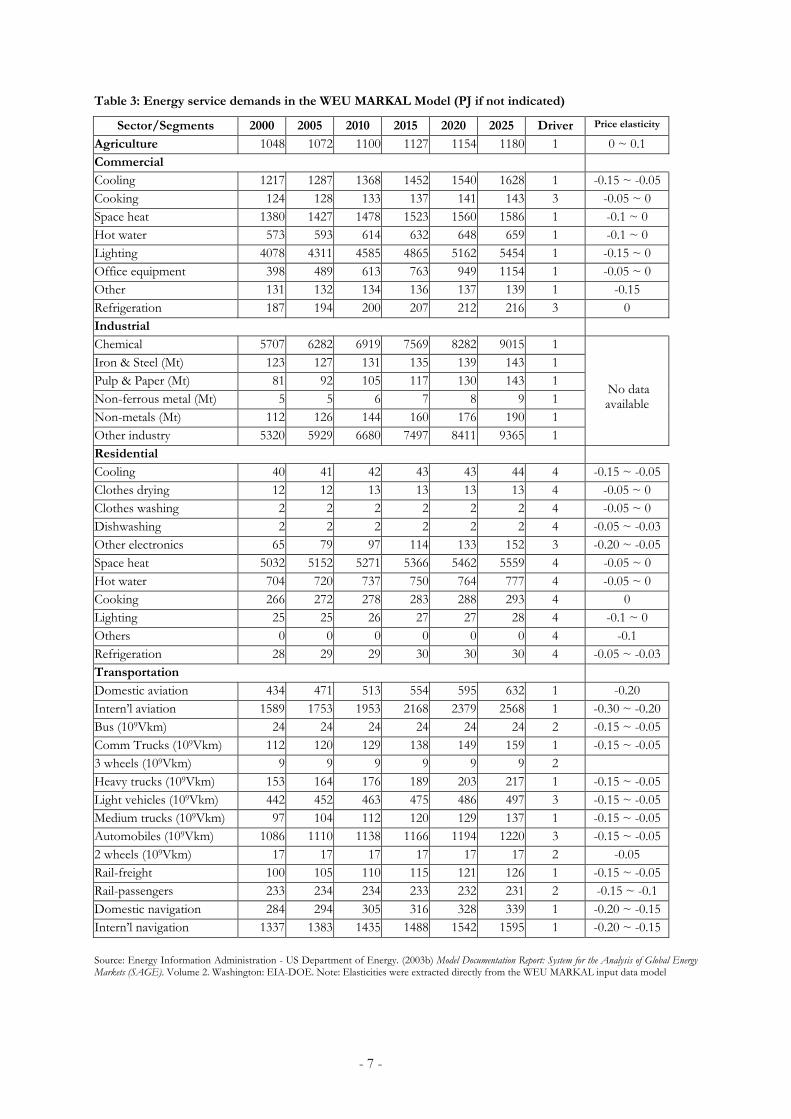
Table 3: Energy service demands in the WEU MARKAL Model (PJ if not indicated)
Sector/Segments 2000 2005 2010 2015 2020 2025 Driver Price elasticity
Agriculture 1048 1072 1100 1127 1154 1180 1 0 ~ 0.1 Commercial Cooling 1217 1287 1368 1452 1540 1628 1 -0.15 ~ -0.05Cooking 124 128 133 137 141 143 3 -0.05 ~ 0 Space heat 1380 1427 1478 1523 1560 1586 1 -0.1 ~ 0 Hot water 573 593 614 632 648 659 1 -0.1 ~ 0 Lighting 4078 4311 4585 4865 5162 5454 1 -0.15 ~ 0 Office equipment 398 489 613 763 949 1154 1 -0.05 ~ 0 Other 131 132 134 136 137 139 1 -0.15 Refrigeration 187 194 200 207 212 216 3 0 Industrial Chemical 5707 6282 6919 7569 8282 9015 1 Iron & Steel (Mt) 123 127 131 135 139 143 1 Pulp & Paper (Mt) 81 92 105 117 130 143 1 Non-ferrous metal (Mt) 5 5 6 7 8 9 1 Non-metals (Mt) 112 126 144 160 176 190 1 Other industry 5320 5929 6680 7497 8411 9365 1
No data available
Residential
Cooling 40 41 42 43 43 44 4 -0.15 ~ -0.05Clothes drying 12 12 13 13 13 13 4 -0.05 ~ 0 Clothes washing 2 2 2 2 2 2 4 -0.05 ~ 0 Dishwashing 2 2 2 2 2 2 4 -0.05 ~ -0.03Other electronics 65 79 97 114 133 152 3 -0.20 ~ -0.05Space heat 5032 5152 5271 5366 5462 5559 4 -0.05 ~ 0 Hot water 704 720 737 750 764 777 4 -0.05 ~ 0 Cooking 266 272 278 283 288 293 4 0 Lighting 25 25 26 27 27 28 4 -0.1 ~ 0 Others 0 0 0 0 0 0 4 -0.1 Refrigeration 28 29 29 30 30 30 4 -0.05 ~ -0.03Transportation
Domestic aviation 434 471 513 554 595 632 1 -0.20 Intern’l aviation 1589 1753 1953 2168 2379 2568 1 -0.30 ~ -0.20Bus (109Vkm) 24 24 24 24 24 24 2 -0.15 ~ -0.05Comm Trucks (109Vkm) 112 120 129 138 149 159 1 -0.15 ~ -0.053 wheels (109Vkm) 9 9 9 9 9 9 2 Heavy trucks (109Vkm) 153 164 176 189 203 217 1 -0.15 ~ -0.05Light vehicles (109Vkm) 442 452 463 475 486 497 3 -0.15 ~ -0.05Medium trucks (109Vkm) 97 104 112 120 129 137 1 -0.15 ~ -0.05Automobiles (109Vkm) 1086 1110 1138 1166 1194 1220 3 -0.15 ~ -0.052 wheels (109Vkm) 17 17 17 17 17 17 2 -0.05 Rail-freight 100 105 110 115 121 126 1 -0.15 ~ -0.05Rail-passengers 233 234 234 233 232 231 2 -0.15 ~ -0.1 Domestic navigation 284 294 305 316 328 339 1 -0.20 ~ -0.15Intern’l navigation 1337 1383 1435 1488 1542 1595 1 -0.20 ~ -0.15 Source: Energy Information Administration - US Department of Energy. (2003b) Model Documentation Report: System for the Analysis of Global Energy Markets (SAGE). Volume 2. Washington: EIA-DOE. Note: Elasticities were extracted directly from the WEU MARKAL input data model
- 7 -

The residential sector includes 11 energy services (e.g. space heating, space cooling, hot water, cooking, etc.), the commercial sector includes 8 segments (electric equipments, lighting, cooking, etc.). It is important to mention that according to the EIA-DOE, due to the fact that neither the IEA energy balances nor any other comprehensive database provides data at the energy service level, expert judgment was used in order to define fuel consumptions within end-use service demands. For the industrial sector, this is characterized with 6 segments (iron and steel, non-ferrous metals, chemicals, pulp and paper, non-metal minerals and other industries). This category was built based on the IEA database. Due to the fact that the IEA database only provides total energy consumption by fuel for the main industries, other numbers were needed to estimate fuel consumption within specific energy services within each industry. The transportation sector is characterized by 14 energy services (e.g. autos, buses, light trucks, national and international aviation, etc.) and 1 non-energy use demand segment. The agricultural sector is represented by a generic value. Table 4 shows the units used in SAGE and the WEU MARKAL. Table 4: Units of measurement in SAGE & MARKAL
Data Unit Energy goods All primary energy vectors (e.g. 1 kWh of electricity is equivalent to about 9.2 GJ/MWh) PJ primary / year All final energy vectors (e.g. 1 kWh of electricity is equivalent to 3.6 GJ/MWh) PJ final / year End-use energy services Transportation: Aviation, Rail, Navigation, Non-Energy Uses Road Transportation Demands Residential Commercial Industry: Non-Ferrous, Iron and Steel, Pulp and Paper Industry: Chemicals, Non-metallic minerals, Other Industries, Non-energy Uses Non-Specified
PJ final of 2000/year Billion vehicle-km/year PJ final of 2000/year PJ final of 2000/year
Mt PJ final of 2000/year PJ final of 2000/year
Capacities Power Plants and CHP (including upstream cogeneration, industrial auto-production and industrial cogeneration) Heat Plants Transportation technologies: Aviation, Rail, Navigation, Non-Energy Uses Other Transportation Technologies Industry Technologies: Non-Ferrous, Iron and Steel, Pulp and Paper Industry Technologies: Chemicals, Non-Metal, Other Industries, Non-Energy Residential Commercial Upstream and Downstream
GW net output
PJ output /year PJ output /year
Billion vehicles-km/year Mt/year
PJ output /year PJ output /year PJ output /year PJ output /year
Emissions CO2 coefficients CH4 coefficients N2O coefficients GHG TOT CO2
Kt CO2/PJ T CH4/PJ T N2O/PJ
Mt CO2 equivalent Kt CO2
Costs Energy commodities Variable costs Investments and fixed operation costs – Power plants and cogeneration Investments and fixed operation costs – Transportation except aviation, rail, navigation, non-energy uses Investments and fixed operation costs – Technologies other than those above
M€/PJ (€/GJ) M€/(PJ/year)
M€/GW (€/kW) M€/(bill vehicles-km/year)
M€/(PJ/year)
Source: Energy Information Administration - US Department of Energy. (2003b) Model Documentation Report: System for the Analysis of Global Energy Markets (SAGE). Volume 2. Washington: EIA-DOE. It is worth to mention that in SAGE all economic values input and output of the model is US$ 2000. However, in the last four years, since the introduction of the €, the market rate of the two currencies has oscillated around a parity of 25%. Since the model averages over 5 years around each time period, within the approximation of the model all economic values can be expressed in Euros.7 7 Personal communication with GianCarlo Tosato.
- 8 -
3. POLICY INSTRUMENTS UNDER ANALYSIS Phase 1 of the “White and Green” project developed an inventory of P&M for increasing efficiency of energy use, with an emphasis on market-based mechanisms. Then, during Phase 2 specific P&M were selected for in-depth analysis. This section briefly depicts the main features of the P&M under assessment so the reader is familiarized with them. For further information about these instruments and the arguments regarding their final selection, please review the documentation of Phase 1 and Phase 2 of the “White and Green” project.
3.1 White Certificate Scheme The system of Tradable Energy Efficiency Certificate Schemes, or so-called “White Certificates”, is a relatively new policy instrument that is currently being tested and researched at a national level namely in the UK and very soon in Italy. As any other “target-and-trade” scheme, the basic principle of this system is the introduction of mandatory energy savings target that certain actors (e.g., distributors of electricity and gas) have to meet. The government sets mandatory targets for energy efficiency improvements relative to a business-as-usual scenario. The targets are usually the outcome of a negotiation process between the government and obligated parties. The latter have an obligation to promote energy efficiency projects to their customers and the energy savings achieved are granted with certificates, which can be traded afterwards. The obligated parties have the opportunity either to implement during the subsequent period energy saving projects with their clients or to buy certificates in order to comply with their obligations. The differentiation of the UK system to the Italian system is that it allows the trading of energy savings on one hand, and the energy obligations on the other. For the energy savings, the suppliers can trade the savings from the energy efficiency measures already completed, and for the obligations, a supplier can pay another supplier to meet all or part of its target, so there will be a shift in their individual targets. The financing of this scheme is provided by mechanisms from which the distributors can increase tariffs to recuperate part of the extra costs incurred by the interventions to increase energy efficiency. These costs, which are not covered by other resources, are in fact limited to the form of energy they distribute (so that the savings determine a decrease of sales and profits) and within the saving objectives required by the law. The key actors in these emerging markets are the suppliers and distributors of energy and gas, energy service companies (ESCOs) and the government or the responsible authority for monitoring and administrating the scheme. The target sectors on the other hand are the non-energy intensive sector, the commercial sector and households, and non-grid connected and small-scale power generation and self supply (excluded from the Renewable Portfolio Standard, RPS).
3.2 Black Certificate Scheme The EU framework directive on greenhouse gas emissions trading, adopted in July 2003, aims to create a market of buyer and seller companies (or operators and installations as referred) for greenhouse gas allowances. The directive proposes two phases: the trial phase from 2005-2007 (1st period, just CO2) and the 2nd phase from 2008-2012 (with probably other GHGs and industrial sectors as part of a wider coverage), covering the initial commitment period of the Kyoto Protocol. The economic principle hidden behind the emissions trading, as any other tradable permit scheme, is that as the cost of emission reductions may vary largely between obligated parties, each party involved in a trade of emission reductions may benefit from the scheme equalizing marginal abatement costs between polluters. The seller of allowances will benefit from the additional profits obtained from the sales. The buyer of allowances will benefit from the cost savings, as the price of purchased credits would be lower than the marginal cost of additional in-the-house reduction measures. Every installation covered by the scheme should apply for a permit, which entitles its owner to emit CO2 emissions. Operation of these installations without a permit is not allowed. Next, the installations will
- 9 -

receive a number of allowances. Member States will set a maximum limit on the amount of emissions from industrial installations. If the installation exceeds that limit, it will be able to buy allowances from other installations that have reduced their emissions. Under the emissions trading scheme it is thus the responsibility of the individual companies or operators to meet their targets and to participate in trading of emission allowances. The following sectors are covered in the proposed EU trading scheme: electricity and heat production and energy-intensive sectors such as mineral oil refineries and coke ovens; iron and steel and metal industries; glass, pottery and building materials (including cement); and paper and printing (including paper pulping). In addition, combustion installations with thermal input larger than 20 MW are included in the system. In practice this means that also the majority of installations in the chemical industry and the aluminium sector are included in the scheme. Capacities of technically linked activities on the same site and capacities carried out by the same operator should be added. A total of over 5,000 installations will be covered by the scheme, responsible for over 45% of the EU’s total CO2 emissions (38% of the EU’s total GHG emissions). The proposed EU-wide CO2 emissions allowance-trading scheme should be implemented in all EU member states and accession countries. The targets in the burden sharing agreement defined under the Kyoto Protocol bind each member state, which has to prepare its national allocation plan in accordance with the specified targets.
3.3 Green Certificate Scheme Another market-based instrument that is used for the stimulation of the growth of the renewable energy market is “Green Certificates”. A scheme like this decouples the physical production of electricity from its green value, which implies that the green value, reflected in a certificate is sold separately from the power produced. The systems are mostly combined with mandatory targets on the share of renewable electricity production, supply or consumption. The producers of green electricity receive “Green Certificates” for each unit that they produce, which they can sell on the market. Several types of schemes are in place in Western Europe, each with its own specifications and combinations of support mechanisms. The following countries have been discussing or have set up a certificate system: Table 5: Tradable Green Certificates Schemes in some European countries
Country Observations Austria System for guarantee of origin based on existing certificate systems and coupled with an
obligation for disclosure and a feed-in tariff for renewables; used to have a system for small-scale hydro power which was abandoned at the end of 2002
Belgium Both in the Flanders and Walloon region; started 2002; coupled to renewable obligation for suppliers
Denmark System proposed, but abandoned because of large objections from the wind industry Italy Started January 2002; coupled to obligation for suppliers and importers and feed-in
tariff system The Netherlands Started July 2001; based on voluntary demand and coupled with financial incentive for
final consumers Norway Under discussion to formulate a certificate system and link this to the Swedish system Sweden Started May 2003. The overall target is to increase the generation of electricity from
renewable energy sources by 10 TWh from the 2002 level by the year 2010. The target is coupled to obligation on final consumers
United Kingdom System started April 2002, coupled to renewable obligation until 2027 The implementation of green certificate schemes increases the flexibility of meeting renewable electricity targets and could in principle lead to reductions of the costs to achieve the targets specified (by creating a large single market with relatively cheap options in some areas). Sellers of green certificates benefit from the additional profits obtained from the sales, as the price of certificates would be higher than the
- 10 -

marginal cost of additional green certificates. The buyer of reductions benefit from the cost savings, as the price of purchased credits would be lower than the marginal cost of additional domestic renewable investments.
- 11 -

4. MAIN FINDINGS As mentioned before, the overall objective of this work is to address the potential implications of implementing selected instruments as far as the Western European energy system is concerned. With the aim to summarize the extensive amount of data generated for every scenario by the WEU MARKAL model, a set of parameters has been selected as a common analytical ground or metric for each modelled instrument. Among others, these parameters (e.g. mix of energy sources for electricity production, CO2 emissions, energy consumption by service demand, energy prices, energy intensities, etc.) give an indication of the selections made by the WEU MARKAL model in order to satisfy the different policy constraints applied and thus the potential implications. The specific purpose of this section is to offer a summary of the scenarios that were analysed. It does not provide a full picture of them, however a detailed discussion is provided for some scenarios. Due to the fact that the main focus of this modelling work is the case of White Certificates, detailed information of all the analysed scenarios can be found in the respective annex.
4.1 White Certificate Scheme With the aim to summarize the extensive results generated for a number of scenarios, we have selected the following parameters: fuel consumption by sectors (residential and commercial), electricity and natural gas consumption by service demand in the residential and commercial sector, CO2 emissions, and energy system costs. These parameters are believed to provide good indications of the selections made by the WEU MARKAL model in order to satisfy the imposed targets on energy consumption in the residential and commercial sectors (see below). The underlying assumption here is also that all energy savings that occur in the residential and commercial sectors are subject of a WhC scheme. This means that we approach WhC as a “target-and-trade” scheme. All energy commodities are included and the analysed time horizon goes from 2000 to 2020. From the modelling point of view, and in order to overcome some elements of rigidity (i.e., the application of any constraint to an energy system that is already optimised involves an extra cost in any case) the modelling approach takes into account market imperfections (e.g., lack of information, technical knowledge, and training; uncertainties about performance of investments, lack of adequate capital or financing possibilities, high initial and perceived costs of more efficient technologies, transaction costs [for searching and assessing information and for training]; lack of incentives for careful maintenance, etc.) possible to simulate like for example financial aspects (e.g. difficulties of access to credit, scarcity of capital available for investments, etc.). This is done by introducing a new apparent discount rate applied to the investments in new energy technologies in the residential and commercial sectors. Such an apparent discount rate, much higher than the social discount rate, attempts to simulate the displacement of the system from the economic optimum from the BASE case scenario. Indeed, Ruderman et al. (1987) point out that an “implicit real discount rate” used in investment decisions in the residential-household sector goes from 35% to 70%. In our case, we select an apparent discount rate of about 30%; which approaches the bottom level given by Ruderman et al. (1987).8
4.1.1 Analysed scenarios Three different scenarios were explored and they attempted to approach the proposed target of 1% cumulative of energy savings (relative to business-as-usual over 6 years) as stated in the proposed EU Directive on energy end-use efficiency and energy services. In addition to the proposed 6-year target, all the analysed scenarios include an extension of energy savings targets that are kept for a longer period of time (i.e., from 2004 up to 2020). These scenarios are as follows: a) low target scenario entails 1% of energy saved from 2004 until 2010 (7% cumulated). From 2010 until 2020 the target is relaxed. It involves a cumulative reduction of 0.35% per year. b) The medium target scenario also entails 1% of energy saved from 2004 until 2010 (7% cumulated). From 2010 until 2020 the target involves a cumulative reduction of
8 Another interesting approach would be to explore different discount rates. However, caution has to be taken in adding many more scenarios and thus adding much more complexity to the analyses.
- 12 -

2% per year. c) The high target scenario entails 2% of energy saved from 2004 until 2010 (14% cumulated). From 2010 until 2020 the target is more ambitious. It involves a cumulative reduction of 4% per year. Targets are expressed in terms of total final energy consumption for both the residential and commercial sectors. See Figure 2.
Final energy consumption for Residential and Commercial sectors under different energy savings scenarios (PJ/year)
0
2,000
4,000
6,000
8,000
10,000
12,000
14,000
16,000
18,000
20,000
2000 2005 2010 2015 2020
BASE
Low target
Medium-target
High-target
Figure 2: Final energy consumption for the residential and commercial sectors under different energy savings scenarios (All fuels)
4.1.2 Summary of results Before addressing the detailed results for a particular scenario, Table 6 attempts to summarize the main results that were obtained for all the scenarios under this target-and-trade WhC scheme. In the low target scenario with cumulative (but relative to the base case as previously mentioned) energy savings of 10% by 2020, the costs of the energy savings are negative by 2020, with a decrease of the average unit cost of the energy system by 0.3 €/GJ (or equal to -4%) with respect to the base case. For the medium target scenario in which energy savings are greater than 1% per year after 2010, the cost of the energy savings are positive. A reduction in consumption by 5 EJ is expected (or 27% compared to the base case) but an increase of the average unit cost of the energy system of 1.1 €/GJ (or equal to +4%) in 2020 with respect to the base case. In this scenario, energy consumption is reduced not only with respect to the base case, but from 2010 on also in absolute terms (see also Figure 2). In the high target scenario, relatively higher costs are seen. As the level of ambition is higher, energy consumption of the residential and service sectors with respect to the base case is reduced by 56% in 2020, with an increase of the average system unit cost of 3.1 €/GJ by 2020 (or +16% compared to the base case).
- 13 -
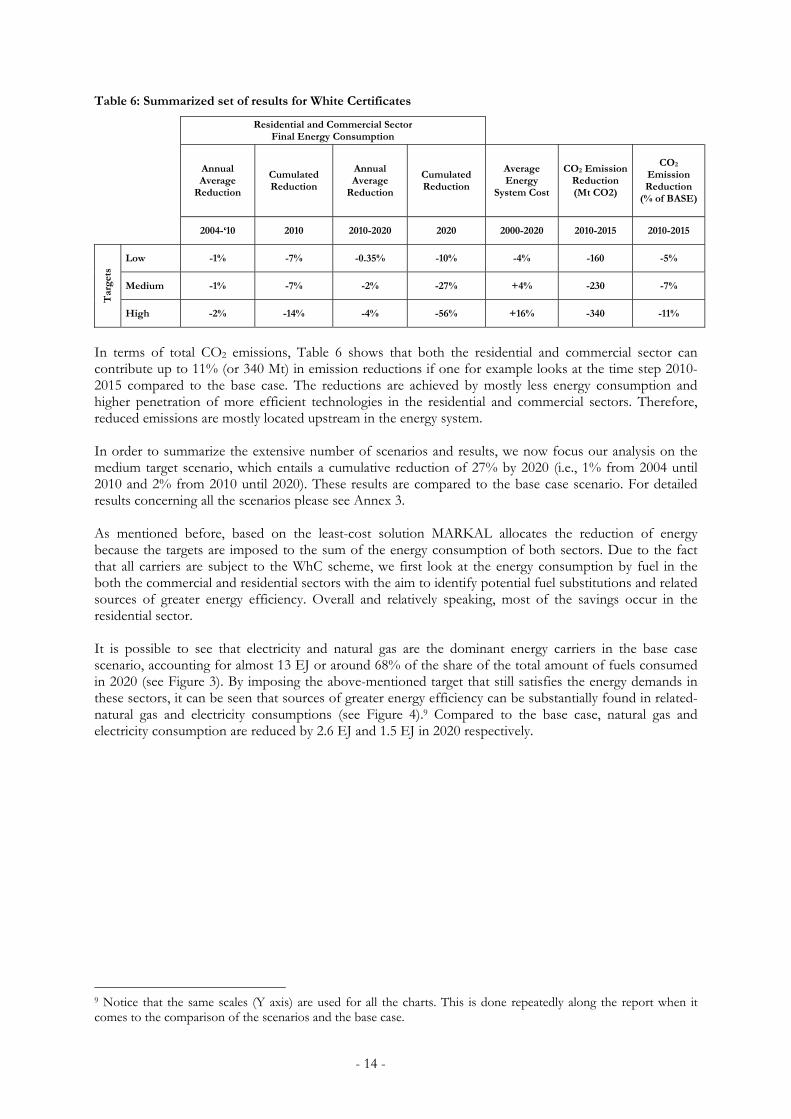
Table 6: Summarized set of results for White Certificates
Residential and Commercial Sector
Final Energy Consumption
Annual Average
Reduction
Cumulated Reduction
Annual Average
Reduction
Cumulated Reduction
Average Energy
System Cost
CO2 Emission Reduction (Mt CO2)
CO2 Emission Reduction
(% of BASE)
2004-‘10 2010 2010-2020 2020 2000-2020 2010-2015 2010-2015
Low -1% -7% -0.35% -10% -4% -160 -5%
Medium -1% -7% -2% -27% +4% -230 -7%
Tar
gets
High -2% -14% -4% -56% +16% -340 -11%
In terms of total CO2 emissions, Table 6 shows that both the residential and commercial sector can contribute up to 11% (or 340 Mt) in emission reductions if one for example looks at the time step 2010-2015 compared to the base case. The reductions are achieved by mostly less energy consumption and higher penetration of more efficient technologies in the residential and commercial sectors. Therefore, reduced emissions are mostly located upstream in the energy system. In order to summarize the extensive number of scenarios and results, we now focus our analysis on the medium target scenario, which entails a cumulative reduction of 27% by 2020 (i.e., 1% from 2004 until 2010 and 2% from 2010 until 2020). These results are compared to the base case scenario. For detailed results concerning all the scenarios please see Annex 3. As mentioned before, based on the least-cost solution MARKAL allocates the reduction of energy because the targets are imposed to the sum of the energy consumption of both sectors. Due to the fact that all carriers are subject to the WhC scheme, we first look at the energy consumption by fuel in the both the commercial and residential sectors with the aim to identify potential fuel substitutions and related sources of greater energy efficiency. Overall and relatively speaking, most of the savings occur in the residential sector. It is possible to see that electricity and natural gas are the dominant energy carriers in the base case scenario, accounting for almost 13 EJ or around 68% of the share of the total amount of fuels consumed in 2020 (see Figure 3). By imposing the above-mentioned target that still satisfies the energy demands in these sectors, it can be seen that sources of greater energy efficiency can be substantially found in related-natural gas and electricity consumptions (see Figure 4).9 Compared to the base case, natural gas and electricity consumption are reduced by 2.6 EJ and 1.5 EJ in 2020 respectively.
9 Notice that the same scales (Y axis) are used for all the charts. This is done repeatedly along the report when it comes to the comparison of the scenarios and the base case.
- 14 -

WEU Markal model - White Certificates Scenarios BASE CASE - Residential and Commercial Sector
Total Final Energy Consumption by energy source (EJ/year)
02468
101214161820
2000 2005 2010 2015 2020
Other SourcesOil ProductsElectricityNatural Gas
Figure 3: Energy consumption by fuel in the residential and commercial sector - BASE case
Figure 4: Energy consumption by fuel in the residential and commercial sector – Medium target scenario for White Certificates
WEU Markal model - White Certificates Scenarios MEDIUM TARGET - Residential and Commercial Sector Total Final Energy Consumption by energy source (EJ/year)
02468
101214161820
2000 2005 2010 2015 2020
Other SourcesOil ProductsElectricityNatural Gas
- 15 -

4.1.3 Results for the residential sector If we now look at the residential sector, a similar trend can be seen. Natural gas and electricity are the dominant energy carriers. They both account for around 60% to 64% of the share of total fuel consumption over the entire analysed period in the base case. Oil products contribute with up to 22% (see Figure 5).
WEU Markal model - White Certificates Scenarios BASE CASE - Residential Sector
Final Energy Consumption by energy source (EJ/year)
0
2
4
6
8
10
12
14
2000 2005 2010 2015 2020
Other SourcesOil ProductsElectricityNatural Gas
Figure 5: Energy consumption by fuel in the residential sector - BASE case
Once the medium target is introduced, energy consumption in the residential sector decreases by 0.5 EJ in 2005, 0.8 EJ in 2010, 1.8 EJ in 2015 and 3.4 in 2020. After 2010, once the target turns out to be 2% per year (instead of 1% per year as for the previous period) the consumption trend is reverted and absolute reductions are achieved (e.g., for 2015 and 2020) compared to 2000. For this sector, most of the savings are related to natural gas consumption and in a lesser degree to electricity. While natural gas consumption decreases around 18% (from 20,5 EJ to 16,8 EJ) from 2000 to 2020, electricity consumption decreases around 7% (from 16,4 EJ to 15,2 EJ). This gives indications that for the residential sector, relatively more savings are related to natural gas consumption than electricity (see Figure 6).
- 16 -

WEU Markal model - White Certificates Scenarios MEDIUM TARGET - Residential Sector
Final Energy Consumption by energy source (EJ/year)
0
2
4
6
8
10
12
14
2000 2005 2010 2015 2020
Other SourcesOil ProductsElectricityNatural Gas
Figure 6: Energy consumption by fuel in the residential sector - Medium target scenario for White Certificates
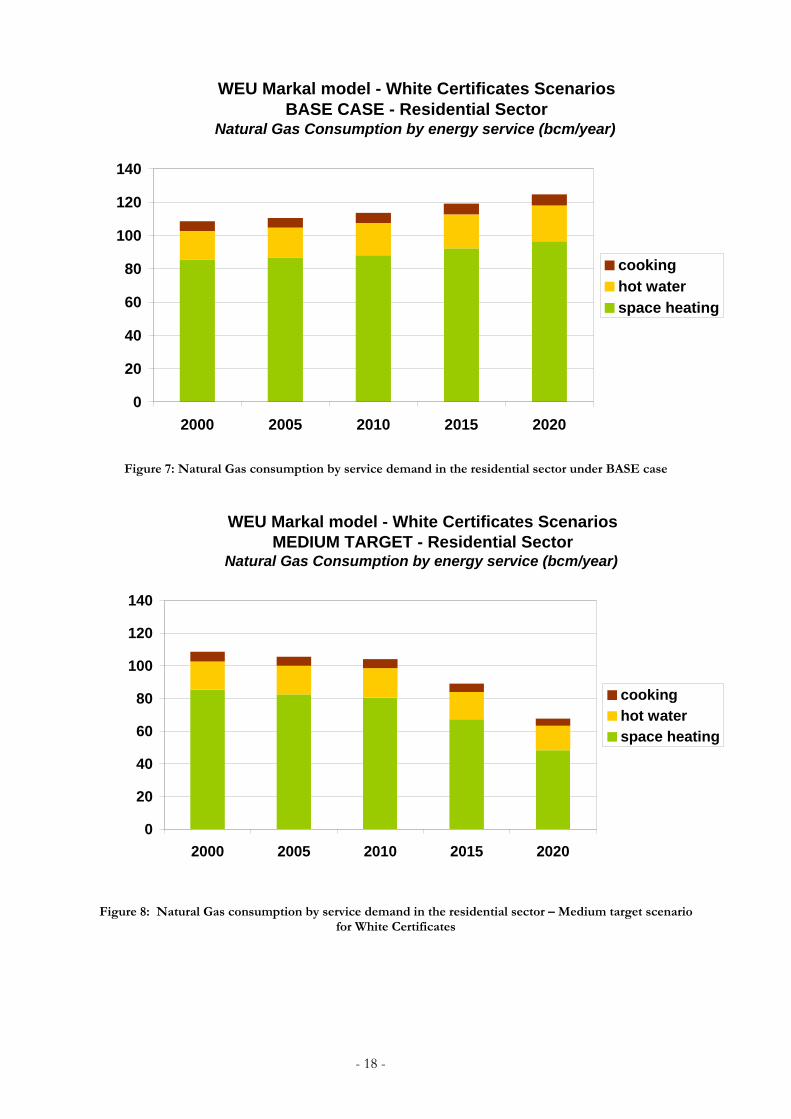
It is now interesting to look into the details of energy consumption for the residential sector in order to identify the sources of greater end-use energy efficiency improvements. These ones give indications of the sources of the improvements to be granted with white certificates. We do this exercise by analysing the fuel consumptions by service demands for the particular cases of natural gas and electricity. If one compares Figure 7 and Figure 8, it can be seen that major savings occur in the segment of space heating. In fact, around 100 billion cubic meters (bcm) of natural gas are saved if we add up the savings for each year, for which space heating accounts the most (up to 83%). If one looks at the years 2010 and 2020, natural gas related energy efficiency improvements account for 9% and 45% respectively in the residential sector this means that 9% and 45% of natural gas is less needed to meet the forecasted service demands for 2010 and 2020 respectively. As for the technologies concerned, higher energy efficiencies for this service demand are reached by better household insulation, the usage of heat pumps, and more advanced related technologies (see annex 3).
- 17 -
WEU Markal model - White Certificates Scenarios BASE CASE - Residential Sector
Natural Gas Consumption by energy service (bcm/year)
0
20
40
60
80
100
120
140
2000 2005 2010 2015 2020
cookinghot waterspace heating
Figure 7: Natural Gas consumption by service demand in the residential sector under BASE case
WEU Markal model - White Certificates Scenarios MEDIUM TARGET - Residential Sector
Natural Gas Consumption by energy service (bcm/year)
0
20
40
60
80
100
120
140
2000 2005 2010 2015 2020
cookinghot waterspace heating
Figure 8: Natural Gas consumption by service demand in the residential sector – Medium target scenario
for White Certificates
- 18 -

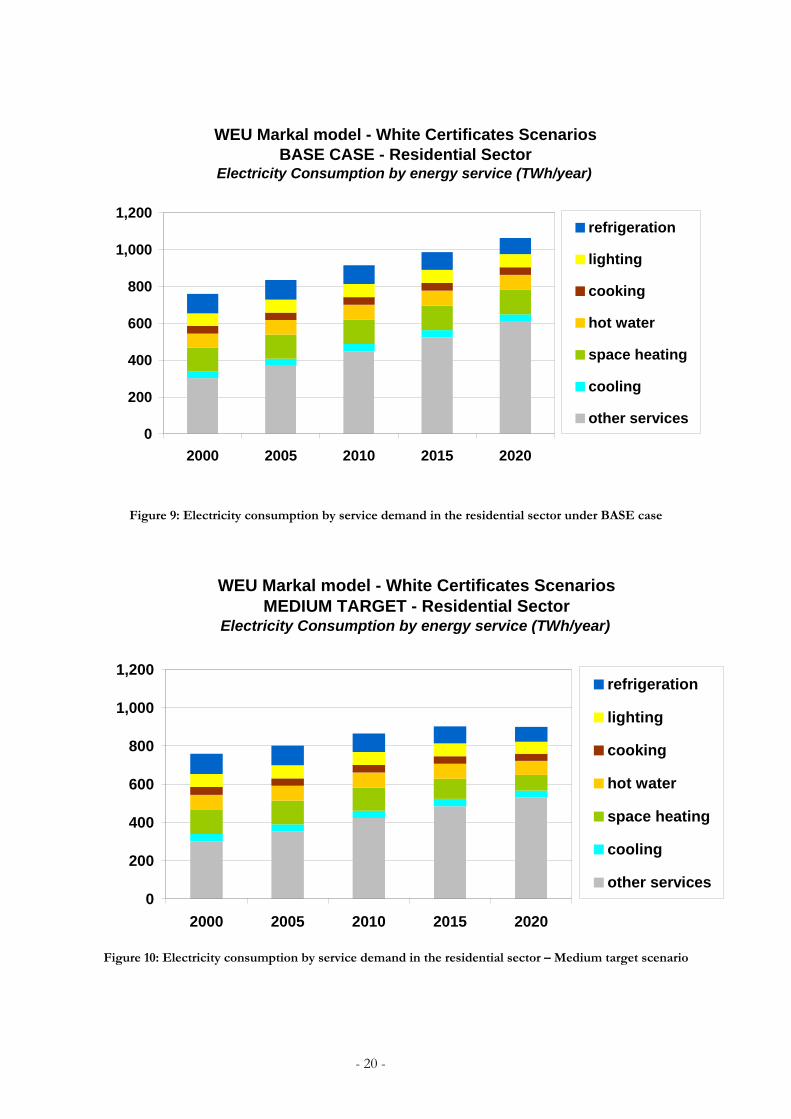
If we look at the electricity consumption by energy service demand for the same sector, space heating and also lighting (in a lesser degree) represent the segments where most savings occur, and thus where higher energy efficiency improvements are reached (see Figure 9 and Figure 10). If we look at the years 2010 and 2020 for example, around 8% (or 11 TWh) and 37% (or 52 TWh) of electricity is less needed for satisfying the forecasted space heating service demands for those years. For the case of lighting, around 4% (or 3 TWh) and 10% (or 8 TWh) of less electricity is needed for satisfying the forecasted lighting service demands for the respective years. Savings for cooking and hot water also take place but in marginal terms (relatively speaking). For the year 2020, consumption of electricity for hot water purposes goes from 81TWh in the base case, while in the medium target scenario accounts for 73 TWh (i.e., 9.8% less). Electricity needed for cooking accounts for 42 TWh in 2020 under the base case, whereas in the medium target scenario accounts for 37 TWh for the same year. Overall, if one observes the years 2010 and 2020 for example, electricity related energy efficiency improvements account for almost 5% and 15% respectively in the residential sector, this means that 49 TWh and 162 TWh of less electricity is needed to meet the forecasted service demands for 2010 and 2020 respectively. As for the technologies concerned, higher energy efficiencies for these service demands are reached by higher penetration of solar water heaters, more advanced heating electronic devices and compact fluorescent lamps
- 19 -
WEU Markal model - White Certificates Scenarios BASE CASE - Residential Sector
Electricity Consumption by energy service (TWh/year)
0
200
400
600
800
1,000
1,200
2000 2005 2010 2015 2020
refrigeration
lighting
cooking
hot water
space heating
cooling
other services
Figure 9: Electricity consumption by service demand in the residential sector under BASE case
Figure 10: Electricity consumption by service demand in the residential sector – Medium target scenario
WEU Markal model - White Certificates Scenarios MEDIUM TARGET - Residential Sector
Electricity Consumption by energy service (TWh/year)
0
200
400
600
800
1,000
1,200
2000 2005 2010 2015 2020
refrigeration
lighting
cooking
hot water
space heating
cooling
other services
- 20 -

4.1.4 Results for the commercial sector In the commercial sector, energy consumption grows at the average rate of 8.6% in the base case scenario. Here, electricity is the dominant energy carrier with a share of more than 57% by 2020. This sector consumes 2.1 EJ of electricity in 2000, which climbs up to 3.3 EJ in 2020, representing a 55% increase. On the other hand, natural gas consumption climbs from 0.9 EJ in 2000 to 1.3 EJ in 2020 (44% increase). This fuel accounts for 22% of the total fuels used by the sector in 2020 in the base case (see Figure 11)
WEU Markal model - White Certificates Scenarios BASE CASE - Commercial Sector
Final Energy Consumption by energy source (EJ/year)
0
1
2
3
4
5
6
7
2000 2005 2010 2015 2020
Other SourcesOil ProductsElectricityNatural Gas
Figure 11: Energy consumption by fuel in the Commercial sector - BASE case
Once the medium target is introduced (i.e., 1% per year until 2010 and 2% after 2010 until 2020), energy consumption in the commercial sector decreases by 0.2 EJ in 2005, 0.3 EJ in 2010, 0.8 EJ in 2015 and 1.6 in 2020. Again, the correlation between the target level and the amount of energy saved is straightforward. In 2010, right before the target turns out to be 2% per year, the consumption trend reaches a peak of about 4.5 EJ. In 2020 energy consumption is around 4 EJ and it is reduced beyond to the 2000 level (i.e., from to 4 EJ to around 4.2 EJ) (see Figure 12). For this sector, energy savings take place in the same order of magnitude for the case of electricity and natural gas. In absolute terms, 0.2 EJ of less natural gas and 0.18 EJ of electricity are consumed by 2010. If we then look at the year 2020, reductions are around 0.7 EJ and 0.8 EJ for natural gas and electricity respectively (see Figure 12).
- 21 -

WEU Markal model - White Certificates Scenarios MEDIUM TARGET - Commercial Sector
Final Energy Consumption by energy source (EJ/year)
0
1
2
3
4
5
6
7
2000 2005 2010 2015 2020
Other SourcesOil ProductsElectricityNatural Gas
Figure 12: Energy consumption by fuel in the Commercial sector – Medium target scenario for White Certificates
Again, we look into the details of the energy consumption in order to identify the sources of greater end-use energy efficiency improvements for this sector. As mentioned before, these ones can give indications of the source of the improvements to be granted with white certificates. Once again, we do this exercise by analysing the fuel consumptions by service demands for the particular cases of natural gas and electricity. For the case of natural gas, it can be seen that major savings occur in the segment of space heating and hot water (see Figure 13 and Figure 14). If one looks at the years 2010 and 2020, natural gas related efficiencies for the case of space heating account for 16% (or 2.7 bcm) by 2010 and 58% (or 10 bcm) by 2020. This means that for the latter case, 58% less natural gas is needed in order to satisfy the forecasted space heating demands by 2020. When it comes to the segment of hot water, energy efficiency improvements account for 1.2 bcm by 2010 and 5.1 bcm by 2020 for example. This entails that around 12% and 50% less natural gas is needed for satisfying this service demand in 2010 and 2020 respectively. The technologies that allow this higher efficiency are better cavity wall insulation, the usage of heat pumps, and solar water heaters (see annex 3). Overall, natural gas related improvements are around 18% by 2010 and 51% by 2020 in the commercial sector. In other words, 5.9 bcm and 19.6 bcm less natural gas are needed to meet given service demands by 2010 and 2020 respectively. For the case of electricity consumption by energy service demands in the commercial sector, lighting, space heating and office equipment represent the segments where most savings take place (see Figure 15 and Figure 16). When it comes to space heating, if we look at the years 2010 and 2020 for example, around 15% (or 8 TWh) and 39% (or 21 TWh) less electricity is needed for satisfying the forecasted service demands for the same years. For the case of lighting, around 6% (or 17 TWh) and 45% (or 145 TWh) less electricity by 2010 and 2020 respectively is needed for satisfying the forecasted lighting service demands. In terms of office equipment, almost 4% (or 7 TWh) and 11% (or 30 TWh) less electricity is needed in order to satisfy the forecasted service demand for this segment in the years 2010 and 2020 correspondingly.
- 22 -

Overall, if one observes the years 2010 and 2020 for example, electricity related energy efficiency improvements in the commercial sector account for 6% and 27% respectively, this means that 5 TWh and 249 TWh less electricity is needed to meet the forecasted service demands by 2010 and 2020 respectively.
- 23 -

WEU Markal model - White Certificates Scenarios BASE CASE - Commercial Sector
Natural Gas Consumption by energy service (bcm/year)
0
5
10
15
20
25
30
35
40
2000 2005 2010 2015 2020
othershot waterspace heatingcookingcooling
Figure 13: Natural Gas consumption by service demand in the commercial sector under BASE case
Figure 14: Natural Gas consumption by service demand in the commercial sector – Medium target scenario for White Certificates
WEU Markal model - White Certificates Scenarios MEDIUM TARGET - Commercial Sector
Natural Gas Consumption by energy service (bcm/year)
0
5
10
15
20
25
30
35
40
2000 2005 2010 2015 2020
othershot waterspace heatingcookingcooling
- 24 -

Figure 15: Electricity consumption by service demand in the commercial sector under BASE case
WEU Markal model - White Certificates Scenarios BASE CASE - Commercial Sector
Electricity Consumption by energy service (TWh/year)
0100200300400500600700800900
1,000
2000 2005 2010 2015 2020
refrigerationlightingcookinghot waterspace heatingcoolingoffice equipment
Figure 16: Electricity consumption by service demand in the commercial sector – Medium target scenario for White Certificates
WEU Markal model - White Certificates Scenarios MEDIUM TARGET - Commercial Sector
Electricity Consumption by energy service (TWh/year)
0100200300400500600700800900
1,000
2000 2005 2010 2015 2020
refrigerationlightingcookinghot waterspace heatingcoolingoffice equipment
- 25 -

4.1.5 Financial aspects Figure 17 attempts to summarize the potential trade-offs between energy savings and the average system costs of the different scenarios, taking the year 2020 as an example. This chart relates the energy savings obtained in the year 2020 as a result of the introduction of a “target-and-trade” WhC scheme for the commercial and residential sectors, and the corresponding variation of the average unit cost of the energy system in the same year. This is evaluated by dividing the total cost (investments, purchase of fuels etc.)10 at a constant undiscounted monetary value, by the total primary energy source. The cost variation with respect to the base case scenario is indicated on the y-axis in relative terms at the left and in absolute terms on the right. The points on the diagram represent the three targets described before. They come up roughly on a straight line, which crosses the x-axis corresponding to a saving of about 15%. This entails that greater energy efficiency (i.e., 15% of cumulated energy savings by 2020) under a “target-and-trade” scheme can be reached at negative costs (i.e., an intermediate target between the low and medium target scenario). This scenario is already more ambitious than the one proposed by the EU Directive. A low target scenario could yield up to 3 EJ of energy savings to be potentially granted with white certificates in 2020. For further trade-off curves see Annex 3c.
Figure 17: Trade-off curve - Energy savings vs. average energy system costs
4.1.6 Energy intensity Finally, and with the aim to explore the effects of the different analysed scenarios for WhC in terms of energy efficiency over the WEU economy, we address the ratio of total energy consumption to GDP, defined as energy intensity (EI) of the economy, as a proxy for energy efficiency improvements as a result of the introduction of WhC. If one looks at the autonomous EI of the system, it can be observed that this goes from around 174 to 137 toe/M€ of GDP for the period 2000-2020 (see Figure 18). In other words, there is reduction of about 20% in the amount of energy that is needed to produce a unit (M€) of GDP if one considers the period 2000-2020. For the different scenarios and by looking at the whole period of analysis, EI decreases around 10 In terms of energy costs, if one considers the undiscounted total annual costs for the WEU energy system generated by MARKAL over a year (investments, fuels, operation and maintenance), this cost divided by the energy used in that year represents an average energy cost (€/year).
WEU Markal model - White Certificates ScenariosResidential and Commercial Sector
Trade-off curve: total (R&C) final energy saved in 2020 (% of b.a.u. scenario) vs.
average energy system cost increase (€/GJ and %) in 2020
-1
0
1
2
3
4
0% 10% 20% 30% 40% 50% 60%% reduction (b.a.u.)
€/G
J
-13%
0%
13%
25%
38%
50%
Low
Medium
High
- 26 -

26% for the low target scenario, 29% for the medium target scenario and around 35% for the high target scenario. This means that the energy efficiency improvements that are policy induced account for around 6%, 9% and 17% respectively for each scenario (i.e., the difference between the autonomous EI and the ones that are policy induced). Certainly, there is a direct correlation between the level of ambition of the energy saving targets and the improvements of the economy in terms of energy efficiency.
Primary energy intensities under White Certificates
0
20
40
60
80
100
120
140
160
180
2000 2005 2010 2015 2020
Toe/
M€
(200
0) o
f GD
P
Base caseLow-targetMedium-targetHigh-target
Figure 18: Energy intensities for various White Certificate scenarios
- 27 -

4.2 Black Certificate Scheme With the aim to summarize the extensive results generated for a number of scenarios, we have selected three main parameters: the mix of energy sources capable of producing electricity, the estimated value of CO2 allowances (€ per ton) and electricity prices. These parameters give indications of the renewable energy technology selections made by the WEU MARKAL model in order to satisfy the imposed caps or limits on CO2 emissions in the electricity sector. For this instrument, the modelling of the CO2 limits is only applied to the power sector. The WEU MARKAL model does not have a separate representation of the CO2 emissions for high energy-intensive industrial sectors (e.g. pulp & paper, iron & steel, glass & ceramics, etc.) as stated by the coverage of the future EU-wide CO2 emissions trading scheme for its period (2005-2007). It can only model industrial CO2 emissions as a single group. This specific modelling exercise concerns only to the power sector. Therefore, the simulation is too simplified, as the details for industrial processes are enough to satisfy a detailed approach.
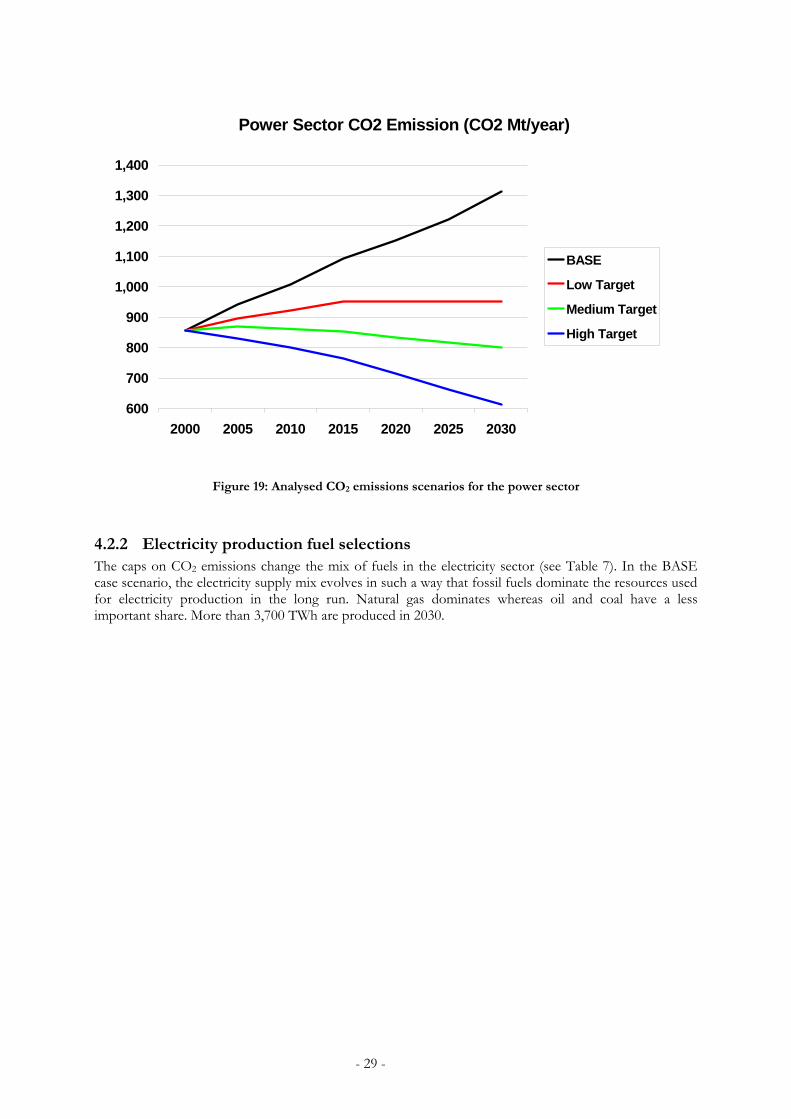
4.2.1 Analysed scenarios Without action, CO2 produced by power generation could actually rise from about 850 millions tons in 2000 to 1,050 million tons by 2012. If Kyoto were implemented, all of this increase would have to be reduced. In addition, to finding ways to avert these emissions, the power industry must contribute to the reduction of 250 million tons that €pe has committed itself to make by 2012. In this study, we assumed that power generation’s share of this amount would be 20 to 35 percent, or approximately 50 million to 90 million tons. We estimate that power generators would have to limit their total output of CO2 by 2012 to between 760 million tons to 800 million tons. In other words, they would have to reduce CO2 emissions by 250 million to 290 million tons: the 200 million tons they have to avert plus the additional 50 millions to 90 million tons. Based on the above estimates, we build three different scenarios for the period 2000-2030. The low target scenario could be called “emission stabilization”. In this scenario the CO2 emissions from power generation rise to 950 million tons by 2015 (100 million tons less than in the no-action scenario, 40% of the Kyoto target) and than remain at this level till 2030. Between 2015 and 2030, almost all the electricity demand growth is supplied by renewable energy power plants. This stabilization scenario implies a reduction of a 28% in 2030 compared to the no-action scenario, but a rise of 11% in the same year compared to the year 2000 level. The medium target could be called “Kyoto delayed”. In this scenario, the Kyoto target for power industry (described above) is reached by 2030 instead of 2012. The target is a reduction of 39% in 2030 compared to the no-action scenario (6.5% compared to the year 2000 level). The high target scenario is the one that represents the Kyoto target till 2010-2015. After that date, a strong emission reduction trend continues towards the indicated target: approximately 50% in 2030 compared to the no-action scenario, 25% in the same year compared to the 2000 emission level. Based on the above estimations and assumptions, three different caps on CO2 emissions were considered for the power sector the period 2000-2030: a) one with a slight growth of CO2 emissions. In this case it is assumed a reduction target of 28% by 2030 with respect to the BASE case, or and increase of 11% with respect to 2000 emissions levels of the BASE case scenario. b) The second scenario implies the stabilisation of CO2 emissions around 2000 levels by 2030, which entails a reduction target of 39% by 2030, or 6% emissions compared to the 2000 year of the base case scenario. c) The third analysed scenario consists of a net decrease of CO2 emissions. This entails a reduction of 28% by 2030 compared to 2000 emissions levels of the BASE case scenario, or 53% compared to 2030 levels of the base case scenario (see Figure 19).
- 28 -
4Tcfi
Power Sector CO2 Emission (CO2 Mt/year)
600
700
800
900
1,000
1,100
1,200
1,300
1,400
2000 2005 2010 2015 2020 2025 2030
BASE
Low Target
Medium Target
High Target
Figure 19: Analysed CO2 emissions scenarios for the power sector
.2.2 Electricity production fuel selections he caps on CO2 emissions change the mix of fuels in the electricity sector (see Table 7). In the BASE ase scenario, the electricity supply mix evolves in such a way that fossil fuels dominate the resources used or electricity production in the long run. Natural gas dominates whereas oil and coal have a less mportant share. More than 3,700 TWh are produced in 2030.
- 29 -

Table 7: Electricity production fuel selections in Black Certificate Scheme
TWh per year 2000 2005 2010 2015 2020 2025 2030 BASE case
Coal 482 469 490 528 554 578 608Oil 148 164 133 120 116 105 121
Natural Gas 382 389 603 689 877 1240 1448Nuclear 882 856 856 856 856 856 856
Hydro 517 550 569 587 606 625 629Other renewables 61 66 69 75 80 85 90
TOTAL 2472 2494 2719 2856 3089 3489 3752Low-target scenario
Coal 482 465 476 445 371 310 264Oil 148 151 133 120 96 89 61
Natural Gas 382 462 637 859 1150 1357 1550Nuclear 882 856 856 856 856 856 856
Hydro 517 550 569 587 606 625 629Other renewables 61 69 70 76 107 190 320
TOTAL 2472 2554 2741 2943 3186 3426 3681Medium-target scenario
Coal 482 464 473 441 367 304 256Oil 148 133 133 120 96 77 61
Natural Gas 382 468 506 626 864 1056 1178Nuclear 882 856 856 856 856 856 856
Hydro 517 550 569 587 606 625 629Other renewables 61 74 212 330 415 526 714
TOTAL 2472 2545 2748 2959 3203 3443 3696High-target scenario
Coal 482 459 469 441 367 307 258Oil 148 133 133 120 96 77 61
Natural Gas 382 413 393 364 508 585 631Nuclear 882 856 856 856 856 856 856
Hydro 517 550 569 587 606 625 629Other renewables 61 83 329 576 756 989 1260
TOTAL 2472 2494 2748 2943 3189 3438 3696 By looking at Table 7 it can be observed that when a cap is imposed, the production of electricity varies and the growth in fossil fuels consumption is lower. Logically, the more ambitious the cap is, the lower the share of fossil fuels in electricity production becomes. When lower caps on CO2 emissions are imposed natural gas is displaced while there is higher penetration of non-hydro renewable energy sources (RES) (i.e. mostly wind and biomass). Oil follows a downward trend with a reduction up to 50% if one compares the base case and the high-target scenario in 2030. A similar reduction takes place for coal, which reduces its share to around 55% if one compares the base case and the other scenarios again in 2030. Electricity production from nuclear and hydro remains constant as it is used at their maximum allowed levels. Natural gas dominates significantly in almost all the cases by 2030 except when the lowest cap is imposed (i.e. high-target). In fact, natural gas does not reach its maximum level in the model and represents only 17% of the total electricity fuel mix by 2030 in the high-target scenario (see Figure 20 and Figure 21).
- 30 -

WEU Markal Model - BASE CASEElectrcicty Production by Source (TWh/year)
0
500
1000
1500
2000
2500
3000
3500
4000
2005 2010 2015 2020 2025 20300
200
400
600
800
1000
1200
1400
Other renewablesHydroNatural GasOilCoalNuclearCO2 Emissions (Mton)
Figure 20: Electricity production fuel selections – BASE case
Figure 21: Electricity production fuel selections – High target scenario on CO2 emissions
WEU Markal Model - ET High Target ScenarioElectrcicty Production by Source (TWh/year)
0
500
1000
1500
2000
2500
3000
3500
4000
2000 2005 2010 2015 2020 2025 20300
200
400
600
800
1000
1200
1400
Other renewablesHydroNatural GasOilCoalNuclearCO2 Emissions (Mton)
From the technological point of view, it is important to mention that no consideration was given in this modelling work to carbon capture and storage technologies, due to the uncertainties as far as their market penetration is concerned over the analysed time period. When it comes to power generation technologies, there is a strong increase of the natural gas combined cycle plants already in the low-target scenario. This technology allows complying with the cap. The scenario with the highest reduction of emissions picks up the development of an advanced technology such as Hot Dry Rocks.
- 31 -

When it comes to the specific contribution of RES and related technologies for power production, there is a strong increase of biomass and wind energy as both resources and related technologies. Biomass contributes with around 40 TWh in the base case, and also in the low and medium scenario. However and by looking at 2030, its contribution increases almost ten times (i.e., 387 TWh) in the high target scenario compared to the base case. For the case of wind energy, its contribution dominates heavily the power generation from RES. Its initial contribution is 20 TWh in 2000; however it grows up to 266 TWh (or 83%) in 2030 under the low target scenario, and 639 TWh with a share of 90% of total RES in 2030 under the medium target scenario. Wind energy reaches a peak of 837 TWh (with a share of 66% of total RES) in the 2030 under the high target scenario. Its minor relative contribution (i.e., lower than the previous scenarios) is affected but the rapid penetration of biomass under the high target scenario. Nevertheless in absolute figures, wind is by far the dominant RES. Geothermal has a marginal contribution in all the scenarios, reaching 36 TWh in 2030 under the high target scenario, approaching its maximum technical potential which is around 47 TWh. See Figure 22, Figure 23, Figure 24, Figure 25 and Table 8.
WEU Markal Model - BASE CASE
RES Electrcicty Production by Source (TWh/year)
0102030405060708090
100
2000 2005 2010 2015 2020 2025 2030
WindBiomassGeothermal
Figure 22: RES Electricity production fuel selections – Base case
- 32 -

WEU Markal Model - ET Low Target Scenario RES Electrcicty Production by Source (TWh/year)
0
50
100
150
200
250
300
350
2000 2005 2010 2015 2020 2025 2030
WindBiomassGeothermal
Figure 23: RES Electricity production fuel selections – Low target scenario
WEU Markal Model - ET Medium Target Scenario RES Electrcicty Production by Source (TWh/year)
0
100
200
300
400
500
600
700
800
2000 2005 2010 2015 2020 2025 2030
WindBiomassGeothermal
Figure 24: RES Electricity production fuel selections – Medium target scenario
- 33 -

WEU Markal Model - ET High Target Scenario
Ta
Figure 25: RES Electricity production fuel selections – High target scenario
RES Electrcicty Production by Source (TWh/year)
0
200
400
600
800
1000
1200
1400
2000 2005 2010 2015 2020 2025 2030
WindBiomassGeothermal
ble 8: Electricity production from RES under Black Certificates
TWh per year 2000 2005 2010 2015 2020 2025 2030
BASE case Wind 20 25 27 32 37 42 47Biomass 37 37 37 38 38 38 39Geothermal 4 4 5 5 5 4 4Solar 0 0 0 0 0 0 0TOTAL 61 66 69 75 80 85 90
Low target scenario Wind 20 27 27 32 62 142 266Biomass 37 37 37 38 38 38 39Geothermal 4 5 6 6 7 10 16Solar 0 0 0 0 0 0 0TOTAL 61 69 70 76 107 190 320
Medium target scenario Wind 20 33 158 269 351 459 639Biomass 37 37 37 38 38 38 39Geothermal 4 5 17 23 26 29 36Solar 0 0 0 0 0 0 0TOTAL 61 74 212 330 415 526 714
High target scenario
Wind 20 35 192 336 511 668 837Biomass 37 43 120 217 220 292 387Geothermal 4 5 17 23 26 29 36Solar 0 0 0 0 0 0 0TOTAL 61 83 329 576 756 989 1260
- 34 -

4.2.3 Financial aspects As the estimated value of CO2 allowances (€ per ton) or “Black Certificates” (BC) is concerned, this obviously varies in relation with the dynamics applied to CO2 emission caps. The range goes from 20 to 90 € per tonne of CO2. By the end of the analysed period, the price is about 30 € per tonne of CO2 for the low target scenario, 40 € per tonne of CO2 for the medium-target scenario, and for the most ambitious scenario, 50 € per tonne of CO2 in 2030 (see Figure 26). In average, the estimated price for the low target scenario is 28 € per tonne of CO2, 40 € per tonne of CO2 for the medium target scenario, and 67 € per tonne of CO2 for the high target scenario.
Estimated value of CO2 allowances for different scenarios (€/ t CO2)
0102030405060708090
100
2005 2010 2015 2020 2025 2030
lowmediumhigh
Figure 26: Estimated value of Black Certificates under different CO2 caps for the power sector
As one can immediately notice, the above estimated price of CO2 allowances differ from the ones that one can observe in reality. The different has two main sources. One the hand, energy intensive industries are not included under the modelled scheme (see section 4.2); which could lower the price by considering more mitigation measures and also enlarging the liquidity of the CO2 allowance market. The second cause is almost all the reductions in the power sector are due to fuel switching (e.g., from coal to natural gas) and also a higher penetration of RET. As a result of the imposed caps on CO2 emissions, electricity prices increase (see Figure 27). The resulting electricity price increases 30% in the first scenario, a little more in the second and around 60% in the third one. These relatively high price increases are partly due to the fact that, as we mentioned, all the reduction in CO2 emissions is obtained on the supply side (i.e., coverage of the emission cap).
- 35 -

Estimated Electricity Price (€/MWh)
0
10
20
30
40
50
60
70
80
90
2005 2010 2015 2020 2025 2030
base caselow targetmedium targethigh target
Figure 27: Electricity price under different CO2 caps
4.2.4 Energy intensity (fossil fuels) Finally, and with the aim to explore the effects of BC for the different analysed scenarios in terms of energy efficiency over the WEU economy, we focus on the ratio of total fossil fuel consumption to GDP (i.e., fossil fuel intensity, FFI). If one looks at the FFI of the system under the base case, it can be observed that this goes from around 127 to 96 toe/M€ of GDP for the period 2000-2020. This means that there is reduction of about 24% in the amount of fossil fuels that are needed to produce a unit (M€) of GDP if one considers the whole period of analysis. This is the autonomous FFI. If we now look at the different scenarios for BC for the same period (2000-2020) FFIs decrease around 26% for the low target scenario, 29% for the medium target scenario and around 31% for the high target scenario (see Figure 28) This means that the energy efficiency improvements that are policy induced account for 2%, 5% and 7% for the low, medium and high target scenario respectively (i.e., the difference between the autonomous FFI and the ones that are policy induced for the period 2000-2020). Again, it is important to keep in mind that there is a direct correlation between the level of ambition of the CO2 caps and the energy efficiency improvements of the economy in terms of fossil fuel consumption.
- 36 -

Figure 28: Fossil fuel intensities for various Black Certificate scenarios
Fossil fuel intensities under Black Certificates
0
20
40
60
80
100
120
140
2000 2005 2010 2015 2020
Toe/
M€
(200
0) o
f GD
P
Base caseLow-targetMedium-targetHigh-target
- 37 -

4.3 Green Certificate Scheme In order to summarize the extensive results generated for a number of scenarios, we have selected three main parameters: the mix of energy sources capable of producing electricity, CO2 emissions from the electricity sector and the estimated price of green certificates. Overall, these parameters give indications of the renewable energy technology selections made by the WEU MARKAL model in order to satisfy the different policy constraints (i.e. targets to increase the contribution of electricity generated from renewable energy sources, not including hydro).
4.3.1 Analysed scenarios Three different scenarios were explored for this particular instrument: a) low, b) medium and c) high target scenarios for electricity production from RES for the 2000-2030 period. All the scenarios are subject to the target foreseen by the EU Directive, which states 22,1% of electricity generated from RES by 2010. Due to the fact the WEU MARKAL model includes Norway (rather large producer of electricity from hydro power), we estimate that this target is equivalent to around 10% of electricity generated from RES by 2010 in the WEU MARKAL model. We therefore build the target scenarios based on this target. The low target scenario sets the 10% share of RES (non-hydro) for the production of electricity at 2020, and a share of 12.5% by 2030. The medium target scenario sets the obligation of 10% share of RES for the production of electricity in 2010 and a share of 20% by 2030. The high target scenario keeps the 10% equivalent value of the EU Directive for 2010, but increases it up to 30% by 2030. In the base case, no targets are imposed for stimulating the penetration of RES (non-hydro). Their contribution goes from 61 TWh in 2000 to 90 TWh in 2030, representing an average growth of 6.6% every 5 years. Hydro and nuclear remain almost the same, in particular the latter that has a fixed capacity generation of around 856 TWh per year. To a large extent, the resource that contributes the most to electricity production by the end of the period under analysis is natural gas. Its contribution goes from 382 TWh (lower than nuclear, coal and hydro) in 2000 to 1,448 TWh in 2030, representing an average growth of 26.1% every 5 years.
4.3.2 Electricity production fuel selection We focus our analysis on the so-called medium-growing target scenario. As mentioned before, this scenario involves the obligation of 10% share of RES by 2010 and a share of 20% by 2030. Here, the electricity supply mix develops in a different manner (see Figure 29 and Figure 30). Once again, the electricity production fuel selection of the base case scenario is shown.
- 38 -
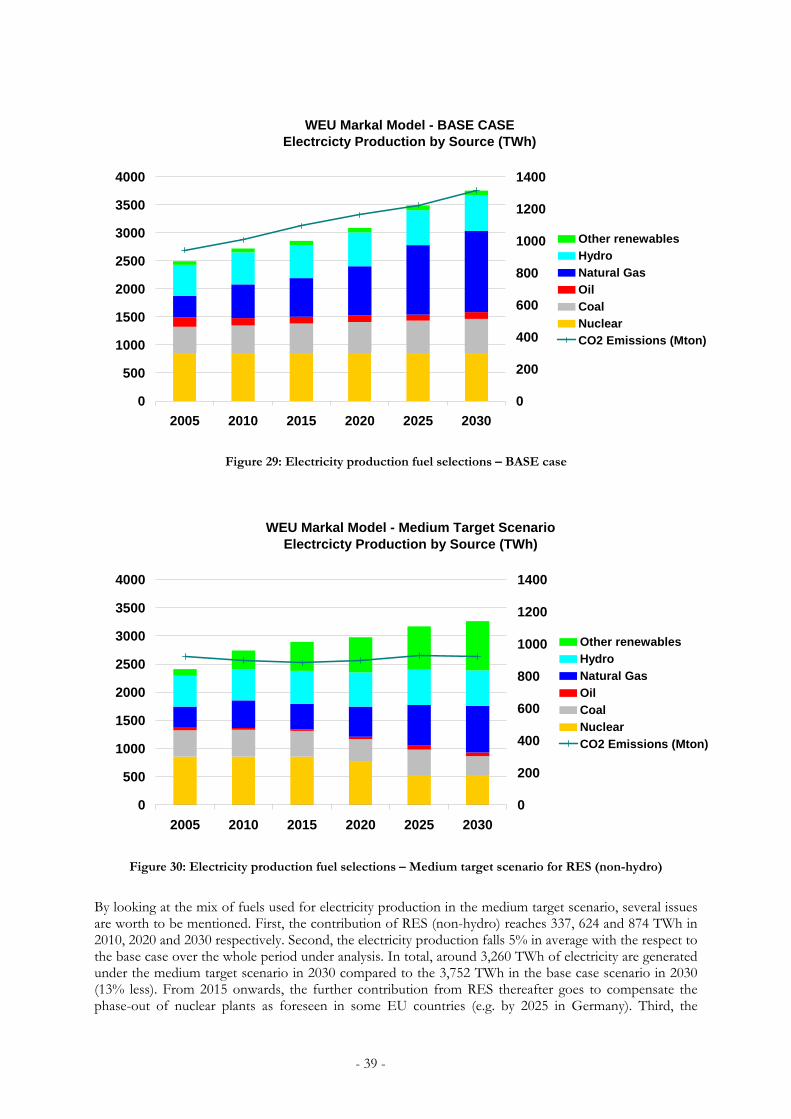
WEU Markal Model - BASE CASE
Ba2tu(p
Electrcicty Production by Source (TWh)
0
500
1000
1500
2000
2500
3000
3500
4000
2005 2010 2015 2020 2025 20300
200
400
600
800
1000
1200
1400
Other renewablesHydroNatural GasOilCoalNuclearCO2 Emissions (Mton)
Figure 29: Electricity production fuel selections – BASE case
WEU Markal Model - Medium Target ScenarioElectrcicty Production by Source (TWh)
0
500
1000
1500
2000
2500
3000
3500
4000
2005 2010 2015 2020 2025 20300
200
400
600
800
1000
1200
1400
Other renewablesHydroNatural GasOilCoalNuclearCO2 Emissions (Mton)
Figure 30: Electricity production fuel selections – Medium target scenario for RES (non-hydro)
y looking at the mix of fuels used for electricity production in the medium target scenario, several issues re worth to be mentioned. First, the contribution of RES (non-hydro) reaches 337, 624 and 874 TWh in 010, 2020 and 2030 respectively. Second, the electricity production falls 5% in average with the respect to he base case over the whole period under analysis. In total, around 3,260 TWh of electricity are generated nder the medium target scenario in 2030 compared to the 3,752 TWh in the base case scenario in 2030 13% less). From 2015 onwards, the further contribution from RES thereafter goes to compensate the hase-out of nuclear plants as foreseen in some EU countries (e.g. by 2025 in Germany). Third, the
- 39 -

consumption of natural gas falls 30% in average compared to the base case from 2000 till 2030. Under the base case its contribution goes from 603, 877 and 1,448 TWh per year in 2010, 2020 and 2030 respectively, whereas in the medium scenario, the contribution of natural gas goes from 490, 538 and 828 TWh per year for the same years. Fourth, nuclear power starts to be phased out after 2015, reaching a maximum production by 2030 of 530 TWh (i.e., 38% less compared to the base case for the same year). The RES (non-hydro) supporting the sustained growth of these sources are essentially wind and biomass. In the base case, the amount of electricity generated from wind energy goes from 20 TWh in 2000 till 47 TWh in 2030, whereas biomass contributes with 37 TWh in 2000 and 39 TWh in 2030. In the medium target scenario, wind and biomass reach 172 and 148 TWh by 2010 and 518 and 326 TWh by 2030 respectively (see Table 9). Under GC, geothermal reaches its maximum technical capacity Table 9: Electricity production from RES under Green Certificates
TWh per year 2000 2005 2010 2015 2020 2025 2030
BASE case Wind 20 25 27 32 37 42 47Biomass 37 37 37 38 38 38 39Geothermal 4 4 5 5 5 4 4Solar 0 0 0 0 0 0 0TOTAL 61 66 69 75 80 85 90
Low target scenario Wind 20 37 98 146 216 265 314Biomass 37 46 96 118 154 182 210Geothermal 4 5 11 13 17 18 19Solar 0 0 0 0 0 0 0TOTAL 61 89 205 277 386 465 544
Medium target scenario Wind 20 36 172 288 361 453 518Biomass 37 75 148 203 237 289 326Geothermal 4 5 17 24 26 29 30Solar 0 0 0 0 0 0 0TOTAL 61 116 337 514 624 771 874
High target scenario Wind 20 36 172 328 509 665 830Biomass 37 75 148 227 321 410 504Geothermal 4 5 17 27 36 41 47Solar 0 0 0 0 0 0 0TOTAL 61 116 336 583 867 1116 1381
If one compares these results with the ones obtained for the case of BC, the penetration of wind and biomass is higher under GC than BC in absolute terms, in particular for the case of biomass (compare Table 8 and Table 9). In this case, the penetration of biomass is much higher in all the scenarios and somewhat proportional to the one for the case of wind energy.
- 40 -

The higher share of RES (non-hydro) and the decrease of fossil fuel consumption for electricity production yield reduced CO2 emissions in the electricity sector. CO2 emissions account for 896 Mton in 2010 and 920 Mton in 2030 in the medium target scenario, whereas in the base case emissions are 1,006 and 1,315 Mton in 2010 and 2030 respectively. This represents an average reduction of around 20% compared to the base case over the entire period of analysis. CO2 emissions from the electricity sector in the medium target scenario decrease until 2015, while thereafter they remain around 900 Mt per year (see Figure 31).11
Figure 31: CO2 emissions from the electricity sector
4.3.3 Financial aspects When it comes to the estimated value of green certificates, the WEU MARKAL model gives prices between 25 to 40 € per MWh under the medium target scenario. However, a higher price takes place at the beginning of the period under analysis due to target applied, which is stronger until 2010. Thereafter, as the target is less ambitious, values decrease till 25 € per certificate. The estimated price of the green certificates is added to a gross price for electricity of about 28 € per MWh (see Figure 32).
11 Notice that Figure 29 and Figure 30 also show CO2 emissions as a result of the electricity supply mix.
Electricity Sector CO2 Emission (Mt CO2/year)
0
200
400
600
800
1000
1200
1400
2000 2005 2010 2015 2020 2025 2030
Green CertificatesMedium Target
Base Case
- 41 -

Electricity and Green Certificates Marginals (€/MWh)Medium target scenario
0
10
20
30
40
50
60
2005 2010 2015 2020 2025 2030051015202530354045
EstimatedElectricity Price(BAU)
EstimatedElectricity Price(GC)
Estimated GreenCertificates Price
Figure 32: Estimated value of Green Certificates and electricity
Regarding the overall cost of the WEU energy system for the whole analysed period, (2000-2030) this increases in 0.8% as a result of the RES obligation under the medium target scenario. In the low target scenario, the estimated value of green certificates is only a few lower, while the total cost energy system costs are 0.4% higher than in the base case. In the high target scenario, the estimated value of green certificates climbs up to 75 € per MWh, while the total energy system costs are around 1.2 % higher than the BASE case.
4.3.4 Energy intensity (fossil fuels) Finally, we once again approach the effects of the different analysed scenarios for GC in terms of energy efficiency and energy security over the WEU economy. We focus on the ratio of total fossil fuel consumption to GDP (i.e., fossil fuel intensity, FFI). If one looks at the FFI of the system under the base case, it can be observed that this goes from around 127 to 96 toe/M€ of GDP for the period 2000-2020. This means that there is a reduction of about 24% in the amount of fossil fuel that is needed to produce a unit (M€) of GDP if one considers the whole period of analysis. This is the autonomous FFI. If we now look at the different scenarios for the same period (2000-2020) FFIs decrease around 25% for the low target scenario, 28% for the medium target scenario and around 30% for the high target scenario (see Figure 33). This means that the energy efficiency improvements that are policy induced account for around 1%, 4% and 6% respectively for each scenario (i.e., the difference between the autonomous FFI and the ones that are policy induced for the period 2000-2020). Again, it is important to keep in mind that there is direct correlation between the level of ambition of the CO2 caps and the improvements of the economy in terms of fossil fuel consumption.
- 42 -

Fossil fuel intensities under Green Certificates
0
20
40
60
80
100
120
140
2000 2005 2010 2015 2020
Toe/
M€
(200
0) o
f GD
P
Base caseLow-targetMedium-targetHigh-target
Figure 33: Fossil fuel intensities for various Green Certificate scenarios
- 43 -

5. CONCLUSIONS The overall objective of this work was to perform a quantitative assessment of selected policies and measures instruments addressing directly or indirectly energy efficiency. The chosen methodology was the usage of the WEU MARKAL model for analysing the response of this energy system to the instruments under assessment. Analysed scenarios were generated by imposing different caps or targets. We analysed three specific instruments in relation to their main policy goals and also in terms of their effects on energy efficiency improvements over the whole WEU economy. The first issue to comment on is that the order of magnitude of the effects of the analysed instruments depends on the target/cap that is applied. As mentioned before it is possible to identify, to some extent, a correlation between the applied targets/caps and the order of magnitude of the effects (e.g., energy intensity). Our main results can be summarized as follows:
• For the case of White Certificates, it is interesting to observe that up to certain level (i.e., around 15% of cumulated energy savings by 2020 compared to the base case) energy savings are obtained at negative net costs. Major savings occur in the residential sector for all the applied targets. For this sector, greater efficiencies are related to natural gas service demands (e.g., hot water and space heating). For the commercial sector, savings are almost equally distributed for the case of natural and electricity related service demands (e.g., space heating, hot water, lighting, office equipment, etc.). While the results for CO2 emissions appear to be robust for the years 2015 and 2020, it should also be observed that these emission trends are less robust for the years 2005 and 2010, in particular for the high target scenario. On the other hand, energy efficiency improvements for the WEU economy that are policy-induced are consistent, accounting for around 6%, 9% and 15% for the low, medium and high target scenarios respectively. Depending on the selected target, a White Certificate target-and-trade scheme yields up to 10 EJ of energy savings by 2020. All the targets are technically possible.
• When it comes to Black Certificates, due to the fact that these results address just the power
sector, they must be seen as complementary of other modelling works that deal with a wider industrial coverage. In our case, the dynamics of the model response are linked to the CO2 emission constraints. The more ambitious the cap is, the lower the share of fossil fuels in electricity production becomes. For the low target scenario there is a strong increase of the natural gas combined cycle plants, which is sufficient to meet the imposed CO2 emission cap. In the other two scenarios, there is also a strong increase of RES technologies, in particular wind and biomass. The different trends for the electricity production seem to be less robust. Compared to the base case, electricity production is higher for the period 2010-2020 in all the analysed scenarios but lower for the period 2025-2030. In average, the estimated price for the low target scenario is 28 € per tonne of CO2, 40 € per tonne of CO2 for the medium target scenario, and 67 € per tonne of CO2 for the high target scenario. With limitations, energy security was partly addressed in this study using the fossil fuel intensity as a way to approach fossil fuels related efficiency improvements. In this case, efficiency improvements that are policy induced accounted for 2%, 5% and 7% for the low, medium and high target scenarios respectively. From the technological point of view, all the targets are met.
• The results of Green Certificates show that the sustained penetrations of renewable energy
sources (RES) are done by wind and biomass. With this higher penetration of non-hydro RES, fossil fuel energy intensities were addressed. By examining the autonomous fossil fuel intensity of the WEU economy, energy efficiency improvements that are policy induced account for around 1%, 4% and 6% for each scenario respectively. For the medium target scenario, reductions of around 20% compared to the base case over the entire period of analysis are seen. As the estimated value of the certificates is concerned, the model predicts a value of around 40 €/MWh in 2005 to 25 €/MWh in 2015 onwards. Again, all the targets are technically possible.
- 44 -

In general, the results presented in this report should be interpreted carefully. As any energy system modelling effort, there are some limitations to be considered when interpreting results and drawing policy conclusions. On the one hand, in our case the results come from an optimisation model that deals with a perfect market (i.e., where “perfect market conditions” are satisfied). Here, despite the fact that in MARKAL it is not possible to identify market agents, it is critical to take into account that in the WEU MARKAL model the market agents behind of the energy system have perfect information and thus transaction costs are zero. This situation is unlikely to happen in the real world. On the other hand, one can argue that these results may be conservative as neither oil shock prices nor externalities have been included in the analysis. For example, energy prices that internalise negative externalities, as well as the increase of the share of renewable energy sources and high oil prices can drive greater energy efficiency improvements and higher energy security. All in all, caution is highly recommended if one wants to extrapolate these results to real markets hoping that the performance of these instruments will be as the WEU MARKAL model predicts. For the specific case of White Certificates, the main instrument under analysis, this modelling work should be understood as a departure point for further research.
- 45 -

REFERENCES Australian Bureau of Agricultural and Resource Economics, 2002. ANSWER MARKAL. User Manual.
An Energy Policy Optimisation Tool. Commonwealth of Australia. Energy Technology Systems Analysis Programme (ETSAP), 2004. Official documents, application and
tools. Available [online] http://www.etsap.org (Accessed March 2004) Energy Information Administration - US Department of Energy, 2003. Model Documentation Report:
System for the Analysis of Global Energy Markets (SAGE). Volume 2. Washington: EIA-DOE. Available [online] http://www.eia.doe.gov/bookshelf/docs.html (Accessed October 2003)
Ruderman, H., Levine, M., McMahon, J., 1987. The Behaviour of the Market for Energy Efficiency in
Residential Appliances Including Heating and Cooling Equipment. The Energy Journal, vol. 8, no 1, p. 101-124.
Seebregts, J, Goldstein, G., Smekens, K., 2001. Energy/Environmental Modelling with the MARKAL
Family of Models. Available [online] http://www.ecn.nl/docs/library/report/2001/rx01039.pdf (Accessed September 2003)
Zongxin, W., DeLaquil, P., Larson, E., Wenying, C., Pengfei, G., 2001. Future Implications of China’s
Energy Technology Choices. Working Group on Energy Strategies and Technologies. China Council for International Cooperation on Environment and Development. Available [online] http://www.princeton.edu/~cmi/research/Capture/Papers/future.pdf (Accessed June 2003)
- 46 -

ANNEX 1: A BRIEF INTRODUCTION TO MARKAL Developed in the early 1980s by the International Energy Agency (IEA) under the Energy Technology Systems Analysis Programme (ETSAP), MARKAL is a dynamic, multi-period, linear programming bottom-up model of a generalized energy system, in which both the energy supply and demand side are depicted, including energy sources, conversion technologies, energy carriers and demand technologies and sectors12. MARKAL is a demand driven optimisation tool that aims at finding the mixture of energy sources and technology options that minimizes the overall energy-system cost solution for fulfilling the demand for energy services over the time period analysed.13 Under different constraints (e.g. Caps on carbon dioxide [CO2] emissions, rapid penetration of advanced technologies, carbon tax, restricted oil and coal imports, accelerated deployment of renewable energy sources, etc.), MARKAL finds the least cost solution for the policy scenarios under assessment, meeting the balance of the energy supply and demand at each interval over the period of analysis.14 For policy analysts and decision makers, MARKAL assists them to explore complex interactions and feedback processes in energy systems, and quantify the effects of policy changes. Some examples of MARKAL applications include: designing cost effective strategies to limit GHG emissions; identifying the impacts of improved technologies; and quantifying the impacts of government intervention through the introduction or removal of taxes and subsidies. MARKAL does however depict perfectly competitive markets, and so results must be understood in a broader political and socio-economic context. Of course, an important feature of MARKAL is the introduction of user-defined constraints to better reflect the expected reality and specific features of the instruments and policies under analysis. MARKAL computes a partial equilibrium for energy markets. Partial because MARKAL deals with one part of the economy: the energy sector. In other words, it calculates both the flows of energy forms and materials as well as their prices, in such a way that, as the prices are computed by the model, the suppliers of energy produce exactly the amounts that the consumers are willing to buy. 15: The underlying principles to the MARKAL equilibrium are as follows:
• Output of a technology is a linear function of its inputs; • Total net surplus is maximised over the current period; • Energy markets are competitive; and • Economic agents have limited foresight (over one five-year period only).
Energy systems are modelled in MARKAL as a network, depicting all the flows of energy from resource extraction, through energy transformation and end-use devices, to demand for energy services (see Figure 34). This is known as the Reference Energy System (RES). Within the RES sets of technologies are described by technical coefficients (e.g. capacity, efficiency, etc.), environmental coefficients (e.g. CO2, SOX, NOX), and economic coefficients (e.g. capital costs, market penetration, etc.). Many networks are feasible and MARKAL finds the solution that minimises the total energy system costs.
12 A deeper understanding and greater detail of the issues is available on the ETSAP website. For further information see http://www.etsap.org/Tools/MARKAL.htm13 Australian Bureau of Agricultural and Resource Economics (ABARE), 2002. ANSWER MARKAL. User Manual. An Energy Policy Optimisation Tool. Commonwealth of Australia. 14 Seebregts et al., 2001. Energy/Environmental Modelling with the MARKAL Family of Models. 15 As a result of these assumptions the market price of each commodity is exactly equal to its marginal value in the overall system, and each economic agent maximises profit (or utility).
- 47 -

Figure 34: MARKAL Building Blocks
Source: Seebregts et al., 2001. Energy/Environmental Modelling with the MARKAL Family of Models. Formulating economic equilibrium models of the energy systems with the MARKAL methodology has several advantages:
• The same MARKAL toolkit is used to create models of systems - with energy commodities, materials, emissions and technologies, - including all energy sectors from primary reserves expressed in PJ to energy services,
expressed in specific units, such as passenger/km or in tons of steel, - extended to many regions interlinked together in multi-regional models with endogenous
trade, - limited to the energy sector (partial equilibrium) or extended to the full economy (general
equilibrium, MARKAL-MACRO versions), - at increasing level of equilibrium: from nearly simulation modes (SAGE, 2003), to intra-
temporal equilibrium and myopic view, to inter-temporal perfect foresight allocation of capital investments and decisions, to endogenous learning.
• Since each step of supply/demand curves represents a technology or a fuel source, further to equilibrium quantities and prices the solution of the model indicates the set of technologies or fuel source that makes the equilibrium feasible.
• When all equations are linear, the solution of very large size models (approaching one million variables and equations) requires an hour or little more in normal PCs if recent powerful Linear Programming solvers are used. Till the number of non-linear functions remains low, the solution of the corresponding Non Linear Programming models does not require much more.
• The same toolkit has maintained the original capacity of running the same model in simpler optimisation models, where it is minimized in turn the total discounted system cost, the cumulative emissions, the total import of un-secure energy sources, or whatever combination of Objective Functions, in order to provide trade-offs among different policy objectives.
When it comes to the modelling of tradeable permits or certificates in general, it is important to point out some limitations that MARKAL entails and thus not possible to capture with it. As the tool deals with a perfect market where “actors” do not intervene as such, real market features like hedging and speculation cannot be observed. Some limitations are as follows:
• Effects of market imperfections • Number of participants (buyers and sellers) • Transaction costs
- 48 -

• Price speculations • Volume of certificates banked • Participants’ savings (difference between the marginal cost of domestic actions vs. the market
price of the certificate or permit) • Traders and risk takers • Performance of new technologies unless those derived from already existing RD&D results.
Despite these limitations, it has to be taken into consideration that MARKAL is a powerful instrument for exploring the economic and technological consequences of policies in the field of energy, as it provides useful insights on the effects of the application of different policy instruments.
- 49 -

ANNEX 2: SUPPORTIVE TOOLS In order to support the development and outcomes of this modelling exercise, several tools where used in addition to the WEU MARKAL model for the assessment of the above-mentioned policy instruments. This section attempts to summarize in brief the specific work carried out by the group of researchers in this regard.
• MURE 16 and ICARUS17 Mesures d’Utilisation Rationnelle de l’Energie (MURE) provides information on energy conservation measures that have been carried out in the 15 Member States of the European Union. This tool allows the simulation and comparison at a national level of the potential impact of such measures. MURE was designed and developed, within the framework of the DGXVII SAVE programme. MURE gives information on energy conservation measures that have been carried out in the EU 15 in four sectors: residential, commercial, transportation and industrial. MURE allows the simulation and comparison at a national level of the potential impact of such measures. MURE database contains energy conservation measures, statistical data and simulation tool addressing the above-mentioned sectors. In this modelling exercise, the usage of MURE was carried out in order to compare the input data contained in the WEU MARKAL model for the residential and commercial sectors, with the database addressing the same sectors in MURE. According to the energy service provided, the list of related technologies reviewed included lighting, hot water, cooling, cooking, space heating, refrigeration, etc. Specific data were also collected from ICARUS database. The project group conducted a check on these technologies with the MARKAL database and consistency was verified. Addressed parameters of the databases were as follows:
- Life span of technologies - Technical efficiency - Investment costs - Operation and maintenance costs - Cost-effectiveness
Furthermore, at a second step, a cross comparison of these measures with the available technologies in residential and commercial sector of the WEU MARKAL model was attempted. There are some differences present that are needed to be taken into account in order to assess the final outcomes. More specifically, the measures used in ICARUS and MURE database that were not included in the WEU MARKAL model for the residential and commercial sectors are:
• Insulation of any kind, both in the household and the service sector • Organisational measures for energy saving from companies and households. The focus of the
MARKAL database lies strongly on appliances. • No heat recovery and energy efficient cooling is present.
These measures could alter the results and should be taken into consideration, since they could consist one category of technologies supported in a White Certificate scheme. These results are presented in the following tables:
16 For further information see http://www.isis-it.com/mure/ 17 For more information, see http://www.chem.uu.nl/nws/www/publica/e2000-03.pdf
- 50 -

Table 10: Measures for residential and commercial sectors not included in WEU MARKAL
Energy savings (absolute)
Cost data (absolute)
Measure description Savings
electricity Savings
fossil fuel Savings
steam/hw
Additional investment
costs
Additional O&M costs
Economic lifetime
Building Insulation
Wall insulation: cavity constr. 11,39 563,64 30
Wall insulation: solid constr., external 21,52 3.418,18 30
Wall insulation: solid constr., internal 21,52 526,11 30
Wall insulation: upgrading to Rc 2.5 2,53 3.418,18 30
Roof insulation: heated attic 18,99 1.392,65 30
Roof insulation: unheated attic 9,50 1.392,65 30
Roof insulation: heated attic, upgrading to Rc 2,5 3,80 244,00 30
Floor insulation 4,75 909,09 30
Floor insulation: upgrading to Rc 2,5 3,17 45,00 30
Window insulation: heated rooms, single to double 7,91 950,00 20
Window insulation: heated rooms, single to HR 9,50 1.022,73 20
Window insulation: heated rooms, single to HR++ 11,08 1.140,91 20
Window insulation: bed rooms, single to double 6,33 950,00 20
Window insulation: bed rooms, single to HR+ 7,91 1.022,73 20
Window insulation: bed rooms, single to HR++ 9,50 1.140,91 20
Window insulation: all rooms, double to HR++ 6,33 381,82 20
LT system (larger surface radiator, T<55), c HR107 0,70 680,00 0,00 30
LT system (floor, wall heating) (combined HR 107) 1.590,00 0,00 30
Ventilation on demand, optimal tuning pumps, fans 1.363,64 15
Balanced ventilation system + heat recovery: exist 4.419,00 220,95 15
Window insulation: heated rooms, single to HR+ 0,00 10,00 0,00 1.045,00 0,00 20
Window insulation: bed rooms, single to HR+ 0,00 9,00 0,00 1.045,00 0,00 20
Window insulation: double to HR 0,00 3,00 0,00 145,00 0,00 20
Window insulation, double to HR+ 0,00 5,00 0,00 191,00 0,00 20
Wall insulation (Rc = 3) 0,63 85,21 0,00 30
Wall insulation (Rc = 3,5) 1,01 170,42 0,00 30
Wall insulation (Rc = 5) 1,77 2.180,90 0,00 30
Roof insulation (Rc = 3) 0,95 142,02 0,00 30
Roof insulation (Rc = 4) 1,90 426,07 0,00 30
Roof insulation (Rc = 5) 2,66 710,12 0,00 30
Floor insulation (Rc = 3) 0,32 106,51 0,00 30
Floor insulation (Rc = 3,5) 0,63 213,02 0,00 30
Floor insulation (Rc = 5) 1,27 532,55 0,00 30
Window insulation HR to HR+ 6,33 45,45 0,00 20
Window insulation HR to HR++ 3,17 181,82 0,00 20
Conductivity
(W/m2) Variable Cost
(€/cm m2) Installation
Cost (€/m2)
Extrados beneath the floor 4,7 30,49 1,22
Flat roof panel under outer side 4,2 34,11 1,8
Flat roof panel beneath inner side 5,3 19,59 1,8
Slope roof panel under tiles 4,2 30,93 0,38
Slope roof panel inner side 5,4 18,56 0,38
Slope roof unpractical roof-ceiling 5,3 7,62 0,38
External panels 4,2 30,95 1,22
Internal panels 5,8 16,49 1,22
- 51 -

Injection in the cavity wall 8 10,31 0,3
External insulating plaster 14 19,59 5,15
Double glazing 3,5 90
Low emission crystals 2,6 150
Insulation film 3,2 100
Appliances Average
Investment €
Additional Investment
(%AI)
Life Span (Years)
Clothes Dryers
Television 229 33 10
Kettles
Photovoltaics 1.500 10
Cogeneration 15.000 10
Sanitary Water Heating Efficiency of
new equipment
Cost per equipement
Life Span (Years)
ducks and pipes insulation 1 1.000,00 12
• PRIMES PRIMES is a modelling system that simulates a market equilibrium solution for energy supply and demand in the EU Member states.18 The development of PRIMES was supported by a series of research programmes of the EU Commission. The first version of the model was in operation in 1997.19 By using a price mechanism (i.e. role of prices in conveying information to both producers and consumers) PRIMES establishes the equilibrium between supply and demand. As mentioned by the National Technical University of Athens, PRIMES was developed for forecasting, scenario construction and policy impact analysis. Under this modelling exercise, PRIMES was used as supportive tool in order to compare major trends of different issues along the EU energy system and correct or calibrate, if needed, any particular input data in the WEU MARKAL that may have lead to unreliable results. By taking into account the different geographical coverages (i.e. EU 15 for PRIMES and EU15+ for WEU MARKAL), the reviewed parameters addressed the following issues:
- Total primary energy supply - Sources of primary energy supply - Energy intensity - Total CO2 emissions - Total final energy consumption - Final energy consumption by four sectors
Overall, by looking at the above-mentioned parameters, the conclusion was that both models generate similar trends (e.g. see Figure 35). Of course, the order of magnitude is different as they entail different geographical coverages (i.e. higher values are obtained for WEU MARKAL outputs). After comparing the parameters, no changes in the database were implemented.
18 For further information see http://www.e3mlab.ntua.gr/manuals/PRIMsd.pdf 19 See http://www.upav.org.tr/project/present/200603_mantzos_work.ppt
- 52 -

Energy Intensity in Western Europe (toe/2000 milions €)
0
20
40
60
80
100
120
140
160
180
200
2000 2005 2010 2015 2020 2025
PRIMESMARKAL
Figure 35: Energy intensity for WEU MARKAL model and PRIMES
- 53 -

ANNEX 3: WHITE CERTIFICATES SCENARIOS RESULTS
a) Comparison of four scenarios
WEU Markal model - White Certificates Scenarios Total Primary Energy Consumption (EJ/year)
0
10
20
30
40
50
60
70
80
90
2000 2005 2010 2015 2020
BASElowmediumhigh
WEU Markal model - White Certificates Scenarios Total CO2 Emissions (Gt CO2/year)
0,0
0,5
1,0
1,5
2,0
2,5
3,0
3,5
2000 2005 2010 2015 2020
BASE lowmediumhigh
- 54 -

WEU Markal model - White Certificates ScenariosResidential Sector
Final Energy Consumption (EJ/year) - All fuels
0
2
4
6
8
10
12
14
2000 2005 2010 2015 2020
BASE lowmediumhigh
WEU Markal model - White Certificates ScenariosCommercial Sector
Final Energy Consumption (EJ/year) - All fuels
0
1
2
3
4
5
6
7
2000 2005 2010 2015 2020
BASE lowmediumhigh
- 55 -

WEU Markal model - White Certificates ScenariosResidential and Commercial Sector Natural Gas Consumption (bcm/year)
020406080
100120140160180
2000 2005 2010 2015 2020
BASE lowmediumhigh
WEU Markal model - White Certificates ScenariosResidential and Commercial Sector Total Natural Gas Savings (bcm/year)
-140
-120
-100
-80
-60
-40
-20
02000 2005 2010 2015 2020
lowmediumhigh
The capacity of the new Libia-to-Italy pipeline is around 8 bcm/year.
- 56 -

WEU Markal model - White Certificates ScenariosResidential Sector
Natural Gas Consumption (bcm/year)
0
20
40
60
80
100
120
140
2000 2005 2010 2015 2020
BASE lowmediumhigh
WEU Markal model - White Certificates ScenariosResidential Sector
Natural Gas Savings (bcm/year)
-120
-100
-80
-60
-40
-20
02000 2005 2010 2015 2020
lowmediumhigh
- 57 -

WEU Markal model - White Certificates ScenariosCommercial Sector
Natural Gas Consumption (bcm/year)
0
5
10
15
20
25
30
35
40
2000 2005 2010 2015 2020
BASE lowmediumhigh
WEU Markal model - White Certificates Scenarios Commercial Sector
Natural Gas Savings (bcm/year)
-35
-30
-25
-20
-15
-10
-5
02000 2005 2010 2015 2020
lowmediumhigh
- 58 -

WEU Markal model - White Certificates ScenariosResidential and Commercial Sector
Final Electricity Consumption (TWh/year)
0
500
1 000
1 500
2 000
2 500
2000 2005 2010 2015 2020
BASE lowmediumhigh
WEU Markal model - White Certificates ScenariosResidential and Commercial Sector
Total Electricity Savings (TWh/year)
-1 000-900-800-700-600-500-400-300-200-100
02000 2005 2010 2015 2020
lowmediumhigh
100 TWh means something like 20 big power plant (1 GW),
or 1/3 of the italian total electricity consumption in 2003
- 59 -
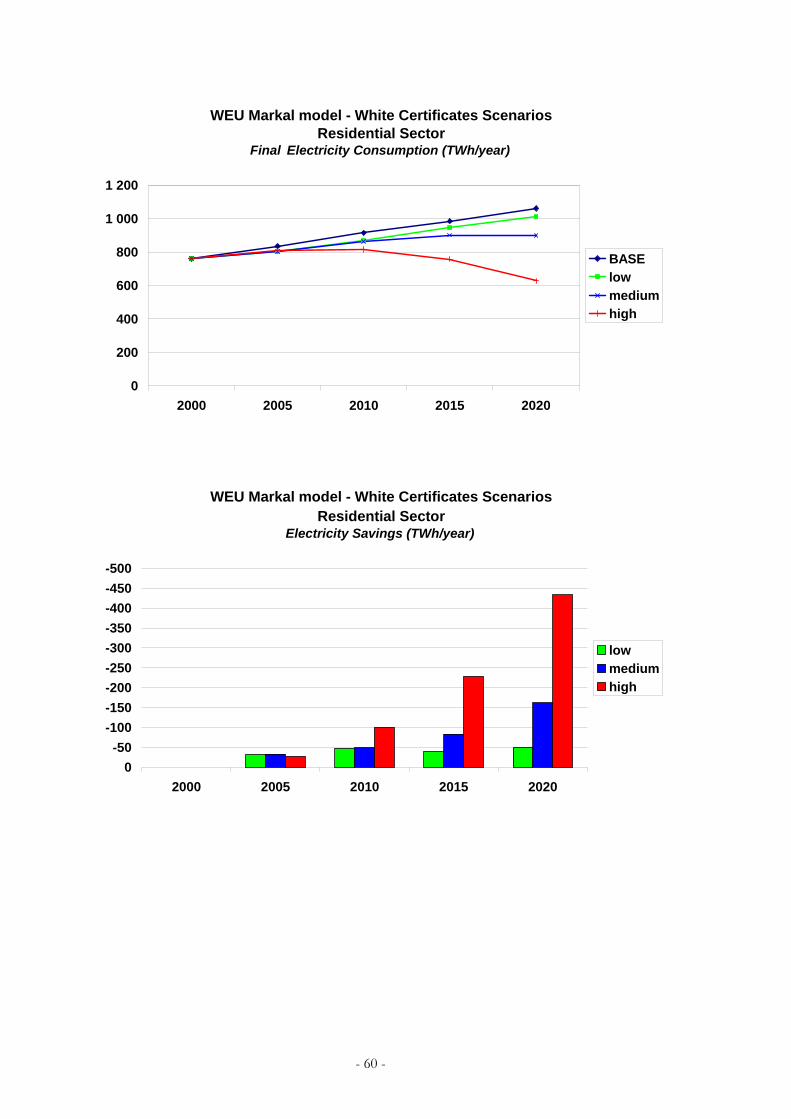
WEU Markal model - White Certificates ScenariosResidential Sector
Final Electricity Consumption (TWh/year)
0
200
400
600
800
1 000
1 200
2000 2005 2010 2015 2020
BASE lowmediumhigh
WEU Markal model - White Certificates ScenariosResidential Sector
Electricity Savings (TWh/year)
-500-450-400-350-300-250-200-150-100-50
02000 2005 2010 2015 2020
lowmediumhigh
- 60 -

WEU Markal model - White Certificates ScenariosCommercial Sector
Final Electricity Consumption (TWh/year)
0100200300400500600700800900
1 000
2000 2005 2010 2015 2020
BASE lowmediumhigh
WEU Markal model - White Certificates ScenariosCommercial Sector
Electricity Savings (TWh/year)
-600
-500
-400
-300
-200
-100
02000 2005 2010 2015 2020
lowmediumhigh
- 61 -

WEU Markal model - White Certificates ScenariosResidential and Commercial Sector
Oil Products Consumption (milion tons/year)
0102030405060708090
100
2000 2005 2010 2015
BASE lowmediumhigh
WEU Markal model - White Certificates ScenariosResidential and Commercial Sector
Total Oil Products Savings (Mt/year)
-40
-35
-30
-25
-20
-15
-10
-5
02000 2005 2010 2015 2020
lowmediumhigh
- 62 -

WEU Markal model - White Certificates ScenariosResidential Sector
Oil Products Consumption (milion tons/year)
0
10
20
30
40
50
60
70
2000 2005 2010 2015 2020
BASE lowmediumhigh
WEU Markal model - White Certificates ScenariosResidential Sector
Oil Products Savings (Mt/year)
-30
-25
-20
-15
-10
-5
02000 2005 2010 2015 2020
lowmediumhigh
- 63 -
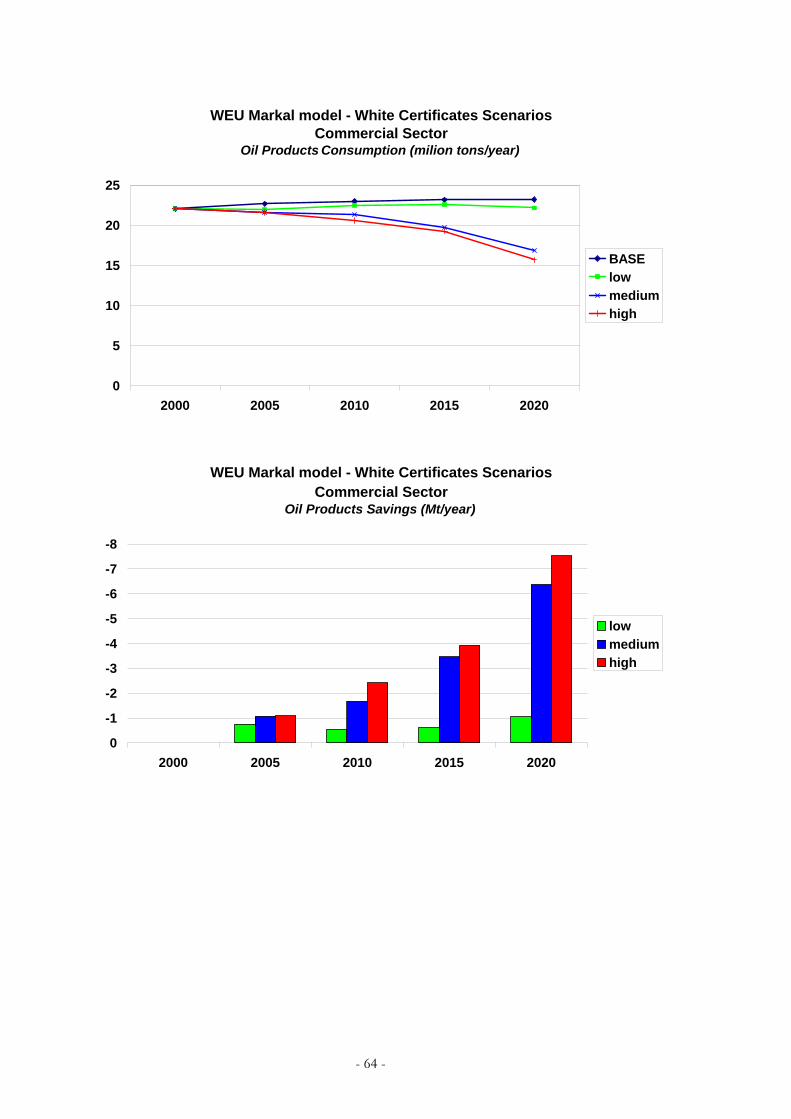
WEU Markal model - White Certificates ScenariosCommercial Sector
Oil Products Consumption (milion tons/year)
0
5
10
15
20
25
2000 2005 2010 2015 2020
BASE lowmediumhigh
WEU Markal model - White Certificates ScenariosCommercial Sector
Oil Products Savings (Mt/year)
-8
-7
-6
-5
-4
-3
-2
-1
02000 2005 2010 2015 2020
lowmediumhigh
- 64 -

b) Detailed results for each scenario b.1) BASE case scenario
WEU Markal model - White Certificates Scenarios BASE CASE - Residential and Commercial Sector
Total Final Energy Consumption by energy source (EJ/year)
02468
101214161820
2000 2005 2010 2015 2020
Other SourcesOil ProductsElectricityNatural Gas
WEU Markal model - White Certificates Scenarios BASE CASE - Residential Sector
Final Energy Consumption by energy source (EJ/year)
0
2
4
6
8
10
12
14
2000 2005 2010 2015 2020
Other SourcesOil ProductsElectricityNatural Gas
- 65 -

WEU Markal model - White Certificates Scenarios BASE CASE - Commercial Sector
Final Energy Consumption by energy source (EJ/year)
0
1
2
3
4
5
6
7
2000 2005 2010 2015 2020
Other SourcesOil ProductsElectricityNatural Gas
WEU Markal model - White Certificates Scenarios BASE CASE - Residential Sector
Natural Gas Consumption by energy service (bcm/year)
0
20
40
60
80
100
120
140
2000 2005 2010 2015 2020
cookinghot waterspace heating
- 66 -

WEU Markal model - White Certificates Scenarios BASE CASE - Commercial Sector
Natural Gas Consumption by energy service (bcm/year)
0
5
10
15
20
25
30
35
40
2000 2005 2010 2015 2020
othershot waterspace heatingcookingcooling
WEU Markal model - White Certificates Scenarios BASE CASE - Residential Sector
Electricity Consumption by energy service (TWh/year)
0
200
400
600
800
1 000
1 200
2000 2005 2010 2015 2020
refrigeration
lighting
cooking
hot water
space heating
cooling
other services
- 67 -

WEU Markal model - White Certificates Scenarios BASE CASE - Commercial Sector
Electricity Consumption by energy service (TWh/year)
0100200300400500600700800900
1 000
2000 2005 2010 2015 2020
refrigerationlightingcookinghot waterspace heatingcoolingoffice equipment
- 68 -

b.2) Low target scenario
WEU Markal model - White Certificates Scenarios LOW TARGET - Residential and Commercial Sector
Total Energy Savings by Sector (EJ/year)
-2,5
-2,0
-1,5
-1,0
-0,5
0,02000 2005 2010 2015 2020
CommercialResidential
WEU Markal model - White Certificates Scenarios LOW TARGET - Residential and Commercial Sector
Total Final Energy Consumption by energy source (EJ/year)
02468
1012141618
2000 2005 2010 2015 2020
Other SourcesOil ProductsElectricityNatural Gas
- 69 -

WEU Markal model - White Certificates Scenarios LOW TARGET - Residential and Commercial Sector
Total Energy Savings by Energy Source (EJ/year, final energy)
-2,5
-2,0
-1,5
-1,0
-0,5
0,02000 2005 2010 2015 2020
Other SourcesOil ProductsElectricityNatural Gas
WEU Markal model - White Certificates Scenarios LOW TARGET - Residential and Commercial Sector
Total Energy Savings by Energy Source (EJ/y, primary energy)
-4,0
-3,5
-3,0
-2,5
-2,0
-1,5
-1,0
-0,5
0,02000 2005 2010 2015 2020
Other SourcesOil ProductsElectricityNatural Gas
- 70 -

WEU Markal model - White Certificates Scenarios LOW TARGET - Residential Sector
Final Energy Consumption by energy source (EJ/year)
0
2
4
6
8
10
12
2000 2005 2010 2015 2020
Other SourcesOil ProductsElectricityNatural Gas
WEU Markal model - White Certificates Scenarios LOW TARGET - Residential Sector
Total Energy Savings by Energy Source (EJ/year, final energy)
-1,4
-1,2
-1,0
-0,8
-0,6
-0,4
-0,2
0,02000 2005 2010 2015 2020
Other SourcesOil ProductsElectricityNatural Gas
- 71 -
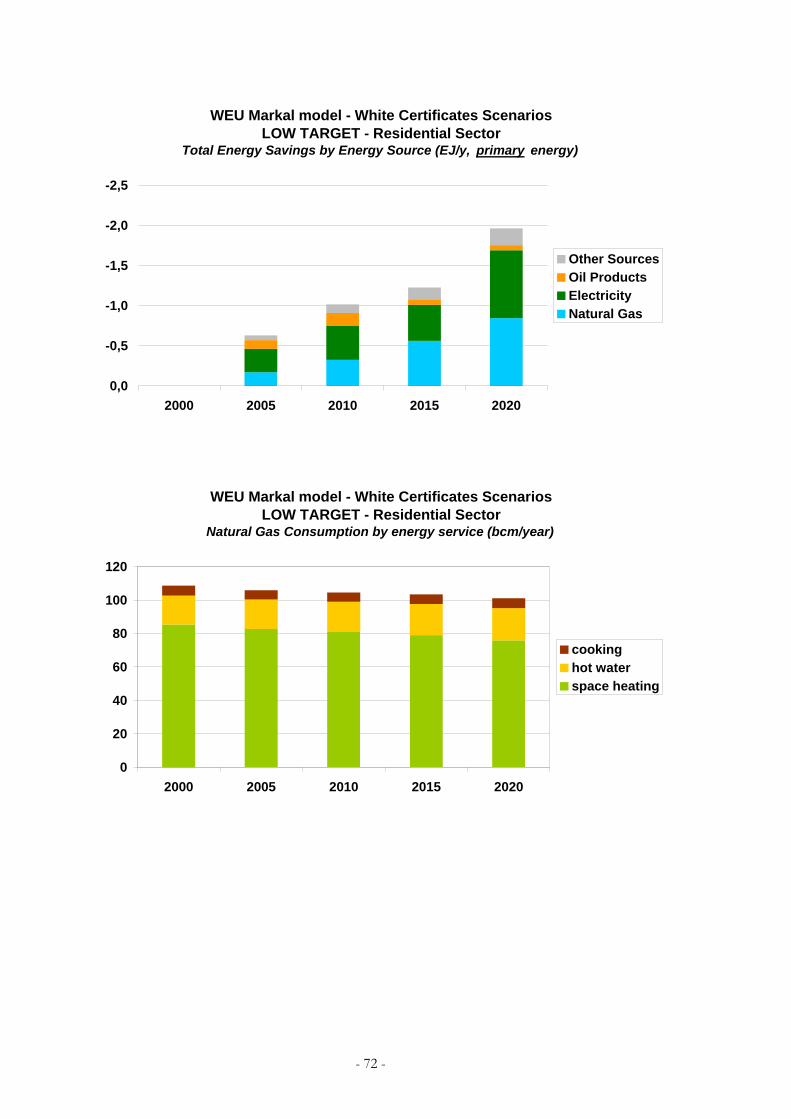
WEU Markal model - White Certificates Scenarios LOW TARGET - Residential Sector
Total Energy Savings by Energy Source (EJ/y, primary energy)
-2,5
-2,0
-1,5
-1,0
-0,5
0,02000 2005 2010 2015 2020
Other SourcesOil ProductsElectricityNatural Gas
WEU Markal model - White Certificates Scenarios LOW TARGET - Residential Sector
Natural Gas Consumption by energy service (bcm/year)
0
20
40
60
80
100
120
2000 2005 2010 2015 2020
cookinghot waterspace heating
- 72 -

WEU Markal model - White Certificates ScenariosLOW TARGET - Residential Sector
Natural Gas Consumption for Space Heating (bcm/year)Natural Gas Burners Advanced
02468
10121416
2000 2005 2010 2015 2020
BASE CASE Low Target
WEU Markal model - White Certificates ScenariosLOW TARGET - Residential Sector
Natural Gas Consumption for Space Heating (bcm/year)Natural Gas Heat Pump Air Standard
0.00.51.01.52.02.53.03.54.0
2000 2005 2010 2015 2020
BASE CASE Low Target
- 73 -

WEU Markal model - White Certificates Scenarios LOW TARGET - Residential Sector
Electricity Consumption by energy service (TWh/year)
0
200
400
600
800
1 000
1 200
2000 2005 2010 2015 2020
refrigeration
lighting
cooking
hot water
space heating
cooling
other services
- 74 -

WEU Markal model - White Certificates Scenarios LOW TARGET - Commercial Sector
Final Energy Consumption by energy source (EJ/year)
0
1
2
3
4
5
6
2000 2005 2010 2015 2020
Other SourcesOil ProductsElectricityNatural Gas
WEU Markal model - White Certificates Scenarios LOW TARGET - Commercial Sector
Total Energy Savings by Energy Source (EJ/year, final energy)
-0,8-0,7-0,6-0,5-0,4-0,3-0,2-0,10,00,1
2000 2005 2010 2015 2020
Other SourcesOil ProductsElectricityNatural Gas
- 75 -

WEU Markal model - White Certificates Scenarios LOW TARGET - Commercial Sector
Total Energy Savings by Energy Source (EJ/y, primary energy)
-1,8-1,6-1,4-1,2-1,0-0,8-0,6-0,4-0,20,00,2
2000 2005 2010 2015 2020
Other SourcesOil ProductsElectricityNatural Gas
WEU Markal model - White Certificates Scenarios LOW TARGET - Commercial Sector
Natural Gas Consumption by energy service (bcm/year)
0
5
10
15
20
25
30
35
2000 2005 2010 2015 2020
othershot waterspace heatingcookingcooling
- 76 -

WEU Markal model - White Certificates ScenariosLOW TARGET - Commercial Sector
Natural Gas Consumption for Water Heating (bcm/year)Natural Gas Water Heater Std.
0123456789
10
2000 2005 2010 2015 2020
BASE CASE Low Target
WEU Markal model - White Certificates ScenariosLOW TARGET - Commercial Sector
Electricity Consumption for Water Heating (TWh/year)Heat Pump Air Advanced
0
1
2
3
4
5
6
2000 2005 2010 2015 2020
BASE CASE Low Target
- 77 -

WEU Markal model - White Certificates Scenarios LOW TARGET - Commercial Sector
Electricity Consumption by energy service (TWh/year)
0
500
1 000
1 500
2 000
2 500
3 000
3 500
2000 2005 2010 2015 2020
refrigerationlightingcookinghot waterspace heatingcoolingoffice equipment
WEU Markal model - White Certificates ScenariosLOW TARGET - Commercial Sector
Electricity Consumption for Cooling (TWh)Electric Chiller Rooftop
05
101520253035404550
2000 2005 2010 2015 2020
BASE CASE Low Target
- 78 -

WEU Markal model - White Certificates ScenariosLOW TARGET - Commercial Sector
Electricity Consumption for Cooling (TWh)Electric Chiller Centrifugal
0
2
4
6
8
10
12
2000 2005 2010 2015 2020
BASE CASE Low Target
WEU Markal model - White Certificates ScenariosLOW TARGET - Commercial Sector
Electricity Consumption for Cooling (TWh)Heat Pump Air Standard
02468
10121416
2000 2005 2010 2015 2020
BASE CASE Low Target
- 79 -

WEU Markal model - White Certificates ScenariosLOW TARGET - Commercial Sector
Distillate Consumption for Space Heating (PJ/year)Advanced Burners
050
100150200250300350400450500
2000 2005 2010 2015 2020
BASE CASE Low Target
- 80 -

b.3) Medium target scenario
WEU Markal model - White Certificates Scenarios MEDIUM TARGET - Residential and Commercial Sector
Total Energy Savings by Sector (EJ/year)
-6
-5
-4
-3
-2
-1
02000 2005 2010 2015 2020
CommercialResidential
WEU Markal model - White Certificates Scenarios MEDIUM TARGET - Residential and Commercial Sector Total Final Energy Consumption by energy source (EJ/year)
02468
101214161820
2000 2005 2010 2015 2020
Other SourcesOil ProductsElectricityNatural Gas
- 81 -

WEU Markal model - White Certificates Scenarios MEDIUM TARGET - Residential and Commercial Sector
Total Energy Savings by Energy Source (EJ/year, final energy)
-6
-5
-4
-3
-2
-1
02000 2005 2010 2015 2020
Other SourcesOil ProductsElectricityNatural Gas
WEU Markal model - White Certificates Scenarios MEDIUM TARGET - Residential and Commercial Sector
Total Energy Savings by Energy Source (EJ/y, primary energy)
-12
-10
-8
-6
-4
-2
02000 2005 2010 2015 2020
Other SourcesOil ProductsElectricityNatural Gas
- 82 -

WEU Markal model - White Certificates Scenarios MEDIUM TARGET - Residential Sector
Final Energy Consumption by energy source (EJ/year)
0
2
4
6
8
10
12
14
2000 2005 2010 2015 2020
Other SourcesOil ProductsElectricityNatural Gas
WEU Markal model - White Certificates Scenarios MEDIUM TARGET - Residential Sector
Total Energy Savings by Energy Source (EJ/year, final energy)
-3,5
-3,0
-2,5
-2,0
-1,5
-1,0
-0,5
0,02000 2005 2010 2015 2020
Other SourcesOil ProductsElectricityNatural Gas
- 83 -
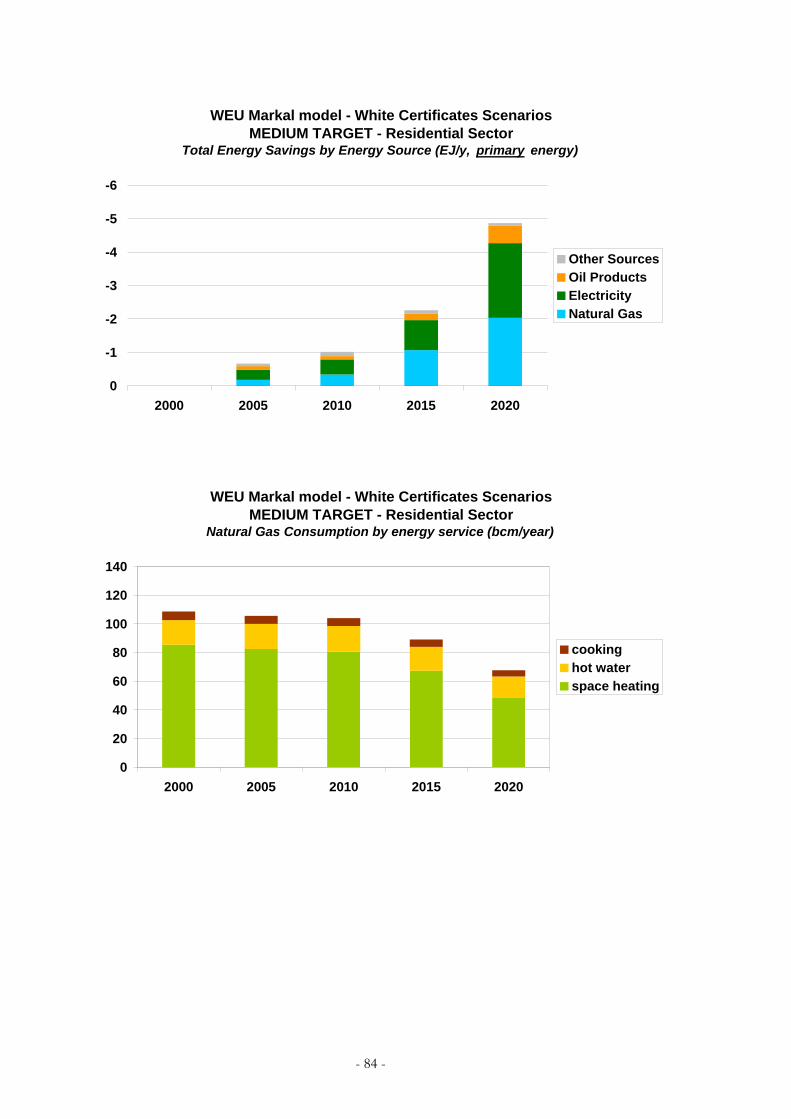
WEU Markal model - White Certificates Scenarios MEDIUM TARGET - Residential Sector
Total Energy Savings by Energy Source (EJ/y, primary energy)
-6
-5
-4
-3
-2
-1
02000 2005 2010 2015 2020
Other SourcesOil ProductsElectricityNatural Gas
WEU Markal model - White Certificates Scenarios MEDIUM TARGET - Residential Sector
Natural Gas Consumption by energy service (bcm/year)
0
20
40
60
80
100
120
140
2000 2005 2010 2015 2020
cookinghot waterspace heating
- 84 -
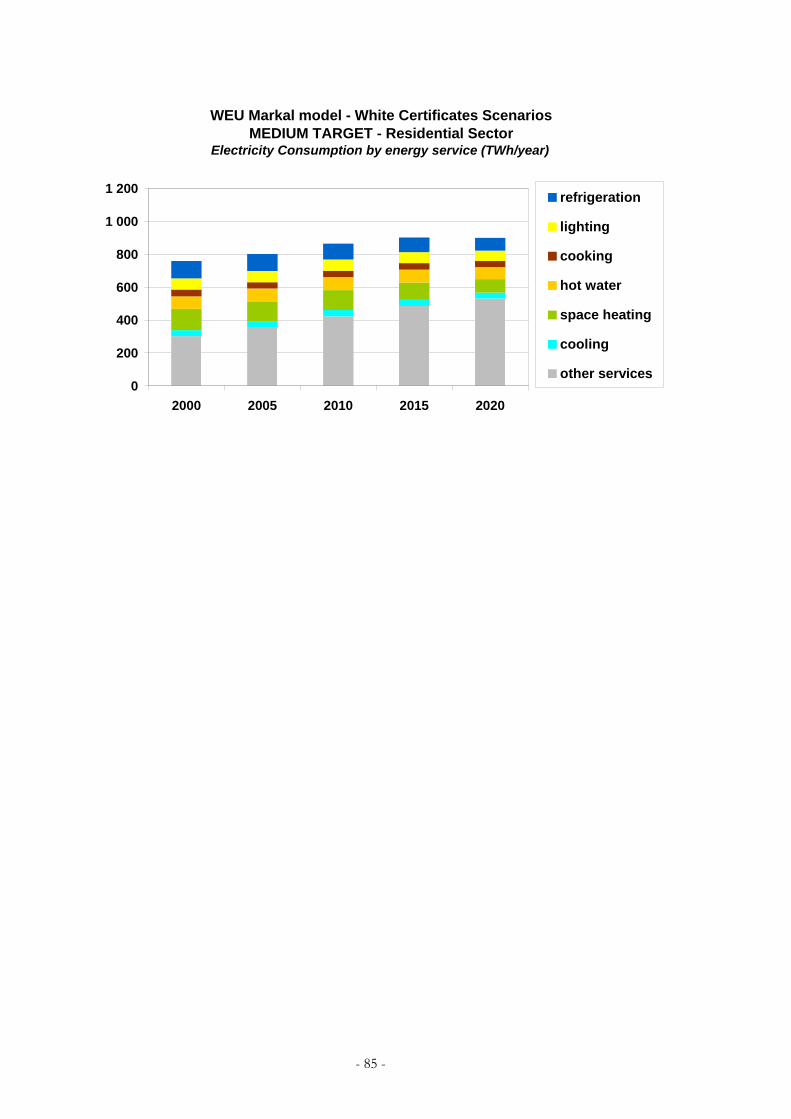
WEU Markal model - White Certificates Scenarios MEDIUM TARGET - Residential Sector
Electricity Consumption by energy service (TWh/year)
0
200
400
600
800
1 000
1 200
2000 2005 2010 2015 2020
refrigeration
lighting
cooking
hot water
space heating
cooling
other services
- 85 -

WEU Markal model - White Certificates Scenarios MEDIUM TARGET - Commercial Sector
Final Energy Consumption by energy source (EJ/year)
0
1
2
3
4
5
6
7
2000 2005 2010 2015 2020
Other SourcesOil ProductsElectricityNatural Gas
WEU Markal model - White Certificates Scenarios MEDIUM TARGET - Commercial Sector
Total Energy Savings by Energy Source (EJ/year, final energy)
-2,0-1,8-1,6-1,4-1,2-1,0-0,8-0,6-0,4-0,20,0
2000 2005 2010 2015 2020
Other SourcesOil ProductsElectricityNatural Gas
- 86 -

WEU Markal model - White Certificates Scenarios MEDIUM TARGET - Commercial Sector
Total Energy Savings by Energy Source (EJ/y, primary energy)
-5,0-4,5-4,0-3,5-3,0-2,5-2,0-1,5-1,0-0,50,0
2000 2005 2010 2015 2020
Other SourcesOil ProductsElectricityNatural Gas
WEU Markal model - White Certificates Scenarios MEDIUM TARGET - Commercial Sector
Natural Gas Consumption by energy service (bcm/year)
0
5
10
15
20
25
30
35
40
2000 2005 2010 2015 2020
othershot waterspace heatingcookingcooling
- 87 -

WEU Markal model - White Certificates Scenarios MEDIUM TARGET - Commercial Sector
Electricity Consumption by energy service (TWh/year)
0100200300400500600700800900
1 000
2000 2005 2010 2015 2020
refrigerationlightingcookinghot waterspace heatingcoolingoffice equipment
- 88 -
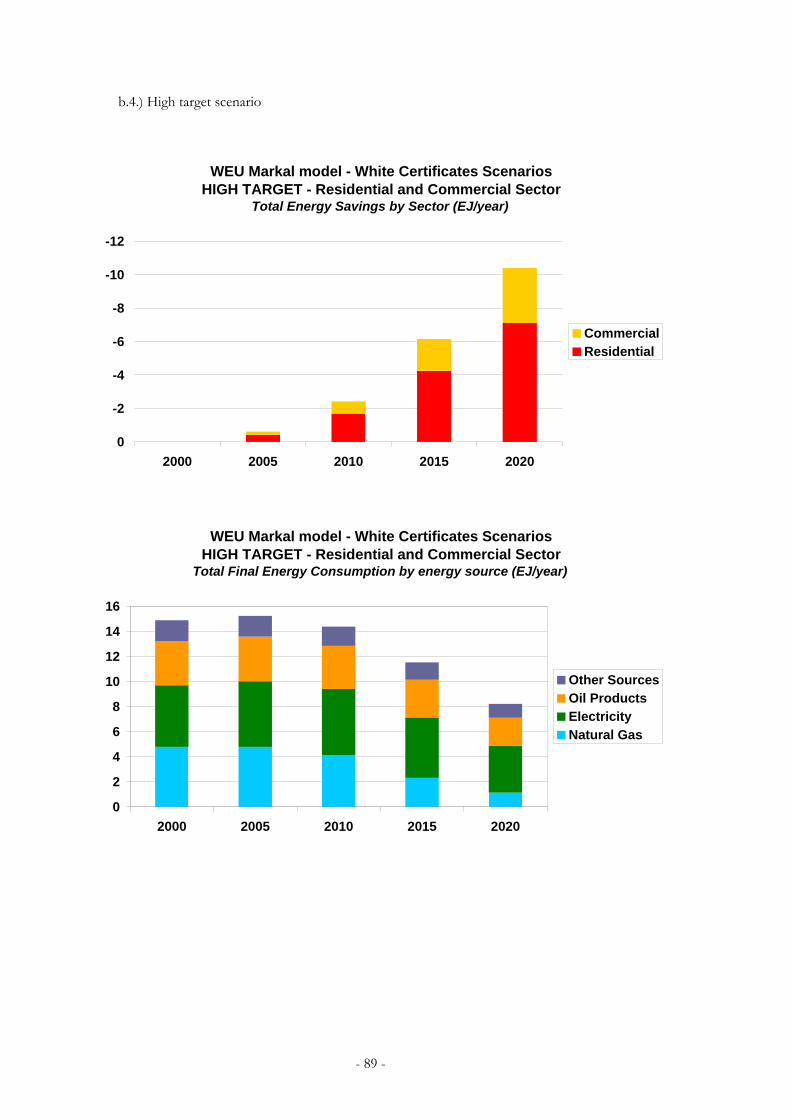
b.4.) High target scenario
WEU Markal model - White Certificates Scenarios HIGH TARGET - Residential and Commercial Sector
Total Energy Savings by Sector (EJ/year)
-12
-10
-8
-6
-4
-2
02000 2005 2010 2015 2020
CommercialResidential
WEU Markal model - White Certificates Scenarios HIGH TARGET - Residential and Commercial Sector
Total Final Energy Consumption by energy source (EJ/year)
0
2
4
6
8
10
12
14
16
2000 2005 2010 2015 2020
Other SourcesOil ProductsElectricityNatural Gas
- 89 -

WEU Markal model - White Certificates Scenarios HIGH TARGET - Residential and Commercial Sector
Total Energy Savings by Energy Source (EJ/year, final energy)
-12
-10
-8
-6
-4
-2
02000 2005 2010 2015 2020
Other SourcesOil ProductsElectricityNatural Gas
WEU Markal model - White Certificates Scenarios HIGH TARGET - Residential and Commercial Sector
Total Energy Savings by Energy Source (EJ/y, primary energy)
-25
-20
-15
-10
-5
02000 2005 2010 2015 2020
Other SourcesOil ProductsElectricityNatural Gas
- 90 -

WEU Markal model - White Certificates Scenarios HIGH TARGET - Residential Sector
Final Energy Consumption by energy source (EJ/year)
0
2
4
6
8
10
12
2000 2005 2010 2015 2020
Other SourcesOil ProductsElectricityNatural Gas
WEU Markal model - White Certificates Scenarios HIGH TARGET - Residential Sector
Total Energy Savings by Energy Source (EJ/year, final energy)
-8
-7
-6
-5
-4
-3
-2
-1
02000 2005 2010 2015 2020
Other SourcesOil ProductsElectricityNatural Gas
- 91 -
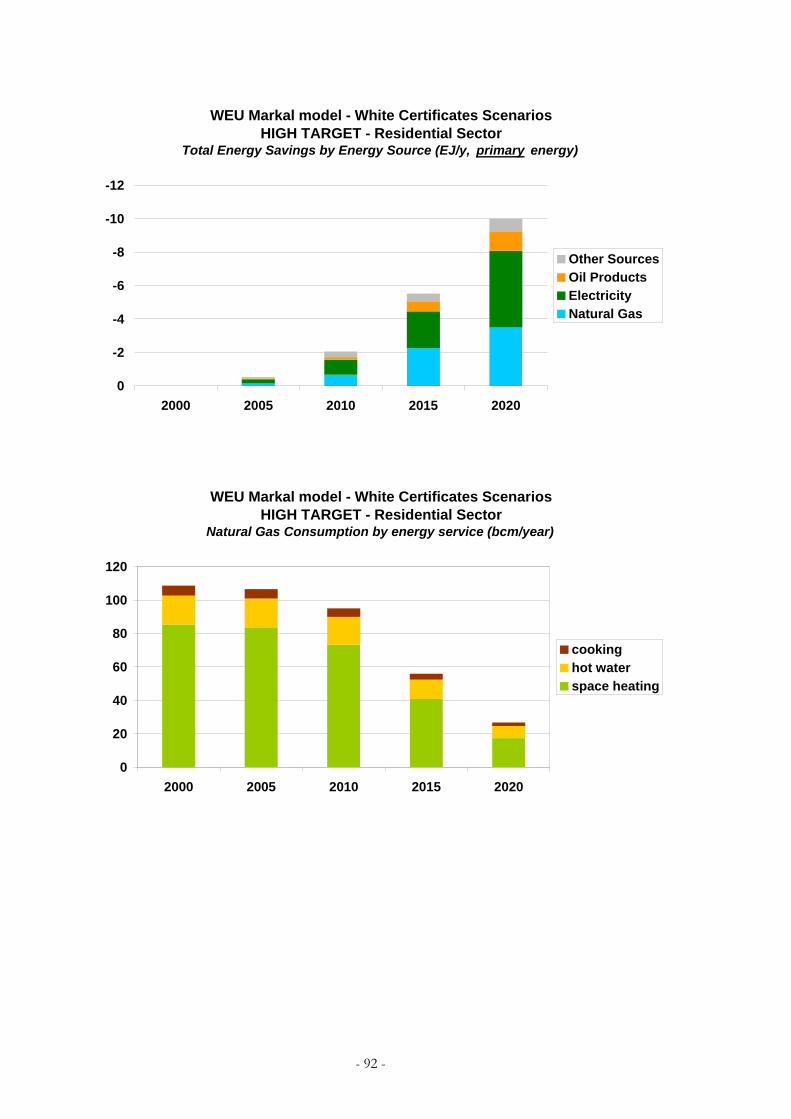
WEU Markal model - White Certificates Scenarios HIGH TARGET - Residential Sector
Total Energy Savings by Energy Source (EJ/y, primary energy)
-12
-10
-8
-6
-4
-2
02000 2005 2010 2015 2020
Other SourcesOil ProductsElectricityNatural Gas
WEU Markal model - White Certificates Scenarios HIGH TARGET - Residential Sector
Natural Gas Consumption by energy service (bcm/year)
0
20
40
60
80
100
120
2000 2005 2010 2015 2020
cookinghot waterspace heating
- 92 -

WEU Markal model - White Certificates Scenarios HIGH TARGET - Residential Sector
Electricity Consumption by energy service (TWh/year)
0100200300400500600700800900
2000 2005 2010 2015 2020
refrigeration
lighting
cooking
hot water
space heating
cooling
other services
- 93 -

WEU Markal model - White Certificates Scenarios HIGH TARGET - Commercial Sector
Final Energy Consumption by energy source (EJ/year)
0,00,51,01,52,02,53,03,54,04,55,0
2000 2005 2010 2015 2020
Other SourcesOil ProductsElectricityNatural Gas
WEU Markal model - White Certificates Scenarios HIGH TARGET - Commercial Sector
Total Energy Savings by Energy Source (EJ/year, final energy)
-4,0
-3,5
-3,0
-2,5
-2,0
-1,5
-1,0
-0,5
0,02000 2005 2010 2015 2020
Other SourcesOil ProductsElectricityNatural Gas
- 94 -

WEU Markal model - White Certificates Scenarios HIGH TARGET - Commercial Sector
Total Energy Savings by Energy Source (EJ/y, primary energy)
-12
-10
-8
-6
-4
-2
02000 2005 2010 2015 2020
Other SourcesOil ProductsElectricityNatural Gas
WEU Markal model - White Certificates Scenarios HIGH TARGET - Commercial Sector
Natural Gas Consumption by energy service (bcm/year)
0
5
10
15
20
25
30
2000 2005 2010 2015 2020
othershot waterspace heatingcookingcooling
- 95 -

WEU Markal model - White Certificates Scenarios HIGH TARGET - Commercial Sector
Electricity Consumption by energy service (TWh/year)
0
500
1 000
1 500
2 000
2 500
2000 2005 2010 2015 2020
refrigerationlightingcookinghot waterspace heatingcoolingoffice equipment
- 96 -

c) Financial aspects
WEU Markal model - White Certificates ScenariosResidential and Commercial Sector
Trade-off curve: total (R&C) final energy saved in 2020 (% of b.a.u. scenario) vs.
average energy system cost increase (€/GJ and %) in 2020
-1
0
1
2
3
4
0% 10% 20% 30% 40% 50% 60%% reduction (b.a.u.)
€/G
J
-13%
0%
13%
25%
38%
50%
WEU Markal model - White Certificates ScenariosResidential and Commercial Sector
Trade-off curve: cumulated (R&C) final energy saved 2000-2020 (% of b.a.u.) vs.
average energy system cost increase (€/GJ and %)
-0.5
0.0
0.5
1.0
1.5
0% 5% 10% 15% 20% 25%% reduction (b.a.u.)
€/G
J
-5%
0%
5%
10%
15%
20%
- 97 -

WEU Markal model - White Certificates ScenariosResidential and Commercial Sector
Trade-off curve: total (R&C) final energy saved in 2010 (% of b.a.u. scenario) vs. average
energy system cost increase (€/GJ and %) in 2010
-0,6-0,4-0,20,00,20,40,60,81,01,2
0% 2% 4% 6% 8% 10% 12% 14% 16%% reduction (b.a.u.)
€/G
J
-6%-4%-2%0%2%4%6%8%10%12%
WEU Markal model - White Certificates Scenarios Base Cases
Discounted Total Energy System Cost (billion €)Financial Discount Rate in Residential and Commercial Sector:
red = 30%, blue = 5%
0
2 000
4 000
6 000
8 000
10 000
12 000
30% DR low
- 98 -

WEU Markal model - White Certificates Scenarios Base Cases
Undiscounted Total Energy System Cost in 2010 (billion €)Financial Discount Rate in Residential and Commercial Sector:
red = 30%, blue = 5%
0100200300400500600700800
30% DR low
WEU Markal model - White Certificates ScenariosResidential and Commercial Sector
Additional Investments in Demand Technologies (% variation from the base case)
0%10%20%30%40%50%60%70%80%90%
2005 2010 2015 2020
LowMediumHigh
- 99 -
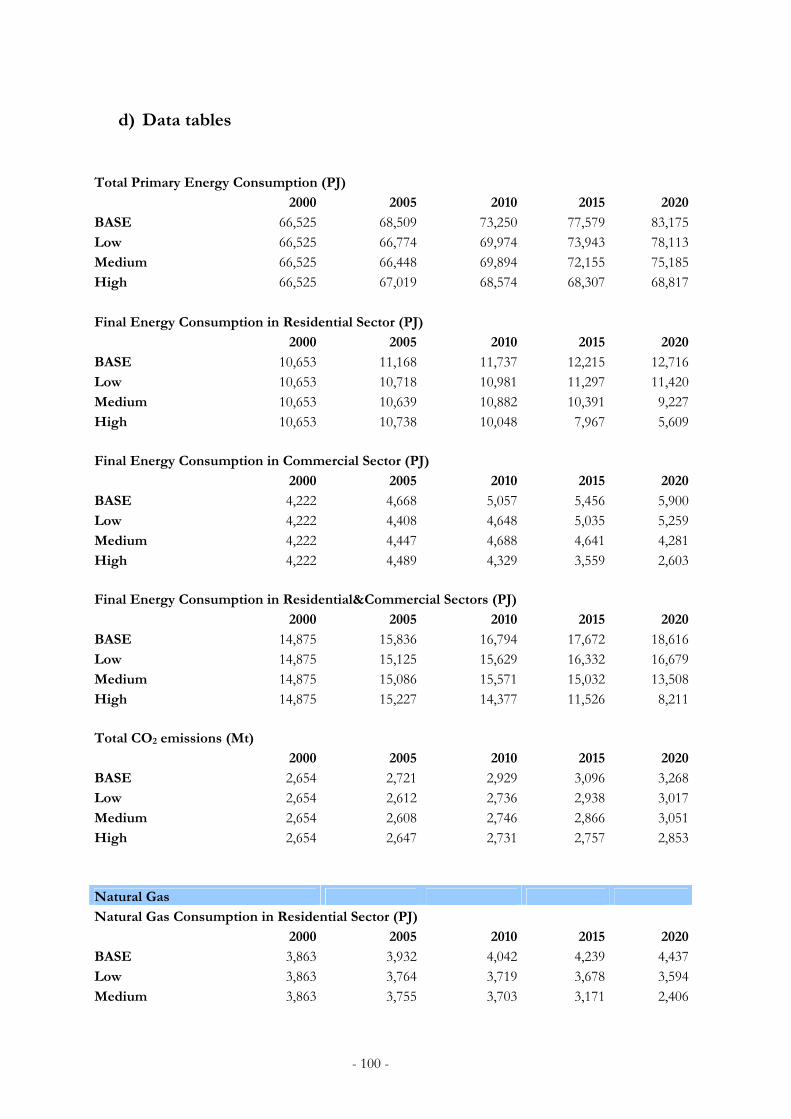
d) Data tables Total Primary Energy Consumption (PJ) 2000 2005 2010 2015 2020BASE 66,525 68,509 73,250 77,579 83,175Low 66,525 66,774 69,974 73,943 78,113Medium 66,525 66,448 69,894 72,155 75,185High 66,525 67,019 68,574 68,307 68,817 Final Energy Consumption in Residential Sector (PJ) 2000 2005 2010 2015 2020BASE 10,653 11,168 11,737 12,215 12,716Low 10,653 10,718 10,981 11,297 11,420Medium 10,653 10,639 10,882 10,391 9,227High 10,653 10,738 10,048 7,967 5,609 Final Energy Consumption in Commercial Sector (PJ) 2000 2005 2010 2015 2020BASE 4,222 4,668 5,057 5,456 5,900Low 4,222 4,408 4,648 5,035 5,259Medium 4,222 4,447 4,688 4,641 4,281High 4,222 4,489 4,329 3,559 2,603 Final Energy Consumption in Residential&Commercial Sectors (PJ) 2000 2005 2010 2015 2020BASE 14,875 15,836 16,794 17,672 18,616Low 14,875 15,125 15,629 16,332 16,679Medium 14,875 15,086 15,571 15,032 13,508High 14,875 15,227 14,377 11,526 8,211 Total CO2 emissions (Mt) 2000 2005 2010 2015 2020BASE 2,654 2,721 2,929 3,096 3,268Low 2,654 2,612 2,736 2,938 3,017Medium 2,654 2,608 2,746 2,866 3,051High 2,654 2,647 2,731 2,757 2,853 Natural Gas Natural Gas Consumption in Residential Sector (PJ) 2000 2005 2010 2015 2020BASE 3,863 3,932 4,042 4,239 4,437Low 3,863 3,764 3,719 3,678 3,594Medium 3,863 3,755 3,703 3,171 2,406
- 100 -

High 3,863 3,788 3,379 1,990 950 Natural Gas Consumption in Commercial Sector (PJ) 2000 2005 2010 2015 2020BASE 917 1,070 1,149 1,250 1,328Low 917 977 948 1,004 1,032Medium 917 972 938 789 628High 917 990 751 325 170 Total Natural Gas Consumption in Commercial Sector (PJ) 2000 2005 2010 2015 2020BASE 4,780 5,002 5,192 5,489 5,765Low 4,780 4,741 4,667 4,682 4,627Medium 4,780 4,726 4,641 3,960 3,034High 4,780 4,778 4,130 2,315 1,120 Electricity Electricity Consumption in Residential Sector (final PJ) 2000 2005 2010 2015 2020BASE 2,733 3,006 3,294 3,546 3,822Low 2,733 2,893 3,125 3,405 3,643Medium 2,733 2,887 3,116 3,248 3,239High 2,733 2,909 2,933 2,726 2,262 Electricity Consumption in Commercial Sector (final PJ) 2000 2005 2010 2015 2020BASE 2,178 2,430 2,693 2,978 3,316Low 2,178 2,313 2,521 2,799 2,977Medium 2,178 2,307 2,512 2,618 2,420High 2,178 2,330 2,334 2,094 1,480 Total Electricity Consumption in Residential&Commercial Sector (final PJ) 2000 2005 2010 2015 2020BASE 4,911 5,436 5,987 6,524 7,138Low 4,911 5,206 5,646 6,204 6,620Medium 4,911 5,193 5,629 5,866 5,659High 4,911 5,239 5,267 4,819 3,742 Electricity Consumption in Residential Sector (primary PJ equivalent) 2000 2005 2010 2015 2020BASE 5,446 6,076 6,731 7,445 8,289Low 5,446 5,783 6,303 6,997 7,443Medium 5,446 5,767 6,281 6,545 6,051High 5,446 5,825 5,836 5,234 3,700
- 101 -
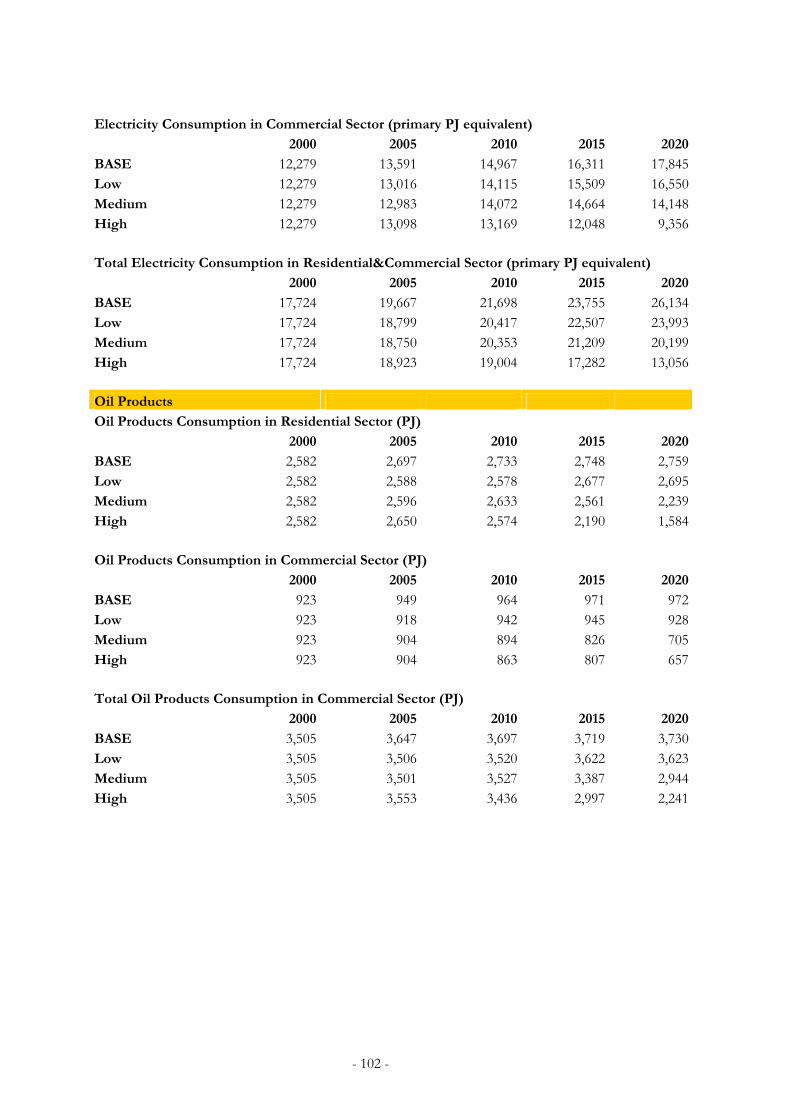
Electricity Consumption in Commercial Sector (primary PJ equivalent) 2000 2005 2010 2015 2020BASE 12,279 13,591 14,967 16,311 17,845Low 12,279 13,016 14,115 15,509 16,550Medium 12,279 12,983 14,072 14,664 14,148High 12,279 13,098 13,169 12,048 9,356 Total Electricity Consumption in Residential&Commercial Sector (primary PJ equivalent) 2000 2005 2010 2015 2020BASE 17,724 19,667 21,698 23,755 26,134Low 17,724 18,799 20,417 22,507 23,993Medium 17,724 18,750 20,353 21,209 20,199High 17,724 18,923 19,004 17,282 13,056 Oil Products Oil Products Consumption in Residential Sector (PJ) 2000 2005 2010 2015 2020BASE 2,582 2,697 2,733 2,748 2,759Low 2,582 2,588 2,578 2,677 2,695Medium 2,582 2,596 2,633 2,561 2,239High 2,582 2,650 2,574 2,190 1,584 Oil Products Consumption in Commercial Sector (PJ) 2000 2005 2010 2015 2020BASE 923 949 964 971 972Low 923 918 942 945 928Medium 923 904 894 826 705High 923 904 863 807 657 Total Oil Products Consumption in Commercial Sector (PJ) 2000 2005 2010 2015 2020BASE 3,505 3,647 3,697 3,719 3,730Low 3,505 3,506 3,520 3,622 3,623Medium 3,505 3,501 3,527 3,387 2,944High 3,505 3,553 3,436 2,997 2,241
- 102 -

BASE CASE (PJ) by sector and source Residential Sector 2000 2005 2010 2015 2020 Natural Gas 3,863 3,932 4,042 4,239 4,437 Electricity 2,733 3,006 3,294 3,546 3,822 Oil Products 2,582 2,697 2,733 2,748 2,759 Other Sources 1,475 1,532 1,668 1,683 1,697 Total 10,653 11,168 11,737 12,215 12,716 Commercial Sector 2000 2005 2010 2015 2020 Natural Gas 917 1,070 1,149 1,250 1,328 Electricity 2,178 2,430 2,693 2,978 3,316 Oil Products 923 949 964 971 972 Other Sources 204 219 251 258 285 Total 4,222 4,668 5,057 5,456 5,900 Total Residential&Commercial Sectors 2000 2005 2010 2015 2020 Natural Gas 4,780 5,002 5,192 5,489 5,765 Electricity 4,911 5,436 5,987 6,524 7,138 Oil Products 3,505 3,647 3,697 3,719 3,730 Other Sources 1,679 1,750 1,918 1,940 1,982 Total 14,875 15,836 16,794 17,672 18,616 by sector, source and energy service Residential Sector Natural Gas 2000 2005 2010 2015 2020 Space heating 3,037 3,080 3,134 3,282 3,435 Hot water 615 648 691 729 765 Cooking 211 204 216 227 238 Total 3,863 3,932 4,042 4,239 4,437
- 103 -
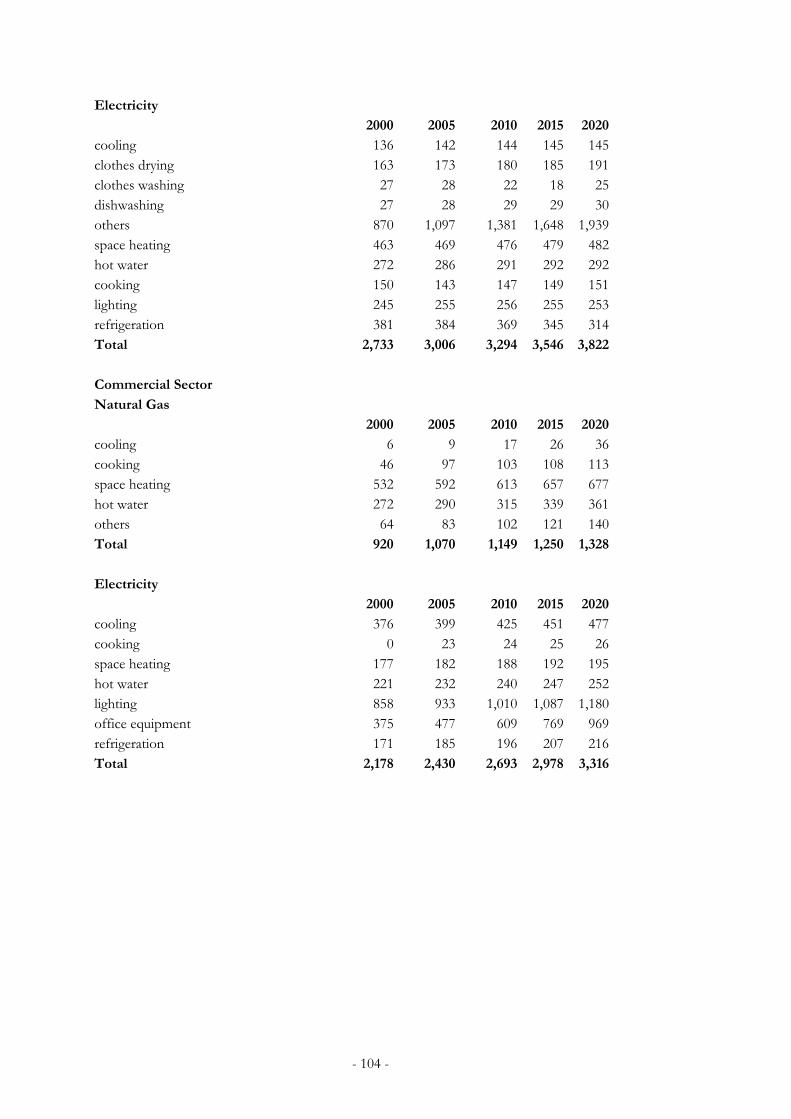
Electricity 2000 2005 2010 2015 2020 cooling 136 142 144 145 145 clothes drying 163 173 180 185 191 clothes washing 27 28 22 18 25 dishwashing 27 28 29 29 30 others 870 1,097 1,381 1,648 1,939 space heating 463 469 476 479 482 hot water 272 286 291 292 292 cooking 150 143 147 149 151 lighting 245 255 256 255 253 refrigeration 381 384 369 345 314 Total 2,733 3,006 3,294 3,546 3,822 Commercial Sector Natural Gas 2000 2005 2010 2015 2020 cooling 6 9 17 26 36 cooking 46 97 103 108 113 space heating 532 592 613 657 677 hot water 272 290 315 339 361 others 64 83 102 121 140 Total 920 1,070 1,149 1,250 1,328 Electricity 2000 2005 2010 2015 2020 cooling 376 399 425 451 477 cooking 0 23 24 25 26 space heating 177 182 188 192 195 hot water 221 232 240 247 252 lighting 858 933 1,010 1,087 1,180 office equipment 375 477 609 769 969 refrigeration 171 185 196 207 216 Total 2,178 2,430 2,693 2,978 3,316
- 104 -
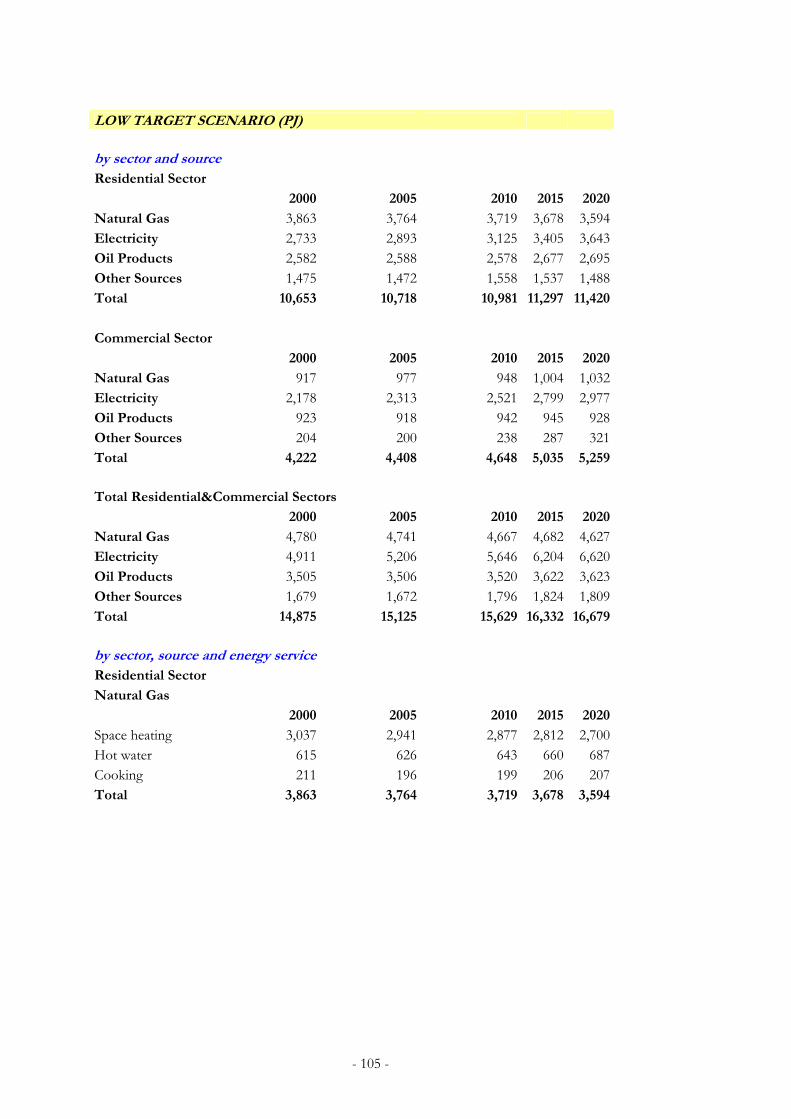
LOW TARGET SCENARIO (PJ) by sector and source Residential Sector 2000 2005 2010 2015 2020 Natural Gas 3,863 3,764 3,719 3,678 3,594 Electricity 2,733 2,893 3,125 3,405 3,643 Oil Products 2,582 2,588 2,578 2,677 2,695 Other Sources 1,475 1,472 1,558 1,537 1,488 Total 10,653 10,718 10,981 11,297 11,420 Commercial Sector 2000 2005 2010 2015 2020 Natural Gas 917 977 948 1,004 1,032 Electricity 2,178 2,313 2,521 2,799 2,977 Oil Products 923 918 942 945 928 Other Sources 204 200 238 287 321 Total 4,222 4,408 4,648 5,035 5,259 Total Residential&Commercial Sectors 2000 2005 2010 2015 2020 Natural Gas 4,780 4,741 4,667 4,682 4,627 Electricity 4,911 5,206 5,646 6,204 6,620 Oil Products 3,505 3,506 3,520 3,622 3,623 Other Sources 1,679 1,672 1,796 1,824 1,809 Total 14,875 15,125 15,629 16,332 16,679 by sector, source and energy service Residential Sector Natural Gas 2000 2005 2010 2015 2020 Space heating 3,037 2,941 2,877 2,812 2,700 Hot water 615 626 643 660 687 Cooking 211 196 199 206 207 Total 3,863 3,764 3,719 3,678 3,594
- 105 -
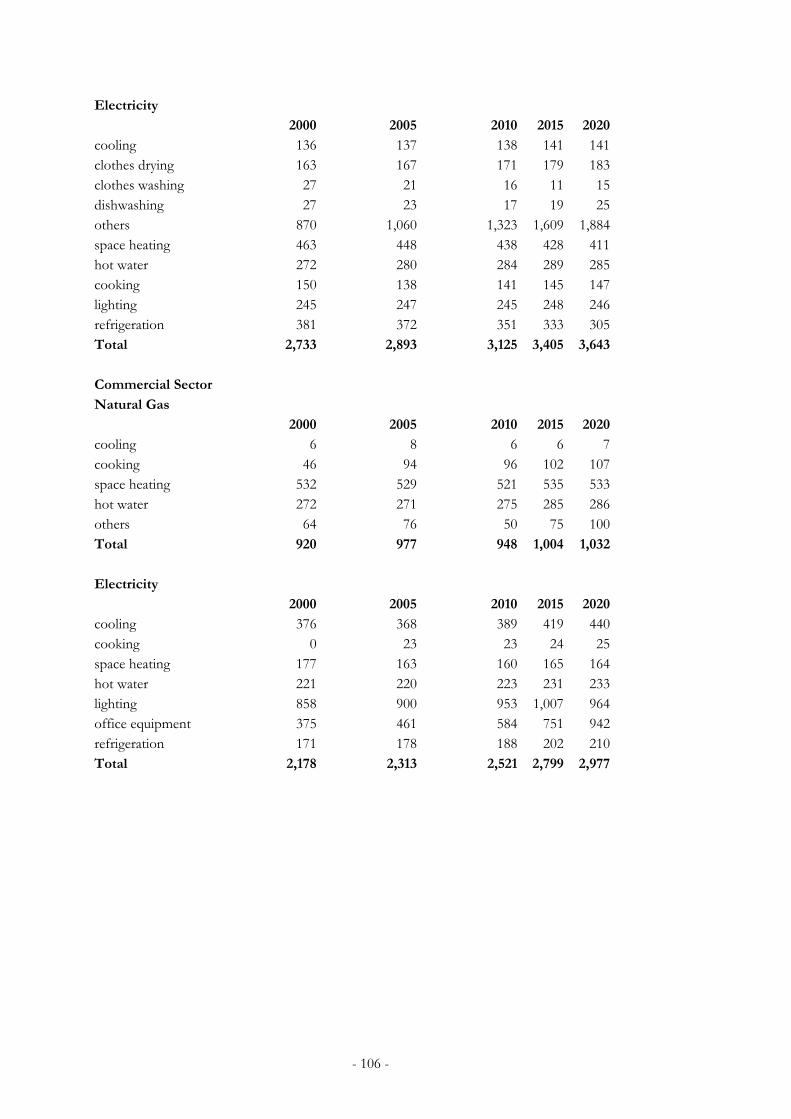
Electricity 2000 2005 2010 2015 2020 cooling 136 137 138 141 141 clothes drying 163 167 171 179 183 clothes washing 27 21 16 11 15 dishwashing 27 23 17 19 25 others 870 1,060 1,323 1,609 1,884 space heating 463 448 438 428 411 hot water 272 280 284 289 285 cooking 150 138 141 145 147 lighting 245 247 245 248 246 refrigeration 381 372 351 333 305 Total 2,733 2,893 3,125 3,405 3,643 Commercial Sector Natural Gas 2000 2005 2010 2015 2020 cooling 6 8 6 6 7 cooking 46 94 96 102 107 space heating 532 529 521 535 533 hot water 272 271 275 285 286 others 64 76 50 75 100 Total 920 977 948 1,004 1,032 Electricity 2000 2005 2010 2015 2020 cooling 376 368 389 419 440 cooking 0 23 23 24 25 space heating 177 163 160 165 164 hot water 221 220 223 231 233 lighting 858 900 953 1,007 964 office equipment 375 461 584 751 942 refrigeration 171 178 188 202 210 Total 2,178 2,313 2,521 2,799 2,977
- 106 -

MEDIUM TARGET SCENARIO (PJ) by sector and source Residential Sector 2000 2005 2010 2015 2020 Natural Gas 3,863 3,755 3,703 3,171 2,406 Electricity 2,733 2,887 3,116 3,248 3,239 Oil Products 2,582 2,596 2,633 2,561 2,239 Other Sources 1,475 1,457 1,542 1,578 1,621 Total 10,653 10,639 10,882 10,391 9,227 Commercial Sector 2000 2005 2010 2015 2020 Natural Gas 917 972 938 789 628 Electricity 2,178 2,307 2,512 2,618 2,420 Oil Products 923 904 894 826 705 Other Sources 204 208 232 241 250 Total 4,222 4,447 4,688 4,641 4,281 Total Residential&Commercial Sectors 2000 2005 2010 2015 2020 Natural Gas 4,780 4,726 4,641 3,960 3,034 Electricity 4,911 5,193 5,629 5,866 5,659 Oil Products 3,505 3,501 3,527 3,387 2,944 Other Sources 1,679 1,666 1,774 1,819 1,871 Total 14,875 15,086 15,571 15,032 13,508 by sector, source and energy service Residential Sector Natural Gas 2000 2005 2010 2015 2020 space heating 3,037 2,934 2,865 2,395 1,717 hot water 615 625 640 592 534 cooking 211 196 198 184 155 Total 3,863 3,755 3,703 3,171 2,406
- 107 -

Electricity 2000 2005 2010 2015 2020 cooling 136 137 138 137 129 clothes drying 163 167 171 172 165 clothes washing 27 21 15 15 13 dishwashing 27 22 17 10 18 others 870 1,058 1,320 1,549 1,715 space heating 463 447 437 380 296 hot water 272 280 284 283 263 cooking 150 138 140 141 135 lighting 245 246 245 241 225 refrigeration 381 371 350 320 280 Total 2,733 2,887 3,116 3,248 3,239 Commercial Sector Natural Gas 2000 2005 2010 2015 2020 cooling 6 8 6 5 4 cooking 46 93 95 92 85 space heating 532 525 517 416 314 hot water 272 270 273 234 180 others 64 75 47 42 46 Total 920 972 938 789 628 Electricity 2000 2005 2010 2015 2020 cooling 376 366 387 387 373 cooking 0 23 23 24 23 space heating 177 162 159 140 118 hot water 221 220 223 216 198 lighting 858 898 950 928 656 office equipment 375 460 583 728 860 refrigeration 171 178 188 196 192 Total 2,178 2,307 2,512 2,618 2,420
- 108 -

HIGH TARGET SCENARIO (PJ) by sector and source Residential Sector 2000 2005 2010 2015 2020 Natural Gas 3,863 3,788 3,379 1,990 950 Electricity 2,733 2,909 2,933 2,726 2,262 Oil Products 2,582 2,650 2,574 2,190 1,584 Other Sources 1,475 1,447 1,335 1,187 944 Total 10,653 10,738 10,048 7,967 5,609 Commercial Sector 2000 2005 2010 2015 2020 Natural Gas 917 990 751 325 170 Electricity 2,178 2,330 2,334 2,094 1,480 Oil Products 923 904 863 807 657 Other Sources 204 210 208 207 164 Total 4,222 4,489 4,329 3,559 2,603 Total Residential&Commercial Sectors 2000 2005 2010 2015 2020 Natural Gas 4,780 4,778 4,130 2,315 1,120 Electricity 4,911 5,239 5,267 4,819 3,742 Oil Products 3,505 3,553 3,436 2,997 2,241 Other Sources 1,679 1,657 1,543 1,395 1,109 Total 14,875 15,227 14,377 11,526 8,211 by sector, source and energy service Residential Sector Natural Gas 2000 2005 2010 2015 2020 space heating 3,037 2,961 2,608 1,452 618 hot water 615 630 591 410 260 cooking 211 197 180 128 72 Total 3,863 3,788 3,379 1,990 950
- 109 -
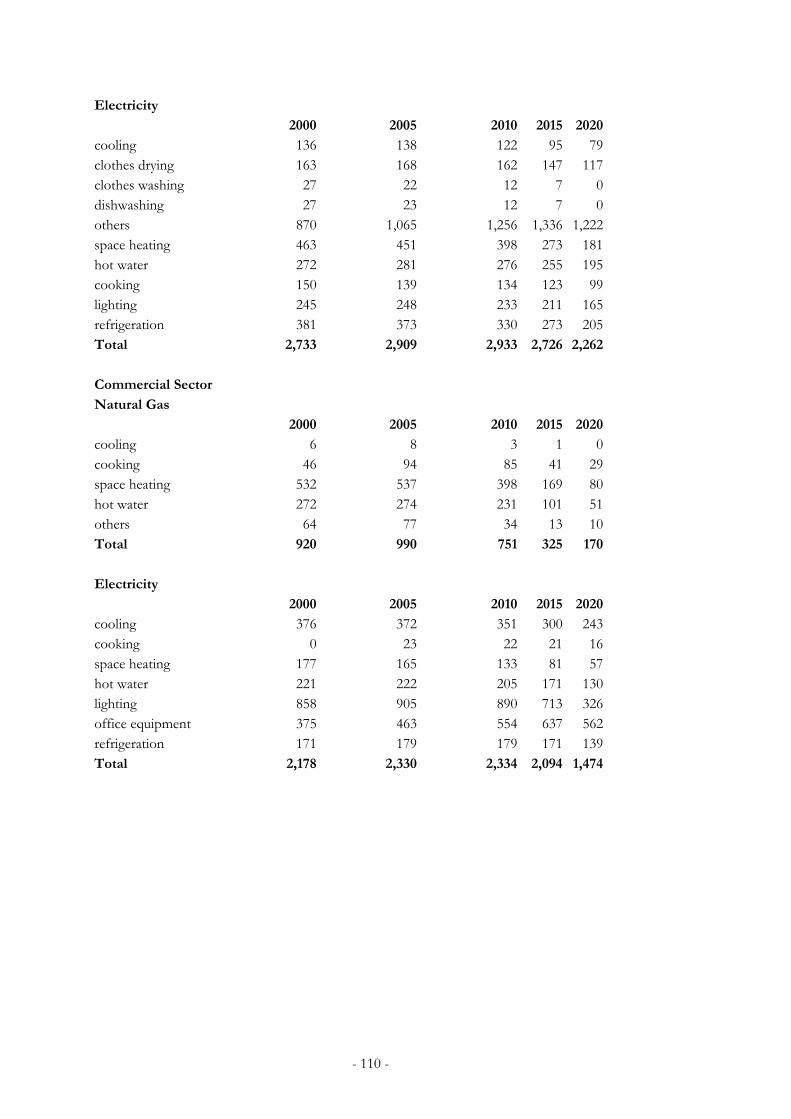
Electricity 2000 2005 2010 2015 2020 cooling 136 138 122 95 79 clothes drying 163 168 162 147 117 clothes washing 27 22 12 7 0 dishwashing 27 23 12 7 0 others 870 1,065 1,256 1,336 1,222 space heating 463 451 398 273 181 hot water 272 281 276 255 195 cooking 150 139 134 123 99 lighting 245 248 233 211 165 refrigeration 381 373 330 273 205 Total 2,733 2,909 2,933 2,726 2,262 Commercial Sector Natural Gas 2000 2005 2010 2015 2020 cooling 6 8 3 1 0 cooking 46 94 85 41 29 space heating 532 537 398 169 80 hot water 272 274 231 101 51 others 64 77 34 13 10 Total 920 990 751 325 170 Electricity 2000 2005 2010 2015 2020 cooling 376 372 351 300 243 cooking 0 23 22 21
890
16 space heating 177 165 133 81 57 hot water 221 222 205 171 130 lighting 858 905 713 326 office equipment 375 463 554 637 562 refrigeration 171 179 179 171 139 Total 2,178 2,330 2,334 2,094 1,474
- 110 -