quantitative risk assessment for - … · quantitative risk assessment for cochin bottling plant by...
TRANSCRIPT
QUANTITATIVE RISK
ASSESSMENT
For
COCHIN BOTTLING PLANT
By
Ultra-Tech Environmental Consultancy
March 2017
DOCUMENT REVISION SHEET:
Document Title Quantitative Risk Assessment Study
Document Number J-2082-S-RT-1804
Client Indian Oil Corporation Limited, Cochin
HSE Consultant Ultra- Tech
ACKNOWLEDGEMENT:
Ultra-Tech gratefully acknowledges the co-operation received from the management of IOCL,
Cochin Bottling Plant.
DISCLAIMER
The advice rendered by consultants is in the nature of guidelines based on good Engineering
practices and generally accepted safety procedures and consultants do not accept any liability for the
same. The recommendations shown in the report are advisory in nature and not binding on the parties
involved viz. Ultra-Tech, Indian Oil Corporation Limited.
Copying this report without the permission of Ultra-Tech, Indian Oil Corporation Limited is
not permitted.
ABBREVIATIONS
ALARP As Low as Reasonably Practicable
IOCL Indian Oil Corporation Limited
IRPA Individual Risk Per Annum
LOC Loss of Containment
LFL/LEL Lower Flammability Limit / Lower Explosive Limit
LSIR Location Specific Individual Risk
B1 03-03-2017 Issued for Review VP SDR JS
A1 02-03-2017 Issued for Internal Review VP SDR JS
Rev Date Comments / Nature of
Changes
Prepare
d by
Reviewed
by
Approved by
Approved by
(IOCL)

P&ID Piping and Instrument Diagram
QRA Quantitative Risk Assessment
SOP Standard Operating Procedure
SR Societal Risk
TLFG Tanker Lorry Filling Gantry
VCE Vapour Cloud Explosion
TABLE OF CONTENTS
ABBREVIATIONS 2
EXECUTIVE SUMMARY 6
1.0 INTRODUCTION 10
1.1 SCOPE OF STUDY 10
1.2 FACILITY DESCRIPTION 10
1.3 DISCLAIMER 12
1.4 ACKNOWLEDGEMENT 12
2.0 QUANTITATIVE RISK ANALYSIS – METHODOLGY 12
2.1 AN OVERVIEW 12
2.2 RISK ASSESSMENT PROCEDURE 14
3.0 RISK ASSESSMENT METHODOLOGY 15
3.1 IDENTIFICATION OF HAZARDS AND RELEASE SCENARIOS 15
3.2 FACTORS FOR IDENTIFICATION OF HAZARDS 16
3.3 SELECTION OF INITIATING EVENTS AND INCIDENTS 17
3.4 TYPES OF OUTCOME EVENTS 17
3.5 PROBABILITIES 18
3.5.1 POPULATION PROBABILITIES 18
3.5.2 FAILURE/ACCIDENT PROBABILITIES 19
3.5.3 WEATHER PROBABILITIES 19
3.5.4 IGNITION PROBABILITES 21
4.0 SCENARIO SELECTION 21
4.1 SCENARIO SELECTION OF QRA STUDY 21
5.0 CONSEQUENCCE ANALYSIS 22
5.1 CONSEQUENCE CALCULATIONS 22
5.2 SELECTION OF DAMAGE CRITERIA 24
5.3 CONSEQUENCE RESULTS 27
5.4 FREQUENCY ANALYSIS 30
6.0 RISK ESTIMATION 32
6.1 LOCATION SPECIFIC INDIVIDUAL RISK 32
6.2 INDIVIDUAL RISK 32
6.3 SOCIETAL RISK 33
7.0 RISK RESULTS 33
7.1 LOCATION SPECIFIC INDIVIDUAL RISK CONTOUR 33
7.2 INDIVIDUAL RISK PER ANNUM RESULTS 34
7.3 SOCIETAL RISK RESULTS- FN CURVE 34
8.0 RISK ACCEPTANCE CRITERIA 35
8.1 ALARP 35
9.0 RECOMMENDATIONS 36
10.0 REFERENCE 39
ANNEXURE – 1 40
CONSEQUENCE CONTOURS 40
LIST OF TABLES
TABLE 1 DETAILS OF STORAGE AT COCHIN BP 12
TABLE 2 : POPULATION DETAILS 19
TABLE 3: WIND DIRECTION PROBABILITIES 19
TABLE 4: PASQUIIL’S STABILITY CLASS 20
TABLE 5: SCENARIO LIST 21
TABLE 6: EFFECTS DUE TO INCIDENT RADIATION INTENSITY 24
TABLE 7: DAMAGE DUE TO OVERPRESSURE 26
TABLE 8: CONSEQUENCE RESULTS (EFFECT DISTANCE IN METERS) 27
TABLE 9 INDIVIDUAL RISK PER ANNUM AT DIFFERENT LOCATIONS 34
TABLE 10: RISK CRITERIA 35
LIST OF FIGURES
FIGURE 1 METHODOLOGY 14
FIGURE 2 LSIR CONTOUR 34
FIGURE 3 FN CURVE 35
FIGURE 4 RISK ACCEPTANCE CRETERIA 36
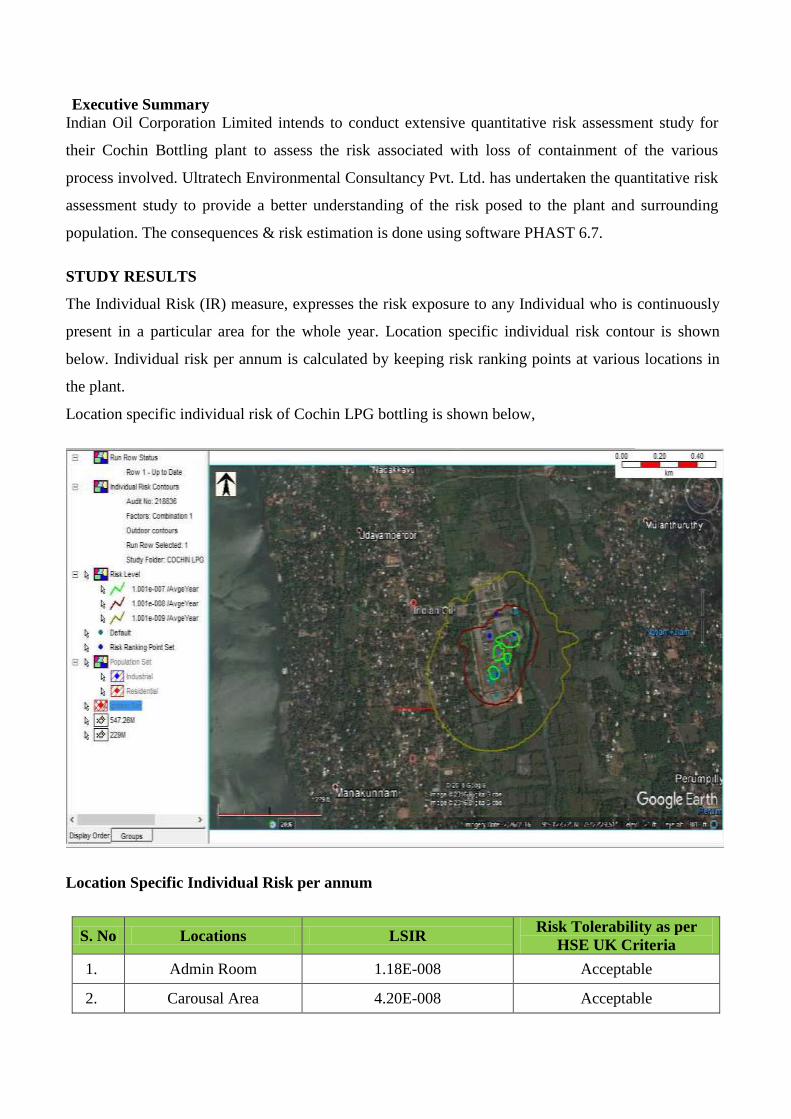
Executive Summary
Indian Oil Corporation Limited intends to conduct extensive quantitative risk assessment study for
their Cochin Bottling plant to assess the risk associated with loss of containment of the various
process involved. Ultratech Environmental Consultancy Pvt. Ltd. has undertaken the quantitative risk
assessment study to provide a better understanding of the risk posed to the plant and surrounding
population. The consequences & risk estimation is done using software PHAST 6.7.
STUDY RESULTS
The Individual Risk (IR) measure, expresses the risk exposure to any Individual who is continuously
present in a particular area for the whole year. Location specific individual risk contour is shown
below. Individual risk per annum is calculated by keeping risk ranking points at various locations in
the plant.
Location specific individual risk of Cochin LPG bottling is shown below,
Location Specific Individual Risk per annum
S. No Locations LSIR Risk Tolerability as per
HSE UK Criteria
1. Admin Room 1.18E-008 Acceptable
2. Carousal Area 4.20E-008 Acceptable
3. Tank Area 8.50E-008 Acceptable
4. TLD Area 1.29E-007 Acceptable
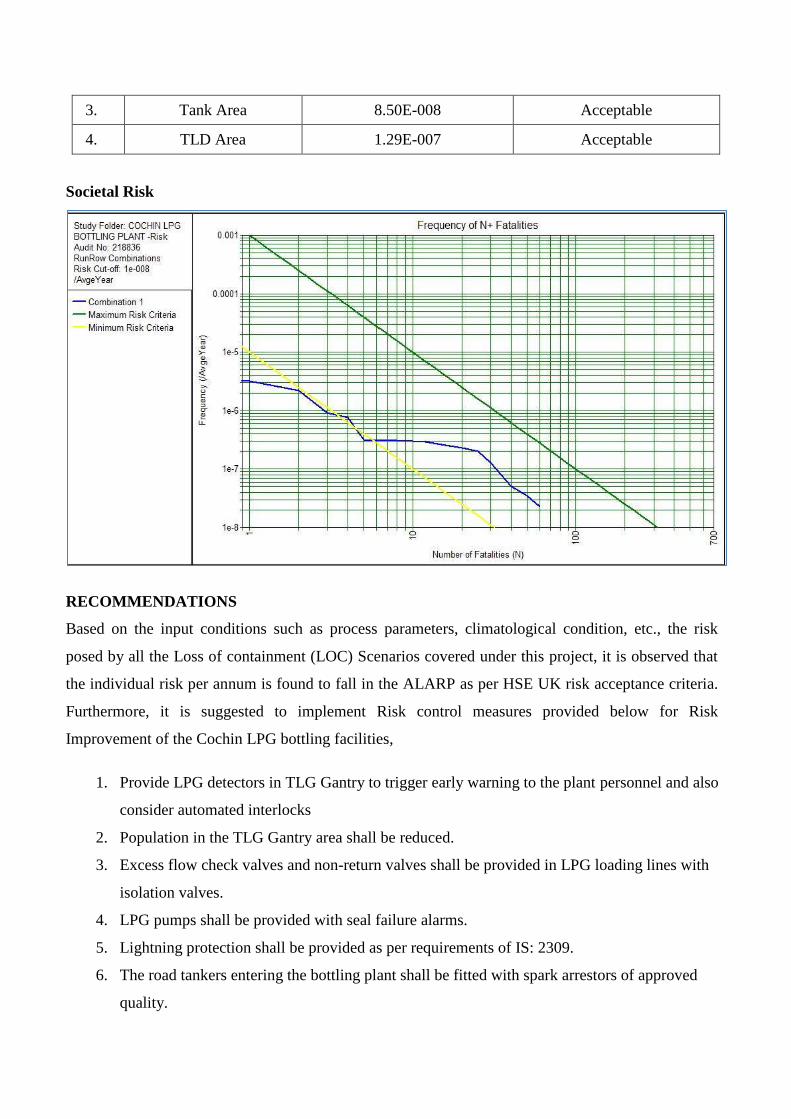
Societal Risk
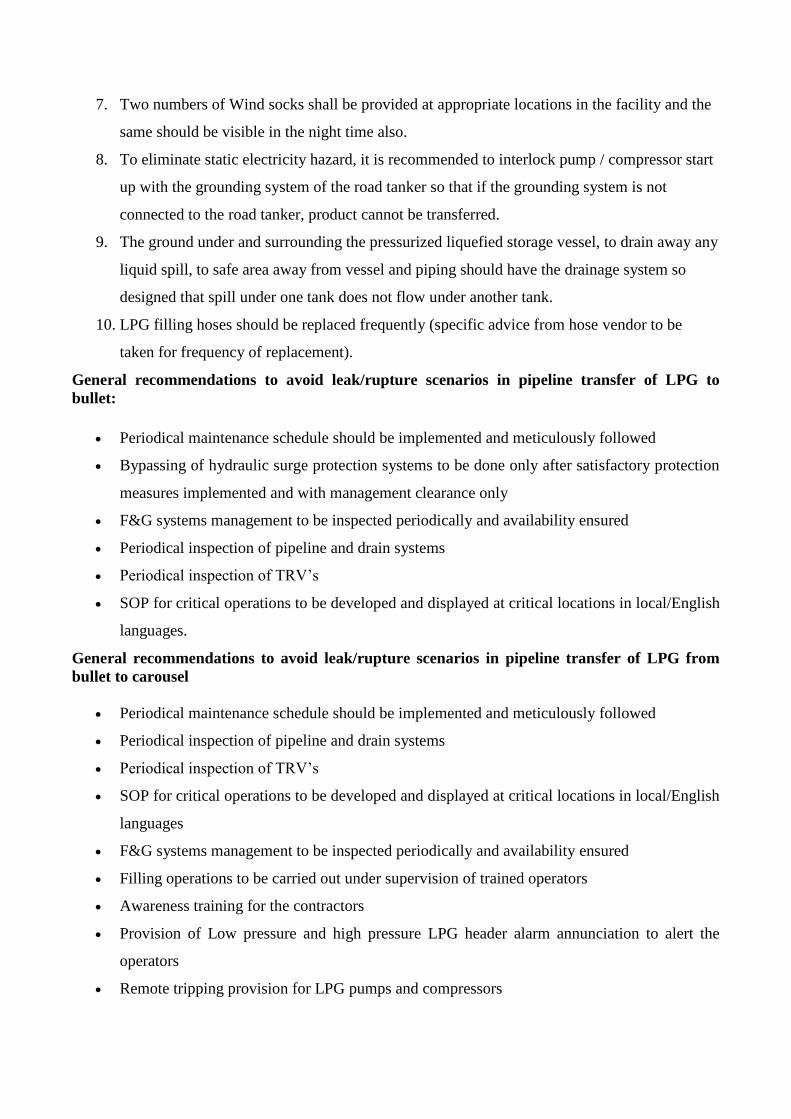
RECOMMENDATIONS
Based on the input conditions such as process parameters, climatological condition, etc., the risk
posed by all the Loss of containment (LOC) Scenarios covered under this project, it is observed that
the individual risk per annum is found to fall in the ALARP as per HSE UK risk acceptance criteria.
Furthermore, it is suggested to implement Risk control measures provided below for Risk
Improvement of the Cochin LPG bottling facilities,
1. Provide LPG detectors in TLG Gantry to trigger early warning to the plant personnel and also
consider automated interlocks
2. Population in the TLG Gantry area shall be reduced.
3. Excess flow check valves and non-return valves shall be provided in LPG loading lines with
isolation valves.
4. LPG pumps shall be provided with seal failure alarms.
5. Lightning protection shall be provided as per requirements of IS: 2309.
6. The road tankers entering the bottling plant shall be fitted with spark arrestors of approved
quality.
7. Two numbers of Wind socks shall be provided at appropriate locations in the facility and the
same should be visible in the night time also.
8. To eliminate static electricity hazard, it is recommended to interlock pump / compressor start
up with the grounding system of the road tanker so that if the grounding system is not
connected to the road tanker, product cannot be transferred.
9. The ground under and surrounding the pressurized liquefied storage vessel, to drain away any
liquid spill, to safe area away from vessel and piping should have the drainage system so
designed that spill under one tank does not flow under another tank.
10. LPG filling hoses should be replaced frequently (specific advice from hose vendor to be
taken for frequency of replacement).
General recommendations to avoid leak/rupture scenarios in pipeline transfer of LPG to
bullet:
Periodical maintenance schedule should be implemented and meticulously followed
Bypassing of hydraulic surge protection systems to be done only after satisfactory protection
measures implemented and with management clearance only
F&G systems management to be inspected periodically and availability ensured
Periodical inspection of pipeline and drain systems
Periodical inspection of TRV’s
SOP for critical operations to be developed and displayed at critical locations in local/English
languages.
General recommendations to avoid leak/rupture scenarios in pipeline transfer of LPG from
bullet to carousel
Periodical maintenance schedule should be implemented and meticulously followed
Periodical inspection of pipeline and drain systems
Periodical inspection of TRV’s
SOP for critical operations to be developed and displayed at critical locations in local/English
languages
F&G systems management to be inspected periodically and availability ensured
Filling operations to be carried out under supervision of trained operators
Awareness training for the contractors
Provision of Low pressure and high pressure LPG header alarm annunciation to alert the
operators
Remote tripping provision for LPG pumps and compressors

Other general recommendations
Periodical mock drills
Periodical inspection of fire protection systems
Periodical inspection of lightning protection and earthing arrangements
Periodical inspection of all Electrical equipment (ensuring the adherence to the area
classification)
1.0 INTRODUCTION
M/s. Indian Oil Corporation Limited intends to conduct extensive quantitative risk assessment study
for their Cochin LPG bottling plant to assess the risk associated with loss of containment of the
various process involved. Ultratech Environmental Consultancy Pvt. Ltd has undertaken the
quantitative risk assessment study to provide a better understanding of the risk posed to the plant and
surrounding population. The consequences & risk estimation is done using software PHAST 6.7.
1.1 SCOPE OF STUDY
The scope of the QRA is given below:
Identification of Hazards and Major Loss of Containment (LOC) events.
Calculation of physical effects of accidental scenarios, which includes frequency analysis
for incident scenarios leading to hazards to people and facilities (flammable gas, fire, and
smoke and explosion overpressure hazards) and consequence analysis for the identified
hazards covering impact on people and potential escalation.
Damage limits identification and quantification of the risks and contour mapping on the
plant layout.
Risk contour mapping.
Evaluation of risks against risk acceptable limit
Risk reduction measures to prevent incident to control the accident
Hazard mitigation recommendations based on QRA
Provide consolidated conclusion on QRA of location
1.2 FACILITY DESCRIPTION
1.2.1 Geographic Location
Indian Oil Corporation Ltd. is India’s largest company by sales with a turnover of Rs. 3,28,744 crore
($ 68,837 million) and profit of Rs. 7445.48 crore ($ 1,719 million) for the year 2010-11.
The Liquefied Petroleum Gas (LPG) bottling facility is located at Manakkunnam village, Ernakulam
–Kottayam state highway. The plant is principally engaged in bottling of LPG. This plant is located
at 18 kms away from Eranakulam Railway station.
1.2.2 Description of the Facility
The Liquefied Petroleum Gas (LPG) is received in bulk through road by trucks. LPG from bullet
truck is transferred to storage vessels. LPG is then filled in to tankers and cylinders by operating
LPG Pump.
The flow diagram of LPG Bottling process is given at the end of this section. LPG brought from
above mentioned sources are stored into all the LPG Storage Vessels.
LPG from bullets is transferred through a pipeline to filling manifolds of carousel and TLD with the
help of centrifugal pumps.
The empty LPG cylinders brought into premises by Lorries are received and stored in the empty
shed. They are fed to carousels / filling gun after due inspection through conveyor system in the
filling shed. The filling is cut off as soon as the weight of LPG in the cylinder reaches 14.2/19/5
/47.5kg. After filling, these cylinders are counter checked for correct weight, tested for leaks from
valves and body, capped and sealed before sending them to the filled cylinder shed. Any defective
cylinder is emptied at evacuation unit and sent for cold repair in the “Cold Repair” shed.
Various Activities at Plant
Receipt of LPG from bulk trucks
Storage of LPG in bullets.
Receiving of empty LPG cylinders
Filling of LPG into cylinders
Dispatch of filled cylinders
Installations Details
In order to carry out above-mentioned operation the following facilities have been provided.
a) Tank Lorry Decantation Shed
An 8x2 Nos bay Tank Lorry Decantation (TLD-1 &TLD-2) has been provided to transfer LPG from
LPG bullet to Storage Vessels.
b) LPG Bullets Storage
Five Nos. of 150 MT Bullets and Five Nos. of 100 MT bullets available for storage of LPG. The
Storage vessels have been provided with all necessary fittings, for filling, emptying, vapour
pressurization, draining facilities and measuring devices like pressure gauges temperature gauges,
level indicators, High level alarm, safety relief valves etc.
c) LPG Pumps and Compressor House
1 Nos. of centrifugal pumps and 2 Nos. Of Vertical can type pump have been installed to pump
liquid LPG from storage vessels to carousel. These pumps have been provided with pop-action
valves on discharge lines and are coupled to flame proof motors.
Five Nos. of LPG vapour compressors each coupled to a flame-proof motor have been installed for
loading/unloading of LPG based differential pressure mechanism. The maximum discharge pressure
of these compressors is 11.5 kg/cm2 (gauge).
d) Cylinder storage shed & Filling Shed
Two 24 points carousels electronic filling machines and cylinder conveyor has been installed in
Three nos. of filling sheds. Besides the above this shed also have electronic check scales for weight
checking filled cylinders, weight correction unit machines, Automatic valve testing machines, Hot
air sealing machine for sealing of cylinders prior to despatch and SQC machine for quality checks of
cylinders facilities are there in the filling sheds.
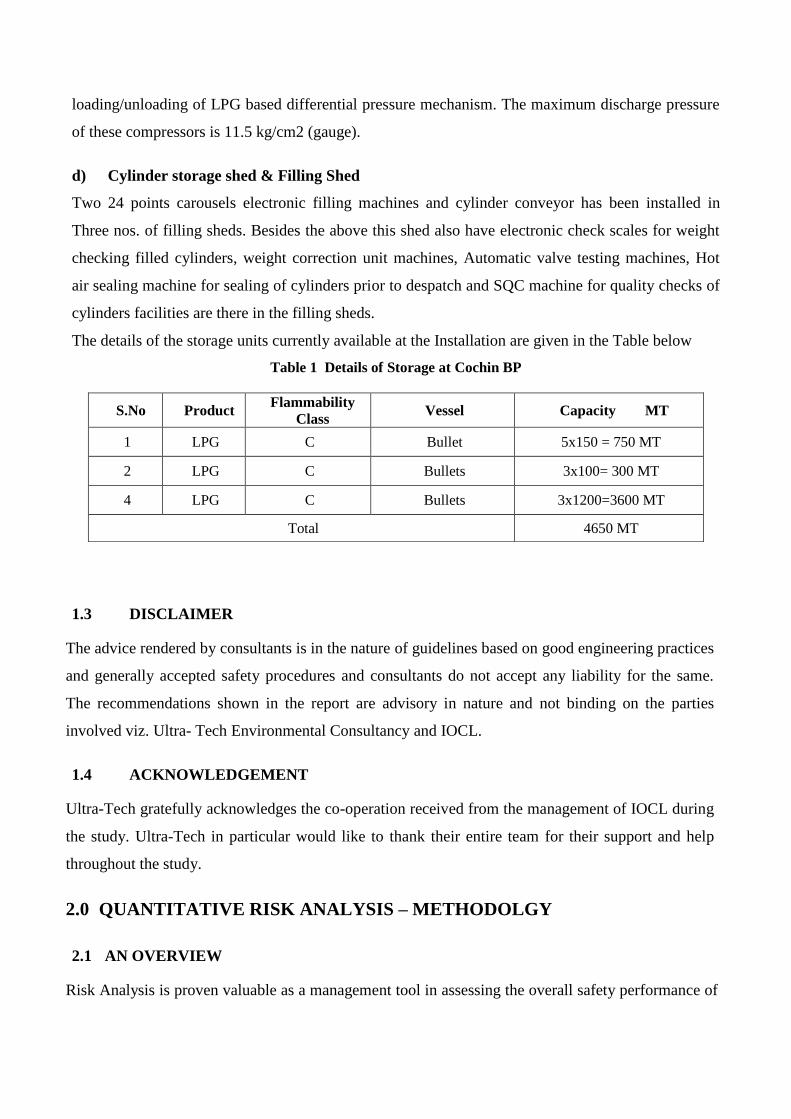
The details of the storage units currently available at the Installation are given in the Table below
Table 1 Details of Storage at Cochin BP
1.3 DISCLAIMER
The advice rendered by consultants is in the nature of guidelines based on good engineering practices
and generally accepted safety procedures and consultants do not accept any liability for the same.
The recommendations shown in the report are advisory in nature and not binding on the parties
involved viz. Ultra- Tech Environmental Consultancy and IOCL.
1.4 ACKNOWLEDGEMENT
Ultra-Tech gratefully acknowledges the co-operation received from the management of IOCL during
the study. Ultra-Tech in particular would like to thank their entire team for their support and help
throughout the study.
2.0 QUANTITATIVE RISK ANALYSIS – METHODOLGY
2.1 AN OVERVIEW
Risk Analysis is proven valuable as a management tool in assessing the overall safety performance of
S.No Product Flammability
Class Vessel Capacity MT
1 LPG C Bullet 5x150 = 750 MT
2 LPG C Bullets 3x100= 300 MT
4 LPG C Bullets 3x1200=3600 MT
Total 4650 MT
the Chemical Process Industry. Although management systems such as engineering codes, checklists,
and reviews by experienced engineers have provided substantial safety assurances, major incidents
involving numerous casualties, injuries and significant damage can occur - as illustrated by recent
world-scale catastrophes. Risk Analysis techniques provide advanced quantitative means to
supplement other hazard identification, analysis, assessment, control and management methods to
identify the potential for such incidents and to evaluate control strategies.
The underlying basis of Risk Analysis is simple in concept. It offers methods to answer the following
four questions:
1. What can go wrong?
2. What are the causes?
3. What are the consequences?
4. How likely is it?
This study tries to quantify the risks to rank them accordingly based on their severity and probability.
The report should be used to understand the significance of existing control measures and to follow
the measures continuously. Wherever possible the additional risk control measures should be adopted
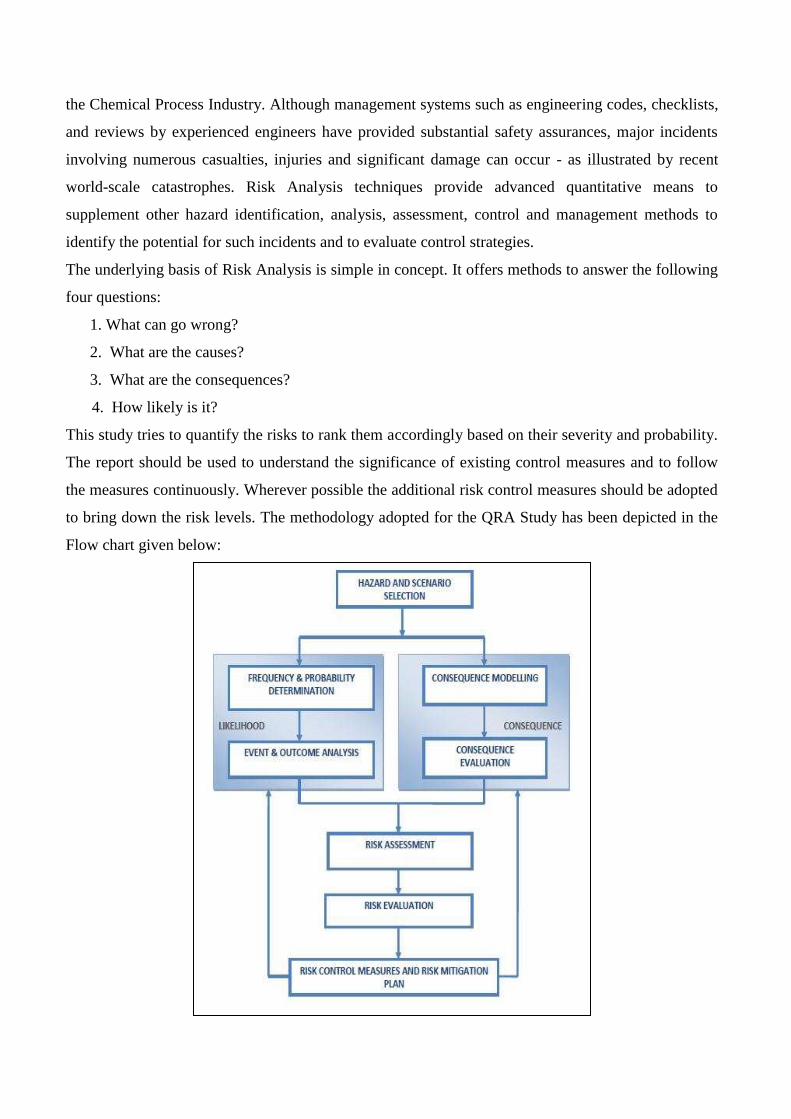
to bring down the risk levels. The methodology adopted for the QRA Study has been depicted in the
Flow chart given below:
Figure 1 Methodology
2.2 RISK ASSESSMENT PROCEDURE
Hazard identification and risk assessment involves a series of steps as follows:
Step 1: Identification of the Hazard
Based on consideration of factors such as the physical & chemical properties of the fluids being
handled, the arrangement of equipment, operating & maintenance procedures and process conditions,
external hazards such as third party interference, extreme environmental conditions, aircraft /
helicopter crash should also be considered.
Step 2: Assessment of the Risk
Arising from the hazards and consideration of its tolerability to personnel, the facility and the
environment, this involves the identification of initiating events, possible accident sequences, and
likelihood of occurrence and assessment of the consequences. The acceptability of the estimated risk
must then be judged based upon criteria appropriate to the particular situation.
Step 3: Elimination or Reduction of the Risk
Where this is deemed to be necessary, this involves identifying opportunities to reduce the likelihood
and/or consequence of an accident.
Hazard Identification is a critical step in Risk Analysis. Many aids are available, including
experience, engineering codes, checklists, detailed process knowledge, equipment failure experience,
hazard index techniques, What-if Analysis. In this phase all potential incidents are identified and
tabulated. Site visit and study of operations and documents like drawings, process write-up etc. are
used for hazard identification.
Assessment of Risks
The assessment of risks is based on the consequences and likelihood. Consequence Estimation is the
methodology used to determine the potential for damage or injury from specific incidents. A single
incident (e.g. rupture of a pressurized flammable liquid tank) can have many distinct incident
outcomes (e.g. Unconfined Vapour Cloud Explosion (UVCE), flash fire.
Likelihood assessment is the methodology used to estimate the frequency or probability of
occurrence of an incident. Estimates may be obtained from historical incident data on failure
frequencies or from failure sequence models, such as fault trees and event trees. In this study the
historical data developed by software models and those collected by CPR18E – Committee for
Prevention of Disasters, Netherlands (Edition: PGS 3, 2005) are used.
Risk Assessment combines the consequences and likelihood of all incident outcomes from all
selected incidents to provide a measure of risk. The risks of all selected incidents are individually
estimated and summed to give an overall measure of risk.
Risk-reduction measures include those to prevent incidents (i.e. reduce the likelihood of
occurrence) to control incidents (i.e. limit the extent & duration of a hazardous event) and to mitigate
the effects (i.e. reduce the consequences). Preventive measures, such as using inherently safer designs
and ensuring asset integrity, should be used wherever practicable. In many cases, the measures to
control and mitigate hazards and risks are simple and obvious and involve modifications to conform
to standard practice. The general hierarchy of risk reducing measures is:
Prevention (by distance or design)
Detection (e.g. fire & gas, Leak detection)
Control (e.g. emergency shutdown & controlled depressurization)
Mitigation (e.g. firefighting and passive fire protection)
Emergency response (in case safety barriers fail)
3.0 RISK ASSESSMENT METHODOLOGY
3.1 IDENTIFICATION OF HAZARDS AND RELEASE SCENARIOS
A technique commonly used to generate an incident list is to consider potential leaks and major
releases from fractures of all process pipelines and vessels. This compilation includes all pipe work
and vessels in direct communication, as these may share a significant inventory that cannot be
isolated in an emergency. The following data were collected to envisage scenarios:
Composition of materials stored in vessels / flowing through pipeline
Inventory of materials stored in vessels
Flow rate of materials passing through pipelines
Vessels / Pipeline conditions (phase, temperature, pressure)
Connecting piping and piping dimensions.
Accidental release of flammable liquids / gases can result in severe consequences. Delayed ignition of
flammable gases can result in blast overpressures covering large areas. This may lead to extensive
loss of life and property. In contrast, fires have localized consequences. Fires can be put out or
contained in most cases; there are few mitigating actions one can take once a flammable gas or a
vapour cloud gets released. Major accident hazards arise, therefore, consequent upon the release of
flammable gases.
3.2 FACTORS FOR IDENTIFICATION OF HAZARDS
In any installation, main hazard arises due to loss of containment during handling of flammable
liquids/gases. To formulate a structured approach to identification of hazards, an understanding of
contributory factors is essential.
Blast over Pressures
Blast Overpressures depend upon the reactivity class of material and the amount of gas between two
explosive limits. For example, LPG once released and not ignited immediately is expected to give rise
to a gas cloud. These gases in general have medium reactivity and in case of confinement of the gas
cloud, on delayed ignition may result in an explosion and overpressures.
Operating Parameters
Potential gas release for the same material depends significantly on the operating conditions. The
gases are likely to operate at atmospheric temperature (and hence high pressures). This operating
range is enough to release a large amount of gas in case of a leak / rupture, therefore the pipeline
leaks and ruptures need to be considered in the risk analysis calculations.
Inventory
Inventory Analysis is commonly used in understanding the relative hazards and short listing of
release scenarios. Inventory plays an important role in regard to the potential hazard. Larger the
inventory of a vessel or a system, larger is the quantity of potential release. A practice commonly
used to generate an incident list is to consider potential leaks and major releases from fractures of
pipelines and vessels/tanks containing sizable inventories.
Range of Incidents
Both the complexity of study and the number of incident outcome cases are affected by the range of
initiating events and incidents covered. This not only reflects the inclusion of accidents and / or non-
accident-initiated events, but also the size of those events. For instance, studies may evaluate one or
more of the following:
catastrophic failure of container
large hole (large continuous release)
smaller holes (continuous release)
In general, quantitative studies do not include very small continuous releases or short duration small
releases if past experience or preliminary consequence modeling shows that such releases do not
contribute to the overall risk levels.
3.3 SELECTION OF INITIATING EVENTS AND INCIDENTS
The selection of initiating events and incidents should take into account the goals or objectives of the
study and the data requirements. The data requirements increase significantly when non -accident -
initiated events are included and when the number of release size increase. While the potential range
of release sizes is tremendous, groupings are both appropriate and necessitated by data restrictions.
The main reasons for including release sizes other than the catastrophic are to reduce the
conservatism in an analysis and to better understand the relative contributions to risk of small versus
large releases.
As per CPR 18 E guidelines & Reference Manual BEVI Risk Assessments Version 3.2 only the Loss
of Containment (LOC) which is basically the release scenarios contributing to the individual and/ or
societal risk are included in the QRA. LOCs of the installation are included only if the following
conditions are fulfilled:
Frequency of occurrence is equal to or greater than 10-8 and
Lethal damage (1% probability) occurs outside the establishment’s boundary or the transport
route.
There may be number of accidents that may occur quite frequently, but due to proper control
measures or fewer quantities of chemicals released, they are controlled effectively. A few examples
are a leak from a gasket, pump or valve, release of a chemical from a vent or relief valve, and fire in a
pump due to overheating. These accidents generally are controlled before they escalate by using
control systems and monitoring devices – used because such piping and equipment are known to
sometimes fail or malfunction, leading to problems.
On the other hand, there are less problematic areas / units that are generally ignore or not given due
attention. Such LOCs are identified by studying the facilities and Event Tree Analysis etc. and
accidents with less consequence are ignored. Some of the critical worst case scenarios identified by
the Hazard Identification study are also assessed as per the guidelines of Environment Protection
Agency.
3.4 TYPES OF OUTCOME EVENTS
In this section of the report we describe the probabilities associated with the sequence of occurrences
which must take place for the incident scenarios to produce hazardous effects and the modeling of
their effects.
Considering the present case, the outcomes expected are
Jet fires
Vapour Cloud Explosion (VCE) and Flash Fire (FF)
BLEVE
Jet fires
Jet fire occurs when a pressurized release (of a flammable fluid) is ignited by any source. They tend
to be localized in effect and are mainly of concern in establishing the potential for domino effects and
employee safety zones rather than for community risks.
The jet fire model is based on the radiant fraction of total combustion energy, which is assumed to
arise from a point slowly along the jet flame path. The jet dispersion model gives the jet flame length.
Vapour Cloud Explosion (VCE)
Vapour cloud explosion is the result of flammable materials in the atmosphere, a subsequent
dispersion phase, and after some delay an ignition of the vapour cloud. Turbulence is the governing
factor in blast generation, which could intensify combustion to the level that will result in an
explosion. Obstacles in the path of vapour cloud or when the cloud finds a confined area, as under the
bullets, often create turbulence. Insignificant level of confinement will result in a flash fire. The VCE
will result in overpressures.
It may be noted that VCEs have been responsible for very serious accidents involving severe property
damage and loss of lives. Vapour Cloud Explosions in the open area with respect to Pure Methane is
virtually impossible due to their lower density.
3.5 PROBABILITIES
3.5.1 Population Probabilities
It is necessary to know the population exposure in order to estimate the consequences and the risk
resulting from an incident. The exposed population is often defined using a population density.
Population densities are an important part of a QRA for several reasons. The most notable is that the
density is typically used to determine the number of people affected by a given incident with a
specific hazard area. Sometimes, population data are available in sketchy forms. In the absence of
specific population data default categories can be used.
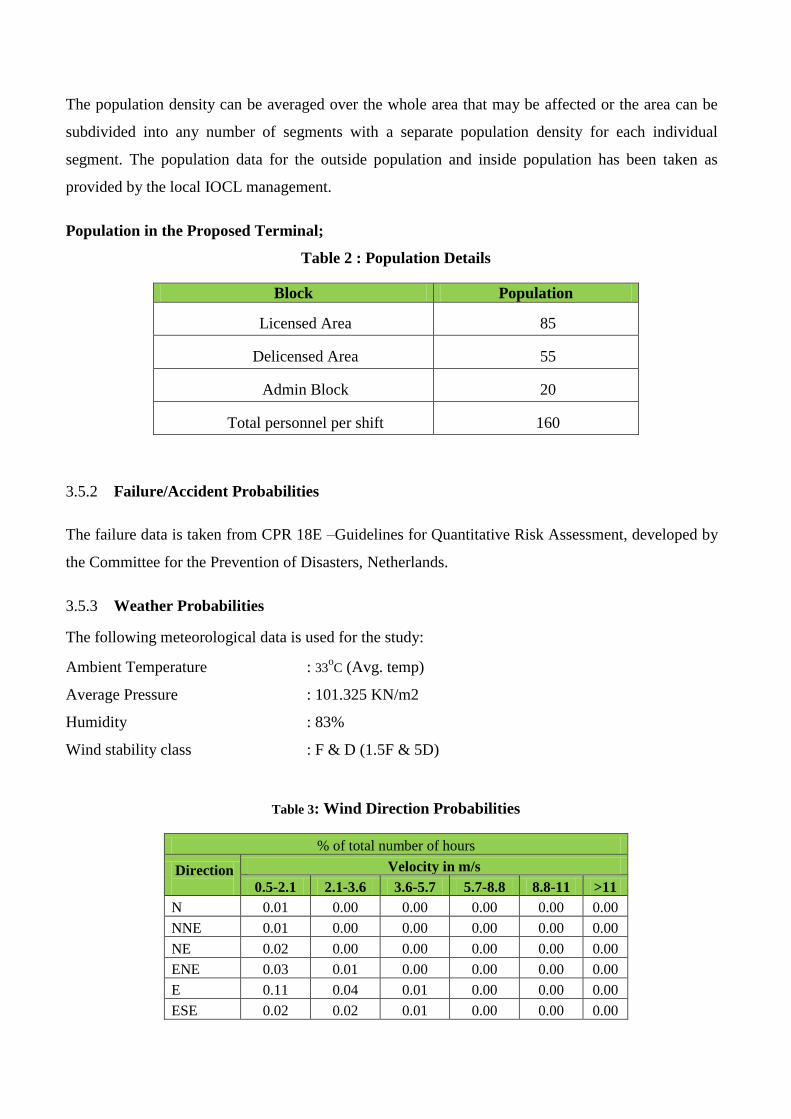
The population density can be averaged over the whole area that may be affected or the area can be
subdivided into any number of segments with a separate population density for each individual
segment. The population data for the outside population and inside population has been taken as
provided by the local IOCL management.
Population in the Proposed Terminal;
Table 2 : Population Details
Block Population
Licensed Area 85
Delicensed Area 55
Admin Block 20
Total personnel per shift 160
3.5.2 Failure/Accident Probabilities
The failure data is taken from CPR 18E –Guidelines for Quantitative Risk Assessment, developed by
the Committee for the Prevention of Disasters, Netherlands.
3.5.3 Weather Probabilities
The following meteorological data is used for the study:
Ambient Temperature : 33oC (Avg. temp)
Average Pressure : 101.325 KN/m2
Humidity : 83%
Wind stability class : F & D (1.5F & 5D)
Table 3: Wind Direction Probabilities
% of total number of hours
Direction
Velocity in m/s
0.5-2.1 2.1-3.6 3.6-5.7 5.7-8.8 8.8-11 >11
N 0.01 0.00 0.00 0.00 0.00 0.00
NNE 0.01 0.00 0.00 0.00 0.00 0.00
NE 0.02 0.00 0.00 0.00 0.00 0.00
ENE 0.03 0.01 0.00 0.00 0.00 0.00
E 0.11 0.04 0.01 0.00 0.00 0.00
ESE 0.02 0.02 0.01 0.00 0.00 0.00
SE 0.01 0.01 0.00 0.00 0.00 0.00
SSE 0.01 0.00 0.00 0.00 0.00 0.00
S 0.01 0.00 0.00 0.00 0.00 0.00
SSW 0.01 0.00 0.00 0.00 0.00 0.00
SW 0.01 0.00 0.00 0.00 0.00 0.00
WSW 0.01 0.01 0.01 0.00 0.00 0.00
W 0.01 0.03 0.05 0.01 0.00 0.00
WNW 0.01 0.02 0.03 0.02 0.00 0.00
NW 0.01 0.02 0.02 0.01 0.00 0.00
NNW 0.01 0.01 0.00 0.00 0.00 0.00
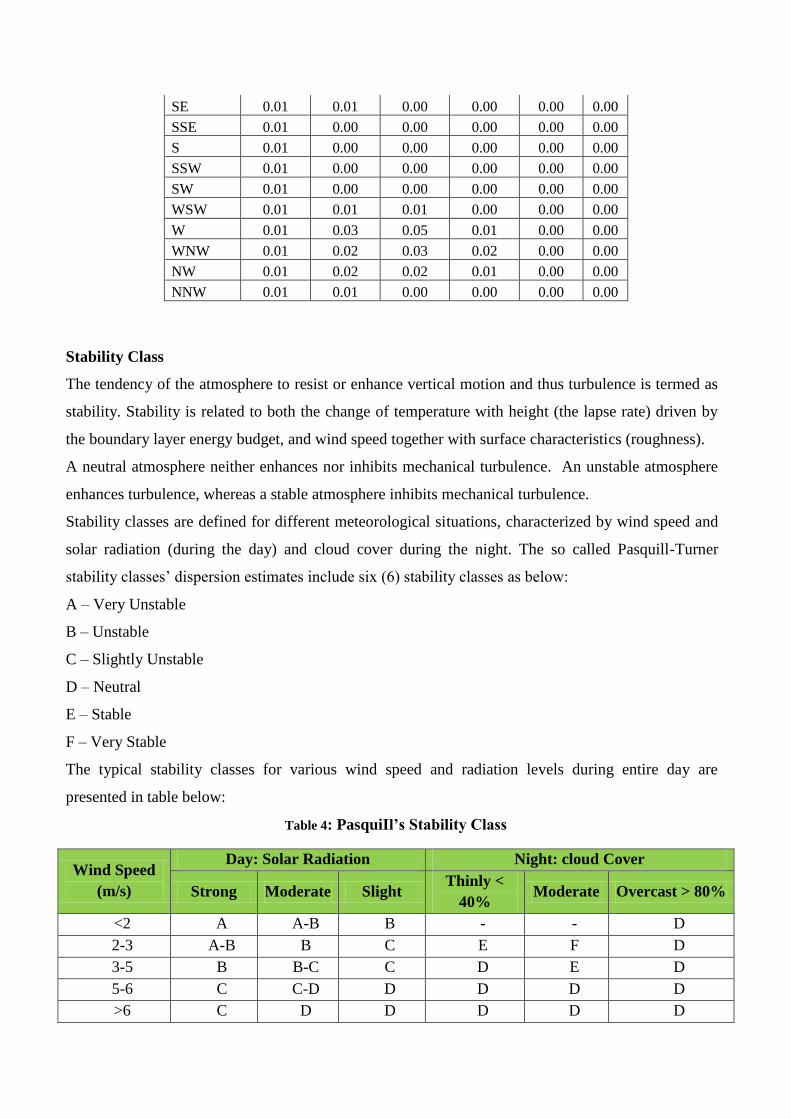
Stability Class
The tendency of the atmosphere to resist or enhance vertical motion and thus turbulence is termed as
stability. Stability is related to both the change of temperature with height (the lapse rate) driven by
the boundary layer energy budget, and wind speed together with surface characteristics (roughness).
A neutral atmosphere neither enhances nor inhibits mechanical turbulence. An unstable atmosphere
enhances turbulence, whereas a stable atmosphere inhibits mechanical turbulence.
Stability classes are defined for different meteorological situations, characterized by wind speed and
solar radiation (during the day) and cloud cover during the night. The so called Pasquill-Turner
stability classes’ dispersion estimates include six (6) stability classes as below:
A – Very Unstable
B – Unstable
C – Slightly Unstable
D – Neutral
E – Stable
F – Very Stable
The typical stability classes for various wind speed and radiation levels during entire day are
presented in table below:
Table 4: PasquiIl’s Stability Class
Wind Speed
(m/s)
Day: Solar Radiation Night: cloud Cover
Strong Moderate Slight Thinly <
40% Moderate Overcast > 80%
<2 A A-B B - - D
2-3 A-B B C E F D
3-5 B B-C C D E D
5-6 C C-D D D D D
>6 C D D D D D
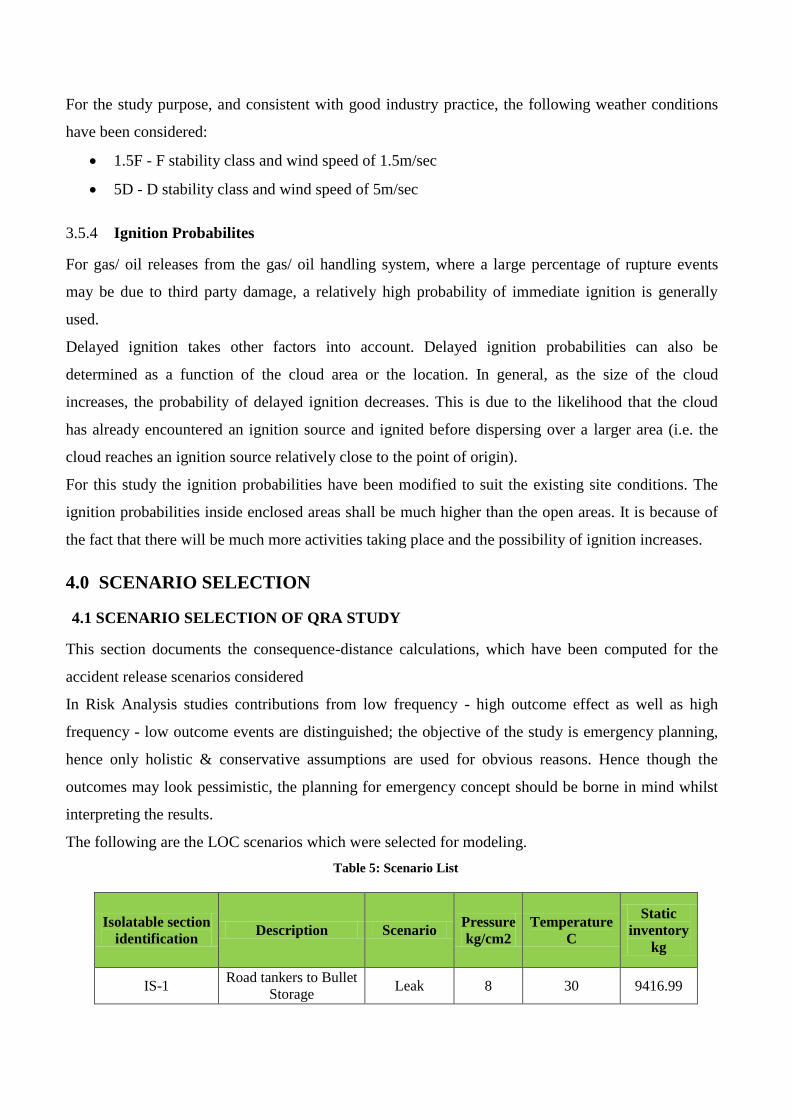
For the study purpose, and consistent with good industry practice, the following weather conditions
have been considered:
1.5F - F stability class and wind speed of 1.5m/sec
5D - D stability class and wind speed of 5m/sec
3.5.4 Ignition Probabilites
For gas/ oil releases from the gas/ oil handling system, where a large percentage of rupture events
may be due to third party damage, a relatively high probability of immediate ignition is generally
used.
Delayed ignition takes other factors into account. Delayed ignition probabilities can also be
determined as a function of the cloud area or the location. In general, as the size of the cloud
increases, the probability of delayed ignition decreases. This is due to the likelihood that the cloud
has already encountered an ignition source and ignited before dispersing over a larger area (i.e. the
cloud reaches an ignition source relatively close to the point of origin).
For this study the ignition probabilities have been modified to suit the existing site conditions. The
ignition probabilities inside enclosed areas shall be much higher than the open areas. It is because of
the fact that there will be much more activities taking place and the possibility of ignition increases.
4.0 SCENARIO SELECTION
4.1 SCENARIO SELECTION OF QRA STUDY
This section documents the consequence-distance calculations, which have been computed for the
accident release scenarios considered
In Risk Analysis studies contributions from low frequency - high outcome effect as well as high
frequency - low outcome events are distinguished; the objective of the study is emergency planning,
hence only holistic & conservative assumptions are used for obvious reasons. Hence though the
outcomes may look pessimistic, the planning for emergency concept should be borne in mind whilst
interpreting the results.
The following are the LOC scenarios which were selected for modeling.
Table 5: Scenario List
Isolatable section
identification Description Scenario
Pressure
kg/cm2
Temperature
C
Static
inventory
kg
IS-1 Road tankers to Bullet
Storage Leak 8 30 9416.99
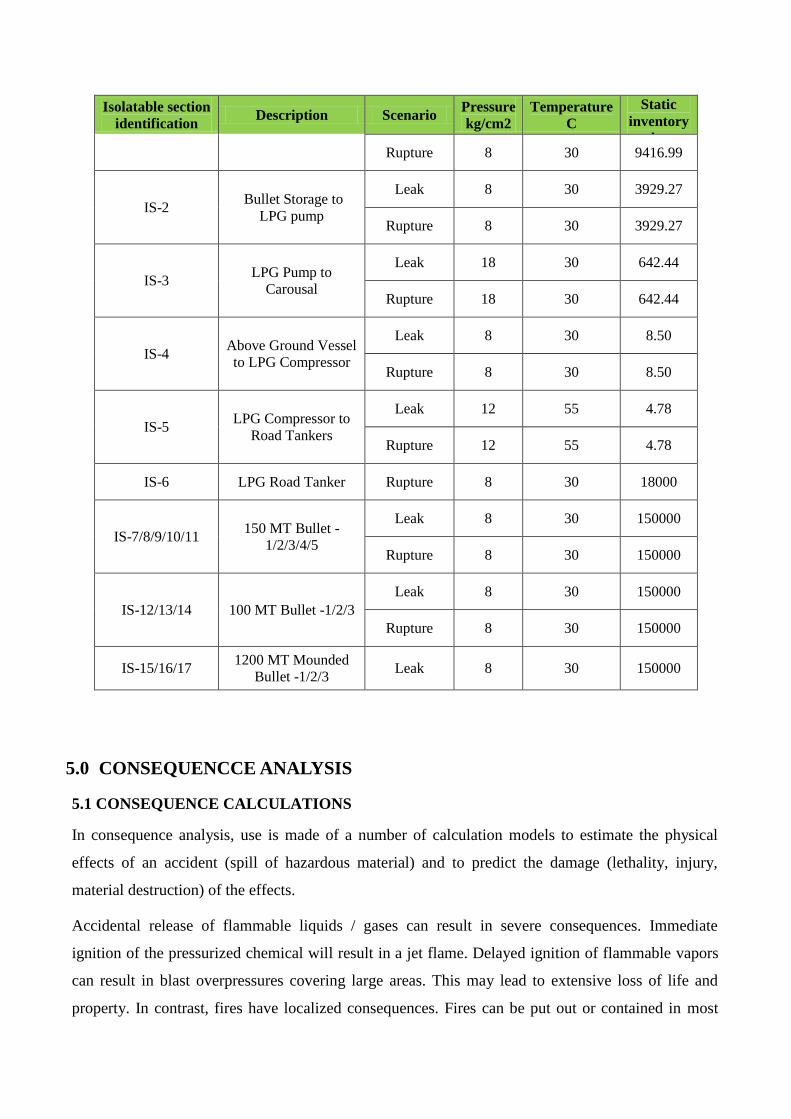
Isolatable section
identification Description Scenario
Pressure
kg/cm2
Temperature
C
Static
inventory
kg Rupture 8 30 9416.99
IS-2 Bullet Storage to
LPG pump
Leak 8 30 3929.27
Rupture 8 30 3929.27
IS-3 LPG Pump to
Carousal
Leak 18 30 642.44
Rupture 18 30 642.44
IS-4 Above Ground Vessel
to LPG Compressor
Leak 8 30 8.50
Rupture 8 30 8.50
IS-5 LPG Compressor to
Road Tankers
Leak 12 55 4.78
Rupture 12 55 4.78
IS-6 LPG Road Tanker Rupture 8 30 18000
IS-7/8/9/10/11 150 MT Bullet -
1/2/3/4/5
Leak 8 30 150000
Rupture 8 30 150000
IS-12/13/14 100 MT Bullet -1/2/3
Leak 8 30 150000
Rupture 8 30 150000
IS-15/16/17 1200 MT Mounded
Bullet -1/2/3 Leak 8 30 150000
5.0 CONSEQUENCCE ANALYSIS
5.1 CONSEQUENCE CALCULATIONS
In consequence analysis, use is made of a number of calculation models to estimate the physical
effects of an accident (spill of hazardous material) and to predict the damage (lethality, injury,
material destruction) of the effects.
Accidental release of flammable liquids / gases can result in severe consequences. Immediate
ignition of the pressurized chemical will result in a jet flame. Delayed ignition of flammable vapors
can result in blast overpressures covering large areas. This may lead to extensive loss of life and
property. In contrast, fires have localized consequences. Fires can be put out or contained in most
cases; there are few mitigating actions one can take once a vapour cloud gets released.
The calculations can roughly be divided in three major groups:
a) Determination of the source strength parameters;
b) Determination of the consequential effects;
c) Determination of the damage or damage distances.
The basic physical effect models consist of the following.
Source strength parameters
Calculation of the outflow of liquid out of a vessel / Tank or a pipe, in case of rupture. Also
Two-phase outflow can be calculated.
Calculation, in case of liquid outflow, of the instantaneous flash evaporation.
Calculation of the evaporation rate, as a function of volatility of the material, and wind
velocity.
Source strength equals pump capacities, etc. in some cases.
Consequential effects
Dispersion of gaseous material in the atmosphere as a function of source strength, relative
density of the gas, weather conditions and topographical situation of the surrounding area.
Intensity of heat radiation [in kW/ m2] due to a fire, as a function of the distance to the source.
Energy of vapour cloud explosions [in N/m2], as a function of the distance to the distance of
the exploding cloud.
Concentration of gaseous material in the atmosphere, due to the dispersion of evaporated
chemical. The latter can be either explosive or toxic.
It may be obvious, that the types of models that must be used in a specific risk study strongly depend
upon the type of material involved:
Gas, vapour, liquid, solid
Inflammable, explosive, toxic, toxic combustion products
Stored at high/low temperatures or pressure
Controlled outflow (pump capacity) or catastrophic failure
5.2 SELECTION OF DAMAGE CRITERIA
The damage criteria give the relation between the extents of the physical effects (exposure) and the
effect of consequences. For assessing the effects on human being consequences are expressed in
terms of injuries and the effects on equipment / property in terms of monetary loss.
The effect of consequences for release of toxic substances or fire can be categorized as
Damage caused by heat radiation on material and people;
Damage caused by explosion on structure and people;
Damage caused by toxic exposure.
In Consequence Analysis studies, in principle three types of exposure to hazardous effects are
distinguished:
1. Heat radiation due to fires. In this study, the concern is that of Jet fires and flash fires.
2. Explosions
3. Toxic effects, from toxic materials or toxic combustion products.
The knowledge about these relations depends strongly on the nature of the exposure. Following are
the criteria selected for damage estimation:
Heat Radiation:
The effect of fire on a human being is in the form of burns. There are three categories of burn such
as first degree, second degree and third degree burns. The consequences caused by exposure to
heat radiation are a function of:
The radiation energy onto the human body [kW/m2];
The exposure duration [sec];
The protection of the skin tissue (clothed or naked body).
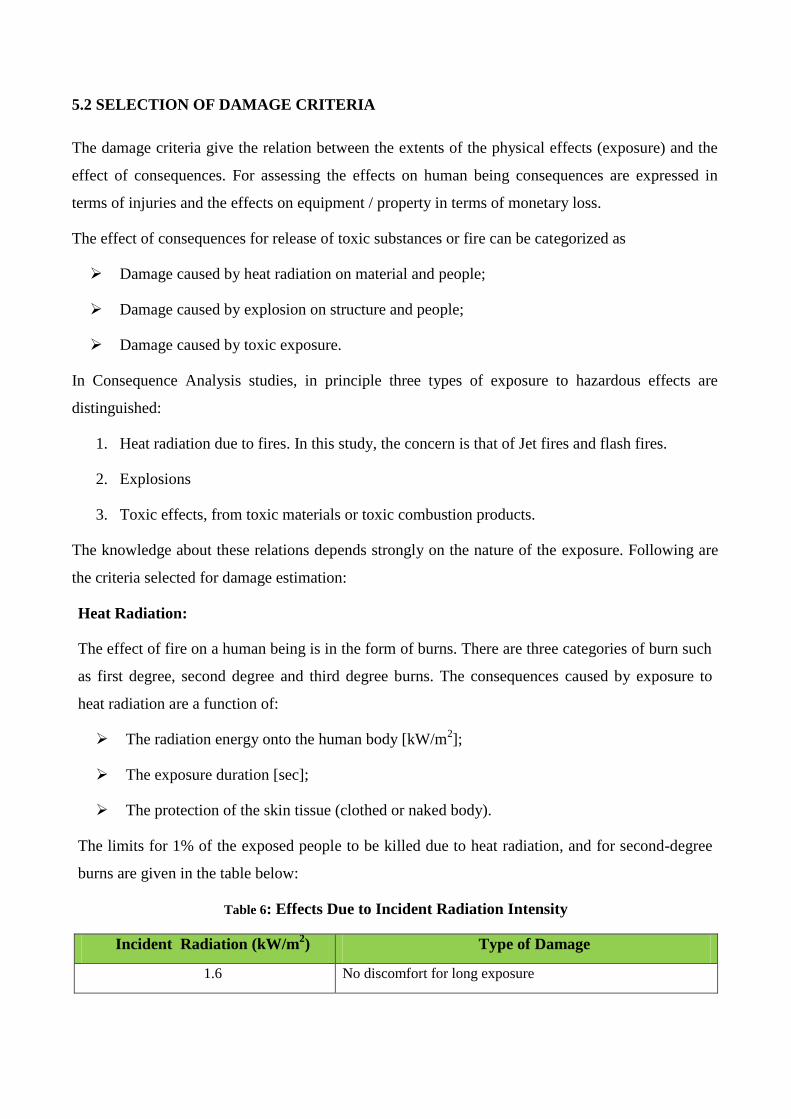
The limits for 1% of the exposed people to be killed due to heat radiation, and for second-degree
burns are given in the table below:
Table 6: Effects Due to Incident Radiation Intensity
Incident Radiation (kW/m2) Type of Damage
1.6 No discomfort for long exposure
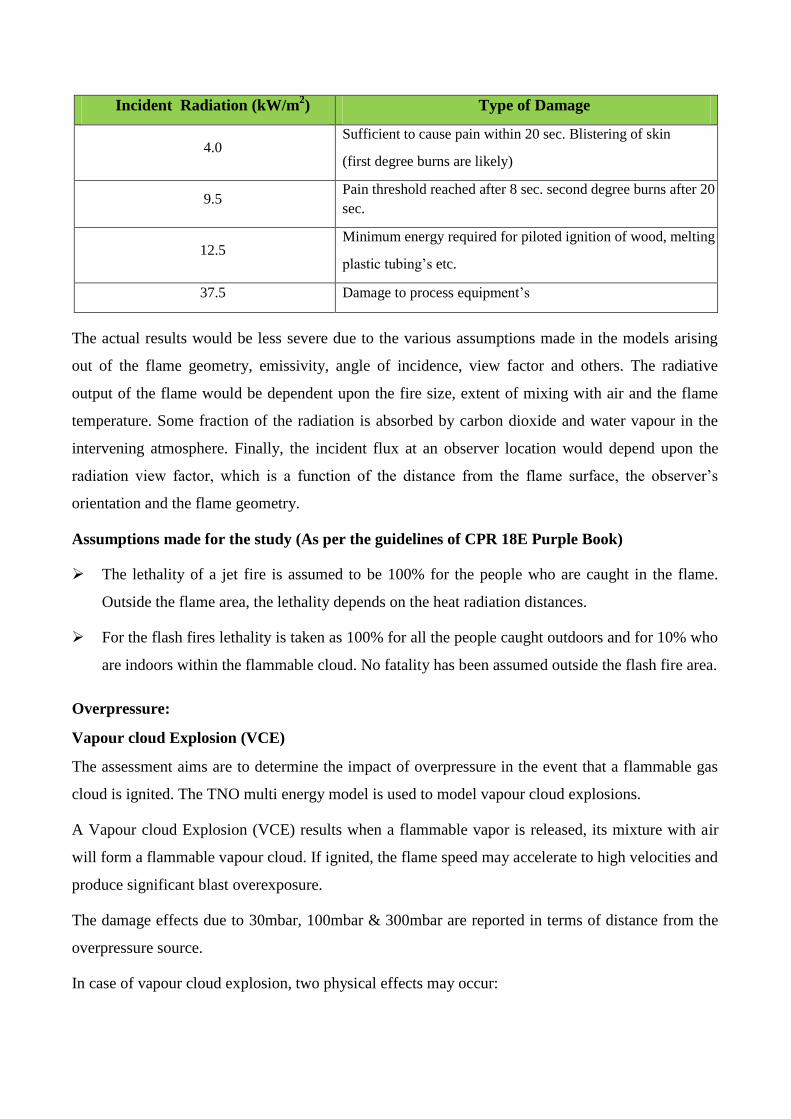
Incident Radiation (kW/m2) Type of Damage
4.0 Sufficient to cause pain within 20 sec. Blistering of skin
(first degree burns are likely)
9.5 Pain threshold reached after 8 sec. second degree burns after 20
sec.
12.5 Minimum energy required for piloted ignition of wood, melting
plastic tubing’s etc.
37.5 Damage to process equipment’s
The actual results would be less severe due to the various assumptions made in the models arising
out of the flame geometry, emissivity, angle of incidence, view factor and others. The radiative
output of the flame would be dependent upon the fire size, extent of mixing with air and the flame
temperature. Some fraction of the radiation is absorbed by carbon dioxide and water vapour in the
intervening atmosphere. Finally, the incident flux at an observer location would depend upon the
radiation view factor, which is a function of the distance from the flame surface, the observer’s
orientation and the flame geometry.
Assumptions made for the study (As per the guidelines of CPR 18E Purple Book)
The lethality of a jet fire is assumed to be 100% for the people who are caught in the flame.
Outside the flame area, the lethality depends on the heat radiation distances.
For the flash fires lethality is taken as 100% for all the people caught outdoors and for 10% who
are indoors within the flammable cloud. No fatality has been assumed outside the flash fire area.
Overpressure:
Vapour cloud Explosion (VCE)
The assessment aims are to determine the impact of overpressure in the event that a flammable gas
cloud is ignited. The TNO multi energy model is used to model vapour cloud explosions.
A Vapour cloud Explosion (VCE) results when a flammable vapor is released, its mixture with air
will form a flammable vapour cloud. If ignited, the flame speed may accelerate to high velocities and
produce significant blast overexposure.
The damage effects due to 30mbar, 100mbar & 300mbar are reported in terms of distance from the
overpressure source.
In case of vapour cloud explosion, two physical effects may occur:
A flash fire over the whole length of the explosive gas cloud;
A blast wave, with typical peak overpressures circular around ignition source.
For the blast wave, the lethality criterion is based on:
A peak overpressure of 0.1bar will cause serious damage to 10% of the housing/structures.
Falling fragments will kill one of each eight persons in the destroyed buildings.
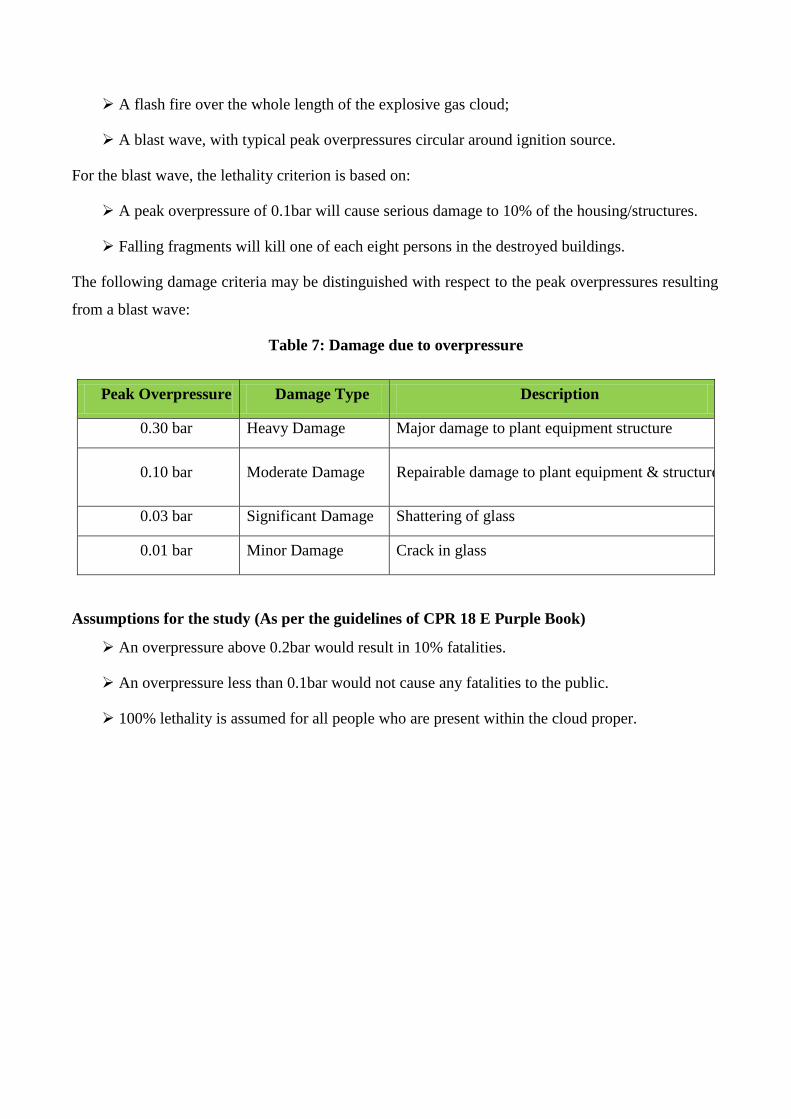
The following damage criteria may be distinguished with respect to the peak overpressures resulting
from a blast wave:
Table 7: Damage due to overpressure
Peak Overpressure Damage Type Description
0.30 bar Heavy Damage Major damage to plant equipment structure
0.10 bar Moderate Damage Repairable damage to plant equipment & structure
0.03 bar Significant Damage Shattering of glass
0.01 bar Minor Damage Crack in glass
Assumptions for the study (As per the guidelines of CPR 18 E Purple Book)
An overpressure above 0.2bar would result in 10% fatalities.
An overpressure less than 0.1bar would not cause any fatalities to the public.
100% lethality is assumed for all people who are present within the cloud proper.
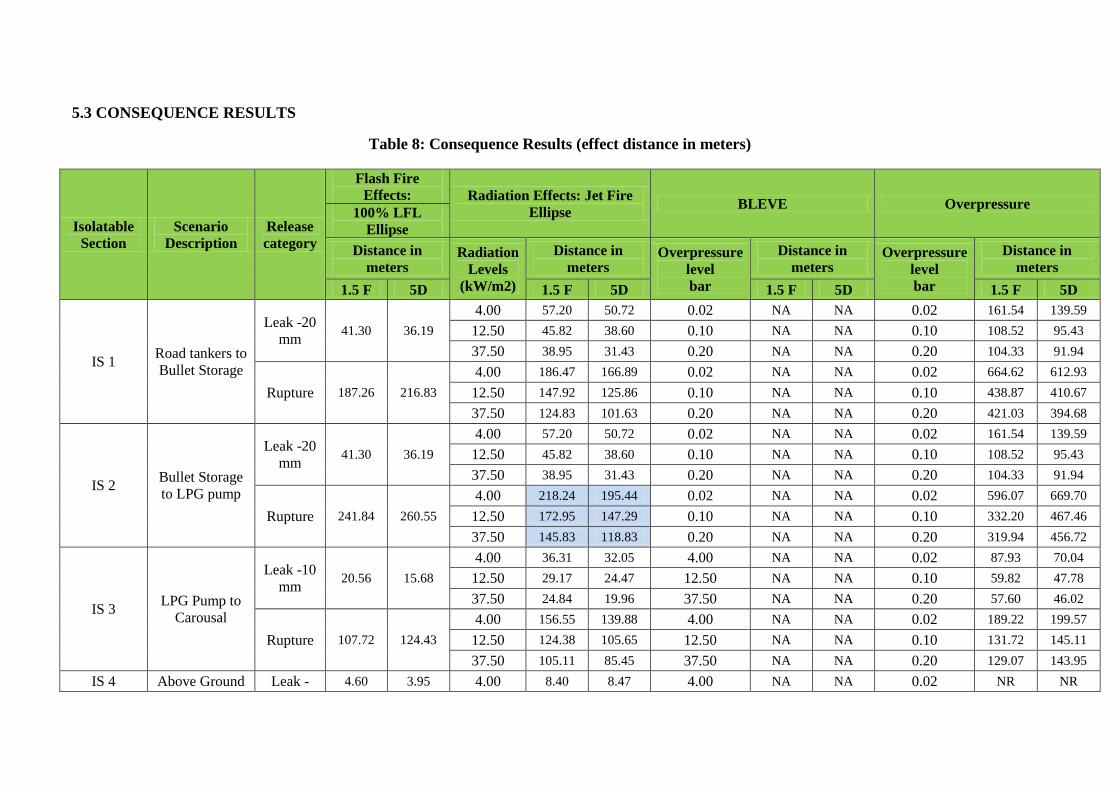
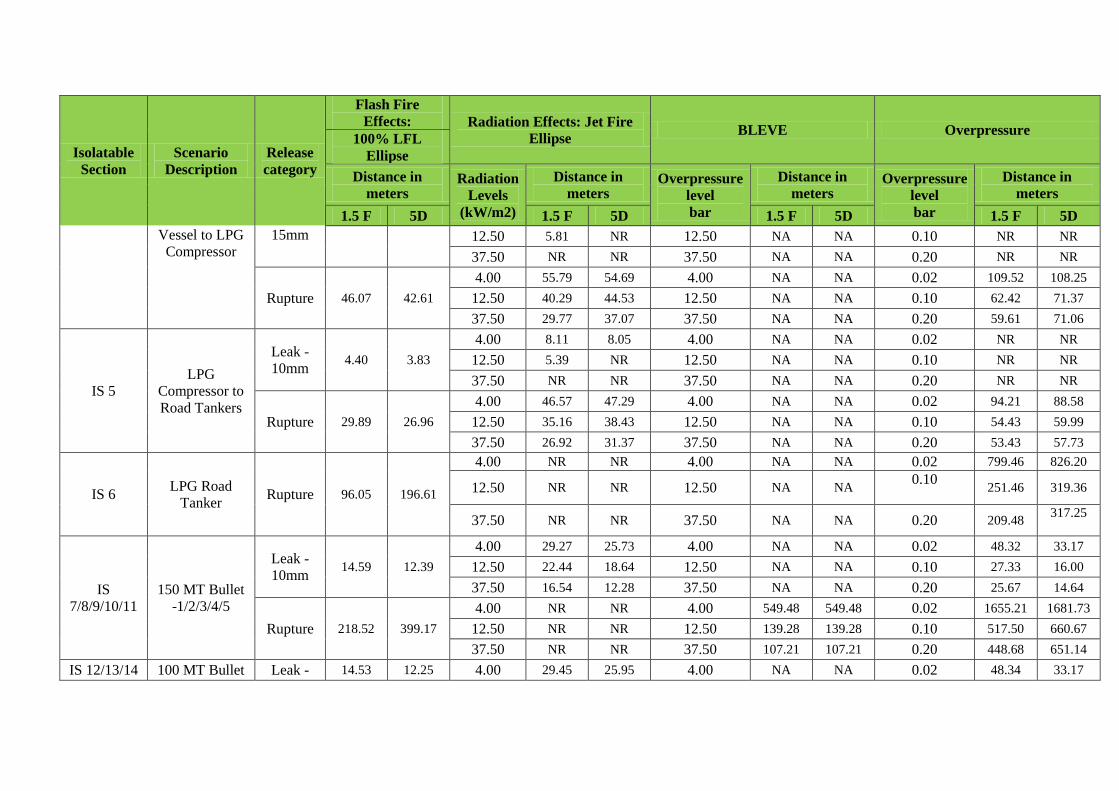
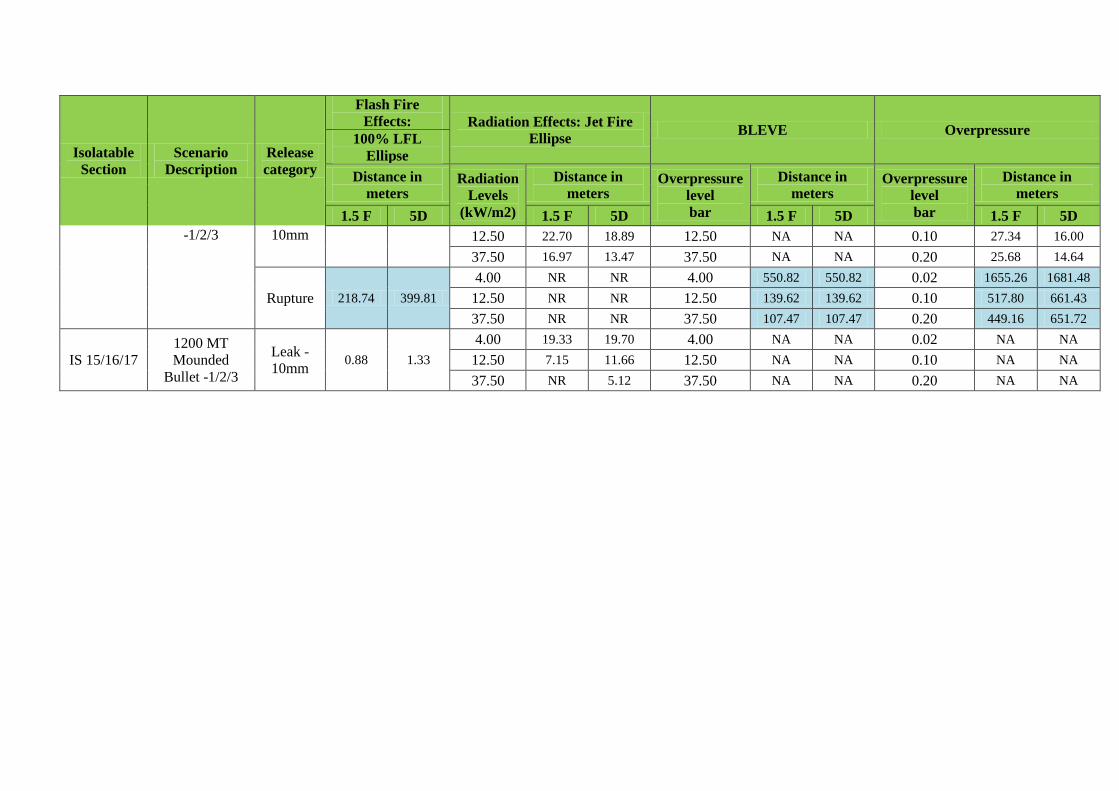
5.3 CONSEQUENCE RESULTS
Table 8: Consequence Results (effect distance in meters)
Isolatable
Section
Scenario
Description
Release
category
Flash Fire
Effects: Radiation Effects: Jet Fire
Ellipse BLEVE Overpressure
100% LFL
Ellipse
Distance in
meters Radiation
Levels
(kW/m2)
Distance in
meters Overpressure
level
bar
Distance in
meters Overpressure
level
bar
Distance in
meters
1.5 F 5D 1.5 F 5D 1.5 F 5D 1.5 F 5D
IS 1 Road tankers to
Bullet Storage
Leak -20
mm 41.30 36.19
4.00 57.20 50.72 0.02 NA NA 0.02 161.54 139.59
12.50 45.82 38.60 0.10 NA NA 0.10 108.52 95.43
37.50 38.95 31.43 0.20 NA NA 0.20 104.33 91.94
Rupture 187.26 216.83
4.00 186.47 166.89 0.02 NA NA 0.02 664.62 612.93
12.50 147.92 125.86 0.10 NA NA 0.10 438.87 410.67
37.50 124.83 101.63 0.20 NA NA 0.20 421.03 394.68
IS 2 Bullet Storage
to LPG pump
Leak -20
mm 41.30 36.19
4.00 57.20 50.72 0.02 NA NA 0.02 161.54 139.59
12.50 45.82 38.60 0.10 NA NA 0.10 108.52 95.43
37.50 38.95 31.43 0.20 NA NA 0.20 104.33 91.94
Rupture 241.84 260.55
4.00 218.24 195.44 0.02 NA NA 0.02 596.07 669.70
12.50 172.95 147.29 0.10 NA NA 0.10 332.20 467.46
37.50 145.83 118.83 0.20 NA NA 0.20 319.94 456.72
IS 3 LPG Pump to
Carousal
Leak -10
mm 20.56 15.68
4.00 36.31 32.05 4.00 NA NA 0.02 87.93 70.04
12.50 29.17 24.47 12.50 NA NA 0.10 59.82 47.78
37.50 24.84 19.96 37.50 NA NA 0.20 57.60 46.02
Rupture 107.72 124.43
4.00 156.55 139.88 4.00 NA NA 0.02 189.22 199.57
12.50 124.38 105.65 12.50 NA NA 0.10 131.72 145.11
37.50 105.11 85.45 37.50 NA NA 0.20 129.07 143.95
IS 4 Above Ground Leak - 4.60 3.95 4.00 8.40 8.47 4.00 NA NA 0.02 NR NR
Isolatable
Section
Scenario
Description
Release
category
Flash Fire
Effects: Radiation Effects: Jet Fire
Ellipse BLEVE Overpressure
100% LFL
Ellipse
Distance in
meters Radiation
Levels
(kW/m2)
Distance in
meters Overpressure
level
bar
Distance in
meters Overpressure
level
bar
Distance in
meters
1.5 F 5D 1.5 F 5D 1.5 F 5D 1.5 F 5D
Vessel to LPG
Compressor
15mm 12.50 5.81 NR 12.50 NA NA 0.10 NR NR
37.50 NR NR 37.50 NA NA 0.20 NR NR
Rupture 46.07 42.61
4.00 55.79 54.69 4.00 NA NA 0.02 109.52 108.25
12.50 40.29 44.53 12.50 NA NA 0.10 62.42 71.37
37.50 29.77 37.07 37.50 NA NA 0.20 59.61 71.06
IS 5
LPG
Compressor to
Road Tankers
Leak -
10mm 4.40 3.83
4.00 8.11 8.05 4.00 NA NA 0.02 NR NR
12.50 5.39 NR 12.50 NA NA 0.10 NR NR
37.50 NR NR 37.50 NA NA 0.20 NR NR
Rupture 29.89 26.96
4.00 46.57 47.29 4.00 NA NA 0.02 94.21 88.58
12.50 35.16 38.43 12.50 NA NA 0.10 54.43 59.99
37.50 26.92 31.37 37.50 NA NA 0.20 53.43 57.73
IS 6 LPG Road
Tanker Rupture 96.05 196.61
4.00 NR NR 4.00 NA NA 0.02 799.46 826.20
12.50 NR NR 12.50 NA NA 0.10
251.46 319.36
37.50 NR NR 37.50 NA NA 0.20 209.48 317.25
IS
7/8/9/10/11
150 MT Bullet
-1/2/3/4/5
Leak -
10mm 14.59 12.39
4.00 29.27 25.73 4.00 NA NA 0.02 48.32 33.17
12.50 22.44 18.64 12.50 NA NA 0.10 27.33 16.00
37.50 16.54 12.28 37.50 NA NA 0.20 25.67 14.64
Rupture 218.52 399.17
4.00 NR NR 4.00 549.48 549.48 0.02 1655.21 1681.73
12.50 NR NR 12.50 139.28 139.28 0.10 517.50 660.67
37.50 NR NR 37.50 107.21 107.21 0.20 448.68 651.14
IS 12/13/14 100 MT Bullet Leak - 14.53 12.25 4.00 29.45 25.95 4.00 NA NA 0.02 48.34 33.17
Isolatable
Section
Scenario
Description
Release
category
Flash Fire
Effects: Radiation Effects: Jet Fire
Ellipse BLEVE Overpressure
100% LFL
Ellipse
Distance in
meters Radiation
Levels
(kW/m2)
Distance in
meters Overpressure
level
bar
Distance in
meters Overpressure
level
bar
Distance in
meters
1.5 F 5D 1.5 F 5D 1.5 F 5D 1.5 F 5D
-1/2/3 10mm 12.50 22.70 18.89 12.50 NA NA 0.10 27.34 16.00
37.50 16.97 13.47 37.50 NA NA 0.20 25.68 14.64
Rupture 218.74 399.81
4.00 NR NR 4.00 550.82 550.82 0.02 1655.26 1681.48
12.50 NR NR 12.50 139.62 139.62 0.10 517.80 661.43
37.50 NR NR 37.50 107.47 107.47 0.20 449.16 651.72
IS 15/16/17
1200 MT
Mounded
Bullet -1/2/3
Leak -
10mm 0.88 1.33
4.00 19.33 19.70 4.00 NA NA 0.02 NA NA
12.50 7.15 11.66 12.50 NA NA 0.10 NA NA
37.50 NR 5.12 37.50 NA NA 0.20 NA NA
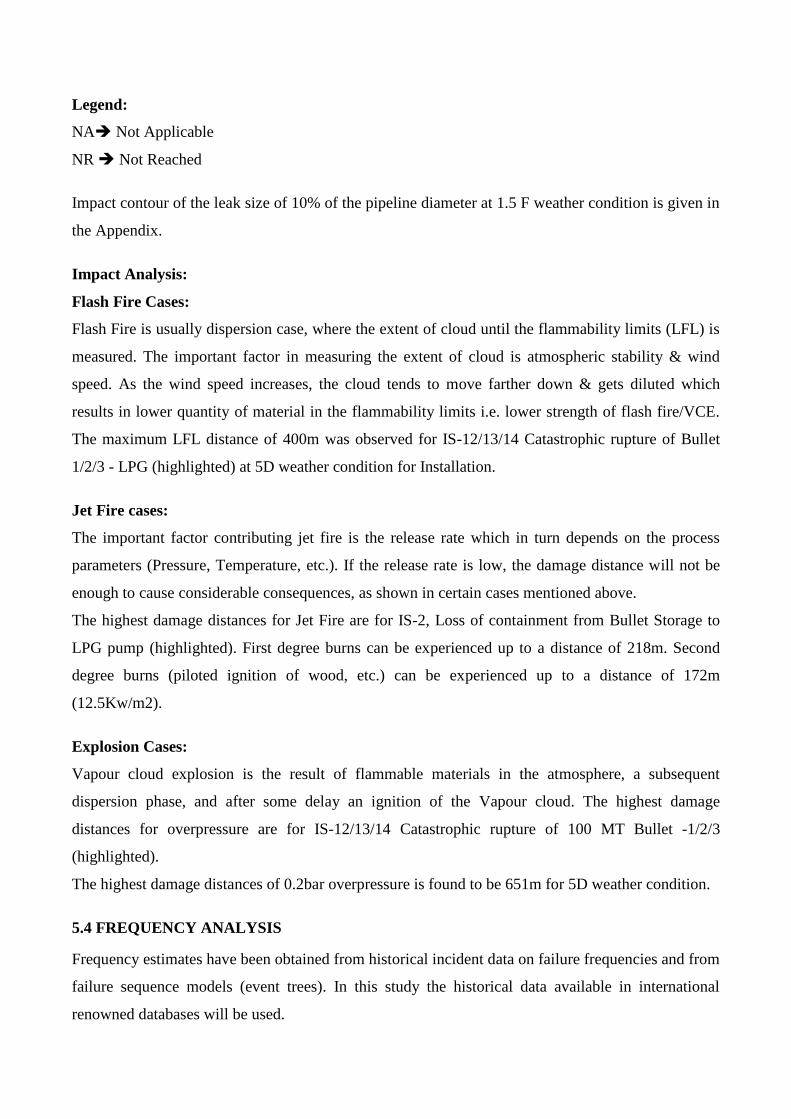
Legend:
NA Not Applicable
NR Not Reached
Impact contour of the leak size of 10% of the pipeline diameter at 1.5 F weather condition is given in
the Appendix.
Impact Analysis:
Flash Fire Cases:
Flash Fire is usually dispersion case, where the extent of cloud until the flammability limits (LFL) is
measured. The important factor in measuring the extent of cloud is atmospheric stability & wind
speed. As the wind speed increases, the cloud tends to move farther down & gets diluted which
results in lower quantity of material in the flammability limits i.e. lower strength of flash fire/VCE.
The maximum LFL distance of 400m was observed for IS-12/13/14 Catastrophic rupture of Bullet
1/2/3 - LPG (highlighted) at 5D weather condition for Installation.
Jet Fire cases:
The important factor contributing jet fire is the release rate which in turn depends on the process
parameters (Pressure, Temperature, etc.). If the release rate is low, the damage distance will not be
enough to cause considerable consequences, as shown in certain cases mentioned above.
The highest damage distances for Jet Fire are for IS-2, Loss of containment from Bullet Storage to
LPG pump (highlighted). First degree burns can be experienced up to a distance of 218m. Second
degree burns (piloted ignition of wood, etc.) can be experienced up to a distance of 172m
(12.5Kw/m2).
Explosion Cases:
Vapour cloud explosion is the result of flammable materials in the atmosphere, a subsequent
dispersion phase, and after some delay an ignition of the Vapour cloud. The highest damage
distances for overpressure are for IS-12/13/14 Catastrophic rupture of 100 MT Bullet -1/2/3
(highlighted).
The highest damage distances of 0.2bar overpressure is found to be 651m for 5D weather condition.
5.4 FREQUENCY ANALYSIS
Frequency estimates have been obtained from historical incident data on failure frequencies and from
failure sequence models (event trees). In this study the historical data available in international
renowned databases will be used.
Reference Manual Bevi Risk Assessments version 3.2
CPR 18E – Committee for Prevention of Disasters, Netherlands
The scenario list and frequencies are available in Table No. 5.
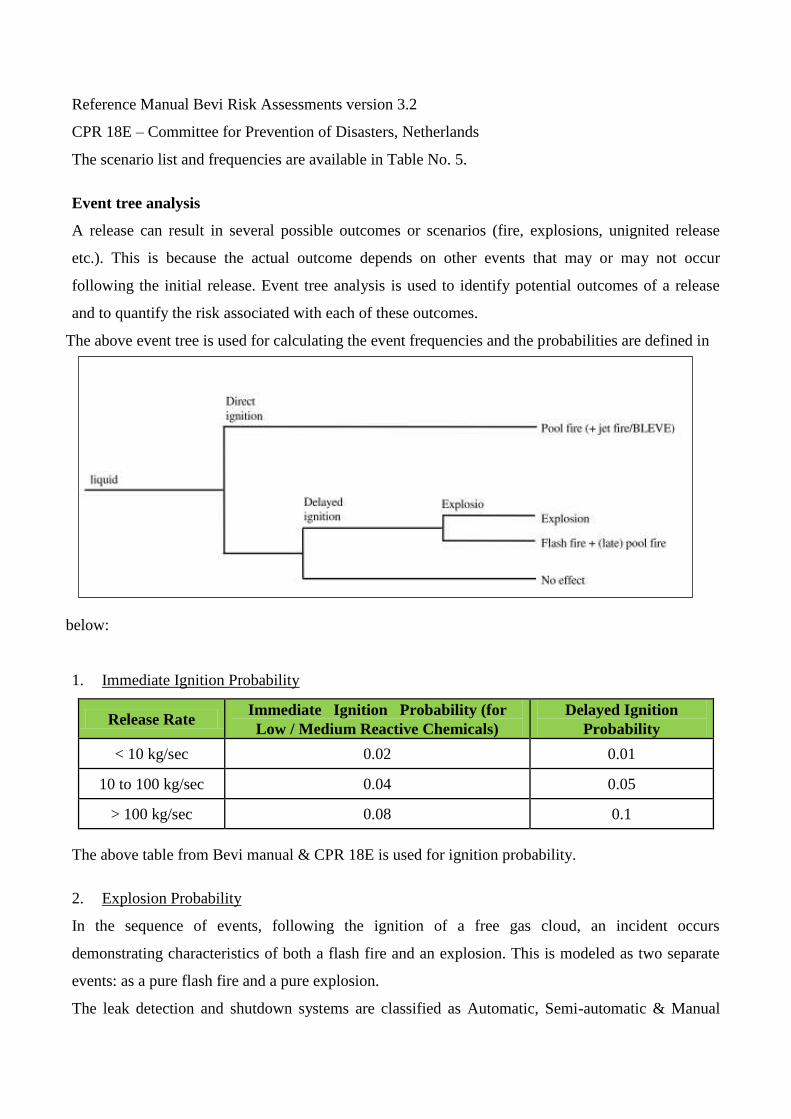
Event tree analysis
A release can result in several possible outcomes or scenarios (fire, explosions, unignited release
etc.). This is because the actual outcome depends on other events that may or may not occur
following the initial release. Event tree analysis is used to identify potential outcomes of a release
and to quantify the risk associated with each of these outcomes.
The above event tree is used for calculating the event frequencies and the probabilities are defined in
below:
1. Immediate Ignition Probability
Release Rate Immediate Ignition Probability (for
Low / Medium Reactive Chemicals)
Delayed Ignition
Probability
< 10 kg/sec 0.02 0.01
10 to 100 kg/sec 0.04 0.05
> 100 kg/sec 0.08 0.1
The above table from Bevi manual & CPR 18E is used for ignition probability.
2. Explosion Probability
In the sequence of events, following the ignition of a free gas cloud, an incident occurs
demonstrating characteristics of both a flash fire and an explosion. This is modeled as two separate
events: as a pure flash fire and a pure explosion.
The leak detection and shutdown systems are classified as Automatic, Semi-automatic & Manual
systems based on the leak detection facilities.
6.0 RISK ESTIMATION
Risk is often defined as a function of the likelihood that a specified undesired event will occur, and
the severity of the consequences of that event. Risk is derived from the product of likelihood and
potential consequence. Risk in general is a measure of potential economic loss or human injury in
terms of the probability of the loss or injury occurring and magnitude of the loss or injury if it occurs.
(Severity,Frequency)Risk f
Quantification of effects of the hazardous event was done using the event tree approach in which all
the possible outcomes of the hazardous event were considered and the likelihood of each type of end
event determined. This step in the process involves the use of consequence modelling to predict both
physical phenomena such as dispersion, size and duration of fires, overpressures due to explosions,
and the performance of equipment and systems such as availability of a fire & gas detection system,
availability of emergency shutdown system, and availability of fire protection system. The end result
of this phase of the assessment is a series of “end events”, together with their estimated frequency of
occurrence.
The risk modelling has been performed using DNV PHAST RISK 6.7 software.
The results of a QRA are expressed using Individual Risk Contours and Societal Risk Graphs given
in this section of the report.
6.1 LOCATION SPECIFIC INDIVIDUAL RISK
The term “Location-Specific Individual Risk (LSIR)” is used for the calculations of the risk of
fatality for someone at a specific location, assuming that the person is always present at the location
and therefore, is continuously exposed to the risk at that location. This makes the LSIR a measure of
the geographic distribution of risk, independent of the distribution of people at that location or in the
surrounding area. The LSIR is presented as iso-risk contours (Figure 2) on a map of the location of
interest.
6.2 INDIVIDUAL RISK
Location Specific Individual Risk (LSIR) is acquired directly from PHAST Risk software. The LSIR
is the individual risk at different locations based upon the assumption that an unprotected individual is
present at an unprotected location exposed to the risk for 24 hours a day, 365 days.
Individual Risk = Location Specific Individual risk * Occupancy factor
The Individual Risk represents the frequency of an individual dying due to loss of containment events
(LOCs). The individual is assumed to be unprotected and to be present during the total exposure time.
6.3 SOCIETAL RISK
The second definition of risk involves the concept of the summation of risk from events involving
many fatalities within specific population groups. This definition is focused on the risk to society
rather than to a specific individual and is termed 'Societal Risk'. In relation to the process operations
we can identify specific groups of people who work on or live close to the installation; for example
communities living or working close to the plant.
7.0 RISK RESULTS
The risk modelling has been performed using DNV PHAST RISK 6.7 software. Thereby, the details
of the input data used for the risk modelling such as vulnerability criteria, ignition probability and
occupancy data are given in the QRA Report. The existing MCC, Substation, DG set, parking area
within the project vicinity is considered as a source of ignition and the ignition probability of the
same is considered in the study. In addition to the above, Transportation and Electrical station and
nearby adjacent plant were considered for the study. This section focuses on the outcome of the risk
results and the comparison of the risk results with UK HS risk acceptance criteria.
7.1 LOCATION SPECIFIC INDIVIDUAL RISK CONTOUR
The location specific individual risk (LSIR) contour for the project facility is presented below:
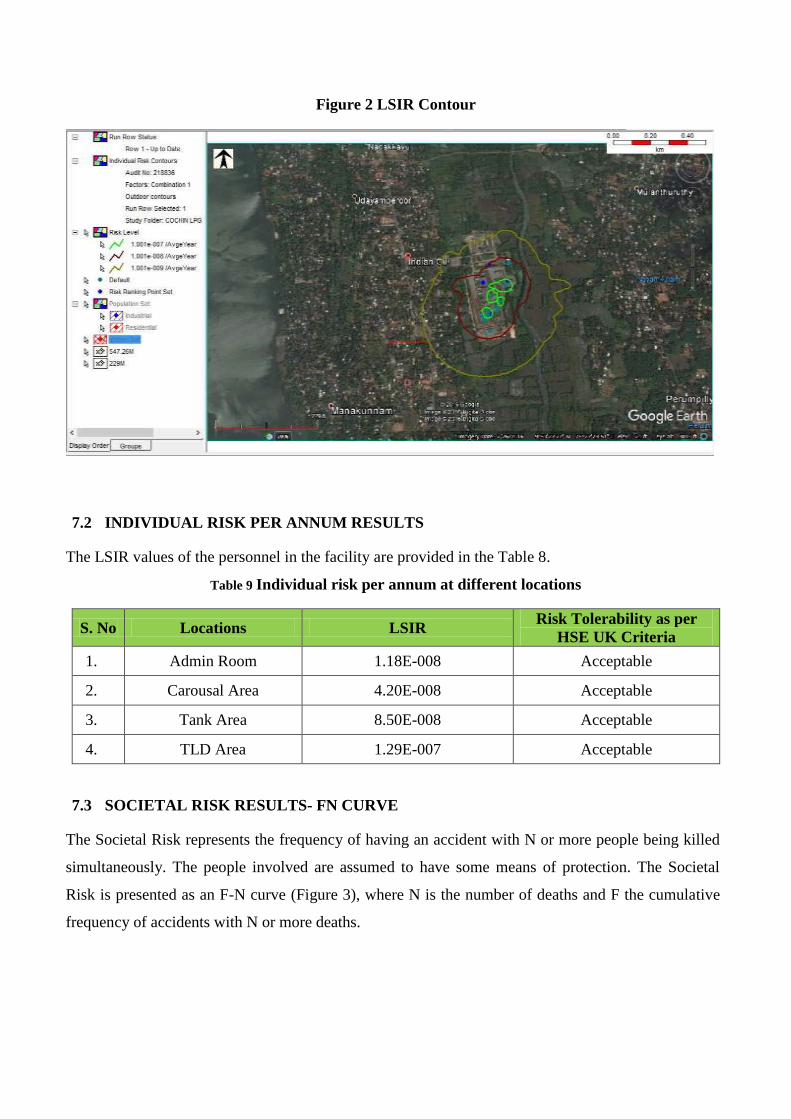
Figure 2 LSIR Contour
7.2 INDIVIDUAL RISK PER ANNUM RESULTS
The LSIR values of the personnel in the facility are provided in the Table 8.
Table 9 Individual risk per annum at different locations
S. No Locations LSIR Risk Tolerability as per
HSE UK Criteria
1. Admin Room 1.18E-008 Acceptable
2. Carousal Area 4.20E-008 Acceptable
3. Tank Area 8.50E-008 Acceptable
4. TLD Area 1.29E-007 Acceptable
7.3 SOCIETAL RISK RESULTS- FN CURVE
The Societal Risk represents the frequency of having an accident with N or more people being killed
simultaneously. The people involved are assumed to have some means of protection. The Societal
Risk is presented as an F-N curve (Figure 3), where N is the number of deaths and F the cumulative
frequency of accidents with N or more deaths.
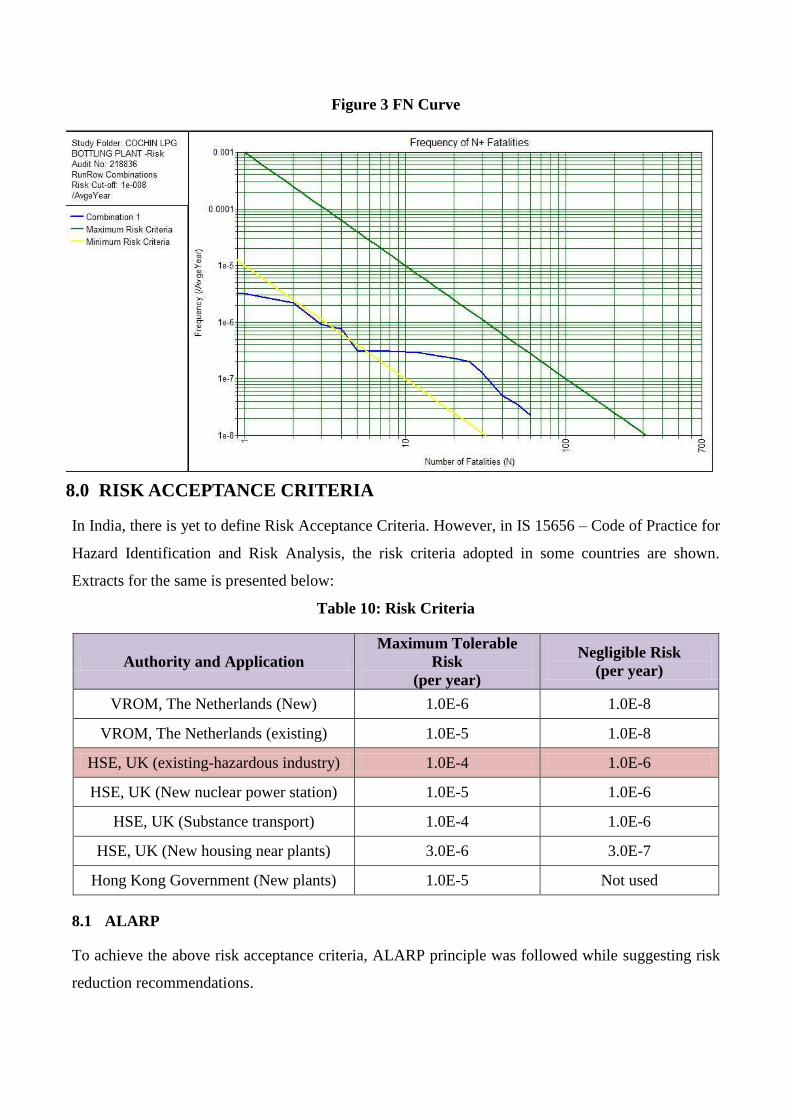
Figure 3 FN Curve
8.0 RISK ACCEPTANCE CRITERIA
In India, there is yet to define Risk Acceptance Criteria. However, in IS 15656 – Code of Practice for
Hazard Identification and Risk Analysis, the risk criteria adopted in some countries are shown.
Extracts for the same is presented below:
Table 10: Risk Criteria
Authority and Application
Maximum Tolerable
Risk
(per year)
Negligible Risk
(per year)
VROM, The Netherlands (New) 1.0E-6 1.0E-8
VROM, The Netherlands (existing) 1.0E-5 1.0E-8
HSE, UK (existing-hazardous industry) 1.0E-4 1.0E-6
HSE, UK (New nuclear power station) 1.0E-5 1.0E-6
HSE, UK (Substance transport) 1.0E-4 1.0E-6
HSE, UK (New housing near plants) 3.0E-6 3.0E-7
Hong Kong Government (New plants) 1.0E-5 Not used
8.1 ALARP
To achieve the above risk acceptance criteria, ALARP principle was followed while suggesting risk
reduction recommendations.
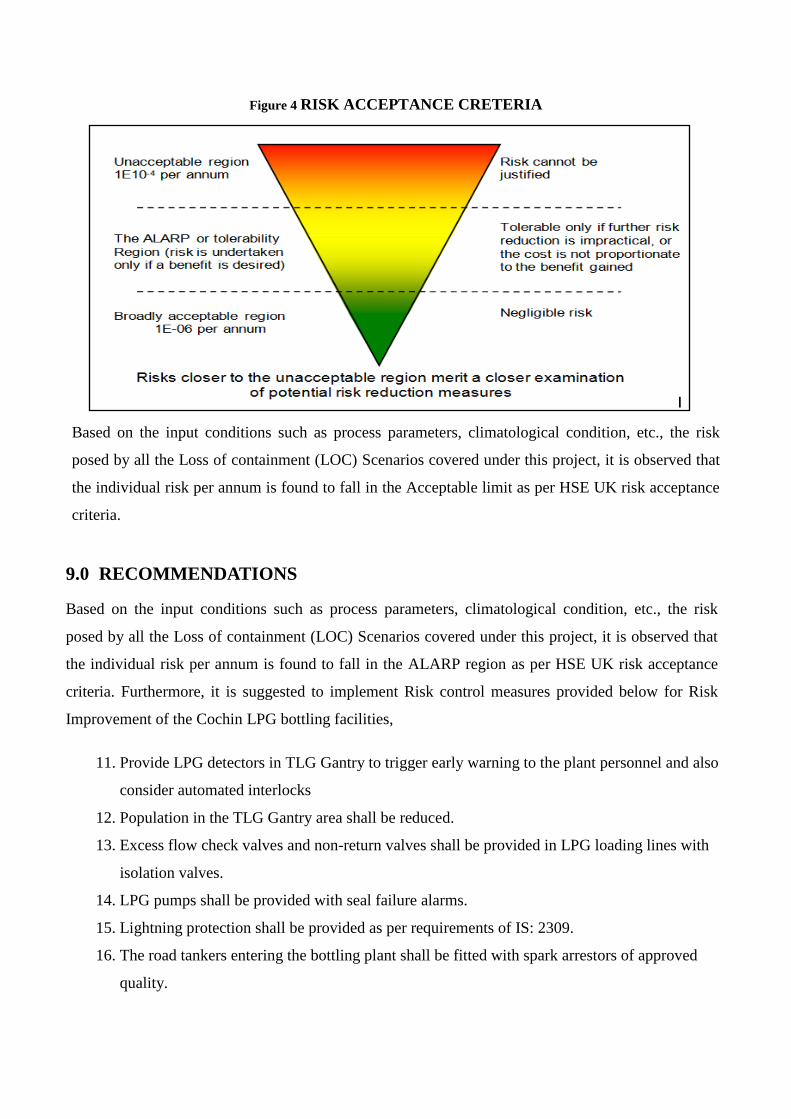
Figure 4 RISK ACCEPTANCE CRETERIA
Based on the input conditions such as process parameters, climatological condition, etc., the risk
posed by all the Loss of containment (LOC) Scenarios covered under this project, it is observed that
the individual risk per annum is found to fall in the Acceptable limit as per HSE UK risk acceptance
criteria.
9.0 RECOMMENDATIONS
Based on the input conditions such as process parameters, climatological condition, etc., the risk
posed by all the Loss of containment (LOC) Scenarios covered under this project, it is observed that
the individual risk per annum is found to fall in the ALARP region as per HSE UK risk acceptance
criteria. Furthermore, it is suggested to implement Risk control measures provided below for Risk
Improvement of the Cochin LPG bottling facilities,
11. Provide LPG detectors in TLG Gantry to trigger early warning to the plant personnel and also
consider automated interlocks
12. Population in the TLG Gantry area shall be reduced.
13. Excess flow check valves and non-return valves shall be provided in LPG loading lines with
isolation valves.
14. LPG pumps shall be provided with seal failure alarms.
15. Lightning protection shall be provided as per requirements of IS: 2309.
16. The road tankers entering the bottling plant shall be fitted with spark arrestors of approved
quality.
17. Two numbers of Wind socks shall be provided at appropriate locations in the facility and the
same should be visible in the night time also.
18. To eliminate static electricity hazard, it is recommended to interlock pump / compressor start
up with the grounding system of the road tanker so that if the grounding system is not
connected to the road tanker, product cannot be transferred.
19. The ground under and surrounding the pressurized liquefied storage vessel, to drain away any
liquid spill, to safe area away from vessel and piping should have the drainage system so
designed that spill under one tank does not flow under another tank.
20. LPG filling hoses should be replaced frequently (specific advice from hose vendor to be
taken for frequency of replacement).
General recommendations to avoid leak/rupture scenarios in pipeline transfer of LPG to
bullet:
Periodical maintenance schedule should be implemented and meticulously followed
Bypassing of hydraulic surge protection systems to be done only after satisfactory protection
measures implemented and with management clearance only
F&G systems management to be inspected periodically and availability ensured
Periodical inspection of pipeline and drain systems
Periodical inspection of TRV’s
SOP for critical operations to be developed and displayed at critical locations in local/English
languages.
General recommendations to avoid leak/rupture scenarios in pipeline transfer of LPG from
bullet to carousel
Periodical maintenance schedule should be implemented and meticulously followed
Periodical inspection of pipeline and drain systems
Periodical inspection of TRV’s
SOP for critical operations to be developed and displayed at critical locations in local/English
languages
F&G systems management to be inspected periodically and availability ensured
Filling operations to be carried out under supervision of trained operators
Awareness training for the contractors
Provision of Low pressure and high pressure LPG header alarm annunciation to alert the
operators
Remote tripping provision for LPG pumps and compressors
Other general recommendations
Periodical mock drills
Periodical inspection of fire protection systems
Periodical inspection of lightning protection and earthing arrangements
Periodical inspection of all Electrical equipment (ensuring the adherence to the area
classification)
10.0 REFERENCE
1 Reference Manual Bevi Risk Assessments version 3.2, Netherlands
2 CPR 18E – Committee for Prevention of Disasters, Netherlands
3 A guide to Chemical Process Quantitative Risk Analysis – Centre for Chemical Process
Safety
DNV GL, PHAST-RISK (Safety), Version 6.7,
4 http://www.dnv.com/services/software/products/safeti/safeti/index.asp
5 Burchfield Major Incident Investigation Board, “The Buncefield Incident 11 December 2005,
The Final Report of the Major Incident Investigation Board”, December 2008
6 International Association of Oil & Gas Producers, “OGP Risk Assessment Data Directory;
Storage Incident Frequencies”, Report No. 434-3, March 2010.
ANNEXURE – 1
CONSEQUENCE CONTOURS
IS-1 Road tankers to Bullet Storage
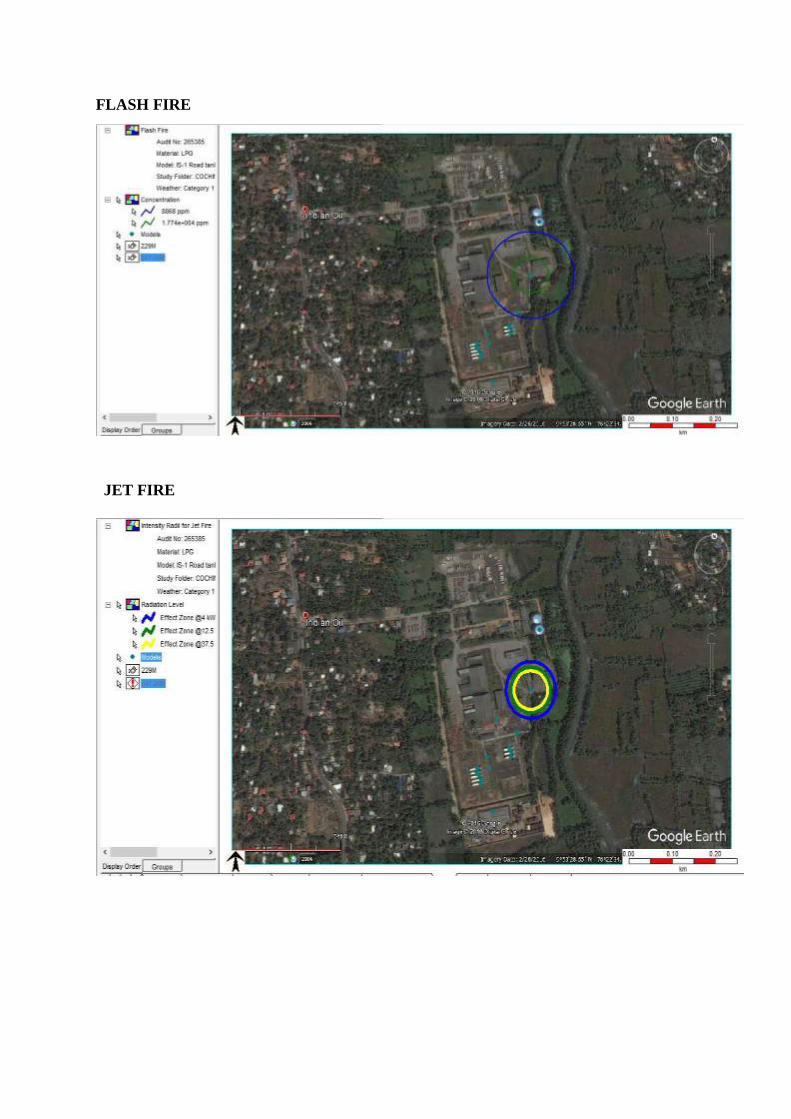
FLASH FIRE
JET FIRE
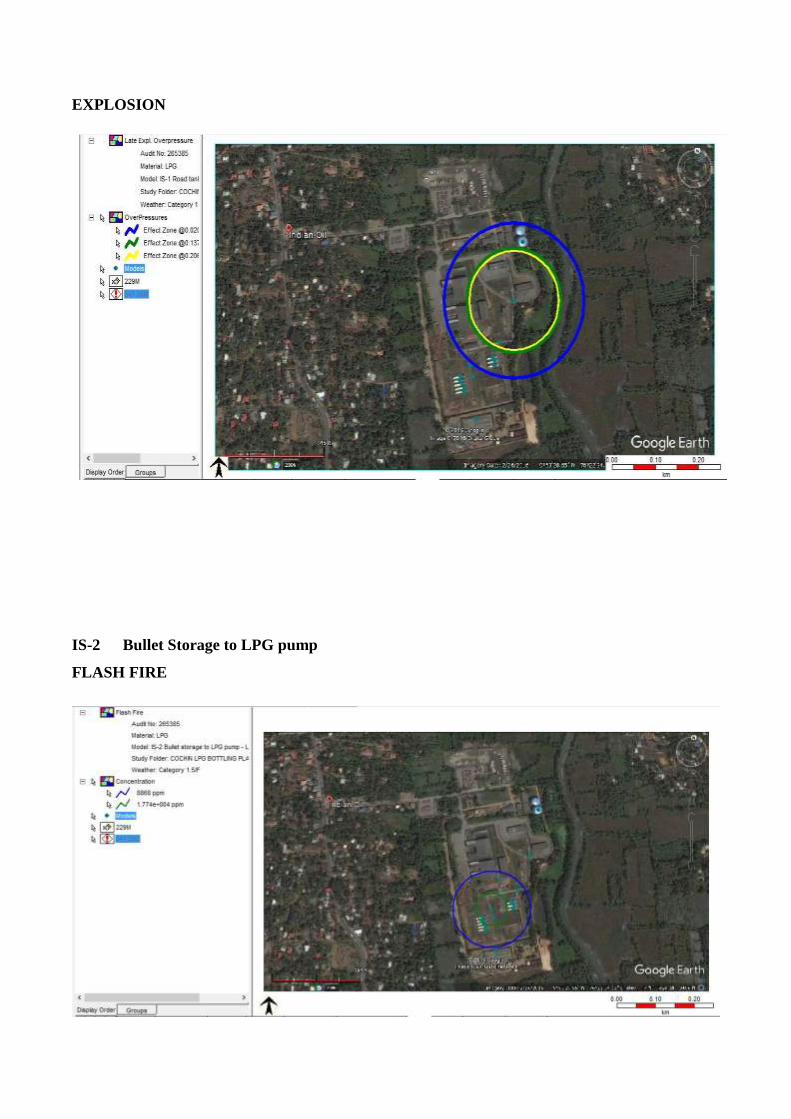
EXPLOSION
IS-2 Bullet Storage to LPG pump
FLASH FIRE
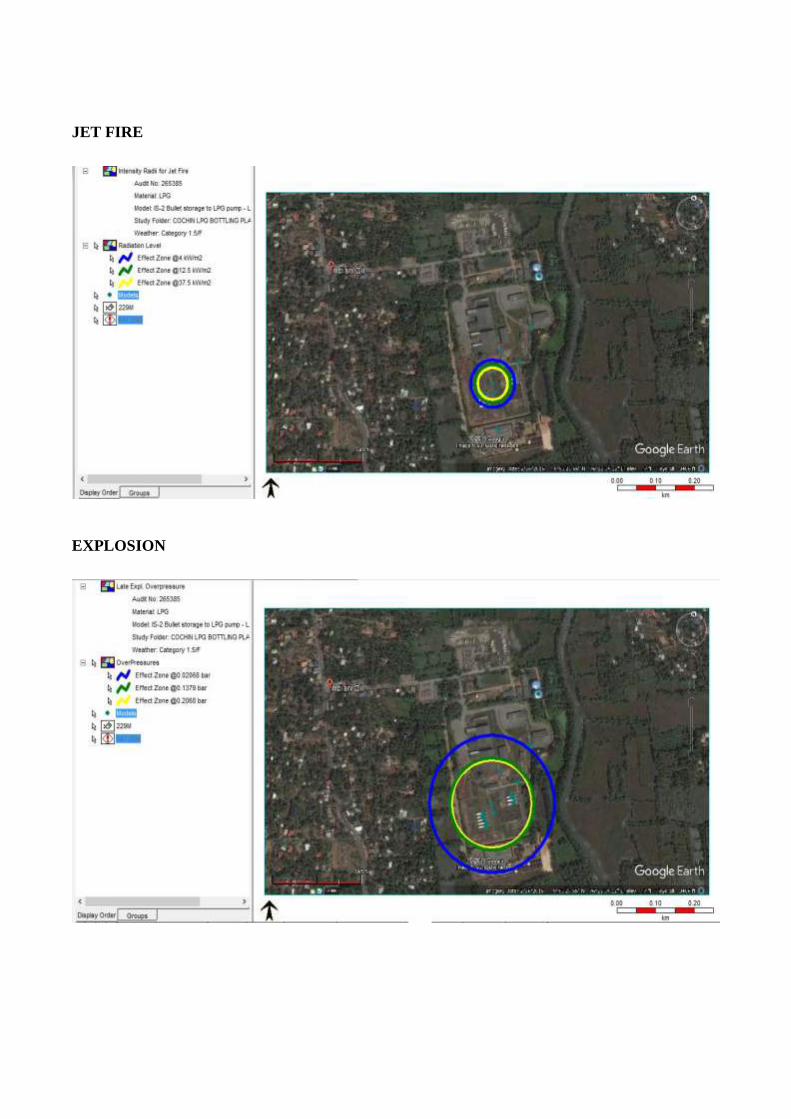
JET FIRE
EXPLOSION
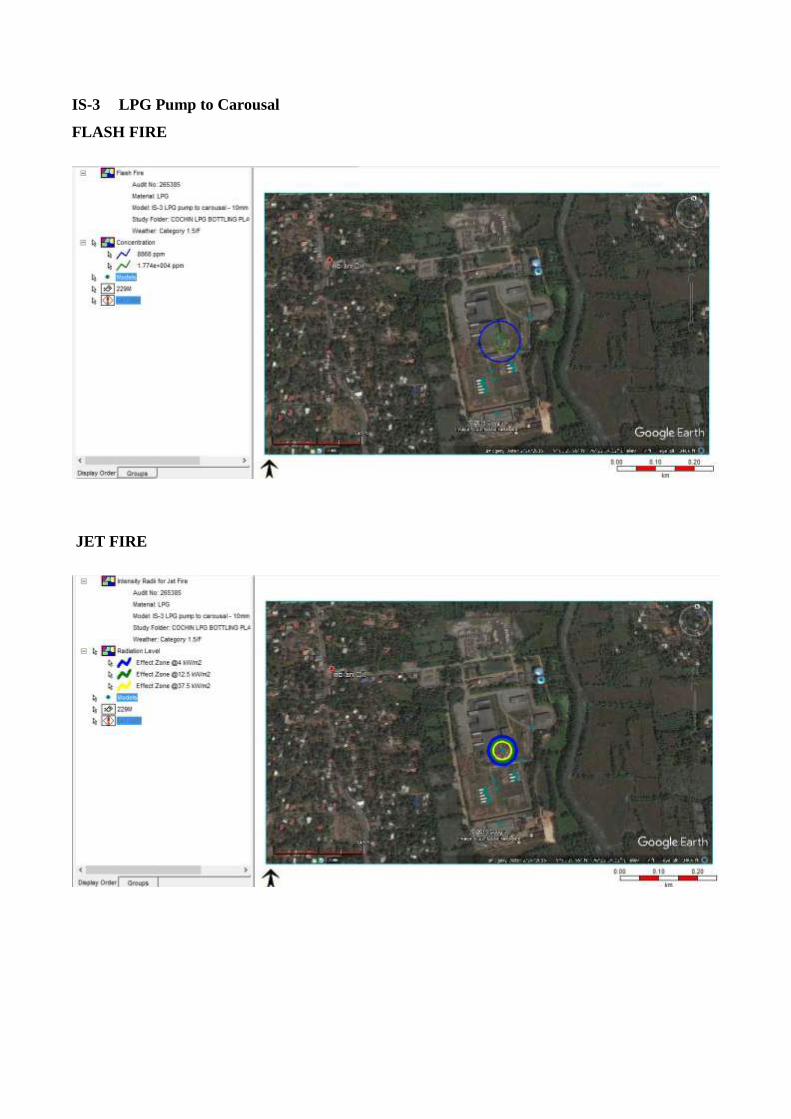
IS-3 LPG Pump to Carousal
FLASH FIRE
JET FIRE
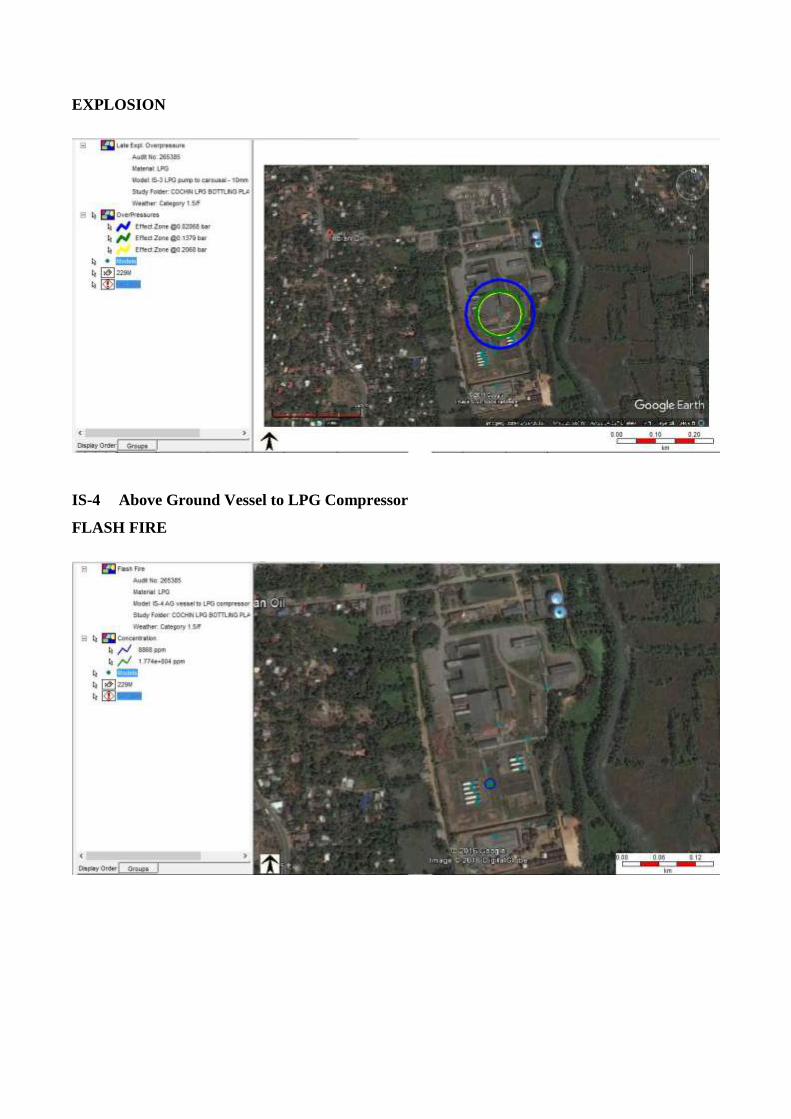
EXPLOSION
IS-4 Above Ground Vessel to LPG Compressor
FLASH FIRE
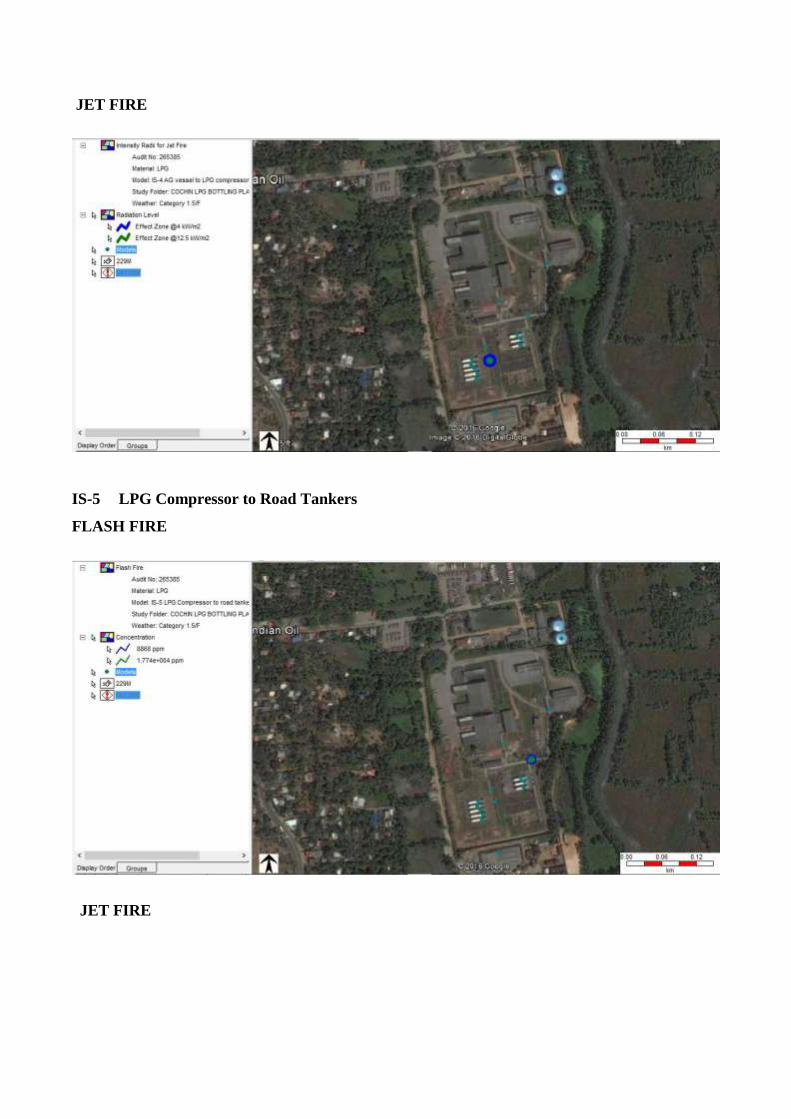
JET FIRE
IS-5 LPG Compressor to Road Tankers
FLASH FIRE
JET FIRE
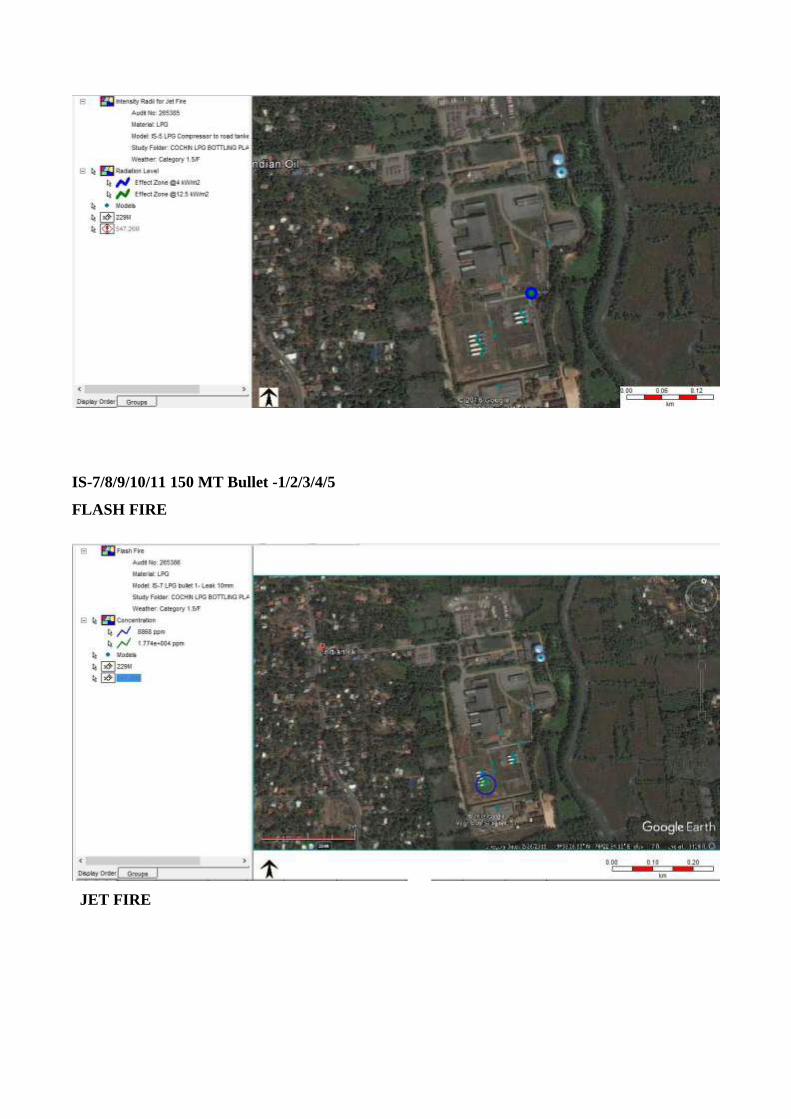
IS-7/8/9/10/11 150 MT Bullet -1/2/3/4/5
FLASH FIRE
JET FIRE
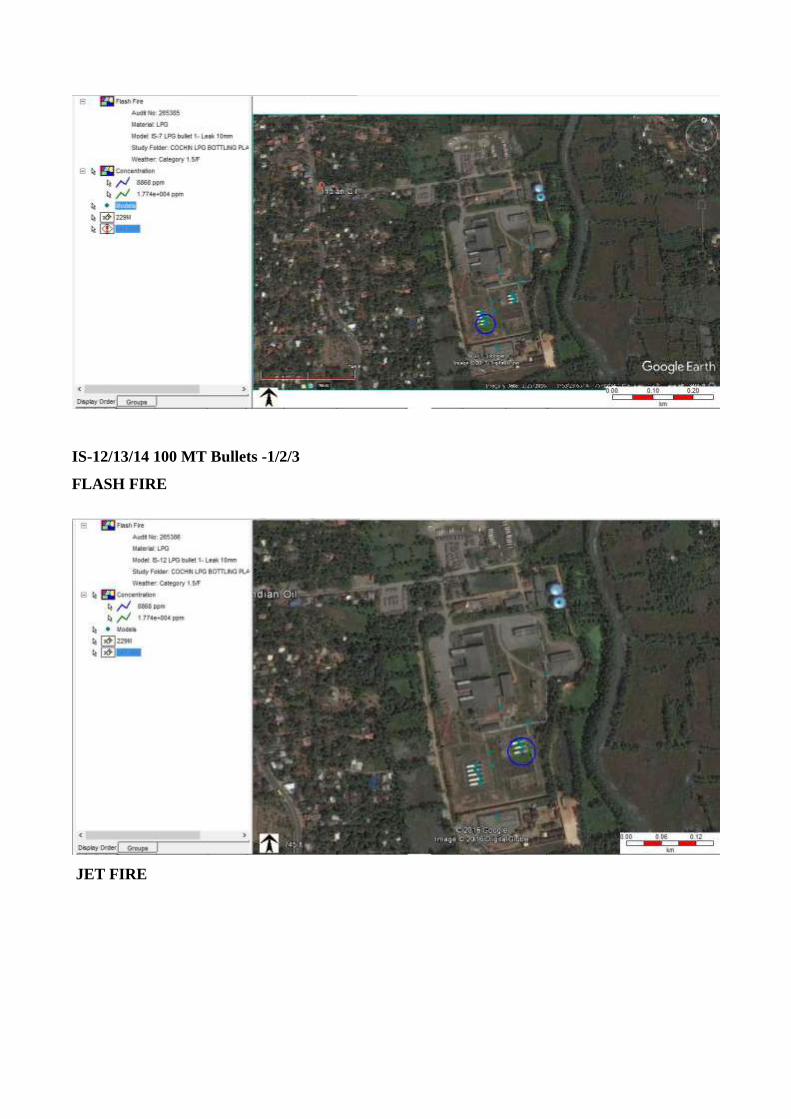
IS-12/13/14 100 MT Bullets -1/2/3
FLASH FIRE
JET FIRE
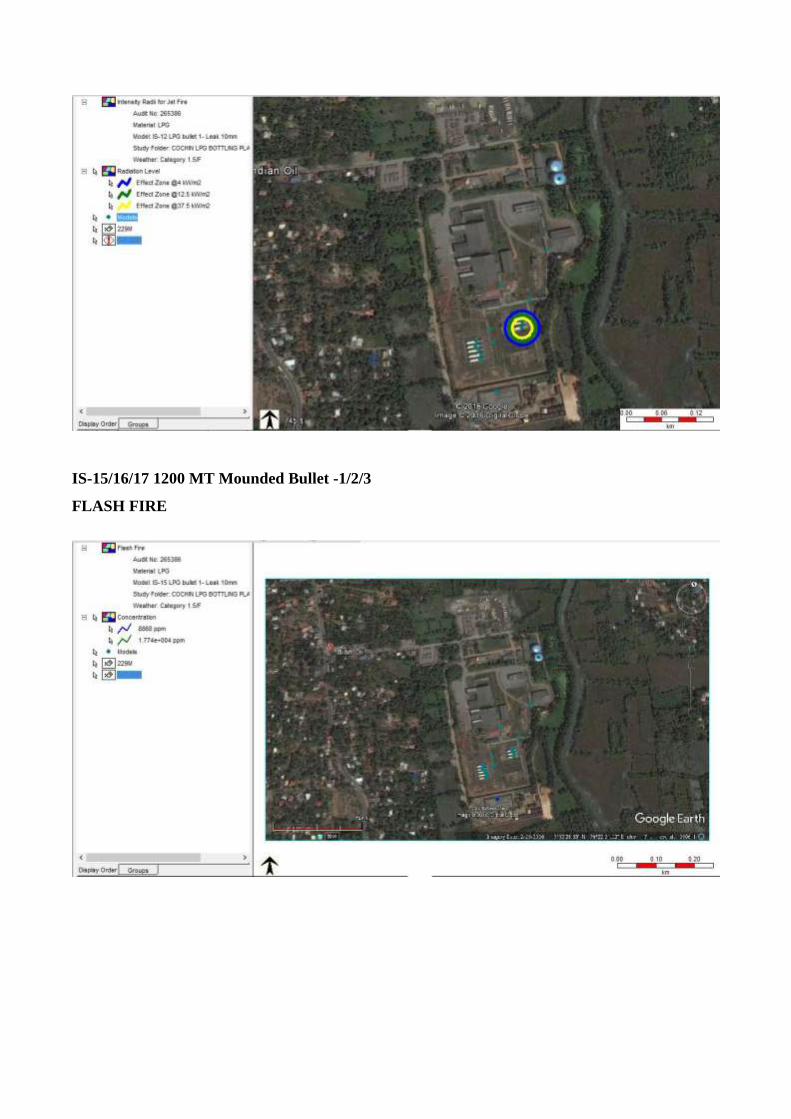
IS-15/16/17 1200 MT Mounded Bullet -1/2/3
FLASH FIRE
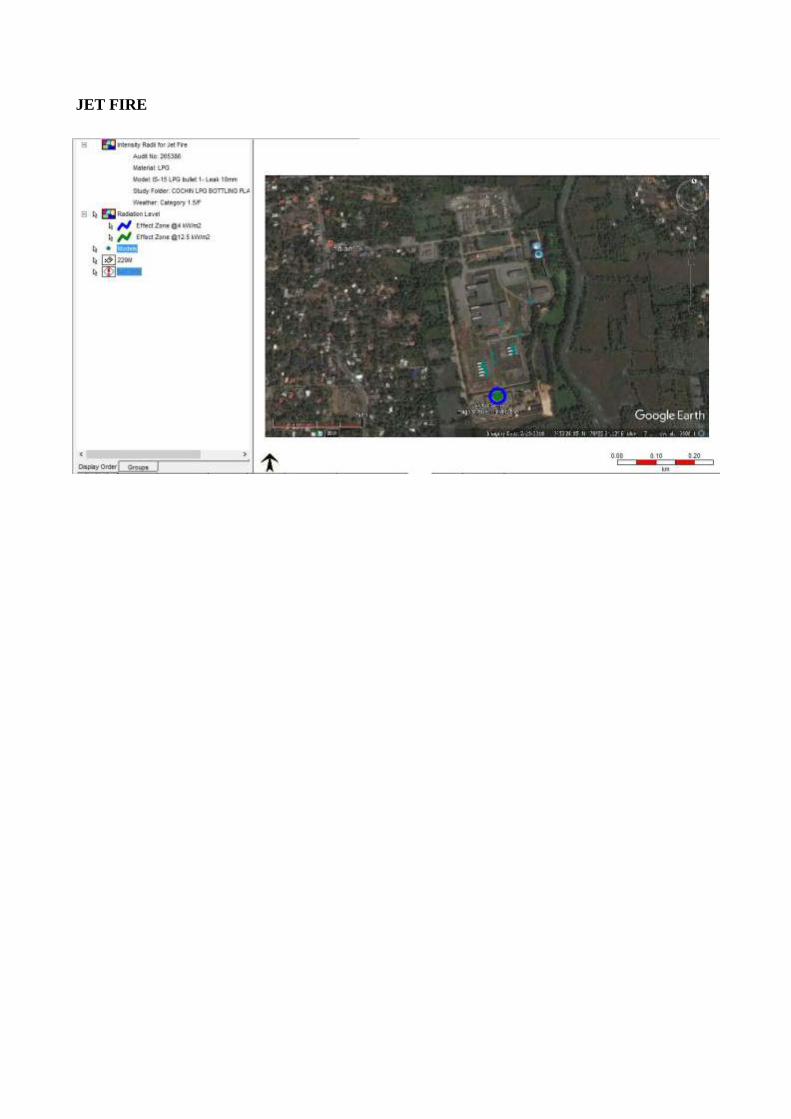
JET FIRE