quarterly condensed consolidated financial … · pkp cargo s.a. jednostkowe sprawozdanie finansowe...
TRANSCRIPT


PKP CARGO GROUP
QUARTERLY CONDENSED CONSOLIDATED FINANCIAL STATEMENTS FOR THE PERIOD
OF 3 MONTHS ENDED 31 MARCH 2017, PREPARED IN ACCORDANCE WITH IFRS EU (IN PLN ‘000)
(translation of a document originally issued in Polish)
TABLE OF CONTENTS
QUARTERLY CONSOLIDATED STATEMENT OF COMPREHENSIVE INCOME ....................................................................... 2
QUARTERLY CONSOLIDATED STATEMENT OF FINANCIAL POSITION ................................................................................. 3
QUARTERLY CONSOLIDATED STATEMENT OF CHANGES IN EQUITY ................................................................................. 5
QUARTERLY CONSOLIDATED STATEMENT OF CASH FLOWS .............................................................................................. 6
1. General information ................................................................................................................................................................ 7
2. Basis for the preparation of the Quarterly Condensed Consolidated Financial Statements ................................................... 9
3. Basis for the application of International Financial Reporting Standards ................................................................................ 9
4. Accounting policies and material values based on professional judgement and estimates .................................................. 11
5. Prior period error adjustment ................................................................................................................................................ 11
6. Revenue from the sale of services and finished goods ........................................................................................................ 13
7. Expenses by kind ................................................................................................................................................................. 14
8. Other operating revenue and expenses ............................................................................................................................... 15
9. Financial revenue and expenses .......................................................................................................................................... 16
10. Income tax ............................................................................................................................................................................ 17
11. Property, plant and equipment ............................................................................................................................................. 21
12. Subsidiaries .......................................................................................................................................................................... 23
13. Investments in entities accounted for under the equity method ............................................................................................ 24
14. Other financial assets ........................................................................................................................................................... 25
15. Other non-financial assets .................................................................................................................................................... 26
16. Inventories ............................................................................................................................................................................ 26
17. Trade and other receivables ................................................................................................................................................. 26
18. Cash and cash equivalents .................................................................................................................................................. 27
19. Equity ................................................................................................................................................................................... 27
20. Earnings per share ............................................................................................................................................................... 27
21. Bank loans and credit facilities ............................................................................................................................................ 28
22. Other financial liabilities ........................................................................................................................................................ 31
23. Finance lease liabilities and leases with purchase option .................................................................................................... 31
24. Trade and other payables .................................................................................................................................................... 32
25. Employee benefits ................................................................................................................................................................ 32
26. Other provisions ................................................................................................................................................................... 33
27. Financial instruments ........................................................................................................................................................... 34
28. Transactions with related parties .......................................................................................................................................... 38
29. Commitments to incur expenses for non-financial fixed assets ............................................................................................ 40
30. Contingent liabilities ............................................................................................................................................................. 40
31. Subsequent events ............................................................................................................................................................... 40
32. Approval of financial statements........................................................................................................................................... 40

PKP CARGO S.A.
JEDNOSTKOWE SPRAWOZDANIE FINANSOWE ZA ROK OBROTOWY ZAKOŃCZONY DNIA
31 GRUDNIA 2015 ROKU WEDŁUG MSSF UE
2
PKP CARGO GROUP
QUARTERLY CONDENSED CONSOLIDATED FINANCIAL STATEMENTS FOR THE PERIOD
OF 3 MONTHS ENDED 31 MARCH 2017, PREPARED IN ACCORDANCE WITH IFRS EU (IN PLN ‘000)
(translation of a document originally issued in Polish)
QUARTERLY CONSOLIDATED STATEMENT OF COMPREHENSIVE INCOME FOR THE PERIOD FROM 1 JANUARY 2017 TO 31 MARCH 2017
Note 3 months ended
31/03/2017 (unaudited)
3 months ended
31/03/2016 (restated*)
Revenue from sales of services and finished goods 6 1 077 580 1 014 043 Revenue from sales of merchandise and raw materials
9 920 8 757
Other operating revenue 8.1 12 701 11 554 Total operating revenue
1 100 201 1 034 354
Depreciation / amortization and impairment losses 7.1 143 841 142 359 Consumption of raw materials and energy 7.2 170 643 162 818 External services 7.3 372 006 366 568 Taxes and charges
10 310 7 026
Employee benefits 7.4 371 185 385 348 Other expenses by kind 7.5 13 056 11 563 Cost of merchandise and raw materials sold
7 396 8 336
Other operating expenses 8.2 8 588 12 144 Total operating expenses
1 097 025 1 096 162
Profit / (loss) on operating activities
3 176 (61 808)
Financial revenue 9.1 10 087 390 Financial expenses 9.2 15 184 14 559
Share in the profit / (loss) of equity accounted entities 13 2 019 1 364
Profit / (loss) before tax
98 (74 613)
Income tax 10.1 1 532 (8 235) NET PROFIT / (LOSS) (1 434) (66 378)
Other comprehensive income
Other comprehensive income that will be reclassified to profit or loss:
(17 040) 1 072
The effective portion of gains / (losses) on a cash flow hedging instrument
19 404 606
Income tax on other comprehensive income 10.3 (3 687) (115) Foreign exchange differences on translation of financial statements of foreign entities
(32 757) 581
Total other comprehensive income (17 040) 1 072
TOTAL COMPREHENSIVE INCOME (18 474) (65 306)
Net profit / (loss) attributable to: Shareholders of the parent company (1 434) (66 378) Total comprehensive income attributable to: Shareholders of the parent company (18 474) (65 306) Earnings per share (PLN per share) Basic earnings per share: 20.1 (0,03) (1,48) Diluted earnings per share: 20.2 (0,03) (1,48)
(*) restatement of comparatives described in Note 5 to these Quarterly Condensed Consolidated Financial Statements.

PKP CARGO S.A.
JEDNOSTKOWE SPRAWOZDANIE FINANSOWE ZA ROK OBROTOWY ZAKOŃCZONY DNIA
31 GRUDNIA 2015 ROKU WEDŁUG MSSF UE
3
PKP CARGO GROUP
QUARTERLY CONDENSED CONSOLIDATED FINANCIAL STATEMENTS FOR THE PERIOD
OF 3 MONTHS ENDED 31 MARCH 2017, PREPARED IN ACCORDANCE WITH IFRS EU (IN PLN ‘000)
(translation of a document originally issued in Polish)
QUARTERLY CONSOLIDATED STATEMENT OF FINANCIAL POSITION
PREPARED AS AT 31 MARCH 2017
Note
As at 31/03/2017
(unaudited)
As at 31/12/2016
(audited)
As at 31/03/2016 (restated*)
ASSETS Non-current assets Property, plant and equipment 11 4 594 168 4 700 550 4 763 797 Intangible assets
52 066 55 831 62 495
Investment properties 1 244 1 257 1 296 Investments accounted for under the equity method
13 41 988 40 810 41 204
Trade and other receivables 17 1 767 2 223 5 101 Other long-term financial assets 14 12 531 8 649 9 841 Other long-term non-financial assets 15 34 700 25 987 26 394
Deferred income tax assets 10.4 113 137 107 554 109 941
Total non-current assets 4 851 601 4 942 861 5 020 069
Current assets Inventories 16 125 238 121 189 130 799
Trade and other receivables 17 627 143 639 866 702 131
Income tax receivables
2 081 2 793 3 276 Other short-term financial assets 14 257 635 892 5 254 Other short-term non-financial assets 15 51 440 27 277 49 847 Cash and cash equivalents 18 447 674 755 919 137 900
1 511 211 1 547 936 1 029 207
Non-current assets classified as held for sale
-
- 43 210
Total non-current assets 1 511 211 1 547 936 1 072 417
Total assets 6 362 812 6 490 797 6 092 486
(*) restatement of comparatives described in Note 5 to these Quarterly Condensed Consolidated Financial Statements.
PKP CARGO S.A.
JEDNOSTKOWE SPRAWOZDANIE FINANSOWE ZA ROK OBROTOWY ZAKOŃCZONY DNIA
31 GRUDNIA 2015 ROKU WEDŁUG MSSF UE
4
PKP CARGO GROUP
QUARTERLY CONDENSED CONSOLIDATED FINANCIAL STATEMENTS FOR THE PERIOD
OF 3 MONTHS ENDED 31 MARCH 2017, PREPARED IN ACCORDANCE WITH IFRS EU (IN PLN ‘000)
(translation of a document originally issued in Polish)
QUARTERLY CONSOLIDATED STATEMENT OF FINANCIAL POSITION
PREPARED AS AT 31 MARCH 2017 (continued)
Note As at
31/03/2017 (unaudited)
As at 31/12/2016
(audited)
As at 31/03/2016 (restated*)
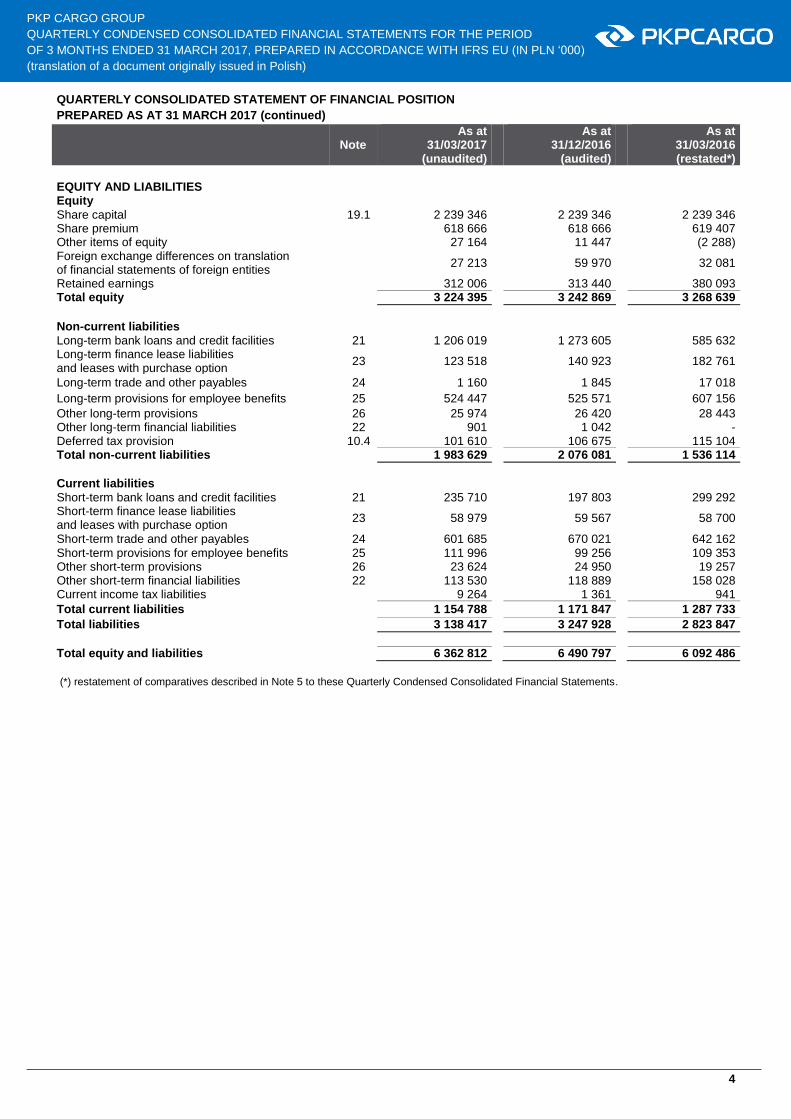
EQUITY AND LIABILITIES
Equity
Share capital 19.1 2 239 346 2 239 346 2 239 346 Share premium
618 666 618 666 619 407
Other items of equity
27 164 11 447 (2 288) Foreign exchange differences on translation of financial statements of foreign entities
27 213 59 970 32 081
Retained earnings
312 006 313 440 380 093 Total equity
3 224 395 3 242 869 3 268 639
Non-current liabilities
Long-term bank loans and credit facilities 21 1 206 019
1 273 605 585 632 Long-term finance lease liabilities and leases with purchase option
23 123 518
140 923 182 761
Long-term trade and other payables 24 1 160
1 845 17 018
Long-term provisions for employee benefits 25 524 447 525 571 607 156
Other long-term provisions 26 25 974
26 420 28 443 Other long-term financial liabilities 22 901
1 042 -
Deferred tax provision 10.4 101 610 106 675 115 104 Total non-current liabilities
1 983 629 2 076 081 1 536 114
Current liabilities
Short-term bank loans and credit facilities 21 235 710
197 803 299 292 Short-term finance lease liabilities and leases with purchase option
23 58 979
59 567 58 700
Short-term trade and other payables 24 601 685
670 021 642 162
Short-term provisions for employee benefits 25 111 996 99 256 109 353 Other short-term provisions 26 23 624
24 950 19 257
Other short-term financial liabilities 22 113 530
118 889 158 028 Current income tax liabilities
9 264
1 361 941
Total current liabilities
1 154 788 1 171 847 1 287 733
Total liabilities
3 138 417 3 247 928 2 823 847
Total equity and liabilities
6 362 812 6 490 797 6 092 486
(*) restatement of comparatives described in Note 5 to these Quarterly Condensed Consolidated Financial Statements.
5
Grupa Kapitałowa PKP CARGO Sródroczne Skrócone Skonsolidowane Sprawozdanie Finansowe za okres 6 miesięcy zakończony dnia 30 czerwca 2015 roku sporządzone według MSSF UE
PKP CARGO GROUP
QUARTERLY CONDENSED CONSOLIDATED FINANCIAL STATEMENTS FOR THE PERIOD
OF 3 MONTHS ENDED 31 MARCH 2017, PREPARED IN ACCORDANCE WITH IFRS EU (IN PLN ‘000)
(translation of a document originally issued in Polish)
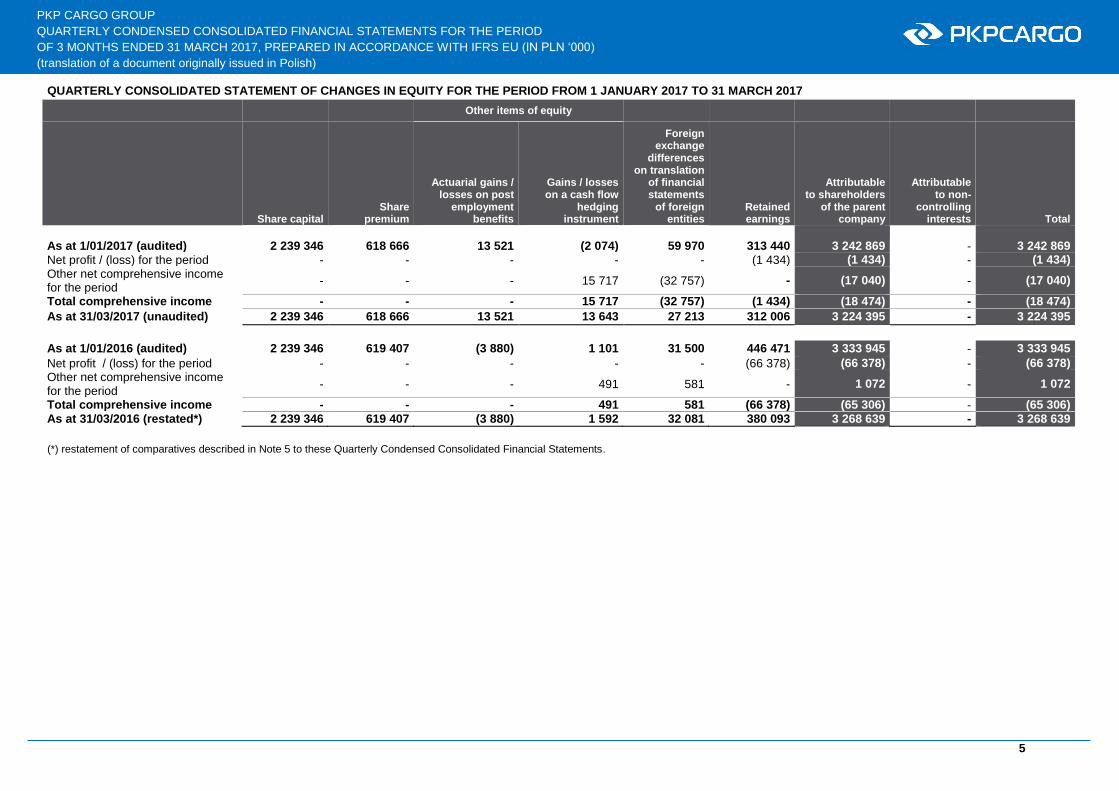
QUARTERLY CONSOLIDATED STATEMENT OF CHANGES IN EQUITY FOR THE PERIOD FROM 1 JANUARY 2017 TO 31 MARCH 2017
Other items of equity
Share capital Share
premium
Actuarial gains / losses on post
employment benefits
Gains / losses on a cash flow
hedging instrument
Foreign exchange
differences on translation
of financial statements
of foreign entities
Retained earnings
Attributable to shareholders
of the parent company
Attributable to non-
controlling interests Total
As at 1/01/2017 (audited) 2 239 346 618 666 13 521 (2 074) 59 970 313 440 3 242 869 - 3 242 869
Net profit / (loss) for the period - - - - - (1 434) (1 434) - (1 434)
Other net comprehensive income for the period
- - - 15 717 (32 757) - (17 040) - (17 040)
Total comprehensive income - - - 15 717 (32 757) (1 434) (18 474) - (18 474)
As at 31/03/2017 (unaudited) 2 239 346 618 666 13 521 13 643 27 213 312 006 3 224 395 - 3 224 395
As at 1/01/2016 (audited) 2 239 346 619 407 (3 880) 1 101 31 500 446 471 3 333 945 - 3 333 945
Net profit / (loss) for the period - - - - - (66 378) (66 378) - (66 378)
Other net comprehensive income for the period
- - - 491 581 - 1 072 - 1 072
Total comprehensive income - - - 491 581 (66 378) (65 306) - (65 306)
As at 31/03/2016 (restated*) 2 239 346 619 407 (3 880) 1 592 32 081 380 093 3 268 639 - 3 268 639
(*) restatement of comparatives described in Note 5 to these Quarterly Condensed Consolidated Financial Statements.

6
PKP CARGO GROUP
QUARTERLY CONDENSED CONSOLIDATED FINANCIAL STATEMENTS FOR THE PERIOD
OF 3 MONTHS ENDED 31 MARCH 2017, PREPARED IN ACCORDANCE WITH IFRS EU (IN PLN ‘000)
(translation of a document originally issued in Polish)
QUARTERLY CONSOLIDATED STATEMENT OF CASH FLOWS
FOR THE PERIOD FROM 1 JANUARY 2017 TO 31 MARCH 2017 (INDIRECT METHOD)
Cash flows from investing activities
Acquisition of property, plant and equipment and intangible assets
(118 436) (175 047)
Proceeds from sale of property, plant and equipment, intangible assets and non-current assets classified as held for sale
7 854 4 117
Interest received
1 092 316 Dividends received
600 -
Granted loans (120) - Repayment of loans granted
- 125
Outflows from bank deposits over 3 months (250 000) - Net cash provided by investing activities
(359 010) (170 489)
Cash flows from financing activities
Payments of liabilities under finance lease
(12 610) (20 245) Payments of interest under lease agreement 9.2 (1 580) (2 332) Proceeds from credit facilities / loans received 21.1 80 181 199 347 Repayment of credit facilities / loans received 21.1 (94 422) (28 823) Interest paid on credit facilities / loans received
(7 456) (3 972)
Grants received
- 1 627 Other outflows from financing activities
(313) (968)
Net cash provided by financing activities
(36 200) 144 634
Net increase / (decrease) in cash and cash equivalents
(302 572) (138 291) Opening balance of cash and cash equivalents 18 755 919 276 191 Effect of changes in foreign exchange rates on cash balances in foreign currencies
(5 673) -
Closing balance of cash and cash equivalents 18 447 674 137 900
(*) restatement of comparatives described in Note 5 to these Quarterly Condensed Consolidated Financial Statements.
Note 3 months ended
31/03/2017 (unaudited)
3 months ended 31/03/2016 (restated*)
Cash flows from operating activities
Profit / (loss) before tax 98 (74 613) Adjustments:
Depreciation of property, plant and equipment and amortization of intangible assets
7.1 143 841
141 891
Impairment loss on non-current assets 7.1 - 468 (Gain) / loss on disposal / liquidation of property, plant and equipment, intangible assets and non-current assets classified as held for sale
(5 215)
(806)
(Gain) / loss on investing activities
-
- Foreign exchange (gain) / loss
(2 819)
(2 392)
(Gain) / loss on interest, dividends
7 445
7 383 Share in (profit) / loss of equity accounted entities 13 (2 019) (1 364) Interest received / (paid) 491 (161) Income tax received / (paid) (2 410) (3 663) Other adjustments 9 589
736
Changes in working capital: (Increase) / decrease in trade and other receivables 12 639
(49 805)
(Increase) / decrease in inventories 6 269
(1 806) (Increase) / decrease in other assets (33 212)
(36 331)
Increase / (decrease) in trade and other payables (46 403)
(106 092)
Increase / (decrease) in other financial liabilities (5 500)
656
Increase / (decrease) in provisions 9 844
13 463 Net cash provided by operating activities 92 638
(112 436)

7
PKP CARGO GROUP
QUARTERLY CONDENSED CONSOLIDATED FINANCIAL STATEMENTS FOR THE PERIOD
OF 3 MONTHS ENDED 31 MARCH 2017, PREPARED IN ACCORDANCE WITH IFRS EU (IN PLN ‘000)
(translation of a document originally issued in Polish)
EXPLANATORY NOTES TO THE QUARTERLY CONDENSED CONSOLIDATED FINANCIAL STATEMENTS PREPARED AS AT 31 MARCH 2017
1. General information
1.1 Information about the Parent Company
PKP CARGO S.A. ("the Company", “the Parent Company”) was formed based on a notarial deed dated 29 June 2001
(Repertory A No. 1287/2001). The Parent Company’s registered office is located in Warsaw at ul. Grójecka 17. The Parent
Company was registered with the National Court Register at the District Court in Katowice, Business Division of the National
Court Register, in number KRS 0000027702. At present, due to a subsequent change in the Parent Company’s registered
office, the Parent Company’s records are kept by the Registration Court for the Capital City of Warsaw, XII Business Division
of the National Court Register. The Parent Company has been assigned statistical identification number REGON 277586360,
as well as tax identification number NIP 954-23-81-960.
The financial year of the Parent Company and of the companies comprising the PKP CARGO Group is the calendar year.
At the preparation of these Quarterly Condensed Consolidated Financial Statements, the Parent Company’s management
and supervisory organs comprised:
Management Board:
Maciej Libiszewski - President of the Management Board
Arkadiusz Olewnik - Member of the Management Board in charge of Finances
Jarosław Klasa - Member of the Management Board in charge of Operations
Grzegorz Fingas - Member of the Management Board in charge of Sales
Zenon Kozendra - Member of the Management Board – Employee Representative
Supervisory Board:
Krzysztof Mamiński - Chairman of the Supervisory Board
Andrzej Wach - Vice-Chairman of the Supervisory Board
Raimondo Eggink - Member of the Supervisory Board
Czesław Warsewicz - Member of the Supervisory Board
Małgorzata Kryszkiewicz - Member of the Supervisory Board
Zofia Dzik - Member of the Supervisory Board
Marek Podskalny - Member of the Supervisory Board
Krzysztof Czarnota - Member of the Supervisory Board
Tadeusz Stachaczyński - Member of the Supervisory Board
Władysław Szczepkowski - Member of the Supervisory Board
On 6 March 2017 Mirosław Pawłowski resigned from the position of Chairman of the Supervisory Board effective immediately. The same day the Parent Company’s shareholder - PKP S.A., appointed Krzysztof Mamiński to the position of Member of the Parent Company’s Supervisory Board. On 14 March 2017 Jerzy Kleniewski resigned from the position of Member of the Parent Company’s Supervisory Board effective immediately. On 14 March 2017 the Parent Company’s shareholder - PKP S.A., appointed Władysław Szczepkowski to the position of Member of the Parent Company’s Supervisory Board. On 20 March 2017 the Parent Company’s Supervisory Board passed a resolution to appoint Krzysztof Mamiński to the position of Chairman of the Parent Company’s Supervisory Board.

8
PKP CARGO GROUP
QUARTERLY CONDENSED CONSOLIDATED FINANCIAL STATEMENTS FOR THE PERIOD
OF 3 MONTHS ENDED 31 MARCH 2017, PREPARED IN ACCORDANCE WITH IFRS EU (IN PLN ‘000)
(translation of a document originally issued in Polish)
1.1 Information about the Parent Company (continued)
The Parent Company’s shareholders as at 31 March 2017 was as follows:
Entity
Registered office
Number of shares
% of share capital
% of voting rights
PKP S.A.(1) Warsaw 14 784 194 33,01% 33,01% Nationale-Nederlanden OFE (2) Warsaw 6 854 195 15,30% 15,30%
MetLife OFE (3) Warsaw 2 494 938 5,57% 5,57%
Aviva OFE (4)
Warsaw 2 338 371 5,22% 5,22%
TFI PZU S.A. (5) Warsaw 2 302 843 5,14% 5,14%
Other shareholders
16 012 376 35,76% 35,76%
Total
44 786 917 100,00% 100,00%
(1) As per notice sent by shareholder on 24 June 2014. (2) As per notice sent by shareholder on 18 October 2016. (3) As per notice sent by shareholder on 18 August 2016. (4) As per notice sent by shareholder on 13 August 2014. (5) As per notice sent by shareholder on 27 March 2017.
On 27 March 2017 the Parent Company’s Management Board was notified by Towarzystwo Funduszy Investycyjnych PZU S.A.
(“TFI PZU”) that TFI PZU has acquired the Parent Company’s shares in transactions performed on the Warsaw Stock Exchange
on 21 March 2017. As a result of the transactions, TFI PZU increased its interest in the Parent Company to 2.302.843 shares,
or 5,14% of the share capital and of the total number of votes at the Parent Company’s general meeting.
The company PKP S.A. is the parent company of PKP CARGO S.A. In accordance with the Parent Company’s statute,
PKP S.A. holds special personal entitlements, consisting of a right to appoint and dismiss Members of the Supervisory Board
at a number equal to half of the Supervisory Board plus one. PKP S.A. holds a personal entitlement to appoint the chair
of the Supervisory Board, as well as to set the number of Members of the Supervisory Board. In addition, if the percent
of the Parent Company’s share capital held by PKP S.A. equals to 50% or less, PKP S.A. holds a personal entitlement to solely
designate candidates for the position of President of the Parent Company’s Management Board. PKP S.A. holds these personal
entitlements whenever it owns at least 25% of the Parent Company’s share capital.
1.2 Information about the Group
As at the balance sheet date the PKP CARGO Group (hereinafter referred to as the Group) comprises PKP CARGO S.A.
as the parent company and 28 subsidiary companies. In addition, the Group has 6 associated companies and shares in 4 joint
ventures.
Additional information about the subsidiaries is presented in Note 12 to these Quarterly Condensed Consolidated Financial
Statements.
The Group’s main area of activity is the rail transport of freight. In addition to the rail transport of freight, the Group provides
the following services:
a) intermodal services,
b) shipping services (domestic and international),
c) terminal services,
d) siding and track line services,
e) rolling stock maintenance and repair services,
f) reclamation services.
The duration of the companies comprising the Group is not limited, with the exception of companies in liquidation.

9
PKP CARGO GROUP
QUARTERLY CONDENSED CONSOLIDATED FINANCIAL STATEMENTS FOR THE PERIOD
OF 3 MONTHS ENDED 31 MARCH 2017, PREPARED IN ACCORDANCE WITH IFRS EU (IN PLN ‘000)
(translation of a document originally issued in Polish)
2. Basis for the preparation of the Quarterly Condensed Consolidated Financial Statements
These Quarterly Condensed Consolidated Financial Statements have been prepared in accordance with International
Accounting Standard (IAS) 34 – Interim Financial Reporting ("IAS 34") and in accordance with the accounting standards
applicable to interim financial reporting endorsed by the European Union (“IFRS EU’), published and binding during
the preparation of these Quarterly Condensed Consolidated Financial Statements, and in accordance with the Minister’s
of Finance Decree of 19 February 2009 on the current and periodic information submitted by the issuers of securities and the
conditions for recognizing as equally valid the information required by the regulations of a state that is not a member state
(2014 Journal of Laws, item 133 with subsequent amendments) (“the Decree”).
These Quarterly Condensed Consolidated Financial Statements should be read in conjunction with the audited Consolidated
Financial Statements of the PKP CARGO Group for the financial year ended 31 December 2016, prepared in accordance
with IFRS EU.
These Quarterly Condensed Consolidated Financial Statements have been prepared on a going concern basis. At the
preparation of these Quarterly Condensed Consolidated Financial Statements no circumstances existed indicating a threat
to the Group’s ability to continue as a going concern for at least 12 months of the date of the financial statements.
These Quarterly Condensed Consolidated Financial Statements have been prepared on a historical cost basis, with the
exception of derivative financial instruments measured at fair value and liabilities relating to put options for non-controlling
interests.
These Quarterly Condensed Consolidated Financial Statements consist of a consolidated statement of comprehensive income,
consolidated statement of financial position, consolidated statement of changes in equity, consolidated statement of cash flows
and selected notes to the financial statements.
These Quarterly Condensed Consolidated Financial Statements were approved for publication by the Parent Company’s
Management Board on 25 May 2017.
3. Basis for the application of International Financial Reporting Standards
3.1 Standards and interpretations adopted by IASB and endorsed by the EU, but not yet effective
When approving these Quarterly Consolidated Financial Statements the Group did not apply the following standards,
amendments to standards and interpretations, which have been issued by the International Accounting Standards Board (IASB)
and endorsed by the European Union, but have not yet become effective:
IFRS 15 "Revenue from Contracts with Customers" – applies to annual periods beginning on and after 1 January 2018.
This standard specifies how and when to recognize revenue, and calls for more detailed disclosures. The standard replaces
IAS 18 Revenue, IAS 11 Construction Contracts and several interpretations relating to recognition of revenue.
The new standard requires the disclosure in the financial statements of much more information on the nature, amount,
distribution in time and uncertainty with regard to revenue and cash flows from contracts with customers.
Clarifications to IFRS 15 "Revenue from Contracts with Customers" – apply to annual periods beginning or and after
1 January 2018.
IFRS 9 "Financial Instruments" – applies to periods beginning on and after 1 January 2018. IFRS 9 introduces
an approach to the classification and valuation of financial assets that reflects the business model in which they
are managed and the nature of the cash flows. IFRS 9 introduces a new model of impairment testing, which will require
a more timely recognition of anticipated credit losses. The new model will also result in the introduction of a standardized
approach to impairment tests used on all financial instruments. In addition, IFRS 9 introduces a new model of hedge
accounting, requiring extensive risk management disclosures. The changes are meant to adapt the methods used
to recognize risk management matters in the financial statements, to allow entities to better reflect their actions
in the financial statements.
The Group is analyzing the effect on its accounting policies of the published IFRS 9 “Financial Instruments” and IFRS 15
“Revenue from Contracts with Customers”. Our initial analysis of the effect of IFRS 9 on the existing accounting methods
indicates that the new standard will mainly affect the extent of disclosures and the presentation of financial instruments
in the Group’s financial statements. In addition, the above analysis has shown that the new approach to the impairment
of financial instruments model (in the case of the Group it will pertain primarily to trade receivables) will have no material effect
on the amount of impairment and most likely implementation of IFRS 9 in this area will not require adjustments of prior periods.
In the case of IFRS 15, the Group is performing analyses of the effect of variable consideration on sales revenue generated
in different reporting periods. The Group is working on identifying contracts with elements of variable consideration
and on developing a method to estimate the consideration due to the entity in the given reporting period. At this stage
we are not yet able to determine the effect of the new standard on the Group’s financial statements.

10
PKP CARGO GROUP
QUARTERLY CONDENSED CONSOLIDATED FINANCIAL STATEMENTS FOR THE PERIOD
OF 3 MONTHS ENDED 31 MARCH 2017, PREPARED IN ACCORDANCE WITH IFRS EU (IN PLN ‘000)
(translation of a document originally issued in Polish)
3.2 Standards and interpretations adopted by IASB, but not yet endorsed by the EU and not effective
At present the IFRS endorsed by the EU do not differ significantly from the regulations adopted by the International Accounting
Standards Board (IASB), with the exception of the following standards, amendments to standards and interpretations, which
as at 31 March 2017 had not yet been endorsed by the EU and were not effective:
IFRS 16 "Leases" – applicable to annual periods beginning or and after 1 January 2019. In accordance with IFRS 16,
a lessee recognizes the right to use an asset and the liability arising out of the lease agreement. The right to use an asset is
treated similarly to other non-financial assets and amortized accordingly. The liability is initially recognized at the present
value of the lease fees payable during the term of the lease, discounted by the rate contained in the lease, if its
determination is not difficult. If it is not easy to determine the rate, then the lessee applies the marginal interest rate.
Amendments to IAS 7 "Statement of Cash Flows” entitled Disclosure Initiative – applicable to periods beginning
on 1 January 2017. The amendments introduce the requirement to include in the financial statements a disclosure that will
allow the users of the financial statements to evaluate changes in liabilities arising out of financial activities, including
changes arising out of cash flows and cashless changes. One of the methods of fulfilling this requirement is to present
a reconciliation of debt balances broken down by type of change.
Amendments to IAS 12 "Income Taxes” entitled Recognition of Deferred Tax Assets for Unrealized Losses – applicable
to periods beginning on 1 January 2017. The amendments clarify the need to form deferred tax assets on losses
on the valuation of financial instruments classified as available for sale. In particular, the change pertains to debt
instruments, for which the entity should consider the existence of evidence that it is likely that it will realize the financial
instrument for an amount higher than its balance sheet value.
Amendments to IFRS 2 "Share-based Payment" entitled Classification and Measurement of Share-based Payment
Transactions – applicable to periods beginning on 1 January 2018. The change to IFRS 2 clarifies that the “fair value”
of share based payments settled in cash should be determined in the same manner as in the case of payments settled
in equity instruments. The change has introduced a requirement to adjust the liability by considering each change in its value
in the financial result before reclassifying from liabilities to equity. The cost recognized after the modification is based on the
fair value at the date of modification. The change introduced an exception where the payment of funds to a tax office
is treated as a settlement in equity instruments. The entity should disclose the estimated amount it expects to pay as tax
to the tax office. At initial application, reclassification of liabilities to equity will have no effect on the financial result.
Amendments to IFRS 4 "Insurance Contracts" entitled Applying IFRS 9 “Financial Instruments” with IFRS 4 “Insurance
Contracts” – applicable to periods beginning on 1 January 2018. The changes address the matter of applying the new IFRS
9 “Financial Instruments” prior to the implementation of the new standard relating to insurance activities, on which IASB
is currently working.
Amendments to International Financial Reporting Standards 2014-2016 (annual improvements to IFRS 2014 - 2016
contain amendments to IFRS 1 – deletion of short-term exemptions, IFRS 12 – clarification of the scope of the standard,
and IAS 28 – measuring associates or joint ventures at fair value, with corresponding amendments to other standards
and interpretations) – apply to periods beginning on or after 1 January 2018.
Interpretation IFRIC 22 entitled Foreign Currency Transactions and Advance Consideration – applicable to periods
beginning 1 January 2018. The interpretation clarifies the recognition of transactions that include the receipt or payment
of advance consideration in a foreign currency.
Amendments to IAS 40 "Investment Property" entitled Transfers of Investment Property – applicable to periods beginning
on 1 January 2018. The amendments discuss whether an investment property under construction should be transferred
from inventories to investment properties in the event of a clear change in its use.
The Group is analyzing the effect on its accounting policies of the published IFRS 16 “Leases” and IFRIC 22 “Foreign Currency
Transactions and Advance Consideration”. Our initial analysis of the effect of IFRS 16 on the existing accounting methods
indicates that the Group will have to recognize retrospectively its significant lease liabilities and asset items (mainly land,
buildings and constructions), which are currently covered by long-term operating lease or rental agreements. The Group
is currently in the process of identifying the agreements that are subject to the new requirements and of developing preliminary
models for the valuation and recognition of the above agreements in the financial statements. At this stage it is not possible
to quantify the effect of IFRS 16 on the Group’s financial statements. The Group has analyzed the potential effect of the other
above-listed standards, interpretations and amendments to standards on its accounting policies. In the opinion of the Parent
Company’s Management Board, they will have no material effect on the existing accounting policies.
11
PKP CARGO GROUP
QUARTERLY CONDENSED CONSOLIDATED FINANCIAL STATEMENTS FOR THE PERIOD
OF 3 MONTHS ENDED 31 MARCH 2017, PREPARED IN ACCORDANCE WITH IFRS EU (IN PLN ‘000)
(translation of a document originally issued in Polish)
4. Accounting policies and material values based on professional judgement and estimates
4.1 Statement on accounting policies
The accounting policies and calculation methods used in the preparation of these Quarterly Condensed Consolidated Financial
Statements are consistent with the policies described in the audited Consolidated Financial Statements of the PKP CARGO
Group for the financial year ended 31 December 2016, prepared in accordance with IFRS EU (see Note 5 to the Consolidated
Financial Statements of the PKP CARGO Group for the financial year ended 31 December 2016, prepared in accordance
with IFRS EU).
4.2 Material values based on professional judgement and estimates
In the period of 3 months ended 31 March 2017 no changes were made in methodology or assumptions adopted by the Parent
Company’s Management Board when making estimates, with an significant effect on the current or future periods.
4.3 Information on the seasonal or cyclical nature of the Group’s interim operations
The Group’s operations show no significant seasonal or cyclical trends.
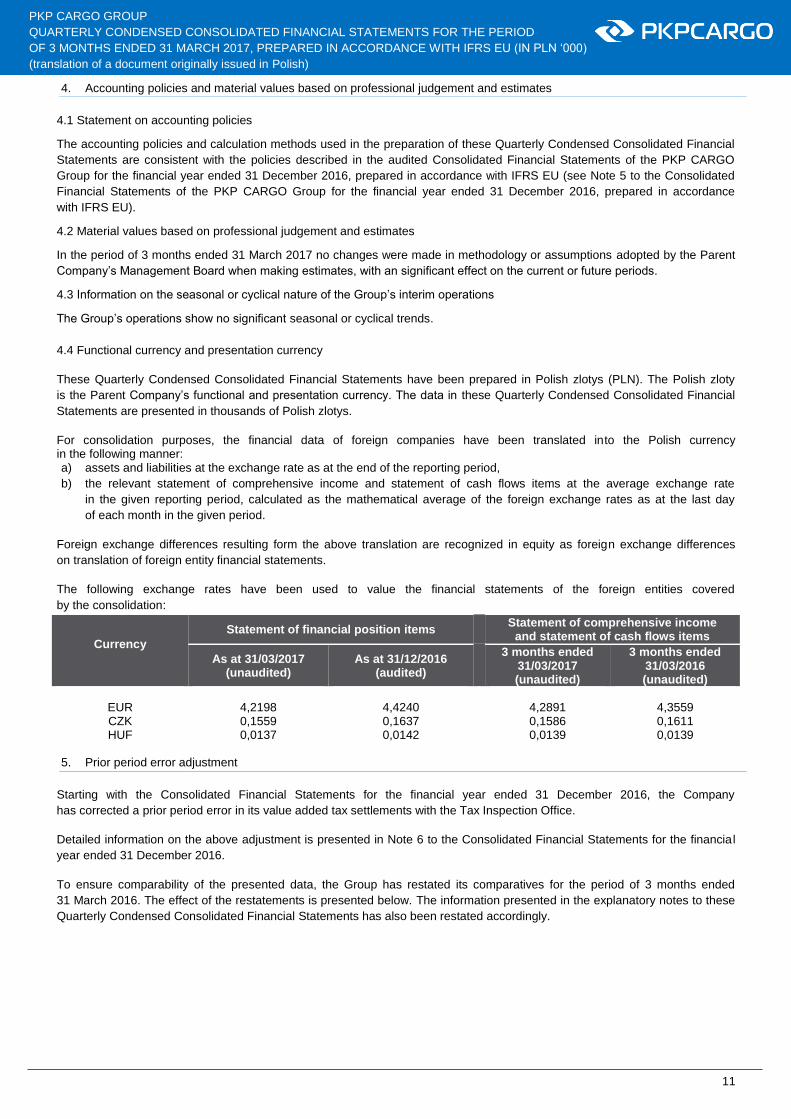
4.4 Functional currency and presentation currency
These Quarterly Condensed Consolidated Financial Statements have been prepared in Polish zlotys (PLN). The Polish zloty
is the Parent Company’s functional and presentation currency. The data in these Quarterly Condensed Consolidated Financial
Statements are presented in thousands of Polish zlotys.
For consolidation purposes, the financial data of foreign companies have been translated into the Polish currency in the following manner: a) assets and liabilities at the exchange rate as at the end of the reporting period,
b) the relevant statement of comprehensive income and statement of cash flows items at the average exchange rate
in the given reporting period, calculated as the mathematical average of the foreign exchange rates as at the last day
of each month in the given period.
Foreign exchange differences resulting form the above translation are recognized in equity as foreign exchange differences
on translation of foreign entity financial statements.
The following exchange rates have been used to value the financial statements of the foreign entities covered
by the consolidation:
Currency
Statement of financial position items Statement of comprehensive income
and statement of cash flows items
As at 31/03/2017 (unaudited)
As at 31/12/2016 (audited)
3 months ended 31/03/2017 (unaudited)
3 months ended 31/03/2016 (unaudited)
EUR 4,2198 4,4240 4,2891 4,3559 CZK 0,1559 0,1637 0,1586 0,1611 HUF 0,0137 0,0142 0,0139 0,0139
5. Prior period error adjustment
Starting with the Consolidated Financial Statements for the financial year ended 31 December 2016, the Company
has corrected a prior period error in its value added tax settlements with the Tax Inspection Office.
Detailed information on the above adjustment is presented in Note 6 to the Consolidated Financial Statements for the financial
year ended 31 December 2016.
To ensure comparability of the presented data, the Group has restated its comparatives for the period of 3 months ended
31 March 2016. The effect of the restatements is presented below. The information presented in the explanatory notes to these
Quarterly Condensed Consolidated Financial Statements has also been restated accordingly.

12
PKP CARGO GROUP
QUARTERLY CONDENSED CONSOLIDATED FINANCIAL STATEMENTS FOR THE PERIOD
OF 3 MONTHS ENDED 31 MARCH 2017, PREPARED IN ACCORDANCE WITH IFRS EU (IN PLN ‘000)
(translation of a document originally issued in Polish)
5. Prior period error adjustment (continued)
QUARTERLY CONSOLIDATED STATEMENT OF COMPREHENSIVE INCOME
FOR THE PERIOD FROM 1 JANUARY 2016 TO 31 MARCH 2016
3 months ended 31/03/2016
(unaudited)
Adjustment of value added tax
settlements
3 months ended 31/03/2016 (restated)
Financial expenses 14 228 331 14 559
Profit / (loss) before tax (74 282) (331) (74 613)
NET PROFIT / (LOSS) (66 047) (331) (66 378)
TOTAL COMPREHENSIVE INCOME (64 975) (331) (65 306)
Net profit / (loss) attributable to:
Shareholders of the parent company (66 047) (331) (66 378) Total comprehensive income attributable to:
Shareholders of the parent company (64 975) (331) (65 306) Earnings per share (PLN per share)
Basic earnings per share: (1,47) (0,01) (1,48)
Diluted earnings per share: (1,47) (0,01) (1,48)
QUARTERLY CONSOLIDATED STATEMENT OF FINANCIAL POSITION AS AT 31 MARCH 2016
As at
31/032016 (unaudited)
Adjustment of value added tax
settlements
As at 31/03/2016 (restated)
ASSETS Current assets Trade and other receivables 713 399 (11 268) 702 131 Total current assets 1 083 685 (11 268) 1 072 417
Total assets 6 103 754 (11 268) 6 092 486
EQUITY AND LIABILITIES Equity Retained earnings 400 345 (20 252) 380 093 Total equity 3 288 891 (20 252) 3 268 639
Current liabilities Short-term trade and other payables 633 178 8 984 642 162 Total current liabilities 1 278 749 8 984 1 287 733
Total liabilities 2 814 863 8 984 2 823 847
Total equity and liabilities 6 103 754 (11 268) 6 092 486
QUARTERLY CONSOLIDATED STATEMENT OF CASH FLOWS FOR THE PERIOD FROM 1 JANUARY 2016 TO 31 MARCH 2016 [INDIRECT METHOD]
3 months ended 31/03/2016
(unaudited)
Adjustment of value added tax
settlements
3 months ended 31/03/2016 (restated)
Cash flows from operating activities
Profit / (loss) before tax (74 282) (331) (74 613) Changes in working capital: (Increase) / decrease in trade and other receivables (50 868) 1 063 (49 805) Increase / (decrease) in trade and other payables (105 360) (732) (106 092) Net cash provided by operating activities (112 436) - (112 436)
Increase / (decrease) in net cash and cash equivalents
(138 291) - (138 291)
Opening balance of cash and cash equivalents 276 191 - 276 191 Closing balance of cash and cash equivalents 137 900 - 137 900

13
PKP CARGO GROUP
QUARTERLY CONDENSED CONSOLIDATED FINANCIAL STATEMENTS FOR THE PERIOD
OF 3 MONTHS ENDED 31 MARCH 2017, PREPARED IN ACCORDANCE WITH IFRS EU (IN PLN ‘000)
(translation of a document originally issued in Polish)
6. Revenue from the sale of services and finished goods
6.1 Operating segment products and services
The Group does not distinguish operating segments, as it has only one main product that all of its services are assigned
to. The Group conducts operations as part of one main segment – domestic and international transport of freight and the
provision of comprehensive logistics services relating to rail transport of freight. The Parent Company’s Management analyzes
the Group’s financial data in the format, in which they are presented in these Quarterly Condensed Consolidated Financial
Statements of the PKP CARGO Group. In addition, the Group also provides rolling stock repair and land reclamation services,
which are not, however, significant from the perspective of the Group’s operations and as such are not treated as separate
operating segments.
The Group’s revenue from its customers broken down by geographical area is presented in Note 6.2 to these Quarterly
Condensed Consolidated Financial Statements.
6.2 Geographical information
The Group defines a geographical area of operations as the location of the registered office of its customer rather than
the country in which the service is performed. The Group’s main geographical area of operations is Poland.
Presented below is the Group’s revenue from the sale of services and finished goods to customers, broken down by location of their headquarter :
3 months ended
31/03/2017 (unaudited)
3 months ended
31/03/2016 (unaudited)
Poland 738 061 701 660 Czech Republic 148 815 176 171 Germany 57 573 37 108 Slovakia 27 298 14 982 Italy 25 131 13 970 France 14 732 18 057 Other countries 65 970 52 095 Total 1 077 580 1 014 043
Non-current assets other than financial instruments and deferred income tax assets, broken down by location:
As at
31/03/2017 (unaudited)
As at
31/12/2016 (audited)
Poland 3 924 985 3 971 390 Czech Republic 785 942 840 775 Other countries 13 239 12 270 Total 4 724 166 4 824 435
6.3 Structure of revenue from the sale of services and finished goods
As part of its operations, the Group distinguishes groups of services, as shown in this Note. The Parent Company’s
Management does not, however, take this division into account when assessing the Group’s performance or making decisions
on the allocation of resources to the groups of services. Accordingly, the groups of services shown below are not to be treated
as the Group’s operating segments.
3 months ended
31/03/2017 (unaudited)
3 months ended
31/03/2016 (unaudited)
Transport revenue and railway shipping 909 305 840 685 Revenue from other transport activities 39 407 38 808 Siding and traction revenue 60 803 66 169 Cargo revenue 19 091 22 847 Reclamation services 16 218 13 243 Other revenue (1) 32 756 32 291 Total 1 077 580 1 014 043
14
PKP CARGO GROUP
QUARTERLY CONDENSED CONSOLIDATED FINANCIAL STATEMENTS FOR THE PERIOD
OF 3 MONTHS ENDED 31 MARCH 2017, PREPARED IN ACCORDANCE WITH IFRS EU (IN PLN ‘000)
(translation of a document originally issued in Polish)
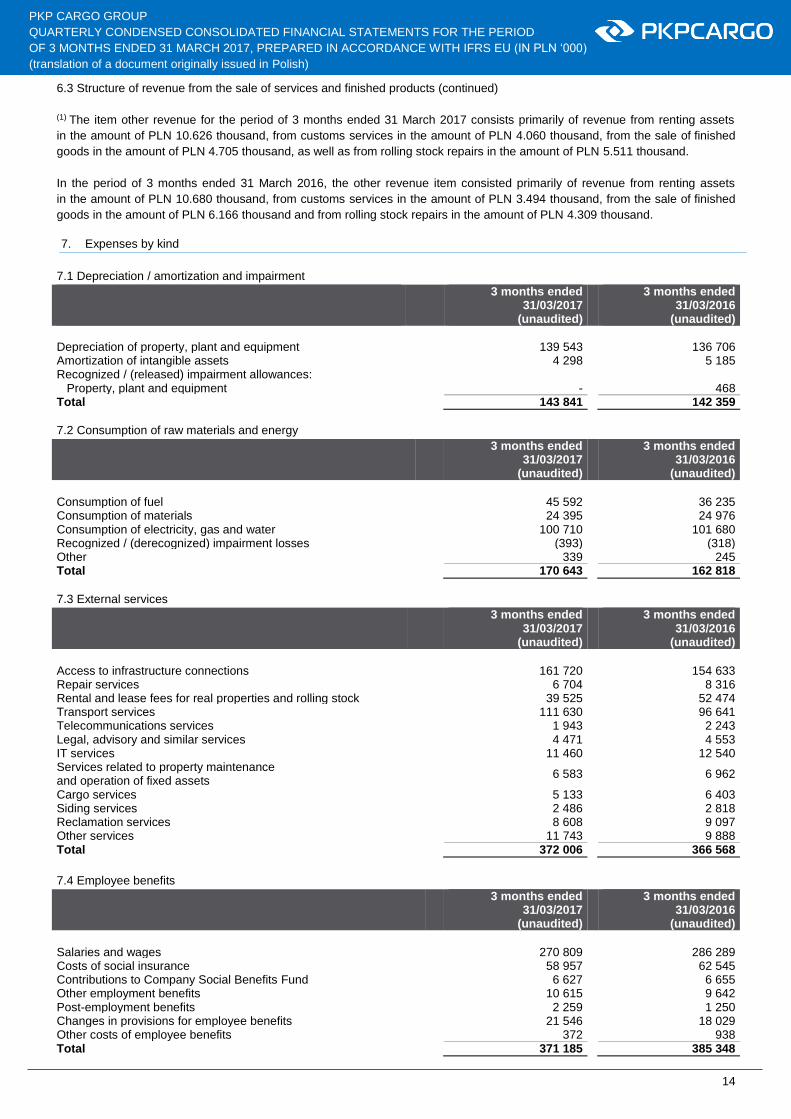
6.3 Structure of revenue from the sale of services and finished products (continued)
(1) The item other revenue for the period of 3 months ended 31 March 2017 consists primarily of revenue from renting assets
in the amount of PLN 10.626 thousand, from customs services in the amount of PLN 4.060 thousand, from the sale of finished
goods in the amount of PLN 4.705 thousand, as well as from rolling stock repairs in the amount of PLN 5.511 thousand.
In the period of 3 months ended 31 March 2016, the other revenue item consisted primarily of revenue from renting assets
in the amount of PLN 10.680 thousand, from customs services in the amount of PLN 3.494 thousand, from the sale of finished
goods in the amount of PLN 6.166 thousand and from rolling stock repairs in the amount of PLN 4.309 thousand.
7. Expenses by kind
7.1 Depreciation / amortization and impairment
3 months ended
31/03/2017 (unaudited)
3 months ended
31/03/2016 (unaudited)
Depreciation of property, plant and equipment 139 543 136 706 Amortization of intangible assets 4 298 5 185 Recognized / (released) impairment allowances: Property, plant and equipment - 468 Total 143 841 142 359
7.2 Consumption of raw materials and energy
3 months ended
31/03/2017 (unaudited)
3 months ended
31/03/2016 (unaudited)
Consumption of fuel 45 592 36 235 Consumption of materials 24 395 24 976 Consumption of electricity, gas and water 100 710 101 680 Recognized / (derecognized) impairment losses (393) (318) Other 339 245 Total 170 643 162 818
7.3 External services
3 months ended
31/03/2017 (unaudited)
3 months ended
31/03/2016 (unaudited)
Access to infrastructure connections 161 720 154 633 Repair services 6 704 8 316 Rental and lease fees for real properties and rolling stock 39 525 52 474 Transport services 111 630 96 641 Telecommunications services 1 943 2 243 Legal, advisory and similar services 4 471 4 553 IT services 11 460 12 540 Services related to property maintenance and operation of fixed assets
6 583 6 962
Cargo services 5 133 6 403 Siding services 2 486 2 818 Reclamation services 8 608 9 097 Other services 11 743 9 888 Total 372 006 366 568
7.4 Employee benefits
3 months ended
31/03/2017 (unaudited)
3 months ended
31/03/2016 (unaudited)
Salaries and wages 270 809 286 289 Costs of social insurance 58 957 62 545 Contributions to Company Social Benefits Fund 6 627 6 655 Other employment benefits 10 615 9 642 Post-employment benefits 2 259 1 250 Changes in provisions for employee benefits 21 546 18 029 Other costs of employee benefits 372 938 Total 371 185 385 348

15
PKP CARGO GROUP
QUARTERLY CONDENSED CONSOLIDATED FINANCIAL STATEMENTS FOR THE PERIOD
OF 3 MONTHS ENDED 31 MARCH 2017, PREPARED IN ACCORDANCE WITH IFRS EU (IN PLN ‘000)
(translation of a document originally issued in Polish)
7.5 Other expenses by kind
3 months ended
31/03/2017 (unaudited)
3 months ended
31/03/2016 (unaudited)
Business travel 7 538 7 695 Insurance 3 224 3 033 Other 2 294 835 Total 13 056 11 563
8. Other operating revenue and expenses
8.1 Other operating revenue
3 months ended
31/03/2017 (unaudited)
3 months ended
31/03/2016 (unaudited)
Gains on disposal
Gain on the sale of non-financial assets 6 186 1 150 Derecognized impairment losses
Trade receivables 1 129 221 Other receivables 5 6
1 134 227 Other
Penalties and damage compensation 3 510 4 405 Release of provision for fine from UOKiK
- 357
Release of other provisions
692 1 241 Interest on trade and other receivables
554 234
Net results on foreign exchange on trade receivables and trade payables
- 3 140
Grants 141 124 Other 484 676 Total 12 701 11 554
8.2 Other operating expenses
3 months ended 31/03/2017
(unaudited)
3 months ended 31/03/2016
(unaudited)
Recognized impairment losses
Trade receivables
785 3 995 Other receivables - 25
785 4 020 Other
Penalties and damage compensation 1 963 2 481 Costs of liquidating non-current and current assets
738 1 380
Provision for fine from UOKiK
- 2 032 Other provisions
329 671
Court and collection costs 346 200
Costs of transport benefits for non-employees
293 955
Interest on trade and other payables 141 68 Net results on foreign exchange on trade receivables and trade payables
2 611 -
Donations (1) 1 013 - Other 369 337 Total
8 588 12 144
(1) The item consists of the book value of assets contributed based on a donation agreement to the cultural institution Wolsztyn
Steam Engine Depot, which was formed by the Parent Company jointly with the Wielkopolskie Voivodship, the County
of Wolsztyn and the Municipality of Wolsztyn in the year 2016.
16
PKP CARGO GROUP
QUARTERLY CONDENSED CONSOLIDATED FINANCIAL STATEMENTS FOR THE PERIOD
OF 3 MONTHS ENDED 31 MARCH 2017, PREPARED IN ACCORDANCE WITH IFRS EU (IN PLN ‘000)
(translation of a document originally issued in Polish)
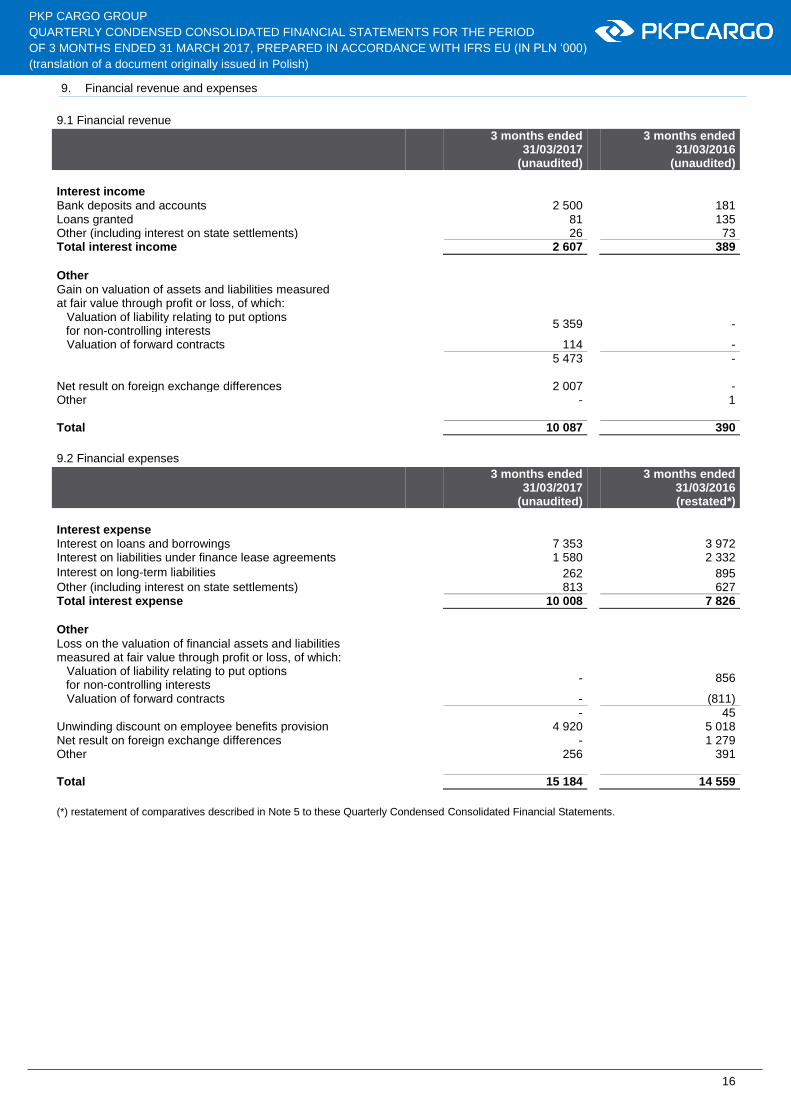
9. Financial revenue and expenses
9.1 Financial revenue
3 months ended 31/03/2017
(unaudited)
3 months ended 31/03/2016
(unaudited)
Interest income
Bank deposits and accounts 2 500 181 Loans granted 81 135 Other (including interest on state settlements) 26 73 Total interest income 2 607 389
Other Gain on valuation of assets and liabilities measured at fair value through profit or loss, of which:
Valuation of liability relating to put options for non-controlling interests
5 359 -
Valuation of forward contracts 114 -
5 473 -
Net result on foreign exchange differences 2 007 - Other - 1 Total 10 087 390
9.2 Financial expenses
3 months ended 31/03/2017
(unaudited)
3 months ended 31/03/2016 (restated*)
Interest expense
Interest on loans and borrowings 7 353 3 972 Interest on liabilities under finance lease agreements 1 580 2 332
Interest on long-term liabilities 262 895 Other (including interest on state settlements) 813 627 Total interest expense 10 008 7 826
Other Loss on the valuation of financial assets and liabilities measured at fair value through profit or loss, of which:
Valuation of liability relating to put options for non-controlling interests
- 856
Valuation of forward contracts - (811) - 45 Unwinding discount on employee benefits provision 4 920 5 018 Net result on foreign exchange differences - 1 279 Other 256 391
Total 15 184 14 559
(*) restatement of comparatives described in Note 5 to these Quarterly Condensed Consolidated Financial Statements.
17
PKP CARGO GROUP
QUARTERLY CONDENSED CONSOLIDATED FINANCIAL STATEMENTS FOR THE PERIOD
OF 3 MONTHS ENDED 31 MARCH 2017, PREPARED IN ACCORDANCE WITH IFRS EU (IN PLN ‘000)
(translation of a document originally issued in Polish)
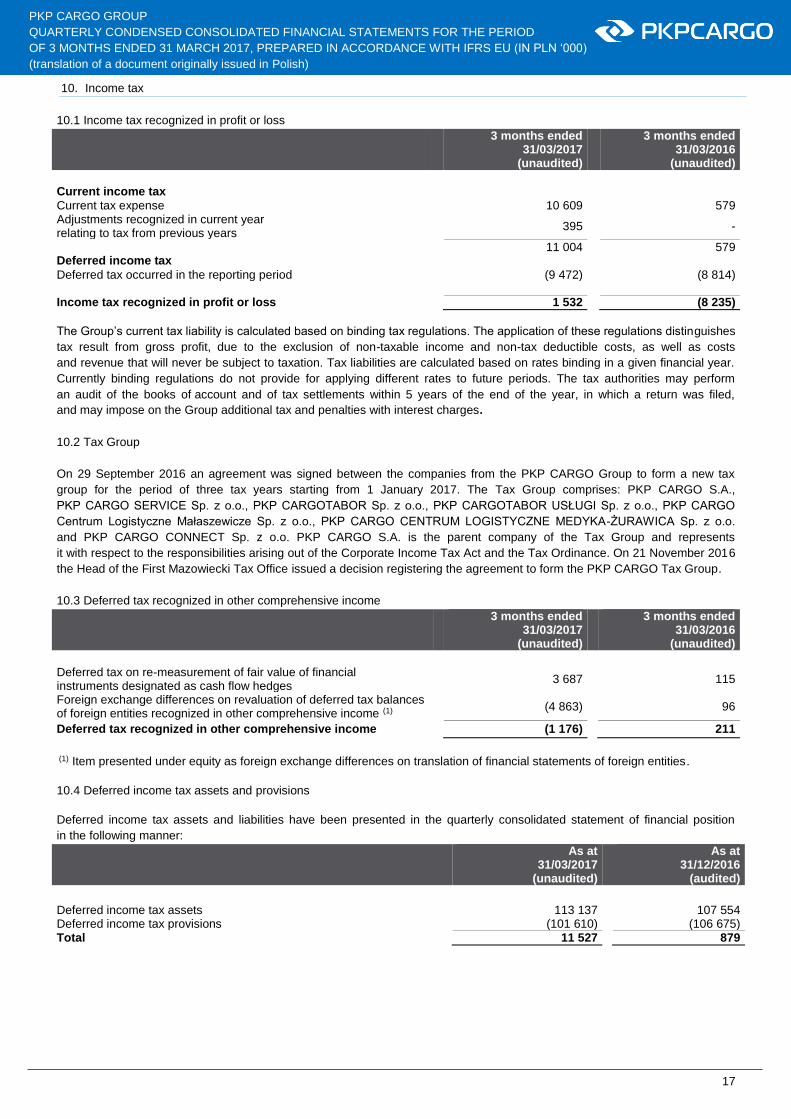
10. Income tax
10.1 Income tax recognized in profit or loss
3 months ended
31/03/2017 (unaudited)
3 months ended
31/03/2016 (unaudited)
Current income tax
Current tax expense 10 609 579 Adjustments recognized in current year relating to tax from previous years
395 -
11 004 579 Deferred income tax Deferred tax occurred in the reporting period (9 472) (8 814)
Income tax recognized in profit or loss 1 532 (8 235)
The Group’s current tax liability is calculated based on binding tax regulations. The application of these regulations distinguishes
tax result from gross profit, due to the exclusion of non-taxable income and non-tax deductible costs, as well as costs
and revenue that will never be subject to taxation. Tax liabilities are calculated based on rates binding in a given financial year.
Currently binding regulations do not provide for applying different rates to future periods. The tax authorities may perform
an audit of the books of account and of tax settlements within 5 years of the end of the year, in which a return was filed,
and may impose on the Group additional tax and penalties with interest charges.
10.2 Tax Group
On 29 September 2016 an agreement was signed between the companies from the PKP CARGO Group to form a new tax
group for the period of three tax years starting from 1 January 2017. The Tax Group comprises: PKP CARGO S.A.,
PKP CARGO SERVICE Sp. z o.o., PKP CARGOTABOR Sp. z o.o., PKP CARGOTABOR USŁUGI Sp. z o.o., PKP CARGO
Centrum Logistyczne Małaszewicze Sp. z o.o., PKP CARGO CENTRUM LOGISTYCZNE MEDYKA-ŻURAWICA Sp. z o.o.
and PKP CARGO CONNECT Sp. z o.o. PKP CARGO S.A. is the parent company of the Tax Group and represents
it with respect to the responsibilities arising out of the Corporate Income Tax Act and the Tax Ordinance. On 21 November 2016
the Head of the First Mazowiecki Tax Office issued a decision registering the agreement to form the PKP CARGO Tax Group.
10.3 Deferred tax recognized in other comprehensive income
3 months ended
31/03/2017 (unaudited)
3 months ended
31/03/2016 (unaudited)
Deferred tax on re-measurement of fair value of financial instruments designated as cash flow hedges
3 687 115
Foreign exchange differences on revaluation of deferred tax balances of foreign entities recognized in other comprehensive income (1)
(4 863) 96
Deferred tax recognized in other comprehensive income (1 176) 211
(1) Item presented under equity as foreign exchange differences on translation of financial statements of foreign entities.
10.4 Deferred income tax assets and provisions
Deferred income tax assets and liabilities have been presented in the quarterly consolidated statement of financial position
in the following manner:
As at
31/03/2017 (unaudited)
As at
31/12/2016 (audited)
Deferred income tax assets 113 137 107 554 Deferred income tax provisions (101 610) (106 675) Total 11 527 879

18
PKP CARGO GROUP
QUARTERLY CONDENSED CONSOLIDATED FINANCIAL STATEMENTS FOR THE PERIOD
OF 3 MONTHS ENDED 31 MARCH 2017, PREPARED IN ACCORDANCE WITH IFRS EU (IN PLN ‘000)
(translation of a document originally issued in Polish)
10.4.1 Deferred income tax movements
3 months ended 31/03/2017
As at 01/01/2017
(audited)
Recognized in profit or loss
Recognized in other
comprehensive income
Foreign exchange
differences on translation
of deferred income tax recognized
in other comprehensive
income As at 31/03/2017
(unaudited)
Temporary differences relating to deferred income tax assets / (provisions):
Property, plant and equipment, intangible assets and non-current assets held for sale (including finance leases)
(183 033) 12 033 - 5 478 (165 522)
Long-term liabilities (97) 50 - - (47) Inventories 936 (1 328) - (15) (407) Receivables – impairment allowance
7 138 (71) - (28) 7 039
Interest accrued on assets (241) (244) - - (485) Interest accrued on liabilities 182 (23) - - 159 Provisions for employee benefits
118 565 1 845 - (120) 120 290
Other provisions 3 904
818 - (126) 4 596 Accrued expenses 6 008 2 282 - - 8 290
Deferred income (3 080) (3 237) - - (6 317)
Unpaid employee benefits 7 375 (476) - (3) 6 896
Foreign exchange differences 2 235 (529) (1 836) - (130) Valuation of derivative instruments
218 (22) (1 851) - (1 655)
Other - 1 518 - (2) 1 516 (39 890) 12 616 (3 687) 5 184 (25 777)
Unused tax losses (1) 40 769 (3 144) - (321) 37 304
Total 879 9 472 (3 687) 4 863 11 527
(1) As at 31 March 2017 deferred income tax assets on tax losses to be used in future periods represented the loss of the Parent
Company in the amount of PLN 139.330 thousand, and of the subsidiary companies in the amount of PLN 57.002 thousand. The tax
loss in the amount of PLN 166.673 thousand will be deductible in the five consecutive tax years following the end of operations
of the Tax Group. The other tax losses will be deductible for five consecutive years from their incurrence. The Parent Company’s
Management is of the opinion that as at 31 March 2017 there is no threat of not being able to realize the above assets.

19
PKP CARGO GROUP
QUARTERLY CONDENSED CONSOLIDATED FINANCIAL STATEMENTS FOR THE PERIOD
OF 3 MONTHS ENDED 31 MARCH 2017, PREPARED IN ACCORDANCE WITH IFRS EU (IN PLN ‘000)
(translation of a document originally issued in Polish)
10.4.1 Deferred income tax movements (continued)
3 months ended 31/03/2016
As at 01/01/2016
(audited)
Recognized in profit or loss
Recognized in other
comprehensive income
Foreign exchange
differences on translation
of deferred income tax recognized
in other comprehensive
income As at 31/03/2016
(unaudited)
Temporary differences relating to deferred income tax assets / (provisions):
Property, plant and equipment, intangible assets and non-current assets held for sale (including finance leases)
(185 146) 11 711 - (93) (173 528)
Trade payables 4 608 (4 608) - - - Long-term liabilities (543) 170 - - (373) Inventories 466 205 - 1 672 Receivables – impairment allowance
6 856 620 - - 7 476
Interest accrued on assets (157) (2) - - (159) Interest accrued on liabilities (6) - - - (6) Provisions for employee benefits
133 800 1 682 - 3 135 485
Other provisions 4 652 (26) - - 4 626 Accrued expenses 7 265 1 895 - - 9 160 Deferred income (4 731) (1 826) - - (6 557) Unpaid employee benefits 7 188 (152) - (3) 7 033 Foreign exchange differences 1 582 (500) (4) - 1 078 Valuation of derivative instruments
450 (158) (111) - 181
Other 858 285 - - 1 143 (22 858) 9 296 (115) (92) (13 769)
Unused tax losses (1) 9 092 (482) - (4) 8 606
Total (13 766) 8 814 (115) (96) (5 163)
(1) As at 31 March 2016 deferred income tax assets on tax losses to be used in future periods represented the loss of the subsidiary
companies in the amount of PLN 45.295 thousand.

20
PKP CARGO GROUP
QUARTERLY CONDENSED CONSOLIDATED FINANCIAL STATEMENTS FOR THE PERIOD
OF 3 MONTHS ENDED 31 MARCH 2017, PREPARED IN ACCORDANCE WITH IFRS EU (IN PLN ‘000)
(translation of a document originally issued in Polish)
10.5 Tax losses not included in the calculation of deferred income tax assets
As at 31/03/2017
(unaudited)
As at 31/12/2016
(audited)
Deferred income tax assets on the following tax losses were not recognized as at the balance sheet date
111 952
115 682
Tax losses not included in the calculation of a deferred income tax asset as at 31 March 2017 represent the losses incurred
by the companies of the AWT Group in the amount of PLN 101.108 thousand (AWT B.V. in the amount of PLN 58.194
thousand, AWT Coal Logistics s.r.o. in the amount of PLN 28.770 thousand, AWT Rail HU Zrt. in the amount of PLN 14.144
thousand), the loss of PKP CARGOTABOR USŁUGI Sp. z o.o. in the amount of PLN 7.540 thousand and of CARGOSPED
Terminal Braniewo Sp. z o.o. in the amount of PLN 3.304 thousand. Whereas as at 31 December 2016 the tax losses
not included in the calculation of a deferred income tax represented the losses of the companies of the AWT Group
in the amount of PLN 104.774 thousand (AWT B.V. in the amount of PLN 59.333 thousand, AWT Coal Logistics s.r.o.
in the amount of PLN 30.930 thousand and AWT Rail HU Zrt. in the amount of PLN 14.511 thousand), the loss
of PKP CARGOTABOR USŁUGI Sp. z o.o. in the amount of PLN 7.540 thousand and of CARGOSPED Terminal
Braniewo Sp. z o.o. in the amount of PLN 3.368 thousand.
The unused tax losses on which no deferred tax assets were recognized as at 31 March 2017 may be used in the following
future years:
Year 2017 2018 2019 2020 2021 2022
and later Total
Unused tax losses 5 479 6 046 17 598 19 330 38 413 25 086 111 952
The unused tax losses on which no deferred tax assets were recognized as at 31 December 2016 could have been used
in the following future periods:
Year 2017 2018 2019 2020 2021 2022
and later Total
Unused tax losses 5 711 6 093 18 352 20 221 40 979 24 326 115 682

21
PKP CARGO GROUP
QUARTERLY CONDENSED CONSOLIDATED FINANCIAL STATEMENTS FOR THE PERIOD
OF 3 MONTHS ENDED 31 MARCH 2017, PREPARED IN ACCORDANCE WITH IFRS EU (IN PLN ‘000)
(translation of a document originally issued in Polish)
11. Property, plant and equipment
Period of 3 months ended 31 March 2017 (unaudited)
Land
Buildings, premises,
civil and water
engineering structures
Technical equipment
and machinery
Means of transport
Other fixed
assets
Fixed assets under
construction Total
Gross value
As at 1 January 2017 (audited) 162 389 742 757 381 563 5 925 512 39 889 44 274 7 296 384
Additions / (disposals):
Acquisition - - - - - 85 734 85 734
Foreign exchange differences on translation of financial statements of foreign entities
(795) (5 169) (1 846) (38 855) (95) (476) (47 236)
Transfer of fixed assets under construction into use
10 1 382 5 947 80 426 96 (87 861) -
Sale (878) (231) (415) (3 833) (23) - (5 380)
Liquidation - (4 033) (546) (59 839) (35) - (64 453)
Other (686) (3 280) (343) (4 303) (1 161) - (9 773)
As at 31 March 2017 (unaudited)
160 040 731 426 384 360 5 899 108 38 671 41 671 7 255 276
Accumulated depreciation
As at 1 January 2017 (audited)
-
167 999
241 431
1 953 606
31 223 - 2 394 259
Additions / (disposals):
Depreciation charges - 8 308 8 691 121 883 661 - 139 543
Foreign exchange differences on translation of financial statements of foreign entities
- (462) (344) (5 184) (18) - (6 008)
Sale - (11) (311) (3 486) (23) - (3 831)
Liquidation - (3 158) (532) (41 365) (35) - (45 090)
Other - (3 280) (342) (4 108) (1 161) - (8 891)
As at 31 March 2017 (unaudited)
- 169 396 248 593 2 021 346 30 647 - 2 469 982
Accumulated impairment
As at 1 January 2017 (audited) 2 380
1 924
317
194 486
8 2 460
201 575
Additions / (disposals):
Sale - - - (5) - - (5)
Liquidation - (829) - (7 971) - - (8 800)
Foreign exchange differences on translation of financial statements of foreign entities
(9) (4) - (1 631) - - (1 644)
As at 31 March 2017 (unaudited)
2 371 1 091 317 184 879 8 2 460 191 126
Net value
As at 1 January 2017 (audited) 160 009 572 834 139 815 3 777 420 8 658 41 814 4 700 550
of which finance leases - - 8 633 319 689 - - 328 322
As at 31 March 2017 (unaudited)
157 669 560 939 135 450 3 692 883 8 016 39 211 4 594 168
of which finance leases - - 7 247 309 960 - - 317 207
22
PKP CARGO GROUP
QUARTERLY CONDENSED CONSOLIDATED FINANCIAL STATEMENTS FOR THE PERIOD
OF 3 MONTHS ENDED 31 MARCH 2017, PREPARED IN ACCORDANCE WITH IFRS EU (IN PLN ‘000)
(translation of a document originally issued in Polish)
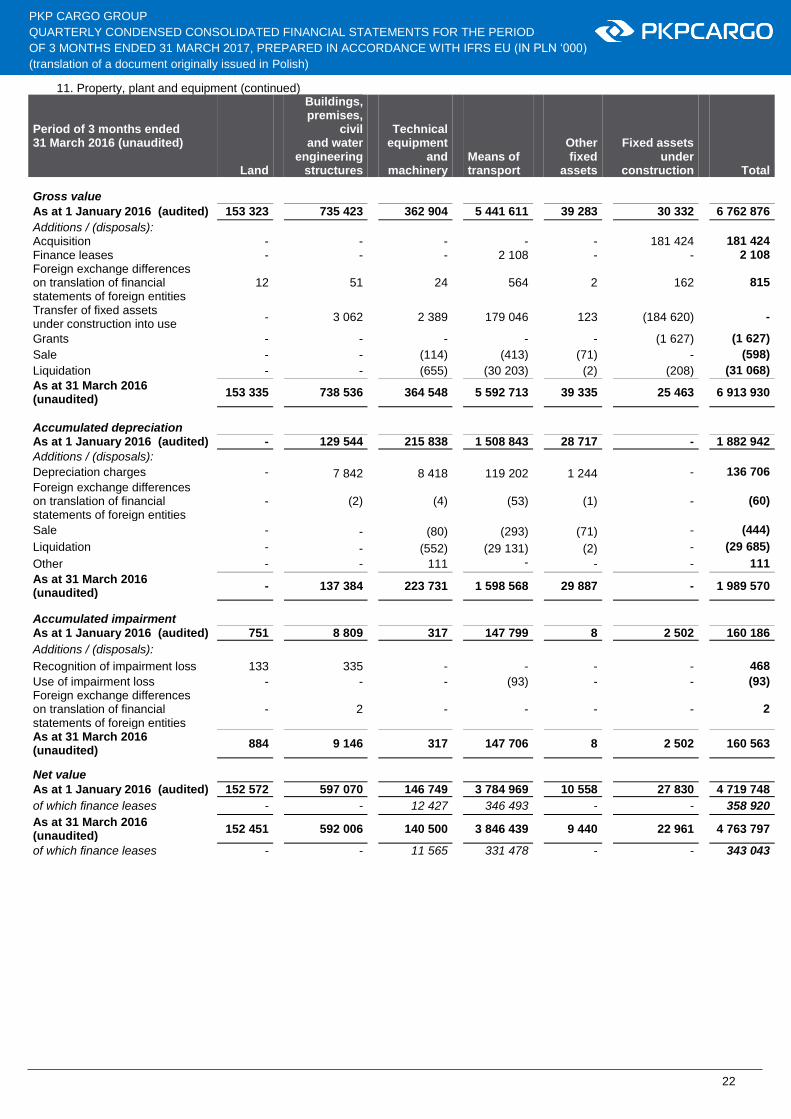
11. Property, plant and equipment (continued)
Period of 3 months ended 31 March 2016 (unaudited)
Land
Buildings, premises,
civil and water
engineering structures
Technical equipment
and machinery
Means of transport
Other fixed
assets
Fixed assets under
construction Total
Gross value
As at 1 January 2016 (audited) 153 323 735 423 362 904 5 441 611 39 283 30 332 6 762 876
Additions / (disposals): Acquisition - - - - - 181 424 181 424
Finance leases - - - 2 108 - - 2 108
Foreign exchange differences on translation of financial statements of foreign entities
12 51 24 564 2 162 815
Transfer of fixed assets under construction into use
- 3 062 2 389 179 046 123 (184 620) -
Grants - - - - - (1 627) (1 627)
Sale - - (114) (413) (71) - (598)
Liquidation - - (655) (30 203) (2) (208) (31 068)
As at 31 March 2016 (unaudited)
153 335 738 536 364 548 5 592 713 39 335 25 463 6 913 930
Accumulated depreciation
As at 1 January 2016 (audited) - 129 544 215 838 1 508 843 28 717 - 1 882 942 Additions / (disposals): Depreciation charges - 7 842 8 418 119 202 1 244 - 136 706
Foreign exchange differences on translation of financial statements of foreign entities
- (2) (4) (53) (1) - (60)
Sale - - (80) (293) (71) - (444)
Liquidation - - (552) (29 131) (2) - (29 685)
Other - - 111 - - - 111
As at 31 March 2016 (unaudited)
- 137 384 223 731 1 598 568 29 887 - 1 989 570
Accumulated impairment
As at 1 January 2016 (audited) 751 8 809 317 147 799 8 2 502 160 186 Additions / (disposals): Recognition of impairment loss 133 335 - - - - 468
Use of impairment loss - - - (93) - - (93)
Foreign exchange differences on translation of financial statements of foreign entities
- 2 - - - - 2
As at 31 March 2016 (unaudited)
884 9 146 317 147 706 8 2 502 160 563
Net value
As at 1 January 2016 (audited) 152 572 597 070 146 749 3 784 969 10 558 27 830 4 719 748
of which finance leases - - 12 427 346 493 - - 358 920
As at 31 March 2016 (unaudited)
152 451 592 006 140 500 3 846 439 9 440 22 961 4 763 797
of which finance leases - - 11 565 331 478 - - 343 043

23
PKP CARGO GROUP
QUARTERLY CONDENSED CONSOLIDATED FINANCIAL STATEMENTS FOR THE PERIOD
OF 3 MONTHS ENDED 31 MARCH 2017, PREPARED IN ACCORDANCE WITH IFRS EU (IN PLN ‘000)
(translation of a document originally issued in Polish)
12. Subsidiaries
Detailed information about consolidated subsidiaries as at 31 March 2017 and 31 December 2016:
No. Name of subsidiary Core business Place of
registration and operations
Percent of shares held by the Group
As at 31/03/2017
As at 31/12/2016
1 PKP CARGO Centrum Logistyczne Małaszewicze Sp. z o.o.
Services in support of land transport, reloading of cargo and wholesale and retail of waste and scrap
Małaszewicze 100,0% 100,0%
2 PKP CARGO Centrum Logistyczne Medyka Żurawica Sp. z o.o.
Reloading of cargo at other reloading centers
Żurawica 100,0% 100,0%
3 PKP CARGO SERVICE Sp. z o.o. Comprehensive siding services Warsaw 100,0% 100,0%
4 PKP CARGO CONNECT Sp. z o.o. Shipping services Warsaw 100,0% 100,0%
5 PKP CARGOTABOR Sp. z o.o. Maintenance and repair of rolling stock
Warsaw 100,0% 100,0%
6 PKP CARGOTABOR USŁUGI Sp. z o.o. Collection, processing and neutralization of waste and recovery of raw materials
Warsaw 100,0% 100,0%
7 CARGOTOR Sp. z o.o.
Management of logistics and service infrastructure in the form of railway sidings and railroad tracks. Provision of such infrastructure to rail carriers.
Warsaw 100,0% 100,0%
8 CARGOSPED Terminal Braniewo Sp. z o.o. Reloading of cargo, customs warehouse
Braniewo 100,0% 100,0%
9 Advanced World Transport B.V. Holding and financial activities Amsterdam 80,0% 80,0%
10 Advanced World Transport a.s. Provision of comprehensive services: rail transport, rail shipping, siding services, rolling stock repairs
Ostrava 80,0% 80,0%
11 AWT ROSCO a.s. Rolling stock management and rentals
Ostrava 80,0% 80,0%
12 AWT Čechofracht a.s. Rail shipping and customs services Prague 80,0% 80,0%
13 AWT Rekultivace a.s.
Provision of comprehensive services: land reclamation, construction services, waste management, landscape planning
Havirov-Prostredni
Sucha 80,0% 80,0%
14 AWT Rail HU Zrt. Provision of comprehensive services: rail transport, rail shipping, siding services
Budapest 80,0% 80,0%
15 AWT Coal Logistics s.r.o. Rail shipping Prague 80,0% 80,0%

24
PKP CARGO GROUP
QUARTERLY CONDENSED CONSOLIDATED FINANCIAL STATEMENTS FOR THE PERIOD
OF 3 MONTHS ENDED 31 MARCH 2017, PREPARED IN ACCORDANCE WITH IFRS EU (IN PLN ‘000)
(translation of a document originally issued in Polish)
12. Subsidiaries (continued)
Detailed information about other subsidiaries belonging to the Group as at 31 March 2017 and 31 December 2016:
No. Name of subsidiary Core business Place of
registration and operations
Percent of shares held by the Group
As at 31/03/2017
As at 31/12/2016
16 ONECARGO Sp. z o.o. Rail transport of freight Warsaw 100,0% 100,0%
17 ONECARGO CONNECT Sp. z o.o. Services in support of land transport
Warsaw 100,0% 100,0%
18 Trade Trans Karya Sp. z o.o. Reloading of cargo, customs warehouse
Lublin 100,0% 100,0%
19 Transgaz S.A. Shipping agency Zalesie k.
Małaszewicz 64,0% 64,0%
20 Trade Trans Finance Sp. z o.o. Financial and accounting services Warsaw 100,0% 100,0%
21 PKP CARGO CONNECT GmbH Customs and shipping services Hamburg 100,0% 100,0%
22 PPHU "Ukpol" Sp. z o.o. Reloading, commercial services Werchrata 100,0% 100,0%
23 AWT Rail SK a. s. Rail transport, rail shipping Bratislava 80,0% 80,0%
24 AWT Rail PL Sp. z o.o. w likwidacji Rail shipping Rybnik 80,0% 80,0%
25 AWT DLT s.r.o. Siding services Kladno 80,0% 80,0%
26 AWT Trading s.r.o. Sale of military products Petrvald 80,0% 80,0%
27 AWT Rekultivace PL Sp. z o.o.
Provision of comprehensive services: land reclamation, construction services, waste management, landscape planning
Cieszyn 80,0% 80,0%
28 RND s.r.o. Rail shipping, transport monitoring Olomouc 40,8% 40,8%
13. Investments in entities accounted for under the equity method
3 months ended 31/03/2017
(unaudited)
3 months ended 31/03/2016
(unaudited)
Opening balance 40 810 39 831
Share in profits of entities accounted for under the equity method
2 019 1 364
Change in equity arising out of dividend payment (600) - Foreign exchange differences on translation of financial statements of foreign entities
(241) 9
Closing balance 41 988 41 204
25
PKP CARGO GROUP
QUARTERLY CONDENSED CONSOLIDATED FINANCIAL STATEMENTS FOR THE PERIOD
OF 3 MONTHS ENDED 31 MARCH 2017, PREPARED IN ACCORDANCE WITH IFRS EU (IN PLN ‘000)
(translation of a document originally issued in Polish)
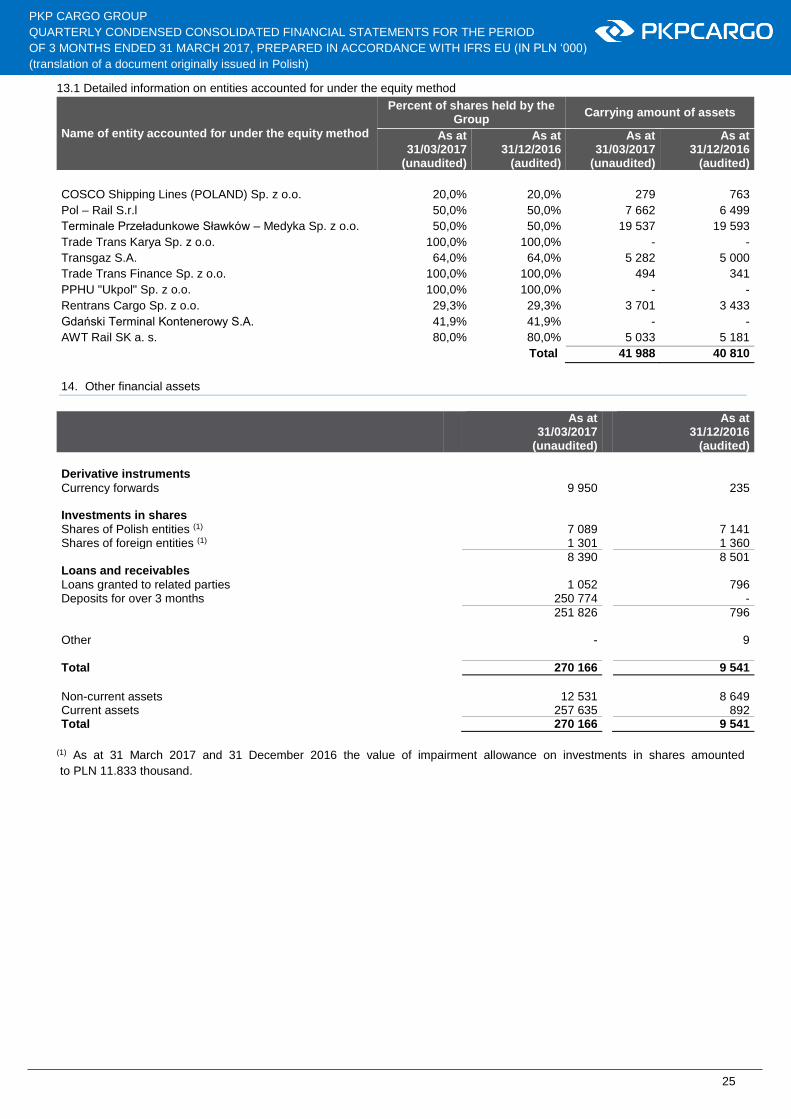
13.1 Detailed information on entities accounted for under the equity method
Name of entity accounted for under the equity method
Percent of shares held by the Group
Carrying amount of assets
As at 31/03/2017
(unaudited)
As at 31/12/2016
(audited)
As at 31/03/2017
(unaudited)
As at 31/12/2016
(audited)
COSCO Shipping Lines (POLAND) Sp. z o.o. 20,0% 20,0% 279 763
Pol – Rail S.r.l 50,0% 50,0% 7 662 6 499
Terminale Przeładunkowe Sławków – Medyka Sp. z o.o. 50,0% 50,0% 19 537 19 593
Trade Trans Karya Sp. z o.o. 100,0% 100,0% - -
Transgaz S.A. 64,0% 64,0% 5 282 5 000
Trade Trans Finance Sp. z o.o. 100,0% 100,0% 494 341
PPHU "Ukpol" Sp. z o.o. 100,0% 100,0% - -
Rentrans Cargo Sp. z o.o. 29,3% 29,3% 3 701 3 433
Gdański Terminal Kontenerowy S.A. 41,9% 41,9% - -
AWT Rail SK a. s. 80,0% 80,0% 5 033 5 181
Total 41 988 40 810
14. Other financial assets
As at
31/03/2017 (unaudited)
As at 31/12/2016
(audited)
Derivative instruments Currency forwards 9 950 235 Investments in shares Shares of Polish entities (1) 7 089 7 141 Shares of foreign entities (1) 1 301 1 360
8 390 8 501 Loans and receivables Loans granted to related parties 1 052 796 Deposits for over 3 months 250 774 -
251 826 796 Other - 9 Total 270 166 9 541
Non-current assets 12 531 8 649 Current assets 257 635 892 Total 270 166 9 541
(1) As at 31 March 2017 and 31 December 2016 the value of impairment allowance on investments in shares amounted
to PLN 11.833 thousand.

26
PKP CARGO GROUP
QUARTERLY CONDENSED CONSOLIDATED FINANCIAL STATEMENTS FOR THE PERIOD
OF 3 MONTHS ENDED 31 MARCH 2017, PREPARED IN ACCORDANCE WITH IFRS EU (IN PLN ‘000)
(translation of a document originally issued in Polish)
15. Other non-financial assets
As at
31/03/2017 (unaudited)
As at 31/12/2016
(audited)
Expenses settled in time Contribution to Company Social Benefits Fund 25 262 - Rental fees 13 788 14 210 Transport benefits for eligible persons 10 505 - Insurance 7 306 7 667 Prepaid electrical energy 3 246 14 673 Other prepaid expenses 5 161 5 583
65 268 42 133 Other Advances for the purchase of fixed assets 19 856 10 477 Other 1 016 654
20 872 11 131 Total 86 140 53 264
Non-current assets 34 700 25 987 Current assets 51 440 27 277 Total 86 140 53 264
16. Inventories
As at
31/03/2017 (unaudited)
As at 31/12/2016
(audited)
Raw materials 126 771 120 619 Semi-finished products 4 723 6 027 Merchandise 599 1 872 Impairment allowance (6 855) (7 329) Total 125 238 121 189
17. Trade and other receivables
As at
31/03/2017 (unaudited)
As at 31/12/2016
(audited)
Trade receivables 750 701 768 873 Impairment allowance for trade receivables (146 504) (152 873) Total 604 197 616 000
State receivables 4 379 5 216 Guarantees, security deposits and bid bonds 2 934 1 415 VAT settlements 15 056 17 754 Other receivables 2 344 1 704 Total 628 910 642 089
Non-current assets 1 767 2 223 Current assets 627 143 639 866 Total 628 910 642 089
27
PKP CARGO GROUP
QUARTERLY CONDENSED CONSOLIDATED FINANCIAL STATEMENTS FOR THE PERIOD
OF 3 MONTHS ENDED 31 MARCH 2017, PREPARED IN ACCORDANCE WITH IFRS EU (IN PLN ‘000)
(translation of a document originally issued in Polish)
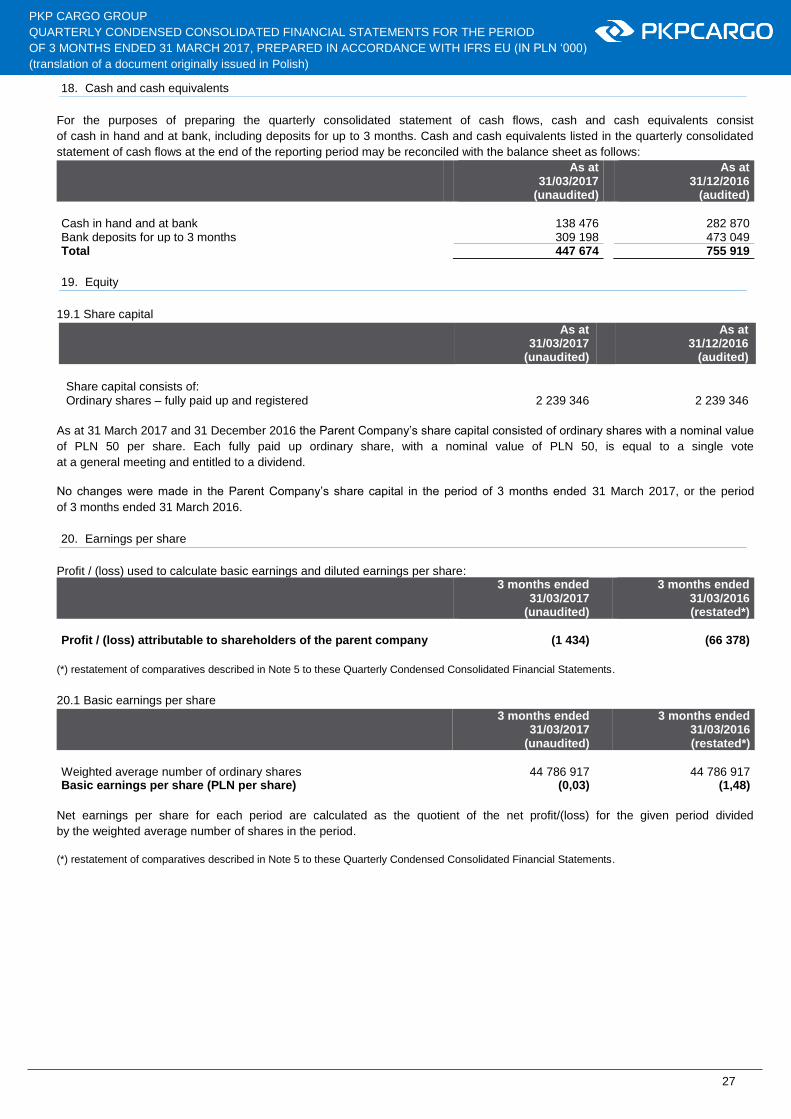
18. Cash and cash equivalents
For the purposes of preparing the quarterly consolidated statement of cash flows, cash and cash equivalents consist
of cash in hand and at bank, including deposits for up to 3 months. Cash and cash equivalents listed in the quarterly consolidated
statement of cash flows at the end of the reporting period may be reconciled with the balance sheet as follows:
As at 31/03/2017
(unaudited)
As at 31/12/2016
(audited)
Cash in hand and at bank 138 476 282 870 Bank deposits for up to 3 months 309 198 473 049 Total 447 674 755 919
19. Equity
19.1 Share capital
As at
31/03/2017 (unaudited)
As at 31/12/2016
(audited)
Share capital consists of:
Ordinary shares – fully paid up and registered 2 239 346 2 239 346
As at 31 March 2017 and 31 December 2016 the Parent Company’s share capital consisted of ordinary shares with a nominal value
of PLN 50 per share. Each fully paid up ordinary share, with a nominal value of PLN 50, is equal to a single vote
at a general meeting and entitled to a dividend.
No changes were made in the Parent Company’s share capital in the period of 3 months ended 31 March 2017, or the period
of 3 months ended 31 March 2016.
20. Earnings per share
Profit / (loss) used to calculate basic earnings and diluted earnings per share:
3 months ended 31/03/2017
(unaudited)
3 months ended 31/03/2016 (restated*)
Profit / (loss) attributable to shareholders of the parent company (1 434) (66 378)
(*) restatement of comparatives described in Note 5 to these Quarterly Condensed Consolidated Financial Statements.
20.1 Basic earnings per share
3 months ended 31/03/2017
(unaudited)
3 months ended 31/03/2016 (restated*)
Weighted average number of ordinary shares 44 786 917 44 786 917 Basic earnings per share (PLN per share) (0,03) (1,48)
Net earnings per share for each period are calculated as the quotient of the net profit/(loss) for the given period divided
by the weighted average number of shares in the period.
(*) restatement of comparatives described in Note 5 to these Quarterly Condensed Consolidated Financial Statements.
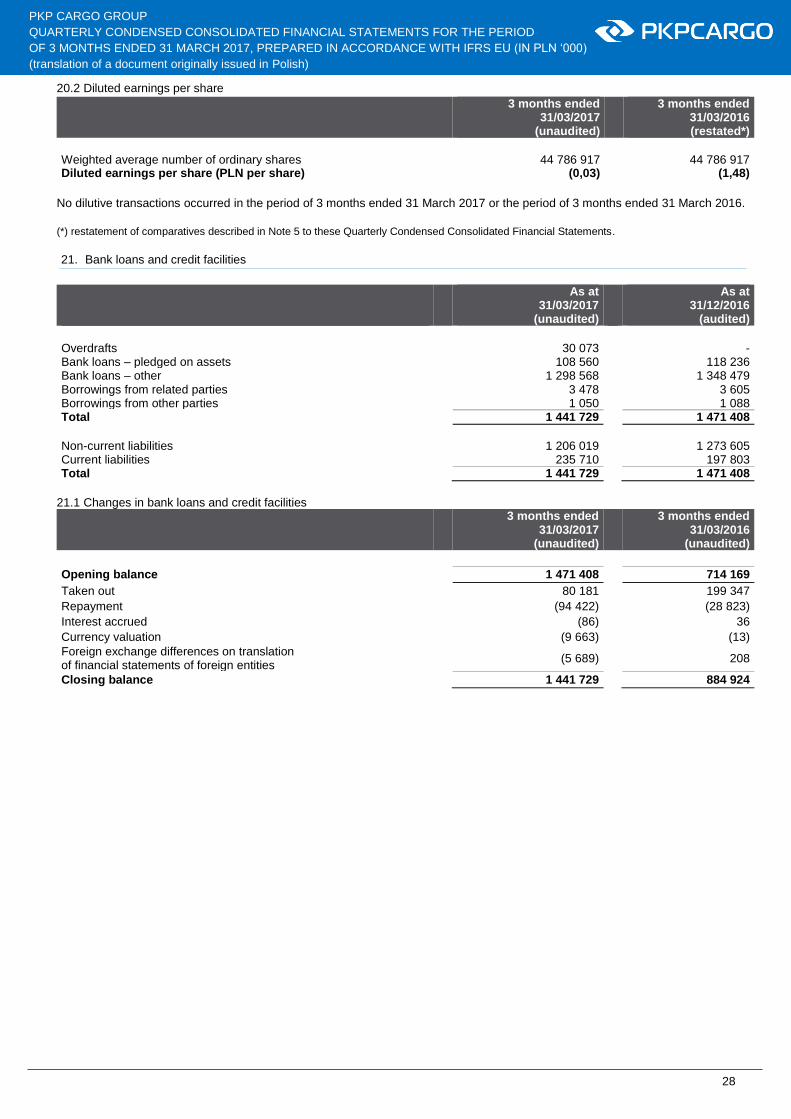
28
PKP CARGO GROUP
QUARTERLY CONDENSED CONSOLIDATED FINANCIAL STATEMENTS FOR THE PERIOD
OF 3 MONTHS ENDED 31 MARCH 2017, PREPARED IN ACCORDANCE WITH IFRS EU (IN PLN ‘000)
(translation of a document originally issued in Polish)
20.2 Diluted earnings per share
3 months ended 31/03/2017
(unaudited)
3 months ended 31/03/2016 (restated*)
Weighted average number of ordinary shares 44 786 917 44 786 917 Diluted earnings per share (PLN per share) (0,03) (1,48)
No dilutive transactions occurred in the period of 3 months ended 31 March 2017 or the period of 3 months ended 31 March 2016.
(*) restatement of comparatives described in Note 5 to these Quarterly Condensed Consolidated Financial Statements.
21. Bank loans and credit facilities
As at 31/03/2017
(unaudited)
As at 31/12/2016
(audited)
Overdrafts 30 073 - Bank loans – pledged on assets 108 560 118 236 Bank loans – other 1 298 568 1 348 479 Borrowings from related parties 3 478 3 605 Borrowings from other parties 1 050 1 088 Total 1 441 729 1 471 408
Non-current liabilities 1 206 019 1 273 605 Current liabilities 235 710 197 803 Total 1 441 729 1 471 408
21.1 Changes in bank loans and credit facilities
3 months ended
31/03/2017 (unaudited)
3 months ended
31/03/2016 (unaudited)
Opening balance 1 471 408 714 169
Taken out 80 181 199 347
Repayment (94 422) (28 823)
Interest accrued (86) 36
Currency valuation (9 663) (13)
Foreign exchange differences on translation of financial statements of foreign entities
(5 689) 208
Closing balance 1 441 729 884 924
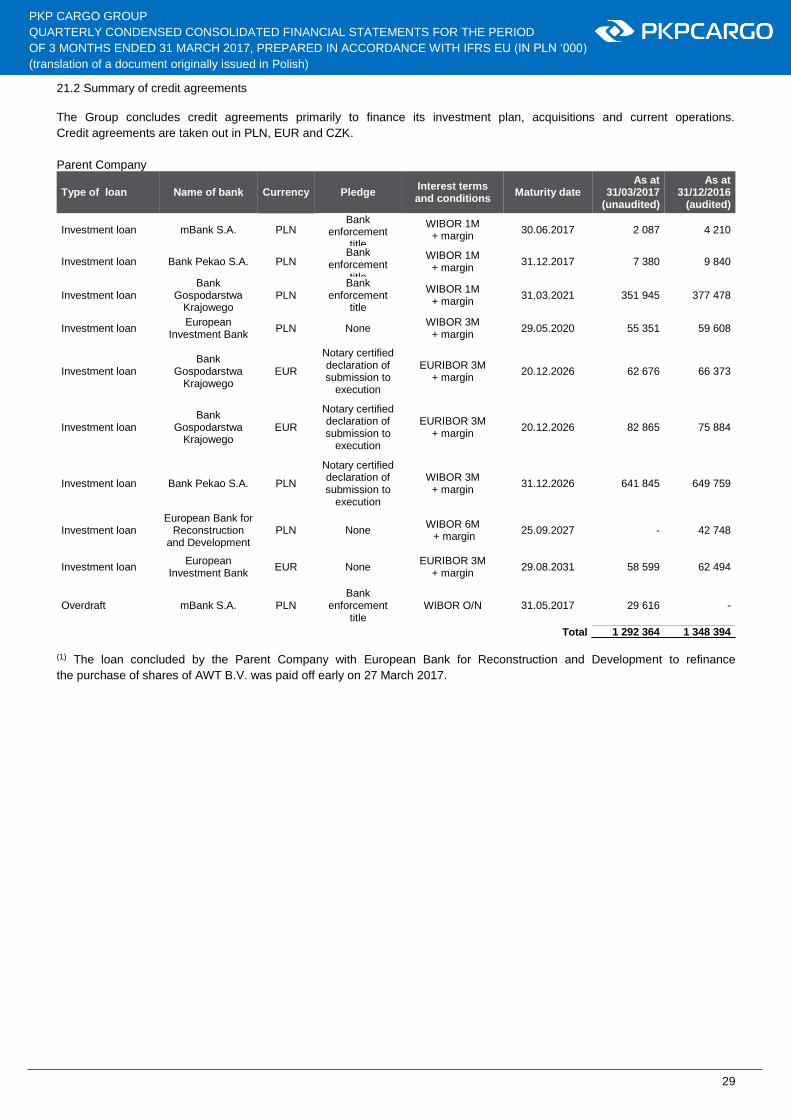
29
PKP CARGO GROUP
QUARTERLY CONDENSED CONSOLIDATED FINANCIAL STATEMENTS FOR THE PERIOD
OF 3 MONTHS ENDED 31 MARCH 2017, PREPARED IN ACCORDANCE WITH IFRS EU (IN PLN ‘000)
(translation of a document originally issued in Polish)
21.2 Summary of credit agreements
The Group concludes credit agreements primarily to finance its investment plan, acquisitions and current operations.
Credit agreements are taken out in PLN, EUR and CZK.
Parent Company
Type of loan Name of bank Currency Pledge Interest terms and conditions
Maturity date As at
31/03/2017 (unaudited)
As at 31/12/2016
(audited)
Investment loan mBank S.A. PLN Bank
enforcement title
WIBOR 1M + margin
30.06.2017 2 087 4 210
Investment loan Bank Pekao S.A. PLN Bank
enforcement title
WIBOR 1M + margin
31.12.2017 7 380 9 840
Investment loan Bank
Gospodarstwa Krajowego
PLN Bank
enforcement title
WIBOR 1M + margin
31.03.2021 351 945 377 478
Investment loan European
Investment Bank PLN None
WIBOR 3M + margin
29.05.2020 55 351 59 608
Investment loan Bank
Gospodarstwa Krajowego
EUR
Notary certified declaration of submission to
execution
EURIBOR 3M + margin
20.12.2026 62 676 66 373
Investment loan Bank
Gospodarstwa Krajowego
EUR
Notary certified declaration of submission to
execution
EURIBOR 3M + margin
20.12.2026 82 865 75 884
Investment loan Bank Pekao S.A. PLN
Notary certified declaration of submission to
execution
WIBOR 3M + margin
31.12.2026 641 845 649 759
Investment loan European Bank for
Reconstruction and Development
(1)
PLN None WIBOR 6M + margin
25.09.2027 - 42 748
Investment loan European
Investment Bank EUR None
EURIBOR 3M + margin
29.08.2031 58 599 62 494
Overdraft mBank S.A. PLN Bank
enforcement title
WIBOR O/N 31.05.2017 29 616 -
Total 1 292 364 1 348 394 (1) The loan concluded by the Parent Company with European Bank for Reconstruction and Development to refinance
the purchase of shares of AWT B.V. was paid off early on 27 March 2017.

30
PKP CARGO GROUP
QUARTERLY CONDENSED CONSOLIDATED FINANCIAL STATEMENTS FOR THE PERIOD
OF 3 MONTHS ENDED 31 MARCH 2017, PREPARED IN ACCORDANCE WITH IFRS EU (IN PLN ‘000)
(translation of a document originally issued in Polish)
21.2 Summary of credit agreements (continued)
Subsidiaries
Type of loan Name of bank Currency Pledge Interest terms and conditions
Maturity date
As at 31/03/2017
(unaudited)
As at 31/12/2016
(audited)
Overdraft PKO BP S.A. PLN Capped mortgage, pledge on inventory
WIBOR 1M + margin
15.07.2019 457 429
Investment loan
Bank Pekao S.A. (2) PLN Notary certified
declaration of submission to execution
WIBOR 3M + margin
20.12.2021 7 124 -
Investment loan
Bank Pekao S.A. (2) PLN Notary certified
declaration of submission to execution
WIBOR 3M + margin
31.12.2021 13 683 -
Investment loan
mBank S.A. PLN Guarantee granted by
PKP CARGO S.A WIBOR 1M
+ margin 30.06.2017 43 85
Loan WFOŚIGW Łódź (1) PLN
1) Blank promissory note 2) Irrevocable
authorization to bank account
3) Guarantee granted by PKP CARGO S.A.
fixed 31.03.2024 1 050 1 088
Investment loan
Bank Pekao S.A. (2) PLN Notary certified
declaration of submission to execution
WIBOR 3M + margin
31.12.2021 10 495 -
Investment loan
Bank Pekao S.A. (2) PLN Notary certified
declaration of submission to execution
WIBOR 3M + margin
31.12.2021 4 475 -
Investment loan
ING Bank N.V. UniCredit Bank
Czech Republik and Slovakia a.s.
Raiffeisenbank a.s.
CZK
1) Pledge on property, plant and equipment
and receivables 2) Lien on bank accounts
3) Assignment of insurance policy
PRIBOR 3M + margin
26.09.2021 46 340 48 663
Investment loan
ING Bank N.V. UniCredit Bank
Czech Republik and Slovakia a.s.
Raiffeisenbank a.s. (1)
EUR
1) Pledge on property, plant and equipment
and receivables 2) Lien on bank accounts
3) Assignment of insurance policy
fixed 30.06.2021 62 220 69 144
Loan AWT Rail SK a.s. (1) EUR None fixed 31.12.2017 1 357 3 605
Loan AWT Rail SK a.s. (1) EUR None fixed 31.12.2017 2 121 -
Total 149 365 123 014
(1) As at 31 March 2017 interest rates on bank credits and loans with a fixed interest rate fell within the range of 0,06% do 4%.
(2) In February and March 2017 the companies: PKP CARGO SERVICE Sp. z o.o., CARGOTOR Sp. z o.o.,
PKP CARGOTABOR Sp. z o.o., PKP CARGO CONNECT Sp. z o.o. concluded credit agreements with Bank Pekao S.A.
to refinance the investment plan.
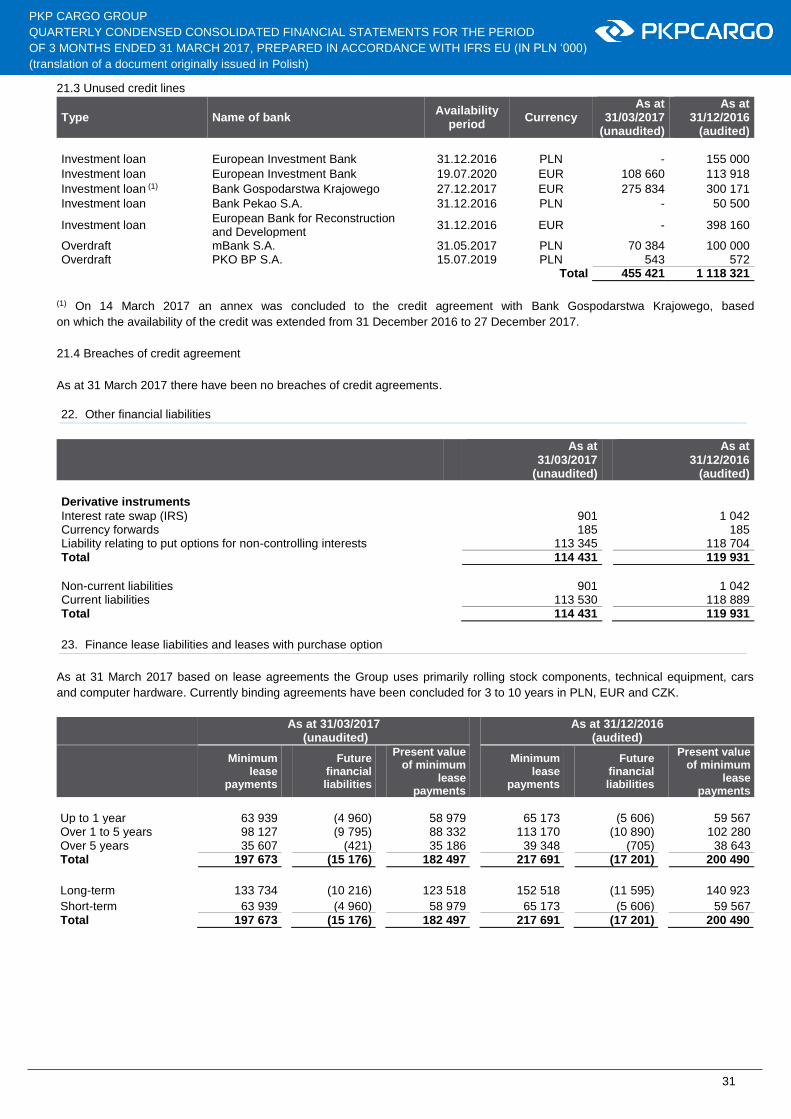
31
PKP CARGO GROUP
QUARTERLY CONDENSED CONSOLIDATED FINANCIAL STATEMENTS FOR THE PERIOD
OF 3 MONTHS ENDED 31 MARCH 2017, PREPARED IN ACCORDANCE WITH IFRS EU (IN PLN ‘000)
(translation of a document originally issued in Polish)
21.3 Unused credit lines
Type Name of bank Availability
period Currency
As at 31/03/2017
(unaudited)
As at 31/12/2016
(audited)
Investment loan European Investment Bank 31.12.2016 PLN - 155 000
Investment loan European Investment Bank 19.07.2020 EUR 108 660 113 918
Investment loan (1) Bank Gospodarstwa Krajowego 27.12.2017 EUR 275 834 300 171
Investment loan Bank Pekao S.A. 31.12.2016 PLN - 50 500
Investment loan European Bank for Reconstruction and Development
31.12.2016 EUR - 398 160
Overdraft mBank S.A. 31.05.2017 PLN 70 384 100 000 Overdraft PKO BP S.A. 15.07.2019 PLN 543 572
Total 455 421 1 118 321
(1) On 14 March 2017 an annex was concluded to the credit agreement with Bank Gospodarstwa Krajowego, based
on which the availability of the credit was extended from 31 December 2016 to 27 December 2017.
21.4 Breaches of credit agreement
As at 31 March 2017 there have been no breaches of credit agreements.
22. Other financial liabilities
As at 31/03/2017
(unaudited)
As at 31/12/2016
(audited)
Derivative instruments
Interest rate swap (IRS) 901 1 042 Currency forwards 185 185 Liability relating to put options for non-controlling interests 113 345 118 704 Total
114 431 119 931
Non-current liabilities 901 1 042 Current liabilities
113 530 118 889
Total
114 431 119 931
23. Finance lease liabilities and leases with purchase option
As at 31 March 2017 based on lease agreements the Group uses primarily rolling stock components, technical equipment, cars
and computer hardware. Currently binding agreements have been concluded for 3 to 10 years in PLN, EUR and CZK.
As at 31/03/2017 (unaudited)
As at 31/12/2016 (audited)
Minimum lease
payments
Future financial liabilities
Present value of minimum
lease payments
Minimum lease
payments
Future financial liabilities
Present value of minimum
lease payments
Up to 1 year 63 939 (4 960) 58 979 65 173 (5 606) 59 567 Over 1 to 5 years 98 127 (9 795) 88 332 113 170 (10 890) 102 280 Over 5 years 35 607 (421) 35 186 39 348 (705) 38 643 Total 197 673 (15 176) 182 497 217 691 (17 201) 200 490
Long-term 133 734 (10 216) 123 518 152 518 (11 595) 140 923
Short-term 63 939 (4 960) 58 979 65 173 (5 606) 59 567 Total 197 673 (15 176) 182 497 217 691 (17 201) 200 490

32
PKP CARGO GROUP
QUARTERLY CONDENSED CONSOLIDATED FINANCIAL STATEMENTS FOR THE PERIOD
OF 3 MONTHS ENDED 31 MARCH 2017, PREPARED IN ACCORDANCE WITH IFRS EU (IN PLN ‘000)
(translation of a document originally issued in Polish)
24. Trade and other payables
As at
31/03/2017 (unaudited)
As at
31/12/2016 (audited)
Trade payables 278 704 327 389 Accruals 55 599 49 826 Liabilities relating to purchase of non-financial fixed assets 23 008 46 402 Security related liabilities (bid bonds, security deposits, guarantees) 19 986 20 289 State liabilities 94 459 103 170 Employee liabilities 80 128 78 836 Grants (1) 8 148 8 490 Other liabilities (2) 36 633 3 287 VAT settlements 6 180 34 177 Total 602 845 671 866
Non-current liabilities 1 160 1 845 Current liabilities 601 685 670 021 Total 602 845 671 866
(1) As at 31 March 2017 and 31 December 2016 the item consisted of a grant received by AWT as part of the CEF program
to support the construction of a multi-modal container terminal in Paskow. The capital expenditures covered by the grant
will be incurred in the subsequent periods.
(2) As at 31 March 2017 other liabilities consist primarily of a statutory contribution to the Social Benefits Fund in the amount
of PLN 32.923 thousand.
25. Employee benefits
The 31 March 2017 valuation of provisions for employee benefits is based on the assumptions used in the valuation
as at 31 December 2016.
The amount recognized in the quarterly consolidated statement of financial position arising out of the Group’s liabilities re lating
to employee benefit plans:
As at 31/03/2017
(unaudited)
As at 31/12/2016
(audited)
Defined post-employment benefit plans
– retirement compensation 151 376 153 230 – contributions to Company Social Benefits Fund for retirees 129 726 128 614 – death benefits 6 758 6 836 – transport benefits 33 450 33 286 Other employee benefits
– jubilee bonuses 267 854 268 875 – other employee benefits (unused annual leave / bonuses) 47 279 33 986 Total 636 443 624 827
Non-current liabilities 524 447 525 571 Current liabilities 111 996 99 256 Total 636 443 624 827

33
PKP CARGO GROUP
QUARTERLY CONDENSED CONSOLIDATED FINANCIAL STATEMENTS FOR THE PERIOD
OF 3 MONTHS ENDED 31 MARCH 2017, PREPARED IN ACCORDANCE WITH IFRS EU (IN PLN ‘000)
(translation of a document originally issued in Polish)
26. Other provisions
As at 31/03/2017
(unaudited)
As at 31/12/2016
(audited)
Provision for fines from antimonopoly office UOKiK 16 455 16 455 Reclamation provision 4 692 4 908 Provision for onerous contracts 7 770 8 159 Other 20 681 21 848 Total 49 598 51 370
Long-term provisions 25 974 26 420 Short-term provisions 23 624 24 950 Total 49 598 51 370
Provision for fines from antimonopoly office UOKiK
As at 31 March 2017 and 31 December 2016 the provision represented the Parent Company’s Management Board’s estimate
in connection with the likelihood of payment of two fines imposed by the Office of Competition and Consumer Protection (UOKiK),
amounting to PLN 14.224 thousand and PLN 2.231 thousand respectively.
No circumstances occurred in the period of 3 months ended 31 March 2017 causing the Management of the Parent Company
to change its estimates. Future events may lead to changes in the Management Board’s estimates in the subsequent reporting
periods.
Reclamation provision
The provision was formed to cover the future expenses associated with the obligation to reclaim land. The estimate corresponds
to the present value of the anticipated future expenses.
Provision for onerous contracts
The Group has recognized a provision for losses on a concluded property lease agreement, where the anticipated revenue
will not cover the lease costs incurred by the Group.
Other
This item includes mainly provisions for contractual penalties, disputed claims and litigation. According to the Parent Company’s
Management Board, the amount of other provisions as at 31 March 2017 and as at 31 December 2016 constitutes the best
estimate of the amount that will likely have to be paid. In the event of other fines being imposed, their amount would depend
on future events the result of which is uncertain. In consequence, the amount of the provisions may change in the subsequent
periods.

34
PKP CARGO GROUP
QUARTERLY CONDENSED CONSOLIDATED FINANCIAL STATEMENTS FOR THE PERIOD
OF 3 MONTHS ENDED 31 MARCH 2017, PREPARED IN ACCORDANCE WITH IFRS EU (IN PLN ‘000)
(translation of a document originally issued in Polish)
27. Financial instruments
27.1 Categories and classes of financial instruments
Financial assets by category and class Note As at
31/03/2017 (unaudited)
As at 31/12/2016
(audited)
Hedging financial instruments 9 950 235
Derivative instruments 14 9 950 235 Financial assets available for sale
8 390 8 501
Shares of unlisted companies 14 8 390 8 501 Loans and receivables
1 303 697 1 372 724
Trade receivables 17 604 197 616 000 Loans granted
14 1 052
796
Bank deposits 14 250 774 - Other 14 - 9 Cash and cash equivalents 18 447 674 755 919 Total
1 322 037 1 381 460
Financial liabilities by category and class Note As at
31/03/2017 (unaudited)
As at 31/12/2016
(audited)
Financial liabilities measured at fair value through profit or loss
113 345 118 704
Liabilities relating to put options for non-controlling interests 22 113 345 118 704 Hedging financial instruments (1) 205 187 205 938
Derivative instruments 22 1 086 1 227 Credits and loans 21 204 101 204 711 Financial liabilities measured at amortized cost 1 594 939 1 690 314
Credits and loans 21 1 237 628 1 266 697 Trade payables 24 334 303 377 215 Liabilities relating to purchase of non-current assets 24 23 008 46 402 Financial liabilities excluded from the scope of IAS 39
23 182 497 200 490
Total
2 095 968 2 215 446
Impairment losses on shares of unlisted companies and trade receivables are described in Notes 14 and 17, respectively,
to these Quarterly Condensed Consolidated Financial Statements.
(1) In the period from 1 January 2017 to 31 March 2017 the Group applied cash flow hedge accounting. The objective
of the hedging activities is to limit the effect of currency risk arising out of the EUR/PLN exchange rates on future cash flows.
The hedged item consists of the highly probable future cash flows expressed in EUR. The following hedging instruments have
been established:
investment credits expressed in EUR starting from 1 January 2016. The hedged cash flows are being realized since February
2017. As at 31 March 2017 the nominal value of the hedging instrument was EUR 48.367 thousand, which is the equivalent
of PLN 204.101 thousand,
currency forward contracts starting from 1 June 2016. The hedged cash flows are being realized since July 2016.
As at 31 March 2017 the value of the hedging instrument was PLN 9.950 thousand.
The item also includes a subsidiary’s valuation of hedging instruments in the form of:
interest rate swaps (IRS) to hedge cash flows relating to the future payment of lease payables at variable rates.
As at 31 March 2017 the value of the liabilities arising out of the hedging instrument is PLN 901 thousand,
currency forwards to hedge future cash flows. As at 31 March 2017 the value of the liabilities arising out of the valuation
of the hedging instrument is PLN 185 thousand.
The effect of hedge accounting valuation for the period of 3 months ended 31 March 2017 and for the period of 3 months ended
31 March 2016 on the quarterly consolidated statement of comprehensive income is presented in Note 27.5 to these Quarterly
Condensed Consolidated Financial Statements.

35
PKP CARGO GROUP
QUARTERLY CONDENSED CONSOLIDATED FINANCIAL STATEMENTS FOR THE PERIOD
OF 3 MONTHS ENDED 31 MARCH 2017, PREPARED IN ACCORDANCE WITH IFRS EU (IN PLN ‘000)
(translation of a document originally issued in Polish)
27.2 Fair value hierarchy
As at 31 March 2017 and 31 December 2016 financial instruments measured at fair value consisted of derivative financial
instruments and the liability relating to put options for non-controlling interests. The maturity dates of these instruments fall after
the end of the reporting period.
Financial assets and liabilities measured at fair value
As at 31/03/2017 (unaudited)
As at 31/12/2016 (audited)
Level 2 Level 3 Level 2 Level 3
Assets 9 950 - 235 -
Derivative instruments – forward contracts 9 950 - 235 -
Liabilities 1 086 113 345 1 227 118 704
Derivative instruments – forward contracts and IRS 1 086 - 1 227 -
Liability relating to put options for non-controlling interests - 113 345 - 118 704
27.3 Valuation of financial instruments measured at fair value
a) Liabilities relating to put options for non-controlling interests
The Parent Company concluded with Minezit S.E. (hereinafter “MSE”, “Minezit”), a minority shareholder holding 20%
of the shares of AWT, an Agreement relating to call and put options for a packet of non-controlling shares of Advanced World
Transport B.V. (hereinafter AWT B.V). Based on the Agreement the Parent Company is both the buyer of call options
and the issuer of put options, i.e. has the right to both buy the shares from MSE (exercising call option), as well as an obligation
to buy the shares from MSE (if MSE performs the put option).
In accordance with the Parent Company’s accounting policies:
the call option has not been recognized in the consolidated statement of financial position, as it did not meet the definition
of derivative instrument in IAS 39,
the put option has been recognized using the anticipated acquisition method.
The fair value of the liability relating to the put options is based on discounted cash flows at an interest rate appropriate for such
liabilities. The fair value of the put options depends on the results of the AWT Group and is determined as the product of EBITDA
and the multiplier specified in the Agreement, adjusted by net debt.
The main assumptions used in the valuation are:
EBITDA and net debt,
the EUR/PLN exchange rate,
the discount rate appropriate for such liabilities.
As at 31 March 2017, the model used in the valuation of liabilities relating to put options assumes that the put options
will be exercised within 1 year. The EBITDA and net debt parameters of the entity that is the subject of the option contract used
in the model were adopted based on financial data as at 31 December 2016. This results from the provisions of the Agreement,
under which when the options are exercised the data relating to AWT’s EBITDA and net debt will come from the last statutory
consolidated financial statements of AWT preceding the option exercise date.
All changes to the amount of the liability after its initial recognition affect the financial result through the financial revenue
and expenses. The amount recognized on re-measurement of the liability after its initial recognition is presented in Note 9
to these Quarterly Condensed Consolidated Financial Statements.
Level 3 unobservable input data used to measure the pub options at fair value are updated at the end of each financial year.
The change in the valuation of the put options as at 31 March 2017 compared to 31 December 2016 was caused by a change
in the EUR/PLN exchange rate. Level 3 unobservable input data are described in Note 32.1.5 to the Consolidated Financial
Statements of the PKP CARGO Group for the financial year ended 31 December 2016.

36
PKP CARGO GROUP
QUARTERLY CONDENSED CONSOLIDATED FINANCIAL STATEMENTS FOR THE PERIOD
OF 3 MONTHS ENDED 31 MARCH 2017, PREPARED IN ACCORDANCE WITH IFRS EU (IN PLN ‘000)
(translation of a document originally issued in Polish)
27.3 Valuation of financial instruments measured at fair value (continued)
b) Currency forward contracts
The fair value of currency forward contracts is determined based on the discounted future cash flows from concluded
transactions, calculated based on the difference between the forward and the transaction price. The forward price is calculated
based on an NBP fixing rate and the interest rate curve implicated by fxswap transactions.
c) Interest rate swaps IRS
The fair value of interest rate swaps is determined based on the discounted future cash flows from concluded transactions,
calculated based on the difference between the swap and the transaction price. The fair value is calculated and discounted
by the Bank based on WIBOR 1 M.
d) Other financial instruments
The Group does not disclose the fair values of financial instruments not measured at fair value as at the balance sheet date.
This is because the fair values of these financial instruments as at 31 March 2017 and as at 31 December 2016 did not differ
significantly from their values presented in the statement of financial position. The Group does not disclose the fair value of shares
not listed in active markets classified as financial assets available for sale. The Group is unable to reliably determine the fair value
of its shares of companies not listed in active markets. As at the balance sheet date they are measured at acquisition cost less
impairment losses.
27.4 Change in the valuation of financial instruments for Level 3 of the fair value hierarchy
3 months ended 31/03/2017
(unaudited)
3 months ended 31/03/2016
(unaudited)
Opening balance 118 704 155 198
Re-measurement (gains) / losses (5 359) 856 Closing balance 113 345 156 054
There were no transfers between level 2 and 3 of the fair value hierarchy in the period of 3 months ended 31 March 2017
or in the period of 3 months ended 31 March 2016.
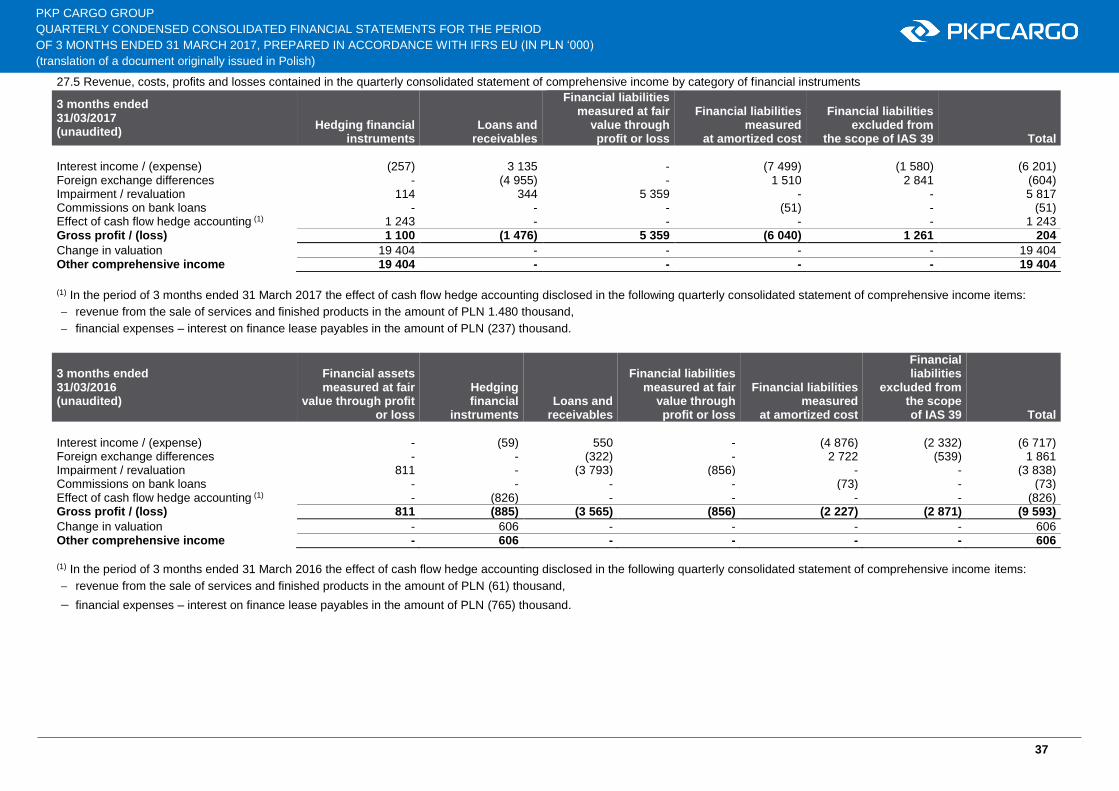
37
PKP CARGO GROUP
QUARTERLY CONDENSED CONSOLIDATED FINANCIAL STATEMENTS FOR THE PERIOD
OF 3 MONTHS ENDED 31 MARCH 2017, PREPARED IN ACCORDANCE WITH IFRS EU (IN PLN ‘000)
(translation of a document originally issued in Polish)
27.5 Revenue, costs, profits and losses contained in the quarterly consolidated statement of comprehensive income by category of financial instruments
3 months ended 31/03/2017 (unaudited)
Hedging financial instruments
Loans and receivables
Financial liabilities measured at fair
value through profit or loss
Financial liabilities measured
at amortized cost
Financial liabilities excluded from
the scope of IAS 39 Total
Interest income / (expense) (257) 3 135 - (7 499) (1 580) (6 201) Foreign exchange differences - (4 955) - 1 510 2 841 (604) Impairment / revaluation 114 344 5 359 - - 5 817 Commissions on bank loans - - - (51) - (51) Effect of cash flow hedge accounting (1) 1 243 - - - - 1 243 Gross profit / (loss) 1 100 (1 476) 5 359 (6 040) 1 261 204
Change in valuation 19 404 - - - - 19 404 Other comprehensive income 19 404 - - - - 19 404
(1) In the period of 3 months ended 31 March 2017 the effect of cash flow hedge accounting disclosed in the following quarterly consolidated statement of comprehensive income items:
revenue from the sale of services and finished products in the amount of PLN 1.480 thousand,
financial expenses – interest on finance lease payables in the amount of PLN (237) thousand.
3 months ended 31/03/2016 (unaudited)
Financial assets measured at fair
value through profit or loss
Hedging financial
instruments Loans and
receivables
Financial liabilities measured at fair
value through profit or loss
Financial liabilities measured
at amortized cost
Financial liabilities
excluded from the scope of IAS 39 Total
Interest income / (expense) - (59) 550 - (4 876) (2 332) (6 717) Foreign exchange differences - - (322) - 2 722 (539) 1 861 Impairment / revaluation 811 - (3 793) (856) - - (3 838) Commissions on bank loans - - - - (73) - (73) Effect of cash flow hedge accounting (1) - (826) - - - - (826) Gross profit / (loss) 811 (885) (3 565) (856) (2 227) (2 871) (9 593)
Change in valuation - 606 - - - - 606 Other comprehensive income - 606 - - - - 606
(1) In the period of 3 months ended 31 March 2016 the effect of cash flow hedge accounting disclosed in the following quarterly consolidated statement of comprehensive income items:
revenue from the sale of services and finished products in the amount of PLN (61) thousand,
financial expenses – interest on finance lease payables in the amount of PLN (765) thousand.

38
PKP CARGO GROUP
QUARTERLY CONDENSED CONSOLIDATED FINANCIAL STATEMENTS FOR THE PERIOD
OF 3 MONTHS ENDED 31 MARCH 2017, PREPARED IN ACCORDANCE WITH IFRS EU (IN PLN ‘000)
(translation of a document originally issued in Polish)
28. Transactions with related parties
28.1 Transaction with the State Treasury
In the period of 3 months ended 31 March 2017 and in the period of 3 months ended 31 March 2016, the State Treasury
was the ultimate parent company of the PKP CARGO Group. In view of this, all of the companies belonging (directly or indirectly)
to the State Treasury are the Group’s related parties and are presented broken down into related entities from the PKP Group
and other entities related to the State Treasury. In these Quarterly Condensed Consolidated Financial Statements
the Management Board of the Parent Company has disclosed transactions with significant related parties, identified as related parties
to the best of the Management’s knowledge.
No individual transactions concluded between the PKP CARGO Group and the State Treasury were identified in the period
of 3 months ended 31 March 2017 or in the period of 3 months ended 31 March 2016, which would be significant due to their unusual
scope or amount.
28.1.1 Transactions with related parties from PKP Group
In the period covered by these Quarterly Condensed Consolidated Financial Statements the Group concluded the following transactions with related parties from the PKP Group:
3 months ended 31/03/2017 (unaudited)
3 months ended 31/03/2016
(unaudited)
Sales to related parties
Purchases from related
parties Sales to
related parties
Purchases from related
parties
Parent company (PKP S.A.) 157 17 563 153 17 389 Subsidiaries / joint ventures - unconsolidated 2 104 4 502 3 705 4 639 Associates 985 89 246 116 Other related parties from PKP Group 8 932 153 727 8 653 148 534
As at 31/03/2017 (unaudited)
As at 31/12/2016
(audited)
Receivables from related
parties Liabilities to
related parties
Receivables from related
parties Liabilities to
related parties
Parent company (PKP S.A.) 1 959 6 373 1 247 7 811 Subsidiaries / joint ventures - unconsolidated 1 983 2 378 1 389 1 559 Associates 499 9 161 4 Other related parties from PKP Group 3 788 72 257 3 062 75 331
Purchase transactions with the parent company (PKP S.A.) consist primarily of leases and rentals of real estate, the supply
of utilities and occupational medicine services.
Sales transactions concluded with other related parties from the PKP Group consisted of such services as track line services, rental
of manned engines, financial settlements with foreign rail companies, rolling stock maintenance, sub-lease of real estate. Purchase
transactions consisted mainly of access to rail infrastructure, lease of real estate, supply of utilities, maintenance of rail traffic control
equipment, network maintenance services, IT services, purchase of transport benefits for employees and retirees.
28.1.2 Transactions with other related parties of the State Treasury
No individual transactions concluded between the Group and the State Treasury and the State Treasury’s related parties were
identified in the period of 3 months ended 31 March 2017 or the period of 3 months ended 31 March 2016, which would
be significant due to their unusual scope or amount. In the periods covered by these Quarterly Condensed Consolidated Financial
Statements the Group’s most significant customers that are companies controlled by the State Treasury were Jastrzębska Spółka
Węglowa S.A., Azoty Group, Węglokoks S.A. and PGE Górnictwo i Energetyka Konwencjonalna S.A. Whereas in the periods
covered by these Quarterly Condensed Consolidated Financial Statements no significant purchases were recorded from companies
controlled by the State Treasury.
All transactions with related parties were performed on market terms.

39
PKP CARGO GROUP
QUARTERLY CONDENSED CONSOLIDATED FINANCIAL STATEMENTS FOR THE PERIOD
OF 3 MONTHS ENDED 31 MARCH 2017, PREPARED IN ACCORDANCE WITH IFRS EU (IN PLN ‘000)
(translation of a document originally issued in Polish)
28.2 Loans granted to/received from related parties
As at 31/03/2017
(unaudited)
As at 31/12/2016
(audited)
Loans granted to related parties 1 052 796 Loans received from related parties 3 478 3 605
28.3 Remuneration of key management personnel
Remuneration of members of the Parent Company’s Management Board:
3 months ended
31/03/2017 (unaudited)
3 months ended
31/03/2016 (unaudited)
Short-term benefits 678 844 Post-employment benefits 568 28 Severance benefits - 432 Total 1 246 1 304
Remuneration of members of the Parent Company’s Supervisory Board:
3 months ended
31/03/2017 (unaudited)
3 months ended
31/03/2016 (unaudited)
Short-term benefits 319 250 Total 319 250
Remuneration of the Parent Company’s other key personnel (Representatives-Managing Directors):
3 months ended
31/03/2017 (unaudited)
3 months ended
31/03/2016 (unaudited)
Short-term benefits - 424 Post-employment benefits 268 189 Total 268 613
Remuneration of members of the Management Boards of subsidiary companies:
3 months ended 31/03/2017
(unaudited)
3 months ended 31/03/2016
(unaudited)
Short-term benefits 1 899 1 782 Post-employment benefits 353 288 Severance benefits - 401 Total 2 252 2 471
Remuneration of members of the Supervisory Boards of subsidiary companies:
3 months ended 31/03/2017
(unaudited)
3 months ended 31/03/2016
(unaudited)
Short-term benefits 399 337 Total 399 337
Remuneration of other key personnel (Representatives-Managing Directors) of subsidiary companies:
3 months ended 31/03/2017
(unaudited)
3 months ended 31/03/2016
(unaudited)
Short-term benefits 1 639 1 214 Severance benefits 31 145 Total 1 670 1 359
No loan or guarantee transactions were concluded with the Group by members of the key management personnel of the Parent
Company or of the subsidiaries of the PKP CARGO Group in the period of 3 months ended 31 March 2017 or the period of 3 months
ended 31 March 2016.
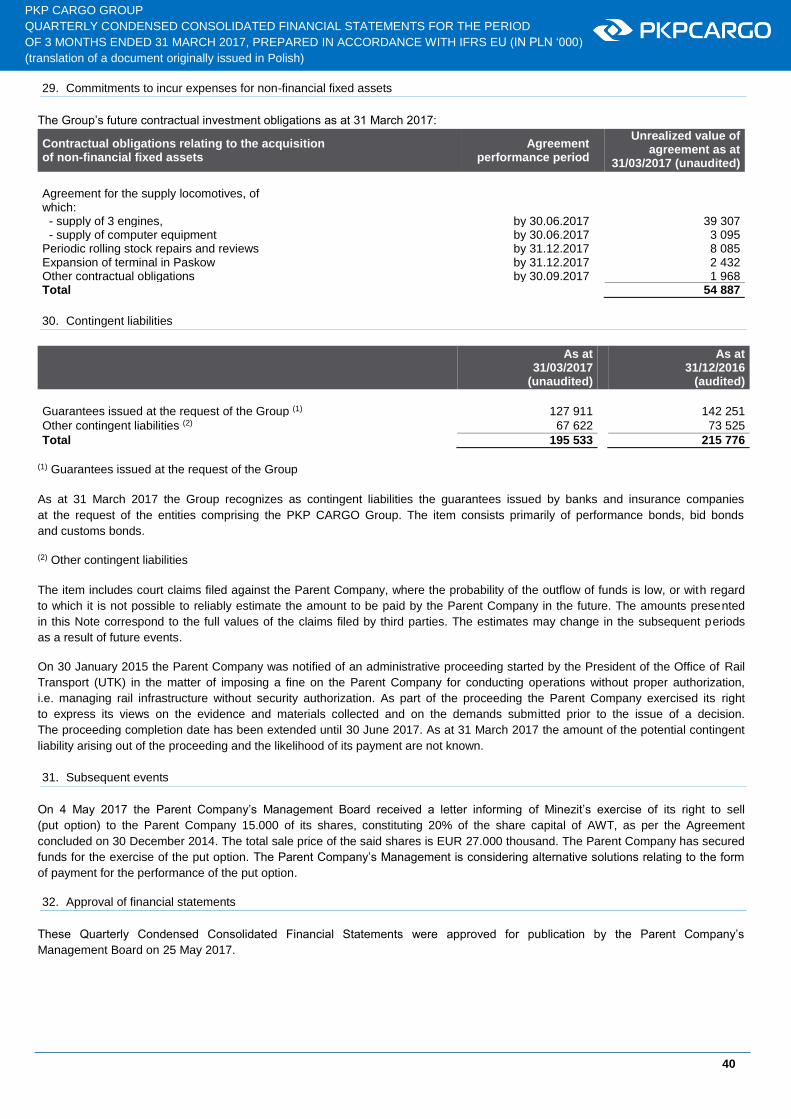
40
PKP CARGO GROUP
QUARTERLY CONDENSED CONSOLIDATED FINANCIAL STATEMENTS FOR THE PERIOD
OF 3 MONTHS ENDED 31 MARCH 2017, PREPARED IN ACCORDANCE WITH IFRS EU (IN PLN ‘000)
(translation of a document originally issued in Polish)
29. Commitments to incur expenses for non-financial fixed assets
The Group’s future contractual investment obligations as at 31 March 2017:
Contractual obligations relating to the acquisition of non-financial fixed assets
Agreement performance period
Unrealized value of agreement as at
31/03/2017 (unaudited)
Agreement for the supply locomotives, of which:
- supply of 3 engines, by 30.06.2017 39 307 - supply of computer equipment by 30.06.2017 3 095 Periodic rolling stock repairs and reviews by 31.12.2017 8 085 Expansion of terminal in Paskow by 31.12.2017 2 432 Other contractual obligations by 30.09.2017 1 968 Total 54 887
30. Contingent liabilities
As at 31/03/2017
(unaudited)
As at 31/12/2016
(audited)
Guarantees issued at the request of the Group (1) 127 911 142 251
Other contingent liabilities (2) 67 622 73 525
Total 195 533
215 776 (1) Guarantees issued at the request of the Group
As at 31 March 2017 the Group recognizes as contingent liabilities the guarantees issued by banks and insurance companies
at the request of the entities comprising the PKP CARGO Group. The item consists primarily of performance bonds, bid bonds
and customs bonds.
(2) Other contingent liabilities
The item includes court claims filed against the Parent Company, where the probability of the outflow of funds is low, or with regard
to which it is not possible to reliably estimate the amount to be paid by the Parent Company in the future. The amounts presented
in this Note correspond to the full values of the claims filed by third parties. The estimates may change in the subsequent periods
as a result of future events.
On 30 January 2015 the Parent Company was notified of an administrative proceeding started by the President of the Office of Rail
Transport (UTK) in the matter of imposing a fine on the Parent Company for conducting operations without proper authorization,
i.e. managing rail infrastructure without security authorization. As part of the proceeding the Parent Company exercised its right
to express its views on the evidence and materials collected and on the demands submitted prior to the issue of a decision.
The proceeding completion date has been extended until 30 June 2017. As at 31 March 2017 the amount of the potential contingent
liability arising out of the proceeding and the likelihood of its payment are not known.
31. Subsequent events
On 4 May 2017 the Parent Company’s Management Board received a letter informing of Minezit’s exercise of its right to sell
(put option) to the Parent Company 15.000 of its shares, constituting 20% of the share capital of AWT, as per the Agreement
concluded on 30 December 2014. The total sale price of the said shares is EUR 27.000 thousand. The Parent Company has secured
funds for the exercise of the put option. The Parent Company’s Management is considering alternative solutions relating to the form
of payment for the performance of the put option.
32. Approval of financial statements
These Quarterly Condensed Consolidated Financial Statements were approved for publication by the Parent Company’s
Management Board on 25 May 2017.

41
PKP CARGO GROUP
QUARTERLY CONDENSED CONSOLIDATED FINANCIAL STATEMENTS FOR THE PERIOD
OF 3 MONTHS ENDED 31 MARCH 2017, PREPARED IN ACCORDANCE WITH IFRS EU (IN PLN ‘000)
(translation of a document originally issued in Polish)
The Parent Company’s Management Board
Maciej Libiszewski President of the Management Board
Grzegorz Fingas Member of the Management Board
Jarosław Klasa Member of the Management Board
Arkadiusz Olewnik Member of the Management Board
Zenon Kozendra Member of the Management Board
Warsaw, 25 May 2017


1
QUARTERLY FINANCIAL INFORMATION PKP CARGO S.A. FOR THE PERIOD OF 3 MONTHS
ENDED 31 MARCH 2017, PREPARED IN ACCORDANCE WITH IFRS EU (IN PLN ‘000)
(translation of a document originally issued in Polish)
2016 ROKU SPORZĄDZONA WEDŁUG MSSF UE
SEPARATE STATEMENT OF COMPREHENSIVE INCOME FROM 1 JANUARY 2017 TO 31 MARCH 2017
for the 3 months period ended
31/03/2017 (unaudited)
for the 3 months period ended
31/03/2016 (unaudited)
Revenue from sales of services 811 880 743 644
Revenue from sales of raw materials 1 747 4 270
Other operating revenue 4 698 9 380
Total operating revenue 818 325 757 294
Depreciation / amortisation and impairment losses 118 923 116 466
Consumption of raw materials and energy 132 694 127 477
External services 265 270 248 061
Taxes and charges 8 514 5 006
Employee benefits 282 774 293 359
Other expenses by kind 9 797 9 672
Cost of raw materials sold 684
3 824
Other operating expenses 5 376 9 583
Total operating expenses 824 032 813 448
Profit / (loss) on operating activities (5 707) (56 154)
Financial revenue 8 205 1 447
Financial expenses 12 287 11 493
Profit / (loss) before tax (9 789) (66 200)
Income tax expense (603) (7 951)
NET PROFIT / (LOSS) (9 186)
(58 249)
Other comprehensive income
Other comprehensive income that will be reclassified to profit or loss in subsequent periods:
15 603 19
The effective portion of changes in fair value of cash-flow hedging instruments
19 263 24
Income tax on other comprehensive income
(3 660) (5)
TOTAL COMPREHENSIVE INCOME 6 417 (58 230)
Earnings per share (PLN per share)
Earnings per share on operations (basic): (0,21)
(1,30)
Earnings per share on operations (diluted): (0,21)
(1,30)

2
QUARTERLY FINANCIAL INFORMATION PKP CARGO S.A. FOR THE PERIOD OF 3 MONTHS
ENDED 31 MARCH 2017, PREPARED IN ACCORDANCE WITH IFRS EU (IN PLN ‘000)
(translation of a document originally issued in Polish)
2016 ROKU SPORZĄDZONA WEDŁUG MSSF UE
SEPARATE STATEMENT OF FINANCIAL POSITION PREPARED AS AT 31 MARCH 2017
As at 31/03/2017
(unaudited)
As at 31/12/2016
(audited)
ASSETS
Non-current assets
Property, plant and equipment 3 512 729 3 561 993
Intangible assets 47 610 50 778
Investments in subsidiaries and associates 737 974 737 974
Other long-term financial assets 10 161 6 169
Other long-term non-financial assets 18 593 8 162
Deferred tax assets 80 684 76 244
Total non-current assets 4 407 751 4 441 320
Current assets
Inventories 69 957 59 701
Trade and other receivables 410 086 413 607
Income tax receivables - 1 304
Other short-term financial assets 263 480 87
Other short-term non-financial assets 38 518 19 716
Cash and cash equivalents 266 889 611 990
1 048 930 1 106 405
Non-current assets classified as held for sale 6 000 6 000
Total current assets 1 054 930 1 112 405
Total assets 5 462 681 5 553 725
EQUITY AND LIABILITIES
Equity
Share capital 2 239 346 2 239 346
Share premium 589 202 589 202
Other items of equity 34 018 18 415
Retained earnings 162 291 171 477
Total equity
3 024 857 3 018 440
Non-current liabilities
Long-term bank loans and credit facilities
1 082 230 1 170 224
Long-term finance lease liabilities and leases with purchase option
24 928 36 159
Long-term trade and other payables
42 582
Long-term provisions for employee benefits
473 112 473 965
Other long-term provisions
16 455 16 455
Non-current liabilities
1 596 767 1 697 385
Current liabilities
Short-term bank loans and credit facilities
210 134 178 170
Short-term finance lease liabilities and leases with purchase option
42 940 43 176
Short-term trade and other payables
441 458 465 411
Short-term provisions for employee benefits
89 877 80 524
Other short-term provisions
11 636 11 640
Other short-term financial liabilities
37 279 58 979
Current tax liabilities
7 733 -
Total current liabilities
841 057 837 900
Total liabilities
2 437 824 2 535 285
Total equity and liabilities
5 462 681 5 553 725

3
Grupa Kapitałowa PKP CARGO Sródroczne Skrócone Skonsolidowane Sprawozdanie Finansowe za okres 6 miesięcy zakończony dnia 30 czerwca 2015 roku sporządzone według MSSF UE
QUARTERLY FINANCIAL INFORMATION PKP CARGO S.A. FOR THE PERIOD OF 3 MONTHS
ENDED 31 MARCH 2017, PREPARED IN ACCORDANCE WITH IFRS EU (IN PLN ‘000)
(translation of a document originally issued in Polish)
(TRANSLATION OF A DOCUMENT ORIGINALLY ISSUED IN POLISH)
STATEMENT OF CHANGES IN SEPARATE EQUITY FOR THE PERIOD FROM 1 JANUARY 2017 TO 31 MARCH 2017
Other items of equity
Share capital Share premium
Actuarial gains / (losses) on post-employment
benefits
Gains / (losses) on a cash flow
hedging instrument Retained earnings Total
Balance as at 1/01/2017 (audited)
2 239 346 589 202 22 249 (3 834) 171 477 3 018 440
Net result for the period - - - - (9 186) (9 186)
Other net comprehensive income for the period
- - - 15 603 - 15 603
Total comprehensive income
- - - 15 603 (9 186) 6 417
Balance as at 31/03/2017 (unaudited)
2 239 346 589 202 22 249 11 769 162 291 3 024 857
Balance as at 1/01/2016 (audited)
2 239 346 589 202 3 726 - 240 042 3 072 316
Net result for the period - - - - (58 249) (58 249)
Other net comprehensive income for the period
- - -
19 - 19
Total comprehensive income
- - - 19 (58 249) (58 230)
Balance as at 31/03/2016 (unaudited)
2 239 346 589 202 3 726 19 181 793 3 014 086

4
QUARTERLY FINANCIAL INFORMATION PKP CARGO S.A. FOR THE PERIOD OF 3 MONTHS
ENDED 31 MARCH 2017, PREPARED IN ACCORDANCE WITH IFRS EU (IN PLN ‘000)
(translation of a document originally issued in Polish)
(TRANSLATION OF A DOCUMENT ORIGINALLY ISSUED IN POLISH)
SEPARATE STATEMENT OF CASH FLOWS FROM 1 JANUARY 2017 TO 31 MARCH 2017
for the 3 months period ended
31/03/2017 (unaudited)
for the 3 months period ended
31/03/2016 (unaudited)
Cash flows from operating activities
Profit / (loss) before tax (9 789) (66 200)
Adjustments:
Depreciation of property, plant and equipment and amortisation of intangible assets
118 923 116 131
Impairment of fixed assets - 335
(Gain) / loss on disposal / liquidation of property, plant and equipment and intangible assets classified as held for sale
1 048 (586)
(Profit) / loss on investing activities (2 853) (2 261)
(Gains) / losses on interest, dividends 5 157 5 592
Interest received / (paid) 493 (275)
Income taxes received / (paid) (596) (2 067)
Other adjustments 9 600 -
Changes in working capital:
(Increase) / decrease in trade and other receivables 4 663 (47 882)
(Increase) / decrease in inventory 62 4 232
(Increase) / decrease in other assets (28 247) (34 695)
Increase / (decrease) in trade and other payables (15 398) (122 313)
Increase / (decrease) in other financial liabilities (2 483) (423)
Increase / (decrease) in provisions 8 497 9 782
Net cash (used in) / provided by operating activities 89 077 (140 630)
Cash flows from investing activities
Acquisition of property, plant and equipment and intangible assets
(97 231) (137 812)
Proceeds from sale of property, plant and equipment, intangible assets and non-current assets classified as held for sale
36 2 046
Interest received 949 56
Dividend received 600 -
Outflows of bank deposits over 3 months
(250 000) -
Net cash (used in) / provided by investing activities (345 646) (135 710)
Cash flows from financing activities
Payments of liabilities under finance lease (8 615) (15 947)
Payments of interest under lease agreement (278) (857)
Proceeds from credit facilities / loans received 40 349 199 043
Repayments of credit facilities / loans received (86 597) (27 546)
Interest on credit facilities / loans received (7 068) (3 382)
Grants received - 1 627
Cash pool inflows / (outflows) (26 048) 52 954
Other inflows / (outflows) from financing activities (275) (968)
Net cash (used in) / provided by financing activities (88 532) 204 924
Net increase / (decrease) in cash and cash equivalents (345 101) (71 416)
Opening balance of cash and cash equivalents 611 990 84 097
Closing balance of cash and cash equivalents 266 889 12 681

1
Consolidated report for Q1 2015
PKP CARGO GROUP
ADDITIONAL INFORMATION TO THE CONSOLIDATED QUARTERLY REPORT
FOR Q1 2017
ADDITIONAL INFORMATION TO THE CONSOLIDATED QUARTERLY REPORT
FOR Q1 2017
TABLE OF CONTENTS
1. Financial highlights of the PKP CARGO Group and PKP CARGO S.A. .............................................................................. 4
2. Organization of the PKP CARGO Group ............................................................................................................................. 6
2.1. Highlights on the Company and the PKP CARGO Group ................................................................................................. 6
2.2. Consolidated entities ........................................................................................................................................................ 6
2.3. Structure of the PKP CARGO Group ................................................................................................................................ 9
3. Information about the Parent Company ............................................................................................................................. 12
3.1. Composition of the Management Board and Supervisory Board of PKP CARGO S.A. .................................................. 12
3.2. Structure of PKP CARGO S.A.’s share capital ................................................................................................................ 16
3.3. Shareholders holding at least 5% of the total votes ........................................................................................................ 17
3.4. Listing of shares held by management and supervisory board members ....................................................................... 17
4. Key areas of operation of the PKP CARGO Group ........................................................................................................... 18
4.1. Macroeconomic environment .......................................................................................................................................... 18
4.2. Freight transportation activity .......................................................................................................................................... 25
4.2.1. Rail transport market in Poland....................................................................................................................................... 25
4.2.2. Position of the PKP CARGO Group in the rail transport market in Poland...................................................................... 26
4.2.3. Rail freight transport market in the Czech Republic ........................................................................................................ 28
4.2.4. Position of the AWT Group in the rail transport market in the Czech Republic ............................................................... 29
4.2.5. PKP CARGO Group's rail transport ................................................................................................................................ 31
4.3. Other services................................................................................................................................................................. 33
4.4. Headcount ...................................................................................................................................................................... 34
4.5. PKP CARGO Group’s investments ................................................................................................................................. 35
4.6. Key information and events ............................................................................................................................................ 36
5. Analysis of the financial situation and assets of the PKP CARGO Group.......................................................................... 37
5.1. Key economic and financial figures ................................................................................................................................ 37
5.1.1. Statement of comprehensive income .............................................................................................................................. 37
5.1.2. Description of the structure of assets and liabilities ........................................................................................................ 40
5.1.3. Cash flow statement ....................................................................................................................................................... 42
5.1.4. Selected financial and operating ratios ........................................................................................................................... 43
5.2. Factors that will affect the financial performance in the next quarter .............................................................................. 44
5.3. The Management Board’s stance with respect to the possibility of realizing previously published result forecasts
for the year...................................................................................................................................................................... 47
5.4. Information about production assets ............................................................................................................................... 47
5.4.1. Rolling stock ................................................................................................................................................................... 47
5.4.2. Real estate ...................................................................................................................................................................... 48
6. Other key information and events ...................................................................................................................................... 49
6.1. Proceedings pending before courts, arbitration bodies or public administration authorities ............................................ 49
6.2. Information on transactions with related parties .............................................................................................................. 49
6.3. Information on granted guarantees and sureties of loans or credits ............................................................................... 49
6.4. Other information of relevance for evaluation of the employment situation, financial standing, financial performance,
assets and their movements as well as information of relevance for assessment of the ability of the Issuer and other
Group companies to pay their debts. .............................................................................................................................. 49

2
Consolidated report for Q1 2015
PKP CARGO GROUP
ADDITIONAL INFORMATION TO THE CONSOLIDATED QUARTERLY REPORT
FOR Q1 2017
LIST OF TABLES
Table 1 Financial highlights of the PKP CARGO Group .................................................................................................................. 4
Table 2 Financial highlights of PKP CARGO S.A. ........................................................................................................................... 5
Table 3 Composition of the PKP CARGO S.A. Management Board from 1 January 2017 to the delivery date of this report ....... 12
Table 4 Composition of the PKP CARGO S.A. Supervisory Board from 1 January 2017 to the delivery date of this report ......... 15
Table 5 Composition of the Audit Committee of the PKP CARGO S.A. Supervisory Board from 1 January 2017 to the delivery
date of this report ............................................................................................................................................................. 15
Table 6 Composition of the Nomination Committee of the PKP CARGO S.A. Supervisory Board from 1 January 2017 to the
delivery date of this report ................................................................................................................................................ 16
Table 7 Composition of the Strategic Committee of the PKP CARGO S.A. Supervisory Board from 1 January 2017 to the
delivery date of this report ................................................................................................................................................ 16
Table 8 Structure of PKP CARGO S.A.’s share capital ................................................................................................................. 16
Table 9 Shareholder structure of PKP CARGO S.A. as at 31 March 2017 and as at the delivery date of this report .................... 17
Table 10 PKP CARGO S.A. shares held by Management Board members .................................................................................. 17
Table 11 PKP CARGO S.A. shares held by Supervisory Board members .................................................................................... 17
Table 12 Freight turnover of the PKP CARGO Group in Q1 2017 and the corresponding period of 2016 .................................... 32
Table 13 Freight volume of the PKP CARGO Group in Q1 2017 and the corresponding period of 2016 ...................................... 33
Table 14 Average haul of the PKP CARGO Group in Q1 2017 and the corresponding period of 2016......................................... 33
Table 15 Headcount in Q1 2017 and 2016 in the PKP CARGO Group (active employees only) .................................................. 34
Table 16 Average headcount in Q1 2017 and Q1 2016 in the PKP CARGO Group (active employees only) ............................... 34
Table 17 Movement in the headcount structure in Q1 2017 in the PKP CARGO Group (active employees only) ........................ 35
Table 18 Capital expenditures on property, plant and equipment and intangible assets in the PKP CARGO Group in Q1 2017
compared to Q1 2016 (thousands of PLN) ..................................................................................................................... 35
Table 19 Key information and events which occurred in Q1 2017 and after the balance sheet date ............................................ 36
Table 20 Results of the PKP CARGO Group in Q1 2017 compared to the corresponding period of 2016 (thousands of PLN) .... 37
Table 21 Operating revenue of the PKP CARGO Group in Q1 2017 compared to the corresponding period of 2016
(thousands of PLN) ........................................................................................................................................................ 37
Table 22 Operating expenses of the PKP CARGO Group in Q1 2017 compared to the corresponding period of 2016
(thousands of PLN) ........................................................................................................................................................ 38
Table 23 Financial activities of the PKP CARGO Group in Q1 2017 compared to the corresponding period of 2016
(thousands of PLN) ........................................................................................................................................................ 39
Table 24 Horizontal and vertical analysis of PKP CARGO Group’s assets (thousands of PLN) ................................................... 40
Table 25 Horizontal and vertical analysis of PKP CARGO Group’s liabilities (thousands of PLN) ................................................ 41
Table 26 Main line items in the PKP CARGO Group’s cash flow statement in Q1 2017 compared to the corresponding
period of 2016. ............................................................................................................................................................... 42
Table 27 Key financial and operating ratios in Q1 2017 compared to the corresponding period of 2016. ..................................... 43
Table 28 Structure of the locomotives used by the PKP CARGO Group by traction type and ownership ..................................... 47
Table 29 Structure of the wagons used by the PKP CARGO Group, by ownership ...................................................................... 47
Table 30 Real estate owned and used by the PKP CARGO Group as at 31 March 2017 compared to 31 December 2016. ....... 48
3
Consolidated report for Q1 2015
PKP CARGO GROUP
ADDITIONAL INFORMATION TO THE CONSOLIDATED QUARTERLY REPORT
FOR Q1 2017
LIST OF FIGURES
Figure 1 Structure of equity links of PKP CARGO S.A. as at 31 March 2017 ............................................................................... 10
Figure 2 Structure of equity links of AWT as at 31 March 2017. ................................................................................................... 11
Figure 3 Duties and responsibilities of the Parent Company’s Management Board Members ...................................................... 14
Figure 4 GDP growth in Poland in 2011-2016 per annum and 2017, 2018 and 2019 forecasts ................................................... 18
Figure 5 Real GDP growth in the Czech Republic in 2012-2016 and 2017 and 2018 forecasts ................................................... 19
Figure 6 Coal prices on ARA vs. RB markets* .............................................................................................................................. 22
Figure 7 Quarterly extraction of hard coal in the Czech Republic in 2015-2017 (thousand tons) ................................................. 24
Figure 8 Rail freight volumes in Poland (in million tons) in individual quarters of 2014-2017 ....................................................... 26
Figure 9 Rail freight turnover in Poland (in billions tkm) in individual quarters of 2014-2017 ........................................................ 26
Figure 10 Share of the PKP CARGO Group in freight volume in 2014-2017 in Poland ................................................................ 26
Figure 11 Share of the PKP CARGO Group in freight turnover in 2014-2017 in Poland ............................................................... 27
Figure 12 Market shares of the biggest rail operators in Poland in Q1 2017, by freight volume and freight turnover ................... 27
Figure 13 Rail freight transport in the Czech Republic, by freight volume in individual quarters of 2014-2016 (million tons) ....... 28
Figure 14 Rail freight transport in the Czech Republic, by freight turnover in individual quarters of 2014-2016 (billion tkm) ........ 28
Figure 15 AWT a.s.’s market shares in terms of freight volume in the Czech Republic quarterly in 2014-2016. ........................... 29
Figure 16 AWT a.s.’s market shares in terms of freight turnover in the Czech Republic quarterly in 2014-2016. ......................... 29
Figure 17 Market shares of the biggest rail operators by operational freight turnover in the Czech Republic in January-March
2017 (btkm)..................................................................................................................................................................... 30

4
Consolidated report for Q1 2015
PKP CARGO GROUP
ADDITIONAL INFORMATION TO THE CONSOLIDATED QUARTERLY REPORT
FOR Q1 2017
1. Financial highlights of the PKP CARGO Group and PKP CARGO S.A.
Table 1 Financial highlights of the PKP CARGO Group
PKP CARGO Group
PLN 000s1 EUR 000s
Q1 2017 Q1 2016
Q1 2017 Q1 2016
(restated*) (restated*)
Operating revenues 1,100,201 1,034,354 256,511 237,460
Profit / (loss) on operating activities 3,176 -61,808 740 -14,189
Profit (loss) before tax 98 -74,613 23 -17,129
Net profit (loss) from continuing operations -1,434 -66,378 -334 -15,239
Total comprehensive income attributable to the owners of the parent company
-18,474 -65,306 -4,307 -14,993
Weighted average number of shares 44,786,917 44,786,917 44,786,917 44,786,917
Weighted average number of shares used to calculate diluted profit
44,786,917 44,786,917 44,786,917 44,786,917
Earnings / (loss) per share (PLN/EUR) -0.03 -1.48 - -0.34
Diluted earnings / (loss) per share (PLN/EUR) -0.03 -1.48 - -0.34
Net cash flow from operating activities** 92,638 -112,436 21,598 -25,812
Net cash flow from investing activities -359,010 -170,489 -83,703 -39,140
Net cash flow from financing activities -36,200 144,634 -8,440 33,204
Movement in cash and cash equivalents -302,572 -138,291 -70,545 -31,748
31/03/2017 31/12/2016 31/03/2017 31/12/2016
Non-current assets 4,851,601 4,942,861 1,149,723 1,117,283
Current assets 1,511,211 1,547,936 358,124 349,895
Share capital 2,239,346 2,239,346 530,676 506,181
Equity 3,224,395 3,242,869 764,111 733,017
Non-current liabilities 1,983,629 2,076,081 470,077 469,277
Current liabilities 1,154,788 1,171,847 273,659 264,884
Source: Condensed quarterly consolidated financial statements of the PKP CARGO Group for the period of 3 months ended 31 March 2017
prepared according to EU IFRS
* restatement of comparative data is described in detail in Note2 5 to the Condensed Quarterly Consolidated Financial Statements
** including the payment of liabilities stemming from the implemented 1st and 2nd Voluntary Redundancy Programs in the amount of PLN 48.2 million in Q1 2016.
1 In this document, in the Additional Information to the Consolidated Quarterly Report of the PKP CARGO Group for Q1 2017, to facilitate the reading, some figures
were rounded off which may cause slight deviations in the presented data. If there was a risk of distortion, data were presented with more accuracy. 2 Any reference to a Note in these Statements should be construed as a Note to the Condensed Quarterly Consolidated Financial Statements of the PKP CARGO
Group for the period of 3 months ended 31 March 2017 prepared according to EU IFRS.

5
Consolidated report for Q1 2015
PKP CARGO GROUP
ADDITIONAL INFORMATION TO THE CONSOLIDATED QUARTERLY REPORT
FOR Q1 2017
Table 2 Financial highlights of PKP CARGO S.A.
PKP CARGO S.A. PLN 000s EUR 000s
Q1 2017 Q1 2016 Q1 2017 Q1 2016
Operating revenues 818,325 757,294 190,792 173,855
Profit / (loss) on operating activities -5,707 -56,154 -1,331 -12,891
Profit (loss) before tax -9,789 -66,200 -2,282 -15,198
Net profit (loss) from continuing operations -9,186 -58,249 -2,142 -13,372
Comprehensive income 6,417 -58,230 1,496 -13,368
Weighted average number of shares 44,786,917 44,786,917 44,786,917 44,786,917
Weighted average number of shares used to calculate diluted profit
44,786,917 44,786,917 44,786,917 44,786,917
Earnings / (loss) per share (PLN/EUR) -0.21 -1.30 -0.05 -0.30
Diluted earnings / (loss) per share (PLN/EUR) -0.21 -1.30 -0.05 -0.30
Net cash flow from operating activities* 89,077 -140,630 20,768 -32,285
Net cash flow from investing activities -345,646 -135,710 -80,587 -31,155
Net cash flow from financing activities -88,532 204,924 -20,641 47,045
Movement in cash and cash equivalents -345,101 -71,416 -80,460 -16,395
31/03/2017 31/12/2016 31/03/2017 31/12/2016
Non-current assets 4,407,751 4,441,320 1,044,540 1,003,915
Current assets 1,048,930 1,106,405 248,574 250,092
Non-current assets classified as held for sale 6,000 6,000 1,422 1,356
Share capital 2,239,346 2,239,346 530,676 506,181
Equity 3,024,857 3,018,440 716,825 682,287
Non-current liabilities 1,596,767 1,697,385 378,399 383,677
Current liabilities 841,057 837,900 199,312 189,399
Source: Quarterly Financial Information of PKP CARGO S.A. for the period of 3 months ended 31 March 2017 prepared according to EU IFRS
* including the payment of liabilities stemming from the implemented 1st and 2nd Voluntary Redundancy Programs in the amount of PLN 47.4
million in Q1 2016.
The following average PLN to EUR exchange rates set by the National Bank of Poland have been used to translate selected
financial data in the periods covered by the Quarterly Financial Information of PKP CARGO S.A. and the Condensed Quarterly
Consolidated Financial Statements:
exchange rate in force on the last day of the reporting period: 31 March 2017: EUR 1 = PLN 4.2198; 31 December
2016: EUR 1 = PLN 4.4240,
the average exchange rate in the period calculated as the arithmetic mean of the exchange rates prevailing on the last
day of each month in a given period: 1 January – 31 March 2017: EUR 1 = PLN 4.2891, 1 January – 31 March 2016:
EUR 1 = PLN 4.3559.

6
Consolidated report for Q1 2015
PKP CARGO GROUP
ADDITIONAL INFORMATION TO THE CONSOLIDATED QUARTERLY REPORT
FOR Q1 2017
2. Organization of the PKP CARGO Group
2.1. Highlights on the Company and the PKP CARGO Group3
The PKP CARGO Group is a major rail freight operator in the European Union („EU”). The Group’s development is focused
on enhancing and extending its operations in terms of its product range and geographic area. At present, the Group is the leader
on the Polish market (according to the Office of Rail Transport - UTK4) and it is the second largest operator on the Czech market
(according to SZDC5). Notwithstanding the areas mentioned above, the Group conducts operations that it is constantly
developing in Czech Republic, Slovakia, Germany, Austria, the Netherlands, Lithuania and Hungary.
The Group (the Parent Company, AWT a.s., PKP CARGO SERVICE) offers domestic and international transport of cargo as well
as comprehensive logistics services for rail freight. In addition, the following services are provided to support clients
and supplement the offering:
intermodal logistics;
freight forwarding (domestic and international);
terminal services;
siding and traction services;
maintenance and repair of rolling stock;
reclamation activity.
2.2. Consolidated entities
The Condensed Quarterly Consolidated Financial Statements for the period of 3 months ended 31 March 2017 encompass
PKP CARGO S.A. and 15 subsidiaries consolidated by the full method:
1. PKP CARGO SERVICE Sp. z o.o.
2. PKP CARGOTABOR Sp. z o.o.
3. PKP CARGOTABOR USŁUGI Sp. z o.o.
4. PKP CARGO Centrum Logistyczne Małaszewicze Sp. z o.o.
5. PKP CARGO Centrum Logistyczne Medyka-Żurawica Sp. z o.o.
6. CARGOSPED TERMINAL BRANIEWO Sp. z o.o.
7. CARGOTOR Sp. z o.o.
8. PKP CARGO CONNECT Sp. z o.o.
9. Advanced World Transport B.V. (“AWT B.V.”, “AWT”)
10. Advanced World Transport a.s. (“AWT a.s.”)
11. AWT Rosco a.s.
12. AWT Cechofracht a.s.
13. AWT Rekultivace a.s.
14. AWT Coal Logistics s.r.o.
15. AWT Rail HU Zrt.
In addition, the following companies are measured using the equity method as at 31 March 2017 in the PKP CARGO Group’s
Condensed Quarterly Consolidated Financial Statements:
3 Whenever the Report mentions:
the Company or the Parent Company, it should be construed to mean PKP CARGO S.A.,
PKP CARGO Group, Group or Capital Group, it should be construed to mean PKP CARGO S.A. and its subsidiaries collectively. 4 Office of Rail Transport
5 Správa železniční dopravní cesty (entity responsible for management of the state railway network in the Czech Republic)
7
Consolidated report for Q1 2015
PKP CARGO GROUP
ADDITIONAL INFORMATION TO THE CONSOLIDATED QUARTERLY REPORT
FOR Q1 2017
COSCO Shipping Lines (POLAND) Sp. z o.o.
Pol – Rail S.r.l.
Terminale Przeładunkowe Sławków – Medyka Sp. z o.o.
Trade Trans Karya Sp. z o.o.
Transgaz S.A.
Trade Trans Finance Sp. z o.o.
PPHU “Ukpol” Sp. z o.o.
Rentrans Cargo Sp. z o.o.
Gdański Terminal Kontenerowy S.A.
AWT Rail SK a.s.
A short description of the companies whose financial statements are subject to consolidation by the full method has been
presented below.
PKP CARGO S.A.
The Parent Company was established by the power of article 14 of the Act of 8 September 2000 on Commercialization,
Restructuring and Privatization of the state-owned enterprise “Polskie Koleje Państwowe”. The Company was founded
by a notary deed of 29 June 2001, and subsequently registered under the name of PKP CARGO Spółka Akcyjna in the District
Court in Katowice, 8th Commercial Division of the National Court Register under file number KRS 0000027702.
As a consequence of moving the Company’s registered office, which as of 7 October 2002 has been specified as Warsaw,
ul. Grójecka 17, the registration files are kept by the District Court for the capital city of Warsaw, 12th Commercial Division
of the National Court Register. From its inception the Company has functioned within the PKP Group. The Company’s core
business is domestic and international rail freight transportation.
PKP CARGO SERVICE Sp. z o.o.
PKP CARGO SERVICE Sp. z o.o. was established as Agencje Celne PKP CARGO Sp. z o.o. on 11 July 2002 by PKP CARGO
S.A. It launched operations on 1 December 2002. The company’s core business is to provide services concerning
the comprehensive handling of sidings as well as transporting cargo by rail transport. In areas where the company concentrates
its rail siding services activity, “execution areas” are created to handle rail sidings.
PKP CARGOTABOR Sp. z o.o.
On 1 July 2014, the operations of companies belonging to the PKP CARGO Group dedicated to the repair and maintenance
of rolling stock were consolidated. At present, the competences in this area are concentrated in PKP CARGOTABOR Sp. z o.o.
This company’s core business entails services in the area of repair and maintenance of rolling stock and the physical
decommissioning of wagons and locomotives. Moreover, the company renders comprehensive services concerning repairs
of electrical machines and wheel sets as well as weighing and regulating rolling stock. The company focuses on repairing
and maintaining rolling stock in the PKP CARGO Group.
PKP CARGOTABOR USŁUGI Sp. z o.o.
Until 22 October 2014, PKP CARGOTABOR USŁUGI Sp. z o.o. did business under the name of PKP CARGOLOK Sp. z o.o.
The Company’s line of business includes activity related to collecting, processing and neutralizing waste and recovery of raw
materials. As at the delivery date of the report, the company does not conduct any operating activity.
PKP CARGO Centrum Logistyczne Małaszewicze Sp. z o.o.
PKP CARGO Centrum Logistyczne Małaszewicze Sp. z o.o. was established on 22 February 2010. This company’s line
of business is to provide comprehensive cargo handling through transshipment, storage, segregation, packaging, crushing
and a number of other border services. PKP CARGO Centrum Logistyczne Małaszewicze Sp. z o.o. holds terminals that
facilitate the transshipment of bulk and unit cargo, including containers.
8
Consolidated report for Q1 2015
PKP CARGO GROUP
ADDITIONAL INFORMATION TO THE CONSOLIDATED QUARTERLY REPORT
FOR Q1 2017
PKP CARGO Centrum Logistyczne Medyka – Żurawica Sp. z o.o.
PKP CARGO Centrum Logistyczne Medyka - Żurawica Sp. z o.o. was established on 5 January 2011. It has been conducting
business since 1 February 2011. The company’s line of business is to provide comprehensive cargo handling through
transshipment, storage, segregation, packaging, crushing and a number of other border services. The company has the ability
to offer rail gauge switching services (change of carriages at an intersection point between normal, i.e. 1,435 mm, and wide,
i.e. 1,520 mm gauge rail tracks), chiefly in the transport of hazardous materials and the transshipment of oversized
consignments necessitating the usage of specialized transshipment equipment.
PKP CARGO CONNECT Sp. z o.o.
PKP CARGO CONNECT Sp. z o.o. was established on 8 March 1990 under the business name Przedsiębiorstwo Spedycyjne
TRADE TRANS Sp. z o.o. (PS TRADE TRANS Sp. z o.o.). On 17 August 2015, the Extraordinary Shareholder Meeting
of the company was held and adopted a resolution to change the company’s business name, from PS TRADE TRANS Sp. z o.o.
to PKP CARGO CONNECT Sp. z o.o. The change was registered on 30 October 2015.
On 29 September 2015, the Management Boards of PS TRADE TRANS Sp. z o.o. (as the Acquiring Company)
and CARGOSPED Sp. z o.o. (as the Acquired Company) signed the “Merger Plan for Przedsiębiorstwo Spedycyjne TRADE
TRANS Sp. z o.o. and CARGOSPED Sp. z o.o.”. The merger of the companies was registered on 31 December 2015 following
the procedure set forth in Article 492 § 1 item 1) of the Commercial Company Code, by transferring all the assets
of CARGOSPED Sp. z o.o. to PS TRADE TRANS Sp. z o.o. in exchange for the shares that PKP CARGO CONNECT Sp. z o.o.
issued to PKP CARGO S.A. as the sole shareholder of CARGOSPED Sp. z o.o.
The company’s core business involves freight forwarding and logistics services in Poland and abroad. The company provides
comprehensive logistics services using rail and vehicle, marine and inland water transportation by organizing transport,
transshipment, storage, warehousing, packaging and distribution. The company also provides overall customs service to clients
of the PKP CARGO Group.
Cargosped Terminal Braniewo Sp. z o. o.
Cargosped Terminal Braniewo Sp. z o.o. has been part of the PKP CARGO Group since January 2010, when it was acquired
by CARGOSPED Sp. z o.o. The company’s major areas of activity constitute transshipment of goods and buying and selling
coal. The company is a direct importer of coal from Russia and it is active in wholesale and retail sales in this area.
CARGOTOR Sp. z o.o.
CARGOTOR Sp. z o.o. was registered on 13 November 2013 and PKP CARGO S.A. subscribed for a 100% equity stake.
This company does business across Poland in the area of managing track and service infrastructure in the form of rail sidings
and track systems along with the requisite plant and buildings. It also makes infrastructure available to rail operators
on commercial terms.
Advanced World Transport B.V.
Parent Company in the AWT Group. The company’s line of business is to discharge the function of the holding company.
The company was established under Dutch law on 11 June 2007. PKP CARGO S.A. acquired an 80% stake in the company
on 28 May 2015.
Advanced World Transport a.s.
ADVANCED WORLD TRANSPORT a.s. was established on 1 January 1994 doing business as OKD DOPRAVA, a.s.
The company is the largest entity in the structure of the AWT Group. The company’s line of business is to render comprehensive
rail freight transport and siding handling services. At present, the company is the second largest rail operator in the Czech
Republic. Rail freight transport services are also rendered by the company in Slovakia and Poland.
On top of providing transportation service on its own leveraging its own authorizations, the company continues to be active
as a rail freight forwarder throughout Central and Eastern Europe.
In addition, the company manages an intermodal terminal located in the community of Paskov in the north of the Czech
Republic and it offers comprehensive services to make deliveries and pick-ups by road transport (“last mile”).

9
Consolidated report for Q1 2015
PKP CARGO GROUP
ADDITIONAL INFORMATION TO THE CONSOLIDATED QUARTERLY REPORT
FOR Q1 2017
AWT Čechofracht a.s.
AWT ČECHOFRACHT a.s. was established on 1 January 1991. The company’s primary line of business is to offer international
freight forwarding services.
AWT Rekultivace a.s.
The company was established on 1 January 1994 with its registered offices in Hawierzów and is specialized in civil engineering
construction activity. The company’s core offering consists of managing and revitalizing post-industrial areas (including mining
areas), demolition works, managing waste utilization facilities, eliminating underground mining pits, decontaminating soil,
providing specialist technical resources, storage of coal, etc.
On account of the nature of this activity, the services rendered by the company frequently require transportation handling, which
in the event of AWT a.s. handling the rail transport, makes it possible to generate added value and ensure comprehensive
service for its clients.
AWT ROSCO a.s.
Since 1 May 2010, the company has been operating within the group under the business name of AWT VADS a.s. In July 2011,
the company’s name was changed to AWT ROSCO a.s. The company is dedicated to the AWT Group’s wagon fleet
management. Within the scope of its operations, the company’s fundamental mission is to provide the rolling stock needed
for the AWT Group’s transportation companies to perform transportation services. The company’s operations involve the rental
of rail wagons and the cleaning of rail and automobile cisterns.
AWT Coal Logistics s.r.o.
The company was registered on 4 April 2013. The Company’s main line of business is railway freight forwarding focused
on catering to the transportation of hard coal from mines belonging to OKD a.s.
AWT Rail HU Zrt.
The company was registered on 31 December 2008. It offers rail transport services and rail siding handling in Hungary
on the basis of its own rail operator’s license. The company’s development is an element of the Group’s international expansion.
At present, the company is participating in handling a large amount of international transportation taken care of in cooperation
with other Group entities.
2.3. Structure of the PKP CARGO Group
As at 31 March 2017, the PKP CARGO Group included, besides PKP CARGO S.A., 28 subsidiaries controlled directly
or indirectly (by entities controlled by PKP CARGO S.A.), including:
10 subsidiaries controlled directly by PKP CARGO S.A.,
13 subsidiaries controlled directly by companies directly controlled by PKP CARGO S.A. (and indirectly controlled
by PKP CARGO S.A.), including 6 companies directly controlled by PKP CARGO CONNECT Sp. z o.o.
and 7 companies directly controlled by AWT B.V.,
5 AWT Group companies controlled directly by companies indirectly controlled by PKP CARGO S.A. (indirectly
controlled by PKP CARGO S.A.);
In addition the Group had 6 associated entities and shares in 4 joint ventures.
The figure below presents the equity links between PKP CARGO S.A. and other entities as at 31 March 2017:
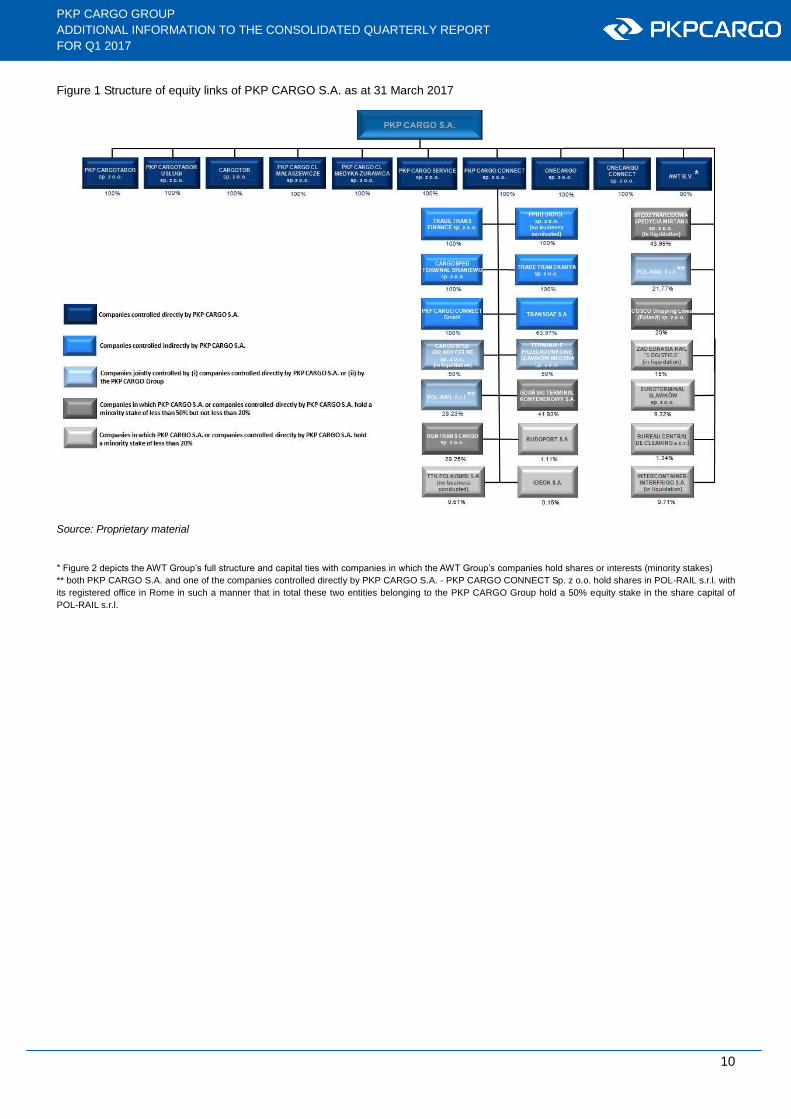
10
Consolidated report for Q1 2015
PKP CARGO GROUP
ADDITIONAL INFORMATION TO THE CONSOLIDATED QUARTERLY REPORT
FOR Q1 2017
Figure 1 Structure of equity links of PKP CARGO S.A. as at 31 March 2017
Source: Proprietary material
* Figure 2 depicts the AWT Group’s full structure and capital ties with companies in which the AWT Group’s companies hold shares or interests (minority stakes)
** both PKP CARGO S.A. and one of the companies controlled directly by PKP CARGO S.A. - PKP CARGO CONNECT Sp. z o.o. hold shares in POL-RAIL s.r.l. with
its registered office in Rome in such a manner that in total these two entities belonging to the PKP CARGO Group hold a 50% equity stake in the share capital of
POL-RAIL s.r.l.

11
Consolidated report for Q1 2015
PKP CARGO GROUP
ADDITIONAL INFORMATION TO THE CONSOLIDATED QUARTERLY REPORT
FOR Q1 2017
Figure 2 Structure of equity links of AWT as at 31 March 2017.
Source: Proprietary material

12
Consolidated report for Q1 2015
PKP CARGO GROUP
ADDITIONAL INFORMATION TO THE CONSOLIDATED QUARTERLY REPORT
FOR Q1 2017
3. Information about the Parent Company
3.1. Composition of the Management Board and Supervisory Board of PKP CARGO S.A.
MANAGEMENT BOARD
The Management Board of PKP CARGO S.A. with its registered office in Warsaw operates on the basis of the applicable
provisions of law, in particular:
1) Act of 15 September 2000 entitled Commercial Company Code (Journal of Laws, Number 94, Item 1037, as amended);
2) Act of 8 September 2000 on the Commercialization, Restructuring and Privatization of the State-Owned Enterprise
“Polskie Koleje Państwowe” (Journal of Laws No. 84 Item 948, as amended)
3) Articles of Association of PKP CARGO S.A. (consolidated text adopted by Resolution No. 1529/V/2016 of the
PKP CARGO S.A. Supervisory Board dated 30 March 2016)
4) Bylaws of the PKP CARGO S.A. Management Board adopted by Resolution No. 252/2016 of the PKP CARGO S.A.
Management Board dated 29 July 2016
5) other internal regulations.
Powers of the Management Board
The Management Board manages the Company’s day-to-day business, manages its assets and represents the Company
in relations with third parties. The responsibilities of the Management Board include any activities that are not reserved for
the Shareholder Meeting or the Supervisory Board. Management Board resolutions are adopted by an absolute majority
of votes present at the meeting, provided that at least half of the Management Board members are in attendance. The President
of the Management Board acting individually or two Management Board Members acting jointly or a Management Board
Member acting jointly with a commercial proxy are authorized to make declarations of will.
Operation of the Management Board
The procedure of the Management Board’s operation is described in detail in the Bylaws of the Management Board. The Bylaws
are adopted by the Management Board and approved by the Company’s Supervisory Board. In accordance with the provisions
of the Bylaws of the Management Board, the Management Board makes decisions in the form of resolutions. Management
Board resolutions are adopted by an absolute majority of votes present at the meeting, provided that at least half of the
Management Board members are in attendance and may only be adopted if all the Management Board members have been
duly notified of the Management Board meeting. Pursuant to the Bylaws, in the event of an equal number of votes ‘for’ and the
total number of votes ‘against’ and ‘abstaining’, the President of the Management Board will have the casting vote. Management
Board meetings are held at least once a week. In particularly justified cases, Management Board meetings may be held on
a later date but no later than within 14 days of the date of the preceding meeting.
According to the Bylaws of the Management Board, if a conflict of interest arises between the Company and a Management
Board member, a spouse, kin or relative (up to the second degree of affinity) or another person with whom the Management
Board member has personal relations, the Management Board member should immediately inform the remaining Management
Board members about the conflict and, in the case of the President of the Management Board, also the Company’s Supervisory
Board, and refrain from discussing and from voting on a resolution in the matter in which the conflict of interest has arisen and
may demand this to be recorded in the minutes of the Management Board meeting.
Table 3 Composition of the PKP CARGO S.A. Management Board from 1 January 2017 to the delivery date of this report
Name Position Period in office
from to
Maciej Libiszewski President of the Management Board 19 January 2016 to date
Arkadiusz Olewnik Management Board Member in charge of Finance 1 April 2016 to date
Grzegorz Fingas Management Board Member in charge of Commerce
1 April 2016 to date
Jarosław Klasa Management Board Member in charge of Operations
1 April 2016 to date
Zenon Kozendra Management Board Member – Employee Representative
14 July 2016 to date
Source: Proprietary material

13
Consolidated report for Q1 2015
PKP CARGO GROUP
ADDITIONAL INFORMATION TO THE CONSOLIDATED QUARTERLY REPORT
FOR Q1 2017
The internal allocation of tasks and functions discharged by Management Board members is as follows:
1) President of the Management Board – the scope of the President’s activity include directing the activities of the
Management Board and the Company’s ongoing operations and overseeing the management of specific areas of the
Company’s activity, in particular:
business strategy,
business security and internal audit.
Special powers of the President of the Company’s Management Board include performance of the Company’s defense
tasks resulting from the regulations on general defense obligation.
2) Management Board Member in charge of Finance – the scope of duties of the Management Board Member in charge
of Finance covers responsibility for rational management of the Company’s resources and overseeing the management
of specific areas of the Company’s business, in particular:
finance management,
purchase and sale of assets.
Special powers of the Management Board Member in charge of Finance include the performance, on behalf
of PKP CARGO S.A., of obligations arising from accounting, tax and insurance regulations.
3) Management Board Member in charge of Commerce – the scope of duties of the Management Board Member
in charge of Commerce covers responsibility for adequate sales levels and customer relations and overseeing
the management of specific areas of the Company’s business, in particular:
commercial policy,
sales of transportation services.
4) Management Board Member in charge of Operations – the scope of activity of the Management Board Member
in charge of Operations includes caring for the effective execution of the Company’s business and technological
processes and overseeing the management of specific areas of the Company’s activity, in particular in the following
areas:
execution of transports,
maintenance of rolling stock.
5) Management Board Member – Employee Representative in the Management Board – the scope of activity of the
Employee Representative in the Management Board includes overseeing tasks pursued in the area of human
resources management, particularly in the following areas:
relations with social partners,
communication with social organizations.
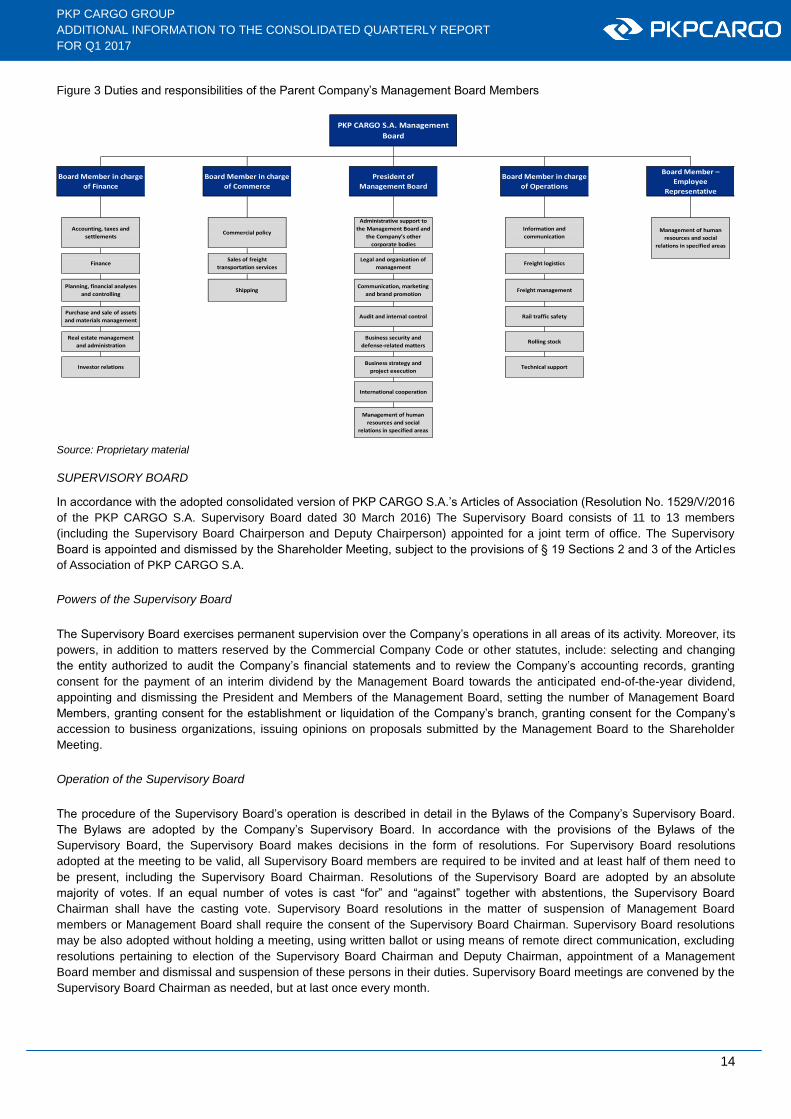
14
Consolidated report for Q1 2015
PKP CARGO GROUP
ADDITIONAL INFORMATION TO THE CONSOLIDATED QUARTERLY REPORT
FOR Q1 2017
Figure 3 Duties and responsibilities of the Parent Company’s Management Board Members
International cooperation
Management of human
resources and social
relations in specified areas
Purchase and sale of assets
and materials management
Real estate management
and administration
Shipping
Business security and
defense-related matters
Business strategy and
project execution
Accounting, taxes and
settlements
Finance
Investor relations
Planning, financial analyses
and controlling
Administrative support to
the Management Board and
the Company’s other
corporate bodies
Legal and organization of
management
Communication, marketing
and brand promotion
Audit and internal control
Rolling stock
Technical support
Management of human
resources and social
relations in specified areas
PKP CARGO S.A. Management
Board
Rail traffic safety
Commercial policy
Sales of freight
transportation services
Information and
communication
Freight logistics
Freight management
Board Member in charge
of Finance
Board Member in charge
of Commerce
President of
Management Board
Board Member in charge
of Operations
Board Member –
Employee
Representative
Source: Proprietary material
SUPERVISORY BOARD
In accordance with the adopted consolidated version of PKP CARGO S.A.’s Articles of Association (Resolution No. 1529/V/2016
of the PKP CARGO S.A. Supervisory Board dated 30 March 2016) The Supervisory Board consists of 11 to 13 members
(including the Supervisory Board Chairperson and Deputy Chairperson) appointed for a joint term of office. The Supervisory
Board is appointed and dismissed by the Shareholder Meeting, subject to the provisions of § 19 Sections 2 and 3 of the Articles
of Association of PKP CARGO S.A.
Powers of the Supervisory Board
The Supervisory Board exercises permanent supervision over the Company’s operations in all areas of its activity. Moreover, i ts
powers, in addition to matters reserved by the Commercial Company Code or other statutes, include: selecting and changing
the entity authorized to audit the Company’s financial statements and to review the Company’s accounting records, granting
consent for the payment of an interim dividend by the Management Board towards the anticipated end-of-the-year dividend,
appointing and dismissing the President and Members of the Management Board, setting the number of Management Board
Members, granting consent for the establishment or liquidation of the Company’s branch, granting consent for the Company’s
accession to business organizations, issuing opinions on proposals submitted by the Management Board to the Shareholder
Meeting.
Operation of the Supervisory Board
The procedure of the Supervisory Board’s operation is described in detail in the Bylaws of the Company’s Supervisory Board.
The Bylaws are adopted by the Company’s Supervisory Board. In accordance with the provisions of the Bylaws of the
Supervisory Board, the Supervisory Board makes decisions in the form of resolutions. For Supervisory Board resolutions
adopted at the meeting to be valid, all Supervisory Board members are required to be invited and at least half of them need to
be present, including the Supervisory Board Chairman. Resolutions of the Supervisory Board are adopted by an absolute
majority of votes. If an equal number of votes is cast “for” and “against” together with abstentions, the Supervisory Board
Chairman shall have the casting vote. Supervisory Board resolutions in the matter of suspension of Management Board
members or Management Board shall require the consent of the Supervisory Board Chairman. Supervisory Board resolutions
may be also adopted without holding a meeting, using written ballot or using means of remote direct communication, excluding
resolutions pertaining to election of the Supervisory Board Chairman and Deputy Chairman, appointment of a Management
Board member and dismissal and suspension of these persons in their duties. Supervisory Board meetings are convened by the
Supervisory Board Chairman as needed, but at last once every month.

15
Consolidated report for Q1 2015
PKP CARGO GROUP
ADDITIONAL INFORMATION TO THE CONSOLIDATED QUARTERLY REPORT
FOR Q1 2017
In accordance with the Bylaws of the Supervisory Board, in the event of conflicting interests of the Company and personal
interests of a Supervisory Board member, his/her spouse, relatives or relatives and second degree next of kin, the Supervisory
Board member should refrain from participating in the discussion and voting on the resolution of such matters and request that
this fact be recorded in the minutes of the Supervisory Board meeting.
The table below presents the composition of the Supervisory Board as at the delivery date of this report.
Table 4 Composition of the PKP CARGO S.A. Supervisory Board from 1 January 2017 to the delivery date of this report
Name Position Period in office
from to
Krzysztof Mamiński Supervisory Board Member 6 March 2017 to date
Supervisory Board Chairman 20 March 2017 to date
Andrzej Wach Supervisory Board Member 17 December 2015* to date
Supervisory Board Deputy Chairman 27 April 2015 20 May 2016
11 May 2016 to date
Krzysztof Czarnota Supervisory Board Member 20 May 2016 to date
Zofia Dzik Supervisory Board Member 11 May 2016 to date
Raimondo Eggink Supervisory Board Member 13 April 2015* to date
Małgorzata Kryszkiewicz Supervisory Board Member 17 December 2015* to date
Marek Podskalny Supervisory Board Member 20 May 2016 to date
Tadeusz Stachaczyński Supervisory Board Member 20 May 2016 to date
Władysław Szczepkowski Supervisory Board Member 14 March 2017 to date
Czesław Warsewicz Supervisory Board Member 17 December 2015* to date
Mirosław Pawłowski Supervisory Board Member 17 December 2015 18 December 2015
Supervisory Board Chairman 18 December 2015* 6 March 2017 (resignation)
Jerzy Kleniewski Supervisory Board Member 17 December 2015* 14 March 2017 (resignation)
* the 6th term of office of the PKP CARGO S.A. Supervisory Board began on 11 May 2016, the date of holding the Ordinary Shareholder Meeting of PKP CARGO S.A.
Source: Proprietary material
SUPERVISORY BOARD AUDIT COMMITTEE
The PKP CARGO S.A. Audit Committee is appointed by the PKP CARGO S.A. Supervisory Board. It consists of at least three
Supervisory Board Members, including two Members (including the Committee Chairman) meeting the independence criteria
and appointed in the manner specified in § 20 and 21 of the Company’s Articles of Association. At least one Audit Committee
member should be qualified in accounting or financial audit. Committee members are appointed for a term corresponding to the
Supervisory Board’s term of office. Tasks of the Audit Committee include in particular: supervision over the organizational unit
responsible for internal audit, monitoring the financial reporting process, monitoring the performance of financial audit activities,
monitoring the independence of the statutory auditor and the entity authorized to audit financial statements, recommending
an entity authorized to audit financial statements to the Supervisory Board to perform financial audit activities for the Company,
etc.
Table 5 Composition of the Audit Committee of the PKP CARGO S.A. Supervisory Board from 1 January 2017 to the delivery date of this report
Name Position Period in office
from to
Raimondo Eggink Committee Member
30 April 2015 20 May 2015 – 6th term of office
18 December 2015
Committee Chairman 18 December 2015
31 May 2016 – 6th term of office 11 May 2016*
to date
Małgorzata Kryszkiewicz Committee Member 18 December 2015
20 May 2016 – 6th term of office 11 May 2016*
to date
Zofia Dzik Committee Member 20 May 2016 to date
*expiration date of the 5th term of office of the PKP CARGO S.A. Supervisory Board
Source: Proprietary material
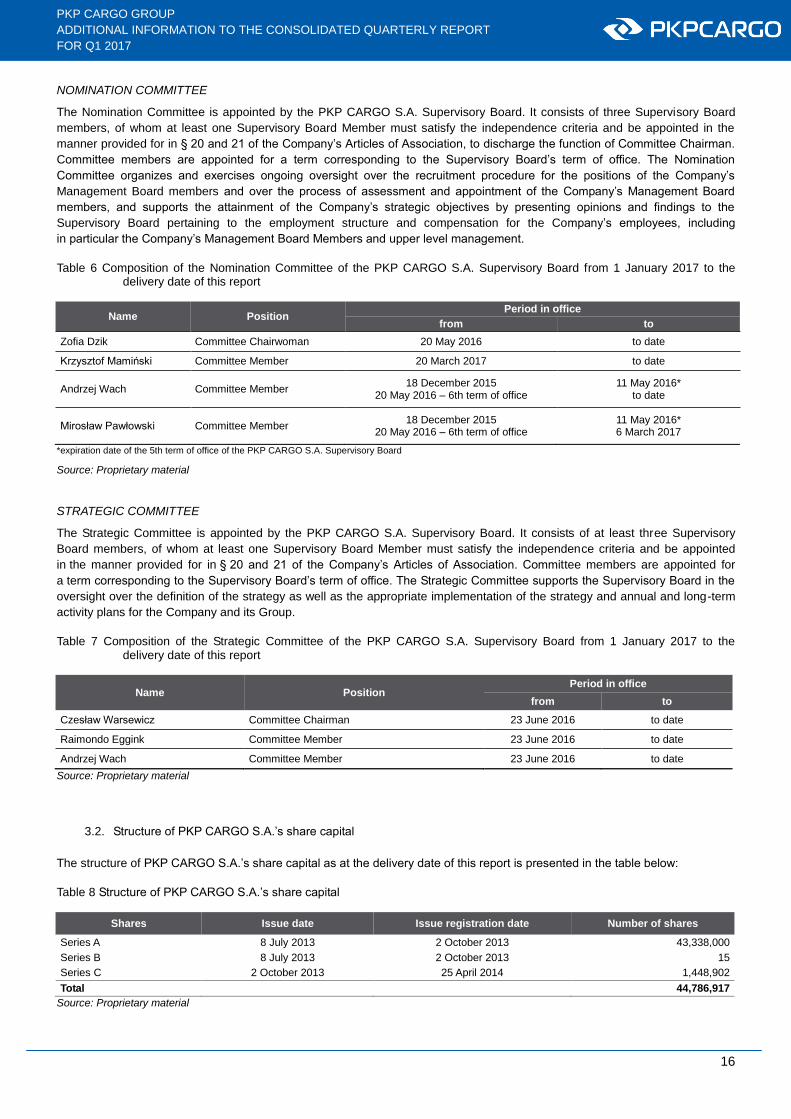
16
Consolidated report for Q1 2015
PKP CARGO GROUP
ADDITIONAL INFORMATION TO THE CONSOLIDATED QUARTERLY REPORT
FOR Q1 2017
NOMINATION COMMITTEE
The Nomination Committee is appointed by the PKP CARGO S.A. Supervisory Board. It consists of three Supervisory Board
members, of whom at least one Supervisory Board Member must satisfy the independence criteria and be appointed in the
manner provided for in § 20 and 21 of the Company’s Articles of Association, to discharge the function of Committee Chairman.
Committee members are appointed for a term corresponding to the Supervisory Board’s term of office. The Nomination
Committee organizes and exercises ongoing oversight over the recruitment procedure for the positions of the Company’s
Management Board members and over the process of assessment and appointment of the Company’s Management Board
members, and supports the attainment of the Company’s strategic objectives by presenting opinions and findings to the
Supervisory Board pertaining to the employment structure and compensation for the Company’s employees, including
in particular the Company’s Management Board Members and upper level management.
Table 6 Composition of the Nomination Committee of the PKP CARGO S.A. Supervisory Board from 1 January 2017 to the delivery date of this report
Name Position Period in office
from to
Zofia Dzik Committee Chairwoman 20 May 2016 to date
Krzysztof Mamiński Committee Member 20 March 2017 to date
Andrzej Wach Committee Member 18 December 2015
20 May 2016 – 6th term of office 11 May 2016*
to date
Mirosław Pawłowski Committee Member 18 December 2015
20 May 2016 – 6th term of office 11 May 2016* 6 March 2017
*expiration date of the 5th term of office of the PKP CARGO S.A. Supervisory Board
Source: Proprietary material
STRATEGIC COMMITTEE
The Strategic Committee is appointed by the PKP CARGO S.A. Supervisory Board. It consists of at least three Supervisory
Board members, of whom at least one Supervisory Board Member must satisfy the independence criteria and be appointed
in the manner provided for in § 20 and 21 of the Company’s Articles of Association. Committee members are appointed for
a term corresponding to the Supervisory Board’s term of office. The Strategic Committee supports the Supervisory Board in the
oversight over the definition of the strategy as well as the appropriate implementation of the strategy and annual and long-term
activity plans for the Company and its Group.
Table 7 Composition of the Strategic Committee of the PKP CARGO S.A. Supervisory Board from 1 January 2017 to the delivery date of this report
Name Position Period in office
from to
Czesław Warsewicz Committee Chairman 23 June 2016 to date
Raimondo Eggink Committee Member 23 June 2016 to date
Andrzej Wach Committee Member 23 June 2016 to date
Source: Proprietary material
3.2. Structure of PKP CARGO S.A.’s share capital
The structure of PKP CARGO S.A.’s share capital as at the delivery date of this report is presented in the table below:
Table 8 Structure of PKP CARGO S.A.’s share capital
Shares Issue date Issue registration date Number of shares
Series A 8 July 2013 2 October 2013 43,338,000
Series B 8 July 2013 2 October 2013 15
Series C 2 October 2013 25 April 2014 1,448,902
Total 44,786,917
Source: Proprietary material

17
Consolidated report for Q1 2015
PKP CARGO GROUP
ADDITIONAL INFORMATION TO THE CONSOLIDATED QUARTERLY REPORT
FOR Q1 2017
3.3. Shareholders holding at least 5% of the total votes
As at the delivery date of this report, the total number of the Company’s outstanding shares is 44,786,917. According to notices
received by the Company, the structure of shareholders holding directly or indirectly significant blocks of shares in the Company
was as follows:
Table 9 Shareholder structure of PKP CARGO S.A. as at 31 March 2017 and as at the delivery date of this report
Shareholder Number of
shares % in share capital Number of votes
% in the total number of votes at the Shareholder Meeting
PKP S.A.(1)
14,784,194 33.01% 14,784,194 33.01%
Nationale-Nederlanden OFE (2)
6,854,195 15.30% 6,854,195 15.30%
MetLife OFE (3)
2,494,938 5.57% 2,494,938 5.57%
AVIVA OFE (4)
2,338,371 5.22% 2,338,371 5.22%
TFI PZU S.A. (5)
2,302,843 5.14% 2,302,843 5.14%
Other shareholders 16,012,376 35.76% 16,012,376 35.76%
Total 44,786,917 100.00% 44,786,917 100.00%
Source: Proprietary material
(1) According to a notice sent by the shareholder on 24 June 2014. (2) According to a notice sent by the shareholder on 18 October 2016. (3) According to a notice sent by the shareholder on 18 August 2016. (4) According to a notice sent by the shareholder on 13 August 2014. (5) According to a notice sent by the shareholder on 27 March 2017.
3.4. Listing of shares held by management and supervisory board members
The holdings of shares in the Company or rights to such shares by members of the Company’s Management Board from
17 March 2017, i.e. from the delivery date of the 2016 annual report to the delivery date of this report, were as follows:
Table 10 PKP CARGO S.A. shares held by Management Board members
Name Number of PKP CARGO S.A. shares
held by Management Board members
Maciej Libiszewski 0
Arkadiusz Olewnik 0
Grzegorz Fingas 0
Jarosław Klasa 46
Zenon Kozendra 46
Source: Proprietary material
The holdings of shares in the Company or rights to such shares by members of the Company’s Supervisory Board from
17 March 2017, i.e. the delivery date of the 2016 annual report to the delivery date of this report, were as follows:
Table 11 PKP CARGO S.A. shares held by Supervisory Board members
Name Number of PKP CARGO S.A. shares
held by Supervisory Board members
Raimondo Eggink 0
Małgorzata Kryszkiewicz 0
Andrzej Wach 0
Czesław Warsewicz 0
Zofia Dzik 0
Krzysztof Czarnota 70
Marek Podskalny 70
Tadeusz Stachaczyński
0
Krzysztof Mamiński
0
Władysław Szczepkowski
0
Source: Proprietary material

18
Consolidated report for Q1 2015
PKP CARGO GROUP
ADDITIONAL INFORMATION TO THE CONSOLIDATED QUARTERLY REPORT
FOR Q1 2017
4. Key areas of operation of the PKP CARGO Group
4.1. Macroeconomic environment
Polish economy
According to the Country Report Poland 2017 study6 prepared by the European Commission, Poland’s economy is currently
in a strong growth phase, despite the low level of investments. According to the EC, GDP will continue to grow by 3.4% yoy and
3.2% yoy in 2017 and 2018, respectively. Domestic demand is expected to be the main growth stimulus (including household
consumption driven by increasing salaries and employment). Therefore, the economic outlook is perceived to be positive,
despite certain risks associated with domestic politics that may contribute to a reduction in corporate trust and consequently, the
level of investments. On the other hand, after a clear decline last year, a strong growth in public investments is expected
as a result of the execution of projects and disbursement of structural EU funds under the new EU funding perspective. HICP
inflation is forecast at 1.3% yoy in 2017 and 1.8% yoy in 2018, mainly due to the forecast raw material prices on global markets,
weak pressure on domestic prices, low inflation in other EU states and a gradual salary growth.
On the other hand, the National Bank of Poland forecasts of GDP growth in 2017 indicate growth of 3.7% and 3.3% yoy and
3.2% yoy in the following years, which is largely consistent with Poland’s economic growth forecasts for that year according
to international financial institutions.7
The National Bank of Poland identified the source of significant uncertainty of that forecast to be the possible worse business
conditions in the global economy, in China in particular. The significant indebtedness of companies caused by excessive
investments (mainly in the steelmaking sector) remains the main threat. It may cause a slowdown of the Chinese economy and
global economy in general and consequently adversely affect the level of investments from China’s business partners.
According to the NBP data, inflation will amount to 2.0% in 2017 and in 2018. It is an upward adjustment as compared
to the November 2016 forecasts, which estimated 1.3% in 2017 and 1.5% in 2018. The clear adjustment of the domestic
consumer goods and services price index was caused among others by the increasing prices of energy fuels (oil, hard coal,
natural gas) and food on global markets.
Figure 4 GDP growth in Poland in 2011-2016 per annum and 2017, 2018 and 2019 forecasts
Source: Central Statistical Office (revised estimate of gross domestic product for 2010-2015 dated 19 October 2016); NBP forecast (March 2017)
a NBP forecast on the basis of the Inflation Report, March 2017
Czech economy
In Q4 2016, economic growth in the Czech Republic improved slightly by 0.4% qoq and compared to Q4 2015, real GDP
increased by 1.9% yoy. Over the entire year 2016, economic growth was 2.4% yoy. The main growth driver in 2016 was
the consumption of households, which rose by 2.9% yoy. The increased consumption was supported by the increase
in employment and salaries and by the very low inflation for the most part of the year. Economic growth was also fostered by an
increase in foreign trade. The lower growth in foreign trade globally and in the European Union led to the decline in the real
growth of goods and services exports, from 7.7% yoy in 2015 to 4.3% yoy in 2016. A more significant decrease could be
observed in imports, which fell from 8.2% yoy in 2015 to 3.2% yoy in 2016, which was caused in particular by a decline
6European Commission Staff Working Document, Country Report Poland 2017, February 2017.
7 Inflation Report. March 2017, NBP
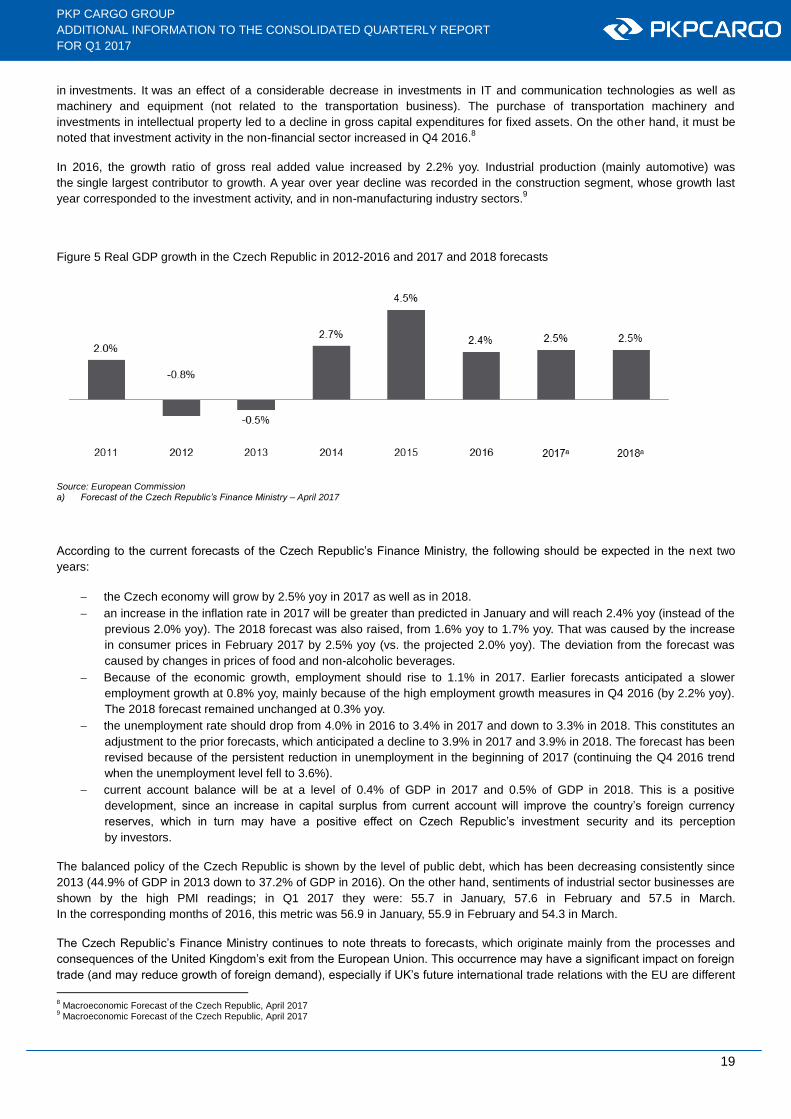
19
Consolidated report for Q1 2015
PKP CARGO GROUP
ADDITIONAL INFORMATION TO THE CONSOLIDATED QUARTERLY REPORT
FOR Q1 2017
in investments. It was an effect of a considerable decrease in investments in IT and communication technologies as well as
machinery and equipment (not related to the transportation business). The purchase of transportation machinery and
investments in intellectual property led to a decline in gross capital expenditures for fixed assets. On the other hand, it must be
noted that investment activity in the non-financial sector increased in Q4 2016.8
In 2016, the growth ratio of gross real added value increased by 2.2% yoy. Industrial production (mainly automotive) was
the single largest contributor to growth. A year over year decline was recorded in the construction segment, whose growth last
year corresponded to the investment activity, and in non-manufacturing industry sectors.9
Figure 5 Real GDP growth in the Czech Republic in 2012-2016 and 2017 and 2018 forecasts
Source: European Commission a) Forecast of the Czech Republic’s Finance Ministry – April 2017
According to the current forecasts of the Czech Republic’s Finance Ministry, the following should be expected in the next two
years:
the Czech economy will grow by 2.5% yoy in 2017 as well as in 2018.
an increase in the inflation rate in 2017 will be greater than predicted in January and will reach 2.4% yoy (instead of the
previous 2.0% yoy). The 2018 forecast was also raised, from 1.6% yoy to 1.7% yoy. That was caused by the increase
in consumer prices in February 2017 by 2.5% yoy (vs. the projected 2.0% yoy). The deviation from the forecast was
caused by changes in prices of food and non-alcoholic beverages.
Because of the economic growth, employment should rise to 1.1% in 2017. Earlier forecasts anticipated a slower
employment growth at 0.8% yoy, mainly because of the high employment growth measures in Q4 2016 (by 2.2% yoy).
The 2018 forecast remained unchanged at 0.3% yoy.
the unemployment rate should drop from 4.0% in 2016 to 3.4% in 2017 and down to 3.3% in 2018. This constitutes an
adjustment to the prior forecasts, which anticipated a decline to 3.9% in 2017 and 3.9% in 2018. The forecast has been
revised because of the persistent reduction in unemployment in the beginning of 2017 (continuing the Q4 2016 trend
when the unemployment level fell to 3.6%).
current account balance will be at a level of 0.4% of GDP in 2017 and 0.5% of GDP in 2018. This is a positive
development, since an increase in capital surplus from current account will improve the country’s foreign currency
reserves, which in turn may have a positive effect on Czech Republic’s investment security and its perception
by investors.
The balanced policy of the Czech Republic is shown by the level of public debt, which has been decreasing consistently since
2013 (44.9% of GDP in 2013 down to 37.2% of GDP in 2016). On the other hand, sentiments of industrial sector businesses are
shown by the high PMI readings; in Q1 2017 they were: 55.7 in January, 57.6 in February and 57.5 in March.
In the corresponding months of 2016, this metric was 56.9 in January, 55.9 in February and 54.3 in March.
The Czech Republic’s Finance Ministry continues to note threats to forecasts, which originate mainly from the processes and
consequences of the United Kingdom’s exit from the European Union. This occurrence may have a significant impact on foreign
trade (and may reduce growth of foreign demand), especially if UK’s future international trade relations with the EU are different
8 Macroeconomic Forecast of the Czech Republic, April 2017
9 Macroeconomic Forecast of the Czech Republic, April 2017
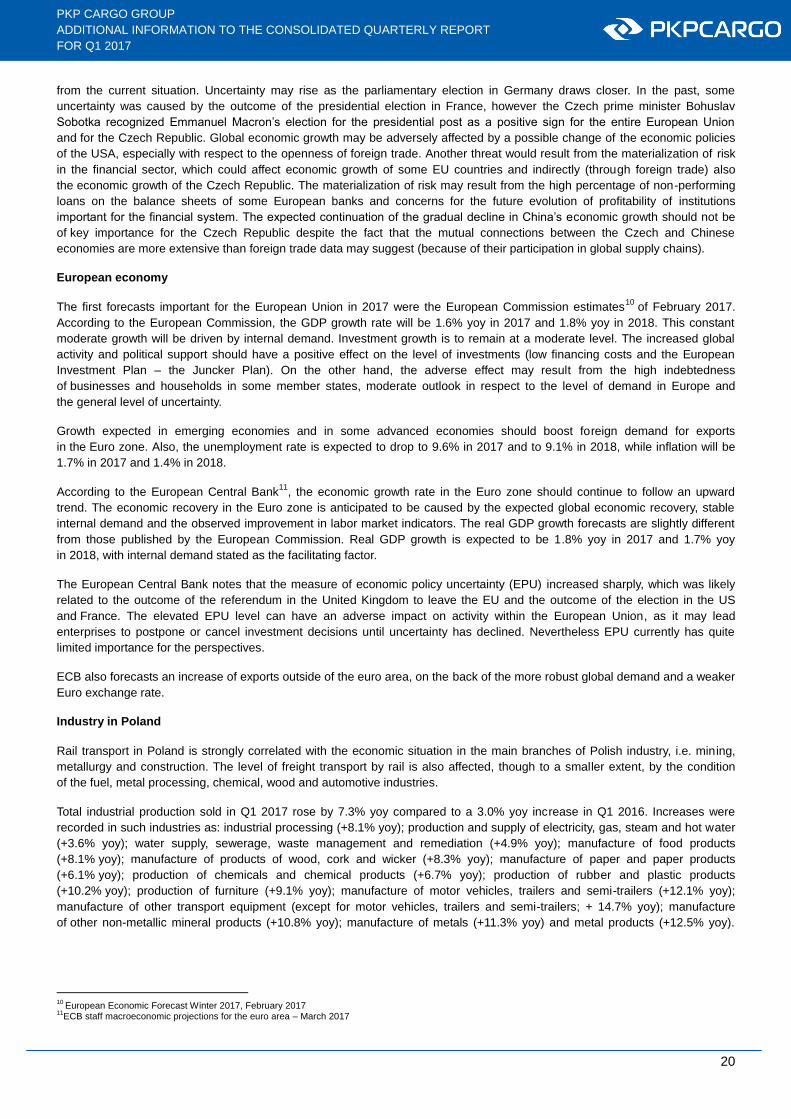
20
Consolidated report for Q1 2015
PKP CARGO GROUP
ADDITIONAL INFORMATION TO THE CONSOLIDATED QUARTERLY REPORT
FOR Q1 2017
from the current situation. Uncertainty may rise as the parliamentary election in Germany draws closer. In the past, some
uncertainty was caused by the outcome of the presidential election in France, however the Czech prime minister Bohuslav
Sobotka recognized Emmanuel Macron’s election for the presidential post as a positive sign for the entire European Union
and for the Czech Republic. Global economic growth may be adversely affected by a possible change of the economic policies
of the USA, especially with respect to the openness of foreign trade. Another threat would result from the materialization of risk
in the financial sector, which could affect economic growth of some EU countries and indirectly (through foreign trade) also
the economic growth of the Czech Republic. The materialization of risk may result from the high percentage of non-performing
loans on the balance sheets of some European banks and concerns for the future evolution of profitability of institutions
important for the financial system. The expected continuation of the gradual decline in China’s economic growth should not be
of key importance for the Czech Republic despite the fact that the mutual connections between the Czech and Chinese
economies are more extensive than foreign trade data may suggest (because of their participation in global supply chains).
European economy
The first forecasts important for the European Union in 2017 were the European Commission estimates10
of February 2017.
According to the European Commission, the GDP growth rate will be 1.6% yoy in 2017 and 1.8% yoy in 2018. This constant
moderate growth will be driven by internal demand. Investment growth is to remain at a moderate level. The increased global
activity and political support should have a positive effect on the level of investments (low financing costs and the European
Investment Plan – the Juncker Plan). On the other hand, the adverse effect may result from the high indebtedness
of businesses and households in some member states, moderate outlook in respect to the level of demand in Europe and
the general level of uncertainty.
Growth expected in emerging economies and in some advanced economies should boost foreign demand for exports
in the Euro zone. Also, the unemployment rate is expected to drop to 9.6% in 2017 and to 9.1% in 2018, while inflation will be
1.7% in 2017 and 1.4% in 2018.
According to the European Central Bank11
, the economic growth rate in the Euro zone should continue to follow an upward
trend. The economic recovery in the Euro zone is anticipated to be caused by the expected global economic recovery, stable
internal demand and the observed improvement in labor market indicators. The real GDP growth forecasts are slightly different
from those published by the European Commission. Real GDP growth is expected to be 1.8% yoy in 2017 and 1.7% yoy
in 2018, with internal demand stated as the facilitating factor.
The European Central Bank notes that the measure of economic policy uncertainty (EPU) increased sharply, which was likely
related to the outcome of the referendum in the United Kingdom to leave the EU and the outcome of the election in the US
and France. The elevated EPU level can have an adverse impact on activity within the European Union, as it may lead
enterprises to postpone or cancel investment decisions until uncertainty has declined. Nevertheless EPU currently has quite
limited importance for the perspectives.
ECB also forecasts an increase of exports outside of the euro area, on the back of the more robust global demand and a weaker
Euro exchange rate.
Industry in Poland
Rail transport in Poland is strongly correlated with the economic situation in the main branches of Polish industry, i.e. mining,
metallurgy and construction. The level of freight transport by rail is also affected, though to a smaller extent, by the condition
of the fuel, metal processing, chemical, wood and automotive industries.
Total industrial production sold in Q1 2017 rose by 7.3% yoy compared to a 3.0% yoy increase in Q1 2016. Increases were
recorded in such industries as: industrial processing (+8.1% yoy); production and supply of electricity, gas, steam and hot water
(+3.6% yoy); water supply, sewerage, waste management and remediation (+4.9% yoy); manufacture of food products
(+8.1% yoy); manufacture of products of wood, cork and wicker (+8.3% yoy); manufacture of paper and paper products
(+6.1% yoy); production of chemicals and chemical products (+6.7% yoy); production of rubber and plastic products
(+10.2% yoy); production of furniture (+9.1% yoy); manufacture of motor vehicles, trailers and semi-trailers (+12.1% yoy);
manufacture of other transport equipment (except for motor vehicles, trailers and semi-trailers; + 14.7% yoy); manufacture
of other non-metallic mineral products (+10.8% yoy); manufacture of metals (+11.3% yoy) and metal products (+12.5% yoy).
10
European Economic Forecast Winter 2017, February 2017 11
ECB staff macroeconomic projections for the euro area – March 2017

21
Consolidated report for Q1 2015
PKP CARGO GROUP
ADDITIONAL INFORMATION TO THE CONSOLIDATED QUARTERLY REPORT
FOR Q1 2017
Decreases in industrial production sold were recorded in: mining and quarrying (-3.3% yoy); manufacture of coke and refined
petroleum products (-2.9% yoy).12
Labor productivity in the industry, which is defined as industrial production sold per employee, was 4.0% higher yoy in Q1 2017.
Also, in the same period the average headcount increased by 3.2% yoy and average monthly gross salary by 4.1% yoy.13
In the period of January-February 2017, compared to a corresponding period of 2016, Poland increased its overall foreign trade
(exports grew by 4.8% yoy to PLN 132.2 billion, while imports by 8.6% yoy up to PLN 132.0 billion). Poland also increased
foreign trade with developed countries (exports grew by 3.4% yoy and imports by 5.6% yoy), including with European Union
countries (exports up by 2.6% yoy and imports by 4.6% yoy). The most significant improvement of foreign trade was with
the Central and Eastern Europe countries (exports up by 24.6% yoy and imports up by 31.9% yoy).14
Poland’s net foreign trade in the period from January to February 2017 closed with a positive balance of PLN 0.2 billion, which is
worse than in 2M 2016 when the balance was PLN 4.6 billion.15
In March 2017, PMI (Purchasing Managers Index) was 53.5, declining slightly from March 2016 (53.816
).
The largest positive change among growth ratios in the economy was observed in construction and installation production.
In March of this year, it increased by as much as 17.2% yoy, which was the highest increase in a span of the last three years.17
Despite the fact that the increase was forecasted already for January or February 2017, such high readings were actually not
expected, and for March of this year even a slight drop was projected. This can be considered to be a piece of evidence that
the stagnation in capital expenditure projects (mainly infrastructural projects) has ended. In the subsequent months, increases
in construction and installation production are projected, but it would be unreasonable to expect them to be as high as in March
of this year.
Mining industry
In Q1 2017, the mines in Poland produced 16.8 million tons of hard coal, down 0.9 million tons, or 5% yoy, compared
to Q1 2016 (in Q1 2016, the volume of production was 17.7 million tons). The deterioration in mining output was affected
by significantly lower yoy extraction in February 2017, which stood at 5.2 million tons, down 1.0 million tons or 15.5% yoy.18
At the same time, in February 2017 inventories declined to 2.0 million tons and were 4.2 million tons lower than in February
2016 (when they stood at 6.1 million tons).19
The Polish mining industry was spurred by increases in steam coal prices on the domestic market. In March of this year, these
prices were the highest since January 2016, which translated into an increase in revenues generated by mining companies.
In March of this year, the price index for coal used in the electricity generation sector was PLN 200.2 per ton and for that used
in the heating sector was PLN 233.6 per ton. According to ARP, this fact confirms the observation that the situation on the Polish
coal market continues to be on an upward trend for another month in a row.20
Coal prices in sea ports also exert a significant impact on the direction of development of the mining sector in Poland. In each
month of Q1 2017, these prices were significantly higher than the corresponding average monthly prices in Q1 2016. In January
2017, the average monthly price was USD 87.0 per ton, whereas a year earlier the price was USD 40.7 per ton lower and stood
at USD 46.3 per ton; in February 2017, the price was higher by USD 38.1 per ton and stood at USD 82.1 per ton (USD 44.0
per ton in February 2016); in March 2017, the average price was USD 75.0 per ton and was higher by USD 29.1 per ton yoy
(USD 45.9 per ton in March 2016). Despite the obvious downward trend in the months of January-March 2017, the average
monthly prices in the ARA ports should still be considered to be high.
12
Central Statistical Office of Poland 13
Central Statistical Office of Poland 14
Central Statistical Office of Poland 15
Central Statistical Office of Poland 16
http://stooq.pl/ 17
wGospodarce.pl 18
Central Statistical Office of Poland 19
Polski Rynek Węgla [Polish Coal Market] 20
money.pl

22
Consolidated report for Q1 2015
PKP CARGO GROUP
ADDITIONAL INFORMATION TO THE CONSOLIDATED QUARTERLY REPORT
FOR Q1 2017
Figure 6 Coal prices on ARA vs. RB markets*
Source: Virtual New Industry
*ARA – Amsterdam, Rotterdam and Antwerp; RB – Richards Bay (RSA)
Steel industry
According to data published by the World Steel Association, steel production in the 67 member countries in Q1 2017 increased
by 22.2 million tons yoy (from 388.4 million tons in Q1 2016 to 410.5 million tons in Q1 2017), or 5.7% yoy. In Poland, steel
production in Q1 2017 increased by 0.2 million tons (from 2.3 million tons in 3M 2016 to 2.5 million tons in 3M 2017), or 9.6%
yoy.21
In this period, steel production in the European Union also increased by 1.6 million tons yoy (from 40.9 million tons
to 42.5 million tons. This was driven by higher production in Germany by 1.8% yoy from 10.8 million tons to 11.0 million tons,
in Italy by 5.5% yoy from 5.8 million tons to 6.1 million tons, in France by 3.3% yoy from 3.8 million tons to 3.9 million tons,
in Spain by 0.9% yoy from 3.5 million tons to 3.6 million tons and in the UK by 4.1% yoy from 1.8 million tons to 1.9 million tons
with a concurrent yoy decrease in steel production in, among others, the Czech Republic (down by 1.4% yoy from 1.31 million
tons to 1.29 million tons). Outside the EU, steel production increased on a yoy basis in Russia (by 4.1% yoy from 17.2 million
tons to 18.0 million tons) and Belarus (by 24.2% yoy from 0.5 million tons to 0.6 million tons).
As regards non-European countries, special attention should be paid to global leaders in steel production, namely China, Japan
and India. In January-March 2017, each of these countries recorded an increase in steel production: China by 4.5% yoy (from
192.4 million tons to 201.1 million tons), Japan by 1.5% yoy (from 25.8 million tons to 26.2 million tons) and India by 10.7% yoy
(from 23.3 million tons to 25.8 million tons).22
Construction industry
According to data published by the Central Statistical Office of Poland, construction and installation production at constant prices
in March of this year was higher by 49.4% mom and 17.2% yoy. This indicator, when adjusted for seasonal differences,
was higher by 10.2% yoy and 9.7% mom.
In Q1 2017, total construction and installation production was higher by 3.9% than in the corresponding period of the previous
year (compared to a 13.3% yoy decrease in Q1 2016).
Increases in output on a yoy basis in Q1 2017 were also observed in the following sectors: construction of buildings
(+18.6% yoy), construction of civil engineering facilities (+14.3% yoy), specialized construction works (+18.3% yoy).
In Q1 2016, declines in construction output resulted from delays in the preparation for the use of funds under the new EU
budget framework. These projects bounced back only at the end of 2016 and bore fruit noticeably in Q1 2017. Among the
breakthrough events that supported this increase in capital expenditure spending in this sector were earlier amendments
to public procurement law.
In March of this year, the Ministry of Development announced that nine large Polish cities (Bielsko-Biała, Gdańsk, Katowice,
Konin, Piotrków Trybunalski, Poznań, Szczecin, Toruń, Wrocław) will obtain a total of PLN 1.2 billion in EU co-financing
21
World Steel Association 22
World Steel Association

23
Consolidated report for Q1 2015
PKP CARGO GROUP
ADDITIONAL INFORMATION TO THE CONSOLIDATED QUARTERLY REPORT
FOR Q1 2017
for the execution of construction projects aimed at improving their road infrastructure. Moreover, five road construction projects
were co-financed in the same period (two sections of the S5 expressway, one section of the S8 expressway, the Wałcz ring road
and the Kościerzyna ring road) in the total amount of PLN 2.4 billion as a result of which approx. 140 km of roads will be
constructed.23
Industry in the Czech Republic
In Q1 2017, seasonally adjusted industrial output increased by 3.5% yoy (whereas seasonally unadjusted industrial output
increased by 5.3% yoy). The following factors had the strongest impact on the increase in the rate of growth in annual industrial
output in 3M 2017: production of chemicals and chemical products (total growth of 21.7% yoy), manufacture of motor vehicles,
trailers and semi-trailers (+14.9% yoy), manufacture of rubber and plastic products (+11.0% yoy) and manufacture of finished
metal products (+7.4% yoy). Industrial output recorded decreases in the following industries: production of other transport
equipment (overall decline by 12.0% yoy), mining and extraction of raw materials (-4.5% yoy) and repair and assembly
of machinery and equipment (-2.0% yoy).24
Revenues from industrial activity at current prices rose by 10.7% yoy in Q1 2017 and direct export sales revenues of industrial
enterprises at current prices increased by 11.2% yoy. Domestic sales, which comprised indirect exports (through non-industrial
companies), at current prices decreased by 10.1% yoy.
In January-March 2017, the value of new orders in selected industrial sectors increased by 10.2% yoy. The number of new
orders from abroad increased by 9.9% yoy, while new domestic orders rose by 10.9% yoy.
In Q1 2017 in companies with 50 employees or more, the headcount increased by 1.9% yoy. Their average monthly nominal
gross salary in 2016 increased by 5.3% yoy and reached CZK 29,653 (or approx. PLN 4,685).
Mining industry
In Q1 2017, total hard coal mining output was 1.6 million tons, down 22.3% yoy, or 0.4 million tons, compared to Q1 2016,
mainly as a result of the uncertain situation of the Czech mining sector. In accordance with the adopted contingency plan, OKD,
through an increase in the share capital of its subsidiary, will contribute its enterprise (without claims specified as excluded;
the current contract between AWT and OKD for the provision of transport services is not part of the exclusion list) to OKD’s
subsidiary. Subsequently, OKD is expected to sell a 100% stake in the subsidiary OKD PRISKO to a company wholly owned
by the State Treasury of the Czech Republic. The purchase price for OKD PRISKO will be approx. CZK 79 million (approx.
PLN 12.5 million). The conditions for the sale will include approval of the restructuring plan by the court and approval of the
transaction by the Czech antimonopoly authority. Proceeds from the transaction are intended to be used for repayment of debt
to the creditors.25
It should also be noted that the Czech mining industry may be affected by a change in the energy mix. The Czech Republic
is focused primarily on increasing nuclear power generation (according to the Nuclear Energy Program until 2040). Currently,
nuclear energy represents 32.5% of total energy output in the Czech Republic and this share is expected to rise to 58.0%
by 2040. The increase in the share of nuclear energy is anticipated be achieved at the expense of energy generated from lignite.
By the end of 2040, energy generated from renewable sources and gas is expected to account for 25.0% and 15.0%
of the Czech Republic’s total energy output, respectively.26
The figure below presents quarterly hard coal production (coking and steam coal, without coke and coal deposit) in 2015-2017.
23
Wirtualny Nowy Przemysł [Virtual New Industry] 24
CZSO, Industry in December 2016 25
Wyborcza.biz 26
Wirtualny Nowy Przemysł [Virtual New Industry]

24
Consolidated report for Q1 2015
PKP CARGO GROUP
ADDITIONAL INFORMATION TO THE CONSOLIDATED QUARTERLY REPORT
FOR Q1 2017
Figure 7 Quarterly extraction of hard coal in the Czech Republic in 2015-2017 (thousand tons)
Source: Czech Ministry of Industry and Trade
Steel industry
The metallurgical industry in the Czech Republic consists mainly of two sectors: ferrous and non-ferrous metal processing
and metal founding. The steel production industry is driven predominantly demand from the automotive, construction
and mechanical engineering sectors. Barriers to its growth include high costs inherently associated with other kinds of transport
than maritime or inland waterway transport, which is due to the Czech Republic’s location away from seas and larger rivers.
For this reason, the industry must make use of the more expensive road or rail transport.27
Steel Federation a.s. published data which suggest that in Q1 2017 the rate of growth in output increased for only one
of the three major products, namely hot-rolled materials (an increase by 3.3% yoy to 1.3 million tons). Output of the other two
products, i.e. pig iron and crude steel, declined on a yoy basis. Pig iron output fell by 0.9% yoy to 1.0 million tons in Q1 2017,
whereas crude steel output declined by 1.4% yoy to 1.3 million tons.28
Construction industry
In Q1 2017, seasonally adjusted construction and installation output declined by 2.1% yoy (whereas seasonally unadjusted
construction and installation output declined by 0.1% yoy). Output in the construction of buildings increased by 3.9% yoy (and its
share in total construction output rose by 3.0 p.p.), whereas output in construction engineering declined by 13.4% yoy (and its
share in total construction output fell by 3.1% p.p.).29
The average number of registered employees30
in construction companies employing 50 or more staff in Q1 2017 fell by 3.1%
yoy. The average monthly nominal gross salary of such employees increased by 3.2% yoy to CZK 31,014 (or approx.
PLN 4,900).
In Q1 2017, the number of construction orders undertaken by companies employing 50 or more staff increased by 3.1% yoy,
which translated into 12,046 orders executed in the Czech Republic. In turn, the total value of orders increased by 18.1% yoy
to CZK 39.5 billion (or approx. PLN 6.2 billion).
In the period January-March 2017, the number of granted building permits was 18.9 thousand, up 8.2% yoy. The approximate
value of construction orders for which building permits were obtained is estimated at CZK 79.8 billion (or approx.
PLN 12.6 billion), up 41.5% yoy.
Automotive Industry
The Czech Republic is among the most significant car manufacturers in Europe with its automotive industry providing a very
important driving force for the development of the country’s economy. This is the effect of the country’s long tradition of car
27
http://www.budoucnostprofesi.cz/sectoral-studies/industries-development/14_manufacture-of-basic-metals-and-fabricated-metal-products.html 28 The Steel Federation, A.S. 29
Czech Statistical Office 30
the breakdown does not comprise persons working on the basis of different employment contracts, business owners and cooperating household members who do not have employment contracts

25
Consolidated report for Q1 2015
PKP CARGO GROUP
ADDITIONAL INFORMATION TO THE CONSOLIDATED QUARTERLY REPORT
FOR Q1 2017
manufacturing. Thanks to the maintenance of a high number of jobs in this industry and a continuous increase in yoy output,
the car production market is perceived as one of the best stimuli for the Czech economy.31
The biggest manufacturers of passenger cars in the Czech Republic include: Škoda Auto (a 60.0% share in Czech output in
Q1 2017), Hyundai Motor Manufacturing Czech s.r.o. (a 25.3% share) and TPCA – Toyota Peugeot Citroën Automotive (a
14.7% share). Vans and buses are manufactured by: Iveco Czech Republic (a 90.9% share in total bus production in the Czech
Republic in Q1 2017), SOR Libchavy (a 8.1% share) and other manufacturers (a 1% share).
According to data published by the Automotive Industry Association, in Q1 2017, a total of 395 thousand road vehicles were
manufactured in the Czech Republic (357 thousand in Q1 2016), representing an increase by 10.7% yoy, including:
387.3 thousand passenger cars (up 10.7% yoy), more than 1 thousand buses (up 4.6% yoy) and approx. 0.5 thousand
motorcycles (down 32.1% yoy). The largest relative increase was observed in the production of trucks: from 229 in Q1 2016
to 394 in the corresponding period of 2017 (up 72.1% yoy).
4.2. Freight transportation activity
4.2.1. Rail transport market in Poland
In Q1 2017, rail freight services in Poland were provided by 63 carriers holding a license issued by the Office of Rail Transport,
among them PKP CARGO S.A. and PKP CARGO SERVICE Sp. z o.o. During this period, rail freight volume reached
54.1 million tons, compared to 49.9 million tons transported in Q1 2016 (up 8.4% yoy). Rail freight turnover in the reporting
period increased by 6.4% yoy (or 0.7 billion tkm), whereas the average haul in rail transport decreased by 4.3 km yoy
(or -1.9% yoy) to 223.8 km.32
The increased freight volume in Q1 2017 compared to the corresponding period of the previous year was mainly driven
by economic recovery, which was most evident in intermodal transport (development of transit routes and handling of cargo
connections on the China-Europe-China route as part of the “New Silk Road” and a higher percentage of bulk cargo now being
transported in containers, e.g. coke, wood chips) and the construction industry (commencement of road and rail construction
projects coupled with favorable weather conditions in January and March of this year). Other presumed drivers of this growth
in transport include an increase in electricity generation and a higher volume of foreign trade. The decrease in the average haul
is also a positive aspect, because it means that clients are willing to order rail transport services also for shorter distances to be
covered than a year earlier.
In January-February 2017, an increase in freight volume was recorded in the hard coal rail transport segment from 14.2 million
tons (in January-February 2016) to 14.7 million tons, up 3.5% yoy. Moreover, both in January and in February 2017 inventories
of coal stockpiled in mine storage yards declined compared to the corresponding months of the previous year. In January 2017,
inventories of hard coal stood at 2.3 million tons, down by 3.4 million tons yoy (from 5.7 million tons), whereas in February 2017
this figure decreased by 4.2 million tons to slightly more than 1.9 million tons. The higher sales of this commodity were driven
by higher coal prices on international markets (ARA and RB) in the months in question.
In 2M 2017, transport of metal ores also went up, mainly in the subgroup of iron ores (an increase by 0.3 million tons, or 26%
yoy, to 1.7 million tons). This stemmed from a low base in 2M 2016. The poorer transport performance in January-February
2016 was associated with the tough situation in the metallurgical industry on global markets resulting from the economic
slowdown in China, which suppressed demand for steel.
In 2M 2017, transport of timber and wooden products declined on a yoy basis (a decrease by 0.1 million tons, or 36% yoy,
to 0.2 million tons). This was associated predominantly with the suspension of exports of this raw material by Belarus in January
of this year and the subsequent significant reduction in such exports (following their resumption). In the same period, transport
of chemical products also declined (by 0.1 million tons, or 8% yoy, to 1.4 million tons), primarily due to a decrease in the price of
sulfuric acid, the profitability of its sales and the associated lower volume of this commodity intended for exports.
31
AutoSAP 32
Office of Rail Transport

26
Consolidated report for Q1 2015
PKP CARGO GROUP
ADDITIONAL INFORMATION TO THE CONSOLIDATED QUARTERLY REPORT
FOR Q1 2017
Figure 8 Rail freight volumes in Poland (in million tons) in individual quarters of 2014-2017
Source: Office of Rail Transport
Figure 9 Rail freight turnover in Poland (in billions tkm) in individual quarters of 2014-2017
Source: Office of Rail Transport
4.2.2. Position of the PKP CARGO Group in the rail transport market in Poland
In Q1 2017, the PKP CARGO Group maintained its leading position on the rail freight market with a 44.9% market share (+0.6
p.p. yoy) in terms of freight volume and a 52.3% market share in terms of freight turnover (+0.2 p.p. yoy).
Figure 10 Share of the PKP CARGO Group in freight volume in 2014-2017 in Poland
Source: proprietary material based on Office of Rail Transport’s data

27
Consolidated report for Q1 2015
PKP CARGO GROUP
ADDITIONAL INFORMATION TO THE CONSOLIDATED QUARTERLY REPORT
FOR Q1 2017
Figure 11 Share of the PKP CARGO Group in freight turnover in 2014-2017 in Poland
Source: proprietary material based on Office of Rail Transport’s data
Figure 12 Market shares of the biggest rail operators in Poland in Q1 2017, by freight volume and freight turnover
By freight volume By freight turnover
Source: proprietary material based on Office of Rail Transport’s data
The most effective rail freight carriers competing with the PKP CARGO Group on the Polish market include the following
companies: DB Cargo Polska, Lotos Kolej, the CTL Group, PKP LHS, PUK KOLPREM, Freightliner PL, Pol-Miedź Trans
and Orlen Kol-Trans.
In Q1 2017, the PKP CARGO Group’s most significant competitors in terms of freight volume included: DB Cargo Polska, Lotos
Kolej and the CTL Group, which held market shares of 19.1%, 5.6% and 4.9%, respectively. In terms of freight turnover,
the most active operators (besides the PKP CARGO Group) were Lotos Kolej, PKP LHS and DB Cargo Polska with a market
share of 9.6%, 6.4% and 5.8%, respectively.
In January-March 2017, compared to the corresponding period in 2016, the largest increases in freight turnover were posted
by the following rail operators competing against the PKP CARGO Group: DB Cargo Polska (+132.5 million tkm, which
translated into an increase in the market share by 0.8 p.p.) and PKP LHS (+91.0 million tkm, which translated into an increase
in the market share by 0.4 p.p.). The most sizeable decreases in the market share were recorded by the CTL Group
(-143.4 million tkm, a decrease by 1.6 p.p.) and Lotos Kolej (-69.4 million tkm, a decrease by 1.2 p.p.). In the reporting period,
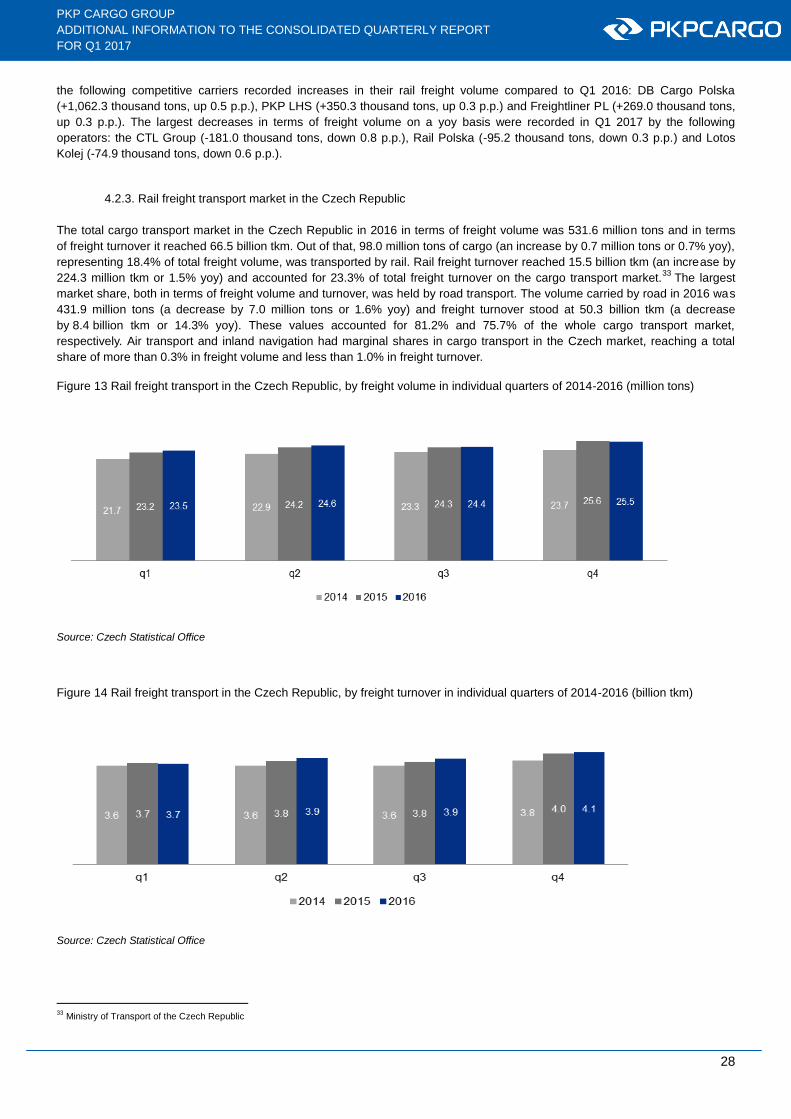
28
Consolidated report for Q1 2015
PKP CARGO GROUP
ADDITIONAL INFORMATION TO THE CONSOLIDATED QUARTERLY REPORT
FOR Q1 2017
the following competitive carriers recorded increases in their rail freight volume compared to Q1 2016: DB Cargo Polska
(+1,062.3 thousand tons, up 0.5 p.p.), PKP LHS (+350.3 thousand tons, up 0.3 p.p.) and Freightliner PL (+269.0 thousand tons,
up 0.3 p.p.). The largest decreases in terms of freight volume on a yoy basis were recorded in Q1 2017 by the following
operators: the CTL Group (-181.0 thousand tons, down 0.8 p.p.), Rail Polska (-95.2 thousand tons, down 0.3 p.p.) and Lotos
Kolej (-74.9 thousand tons, down 0.6 p.p.).
4.2.3. Rail freight transport market in the Czech Republic
The total cargo transport market in the Czech Republic in 2016 in terms of freight volume was 531.6 million tons and in terms
of freight turnover it reached 66.5 billion tkm. Out of that, 98.0 million tons of cargo (an increase by 0.7 million tons or 0.7% yoy),
representing 18.4% of total freight volume, was transported by rail. Rail freight turnover reached 15.5 billion tkm (an increase by
224.3 million tkm or 1.5% yoy) and accounted for 23.3% of total freight turnover on the cargo transport market.33
The largest
market share, both in terms of freight volume and turnover, was held by road transport. The volume carried by road in 2016 was
431.9 million tons (a decrease by 7.0 million tons or 1.6% yoy) and freight turnover stood at 50.3 billion tkm (a decrease
by 8.4 billion tkm or 14.3% yoy). These values accounted for 81.2% and 75.7% of the whole cargo transport market,
respectively. Air transport and inland navigation had marginal shares in cargo transport in the Czech market, reaching a total
share of more than 0.3% in freight volume and less than 1.0% in freight turnover.
Figure 13 Rail freight transport in the Czech Republic, by freight volume in individual quarters of 2014-2016 (million tons)
Source: Czech Statistical Office
Figure 14 Rail freight transport in the Czech Republic, by freight turnover in individual quarters of 2014-2016 (billion tkm)
Source: Czech Statistical Office
33
Ministry of Transport of the Czech Republic

29
Consolidated report for Q1 2015
PKP CARGO GROUP
ADDITIONAL INFORMATION TO THE CONSOLIDATED QUARTERLY REPORT
FOR Q1 2017
4.2.4. Position of the AWT Group in the rail transport market in the Czech Republic
According to a classification published by the Czech Rail Infrastructure Authority (SŽDC), in 2016 there were 97 carriers on the
Czech cargo transport market, including PKP CARGO S.A. and Advanced World Transport a.s.34
In each quarter of H1 2016, AWT had a bigger share in terms of freight volume than in the corresponding periods of the year
before (+2.0 p.p. yoy in Q1 2016, +0.6 p.p. yoy in Q2 2016, in total +1.3 p.p. yoy with an 11.9% share in 6M 2015 to a 13.2%
share in 6M 2016). In H2 2016, AWT recorded a poorer result in terms of market share than in 2015. This was due
to an unstable financial situation of OKD being the only hard coal mining company in the Czech Republic. AWT’s market share
in Q3 2016 declined by 1.8 p.p. yoy to 11.9% (in Q3 2015, the share was 13.6%) and in Q4 2016 by 1.8 p.p. from 14.2%
in Q4 2015 to 12.4% in Q4 2016. In total in H2 2016, the market share fell by 1.8 p.p. yoy from 13.9% in H2 2015 to 12.1%
in H2 2016. The annual market share in 2016 declined to 12.7% from 12.9% in 2015, or 0.2 p.p. yoy. The declines, starting
in Q3 2016, were driven predominantly by a significantly lower hard coal output by OKD, which translated into smaller freight
volume ordered from AWT. As part of the adopted OKD restructuring plan and gradual decommissioning of the company’s
mines, it is anticipated that mining operations will be completed within the next six years.35
The decreases in coal freight volumes in Q2 2016 were partly offset by an increase in freight volume of liquid fuels (up by
129.9 thousand tons yoy), chemicals (up by 71.6 thousand tons yoy), timber and agricultural produce (up by 59.3 thousand tons
yoy) and aggregates (up by 33 thousand tons yoy). Currently, discussions are underway aimed at replacing the lost freight
volume of coal with other merchandise.
Figure 15 AWT a.s.’s market shares in terms of freight volume in the Czech Republic quarterly in 2014-2016.
Source: Proprietary material
Figure 16 AWT a.s.’s market shares in terms of freight turnover in the Czech Republic quarterly in 2014-2016.
Source: Proprietary material
34
Správa železniční dopravní cesty (SŽDC) – data as at 25 April 2017 35
Nettg.pl

30
Consolidated report for Q1 2015
PKP CARGO GROUP
ADDITIONAL INFORMATION TO THE CONSOLIDATED QUARTERLY REPORT
FOR Q1 2017
Figure 17 Market shares of the biggest rail operators by operational freight turnover in the Czech Republic in January-March 2017 (btkm)
Source: SŽDC
In Q1 2017, the leading operator in the Czech rail freight market was again ČD Cargo a.s. with a share of 62.6% in terms
of gross freight turnover, however it should be noted that the Company is recording a steady decrease in its market share.
Compared to Q1 2016, the company’s market share decreased by 2.0 p.p. yoy (from 64.6%) in favor of the following carriers:
PKP CARGO S.A. (which did not appear in the Q1 2016 classification and which held a 2.6% market share in the period from
January to March 2017), Rail Cargo Carrier – Czech Republic s.r.o. (an increase in the market share by 0.4 p.p. yoy from 2.3%
in 3M 2016 to 2.7% in 3M 2017) and Unipetrol Doprava, s.r.o. (an increase in the market share by 0.1 p.p. yoy from 4.0%
in 3M 2016 to 4.1% in 3M 2017). AWT a.s. recorded a market share decrease by 1.5 p.p. yoy from 10.2% in Q1 2016 to 8.8%
in Q1 2017. The appearance of PKP CARGO S.A. in the classification published by the Rail Infrastructure Authority (SŽDC)36
is a result of the Company’s intensification of foreign transportation activity in the Czech Republic which was driven
predominantly by the following factors:
takeover of hard coal transport orders from a competitive carrier for exports from Poland to Slovakia via the Czech
Republic,
acquisition of hard coal transport orders for exports from Poland to the Czech Republic,
acquisition of coke transport orders for exports from Poland to Romania with some routes running via the Czech
Republic,
increase in freight volume of iron ore in transit from Polish seaports and Ukraine to the Czech Republic,
increase in intermodal transport between Poland and Italy, including via the territory of the Czech Republic, and
transport of cars and car components in containers in transit from the Czech Republic to Russia,
increase of carriage of cars from and to Italy via conventional means of transport.
The carriers which exceeded 5% of the share in the Czech rail freight transport market in terms of gross freight turnover
in Q1 2017 were the following: the state-owned company ČD Cargo a.s., Advanced World Transport a.s. and METRANS Rail
s.r.o. Other carriers with a market share of less than 5% but more than 1% included: Unipetrol Doprava, s.r.o., Rail Cargo
Carrier – Czech Republic s.r.o, PKP CARGO S.A., IDS Cargo a.s. and SD – Kolejova doprava a.s.
36
SZDC; the classification presents operators holding more than 1% share in the Czech market

31
Consolidated report for Q1 2015
PKP CARGO GROUP
ADDITIONAL INFORMATION TO THE CONSOLIDATED QUARTERLY REPORT
FOR Q1 2017
4.2.5. PKP CARGO Group's rail transport
Data on the transport activities of the PKP CARGO Group for Q1 2017 and Q1 2016 contain consolidated data of PKP CARGO
S.A., PKP CARGO SERVICE Sp. z o.o. and the AWT Group.
In Q1 2017, transport activities were conducted by 5 members of the Group, namely PKP CARGO S.A., PKP CARGO SERVICE
Sp. z o.o., AWT a.s., AWT Rail HU Zrt. and AWT Rail SK a.s.
The PKP CARGO Group collaborates with the largest Polish and global groups, including ArcelorMittal, PKN Orlen, PGNiG,
Lafarge Group, Azoty Group, Jastrzębska Spółka Węglowa, Węglokoks, Enea Group, PGE Group, Tauron Group, Polska Grupa
Górnicza and International Paper. The contracts with these business partners are regularly renewed, which confirms the high
quality of the transportation services provided by the PKP CARGO Group. Examples of this include extensions of cooperation
with key clients in such segments as transport of solid fuels, chemicals and wood, and the acquisition of a contract from one
of the competing carriers for carriage of commodities to a major power plant in the northern part of the country and for exports
to the south of Europe.
The PKP CARGO Group provides rail freight services in the territory of Poland and seven other European Union states, i.e.:
Germany, the Czech Republic, Slovakia, Austria, the Netherlands, Hungary and Lithuania. The presence in these markets
is a growth opportunity for the Group, since it allows the Group to handle independently the volumes transported to and from
key European seaports, including those located on the North Sea (Amsterdam, Rotterdam, Zeebrugge, Antwerp, Hamburg)
and those located on the Adriatic Sea (Koper, Triest, Rijeka).
Regardless of foreign ports, the PKP CARGO Group remains actively involved in the operation and further development
of transport as part of a route leading from China through Poland to Western Europe, which has led to cooperation with Chinese
partners aimed at developing a whole-train rail link between China and Europe and developing strategic cooperation in the field
of transshipment activity in Małaszewicze. The primary objective of the project is to increase the volumes of overland intermodal
transport between China and Western Europe through Małaszewicze and back to Asia. Development of trade cooperation
between Poland and People’s Republic of China is expected to be facilitated thanks to the execution trade agreements
and cooperation agreements.
In Q1 2017, the PKP CARGO Group carried 27.4 million tons of cargo (+8% yoy) and achieved freight turnover of 7.1 billion tkm
(+8% yoy). This performance was driven by improved results in international transport, which reached 4.7 million tons (+9% yoy)
in terms of freight volume and 0.7 billion tkm (+23% yoy) in terms of freight turnover. In Q1 2017, members of the AWT Group
carried 3.1 million tons of cargo (-7% yoy) and achieved freight turnover of 0.5 billion tkm (+12% yoy)37
.
Solid fuels were the main type of goods carried by the Group, with hard coal being the dominating cargo. Transportation of solid
fuels accounted for 55% of freight volumes and 44% of the PKP CARGO Group’s realized freight turnover in Q1 2017.
In the same period, transportation of solid fuels was higher by 2% yoy in terms of freight volume and remained at the same level
as in Q1 2016 in terms of freight turnover. In Q1 2017, freight volume in hard coal transport increased by 2% yoy and freight
turnover decreased by 2% yoy, accompanied by a decrease in haul by 4% yoy, resulting primarily from an increase in the share
of export carriage through Poland’s southern border (shorter haul) at the expense of export carriage through Polish seaports
(longer haul). As regards transport of hard coal within Poland, freight volume increased by 7% yoy, while freight turnover was
the same as in Q1 2016. The increase in freight volume in Q1 2017 was driven, among other factors, by the acquisition
of contracts for transport services to a major power plant in the north of the country, exports to the Czech Republic, Slovakia
and Ukraine, imports from Russia and transit from seaports to Slovakia. This occurred despite a decline in hard coal output
in Poland (-11% yoy)38
, lower sales of this commodity (-4% yoy)39
and lower electricity generation in hard coal-fired power plants
(-0.5% yoy). Freight volume in hard coal transport outside the country decreased by 19% yoy and freight turnover fell by 22%
yoy, driven primarily by less extensive transport of this commodity from OKD’s mines. In another cargo category included
in solid fuels, namely in coke, the PKP CARGO Group’s transport performance decreased by 1% yoy in terms of freight volume
but surged in terms of freight turnover by 21% yoy, mainly due to an increase in the average haul by 22% yoy, which was due
to a higher share of transport from seaports (with long hauls involved).
Products associated with the metallurgical industry, i.e. metals and ores, are another important market area serviced by the
PKP CARGO Group. Their percentage in the Group’s freight turnover in Q1 2017 was 13% (14% in Q1 2016). This segment
recorded an increase of freight volume by 9% yoy in connection with stronger demand for metal ores resulting from the situation
in the metallurgical industry on the global markets (a 6% yoy increase in output according to data published by the World Steel
Association), improving economic conditions and lower exports from China (due to the imposition of customs duties on products
37
This applies to the AWT Group companies consolidated by the full method. 38
polskirynekwegla.pl. Data for 2M 2017. 39
polskirynekwegla.pl. Data for 2M 2017.

32
Consolidated report for Q1 2015
PKP CARGO GROUP
ADDITIONAL INFORMATION TO THE CONSOLIDATED QUARTERLY REPORT
FOR Q1 2017
sold at dumping prices). The increase in freight turnover in this segment was 3% yoy while the average haul fell by 5% yoy
(due to a change in the structure of freight routes in this segment in Q1 2017). A significant impact on the level of transport
of metals and ores (both raw materials and semi-finished products) in Q1 2017 was also exerted by greater steel production
(in Q1 2017, Poland produced 2.5 million tons of steel, up 10% yoy). According to projections by the Polish Steel Association
(HIPH), crude steel output in 2017 is expected to grow by approx. 5-6% yoy and the consumption of steel products is expected
to increase by approx. 2-3% yoy.
Aggregates and construction materials were the third largest group of commodities transported by the PKP CARGO Group
in Q1 2017, with a 11% share in total freight turnover (10% in Q1 2016). In transport of aggregates and construction materials,
in Q1 2017 an increase by 20% yoy was recorded in terms of freight volume coupled with a 21% yoy increase in terms of freight
turnover. The increase in freight performance in this segment is associated with the commencement of road and rail
construction projects and higher demand for limestone resulting from a higher output of metallurgical products. Conducive
weather conditions also contributed to the quantum of transport of aggregates and construction materials in Q1 2017: above-
zero temperatures permitted an earlier commencement of new road and rail construction projects and an earlier resumption
of work on projects that were already underway. In the reporting period, the supplies of limestone in exports to Ukraine and
the Czech Republic also increased.
The PKP CARGO Group continues to be the market leader in intermodal transport in Poland, an important element of its growth
strategy. In Q1 2017, the transport of intermodal units increased in terms of container freight volume by 28% yoy, while realized
freight turnover increased by 35% yoy. The increase in intermodal transport is driven mainly by the development of transit routes
and the handling of cargo connections on the China-Europe-China route as part of the “New Silk Road” and a higher percentage
of bulk cargo now being transported in containers (e.g. coke, wood chips). Transit between marine ports and inland terminals
has a significant share as well. In Q1 2017, transshipment of containers in Polish seaports declined by 2.8% yoy40
, while the
weight of containers transported by the PKP CARGO Group to/from Polish seaports increased by 13.6% yoy.
In Q1 2017, freight volume rose by 9% yoy and freight turnover by 17% yoy in the transport of chemicals, which was due in par t
to an increase in the average haul by 7% yoy. The growth in the transport of this cargo group was driven by higher imports
of gas from the East and higher exports of fertilizers by domestic producers.
In transport of liquid fuels in Q1 2017, freight volume rose by 46% yoy and freight turnover by 10% yoy, which is attributable
mainly to an decrease in the average haul by 25% yoy (the average haul in the transport of imports in Poland declined by 51%
yoy). The increase in the quantum of transport in this cargo category was driven mainly by curtailment of the so-called “grey
economy” in trade in liquid fuels as a result of last year’s amendments to legislation (the so-called “fuel package”) and more
effective law enforcement measures that were undertaken. In Q1 2017 in Poland, the PKP CARGO Group recorded an increase
in freight volume in this segment by 33% yoy, which was composed of an increase in domestic freight volume (+137% yoy)
and freight volume in the transport of imported merchandise (+8% yoy).
In the transport of timber and agricultural produce in Q1 2017, freight volume declined by 14% yoy with a concurrent increase
in realized freight turnover by 2% yoy, which is attributable mainly to an increase in the average haul by 18% yoy. The main
reason for the poorer transport performance in this segment was a decline in imports of wood from Belarus due to the
introduction of restrictions by the Belarusian government on the exports of timber from that country. The inter-category shifting
of some timber chip transport into the category of cargo container transport also contributed to lower timber transport.
Table 12 Freight turnover of the PKP CARGO Group in Q1 2017 and the corresponding period of 2016
Item Q1 2017 Q1 2016 Change % change Q1 2017 Q1 2016
(million tkm) % percentage of total (%)
Solid fuels1 3,108 3,100 7 0% 44% 47%
of which hard coal 2,774 2,824 -50 -2% 39% 43%
Aggregates and construction materials2 764 630 134 21% 11% 10%
Metals and ores3 936 904 32 3% 13% 14%
Chemicals4 589 505 84 17% 8% 8%
Liquid fuels5 299 273 26 10% 4% 4%
Timber and agricultural produce6 423 415 8 2% 6% 6%
Intermodal transport 731 542 189 35% 10% 8%
Other7 226 171 55 32% 3% 3%
Total 7,075 6,540 535 8% 100% 100%
Source: Proprietary material
40
GUS – Statistical Bulletin No. 3/2017

33
Consolidated report for Q1 2015
PKP CARGO GROUP
ADDITIONAL INFORMATION TO THE CONSOLIDATED QUARTERLY REPORT
FOR Q1 2017
Table 13 Freight volume of the PKP CARGO Group in Q1 2017 and the corresponding period of 2016
Item Q1 2017 Q1 2016 Change % change Q1 2017 Q1 2016
(000s tons) % percentage of total (%)
Solid fuels1 14,958 14,650 308 2% 55% 58%
of which hard coal 13,529 13,204 325 2% 49% 52%
Aggregates and construction materials2 3,056 2,556 499 20% 11% 10%
Metals and ores3 3,111 2,841 270 9% 11% 11%
Chemicals4 1,746 1,596 150 9% 6% 6%
Liquid fuels5 994 679 315 46% 4% 3%
Timber and agricultural produce6 1,031 1,195 -164 -14% 4% 5%
Intermodal transport 1,849 1,442 407 28% 7% 6%
Other7 657 478 180 38% 2% 2%
Total 27,401 25,437 1,964 8% 100% 100%
Source: Proprietary material
Table 14 Average haul of the PKP CARGO Group in Q1 2017 and the corresponding period of 2016
Item Q1 2017 Q1 2016 Change % change
km %
Solid fuels1 208 212 -4 -2%
of which hard coal 205 214 -9 -4%
Aggregates and construction materials2 250 246 4 2%
Metals and ores3 301 318 -17 -5%
Chemicals4 337 316 21 7%
Liquid fuels5 301 402 -101 -25%
Timber and agricultural produce6 410 347 63 18%
Intermodal transport 395 376 20 5%
Other7 343 358 -15 -4%
Total 258 257 1 0%
Source: Proprietary material
1 Includes hard coal, coke and lignite.
2 Includes all kinds of stone, sand, bricks and cement.
3 Includes ores and pyrites, as well as metals and metal products.
4 Includes fertilizers and other chemicals.
5 Includes crude oil and petrochemical products.
6 Includes grain, potatoes, sugar beets, other produce, wood and wooden products.
7 Includes ferry transportation and other freight.
From the point of view of the directions in which the PKP CARGO Group’s transportation services were provided, transportation
within Poland was dominant, constituting 90% of the realized freight turnover in Q1 2017. In comparison with Q1 2016, the
percentage of freight turnover performed outside Poland rose by 1 p.p., which highlights the steady growth of freight outside
Poland.
4.3. Other services
The Group’s core business is rail freight transport. In addition to rail freight transport services, the Group also provides additional
services:
forwarding services – the Group’s freight forwarding offering consists of comprehensive logistics services using vehicle,
marine and inland water transportation incorporating transshipment, storage, warehousing and packaging. The Group
also offers customs handling. The comprehensive transport solutions designed and implemented (3PL solutions)
are an additional strength for the Group’s services. Freight forwarding services are provided chiefly by PKP CARGO
CONNECT Sp. z o.o. and AWT Čechofracht a.s.;
traction services and locomotive lease services which involve the provision of a traction unit with an operating team
to perform a railway transport operation or to ensure its readiness, e.g. to propel repair or rescue trains. Such services
are provided on the Polish market and abroad;

34
Consolidated report for Q1 2015
PKP CARGO GROUP
ADDITIONAL INFORMATION TO THE CONSOLIDATED QUARTERLY REPORT
FOR Q1 2017
comprehensive siding services, entailing among others formation of trains, maneuvering services, rail traffic
management on sidings, loading and unloading, warehouse management, conservation and ongoing maintenance
of point infrastructure. PKP CARGO SERVICE Sp. z o.o. and AWT a.s. are the main entities providing these services.
Siding services are offered in Poland, the Czech Republic and Hungary;
transshipment services – the PKP CARGO Group has been developing its transshipment activity on the basis
of conventional and intermodal transshipment terminals owned by PKP CARGO Centrum Logistyczne Małaszewicze
Sp. z o.o., PKP CARGO Centrum Logistyczne Medyka-Żurawica Sp. z o.o., PS TRADE TRANS Sp. z o.o.,
CARGOSPED Sp. z o.o. and AWT a.s.;
intermodal logistics services – the Group takes care of all the elements of the logistics chain, including: rail transport,
road transport, transshipment and storing intermodal units. This activity is based on a network of intermodal terminals.
Within the Group, PKP CARGO CONNECT Sp. z o. o. is the company specializing in, and dedicated to,
comprehensive intermodal transport service. The service of constantly monitoring the traffic of intermodal trains called
“Track and Trace” implemented by AWT brings added value to the Group’s offer;
rolling stock repairs – maintenance of the Group’s rolling stock is provided mainly by a dedicated company
PKP CARGOTABOR Sp. z o.o. Additionally, selected repair and maintenance work is also done in the facilities situated
in the structures of the Units of PKP CARGO S.A. and by AWT a.s.;
land reclamation services – the Group’s service offering in this area consists of managing and revitalizing post-
industrial premises (including mining areas), work to raze objects, managing facilities allocated to utilize waste,
eliminating underground mining pits and de-contaminating soil. Additionally, the Group offers services in the area
of civil engineering. The land reclamation activity is carried out by AWT Rekultivace a.s. and AWT Rekultivace PL
sp. z o.o., chiefly in the Czech Republic in the vicinity of Ostrava where mining waste deposits are located.
The Group does not distinguish operating segments of its activity, since it has one main product, which incorporates all
the material services provided by the Group. The Group conducts its business within one main segment – domestic
and international cargo freight and provision of comprehensive logistics services related to rail freight. The Management Board
of the Parent Company analyzes financial data in the layout in which they were presented in the Quarterly Condensed
Consolidated Financial Statements of the Group. The Group additionally provides services related to rolling stock repairs
and land reclamation services, but they are not material for the Group’s business and therefore are not treated as separate
operating segments.
4.4. Headcount
Information about changes in the headcount in the PKP CARGO Group in Q1 2017 and in 2016 is provided below.
Table 15 Headcount in Q1 2017 and 2016 in the PKP CARGO Group (active employees only)
Item Headcount as at: Change
YTD
Headcount as at: Change YTD 31/03/2017 31/12/2016 31/03/2016 31/12/2015
PKP CARGO Group 23,281 23,144 137 23,625 23,805 -180
including: PKP CARGO S.A. 17,247 17,429 -182 17,802 17,979 -177
Source: Proprietary material
Table 16 Average headcount in Q1 2017 and Q1 2016 in the PKP CARGO Group (active employees only)
Item
Average headcount in FTEs Change
2017 - 2016
Average headcount in persons Change
2017 - 2016 3 months 3 months 3 months 3 months
2017 2016 2017 2016
PKP CARGO Group 23,253 23,737 -484 23,272 23,766 -494
including: PKP CARGO S.A. 17,335 17,926 -591 17,339 17,930 -591
Source: Proprietary material

35
Consolidated report for Q1 2015
PKP CARGO GROUP
ADDITIONAL INFORMATION TO THE CONSOLIDATED QUARTERLY REPORT
FOR Q1 2017
Table 17 Movement in the headcount structure in Q1 2017 in the PKP CARGO Group (active employees only)
Item Headcount as at:
Change YTD Headcount as at:
Change YTD 31/03/2017 31/12/2016 31/03/2016 31/12/2015
White-collar positions - Group 5,250 5,272 -22 5,328 5,324 4
including: PKP CARGO S.A. 3,798 3,825 -27 3,871 3,863 8
Blue-collar positions - Group 18,031 17,872 159 18,297 18,481 -184
including: PKP CARGO S.A. 13,449 13,604 -155 13,931 14,116 -185
Total 23,281 23,144 137 23,625 23,805 -180
including: PKP CARGO S.A. 17,247 17,429 -182 17,802 17,979 -177
Source: Proprietary material
The average headcount (in FTEs) in the PKP CARGO Group was lower by 484 FTEs, or -2.0% yoy, than in the corresponding
period of the previous year, mainly as a result of termination of employment contracts due to the acquisition of old-age
and disability pension rights.
4.5. PKP CARGO Group’s investments
In Q1 2017, the Group incurred capital expenditures for the acquisition of property, plant and equipment in the form
of purchases, modernizations and the so-called overhaul component (periodic inspections and repairs of the rolling stock)
and intangible assets in the amount of PLN 86.4 million, which accounted for 47% of the figure in the corresponding period
of 2016, i.e. PLN 184.7 million (of which PLN 100.7 million constituted the purchase of multi-system locomotives).
The majority of capital expenditures in Q1 2017 in the Group was allocated to the execution of capital expenditure endeavors
associated with the rolling stock, mainly to periodic repairs and checkups of the rolling stock and modernization of locomotives
and wagons – in total PLN 76.6 million (i.e. 89% of capital expenditures). Moreover, expenditures were incurred on ICT
development, i.e. purchases of computer hardware and intangible assets (software) in the amount of PLN 2.2 million,
investment construction activity in the amount of PLN 5.1 million and purchases of other machinery and other workshop
and office equipment for PLN 2.4 million.
A detailed schedule of capital expenditures in Q1 2017 and comparison with the actuals from Q1 2016 is presented in the table
below.
Table 18 Capital expenditures on property, plant and equipment and intangible assets in the PKP CARGO Group in Q1 2017 compared to Q1 2016 (thousands of PLN)
Item Q1
2017 Q1
2016 Change % change
Investment construction activity 5,136 2,718 2,418 89%
Locomotive purchases - 100,742 -100,742 -
Locomotive upgrades 8,439 13,920 -5,481 -39%
Wagon upgrades 10 - 10 -
Workshop machinery and equipment 2,388 1,343 1,045 78%
ICT development 2,160 1,806 354 20%
Other 118 2,056 -1,938 -94%
Components in overhaul: 68,124 62,162 5,962 10%
Repairs and periodic inspections of locomotives 12,844 17,200 -4,356 -25%
Repairs and periodic inspections of wagons 55,280 44,962 10,318 23%
Total 86,375 184,747 -98,372 -53%
Source: Proprietary material

36
Consolidated report for Q1 2015
PKP CARGO GROUP
ADDITIONAL INFORMATION TO THE CONSOLIDATED QUARTERLY REPORT
FOR Q1 2017
4.6. Key information and events
Table 19 Key information and events which occurred in Q1 2017 and after the balance sheet date
Period Event
January ● PKP CARGO S.A. signed an annex to the investment loan agreement with Bank Polska Kasa Opieki S.A., extending the term of availability for PKP CARGO Group companies.
March
● Mr. Mirosław Pawłowski stepped down from his function of the PKP CARGO S.A. Supervisory Board Chairman. ● Mr. Krzysztof Mamiński was appointed to the PKP CARGO S.A. Supervisory Board as of 6 March 2017. ● Mr. Jerzy Kleniewski resigned from the position of PKP CARGO S.A. Supervisory Board Member.
●
On 14 March 2017, the Parent Company entered into an annex to the Investment Loan Agreement of 16 November 2015 with Bank Gospodarstwa Krajowego. According to the Annex, the loan will be available until 27 December 2017 in the amount of EUR 67,850,591.20.
● Mr. Władysław Szczepkowski was appointed to the PKP CARGO S.A. Supervisory Board as of 14 March 2017. ● Early repayment of a loan obtained from the European Bank for Reconstruction and Development.
●
Four PKP CARGO Group companies entered into an investment loan agreement with Bank Polska Kasa Opieki S.A. for the maximum amount of PLN 50,500,000.00 (WIBOR 3M + margin). The loans were granted for financing and/or refinancing of the investment plan. The loans were available until 19 March 2017. The final repayment date for the loans is 20 December 2021.
●
Receipt of a notification that, following the settlement on 21 March 2017 of the purchase of PKP CARGO S.A. shares effected on 17 March 2017, the stake held by TFI PZU Funds in the overall number of votes at the Company’s Shareholder Meeting exceeded the 5% threshold. Prior to the acquisition of the shares, the Funds held 2,231,450 shares in the Company representing 4.98% of its share capital and were entitled to 2,231,450 votes at the Shareholder Meeting representing 4.98% of the total number of votes. Following the transaction, the TFI PZU Funds hold 2,302,843 shares in the Company representing 5.14% of its share capital and are entitled to 2,302,843 votes at the Shareholder Meeting representing 5.14% of the total number of votes.
April
●
The Regional Court in Ostrava published a draft OKD a.s. restructuring plan. In accordance with the published plan, OKD, through an increase in the share capital of its subsidiary, will contribute its enterprise (without claims specified as excluded) to OKD’s Subsidiary; subsequently, OKD will sell a 100% stake in OKD’s Subsidiary to PRISKO a.s., a company wholly owned by the State Treasury of the Czech Republic, for approx. CZK 79 million (approx. EUR 2.6 million). The closing of the transaction is contingent on the following conditions precedent: approval of the restructuring plan by the court, approval of the transaction by the Czech anti-monopoly authority, increase in the share capital of OKD’s Subsidiary and deposit of the purchase price for a 100% stake in OKD’s Subsidiary. In addition, OKD will use the proceeds from the transaction to satisfy priority creditors in accordance with Czech law and to partly satisfy the remaining creditors. The closing is expected to take place in Q3 or Q4 2017. The current freight contract between AWT and OKD is not included in the list of Excluded Claims, hence OKD’s rights and obligations arising therefrom will be contributed to OKD’s Subsidiary acquired by PRISKO a.s.
● PKP CARGO S.A. was awarded with the prestigious title “Transparent Company of the Year 2016” for high quality of market communication and fulfillment of information and reporting duties.
May
●
Minezit SE (“MSE”) has exercised its right to demand that the Company repurchase of all the shares in AWT owned by MSE (“Put Option”). MSE is entitled to the above right under the Shareholder Agreement concluded between PKP CARGO, MSE and AWT on 30 December 2014. In accordance with the Shareholder Agreement, the total purchase price for the 15,000 shares, constituting 20% of all shares in AWT’s share capital AWT, is EUR 27,000,000.
● Signing coal transport contracts with the Enea Wytwarzanie from Lubelski Węgiel "Bogdanka" to Kozienice Power Plant. Under the new contract PKP CARGO S.A. during the 14 months will transport 5.3 million tons of coal.
Source: Proprietary material

37
Consolidated report for Q1 2015
PKP CARGO GROUP
ADDITIONAL INFORMATION TO THE CONSOLIDATED QUARTERLY REPORT
FOR Q1 2017
5. Analysis of the financial situation and assets of the PKP CARGO Group
5.1. Key economic and financial figures
5.1.1. Statement of comprehensive income
In Q1 2017, the PKP CARGO Group transported 27.4 million tons of cargo (i.e. 8% more than in Q1 2016) and recorded freight
turnover of 7.1 billion tkm (i.e. 8% more than in Q1 2016), which is described in detail in the chapter entitled “PKP CARGO
Group rail transport”.
In Q1 2017, the Group’s operating revenues increased by 6.4% yoy and operating expenses rose by 0.1% yoy. In Q1 2017,
the Group generated a result on operating activities and net result in the amount of PLN 3.2 million and PLN -1.4 million,
respectively.
The details of individual line items of the Statement of comprehensive income are presented in the further part of this section.
The tables below present the results of the PKP CARGO Group in Q1 2017 as compared to the corresponding period of 2016.
Table 20 Results of the PKP CARGO Group in Q1 2017 compared to the corresponding period of 2016 (thousands of PLN)
No. Item Q1 2017 Q1 2016 Change % change
(restated*) 2017 - 2016 2017/2016
1 Total operating revenue 1,100,201 1,034,354 65,847 6.4%
2 Total operating expenses 1,097,025 1,096,162 863 0.1%
3 Result on operating activities 3,176 -61,808 64,984 -
4 EBIT margin 0.3% -6.0% 6.3 p.p. -
5 EBITDA margin 13.4% 7.8% 5.6 p.p. 71.6%
6 Financial revenue 10,087 390 9,697 2486.4%
7 Financial expenses 15,184 14,559 625 4.3%
8 Share in the profit of entities measured by the equity method
2,019 1,364 655 48.0%
9 Result before tax 98 -74,613 74,711 -
10 Net profit margin 0.0% -7.2% 7.2 p.p. -
11 Income tax 1,532 -8,235 9,766 -
12 NET RESULT -1,434 -66,378 64,944 -
13 Net profit margin -0.1% -6.4% 6.3 p.p. -
Source: Condensed Quarterly Consolidated Financial Statements of the PKP CARGO Group for the period of 3 months ended 31 March 2017
prepared according to EU IFRS
* restatement of comparative data is described in detail in Note 5 to the Condensed Quarterly Consolidated Financial Statements
Operating revenues
Table 21 Operating revenue of the PKP CARGO Group in Q1 2017 compared to the corresponding period of 2016 (thousands of PLN)
No. Item Q1 2017 Q1 2016 Change % change
2017 - 2016 2017/2016
1 Revenue from sales of services and finished products 1,077,580 1,014,043 63,537 6.3%
1.1 Revenue from rail transportation and freight forwarding services
909,305 840,685 68,620 8.2%
2 Revenue from sales of goods and materials 9,920 8,757 1,163 13.3%
3 Other operating revenue 12,701 11,554 1,147 9.9%
4 Total operating revenue 1,100,201 1,034,354 65,847 6.4%
Source: Condensed Quarterly Consolidated Financial Statements of the PKP CARGO Group for the period of 3 months ended 31 March 2017
prepared according to EU IFRS
In the Group’s total operating revenue the biggest item was revenue from sales of services and finished products (97.9%
in Q1 2017, with 98.0% in Q1 2016). Revenue from sales of services and finished products comprises: revenue from rail

38
Consolidated report for Q1 2015
PKP CARGO GROUP
ADDITIONAL INFORMATION TO THE CONSOLIDATED QUARTERLY REPORT
FOR Q1 2017
transportation and freight forwarding services, revenue from other transportation activity, revenue from siding and traction
services, revenue from transshipment, revenue from land reclamation, as well as other revenue, including primarily: revenue
from the lease of assets, revenue on the customs agency, revenue from sales of finished products and revenue from rolling
stock repair services. The remaining part of operating revenue of the PKP CARGO Group comprises revenue from sales
of goods and materials, which includes, among others, sales of steel and cast iron scrap and goods, including coal, as well as
other operating revenue comprising, among others, gains from sales of non-financial non-current assets, reversal of impairment
losses on trade and other receivables, received fines and compensations, net foreign exchange gains/(losses) on trade
receivables and liabilities, reversal of provisions and subsidies.
Revenue from rail transportation and freight forwarding services in Q1 2017 increased PLN 68.6 million, i.e. 8.2% yoy.
The details pertaining to PKP CARGO Group’s transport services are described in detail in the chapter “PKP CARGO Group's
rail transport”. Other items in revenue from sales of services and finished products decreased by PLN 5.1 million, i.e. -2.9% yoy,
mainly as a result of decrease in revenues from siding and traction services by PLN 5.4 million, i.e. -8.1% yoy as a result
of discontinuation of the mining activity of the Makoszowy hard coal mine and discontinuation of the mining activity
of the Krupiński hard coal mine.
The increase in revenue from sales of goods and materials in Q1 2017 by PLN 1.2 million, i.e. 13.3% yoy, was attributable
mainly to the higher sale of scrap (i.e. waste from overhaul activities) by PKP CARGOTABOR and higher sales of goods,
in particular coal, in CARGOSPED Terminal Braniewo.
The increase in other operating revenue by PLN 1.1 million, or 9.9% yoy, was caused by higher profit on sale of non-financial
non-current assets by PLN 5.0 million, or 437.9% yoy (sale of container trailers in PKP CARGO CONNECT and sale of Plzen
land in AWT), with a decrease in foreign exchange gains by PLN 3.1 million as a result of exchange rate changes and lower
revenues on received fines and compensations by PLN 0.9 million, or -20.3% yoy.
Operating expenses
Table 22 Operating expenses of the PKP CARGO Group in Q1 2017 compared to the corresponding period of 2016 (thousands of PLN)
No. Item Q1 2017 Q1 2016 Change % change
2017 - 2016 2017/2016
1 Depreciation and amortization and impairment losses
143,841 142,359 1,482 1.0%
2 Consumption of materials and energy 170,643 162,818 7,824 4.8%
3 External services 372,006 366,568 5,439 1.5%
4 Taxes and charges 10,310 7,026 3,284 46.7%
5 Employee benefits 371,185 385,348 -14,163 -3.7%
6 Other expenses by kind 13,056 11,563 1,493 12.9%
7 Cost of goods and materials sold 7,396 8,336 -939 -11.3%
8 Other operating expenses 8,588 12,144 -3,556 -29.3%
9 Total operating expenses 1,097,025 1,096,162 863 0.1%
Source: Condensed Quarterly Consolidated Financial Statements of the PKP CARGO Group for the period of 3 months ended 31 March 2017
prepared according to EU IFRS
In Q1 2017, operating expenses increased by PLN 0.9 million, or 0.1% yoy, to PLN 1,097.0 million.
In Q1 2017, depreciation and amortization expenses and impairment losses rose by PLN 1.5 million, or 1.0% yoy,
to PLN 143.8 million, as a result of increased capital expenditures on fixed assets which have a depreciation term of several
years, in particular repair components.
In Q1 2017, the cost of consumption of materials and energy were higher by PLN 7.8 million, i.e. 4.8%, yoy, of which: fuel
consumption costs increased PLN 9.4 million, i.e. 25.8% yoy, as a result of higher freight transport in diesel traction and
the price level, costs of consumption of electricity, gas and water dropped PLN 1.0 million, i.e. -1.0% yoy as a result of decrease
in the share of transport in electric traction, consumption of materials (excluding fuel) dropped PLN 0.6 million, i.e. -2.3% yoy.
In Q1 2017, the costs of external services increased by PLN 5.4 million, or 1.5% yoy, to PLN 372.0 million. The main reason
for the hike in the above costs was the increase in the fees for access to the lines of infrastructure managers by PLN 7.1 million,
or 4.6% yoy, caused by increasing freight transport. In addition, the increase in transport boosted the costs of transportation

39
Consolidated report for Q1 2015
PKP CARGO GROUP
ADDITIONAL INFORMATION TO THE CONSOLIDATED QUARTERLY REPORT
FOR Q1 2017
services by PLN 15.0 million, or 15.5% yoy, in particular freight forwarding costs. At the same time, in the costs of external
services, there was a decrease in costs of rent and charges for the use of property and rolling stock by PLN 12.9 million,
or -24.7% yoy, as a result of lower rents for leased rolling stock (as a result of purchase of multi-system locomotives), decrease
in the charges for parking wagons to external railways and decrease of rental of wagons in AWT.
The taxes and charges in Q1 2017 increased compared to the corresponding period of 2016 by PLN 3.3 million, i.e. 46.7% yoy,
due to a one-off payment of VAT upon transfer of assets to the Wolsztyn Railway Roundhouse in the amount of PLN 1.1 million
and recovery of the overdue VAT for 2014 in Germany in the amount of PLN 2.2 million in Q1 2016.
In Q1 2017, a decrease in employee benefits by PLN 14.2 million, i.e. -3.7% yoy, to PLN 371.2 million was recorded
(PLN 385.3 million in Q1 2016) as a result of decrease in average headcount in the Group by 484 FTEs, i.e. -2.0% yoy, due
to termination of employment contracts in connection with obtaining retirement rights. Changes in headcount are presented
in the section “Information on headcount”.
The remaining expenses by kind in Q1 2017 increased compared to the corresponding period of 2016 by PLN 1.5 million,
i.e. 12.9% yoy.
In Q1 2017, the cost of goods and materials sold dropped by PLN 0.9 million, i.e. -11.3% yoy, to PLN 7.4 million as a result
of taking into account impairment losses.
Other operating expenses in Q1 2017 fell by PLN 3.6 million, i.e. -29.3% yoy to PLN 8.6 million, chiefly on account of the lower
costs of impairment losses on trade and other receivables by PLN 3.2 million, i.e. -80.4% yoy, recognition of a provision
for a UOKiK fine in the amount of PLN 2.0 million in Q1 2016, while at the same time foreign exchange translation losses
increased by PLN 2.6 million (the total change of the foreign exchange differences exerting negative impact on the result was
PLN 5.8 million) as a result of changes in the exchange rates.
Result on operating activities
As a result of the aforementioned changes of operating revenue and expenses, the result on operating activities in Q1 2017
reached PLN 3.2 million.
EBITDA
The result on operating activities increased by the line item “Amortization/depreciation and impairment losses”, referred to
as EBITDA, amounted to PLN 147.0 million in Q1 2017.
Financial activities
Table 23 Financial activities of the PKP CARGO Group in Q1 2017 compared to the corresponding period of 2016 (thousands of PLN)
No. Item Q1 2017 Q1 2016 Change % change
(restated*) 2017 - 2016 2017/2016
1 Financial revenue 10,087 390 9,697 2486.4%
2 Financial expenses 15,184 14,559 625 4.3%
3 Share in the profit of entities measured by the equity method
2,019 1,364 655 48.0%
4 Result on financial activities -3,079 -12,805 9,727 -
Source: Condensed Quarterly Consolidated Financial Statements of the PKP CARGO Group for the period of 3 months ended 31 March 2017
prepared according to EU IFRS
* restatement of comparative data is described in detail in Note 5 to the Condensed Quarterly Consolidated Financial Statements
In Q1 2017, the PKP CARGO Group recorded a loss on financial activities in the amount of PLN -3.1 million, compared to
PLN -12.8 million recorded in the corresponding period of the previous year. The main reason for the improvement of the result
on financial activities by PLN 9.7 million was the decline in the valuation of the put option liability for non-controlling interest,
which translated into an increase in financial revenue by 5.4 million and increase of the net result on FX differences
by PLN 3.3 million.
Details are presented Notes 9.1 and 9.2 to the Condensed Quarterly Consolidated Financial Statements of the PKP CARGO
Group.

40
Consolidated report for Q1 2015
PKP CARGO GROUP
ADDITIONAL INFORMATION TO THE CONSOLIDATED QUARTERLY REPORT
FOR Q1 2017
Result before tax
In Q1 2017, the result before tax stood at PLN 0.1 million, compared to PLN -74.6 million in the corresponding period of the
previous year.
Income tax
In Q1 2017, the PKP CARGO Group recorded income tax in the amount of PLN 1.5 million, of which current tax amounted
to PLN 11.0 million, and deferred tax to PLN -9.5 million.
Net result
In Q1 2017, the Group generated net result of PLN -1.4 million compared to PLN -66.4 million in the corresponding period
of the previous year.
5.1.2. Description of the structure of assets and liabilities
ASSETS
Table 24 Horizontal and vertical analysis of PKP CARGO Group’s assets (thousands of PLN)
As at 31/03/2017
As at 31/12/2016
Asset structure Change % change
(unaudited) (audited) 31/03/2017 31/12/2016 2017 - 2016 2017/2016
ASSETS
Non-current assets
Property, plant and equipment 4,594,168 4,700,550 72.2% 72.4% -106,382 -2.3%
Intangible assets 52,066 55,831 0.8% 0.9% -3,765 -6.7%
Investment property 1,244 1,257 0.0% 0.0% -13 -1.0%
Investments accounted for under the equity method
41,988 40,810 0.7% 0.6% 1,178 2.9%
Trade and other receivables 1,767 2,223 0.0% 0.0% -456 -20.5%
Other long-term financial assets 12,531 8,649 0.2% 0.2% 3,881 44.9%
Other long-term non-financial assets 34,700 25,987 0.5% 0.4% 8,713 33.5%
Deferred tax assets 113,137 107,554 1.8% 1.7% 5,583 5.2%
Total non-current assets 4,851,601 4,942,861 76.2% 76.2% -91,261 -1.8%
Current assets
-
Inventories 125,238 121,189 2.0% 1.9% 4,049 3.3%
Trade and other receivables 627,143 639,866 9.9% 9.9% -12,724 -2.0%
Income tax receivables 2,081 2,793 0.0% 0.0% -713 -25.5%
Other short-term financial assets 257,635 892 4.0% 0.0% 256,743 28795.8%
Other short-term non-financial assets 51,440 27,277 0.8% 0.4% 24,163 88.6%
Cash and cash equivalents 447,674 755,919 7.0% 11.6% -308,245 -40.8%
Total current assets 1,511,211 1,547,936 23.8% 23.8% -36,725 -2.4%
Total assets 6,362,812 6,490,797 100.0% 100.0% -127,985 -2.0%
Source: Condensed Quarterly Consolidated Financial Statements of the PKP CARGO Group for the period of 3 months ended 31 March 2017
prepared according to EU IFRS
Non-current assets
The biggest share in the asset structure was held by property, plant and equipment, which, as at the end of Q1 2017, amounted
to 72.2% of total assets, compared to 72.4% at the end of 2016. Property, plant and equipment is dominated by the means
of transportation (mainly locomotives and wagons) which as at the end of Q1 2017 represented 80.4% of total property, plant
and equipment. This share did not changed in relation to the end of 2016. The decrease in property, plant and equipment
in Q1 2017 by PLN 106.4 million, i.e. -2.3%, is attributable mainly to the higher level of amortization costs over the expenditures
on property, plant and equipment incurred in the period, and decrease in the exchange rates used for valuation of the property,
plant and equipment items owned by foreign entities. In addition, the value of other long-term financial assets increased
by PLN 3.9 million, i.e. 44.9%, as a result of increased balance sheet value of FX forwards and the value of other long-term

41
Consolidated report for Q1 2015
PKP CARGO GROUP
ADDITIONAL INFORMATION TO THE CONSOLIDATED QUARTERLY REPORT
FOR Q1 2017
non-financial assets increased by PLN 8.7 million, or 33.5%, mainly as a result of higher advances for purchase of non-financial
non-current assets by PLN 9.4 million.
Current assets
Current assets decreased as at the end of Q1 2017 by PLN 36.7 million, i.e. -2.4%, PLN compared to the end of 2016.
The decrease in cash and cash equivalents and bank deposits by 58.2 million was caused primarily by repayment of bank
loans, with simultaneous reclassification of PLN 250.0 million from cash and cash equivalents to bank deposits. In addition, the
value of current assets was affected by a decrease in trade and other receivables by PLN 12.7 million, or -2.0%. The level
of current assets at the end of Q1 2017 was also affected by the increase in other short-term non-financial assets
by PLN 24.2 million, i.e. 88.6%, resulting from charges for the Company Social Benefits Fund in the amount of PLN 25.3 million,
to be settled in future periods, and purchase of transportation services for employees in the amount of PLN 10.5 million.
The share of current assets in total assets did not change and both as at 31 March 2017 and as at 31 December 2016
was 23.8%.
The biggest share in the structure of current assets was held by trade and other receivables (41.5%), cash and cash equivalents
(29.6%) and other short-term financial assets (17.0%).
EQUITY AND LIABILITIES
Table 25 Horizontal and vertical analysis of PKP CARGO Group’s liabilities (thousands of PLN)
As at 31/03/2017
As at 31/12/2016
Structure of equity and liabilities
Change % change
(unaudited) (audited) 31/03/2017 31/12/2016 2017 - 2016 2017/2016
EQUITY AND LIABILITIES
Equity
Share capital 2,239,346 2,239,346 35.2% 34.5% 0 0.0%
Supplementary capital 618,666 618,666 9.7% 9.5% 0 0.0%
Other items of equity 27,164 11,447 0.4% 0.2% 15,717 137.3%
Exchange differences resulting from conversion of financial statements of foreign operations
27,213 59,970 0.4% 0.9% -32,758 -54.6%
Retained earnings 312,006 313,440 4.9% 4.8% -1,433 -0.5%
Equity attributable to the owners of the parent company
3,224,395 3,242,869 50.7% 50.0% -18,474 -0.6%
Total equity 3,224,395 3,242,869 50.7% 50.0% -18,474 -0.6%
Non-current liabilities
-
Long-term bank loans and borrowings 1,206,019 1,273,605 19.0% 19.6% -67,586 -5.3%
Non-current finance lease liabilities and leases with purchase option
123,518 140,923 1.9% 2.2% -17,405 -12.4%
Long-term trade and other payables 1,160 1,845 0.0% 0.0% -685 -37.1%
Long-term provisions for employee benefits 524,447 525,571 8.2% 8.1% -1,123 -0.2%
Other long-term provisions 25,974 26,420 0.4% 0.4% -446 -1.7%
Other long-term financial liabilities 901 1,042 0.0% 0.0% -141 -13.5%
Deferred tax liabilities 101,610 106,675 1.6% 1.6% -5,065 -4.7%
Non-current liabilities, total 1,983,629 2,076,081 31.2% 32.0% -92,452 -4.5%
Current liabilities
-
Short-term bank loans and borrowings 235,710 197,803 3.7% 3.0% 37,907 19.2%
Current finance lease liabilities and leases with purchase option
58,979 59,567 0.9% 0.9% -588 -1.0%
Short-term trade and other payables 601,685 670,021 9.5% 10.3% -68,335 -10.2%
Short-term provisions for employee benefits 111,996 99,256 1.8% 1.5% 12,740 12.8%
Other short-term provisions 23,624 24,950 0.4% 0.4% -1,326 -5.3%
Other short-term financial liabilities 113,530 118,889 1.8% 1.8% -5,359 -4.5%
Current tax liabilities 9,264 1,361 0.1% 0.0% 7,903 580.7%
Current liabilities, total 1,154,788 1,171,847 18.1% 18.1% -17,059 -1.5%
Total liabilities 3,138,417 3,247,928 49.3% 50.0% -109,511 -3.4%
Total liabilities and equity 6,362,812 6,490,797 100.0% 100.0% -127,985 -2.0%
Source: Condensed Quarterly Consolidated Financial Statements of the PKP CARGO Group for the period of 3 months ended 31 March 2017
prepared according to EU IFRS
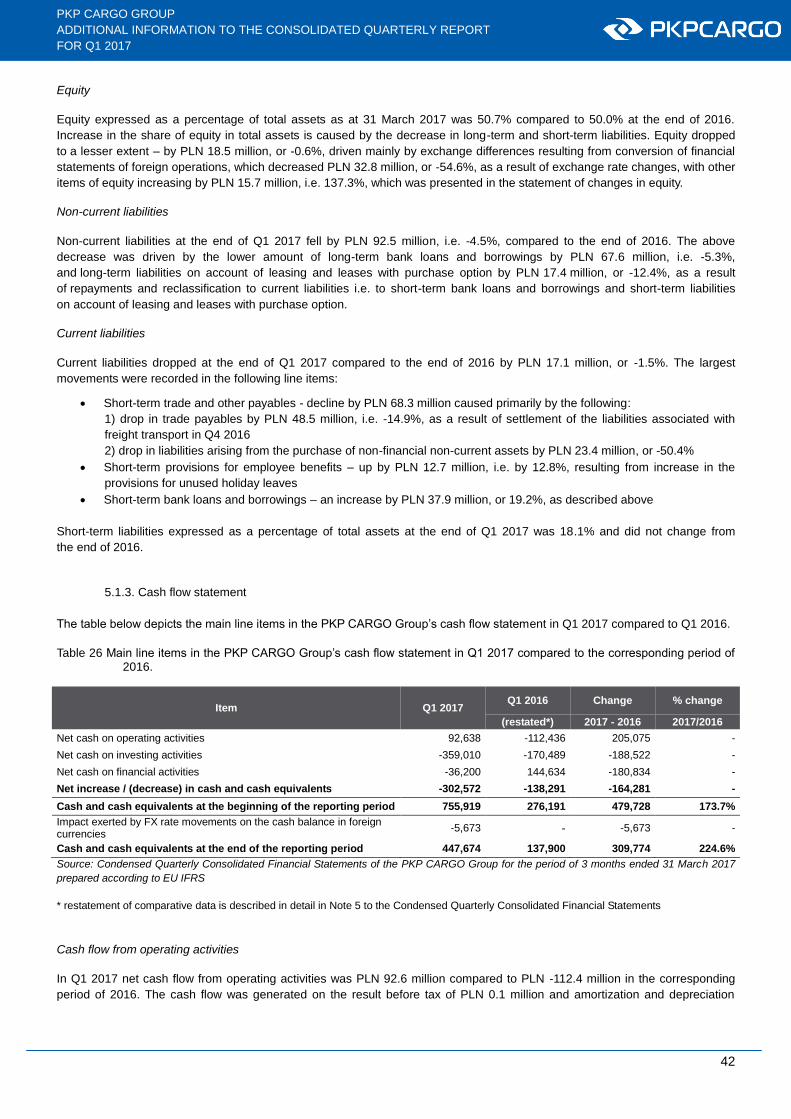
42
Consolidated report for Q1 2015
PKP CARGO GROUP
ADDITIONAL INFORMATION TO THE CONSOLIDATED QUARTERLY REPORT
FOR Q1 2017
Equity
Equity expressed as a percentage of total assets as at 31 March 2017 was 50.7% compared to 50.0% at the end of 2016.
Increase in the share of equity in total assets is caused by the decrease in long-term and short-term liabilities. Equity dropped
to a lesser extent – by PLN 18.5 million, or -0.6%, driven mainly by exchange differences resulting from conversion of financial
statements of foreign operations, which decreased PLN 32.8 million, or -54.6%, as a result of exchange rate changes, with other
items of equity increasing by PLN 15.7 million, i.e. 137.3%, which was presented in the statement of changes in equity.
Non-current liabilities
Non-current liabilities at the end of Q1 2017 fell by PLN 92.5 million, i.e. -4.5%, compared to the end of 2016. The above
decrease was driven by the lower amount of long-term bank loans and borrowings by PLN 67.6 million, i.e. -5.3%,
and long-term liabilities on account of leasing and leases with purchase option by PLN 17.4 million, or -12.4%, as a result
of repayments and reclassification to current liabilities i.e. to short-term bank loans and borrowings and short-term liabilities
on account of leasing and leases with purchase option.
Current liabilities
Current liabilities dropped at the end of Q1 2017 compared to the end of 2016 by PLN 17.1 million, or -1.5%. The largest
movements were recorded in the following line items:
Short-term trade and other payables - decline by PLN 68.3 million caused primarily by the following:
1) drop in trade payables by PLN 48.5 million, i.e. -14.9%, as a result of settlement of the liabilities associated with
freight transport in Q4 2016
2) drop in liabilities arising from the purchase of non-financial non-current assets by PLN 23.4 million, or -50.4%
Short-term provisions for employee benefits – up by PLN 12.7 million, i.e. by 12.8%, resulting from increase in the
provisions for unused holiday leaves
Short-term bank loans and borrowings – an increase by PLN 37.9 million, or 19.2%, as described above
Short-term liabilities expressed as a percentage of total assets at the end of Q1 2017 was 18.1% and did not change from
the end of 2016.
5.1.3. Cash flow statement
The table below depicts the main line items in the PKP CARGO Group’s cash flow statement in Q1 2017 compared to Q1 2016.
Table 26 Main line items in the PKP CARGO Group’s cash flow statement in Q1 2017 compared to the corresponding period of 2016.
Item Q1 2017 Q1 2016 Change % change
(restated*) 2017 - 2016 2017/2016
Net cash on operating activities 92,638 -112,436 205,075 -
Net cash on investing activities -359,010 -170,489 -188,522 -
Net cash on financial activities -36,200 144,634 -180,834 -
Net increase / (decrease) in cash and cash equivalents -302,572 -138,291 -164,281 -
Cash and cash equivalents at the beginning of the reporting period 755,919 276,191 479,728 173.7%
Impact exerted by FX rate movements on the cash balance in foreign currencies
-5,673 - -5,673 -
Cash and cash equivalents at the end of the reporting period 447,674 137,900 309,774 224.6%
Source: Condensed Quarterly Consolidated Financial Statements of the PKP CARGO Group for the period of 3 months ended 31 March 2017
prepared according to EU IFRS
* restatement of comparative data is described in detail in Note 5 to the Condensed Quarterly Consolidated Financial Statements
Cash flow from operating activities
In Q1 2017 net cash flow from operating activities was PLN 92.6 million compared to PLN -112.4 million in the corresponding
period of 2016. The cash flow was generated on the result before tax of PLN 0.1 million and amortization and depreciation

43
Consolidated report for Q1 2015
PKP CARGO GROUP
ADDITIONAL INFORMATION TO THE CONSOLIDATED QUARTERLY REPORT
FOR Q1 2017
and impairment losses of PLN 143.8 million (increase by PLN 1.5 million compared to the corresponding period of the previous
year), with simultaneous decrease in the balance of trade and other payables by PLN 46.2 million.
Cash flow from investing activities
In Q1 2017 net cash flow used in connection with investing activities was PLN -359.0 million versus PLN -170.5 million
in the corresponding period of the previous year. The negative cash flows were related directly to the capital expenditures
incurred by the PKP CARGO Group and opening of bank deposits for PLN 250.0 million. The details of the capital expenditures
are described in “PKP CARGO Group’s investments”.
Cash flow from financing activities
Net cash flow from financing activities in Q1 2017 was PLN -36.2 million versus PLN 144.6 million in the same period in 2016.
Proceeds of PLN 80.2 million were obtained from loans taken out in Q1 2017, compared to PLN 199.3 million
in the corresponding period of 2016. In Q1 2017, total cash expenditures for leases, to repay loans and borrowings and interest
on leases and loans and borrowings were PLN 116.1 million versus PLN 55.4 million in the corresponding period of the previous
year.
5.1.4. Selected financial and operating ratios
The table below presents key financial and operating ratios of the PKP CARGO Group in Q1 2017 compared to the
corresponding period of the previous year.
Table 27 Key financial and operating ratios in Q1 2017 compared to the corresponding period of 2016.
No. Item Q1 2017
Q1 2016 Q1 2017,
adjusted**
Q1 2016, adjusted***
Change % change
(restated*) (restated*) 2017 - 2016 2017/2016
adjusted adjusted
1 EBITDA margin1 13.4% 7.8% 13.4% 7.8% 5.6 p.p. 71.6%
2 Net profit margin2 -0.1% -6.4% -0.1% -6.4% 6.3 p.p. -98.0%
3 Net financial debt to EBITDA ratio
3
1.9 1.8 1.6 2.0 -31.4 p.p. -16.0%
4 ROA4 -1.1% -1.0% 0.4% 0.1% 0.3 p.p. 314.6%
5 ROE5 -2.1% -1.8% 0.7% 0.2% 0.6 p.p. 338.9%
6
Average distance covered by one locomotive (km/day)
6
244.8 242.7 244.8 242.7 2.1 0.9%
7
Average gross train tonnage per operating locomotive (tons)
7
1453.0 1480.0 1453.0 1480.0 -27.0 -1.8%
8
Average running time of train locomotives (hours per day)
8
14.8 14.9 14.8 14.9 -0.1 -0.7%
9
Freight turnover per employee (thousands tkm/employee)
9
304.3 275.5 304.3 275.5 28.7 10.4%
Source: Proprietary material
* restatement of comparative data is described in detail in Note 5 to the Condensed Quarterly Consolidated Financial Statements ** The annualized data for Q1 2017 (4M 2016 – 3M 2017) were adjusted for presentation purposes for (1) impairment loss on receivables from OKD in the amount of
PLN 72.7 million (2) impairment loss arising from a test for impairment of non-current assets from the AWT Group in the amount of PLN 34.1 million; moreover, the
adjusted net profit includes deferred tax resulting from a test for impairment of AWT’s value in the amount of PLN 6.5 million and the deferred tax on account of an
impairment loss on the receivables from OKD a.s. (“OKD”) in the amount of PLN 8.0 million.
** The annualized data for Q1 2016 (4M 2015 – 3M 2016) were adjusted for presentation purposes for (1) the profit on the bargain acquisition of AWT in the amount of PLN 137.8 million, (2) the costs following from the implemented 2nd Voluntary Redundancy Program (VRP 2) pursuant to Resolutions adopted by the Management Boards and Supervisory Boards of PKP CARGO S.A. and PKP CARGOTABOR Sp. z o.o. in the amount of PLN 70.2 million, (3) impairment loss on non-current assets and assets classified as held for sale in the amount of PLN 178.7 million; additionally, the adjusted net profit includes deferred tax on account of VRP 2 in the amount of PLN 13.3 million, deferred tax on impairment of non-current assets and assets classified as held for sale in the amount of PLN 33.9 million, while profit on bargain acquisition of AWT does not include deferred tax
The adjustments concern only data from the Statement of Comprehensive Income.
1. Calculated as the ratio of the operating profit plus amortization/depreciation and impairment losses to total operating revenue 2. Calculated as the ratio of net profit to total operating revenue
44
Consolidated report for Q1 2015
PKP CARGO GROUP
ADDITIONAL INFORMATION TO THE CONSOLIDATED QUARTERLY REPORT
FOR Q1 2017
3. Calculated as the ratio of net financial debt (constituting the sum of (i) long-term bank loans and borrowings; (ii) short-term bank loans and borrowings, (iii) long-term finance lease liabilities and leases with purchase option; (iv) current finance lease liabilities and leases with purchase option; and (v) other short-term financial liabilities and (vi) other long-term financial liabilities, minus (i) cash and cash equivalents; and (ii) other short-term financial assets) to annualized EBITDA for the last 12 months (profit on operating activities plus amortization/depreciation and impairment losses).
4. Calculated as the quotient of annualized net profit for the past 12 months to total assets. 5. Calculated as the quotient of annualized net profit for the past 12 months to equity. 6. Calculated as the quotient of vehicle-kilometers (i.e. distance covered by PKP CARGO Group’s vehicles in the given period) / vehicle-days (i.e. product of the
number of active vehicles and number of calendar days in the given period) 7. Calculated as the quotient of gross ton-kilometers and train-kilometers in train work in relation to the locomotives driving the train (in dual traction or pushing
the train in the given period). 8. Calculated as the quotient of vehicle-hours (i.e. number of hours of work of PKP CARGO Group’s vehicles in the given period) and vehicle-days (i.e. the
product of the number of active vehicles and number of calendar days in the given period). 9. Calculated as the quotient of the Group’s freight turnover to the average headcount (in FTEs) in the Group in the given period.
In Q1 2017, due to reasons described above, the key profitability ratios, i.e. EBITDA margin and net profit margin, were higher
than in the same period of the previous year. ROE, ROA and net financial debt to EBITDA ratios deteriorated. The last ratio
increased from 1.9 in Q1 2017 to 1.8 in the corresponding period of 2016. The improvement of the ratios in Q1 2017 compared
to the corresponding period of the previous year is attributable to the Group’s higher results, in particular EBITDA and net result.
If annualized performance is adjusted by non-recurring events, the foregoing ratios (ROA, ROE and net financial debt) are better
than the reported figures. This results from the aforementioned adjustments of the financial performance in earlier periods.
In Q1 2017, the average daily mileage of locomotives was 244.8 km/day and, compared to the corresponding period
of the previous year, increased by 2.1 km/day, i.e. by 0.9% yoy. The key driver of the improvement of this indicator was
the optimization of the transportation process.
In Q1 2017 the gross average train freight turnover per locomotive moved down from 1,480.0 tons in Q1 2016 to 1,453.0 tons,
i.e. by 27.0 tons (-1.8% yoy). The decrease of the figure results from execution of the transport process with a very high level
of closures and operating difficulties in the PKP PLK grid.
In Q1 2017, the average daily work time of locomotives was 14.8 h/day and, compared to the corresponding period
of the previous year, decreased by 0.1 h/day, i.e. by -0.7% yoy. The decrease of the figure results from execution
of the transport process with a very high level of closures and operating difficulties in the PKP PLK grid.
5.2. Factors that will affect the financial performance in the next quarter
Situation on the rail transport market in the main cargo categories
Favorable business conditions on the market for coal, aggregates, coke, iron ore, metals, petroleum oil refinery products,
chemical products and container transport directly affect the situation in the rail freight turnover sector.
Changes in transport of the foregoing groups of commodities directly affect the changes in volumes of those commodities
transported by the PKP CARGO Group. Majority of revenues in the PKP CARGO Group comes from activity linked to rail freight
transport in Poland, both domestically, exports, imports and transit, as well as in the CEE region. Therefore, the Group’s activity
and financial performance depend on the market situation not just in Poland and the Czech Republic but also in countries which
are their main trading partners.
Deterioration of business conditions on domestic markets or in countries constituting the existing or potential areas
of the Group’s operations may have adverse effect on the demand for the services provided by the Group, which in turn may
directly affects its financial performance.
The uncertain situation in the mining industry significantly affects the market for hard coal transportation. It is caused
predominantly by the low prices of coal and the increasing role of renewable energy sources (“RES”).
Transport of metallurgical products and raw materials required for their production, i.e. iron ore, stone or coke, depend on
the situation in the metallurgical industry, which faces a number of factors restricting the competitiveness of the ironworks
and steelworks located in Poland. The restrictions associated with the climate and energy package and high energy prices have
direct impact on their condition and, indirectly, on the transport market.
Situation in the Czech coal sector
On 11 April 2017 the Regional Court in Ostrava published a draft OKD a.s. restructuring plan. In accordance with the published
plan, OKD, through an increase in the share capital of its subsidiary, will contribute its enterprise (without claims specified

45
Consolidated report for Q1 2015
PKP CARGO GROUP
ADDITIONAL INFORMATION TO THE CONSOLIDATED QUARTERLY REPORT
FOR Q1 2017
as excluded) to OKD’s Subsidiary, subsequently, OKD will sell a 100% stake in OKD’s Subsidiary to PRISKO a.s., a company
wholly owned by the State Treasury of the Czech Republic, for approx. CZK 79 million (approx. EUR 2.6 million). The closing
of the transaction is contingent on the following conditions precedent: approval of the restructuring plan by the court, approval
of the transaction by the Czech anti-monopoly authority, increase in the share capital of OKD’s Subsidiary and deposit
of the purchase price for a 100% stake in OKD’s Subsidiary. In addition, OKD will use the proceeds from the transaction
to satisfy priority creditors in accordance with Czech law and to partly satisfy the remaining creditors. The closing is expected
to take place in Q3 or Q4 2017. The current freight contract between AWT and OKD is not included in the list of excluded claims,
hence OKD’s rights and obligations arising therefrom will be contributed to OKD’s Subsidiary acquired by PRISKO a.s.
Track construction and maintenance market
Through AWT Group companies the Group specializes in the construction and maintenance of rail tracks. On top
of maintenance alone, the function of OKD sidings operator necessitates the application of unique technological solutions
to maintain the efficiency of OKD’s external logistics. One of the examples of activity in this area is the construction of new
tracks for new locations to store coal and gangue. Accordingly, the Group has at its disposal a qualified and professional
workforce and the required equipment.
Its resources and experience in this field poise the Group to participate in open tenders and form an incentive for the further
development of these types of services.
Costs of access to infrastructure
The PKP CARGO Group’s activity results largely depend on the amount of rail infrastructure access charges. The cost of access
to infrastructure in Q1 2017 accounted for approx. 14.7% of PKP CARGO Group’s operating expenses.
In the 2016/2017 timetable, PKP PLK reduced the basic fee rates slightly for the 1435 mm gauge rail infrastructure and raised
most of the additional fees and fees for the basic services of access to devices related to the handling of trains. Other domestic
managers in the 2016/2017 timetable raised the rates for minimum access, additional services, basic services related to
the access to devices.
International managers in countries such as Germany, Netherlands, Hungary, Austria, except for Slovakia and Czech Republic,
also increased the fees for access to infrastructure in the 2016/2017 timetable.
Technical regulations related to rolling stock
The rolling stock used in rail transport must satisfy appropriate technical standards and requirements, determining the scale
of the Group’s modernization and repair activity. The investments in this area depend directly on the current technical condition
of the rolling stock owned and the resulting mandatory periodic repairs. They may also depend on the requirements imposed
by EU regulations.
Put and call option
Minezit SE (“MSE”) has exercised its right to demand that the Company repurchase of all the shares in AWT owned by MSE
(“Put Option”). MSE is entitled to the above right under the Shareholder Agreement concluded between PKP CARGO, MSE
and AWT on 30 December 2014. In accordance with the Shareholder Agreement, the total purchase price for the 15,000 shares,
constituting 20% of all shares in AWT’s share capital AWT, is EUR 27,000,000.
Considering the good cooperation with MSE, the PKP CARGO S.A. Management Board is considering alternative solutions
regarding the form of payment for exercise of the Put Option. Having carried out an analysis the PKP CARGO S.A.
Management Board will make a decision regarding the most favorable settlement of the Put Option from the standpoint
of the Company’s interests. At the same time, the Company has secured funds for exercising the Put Option.
Capital expenditure financing
The Group will finance capital expenditures from investment loans obtained from the European Investment Bank, European
Bank for Reconstruction and Development and commercial banks. The increase of borrowing liabilities will result in an increase
of (short- and long-term) liabilities and financial expenses.
46
Consolidated report for Q1 2015
PKP CARGO GROUP
ADDITIONAL INFORMATION TO THE CONSOLIDATED QUARTERLY REPORT
FOR Q1 2017
Operating difficulties on rail lines
The activities of the PKP CARGO Group depend on the condition of the rail infrastructure, and the railway network is of low
quality. An intense railway network modernization program, although expected to ultimately result in improved operating
conditions, during the course of the construction and renovation work will cause hindrances and the need to route railway traffic
through detours.
Railway track closures caused by modernization works have and will continue to have direct negative impact on the throughput
of the lines and stations used, and rejection of applications for individual timetables (IRJ)41
, extension of the travel time, longer
train travel courses and longer train stays at the stations. This situation requires increased human resources involved
in the transport process, in terms of the rolling stock and train crews, which impacts the costs incurred by the Group.
Infrastructural investments
Due to the fact that Poland will be the main beneficiary of the cohesion fund in 2014-2020, a significant growth
of the construction industry is expected, driven by numerous road and railway investments.
It is expected that development of the construction industry will have positive impact on the volume of rail transport,
as an important provider of services in transport of aggregates and other construction materials.
FX rates
The Parent Company and the Group companies are exposed to FX risk resulting from the receivables, payables and cash
denominated in foreign currencies. The Parent Company’s receivables expressed in foreign currencies are short-term
receivables, and payables expressed in foreign currencies are mostly short- and long-term liabilities on account of investment
loan agreements with maturities of up to 15 years and liability arising from put option on a non-controlling interest.
According to the Financial Risk Management Policy prevailing in the Company, in Q1 2017, the Parent Company
and PKP CARGO CONNECT sp. z o.o. used FX risk management transactions for the EUR/PLN currency pair.
Interest rates
Most financial investments made by the Company and other Group companies as at the end of Q1 2017 were bank deposits,
which are concluded for the period from a few days up to 7 months, depending on the Company’s liquidity needs.
The Group is exposed to the risk of volatility of interest rate cash flows following from bank loans, leasing based on variable
interest rates. Interest on leasing agreements was accrued according to the reference rates increased by the financing party’s
margin. The reference rate for agreements denominated in EUR is EURIBOR 3M and 6M and for agreements signed in PLN –
WIBOR 1M and 3M. The interest rate risk in leasing agreements is executed through revaluation of leasing installments
in the periods of 1 month, 3 months, 6 months, depending on the agreement.
Interest on loan agreements were accrued according to the WIBOR 1M, WIBOR 3M, EURIBOR 3M and PRIBOR 3M reference
rates plus the banks’ margins. The interest rate risk in loan agreements is executed through revaluation of loan installments
in monthly and quarterly periods.
At the same time, in accordance with the Financial Risk Management Policy, PKP CARGO CONNECT Sp. z o.o. used hedge
accounting as regards the hedging of interest rate risk for leasing agreements pertaining to the lease of 210 series TALNS
wagons concluded in 2013. As at the balance sheet date, PKP CARGO CONNECT Sp. z o.o. had outstanding interest rate
transactions (IRS).
The Parent Company did not use transactions hedging against the interest rate risk in Q1 2017.
Scrap price level
The scrap market is very unstable. Due to steelworks suspending purchases of steel scrap dictated by the very high inventory
levels, scrap prices are expected to decline in the months to come. In addition, steel scrap prices at the London Metal Exchange
are expected to drop by 46 USD/ton over the next few months.42
41
Individual Train Timetable - timetable prepared on the carrier’s application, for one or more travel times within the framework of free transport throughput capacity. 42
www.zlom.info.pl
47
Consolidated report for Q1 2015
PKP CARGO GROUP
ADDITIONAL INFORMATION TO THE CONSOLIDATED QUARTERLY REPORT
FOR Q1 2017
5.3. The Management Board’s stance with respect to the possibility of realizing previously published result forecasts for
the year
The Parent Company has not published financial forecasts pursuant to § 5 Section 1 Item 25 of the Regulation issued
by the Finance Minister on 19 February 2009 on the Current and Periodic Information Transmitted by Securities Issuers and the
Conditions for Recognizing the Information Required by the Regulations of a Non-Member State as Equivalent, consolidated
version of 27 June 2013 (Journal of Laws of 2014 Item 133 as amended) pertaining to the results of the Company and
the PKP CARGO Group in 3M 2017.
5.4. Information about production assets
5.4.1. Rolling stock
PKP CARGO Group’s rolling stock is maintained through repair points functioning within the structures of PKP CARGO S.A.
Units and in subsidiaries. The PKP CARGO Group’s rolling stock repair and maintenance organization has the competences
to repair and maintain wagons, electric locomotives at all the maintenance levels from P1 to P5 and to repair diesel locomotives
at maintenance levels from P1 to P4. In addition to the rolling stock owned by the PKP CARGO Group, this organization
belonging to the Group also repairs rolling stock and subassemblies for other owners.
Wagons and traction units are the main elements of the PKP CARGO Group’s production assets. Changes in the rolling stock
levels result directly from such actions as liquidation and sale of rolling stock or purchase of rolling stock. Additionally,
locomotive modernizations are carried out, which do not affect the overall size of the rolling stock but they do change its age
structure and in some cases change the quantities in individual series when a locomotive after a modernization changes its
series and purpose.
In Q1 2017, the process of decommissioning of redundant or obsolete rolling stock was started. The first batch of locomotives
classified for physical liquidation was deleted from the books.
The tables below present the structure of the locomotives and wagons used, by type and ownership during the reporting period.
Table 28 Structure of the locomotives used by the PKP CARGO Group by traction type and ownership
Item 31/03/2017 31/12/2016 Change YTD
diesel locomotives 1,374 1,398 -24
electric locomotives 1,098 1,173 -75
Total 2,472 2,571 -99
owned locomotives (including financial lease) 2,462 2,556 -94
locomotives in operational lease or rented 10 15 -5
Total 2,472 2,571 -99
Source: Proprietary material
Table 29 Structure of the wagons used by the PKP CARGO Group, by ownership
Item 31/03/2017 31/12/2016 Change YTD
owned wagons (including financial lease) 64,452 64,519 -67
wagons in operational lease or rented 890 1,167 -277
Total 65,342 65,686 -344
Source: Proprietary material
On 23 September 2015, an agreement was signed with the Consortium composed of Siemens Sp. z o.o. and Siemens A.G.
for the delivery of 15 multi-system locomotives from 31 January 2016 to 30 June 2017 (basic order) with an option to purchase
5 additional locomotives at basic order prices, where PKP CARGO S.A. must take the decision to exercise this option no later
than on 31 December 2017 (optional order).
Between 1 January 2016 and the delivery date of this report, 12 locomotives were delivered by the manufacturer.

48
Consolidated report for Q1 2015
PKP CARGO GROUP
ADDITIONAL INFORMATION TO THE CONSOLIDATED QUARTERLY REPORT
FOR Q1 2017
5.4.2. Real estate
In the transport process, due to the necessity to guarantee appropriate maintenance and repair support, real estate plays
an important role. Most real estate used by the Group is used on the basis of lease and rental agreements. The table below
presents change of the balance of real estate owned and used by the PKP CARGO Group in Q1 2017.
Table 30 Real estate owned and used by the PKP CARGO Group as at 31 March 2017 compared to 31 December 2016.
Item 31/03/2017 31/12/2016 Change YTD
Land - owned, in perpetual usufruct and leased from other entities [ha] 1,580 1,584 -4
Buildings - owned, leased and rented from other entities [sqm] 767,346 781,998 -14,652
Source: Proprietary material
Decrease of the size of buildings owned, leased and rented results from the on-going verification of the size of the assets used
by the Parent Company and its subsidiaries.

49
Consolidated report for Q1 2015
PKP CARGO GROUP
ADDITIONAL INFORMATION TO THE CONSOLIDATED QUARTERLY REPORT
FOR Q1 2017
6. Other key information and events
6.1. Proceedings pending before courts, arbitration bodies or public administration authorities
PKP CARGO S.A. and its subsidiaries are not parties to proceedings pending before courts, arbitration bodies or public
administration authorities pertaining to liabilities or claims the value of which constitutes at least 10% of the Parent Company’s
equity.
PKP CARGO S.A. and its subsidiaries are not parties to proceedings pertaining to liabilities or claims of the issuer
or the issuer’s subsidiary where the total value of such liabilities or claims constitutes at least 10% of the Parent Company’s
equity.
6.2. Information on transactions with related parties
No entity from the PKP CARGO Group entered in any transactions with related parties on non-market terms in Q1 2017.
Also after the balance sheet date no such transactions have been entered into.
6.3. Information on granted guarantees and sureties of loans or credits
PKP CARGO S.A. and its subsidiaries did not extend any sureties for loans or borrowings and did not grant guarantees
to a single entity or subsidiary of such entity whose total amount would be the equivalent of at least 10% of PKP CARGO S.A.’s
equity.
6.4. Other information of relevance for evaluation of the employment situation, financial standing, financial performance,
assets and their movements as well as information of relevance for assessment of the ability of the Issuer and other
Group companies to pay their debts.
Other than the information presented in this Report, no other information has been identified that would be of relevance
for evaluation of the employment situation, financial standing, financial performance, assets or their movements or information
of relevance for assessment of the ability of the Issuer to pay its debts.

50
Consolidated report for Q1 2015
PKP CARGO GROUP
ADDITIONAL INFORMATION TO THE CONSOLIDATED QUARTERLY REPORT
FOR Q1 2017
This Consolidated Quarterly Report was authorized by the PKP CARGO S.A. Management Board on 25 May 2017.
…………………………………………
Maciej Libiszewski
President of the Management Board
…………………………………………
Arkadiusz Olewnik
Management Board Member
…………………………………………
Grzegorz Fingas
Management Board Member
…………………………………………
Jarosław Klasa
Management Board Member
…………………………………………
Zenon Kozendra
Management Board Member