quarterly market report
TRANSCRIPT
QUARTERLYMARKET REPORTIndustrial Properties
Fourth Quarter 2020
50.0 mil sqmAvailable Stock
*Figures in chart are in mil sqm
Business Park
Multiple-User FactoryWarehouse
Single-User Factory
Outlook on Upcoming SupplyExpected Completion
2022
2021 2 .7Business Park
0.8 mil sqm
1.61.6 mil sqm
89.9%
0.7%-ptCompared to Previous Yr
0.3%-ptCompared to Previous Qtr
Price
Compared to Previous Yr
2.7%
Rental
Compared to Previous Yr
Compared to Previous Qtr
1.0%Compared to Previous Qtr
0.1%
SINGAPORE INDUSTRIAL PROPERTIESAs at Fourth Quarter 2020
Stock & Occupancy
1.5
Occupancy Rate
1.5%
Single-User Factory
Warehouse
Multiple-User Factory
mil sqm
11.4
25.4
11.1
2.2
0.2 mil sqm
mil sqm
mil sqm
EXECUTIVE SUMMARY
3Q 2020 4Q 2020
% Change
Over OverPrevious Quarter
Previous Year
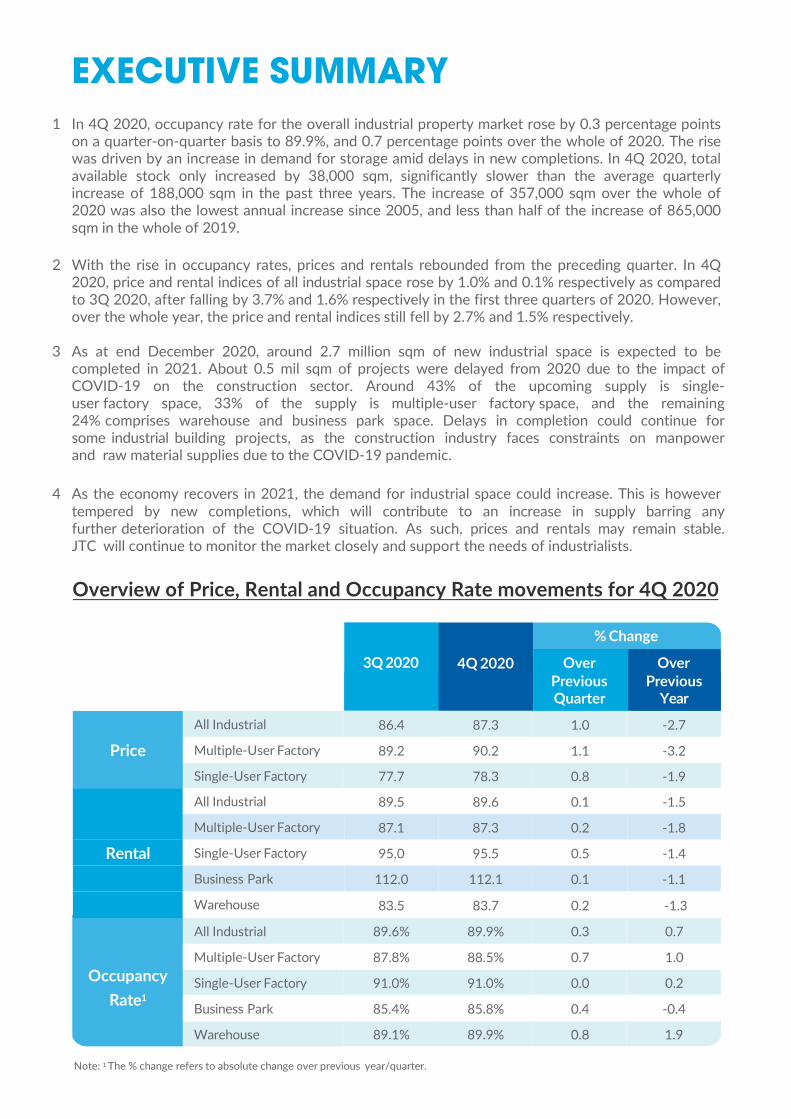
All Industrial 86.4 87.3 1.0 -2.7
Price Multiple-User Factory 89.2 90.2 1.1 -3.2
Single-User Factory 77.7 78.3 0.8 -1.9
All Industrial 89.5 89.6 0.1 -1.5
Multiple-User Factory 87.1 87.3 0.2 -1.8
Rental Single-User Factory 95.0 95.5 0.5 -1.4
Business Park 112.0 112.1 0.1 -1.1
Warehouse 83.5 83.7 0.2
OccupancyRate1
All Industrial 89.6% 89.9% 0.3
Multiple-User Factory 87.8% 88.5% 0.7
Single-User Factory 91.0% 91.0% 0.0
-1.3
0.7
1.0
0.2
Business Park 85.4% 85.8% 0.4 -0.4
Warehouse 89.1% 89.9% 0.8 1.9
Note: 1 The % change refers to absolute change over previous year/quarter.
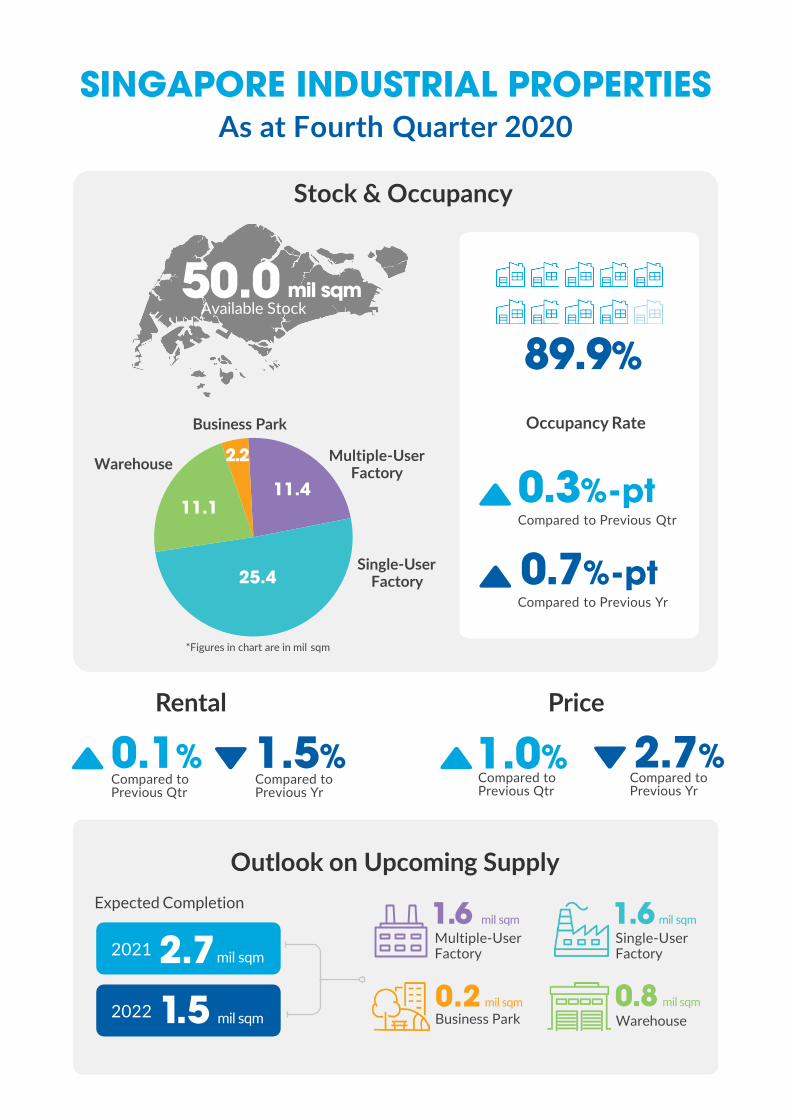
1 In 4Q 2020, occupancy rate for the overall industrial property market rose by 0.3 percentage pointson a quarter-on-quarter basis to 89.9%, and 0.7 percentage points over the whole of 2020. The risewas driven by an increase in demand for storage amid delays in new completions. In 4Q 2020, totalavailable stock only increased by 38,000 sqm, significantly slower than the average quarterlyincrease of 188,000 sqm in the past three years. The increase of 357,000 sqm over the whole of2020 was also the lowest annual increase since 2005, and less than half of the increase of 865,000sqm in the whole of 2019.
2 With the rise in occupancy rates, prices and rentals rebounded from the preceding quarter. In 4Q2020, price and rental indices of all industrial space rose by 1.0% and 0.1% respectively as comparedto 3Q 2020, after falling by 3.7% and 1.6% respectively in the first three quarters of 2020. However,over the whole year, the price and rental indices still fell by 2.7% and 1.5% respectively.
3 As at end December 2020, around 2.7 million sqm of new industrial space is expected to becompleted in 2021. About 0.5 mil sqm of projects were delayed from 2020 due to the impact of COVID-19 on the construction sector. Around 43% of the upcoming supply is single-user factory space, 33% of the supply is multiple-user factory space, and the remaining 24% comprises warehouse and business park space. Delays in completion could continue for some industrial building projects, as the construction industry faces constraints on manpower and raw material supplies due to the COVID-19 pandemic.
4 As the economy recovers in 2021, the demand for industrial space could increase. This is howevertempered by new completions, which will contribute to an increase in supply barring any further deterioration of the COVID-19 situation. As such, prices and rentals may remain stable. JTC will continue to monitor the market closely and support the needs of industrialists.
Overview of Price, Rental and Occupancy Rate movements for 4Q 2020
Warehouse
STOCK & OCCUPANCY
Change in Stock (‘000sqm)
Occupancy Rate (%)
50.0Available Stock
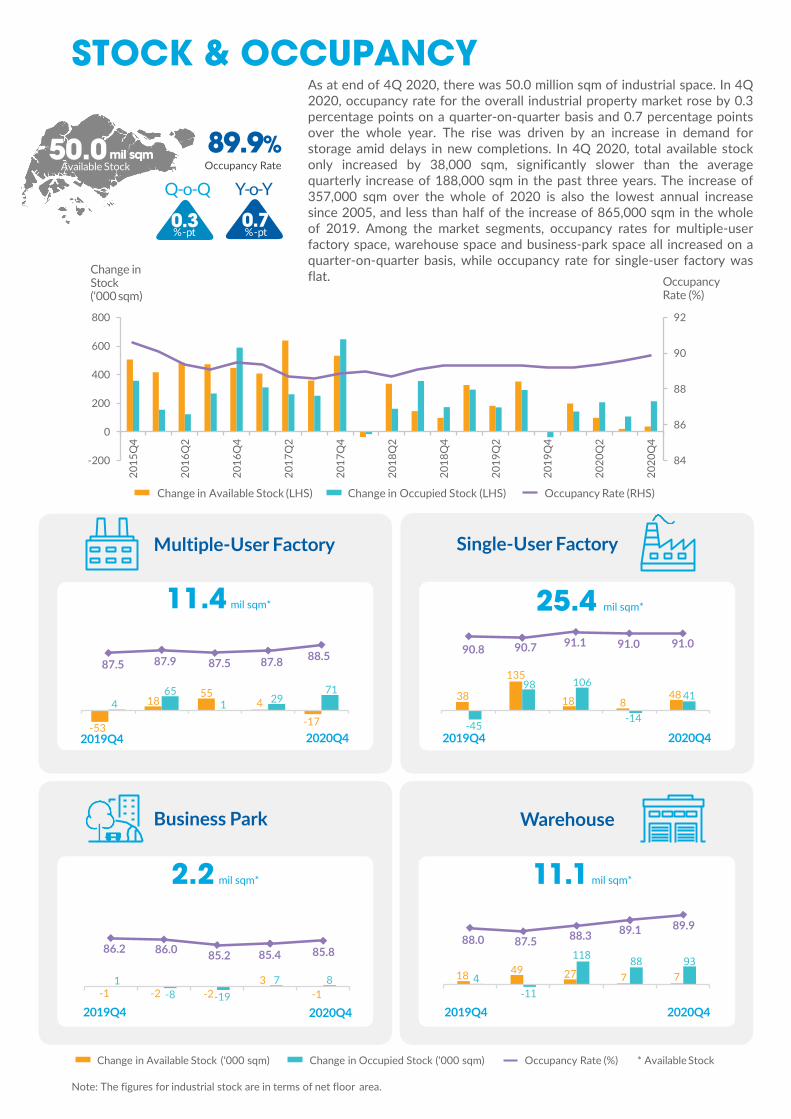
As at end of 4Q 2020, there was 50.0 million sqm of industrial space. In 4Q2020, occupancy rate for the overall industrial property market rose by 0.3percentage points on a quarter-on-quarter basis and 0.7 percentage pointsover the whole year. The rise was driven by an increase in demand forstorage amid delays in new completions. In 4Q 2020, total available stockonly increased by 38,000 sqm, significantly slower than the averagequarterly increase of 188,000 sqm in the past three years. The increase of357,000 sqm over the whole of 2020 is also the lowest annual increasesince 2005, and less than half of the increase of 865,000 sqm in the wholeof 2019. Among the market segments, occupancy rates for multiple-userfactory space, warehouse space and business-park space all increased on aquarter-on-quarter basis, while occupancy rate for single-user factory wasflat.
89.9%Occupancy Rate
Change in Available Stock (LHS) Change in Occupied Stock (LHS) Occupancy Rate (RHS)
Q-o-Q
%-pt
Y-o-Y
0.3%-pt
Change in Available Stock (‘000 sqm) Change in Occupied Stock (‘000 sqm)
Note: The figures for industrial stock are in terms of net floor area.
Occupancy Rate (%) * Available Stock
Single-User Factory
Business Park
Multiple-User Factory
2019Q4 2020Q4
2019Q4
2019Q4 2020Q4
2019Q4 2020Q42020Q4
84
86
88
90
92
-200
0
200
400
600
800
2015
Q4
2016
Q2
2016
Q4
2017
Q2
2017
Q4
2018
Q2
2018
Q4
2019
Q2
2019
Q4
2020
Q2
2020
Q4
465
1 2971
87.5 87.9 87.5 87.8 88.5
38
135
18 848
-45
98 106
-14
41
90.8 90.7 91.1 91.0 91.0
-1 -2 -23
-11
-8 -197 8
86.2 86.0 85.2 85.4 85.8
18 49 27 7 74-11
118 88 93
88.0 87.5 88.3 89.1 89.9
0.7
mil sqm
11.4 mil sqm* 25.4 mil sqm*
11.1 mil sqm*2.2 mil sqm*
Warehouse
RENTAL
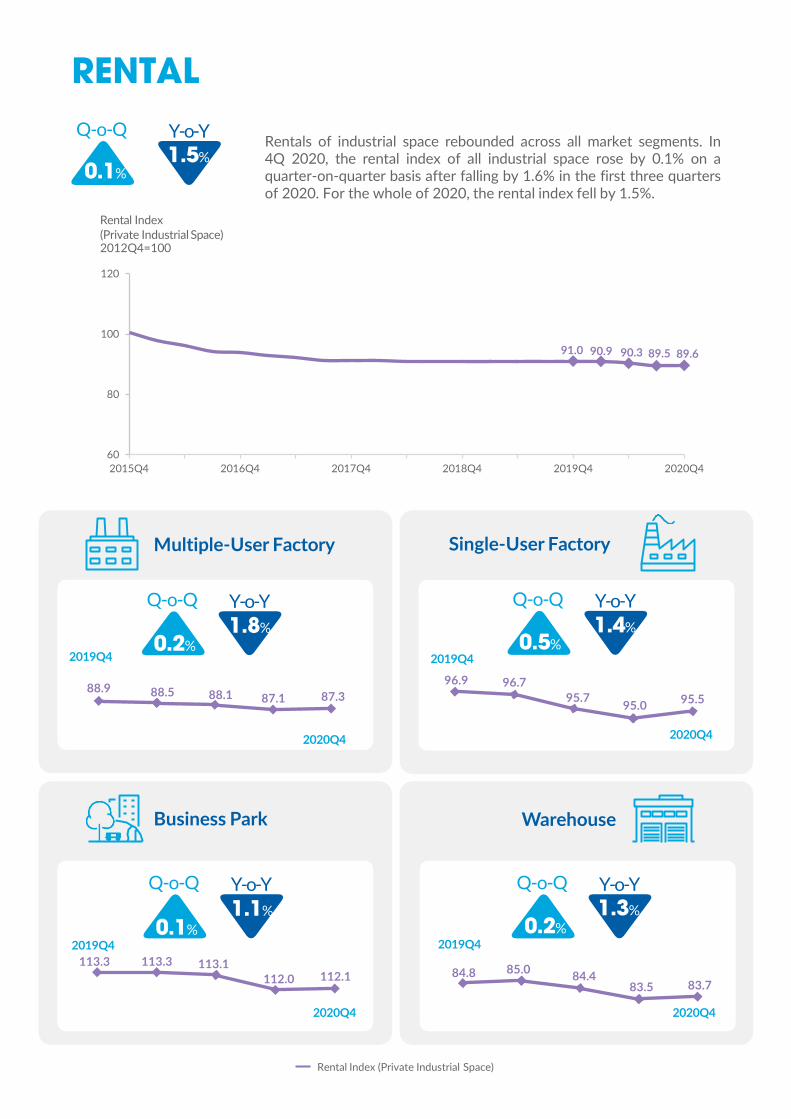
Rentals of industrial space rebounded across all market segments. In4Q 2020, the rental index of all industrial space rose by 0.1% on aquarter-on-quarter basis after falling by 1.6% in the first three quartersof 2020. For the whole of 2020, the rental index fell by 1.5%.
Rental Index (Private Industrial Space)
Single-User Factory
Business Park
Multiple-User Factory
2019Q4
2020Q4
2019Q4
2020Q4
2019Q4
2020Q4
2019Q4
2020Q4
Rental Index(Private Industrial Space) 2012Q4=100
88.9 88.5 88.1 87.1 87.3
113.3 113.3 113.1112.0 112.1 84.8 85.0 84.4
83.5 83.7
96.9 96.795.7 95.0 95.5
91.0 90.9 90.3 89.5 89.6
60
80
100
120
2015Q4 2016Q4 2017Q4 2018Q4 2019Q4 2020Q4
Q-o-Q Y-o-Y
0.1%1.5%
Q-o-Q Y-o-Y
0.2%1.8%
Q-o-Q Y-o-Y
0.5%1.4%
Q-o-Q Y-o-Y
0.1%1.1%
Q-o-Q Y-o-Y
0.2%1.3%
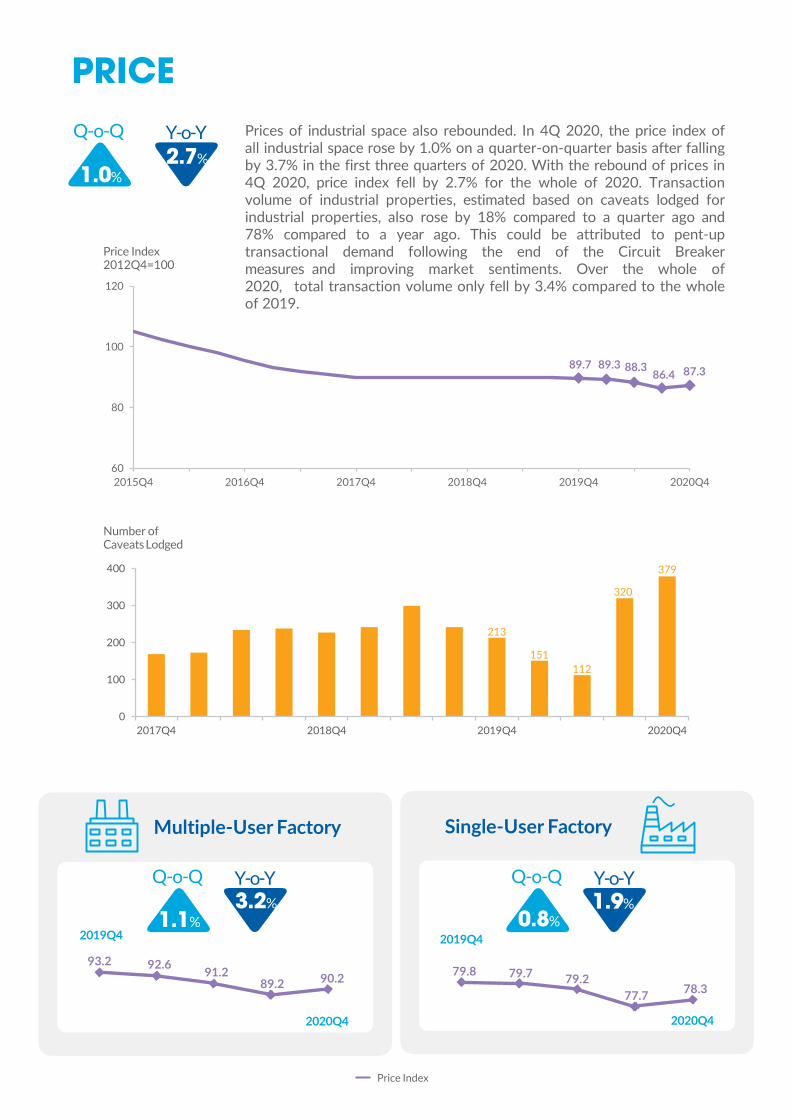
PRICEPrices of industrial space also rebounded. In 4Q 2020, the price index of all industrial space rose by 1.0% on a quarter-on-quarter basis after falling by 3.7% in the first three quarters of 2020. With the rebound of prices in 4Q 2020, price index fell by 2.7% for the whole of 2020. Transaction volume of industrial properties, estimated based on caveats lodged for industrial properties, also rose by 18% compared to a quarter ago and 78% compared to a year ago. This could be attributed to pent-up transactional demand following the end of the Circuit Breaker measures and improving market sentiments. Over the whole of 2020, total transaction volume only fell by 3.4% compared to the whole of 2019.
Price Index 2012Q4=100
Single-User FactoryMultiple-User Factory
Price Index
2020Q4
2019Q4
2020Q4
2019Q4
Number of CaveatsLodged
213
151112
320
379
0
100
200
300
400
2017Q4 2018Q4 2019Q4 2020Q4
93.2 92.6 91.289.2 90.2 79.8 79.7 79.2
77.7 78.3
89.7 89.3 88.3 86.4 87.3
60
80
100
120
2015Q4 2016Q4 2017Q4 2018Q4 2019Q4 2020Q4
Q-o-Q Y-o-Y
1.0%2.7%
Q-o-Q Y-o-Y
1.1%3.2%
Q-o-Q Y-o-Y
0.8%1.9%
0
200
400
600
Jan2019
Mar2019
Aug2019
Dec2019
Feb2020
Feb2020
Jul2020
Oct2020
(1) (1)(1)
(2)
(1)
(1)
(3)(4)
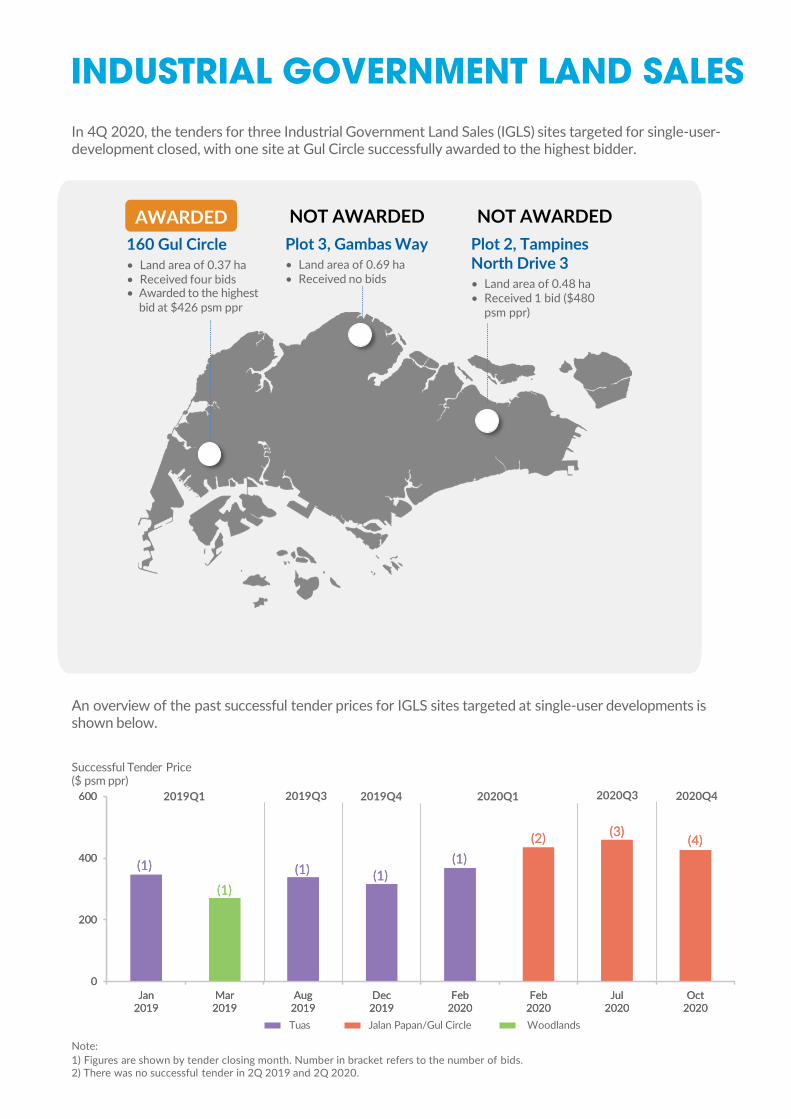
INDUSTRIAL GOVERNMENT LAND SALESIn 4Q 2020, the tenders for three Industrial Government Land Sales (IGLS) sites targeted for single-user-development closed, with one site at Gul Circle successfully awarded to the highest bidder.
An overview of the past successful tender prices for IGLS sites targeted at single-user developments is shown below.
2020Q42019Q1 2019Q3 2019Q4 2020Q1 2020Q3
AWARDED160 Gul Circle• Land area of 0.37 ha• Received four bids• Awarded to the highest
bid at $426 psm ppr
Successful Tender Price ($ psm ppr)
Note:1) Figures are shown by tender closing month. Number in bracket refers to the number of bids.2) There was no successful tender in 2Q 2019 and 2Q 2020.
Plot 2, Tampines North Drive 3• Land area of 0.48 ha• Received 1 bid ($480
psm ppr)
NOT AWARDEDPlot 3, Gambas Way• Land area of 0.69 ha• Received no bids
NOT AWARDED
0
200
400
600
Jan2019
Mar2019
Aug2019
Dec2019
Feb2020
Feb2020
Jul2020
Oct2020
(1) (1)(1)
(2)
(1)
(1)
(3)(4)
Tuas Jalan Papan/Gul Circle Woodlands
ALLOCATION OF JTC’SREADY-BUILT FACILITIES [RBF]
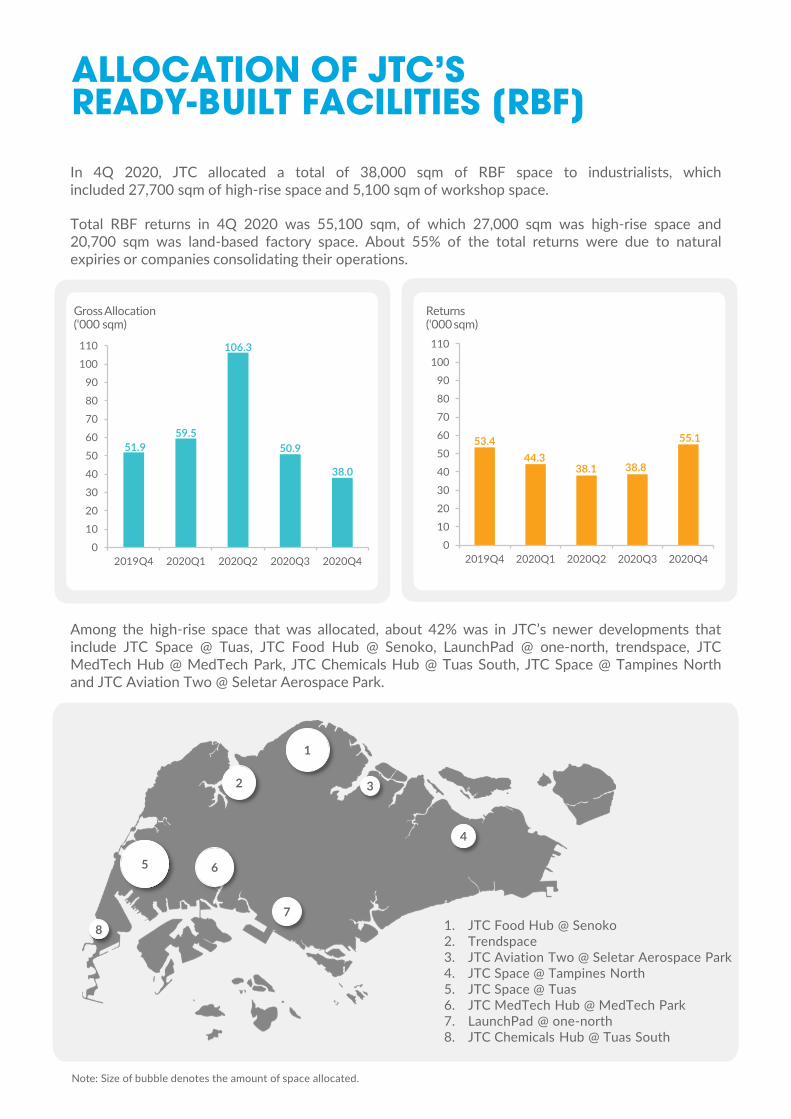
In 4Q 2020, JTC allocated a total of 38,000 sqm of RBF space to industrialists, whichincluded 27,700 sqm of high-rise space and 5,100 sqm of workshop space.
Total RBF returns in 4Q 2020 was 55,100 sqm, of which 27,000 sqm was high-rise space and20,700 sqm was land-based factory space. About 55% of the total returns were due to naturalexpiries or companies consolidating their operations.
GrossAllocation (‘000 sqm)
Returns (‘000sqm)
Note: Size of bubble denotes the amount of space allocated.
Among the high-rise space that was allocated, about 42% was in JTC’s newer developments thatinclude JTC Space @ Tuas, JTC Food Hub @ Senoko, LaunchPad @ one-north, trendspace, JTCMedTech Hub @ MedTech Park, JTC Chemicals Hub @ Tuas South, JTC Space @ Tampines Northand JTC Aviation Two @ Seletar Aerospace Park.
51.959.5
106.3
50.9
38.0
0
10
20
30
40
50
60
70
80
90
100
110
2019Q4 2020Q1 2020Q2 2020Q3 2020Q4
53.444.3
38.1 38.8
55.1
0
10
20
30
40
50
60
70
80
90
100
110
2019Q4 2020Q1 2020Q2 2020Q3 2020Q4
5 6
2
4
78 1. JTC Food Hub @ Senoko
2. Trendspace3. JTC Aviation Two @ Seletar Aerospace Park4. JTC Space @ Tampines North5. JTC Space @ Tuas6. JTC MedTech Hub @ MedTech Park7. LaunchPad @ one-north8. JTC Chemicals Hub @ Tuas South
1
3
OUTLOOK ON UPCOMING SUPPLY
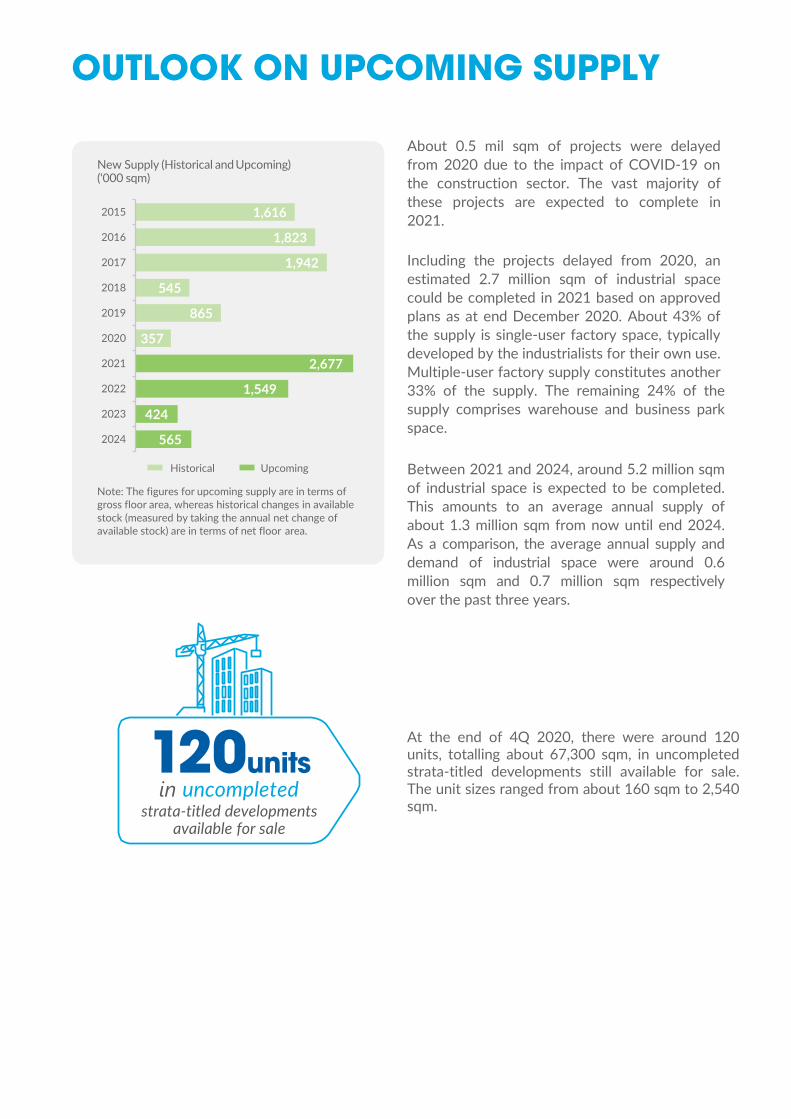
At the end of 4Q 2020, there were around 120units, totalling about 67,300 sqm, in uncompletedstrata-titled developments still available for sale.The unit sizes ranged from about 160 sqm to 2,540sqm.
17
New Supply (Historical and Upcoming) (‘000 sqm)
Historical Upcoming
Note: The figures for upcoming supply are in terms of gross floor area, whereas historical changes in available stock (measured by taking the annual net change of available stock) are in terms of net floor area.
1,616
1,823
1,942
545
865
357
2,677
1,549
424
565
2015
2016
2017
2018
2019
2020
2021
2022
2023
2024
20unitsin uncompleted
strata-titled developments available for sale
1
About 0.5 mil sqm of projects were delayed from 2020 due to the impact of COVID-19 on the construction sector. The vast majority of these projects are expected to complete in 2021.
Including the projects delayed from 2020, an estimated 2.7 million sqm of industrial space could be completed in 2021 based on approved plans as at end December 2020. About 43% of the supply is single-user factory space, typically developed by the industrialists for their own use. Multiple-user factory supply constitutes another 33% of the supply. The remaining 24% of the supply comprises warehouse and business park space.
Between 2021 and 2024, around 5.2 million sqm of industrial space is expected to be completed. This amounts to an average annual supply of about 1.3 million sqm from now until end 2024. As a comparison, the average annual supply and demand of industrial space were around 0.6 million sqm and 0.7 million sqm respectively over the past three years.

Warehouse
NOTE:
1) The figures may not add up due to rounding.
2) Statistics on occupied/vacant space and occupancy/vacancy rate of industrial space are based on physical occupation.From 2Q 2020, industrial premises were considered occupied even if on-site operations were halted due to officialrestrictions.
3) Scan the QR code to visit J-SPACE for historical and more detailed statistics.
OUTLOOK ON UPCOMING SUPPLY
Upcoming Supply (‘000 sqm)
Note: The figures for upcoming supply are in terms of gross floor area.
Single-User Factory
Business Park
Multiple-User Factory
52
451
513
633369
718
520
408
450
347
138
10
2021
2022
2023
2024
202
64 339
2021
2022
2023
2024
885
709
4
52
2021
2022
2023
2024
1,140
493
218
163
2021
2022
2023
2024
1.7 mil sqm 2.0 mil sqm
0.6 mil sqm 0.9 mil sqm
0
ANNEX – Industrial Property Market Statistics
A1 Price Statistics 1
A2 Rental Statistics 5
A3 Stock and Vacancy Statistics 8
A4 Potential Supply Statistics 15
A5 Statistics on Industrial Units Available for Sale 17
A6 List of Major Industrial Projects Completed in 4Q 2020 18
A7 List of Major Industrial Projects in the Pipeline as at End of 4Q 2020 19
B Statistics on JTC's Prepared Industrial Land and Ready-Built Facilities 28
Annex A – Industrial Property Market Statistics
1
Annex A-1: Price Statistics
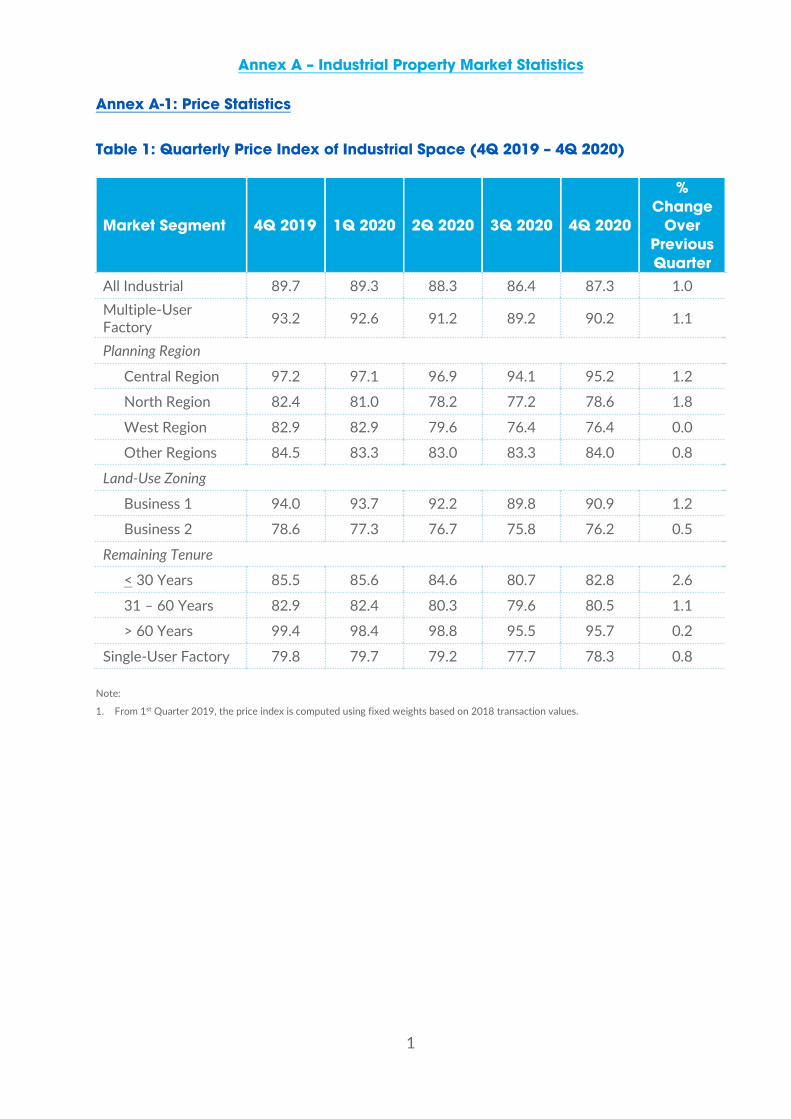
Table 1: Quarterly Price Index of Industrial Space (4Q 2019 – 4Q 2020)
Market Segment 4Q 2019 1Q 2020 2Q 2020 3Q 2020 4Q 2020
% Change
Over Previous Quarter
All Industrial 89.7 89.3 88.3 86.4 87.3 1.0 Multiple-User Factory 93.2 92.6 91.2 89.2 90.2 1.1
Planning Region
Central Region 97.2 97.1 96.9 94.1 95.2 1.2
North Region 82.4 81.0 78.2 77.2 78.6 1.8
West Region 82.9 82.9 79.6 76.4 76.4 0.0
Other Regions 84.5 83.3 83.0 83.3 84.0 0.8
Land-Use Zoning
Business 1 94.0 93.7 92.2 89.8 90.9 1.2
Business 2 78.6 77.3 76.7 75.8 76.2 0.5
Remaining Tenure
< 30 Years 85.5 85.6 84.6 80.7 82.8 2.6
31 – 60 Years 82.9 82.4 80.3 79.6 80.5 1.1
> 60 Years 99.4 98.4 98.8 95.5 95.7 0.2
Single-User Factory 79.8 79.7 79.2 77.7 78.3 0.8 Note:
1. From 1st Quarter 2019, the price index is computed using fixed weights based on 2018 transaction values.
2
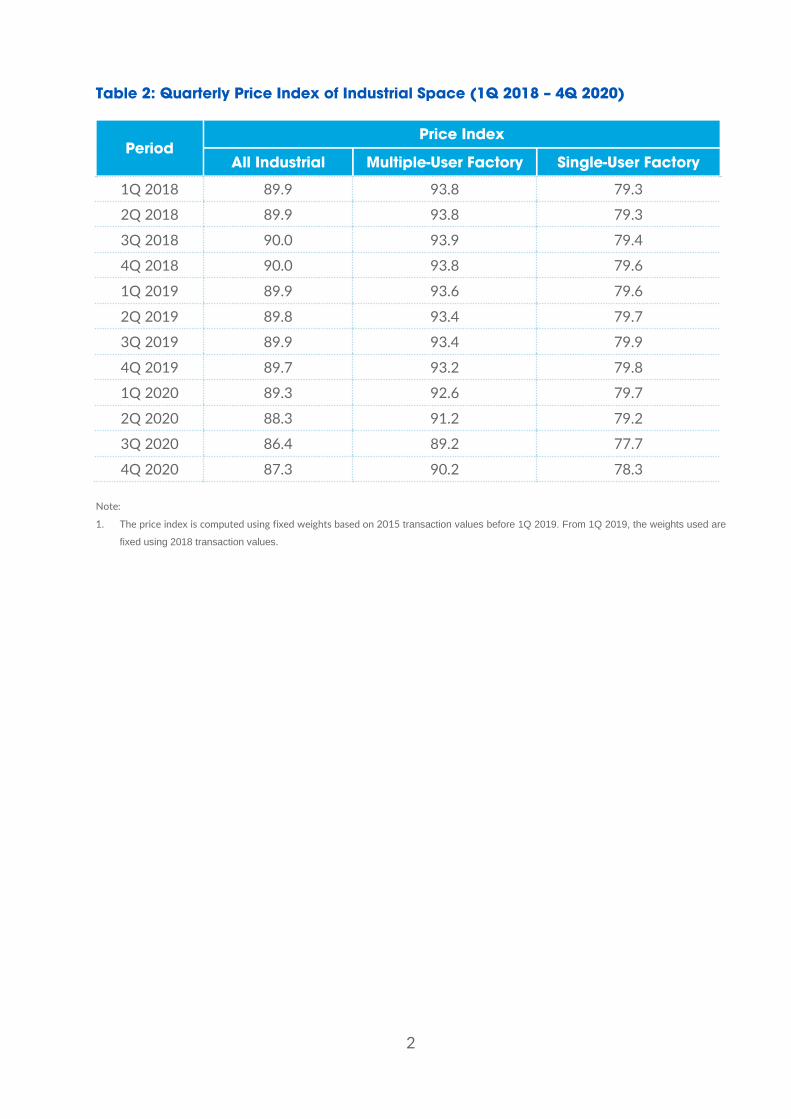
Table 2: Quarterly Price Index of Industrial Space (1Q 2018 – 4Q 2020)
Period Price Index
All Industrial Multiple-User Factory Single-User Factory
1Q 2018 89.9 93.8 79.3
2Q 2018 89.9 93.8 79.3
3Q 2018 90.0 93.9 79.4
4Q 2018 90.0 93.8 79.6
1Q 2019 89.9 93.6 79.6
2Q 2019 89.8 93.4 79.7
3Q 2019 89.9 93.4 79.9
4Q 2019 89.7 93.2 79.8
1Q 2020 89.3 92.6 79.7
2Q 2020 88.3 91.2 79.2
3Q 2020 86.4 89.2 77.7
4Q 2020 87.3 90.2 78.3 Note:
1. The price index is computed using fixed weights based on 2015 transaction values before 1Q 2019. From 1Q 2019, the weights used are
fixed using 2018 transaction values.
3
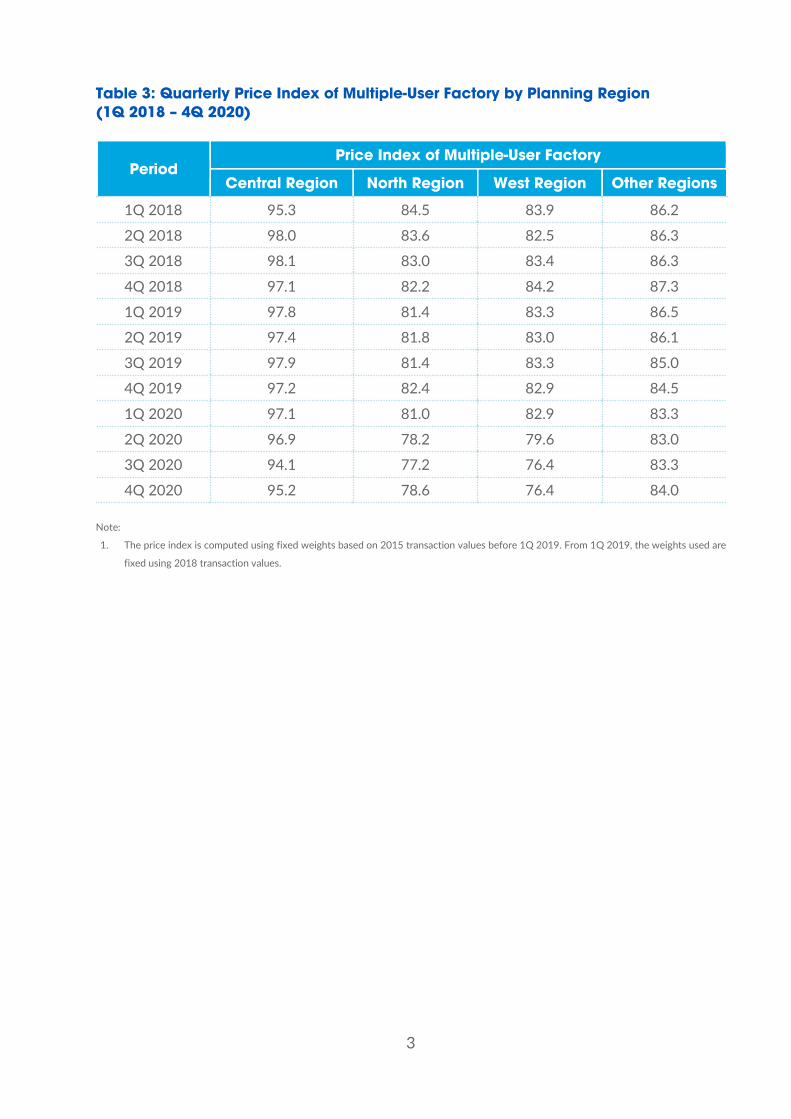
Table 3: Quarterly Price Index of Multiple-User Factory by Planning Region (1Q 2018 – 4Q 2020)
Period Price Index of Multiple-User Factory
Central Region North Region West Region Other Regions
1Q 2018 95.3 84.5 83.9 86.2
2Q 2018 98.0 83.6 82.5 86.3
3Q 2018 98.1 83.0 83.4 86.3
4Q 2018 97.1 82.2 84.2 87.3
1Q 2019 97.8 81.4 83.3 86.5
2Q 2019 97.4 81.8 83.0 86.1
3Q 2019 97.9 81.4 83.3 85.0
4Q 2019 97.2 82.4 82.9 84.5
1Q 2020 97.1 81.0 82.9 83.3
2Q 2020 96.9 78.2 79.6 83.0
3Q 2020 94.1 77.2 76.4 83.3
4Q 2020 95.2 78.6 76.4 84.0 Note:
1. The price index is computed using fixed weights based on 2015 transaction values before 1Q 2019. From 1Q 2019, the weights used are
fixed using 2018 transaction values.
4
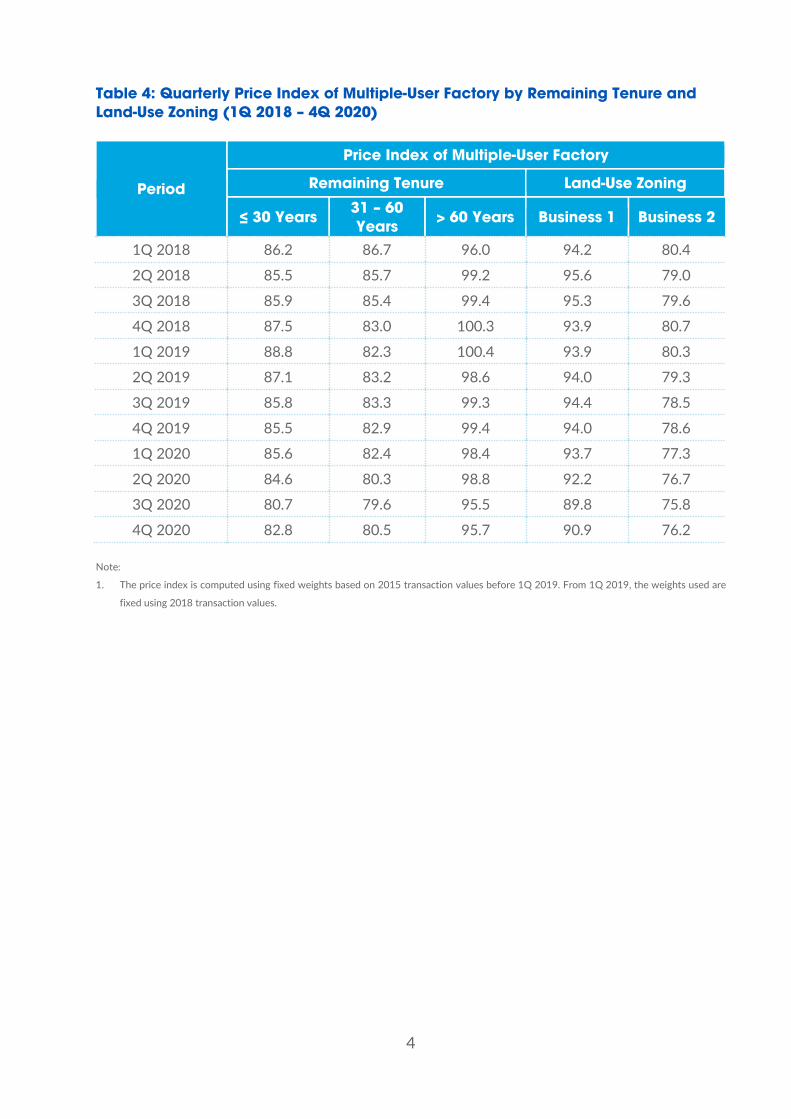
Table 4: Quarterly Price Index of Multiple-User Factory by Remaining Tenure and Land-Use Zoning (1Q 2018 – 4Q 2020)
Period
Price Index of Multiple-User Factory
Remaining Tenure Land-Use Zoning
≤ 30 Years 31 – 60 Years > 60 Years Business 1 Business 2
1Q 2018 86.2 86.7 96.0 94.2 80.4
2Q 2018 85.5 85.7 99.2 95.6 79.0
3Q 2018 85.9 85.4 99.4 95.3 79.6
4Q 2018 87.5 83.0 100.3 93.9 80.7
1Q 2019 88.8 82.3 100.4 93.9 80.3
2Q 2019 87.1 83.2 98.6 94.0 79.3
3Q 2019 85.8 83.3 99.3 94.4 78.5
4Q 2019 85.5 82.9 99.4 94.0 78.6
1Q 2020 85.6 82.4 98.4 93.7 77.3
2Q 2020 84.6 80.3 98.8 92.2 76.7
3Q 2020 80.7 79.6 95.5 89.8 75.8
4Q 2020 82.8 80.5 95.7 90.9 76.2 Note:
1. The price index is computed using fixed weights based on 2015 transaction values before 1Q 2019. From 1Q 2019, the weights used are
fixed using 2018 transaction values.
5
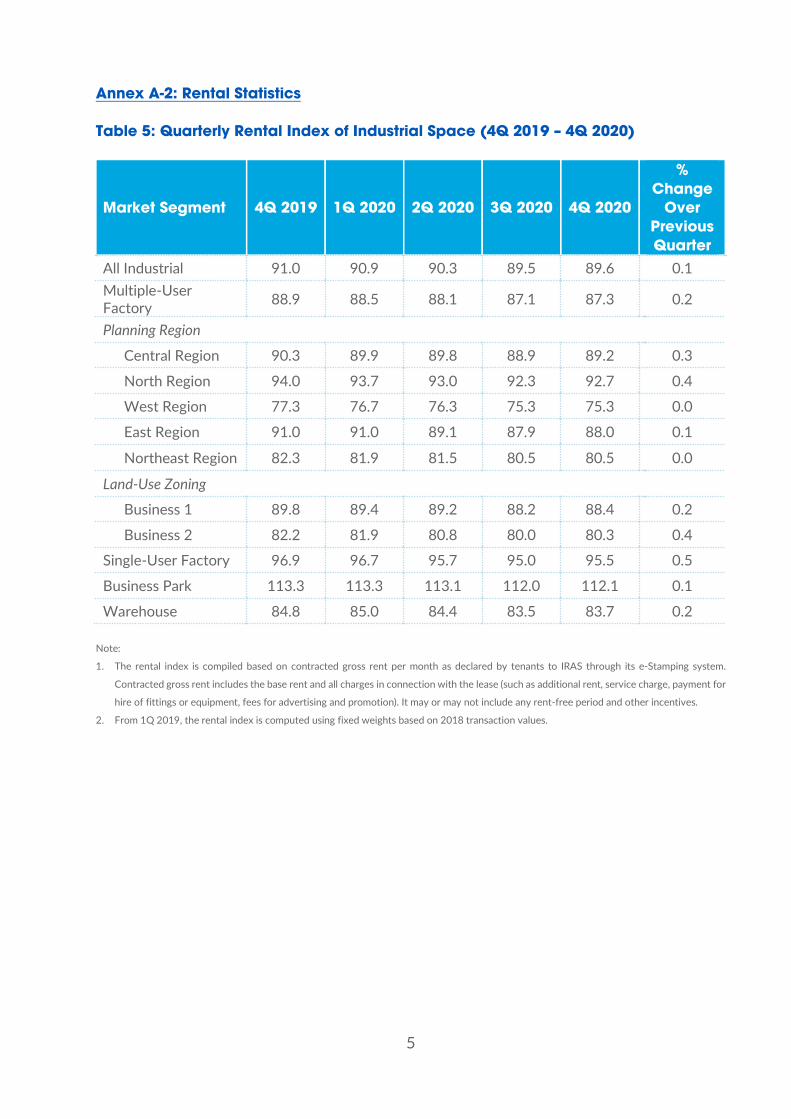
Annex A-2: Rental Statistics Table 5: Quarterly Rental Index of Industrial Space (4Q 2019 – 4Q 2020)
Market Segment 4Q 2019 1Q 2020 2Q 2020 3Q 2020 4Q 2020
% Change
Over Previous Quarter
All Industrial 91.0 90.9 90.3 89.5 89.6 0.1 Multiple-User Factory 88.9 88.5 88.1 87.1 87.3 0.2
Planning Region
Central Region 90.3 89.9 89.8 88.9 89.2 0.3
North Region 94.0 93.7 93.0 92.3 92.7 0.4
West Region 77.3 76.7 76.3 75.3 75.3 0.0
East Region 91.0 91.0 89.1 87.9 88.0 0.1
Northeast Region 82.3 81.9 81.5 80.5 80.5 0.0
Land-Use Zoning
Business 1 89.8 89.4 89.2 88.2 88.4 0.2
Business 2 82.2 81.9 80.8 80.0 80.3 0.4
Single-User Factory 96.9 96.7 95.7 95.0 95.5 0.5
Business Park 113.3 113.3 113.1 112.0 112.1 0.1
Warehouse 84.8 85.0 84.4 83.5 83.7 0.2 Note:
1. The rental index is compiled based on contracted gross rent per month as declared by tenants to IRAS through its e-Stamping system.
Contracted gross rent includes the base rent and all charges in connection with the lease (such as additional rent, service charge, payment for
hire of fittings or equipment, fees for advertising and promotion). It may or may not include any rent-free period and other incentives.
2. From 1Q 2019, the rental index is computed using fixed weights based on 2018 transaction values.

6
Table 6: Quarterly Rental Index of Industrial Space (1Q 2018 – 4Q 2020)
Period
Rental Index
All Industrial
Multiple-User Factory
Single-User Factory
Business Park Warehouse
1Q 2018 91.1 89.1 97.5 111.5 85.5
2Q 2018 91.0 89.3 95.9 112.1 85.1
3Q 2018 90.9 89.1 95.8 112.0 85.1
4Q 2018 90.9 89.0 96.4 111.9 85.0
1Q 2019 90.9 88.9 95.8 112.9 85.1
2Q 2019 91.0 89.0 96.3 113.1 84.9
3Q 2019 91.0 89.0 96.8 113.2 84.7
4Q 2019 91.0 88.9 96.9 113.3 84.8
1Q 2020 90.9 88.5 96.7 113.3 85.0
2Q 2020 90.3 88.1 95.7 113.1 84.4
3Q 2020 89.5 87.1 95.0 112.0 83.5
4Q 2020 89.6 87.3 95.5 112.1 83.7 Note:
1. The rental index is compiled based on contracted gross rent per month as declared by tenants to IRAS through its e-Stamping system.
Contracted gross rent includes the base rent and all charges in connection with the lease (such as additional rent, service charge, payment for
hire of fittings or equipment, fees for advertising and promotion). It may or may not include any rent-free period and other incentives.
2. The rental index is computed using fixed weights based on 2015 transaction values before 1Q 2019. From 1Q 2019, the weights used are
fixed using 2018 transaction values.
7
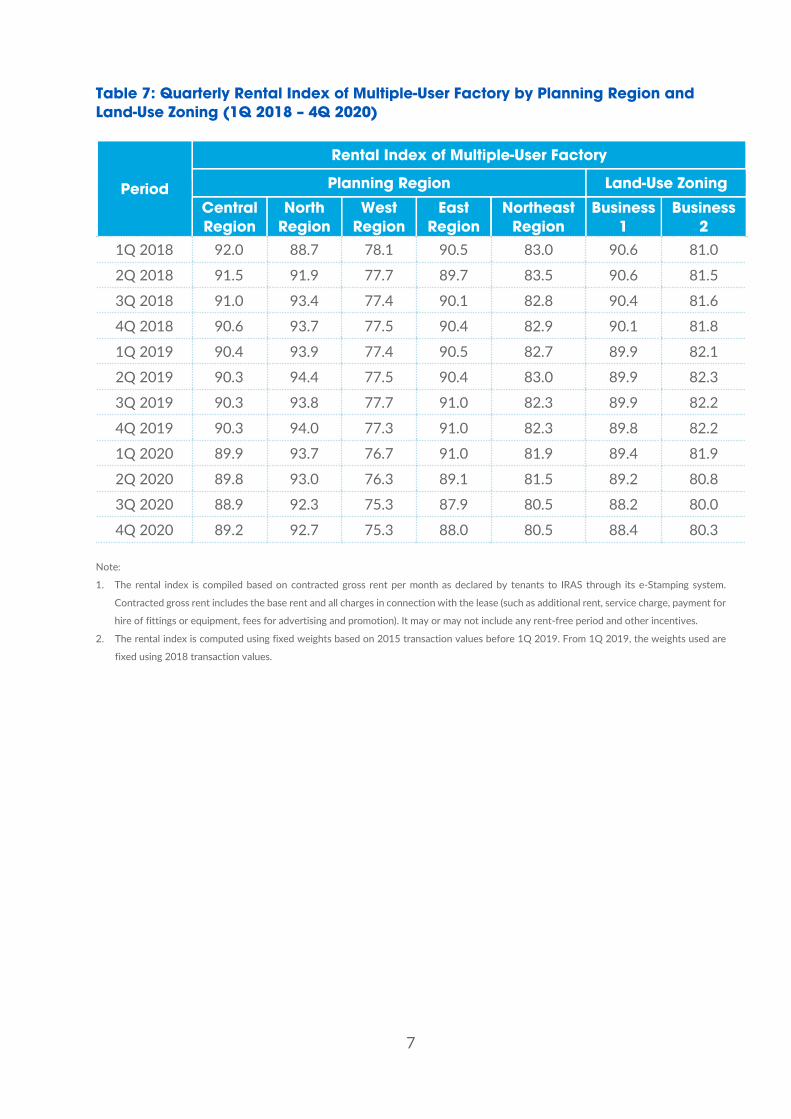
Table 7: Quarterly Rental Index of Multiple-User Factory by Planning Region and Land-Use Zoning (1Q 2018 – 4Q 2020)
Period
Rental Index of Multiple-User Factory
Planning Region Land-Use Zoning
Central Region
North Region
West Region
East Region
Northeast Region
Business 1
Business 2
1Q 2018 92.0 88.7 78.1 90.5 83.0 90.6 81.0
2Q 2018 91.5 91.9 77.7 89.7 83.5 90.6 81.5
3Q 2018 91.0 93.4 77.4 90.1 82.8 90.4 81.6
4Q 2018 90.6 93.7 77.5 90.4 82.9 90.1 81.8
1Q 2019 90.4 93.9 77.4 90.5 82.7 89.9 82.1
2Q 2019 90.3 94.4 77.5 90.4 83.0 89.9 82.3
3Q 2019 90.3 93.8 77.7 91.0 82.3 89.9 82.2
4Q 2019 90.3 94.0 77.3 91.0 82.3 89.8 82.2
1Q 2020 89.9 93.7 76.7 91.0 81.9 89.4 81.9
2Q 2020 89.8 93.0 76.3 89.1 81.5 89.2 80.8
3Q 2020 88.9 92.3 75.3 87.9 80.5 88.2 80.0
4Q 2020 89.2 92.7 75.3 88.0 80.5 88.4 80.3 Note:
1. The rental index is compiled based on contracted gross rent per month as declared by tenants to IRAS through its e-Stamping system.
Contracted gross rent includes the base rent and all charges in connection with the lease (such as additional rent, service charge, payment for
hire of fittings or equipment, fees for advertising and promotion). It may or may not include any rent-free period and other incentives.
2. The rental index is computed using fixed weights based on 2015 transaction values before 1Q 2019. From 1Q 2019, the weights used are
fixed using 2018 transaction values.
8
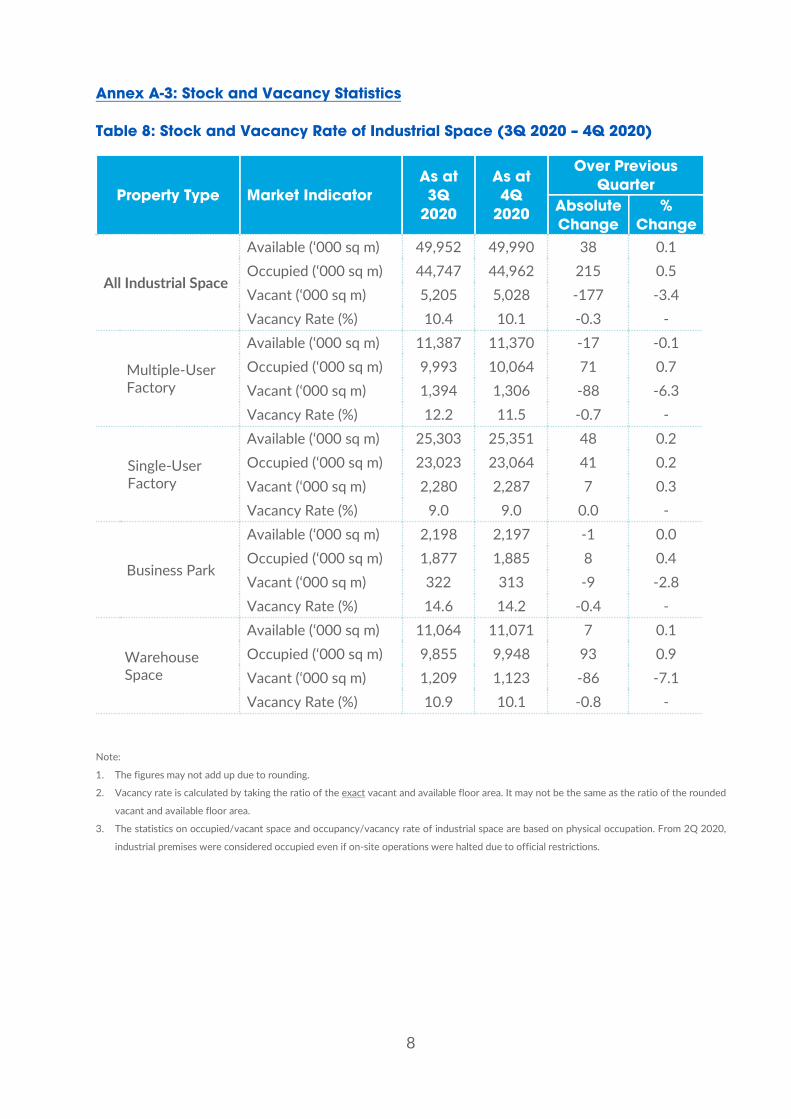
Annex A-3: Stock and Vacancy Statistics Table 8: Stock and Vacancy Rate of Industrial Space (3Q 2020 – 4Q 2020)
Note:
1. The figures may not add up due to rounding. 2. Vacancy rate is calculated by taking the ratio of the exact vacant and available floor area. It may not be the same as the ratio of the rounded
vacant and available floor area. 3. The statistics on occupied/vacant space and occupancy/vacancy rate of industrial space are based on physical occupation. From 2Q 2020,
industrial premises were considered occupied even if on-site operations were halted due to official restrictions.
Property Type Market Indicator As at 3Q
2020
As at 4Q
2020
Over Previous Quarter
Absolute Change
% Change
All Industrial Space
Available (‘000 sq m) 49,952 49,990 38 0.1 Occupied (‘000 sq m) 44,747 44,962 215 0.5 Vacant (‘000 sq m) 5,205 5,028 -177 -3.4 Vacancy Rate (%) 10.4 10.1 -0.3 -
Multiple-User Factory
Available (‘000 sq m) 11,387 11,370 -17 -0.1 Occupied (‘000 sq m) 9,993 10,064 71 0.7 Vacant (‘000 sq m) 1,394 1,306 -88 -6.3 Vacancy Rate (%) 12.2 11.5 -0.7 -
Single-User Factory
Available (‘000 sq m) 25,303 25,351 48 0.2 Occupied (‘000 sq m) 23,023 23,064 41 0.2 Vacant (‘000 sq m) 2,280 2,287 7 0.3 Vacancy Rate (%) 9.0 9.0 0.0 -
Business Park
Available (‘000 sq m) 2,198 2,197 -1 0.0 Occupied (‘000 sq m) 1,877 1,885 8 0.4 Vacant (‘000 sq m) 322 313 -9 -2.8 Vacancy Rate (%) 14.6 14.2 -0.4 -
Warehouse Space
Available (‘000 sq m) 11,064 11,071 7 0.1 Occupied (‘000 sq m) 9,855 9,948 93 0.9 Vacant (‘000 sq m) 1,209 1,123 -86 -7.1 Vacancy Rate (%) 10.9 10.1 -0.8 -

9
Table 9: Stock and Vacancy Rate of All Industrial Space (1Q 2018 – 4Q 2020)
Period Stock (‘000 sq m) Vacancy Rate
(%) Available Occupied Vacant
1Q 2018 48,188 42,871 5,316 11.0
2Q 2018 48,525 43,033 5,492 11.3
3Q 2018 48,670 43,389 5,281 10.9
4Q 2018 48,768 43,562 5,206 10.7
1Q 2019 49,096 43,858 5,238 10.7
2Q 2019 49,278 44,030 5,248 10.7
3Q 2019 49,631 44,324 5,306 10.7
4Q 2019 49,633 44,288 5,346 10.8
1Q 2020 49,832 44,431 5,401 10.8
2Q 2020 49,930 44,639 5,291 10.6
3Q 2020 49,952 44,747 5,205 10.4
4Q 2020 49,990 44,962 5,028 10.1 Note:
1. The figures may not add up due to rounding. 2. Vacancy rate is calculated by taking the ratio of the exact vacant and available floor area. It may not be the same as the ratio of the rounded
vacant and available floor area. 3. The statistics on occupied/vacant space and occupancy/vacancy rate of industrial space are based on physical occupation. From 2Q 2020,
industrial premises were considered occupied even if on-site operations were halted due to official restrictions.
10
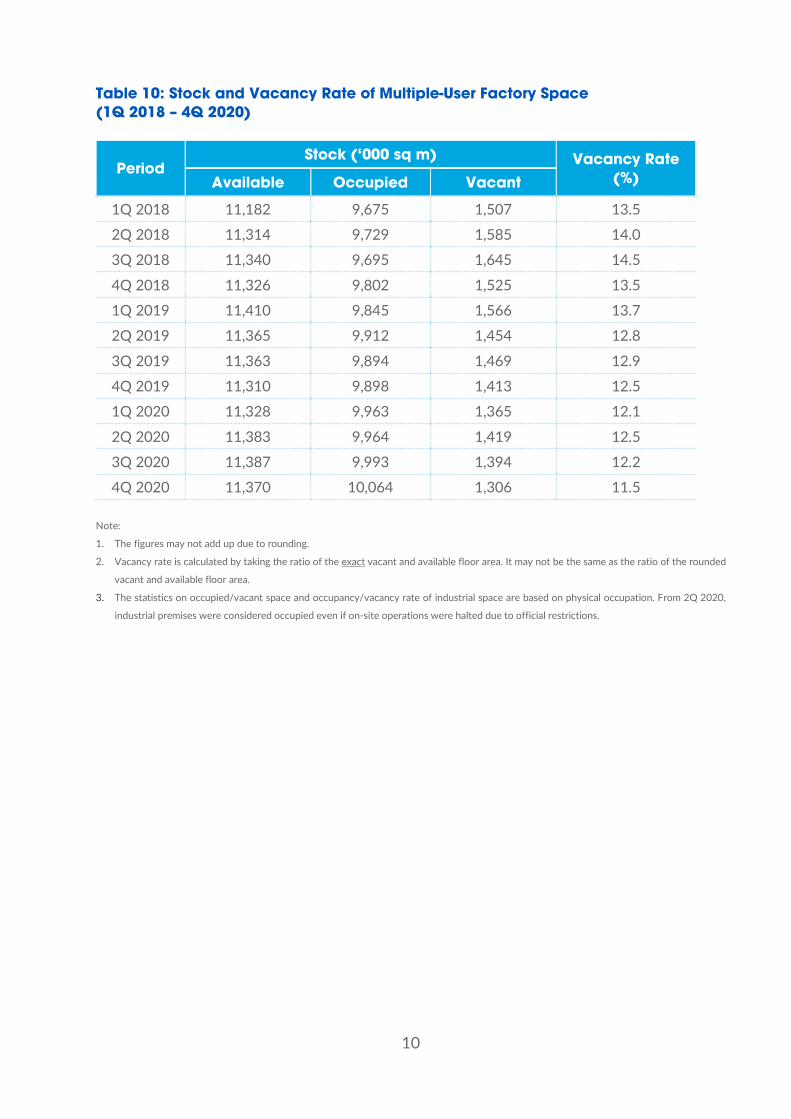
Table 10: Stock and Vacancy Rate of Multiple-User Factory Space (1Q 2018 – 4Q 2020)
Period Stock (‘000 sq m) Vacancy Rate
(%) Available Occupied Vacant
1Q 2018 11,182 9,675 1,507 13.5
2Q 2018 11,314 9,729 1,585 14.0
3Q 2018 11,340 9,695 1,645 14.5
4Q 2018 11,326 9,802 1,525 13.5
1Q 2019 11,410 9,845 1,566 13.7
2Q 2019 11,365 9,912 1,454 12.8
3Q 2019 11,363 9,894 1,469 12.9
4Q 2019 11,310 9,898 1,413 12.5
1Q 2020 11,328 9,963 1,365 12.1
2Q 2020 11,383 9,964 1,419 12.5
3Q 2020 11,387 9,993 1,394 12.2
4Q 2020 11,370 10,064 1,306 11.5 Note:
1. The figures may not add up due to rounding.
2. Vacancy rate is calculated by taking the ratio of the exact vacant and available floor area. It may not be the same as the ratio of the rounded
vacant and available floor area. 3. The statistics on occupied/vacant space and occupancy/vacancy rate of industrial space are based on physical occupation. From 2Q 2020,
industrial premises were considered occupied even if on-site operations were halted due to official restrictions.
11
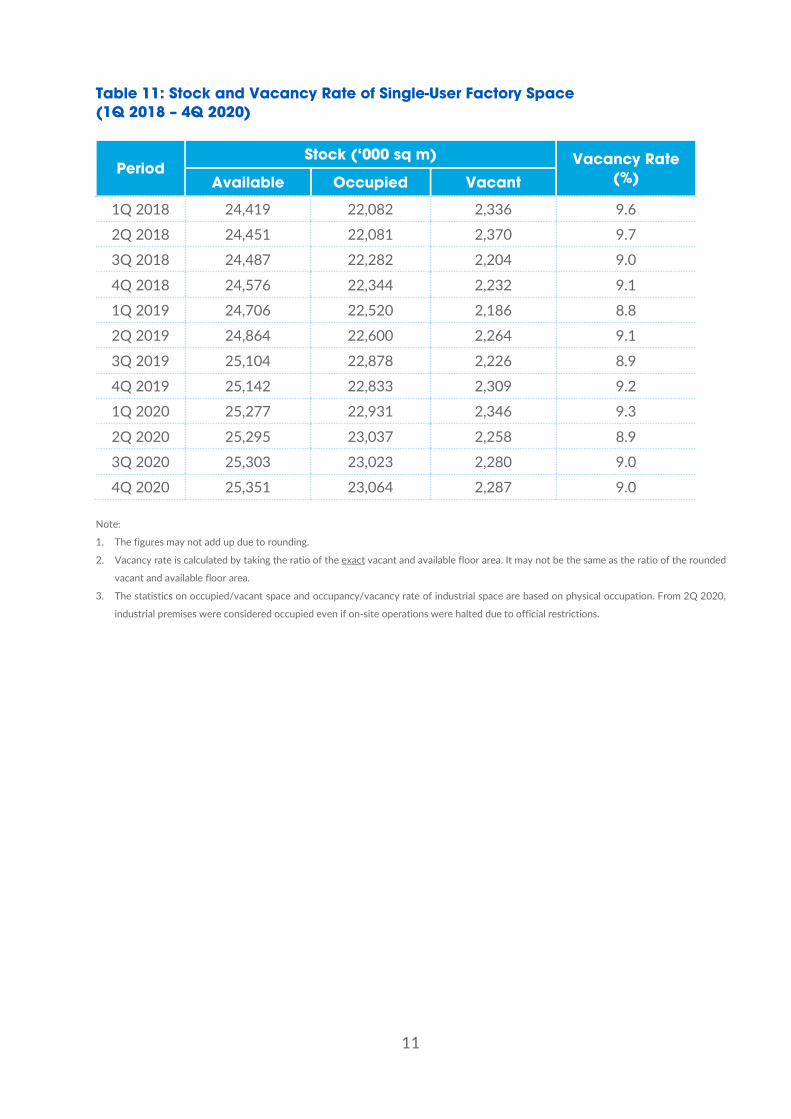
Table 11: Stock and Vacancy Rate of Single-User Factory Space (1Q 2018 – 4Q 2020)
Period Stock (‘000 sq m) Vacancy Rate
(%) Available Occupied Vacant
1Q 2018 24,419 22,082 2,336 9.6
2Q 2018 24,451 22,081 2,370 9.7
3Q 2018 24,487 22,282 2,204 9.0
4Q 2018 24,576 22,344 2,232 9.1
1Q 2019 24,706 22,520 2,186 8.8
2Q 2019 24,864 22,600 2,264 9.1
3Q 2019 25,104 22,878 2,226 8.9
4Q 2019 25,142 22,833 2,309 9.2
1Q 2020 25,277 22,931 2,346 9.3
2Q 2020 25,295 23,037 2,258 8.9
3Q 2020 25,303 23,023 2,280 9.0
4Q 2020 25,351 23,064 2,287 9.0 Note:
1. The figures may not add up due to rounding.
2. Vacancy rate is calculated by taking the ratio of the exact vacant and available floor area. It may not be the same as the ratio of the rounded
vacant and available floor area. 3. The statistics on occupied/vacant space and occupancy/vacancy rate of industrial space are based on physical occupation. From 2Q 2020,
industrial premises were considered occupied even if on-site operations were halted due to official restrictions.

12
Table 12: Stock and Vacancy Rate of Business Park Space (1Q 2018 – 4Q 2020)
Period Stock (‘000 sq m) Vacancy Rate
(%) Available Occupied Vacant
1Q 2018 2,140 1,822 318 14.9
2Q 2018 2,149 1,827 322 15.0
3Q 2018 2,149 1,848 301 14.0
4Q 2018 2,185 1,854 331 15.1
1Q 2019 2,201 1,883 317 14.4
2Q 2019 2,200 1,892 308 14.0
3Q 2019 2,200 1,896 303 13.8
4Q 2019 2,199 1,897 303 13.8
1Q 2020 2,197 1,889 308 14.0
2Q 2020 2,195 1,870 324 14.8
3Q 2020 2,198 1,877 322 14.6
4Q 2020 2,197 1,885 313 14.2 Note:
1. The figures may not add up due to rounding. 2. Vacancy rate is calculated by taking the ratio of the exact vacant and available floor area. It may not be the same as the ratio of the rounded
vacant and available floor area. 3. The statistics on occupied/vacant space and occupancy/vacancy rate of industrial space are based on physical occupation. From 2Q 2020,
industrial premises were considered occupied even if on-site operations were halted due to official restrictions.
13
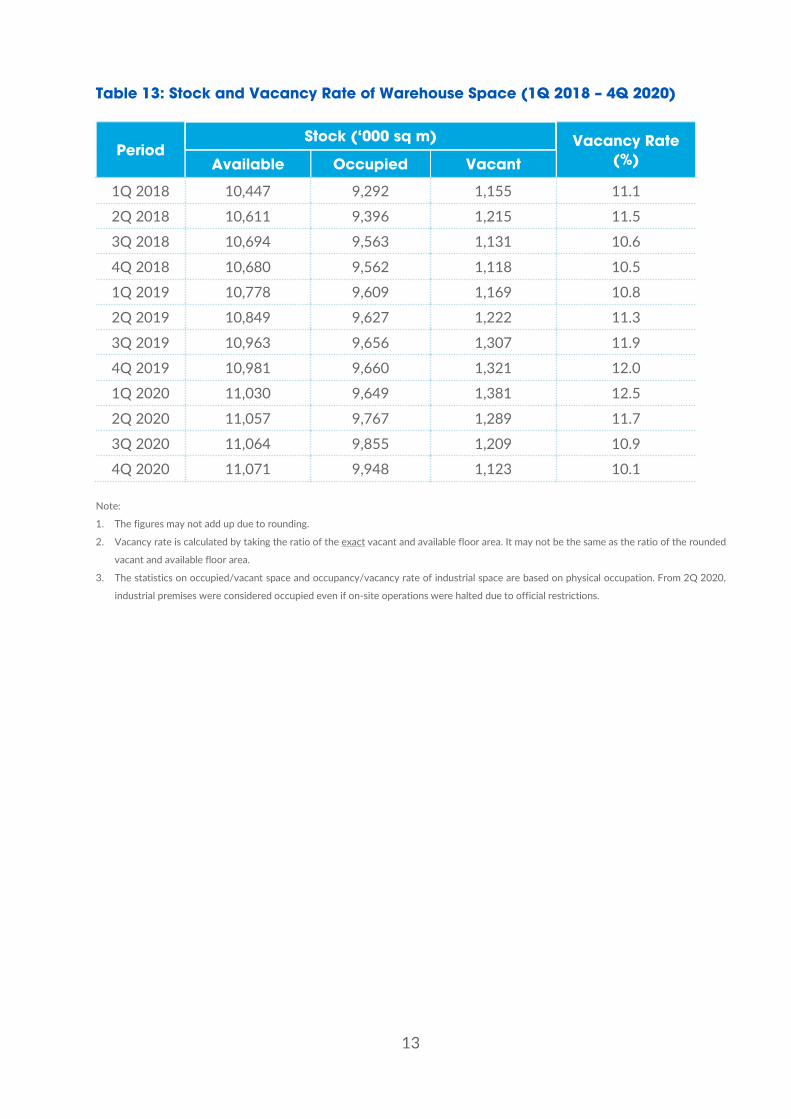
Table 13: Stock and Vacancy Rate of Warehouse Space (1Q 2018 – 4Q 2020)
Period Stock (‘000 sq m) Vacancy Rate
(%) Available Occupied Vacant
1Q 2018 10,447 9,292 1,155 11.1
2Q 2018 10,611 9,396 1,215 11.5
3Q 2018 10,694 9,563 1,131 10.6
4Q 2018 10,680 9,562 1,118 10.5
1Q 2019 10,778 9,609 1,169 10.8
2Q 2019 10,849 9,627 1,222 11.3
3Q 2019 10,963 9,656 1,307 11.9
4Q 2019 10,981 9,660 1,321 12.0
1Q 2020 11,030 9,649 1,381 12.5
2Q 2020 11,057 9,767 1,289 11.7
3Q 2020 11,064 9,855 1,209 10.9
4Q 2020 11,071 9,948 1,123 10.1 Note:
1. The figures may not add up due to rounding.
2. Vacancy rate is calculated by taking the ratio of the exact vacant and available floor area. It may not be the same as the ratio of the rounded
vacant and available floor area.
3. The statistics on occupied/vacant space and occupancy/vacancy rate of industrial space are based on physical occupation. From 2Q 2020,
industrial premises were considered occupied even if on-site operations were halted due to official restrictions.
14
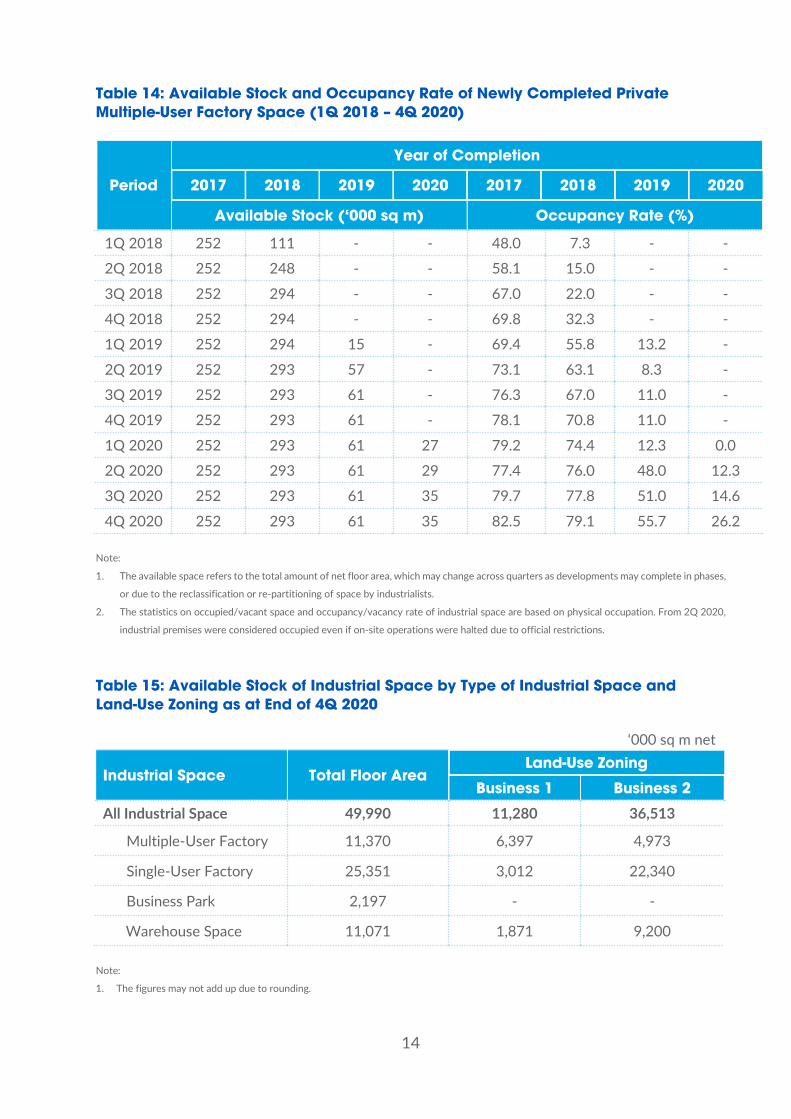
Table 14: Available Stock and Occupancy Rate of Newly Completed Private Multiple-User Factory Space (1Q 2018 – 4Q 2020)
Period
Year of Completion
2017 2018 2019 2020 2017 2018 2019 2020
Available Stock (‘000 sq m) Occupancy Rate (%)
1Q 2018 252 111 - - 48.0 7.3 - -
2Q 2018 252 248 - - 58.1 15.0 - -
3Q 2018 252 294 - - 67.0 22.0 - -
4Q 2018 252 294 - - 69.8 32.3 - -
1Q 2019 252 294 15 - 69.4 55.8 13.2 -
2Q 2019 252 293 57 - 73.1 63.1 8.3 -
3Q 2019 252 293 61 - 76.3 67.0 11.0 -
4Q 2019 252 293 61 - 78.1 70.8 11.0 -
1Q 2020 252 293 61 27 79.2 74.4 12.3 0.0
2Q 2020 252 293 61 29 77.4 76.0 48.0 12.3
3Q 2020 252 293 61 35 79.7 77.8 51.0 14.6
4Q 2020 252 293 61 35 82.5 79.1 55.7 26.2 Note:
1. The available space refers to the total amount of net floor area, which may change across quarters as developments may complete in phases,
or due to the reclassification or re-partitioning of space by industrialists.
2. The statistics on occupied/vacant space and occupancy/vacancy rate of industrial space are based on physical occupation. From 2Q 2020,
industrial premises were considered occupied even if on-site operations were halted due to official restrictions.
Table 15: Available Stock of Industrial Space by Type of Industrial Space and Land-Use Zoning as at End of 4Q 2020
‘000 sq m net
Industrial Space Total Floor Area Land-Use Zoning
Business 1 Business 2
All Industrial Space 49,990 11,280 36,513
Multiple-User Factory 11,370 6,397 4,973
Single-User Factory 25,351 3,012 22,340
Business Park 2,197 - -
Warehouse Space 11,071 1,871 9,200 Note:
1. The figures may not add up due to rounding.
15
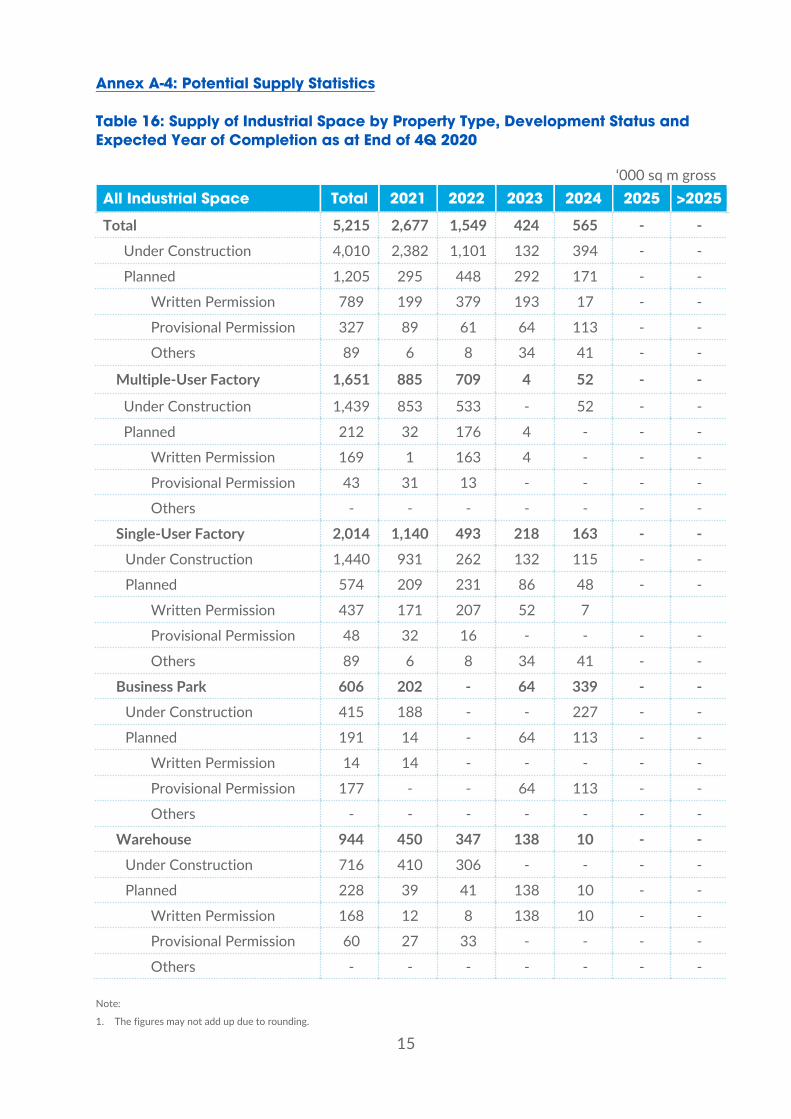
Annex A-4: Potential Supply Statistics Table 16: Supply of Industrial Space by Property Type, Development Status and Expected Year of Completion as at End of 4Q 2020
‘000 sq m gross All Industrial Space Total 2021 2022 2023 2024 2025 >2025
Total 5,215 2,677 1,549 424 565 - -
Under Construction 4,010 2,382 1,101 132 394 - -
Planned 1,205 295 448 292 171 - -
Written Permission 789 199 379 193 17 - -
Provisional Permission 327 89 61 64 113 - -
Others 89 6 8 34 41 - -
Multiple-User Factory 1,651 885 709 4 52 - -
Under Construction 1,439 853 533 - 52 - -
Planned 212 32 176 4 - - -
Written Permission 169 1 163 4 - - -
Provisional Permission 43 31 13 - - - -
Others - - - - - - -
Single-User Factory 2,014 1,140 493 218 163 - -
Under Construction 1,440 931 262 132 115 - -
Planned 574 209 231 86 48 - -
Written Permission 437 171 207 52 7
Provisional Permission 48 32 16 - - - -
Others 89 6 8 34 41 - -
Business Park 606 202 - 64 339 - - Under Construction 415 188 - - 227 - -
Planned 191 14 - 64 113 - -
Written Permission 14 14 - - - - -
Provisional Permission 177 - - 64 113 - -
Others - - - - - - -
Warehouse 944 450 347 138 10 - -
Under Construction 716 410 306 - - - -
Planned 228 39 41 138 10 - -
Written Permission 168 12 8 138 10 - -
Provisional Permission 60 27 33 - - - -
Others - - - - - - - Note:
1. The figures may not add up due to rounding.
16
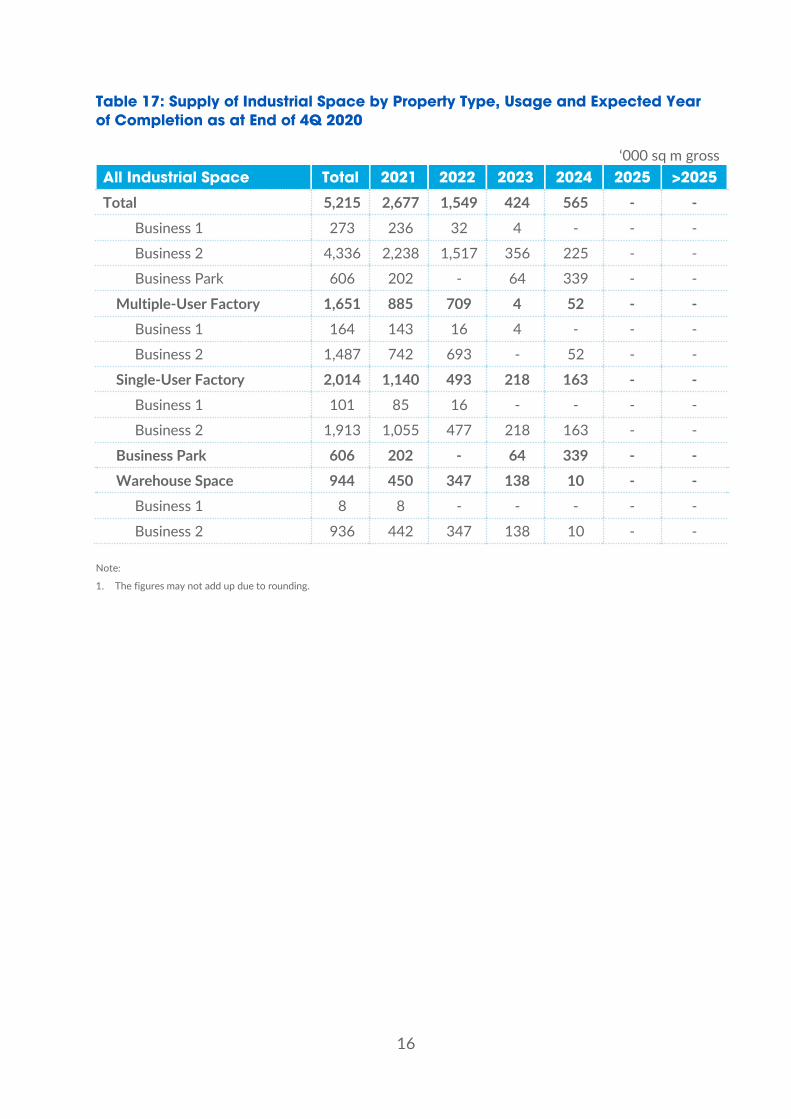
Table 17: Supply of Industrial Space by Property Type, Usage and Expected Year of Completion as at End of 4Q 2020
‘000 sq m gross All Industrial Space Total 2021 2022 2023 2024 2025 >2025
Total 5,215 2,677 1,549 424 565 - - Business 1 273 236 32 4 - - -
Business 2 4,336 2,238 1,517 356 225 - -
Business Park 606 202 - 64 339 - -
Multiple-User Factory 1,651 885 709 4 52 - - Business 1 164 143 16 4 - - -
Business 2 1,487 742 693 - 52 - -
Single-User Factory 2,014 1,140 493 218 163 - - Business 1 101 85 16 - - - -
Business 2 1,913 1,055 477 218 163 - -
Business Park 606 202 - 64 339 - - Warehouse Space 944 450 347 138 10 - -
Business 1 8 8 - - - - -
Business 2 936 442 347 138 10 - - Note:
1. The figures may not add up due to rounding.
17
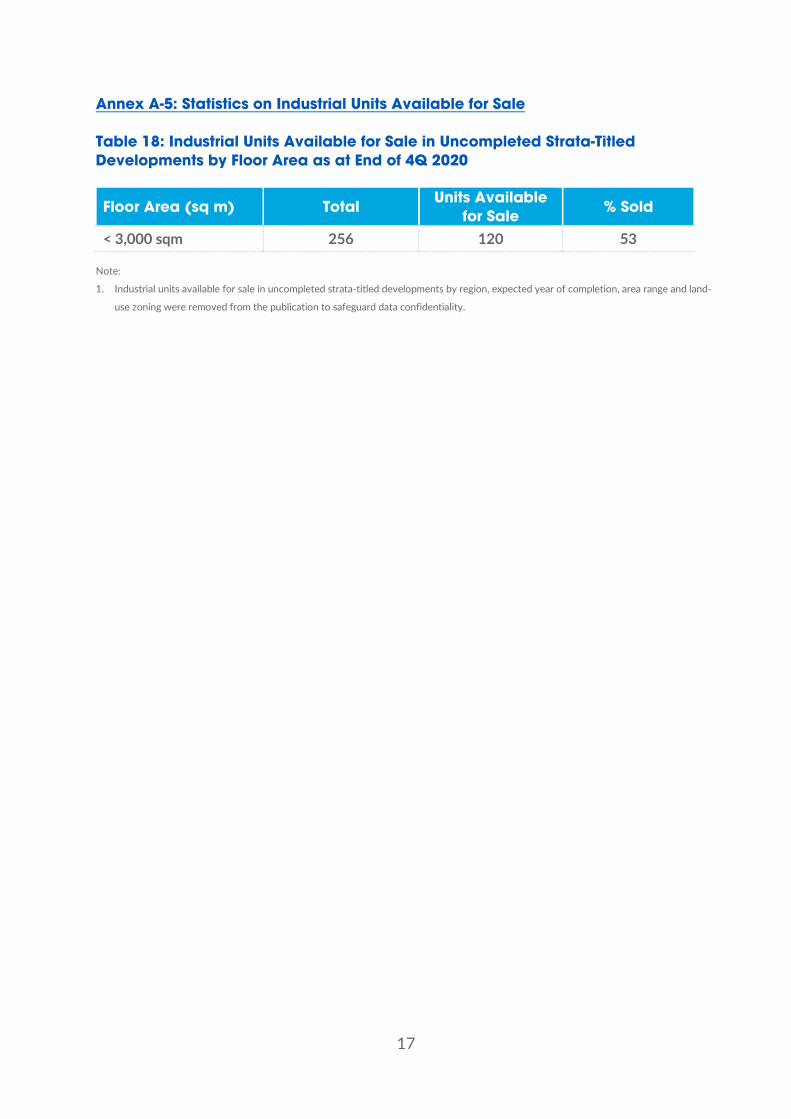
Annex A-5: Statistics on Industrial Units Available for Sale Table 18: Industrial Units Available for Sale in Uncompleted Strata-Titled Developments by Floor Area as at End of 4Q 2020
Floor Area (sq m) Total Units Available for Sale % Sold
< 3,000 sqm 256 120 53 Note: 1. Industrial units available for sale in uncompleted strata-titled developments by region, expected year of completion, area range and land-
use zoning were removed from the publication to safeguard data confidentiality.
18
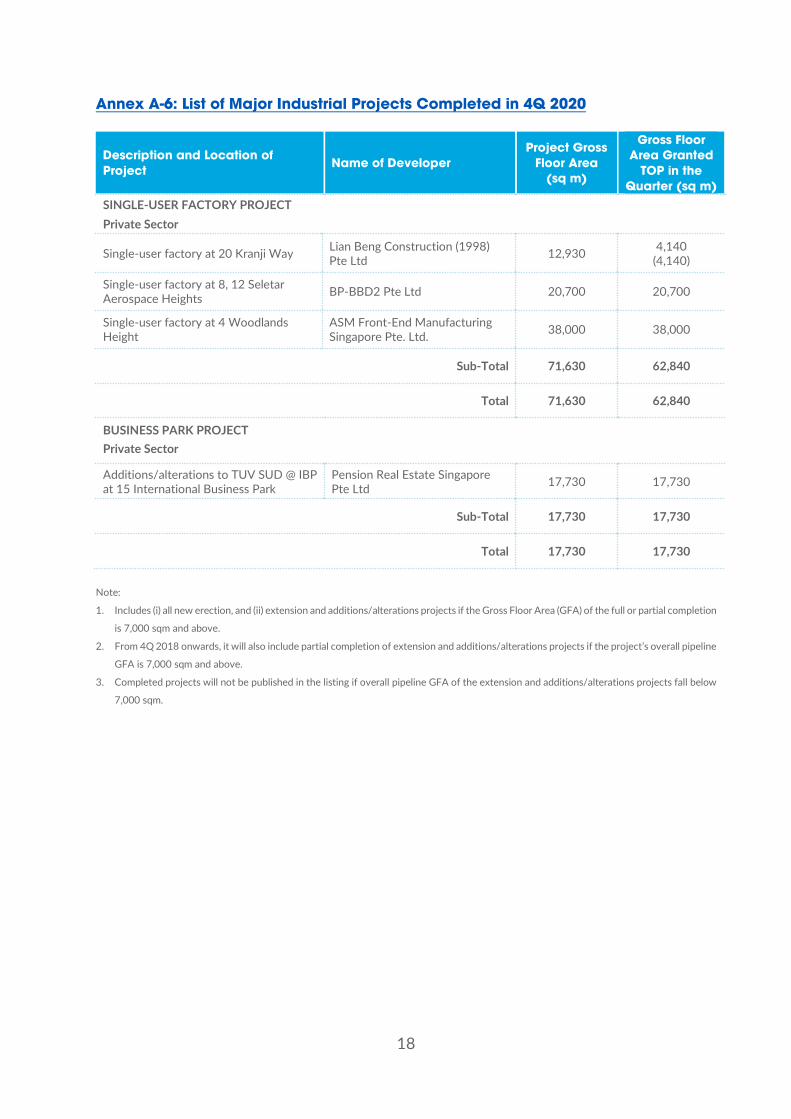
Annex A-6: List of Major Industrial Projects Completed in 4Q 2020
Description and Location of Project Name of Developer
Project Gross Floor Area
(sq m)
Gross Floor Area Granted
TOP in the Quarter (sq m)
SINGLE-USER FACTORY PROJECT Private Sector
Single-user factory at 20 Kranji Way Lian Beng Construction (1998) Pte Ltd 12,930 4,140
(4,140)
Single-user factory at 8, 12 Seletar Aerospace Heights BP-BBD2 Pte Ltd 20,700 20,700
Single-user factory at 4 Woodlands Height
ASM Front-End Manufacturing Singapore Pte. Ltd. 38,000 38,000
Sub-Total 71,630 62,840
Total 71,630 62,840
BUSINESS PARK PROJECT Private Sector
Additions/alterations to TUV SUD @ IBP at 15 International Business Park
Pension Real Estate Singapore Pte Ltd 17,730 17,730
Sub-Total 17,730 17,730
Total 17,730 17,730
Note:
1. Includes (i) all new erection, and (ii) extension and additions/alterations projects if the Gross Floor Area (GFA) of the full or partial completion
is 7,000 sqm and above.
2. From 4Q 2018 onwards, it will also include partial completion of extension and additions/alterations projects if the project’s overall pipeline
GFA is 7,000 sqm and above.
3. Completed projects will not be published in the listing if overall pipeline GFA of the extension and additions/alterations projects fall below
7,000 sqm.
19
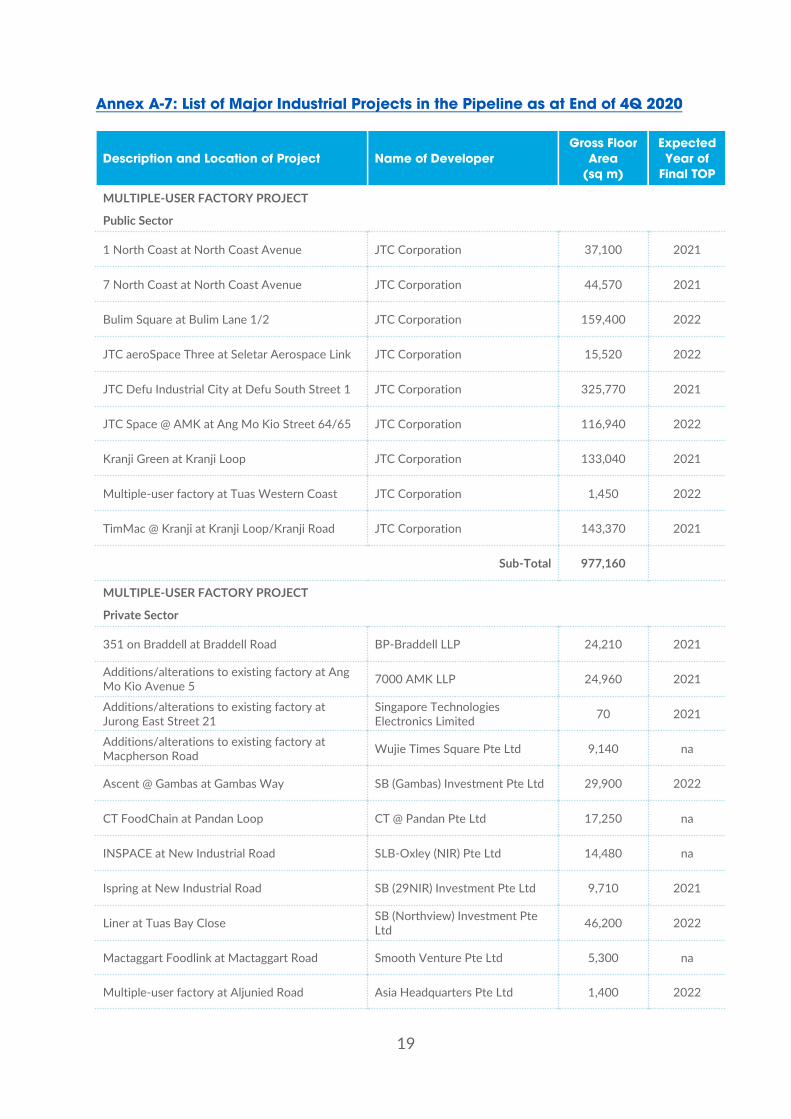
Annex A-7: List of Major Industrial Projects in the Pipeline as at End of 4Q 2020
Description and Location of Project Name of Developer Gross Floor
Area (sq m)
Expected Year of
Final TOP
MULTIPLE-USER FACTORY PROJECT
Public Sector
1 North Coast at North Coast Avenue JTC Corporation 37,100 2021
7 North Coast at North Coast Avenue JTC Corporation 44,570 2021
Bulim Square at Bulim Lane 1/2 JTC Corporation 159,400 2022
JTC aeroSpace Three at Seletar Aerospace Link JTC Corporation 15,520 2022
JTC Defu Industrial City at Defu South Street 1 JTC Corporation 325,770 2021
JTC Space @ AMK at Ang Mo Kio Street 64/65 JTC Corporation 116,940 2022
Kranji Green at Kranji Loop JTC Corporation 133,040 2021
Multiple-user factory at Tuas Western Coast JTC Corporation 1,450 2022
TimMac @ Kranji at Kranji Loop/Kranji Road JTC Corporation 143,370 2021
Sub-Total 977,160
MULTIPLE-USER FACTORY PROJECT
Private Sector
351 on Braddell at Braddell Road BP-Braddell LLP 24,210 2021
Additions/alterations to existing factory at Ang Mo Kio Avenue 5 7000 AMK LLP 24,960 2021
Additions/alterations to existing factory at Jurong East Street 21
Singapore Technologies Electronics Limited 70 2021
Additions/alterations to existing factory at Macpherson Road Wujie Times Square Pte Ltd 9,140 na
Ascent @ Gambas at Gambas Way SB (Gambas) Investment Pte Ltd 29,900 2022
CT FoodChain at Pandan Loop CT @ Pandan Pte Ltd 17,250 na
INSPACE at New Industrial Road SLB-Oxley (NIR) Pte Ltd 14,480 na
Ispring at New Industrial Road SB (29NIR) Investment Pte Ltd 9,710 2021
Liner at Tuas Bay Close SB (Northview) Investment Pte Ltd 46,200 2022
Mactaggart Foodlink at Mactaggart Road Smooth Venture Pte Ltd 5,300 na
Multiple-user factory at Aljunied Road Asia Headquarters Pte Ltd 1,400 2022
20
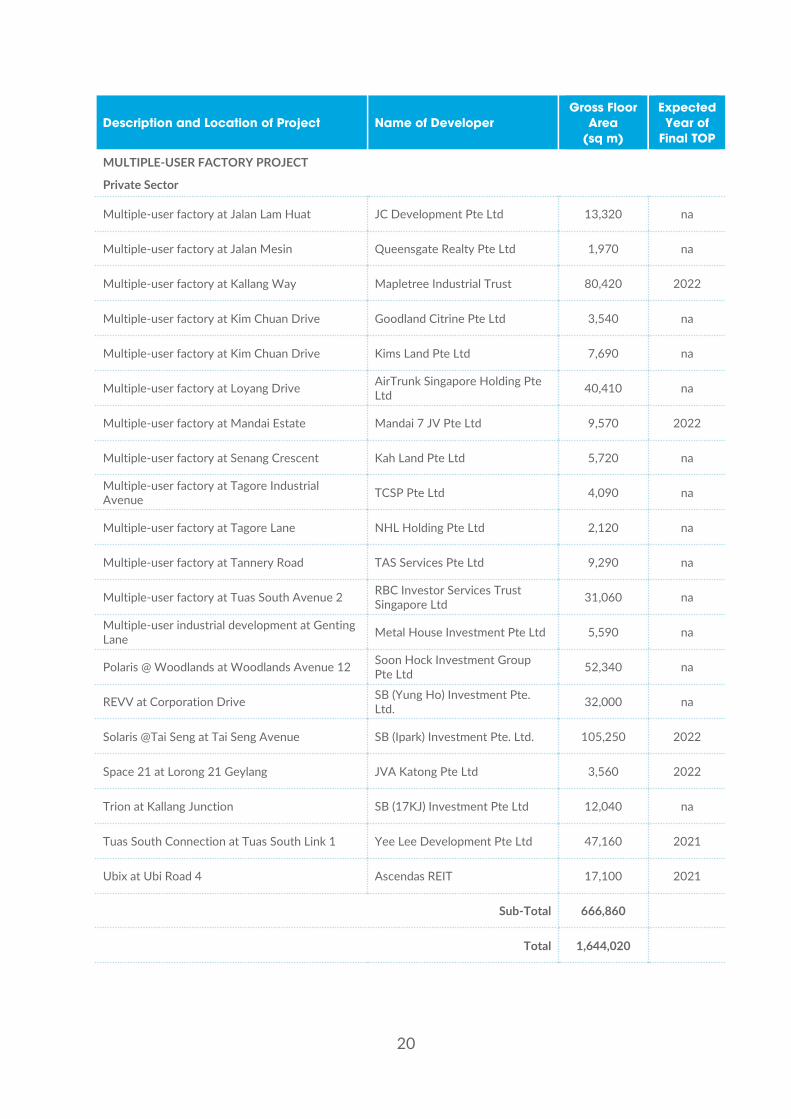
Description and Location of Project Name of Developer Gross Floor
Area (sq m)
Expected Year of
Final TOP
MULTIPLE-USER FACTORY PROJECT
Private Sector
Multiple-user factory at Jalan Lam Huat JC Development Pte Ltd 13,320 na
Multiple-user factory at Jalan Mesin Queensgate Realty Pte Ltd 1,970 na
Multiple-user factory at Kallang Way Mapletree Industrial Trust 80,420 2022
Multiple-user factory at Kim Chuan Drive Goodland Citrine Pte Ltd 3,540 na
Multiple-user factory at Kim Chuan Drive Kims Land Pte Ltd 7,690 na
Multiple-user factory at Loyang Drive AirTrunk Singapore Holding Pte Ltd 40,410 na
Multiple-user factory at Mandai Estate Mandai 7 JV Pte Ltd 9,570 2022
Multiple-user factory at Senang Crescent Kah Land Pte Ltd 5,720 na
Multiple-user factory at Tagore Industrial Avenue TCSP Pte Ltd 4,090 na
Multiple-user factory at Tagore Lane NHL Holding Pte Ltd 2,120 na
Multiple-user factory at Tannery Road TAS Services Pte Ltd 9,290 na
Multiple-user factory at Tuas South Avenue 2 RBC Investor Services Trust Singapore Ltd 31,060 na
Multiple-user industrial development at Genting Lane Metal House Investment Pte Ltd 5,590 na
Polaris @ Woodlands at Woodlands Avenue 12 Soon Hock Investment Group Pte Ltd 52,340 na
REVV at Corporation Drive SB (Yung Ho) Investment Pte. Ltd. 32,000 na
Solaris @Tai Seng at Tai Seng Avenue SB (Ipark) Investment Pte. Ltd. 105,250 2022
Space 21 at Lorong 21 Geylang JVA Katong Pte Ltd 3,560 2022
Trion at Kallang Junction SB (17KJ) Investment Pte Ltd 12,040 na
Tuas South Connection at Tuas South Link 1 Yee Lee Development Pte Ltd 47,160 2021
Ubix at Ubi Road 4 Ascendas REIT 17,100 2021
Sub-Total 666,860
Total 1,644,020

21
Description and Location of Project Name of Developer Gross Floor
Area (sq m)
Expected Year of
Final TOP
SINGLE-USER FACTORY PROJECT
Private Sector Additions/alterations to existing factory at Jurong Island Highway ExxonMobil Asia Pacific Pte Ltd 19,230 na
Additions/alterations to existing factory at North Coast Drive
Micron Semiconductor Asia Operations Pte Ltd 20 2021
Additions/alterations to existing factory at North Coast Drive
Micron Semiconductor Asia Operations Pte Ltd 34,130 2021
Additions/alterations to existing factory at North Coast Drive
Micron Semiconductor Asia Operations Pte Ltd 48,960 na
Additions/alterations to existing factory at Pioneer Road Antara Koh Pte Ltd 11,300 2021
Additions/alterations to existing factory at Pioneer Sector 3 Greif Singapore Pte. Ltd. 7,820 na
Additions/alterations to existing factory at Seraya Place Coim Asia Pacific Pte Ltd 13,290 na
Additions/alterations to existing factory at Tuas Avenue 2
Becton Dickinson Medical (S) Pte Ltd 8,630 2021
Additions/alterations to existing factory at Tuas Bay Drive Pacific Refreshments Pte Ltd 8,490 na
Additions/alterations to existing factory at Tuas South Avenue 6
Pfizer Asia Manufacturing Pte Ltd 44,990 na
Additions/alterations to existing factory at Tuas South Lane Neste Singapore Pte Ltd 31,400 na
Additions/alterations to existing industrial development at Pioneer Road ExxonMobil Asia Pacific Pte Ltd 11,670 na
Additions/alterations to existing industrial development at Tuas South Boulevard Jurong Shipyard Pte Ltd 27,150 na
Excel Centre at Seletar Aerospace Avenue Excel Venture Capital Pte Ltd 10,320 na
Extension to existing factory at Ang Mo Kio Street 64 United Engineers Limited 60,180 na
Koufu Group HQ at Woodlands Height Koufu Pte Ltd 20,390 na
Minwu Industrial Building at Genting Lane Spireworks 1 Pte Ltd 1,510 na
Paradise Group HQ at Defu Lane 10 Paradise Group Holdings Pte Ltd 8,570 na
Samwoh Smart Hub at Kranji Way Samwoh Corporation Pte Ltd 32,150 na
Singapore Gems Building at Kung Chong Road Regal Haus Pte Ltd 2,200 na
Single-user factory at Ayer Merbau Road Baker Hughes Services Pte Ltd 4,140 na
Single-user factory at Benoi Road JP Nelson Equipment Pte Ltd 14,040 na
Single-user factory at Bulim Avenue Hyundai Motor Singapore Pte Ltd 86,900 na
Single-user factory at Chin Bee Road Lim Traders Pte. Ltd. 5,990 na
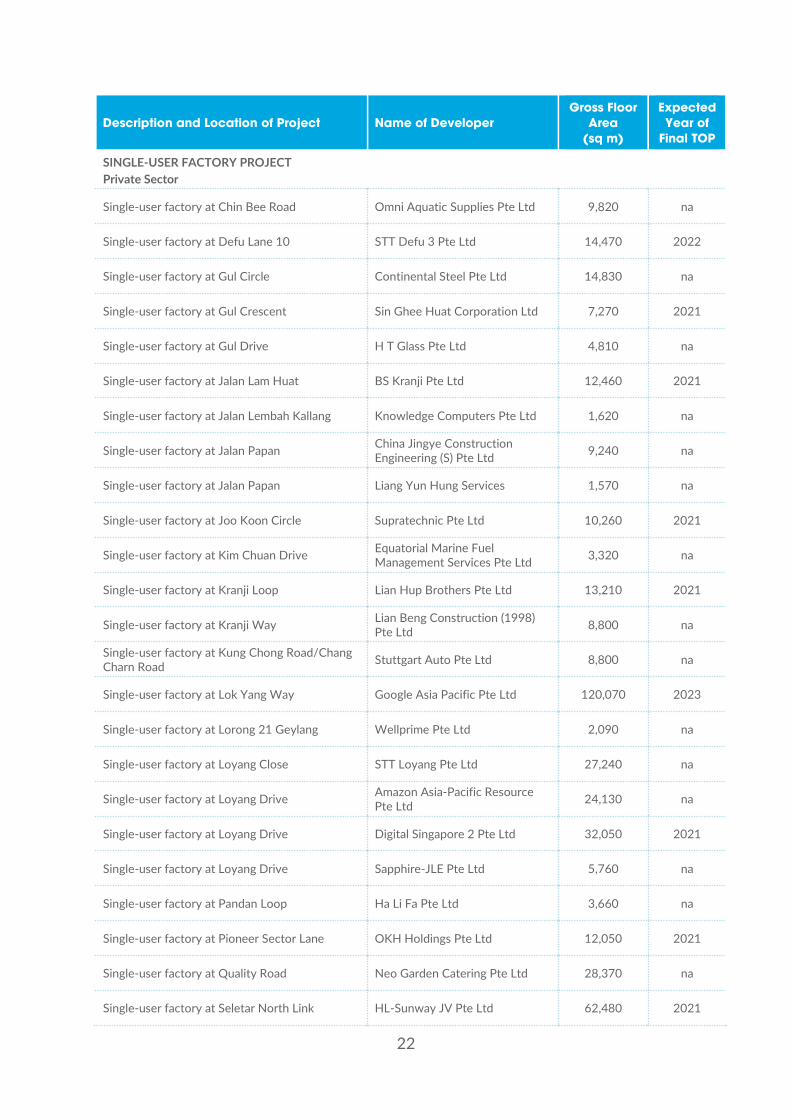
22
Description and Location of Project Name of Developer Gross Floor
Area (sq m)
Expected Year of
Final TOP
SINGLE-USER FACTORY PROJECT Private Sector
Single-user factory at Chin Bee Road Omni Aquatic Supplies Pte Ltd 9,820 na
Single-user factory at Defu Lane 10 STT Defu 3 Pte Ltd 14,470 2022
Single-user factory at Gul Circle Continental Steel Pte Ltd 14,830 na
Single-user factory at Gul Crescent Sin Ghee Huat Corporation Ltd 7,270 2021
Single-user factory at Gul Drive H T Glass Pte Ltd 4,810 na
Single-user factory at Jalan Lam Huat BS Kranji Pte Ltd 12,460 2021
Single-user factory at Jalan Lembah Kallang Knowledge Computers Pte Ltd 1,620 na
Single-user factory at Jalan Papan China Jingye Construction Engineering (S) Pte Ltd 9,240 na
Single-user factory at Jalan Papan Liang Yun Hung Services 1,570 na
Single-user factory at Joo Koon Circle Supratechnic Pte Ltd 10,260 2021
Single-user factory at Kim Chuan Drive Equatorial Marine Fuel Management Services Pte Ltd 3,320 na
Single-user factory at Kranji Loop Lian Hup Brothers Pte Ltd 13,210 2021
Single-user factory at Kranji Way Lian Beng Construction (1998) Pte Ltd 8,800 na
Single-user factory at Kung Chong Road/Chang Charn Road Stuttgart Auto Pte Ltd 8,800 na
Single-user factory at Lok Yang Way Google Asia Pacific Pte Ltd 120,070 2023
Single-user factory at Lorong 21 Geylang Wellprime Pte Ltd 2,090 na
Single-user factory at Loyang Close STT Loyang Pte Ltd 27,240 na
Single-user factory at Loyang Drive Amazon Asia-Pacific Resource Pte Ltd 24,130 na
Single-user factory at Loyang Drive Digital Singapore 2 Pte Ltd 32,050 2021
Single-user factory at Loyang Drive Sapphire-JLE Pte Ltd 5,760 na
Single-user factory at Pandan Loop Ha Li Fa Pte Ltd 3,660 na
Single-user factory at Pioneer Sector Lane OKH Holdings Pte Ltd 12,050 2021
Single-user factory at Quality Road Neo Garden Catering Pte Ltd 28,370 na
Single-user factory at Seletar North Link HL-Sunway JV Pte Ltd 62,480 2021
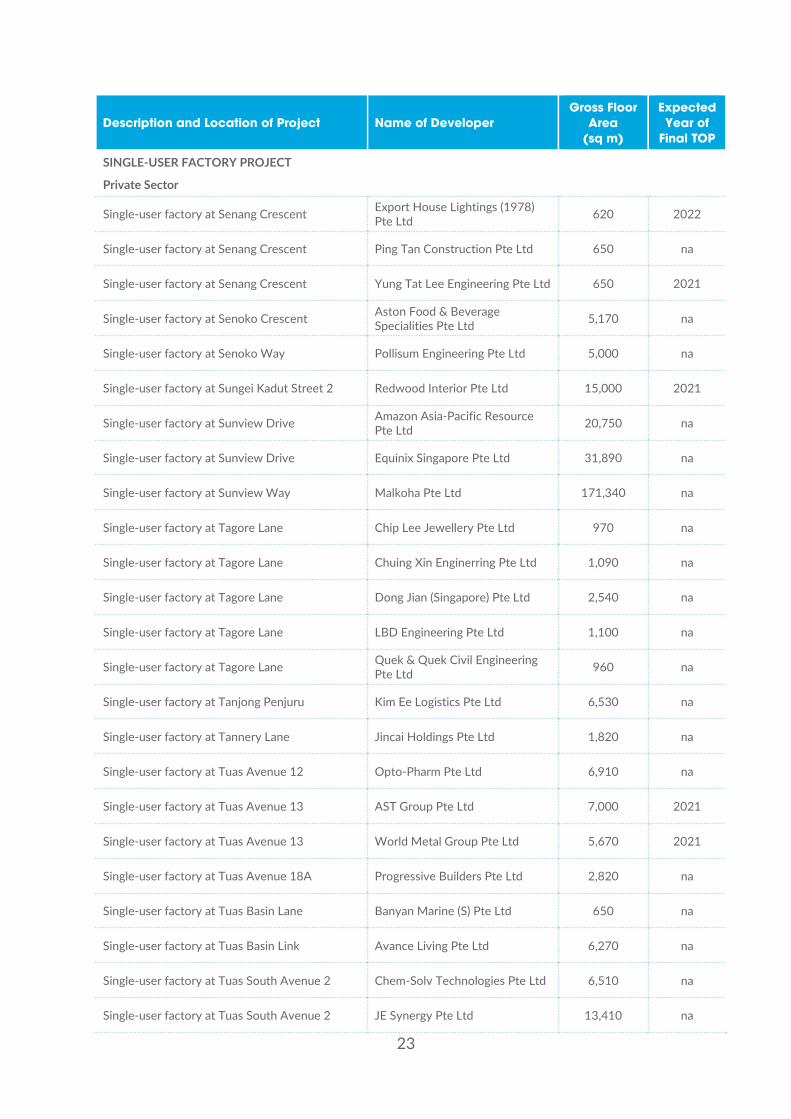
23
Description and Location of Project Name of Developer Gross Floor
Area (sq m)
Expected Year of
Final TOP
SINGLE-USER FACTORY PROJECT
Private Sector
Single-user factory at Senang Crescent Export House Lightings (1978) Pte Ltd 620 2022
Single-user factory at Senang Crescent Ping Tan Construction Pte Ltd 650 na
Single-user factory at Senang Crescent Yung Tat Lee Engineering Pte Ltd 650 2021
Single-user factory at Senoko Crescent Aston Food & Beverage Specialities Pte Ltd 5,170 na
Single-user factory at Senoko Way Pollisum Engineering Pte Ltd 5,000 na
Single-user factory at Sungei Kadut Street 2 Redwood Interior Pte Ltd 15,000 2021
Single-user factory at Sunview Drive Amazon Asia-Pacific Resource Pte Ltd 20,750 na
Single-user factory at Sunview Drive Equinix Singapore Pte Ltd 31,890 na
Single-user factory at Sunview Way Malkoha Pte Ltd 171,340 na
Single-user factory at Tagore Lane Chip Lee Jewellery Pte Ltd 970 na
Single-user factory at Tagore Lane Chuing Xin Enginerring Pte Ltd 1,090 na
Single-user factory at Tagore Lane Dong Jian (Singapore) Pte Ltd 2,540 na
Single-user factory at Tagore Lane LBD Engineering Pte Ltd 1,100 na
Single-user factory at Tagore Lane Quek & Quek Civil Engineering Pte Ltd 960 na
Single-user factory at Tanjong Penjuru Kim Ee Logistics Pte Ltd 6,530 na
Single-user factory at Tannery Lane Jincai Holdings Pte Ltd 1,820 na
Single-user factory at Tuas Avenue 12 Opto-Pharm Pte Ltd 6,910 na
Single-user factory at Tuas Avenue 13 AST Group Pte Ltd 7,000 2021
Single-user factory at Tuas Avenue 13 World Metal Group Pte Ltd 5,670 2021
Single-user factory at Tuas Avenue 18A Progressive Builders Pte Ltd 2,820 na
Single-user factory at Tuas Basin Lane Banyan Marine (S) Pte Ltd 650 na
Single-user factory at Tuas Basin Link Avance Living Pte Ltd 6,270 na
Single-user factory at Tuas South Avenue 2 Chem-Solv Technologies Pte Ltd 6,510 na
Single-user factory at Tuas South Avenue 2 JE Synergy Pte Ltd 13,410 na
24
Description and Location of Project Name of Developer Gross Floor
Area (sq m)
Expected Year of
Final TOP
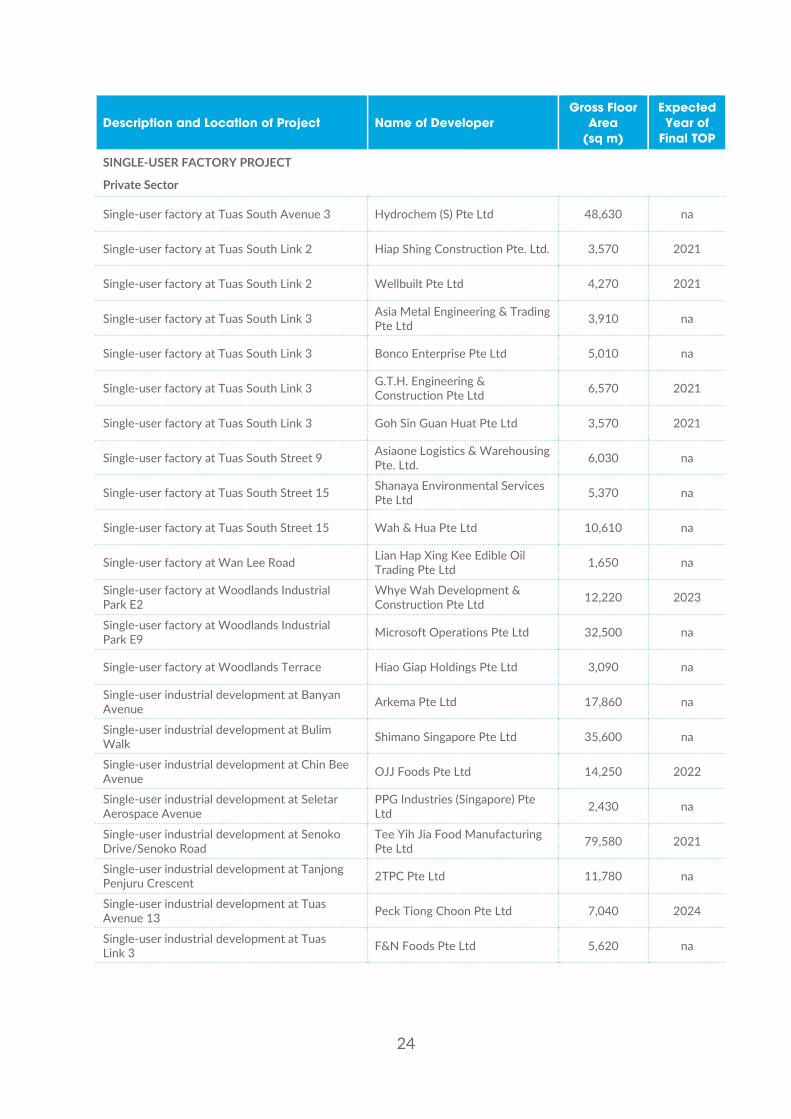
SINGLE-USER FACTORY PROJECT
Private Sector
Single-user factory at Tuas South Avenue 3 Hydrochem (S) Pte Ltd 48,630 na
Single-user factory at Tuas South Link 2 Hiap Shing Construction Pte. Ltd. 3,570 2021
Single-user factory at Tuas South Link 2 Wellbuilt Pte Ltd 4,270 2021
Single-user factory at Tuas South Link 3 Asia Metal Engineering & Trading Pte Ltd 3,910 na
Single-user factory at Tuas South Link 3 Bonco Enterprise Pte Ltd 5,010 na
Single-user factory at Tuas South Link 3 G.T.H. Engineering & Construction Pte Ltd 6,570 2021
Single-user factory at Tuas South Link 3 Goh Sin Guan Huat Pte Ltd 3,570 2021
Single-user factory at Tuas South Street 9 Asiaone Logistics & Warehousing Pte. Ltd. 6,030 na
Single-user factory at Tuas South Street 15 Shanaya Environmental Services Pte Ltd 5,370 na
Single-user factory at Tuas South Street 15 Wah & Hua Pte Ltd 10,610 na
Single-user factory at Wan Lee Road Lian Hap Xing Kee Edible Oil Trading Pte Ltd 1,650 na
Single-user factory at Woodlands Industrial Park E2
Whye Wah Development & Construction Pte Ltd 12,220 2023
Single-user factory at Woodlands Industrial Park E9 Microsoft Operations Pte Ltd 32,500 na
Single-user factory at Woodlands Terrace Hiao Giap Holdings Pte Ltd 3,090 na
Single-user industrial development at Banyan Avenue Arkema Pte Ltd 17,860 na
Single-user industrial development at Bulim Walk Shimano Singapore Pte Ltd 35,600 na
Single-user industrial development at Chin Bee Avenue OJJ Foods Pte Ltd 14,250 2022
Single-user industrial development at Seletar Aerospace Avenue
PPG Industries (Singapore) Pte Ltd 2,430 na
Single-user industrial development at Senoko Drive/Senoko Road
Tee Yih Jia Food Manufacturing Pte Ltd 79,580 2021
Single-user industrial development at Tanjong Penjuru Crescent 2TPC Pte Ltd 11,780 na
Single-user industrial development at Tuas Avenue 13 Peck Tiong Choon Pte Ltd 7,040 2024
Single-user industrial development at Tuas Link 3 F&N Foods Pte Ltd 5,620 na
25
Description and Location of Project Name of Developer Gross Floor
Area (sq m)
Expected Year of
Final TOP
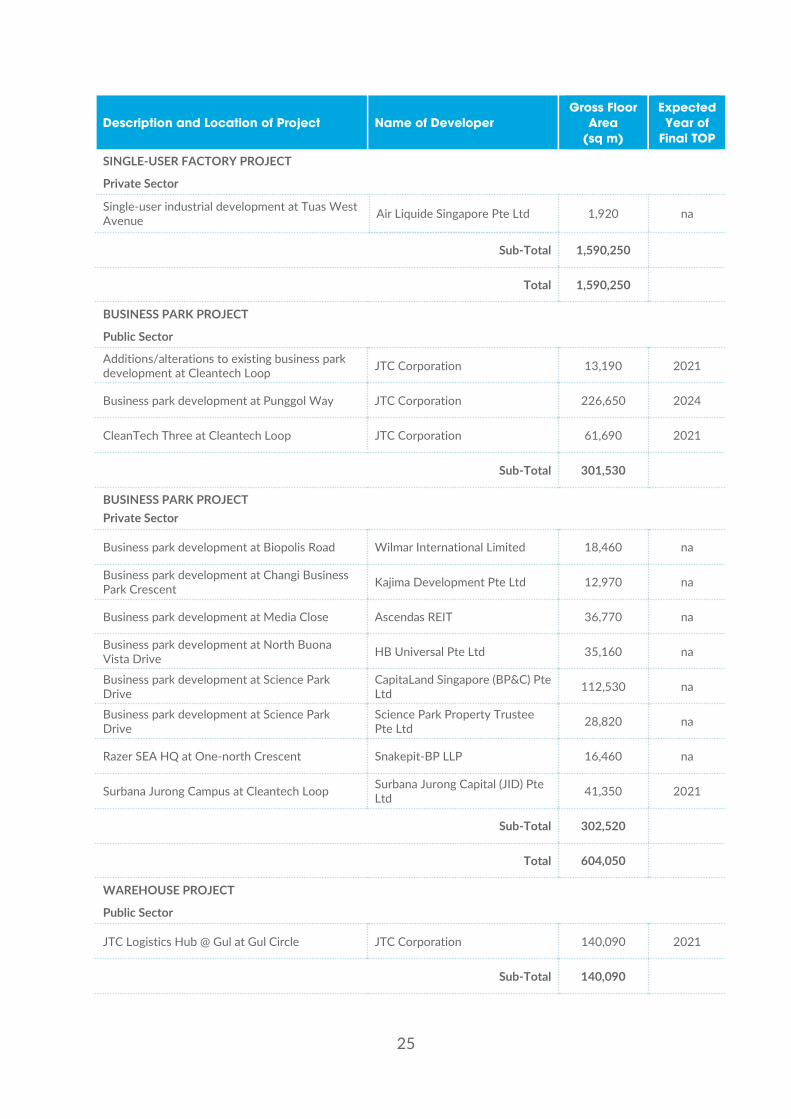
SINGLE-USER FACTORY PROJECT
Private Sector
Single-user industrial development at Tuas West Avenue Air Liquide Singapore Pte Ltd 1,920 na
Sub-Total 1,590,250
Total 1,590,250
BUSINESS PARK PROJECT
Public Sector
Additions/alterations to existing business park development at Cleantech Loop JTC Corporation 13,190 2021
Business park development at Punggol Way JTC Corporation 226,650 2024
CleanTech Three at Cleantech Loop JTC Corporation 61,690 2021
Sub-Total 301,530
BUSINESS PARK PROJECT Private Sector
Business park development at Biopolis Road Wilmar International Limited 18,460 na
Business park development at Changi Business Park Crescent Kajima Development Pte Ltd 12,970 na
Business park development at Media Close Ascendas REIT 36,770 na
Business park development at North Buona Vista Drive HB Universal Pte Ltd 35,160 na
Business park development at Science Park Drive
CapitaLand Singapore (BP&C) Pte Ltd 112,530 na
Business park development at Science Park Drive
Science Park Property Trustee Pte Ltd 28,820 na
Razer SEA HQ at One-north Crescent Snakepit-BP LLP 16,460 na
Surbana Jurong Campus at Cleantech Loop Surbana Jurong Capital (JID) Pte Ltd 41,350 2021
Sub-Total 302,520
Total 604,050
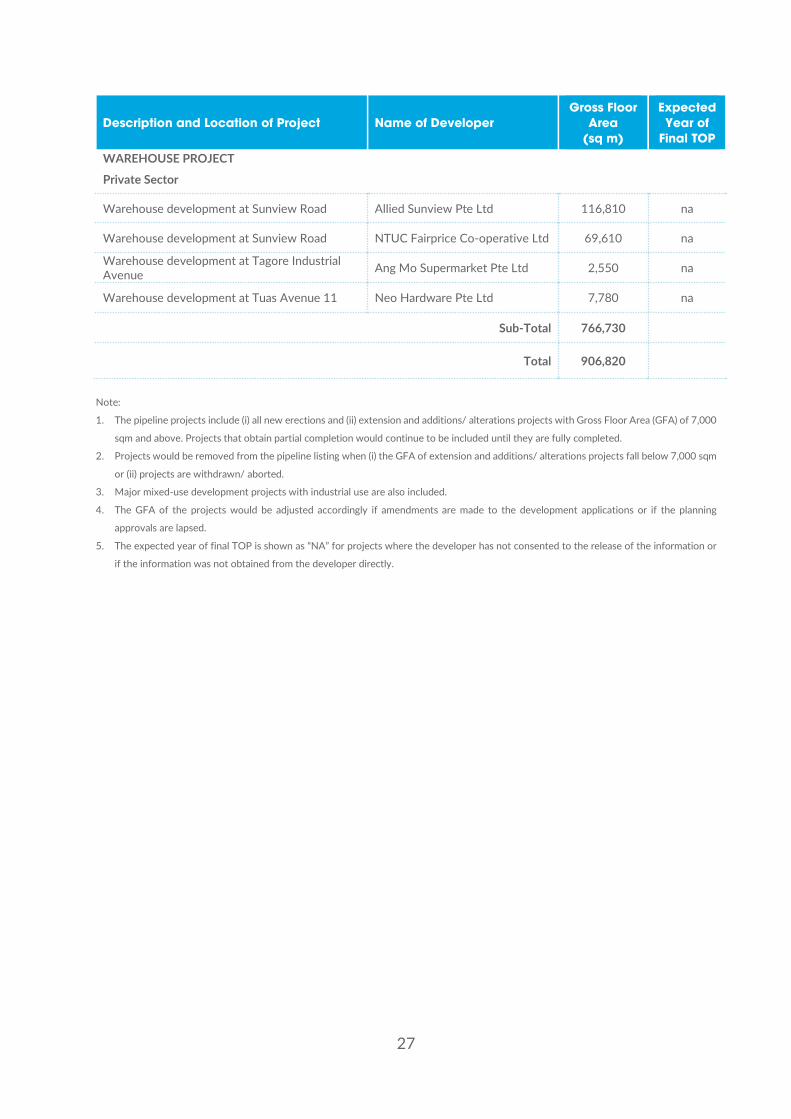
WAREHOUSE PROJECT
Public Sector
JTC Logistics Hub @ Gul at Gul Circle JTC Corporation 140,090 2021
Sub-Total 140,090
26
Description and Location of Project Name of Developer Gross Floor
Area (sq m)
Expected Year of
Final TOP
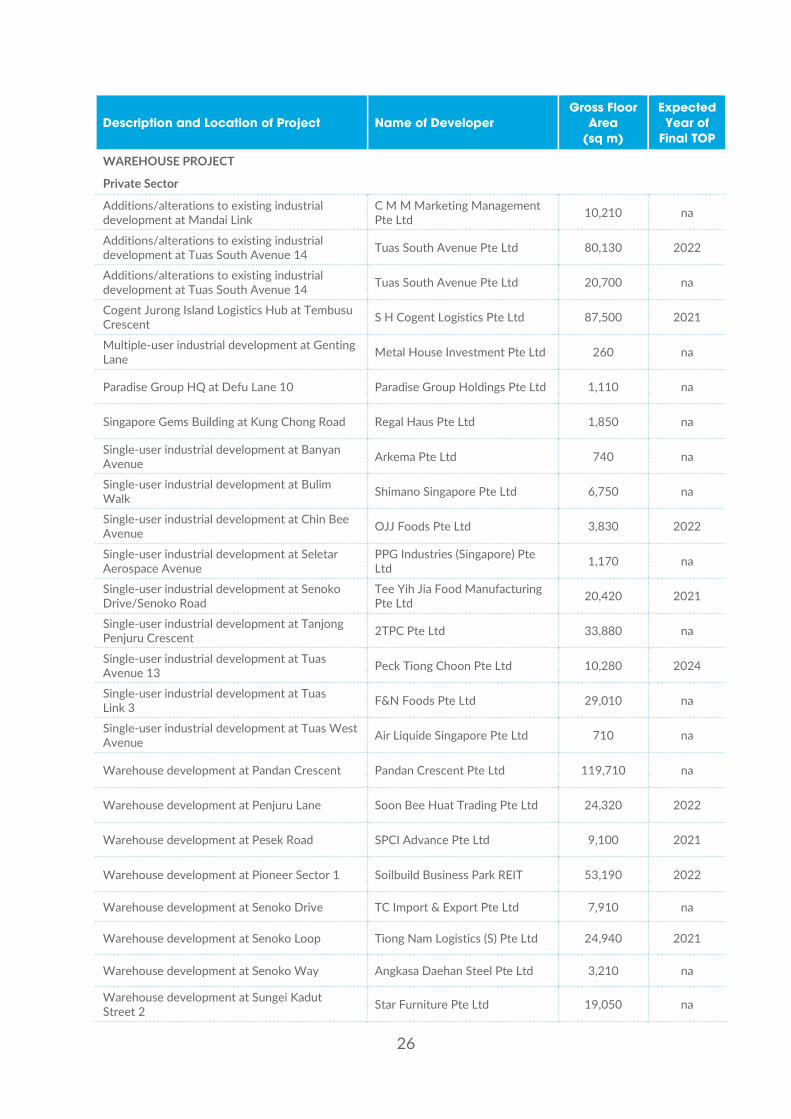
WAREHOUSE PROJECT
Private Sector
Additions/alterations to existing industrial development at Mandai Link
C M M Marketing Management Pte Ltd 10,210 na
Additions/alterations to existing industrial development at Tuas South Avenue 14 Tuas South Avenue Pte Ltd 80,130 2022
Additions/alterations to existing industrial development at Tuas South Avenue 14 Tuas South Avenue Pte Ltd 20,700 na
Cogent Jurong Island Logistics Hub at Tembusu Crescent S H Cogent Logistics Pte Ltd 87,500 2021
Multiple-user industrial development at Genting Lane Metal House Investment Pte Ltd 260 na
Paradise Group HQ at Defu Lane 10 Paradise Group Holdings Pte Ltd 1,110 na
Singapore Gems Building at Kung Chong Road Regal Haus Pte Ltd 1,850 na
Single-user industrial development at Banyan Avenue Arkema Pte Ltd 740 na
Single-user industrial development at Bulim Walk Shimano Singapore Pte Ltd 6,750 na
Single-user industrial development at Chin Bee Avenue OJJ Foods Pte Ltd 3,830 2022
Single-user industrial development at Seletar Aerospace Avenue
PPG Industries (Singapore) Pte Ltd 1,170 na
Single-user industrial development at Senoko Drive/Senoko Road
Tee Yih Jia Food Manufacturing Pte Ltd 20,420 2021
Single-user industrial development at Tanjong Penjuru Crescent 2TPC Pte Ltd 33,880 na
Single-user industrial development at Tuas Avenue 13 Peck Tiong Choon Pte Ltd 10,280 2024
Single-user industrial development at Tuas Link 3 F&N Foods Pte Ltd 29,010 na
Single-user industrial development at Tuas West Avenue Air Liquide Singapore Pte Ltd 710 na
Warehouse development at Pandan Crescent Pandan Crescent Pte Ltd 119,710 na
Warehouse development at Penjuru Lane Soon Bee Huat Trading Pte Ltd 24,320 2022
Warehouse development at Pesek Road SPCI Advance Pte Ltd 9,100 2021
Warehouse development at Pioneer Sector 1 Soilbuild Business Park REIT 53,190 2022
Warehouse development at Senoko Drive TC Import & Export Pte Ltd 7,910 na
Warehouse development at Senoko Loop Tiong Nam Logistics (S) Pte Ltd 24,940 2021
Warehouse development at Senoko Way Angkasa Daehan Steel Pte Ltd 3,210 na
Warehouse development at Sungei Kadut Street 2 Star Furniture Pte Ltd 19,050 na
27
Description and Location of Project Name of Developer Gross Floor
Area (sq m)
Expected Year of
Final TOP
WAREHOUSE PROJECT
Private Sector
Warehouse development at Sunview Road Allied Sunview Pte Ltd 116,810 na
Warehouse development at Sunview Road NTUC Fairprice Co-operative Ltd 69,610 na
Warehouse development at Tagore Industrial Avenue Ang Mo Supermarket Pte Ltd 2,550 na
Warehouse development at Tuas Avenue 11 Neo Hardware Pte Ltd 7,780 na
Sub-Total 766,730
Total 906,820
Note:
1. The pipeline projects include (i) all new erections and (ii) extension and additions/ alterations projects with Gross Floor Area (GFA) of 7,000
sqm and above. Projects that obtain partial completion would continue to be included until they are fully completed.
2. Projects would be removed from the pipeline listing when (i) the GFA of extension and additions/ alterations projects fall below 7,000 sqm
or (ii) projects are withdrawn/ aborted.
3. Major mixed-use development projects with industrial use are also included.
4. The GFA of the projects would be adjusted accordingly if amendments are made to the development applications or if the planning
approvals are lapsed.
5. The expected year of final TOP is shown as “NA” for projects where the developer has not consented to the release of the information or
if the information was not obtained from the developer directly.

28
Annex B: Statistics on JTC’s Prepared Industrial Land and Ready-Built Facilities
Table 1: Gross Allocation and Returns by Product Segment (4Q 2019 – 4Q 2020)
Gross Allocation Returns
4Q2019
1Q 2020
2Q 2020
3Q 2020
4Q 2020
4Q 2019
1Q 2020
2Q 2020
3Q 2020
4Q 2020
Prepared Industrial Land (ha)
Total1 39.6 87.1 48.2 41.1 22.5 29.4 66.6 38.7 17.2 25.4
Generic Land 14.6 27.2 31.5 19.2 5.7 21.8 44.4 20.7 15.7 13.5
Tuas Biomedical Park - - - 16.2 12.9 - 8.8 - - 7.5
Jurong Island 24.8 42.7 16.2 4.4 1.4 7.6 12.0 17.4 1.3 1.3
Wafer Fab Park - 0.2 0.6 - - - 1.2 0.5 0.1 -
Business Park 0.2 17.0 - 1.4 - - 0.1 - - 3.0
Logistics Park - - - - 2.6 - - - - - Seletar Aerospace Park 0.0 - - - - 0.0 - - 0.2 -
Ready-Built Facilities (‘000 sqm)
Total 51.9 59.5 106.3 50.9 38.0 53.4 44.3 38.1 38.8 55.1 High-Rise Space 27.4 32.8 43.3 38.2 27.7 26.0 27.6 26.8 26.3 27.0
Business Park Space 1.2 2.7 0.7 1.8 1.9 0.7 5.8 0.4 1.8 0.7
Land-Based Factory 19.0 19.7 57.1 8.2 3.4 17.6 4.2 5.2 4.5 20.7
Workshop Space 4.4 4.3 5.2 2.6 5.1 9.1 6.8 5.6 6.2 6.7
Note:
1. Excludes Prepared Industrial Land that is tendered out as part of the IGLS programme.
29
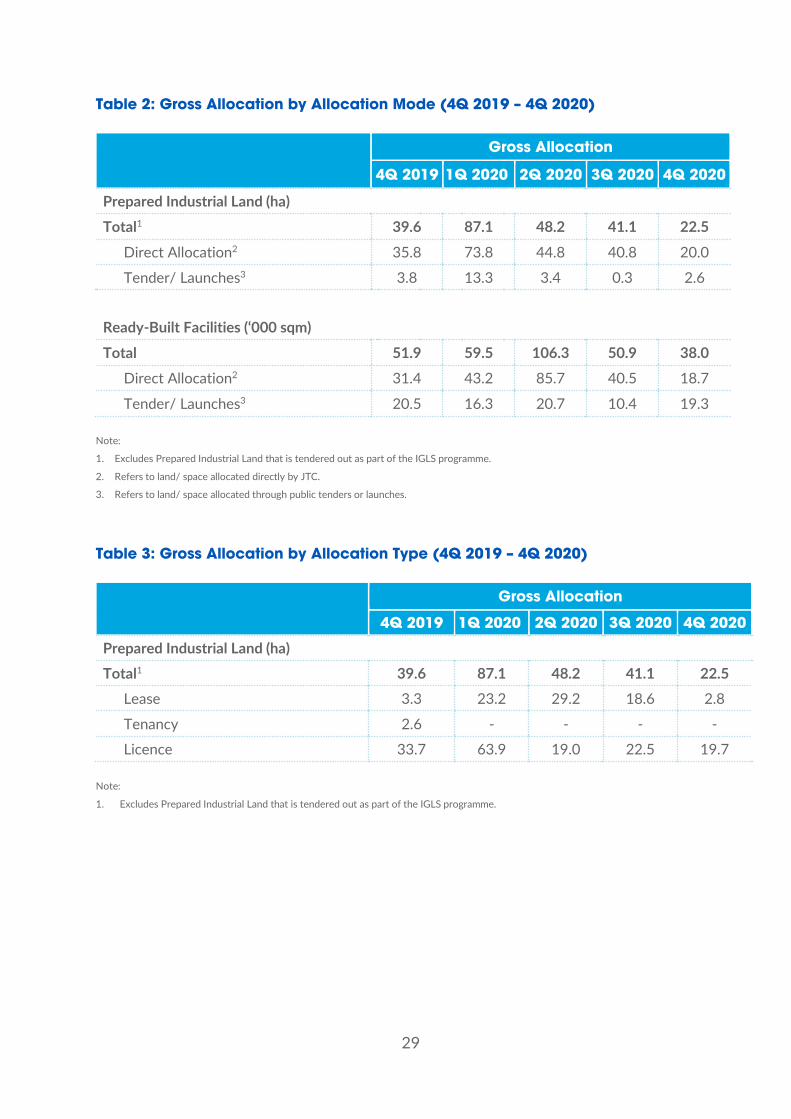
Table 2: Gross Allocation by Allocation Mode (4Q 2019 – 4Q 2020)
Gross Allocation
4Q 2019 1Q 2020 2Q 2020 3Q 2020 4Q 2020
Prepared Industrial Land (ha) Total1 39.6 87.1 48.2 41.1 22.5
Direct Allocation2 35.8 73.8 44.8 40.8 20.0
Tender/ Launches3 3.8 13.3 3.4 0.3 2.6
Ready-Built Facilities (‘000 sqm)
Total 51.9 59.5 106.3 50.9 38.0 Direct Allocation2 31.4 43.2 85.7 40.5 18.7
Tender/ Launches3 20.5 16.3 20.7 10.4 19.3
Note:
1. Excludes Prepared Industrial Land that is tendered out as part of the IGLS programme.
2. Refers to land/ space allocated directly by JTC.
3. Refers to land/ space allocated through public tenders or launches.
Table 3: Gross Allocation by Allocation Type (4Q 2019 – 4Q 2020)
Gross Allocation
4Q 2019 1Q 2020 2Q 2020 3Q 2020 4Q 2020
Prepared Industrial Land (ha) Total1 39.6 87.1 48.2 41.1 22.5
Lease 3.3 23.2 29.2 18.6 2.8
Tenancy 2.6 - - - -
Licence 33.7 63.9 19.0 22.5 19.7
Note:
1. Excludes Prepared Industrial Land that is tendered out as part of the IGLS programme.
30
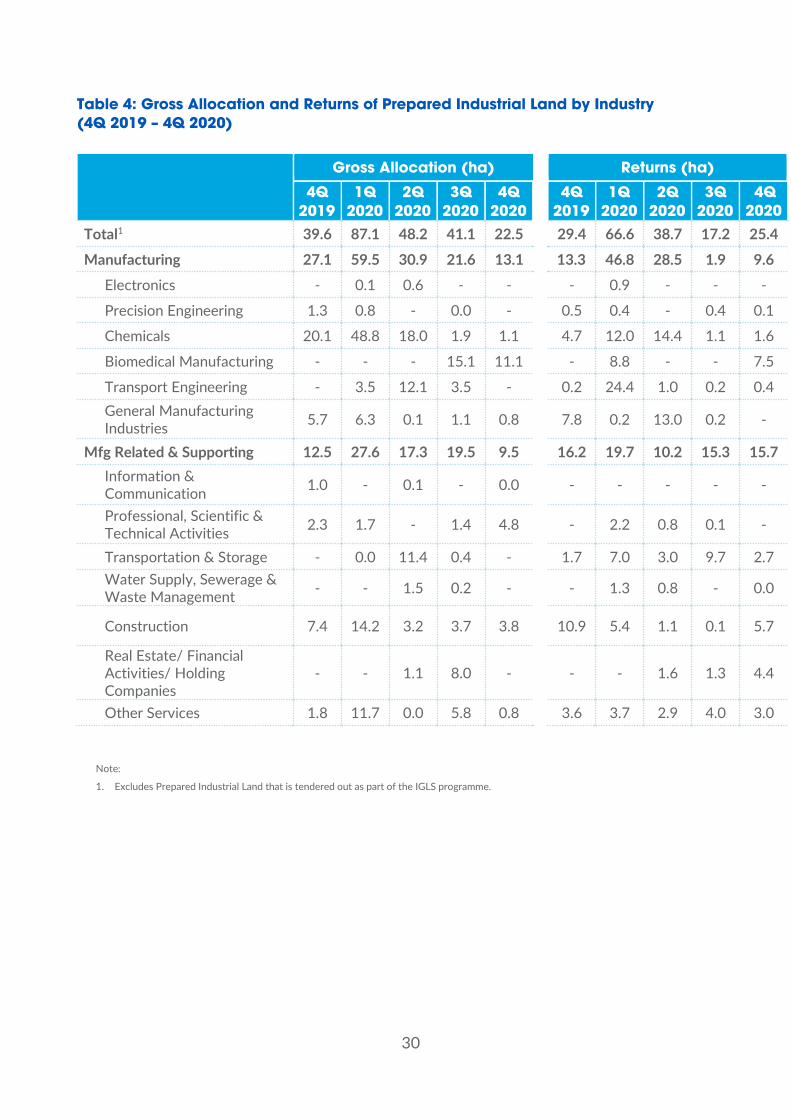
Table 4: Gross Allocation and Returns of Prepared Industrial Land by Industry (4Q 2019 – 4Q 2020)
Note:
1. Excludes Prepared Industrial Land that is tendered out as part of the IGLS programme.
Gross Allocation (ha) Returns (ha)
4Q 2019
1Q 2020
2Q 2020
3Q 2020
4Q 2020
4Q 2019
1Q 2020
2Q 2020
3Q 2020
4Q 2020
Total1 39.6 87.1 48.2 41.1 22.5 29.4 66.6 38.7 17.2 25.4
Manufacturing 27.1 59.5 30.9 21.6 13.1 13.3 46.8 28.5 1.9 9.6 Electronics - 0.1 0.6 - - - 0.9 - - -
Precision Engineering 1.3 0.8 - 0.0 - 0.5 0.4 - 0.4 0.1
Chemicals 20.1 48.8 18.0 1.9 1.1 4.7 12.0 14.4 1.1 1.6
Biomedical Manufacturing - - - 15.1 11.1 - 8.8 - - 7.5
Transport Engineering - 3.5 12.1 3.5 - 0.2 24.4 1.0 0.2 0.4 General Manufacturing Industries 5.7 6.3 0.1 1.1 0.8 7.8 0.2 13.0 0.2 -
Mfg Related & Supporting 12.5 27.6 17.3 19.5 9.5 16.2 19.7 10.2 15.3 15.7 Information & Communication 1.0 - 0.1 - 0.0 - - - - -
Professional, Scientific & Technical Activities 2.3 1.7 - 1.4 4.8 - 2.2 0.8 0.1 -
Transportation & Storage - 0.0 11.4 0.4 - 1.7 7.0 3.0 9.7 2.7 Water Supply, Sewerage & Waste Management - - 1.5 0.2 - - 1.3 0.8 - 0.0
Construction 7.4 14.2 3.2 3.7 3.8 10.9 5.4 1.1 0.1 5.7
Real Estate/ Financial Activities/ Holding Companies
- - 1.1 8.0 - - - 1.6 1.3 4.4
Other Services 1.8 11.7 0.0 5.8 0.8 3.6 3.7 2.9 4.0 3.0
31
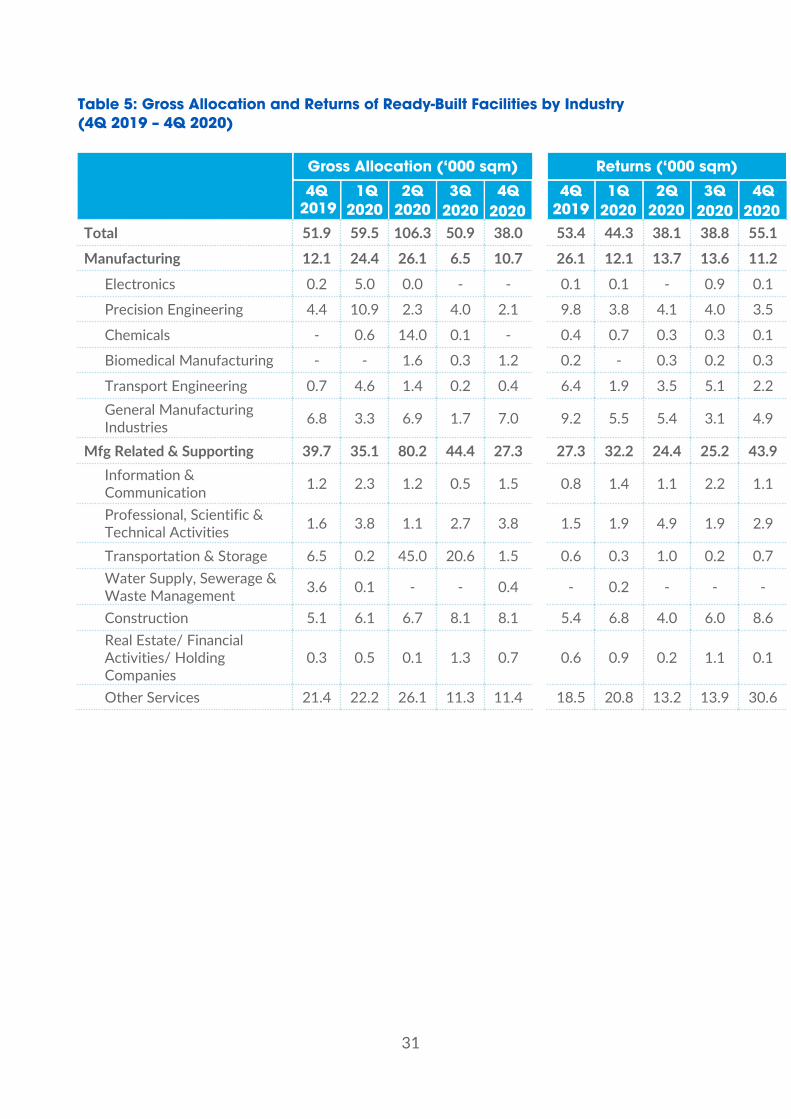
Table 5: Gross Allocation and Returns of Ready-Built Facilities by Industry (4Q 2019 – 4Q 2020)
Gross Allocation (‘000 sqm) Returns (‘000 sqm)
4Q 2019
1Q2020
2Q 2020
3Q 2020
4Q 2020
4Q 2019
1Q2020
2Q 2020
3Q 2020
4Q
Total 51.9 59.5 106.3 50.9 38.0 53.4 44.3 38.1 38.8 55.1
Manufacturing 12.1 24.4 26.1 6.5 10.7 26.1 12.1 13.7 13.6 11.2
Electronics 0.2 5.0 0.0 - - 0.1 0.1 - 0.9 0.1
Precision Engineering 4.4 10.9 2.3 4.0 2.1 9.8 3.8 4.1 4.0 3.5
Chemicals - 0.6 14.0 0.1 - 0.4 0.7 0.3 0.3 0.1
Biomedical Manufacturing - - 1.6 0.3 1.2 0.2 - 0.3 0.2 0.3
Transport Engineering 0.7 4.6 1.4 0.2 0.4 6.4 1.9 3.5 5.1 2.2 General Manufacturing Industries 6.8 3.3 6.9 1.7 7.0 9.2 5.5 5.4 3.1 4.9
Mfg Related & Supporting 39.7 35.1 80.2 44.4 27.3 27.3 32.2 24.4 25.2 43.9 Information & Communication 1.2 2.3 1.2 0.5 1.5 0.8 1.4 1.1 2.2 1.1
Professional, Scientific & Technical Activities 1.6 3.8 1.1 2.7 3.8 1.5 1.9 4.9 1.9 2.9
Transportation & Storage 6.5 0.2 45.0 20.6 1.5 0.6 0.3 1.0 0.2 0.7 Water Supply, Sewerage & Waste Management 3.6 0.1 - - 0.4 - 0.2 - - -
Construction 5.1 6.1 6.7 8.1 8.1 5.4 6.8 4.0 6.0 8.6 Real Estate/ Financial Activities/ Holding Companies
0.3 0.5 0.1 1.3 0.7 0.6 0.9 0.2 1.1 0.1
Other Services 21.4 22.2 26.1 11.3 11.4 18.5 20.8 13.2 13.9 30.6
2020
32
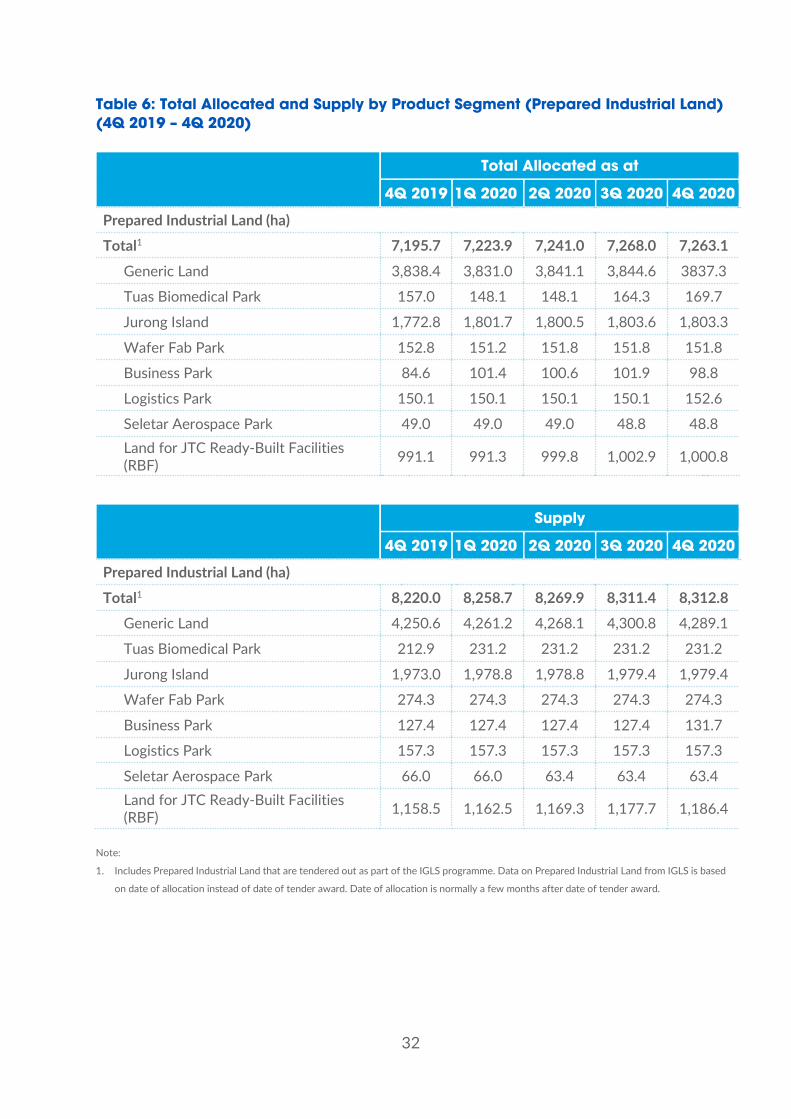
Table 6: Total Allocated and Supply by Product Segment (Prepared Industrial Land) (4Q 2019 – 4Q 2020)
Total Allocated as at
4Q 2019 1Q 2020 2Q 2020 3Q 2020 4Q 2020
Prepared Industrial Land (ha) Total1 7,195.7 7,223.9 7,241.0 7,268.0 7,263.1
Generic Land 3,838.4 3,831.0 3,841.1 3,844.6 3837.3
Tuas Biomedical Park 157.0 148.1 148.1 164.3 169.7
Jurong Island 1,772.8 1,801.7 1,800.5 1,803.6 1,803.3
Wafer Fab Park 152.8 151.2 151.8 151.8 151.8
Business Park 84.6 101.4 100.6 101.9 98.8
Logistics Park 150.1 150.1 150.1 150.1 152.6
Seletar Aerospace Park 49.0 49.0 49.0 48.8 48.8 Land for JTC Ready-Built Facilities (RBF) 991.1 991.3 999.8 1,002.9 1,000.8
Supply
4Q 2019 1Q 2020 2Q 2020 3Q 2020 4Q 2020
Prepared Industrial Land (ha)
Total1 8,220.0 8,258.7 8,269.9 8,311.4 8,312.8 Generic Land 4,250.6 4,261.2 4,268.1 4,300.8 4,289.1
Tuas Biomedical Park 212.9 231.2 231.2 231.2 231.2
Jurong Island 1,973.0 1,978.8 1,978.8 1,979.4 1,979.4
Wafer Fab Park 274.3 274.3 274.3 274.3 274.3
Business Park 127.4 127.4 127.4 127.4 131.7
Logistics Park 157.3 157.3 157.3 157.3 157.3
Seletar Aerospace Park 66.0 66.0 63.4 63.4 63.4 Land for JTC Ready-Built Facilities (RBF) 1,158.5 1,162.5 1,169.3 1,177.7 1,186.4
Note:
1. Includes Prepared Industrial Land that are tendered out as part of the IGLS programme. Data on Prepared Industrial Land from IGLS is based
on date of allocation instead of date of tender award. Date of allocation is normally a few months after date of tender award.

33
Table 7: Total Allocated and Supply by Product Segment (Ready-Built Facilities) (4Q 2019 – 4Q 2020)
Total Allocated as at
4Q 2019 1Q 2020 2Q 2020 3Q 2020 4Q 2020
Ready-Built Facilities (‘000 sqm) Total 5,113.8 5,128.5 5,196.6 5,209.3 5,192.2
High-Rise Space 1,485.4 1,490.1 1,506.9 1,519.0 1,519.7
Business Park Space 270.6 267.6 267.5 267.9 269.1
Land-Based Factory 2,869.7 2,885.2 2,937.1 2,940.8 2,923.4
Workshop Space 488.0 485.6 485.1 481.6 479.9
Supply
4Q 2019 1Q 2020 2Q 2020 3Q 2020 4Q 2020
Ready-Built Facilities (‘000 sqm)
Total 6,302.1 6,335.8 6,411.9 6,489.4 6,504.4
High-Rise Space 1,873.2 1,873.1 1,940.4 1,940.4 1,940.4
Business Park Space 313.8 313.8 313.6 313.6 313.6
Land-Based Factory 3,577.1 3,610.5 3,619.2 3,696.5 3,711.6
Workshop Space 538.0 538.3 538.7 538.8 538.8
Table 8: Occupancy Rate of Ready-Built Facilities (4Q 2019 – 4Q 2020)
4Q 2019 1Q 2020 2Q 2020 3Q 2020 4Q 2020
Ready-Built Facilities (%)
Overall 81.1 80.9 81.0 80.3 79.8 High-Rise Space 79.3 79.5 77.7 78.3 78.3
Business Park Space 86.2 85.3 85.3 85.4 85.8
Land-Based Factory 80.2 79.9 81.2 79.6 78.8
Workshop Space 90.7 90.2 90.1 89.4 89.1