quarterly report on telecom sector indicators · the mobile subscribers increased slightly by 0.26%...
TRANSCRIPT

Q1, 2013
Quarterly Report on Telecom Sector
Indicators
Q2, 2016
Competition and Tariffs Unit

Telecom Market Indicators Report / Q2, 2016 Page 2
Table of Content
Topics Page
Introduction 3
Major Market Observations 5
Summary of Main Telecom Indicators 6
Fixed Telephone Line Service 7
Mobile Service 10
Internet Service 13
ARPUs 19
Quality of Service 20
Traffic 24
Type Approval 26
Tariffs & Promotions 28

Telecom Market Indicators Report / Q2, 2016 Page 3
Introduction
We are pleasured to present Q2 2016 Report for the Indicators of Telecom
Sector of Oman. The TRA has been compiling and publishing this information
on quarterly basis to provide market intelligence on Telecom Sector to all
interested parties including the investors, consumers, and the licensees. The
Quarterly reports provide a brief update on the status of major telecom
services in the Sultanate of Oman. These reports cover voice and data
services for both fixed and mobile segments.
The quarterly reports are being compiled collecting data from the telecom
service providers operating in Oman. The TRA would like to acknowledge
and appreciate the service providers for their cooperation and support for
providing statistics to TRA, which helped in preparing and disseminating this
information. The source data is sometimes delayed by the licensees, which
ultimately cause delays in publishing the report. We hope the publication
timing will improve in future with the cooperation of service providers.
Comments and suggestions from the users of these reports are welcome for
improvement of the contents and structure of the reports.
This report is also published on the TRA website (www.tra.gov.om).

Telecom Market Indicators Report / Q2, 2016 Page 4
Disclaimer
The TRA tries its best to ensure accuracy of the information provided in this
report. However, The users of any information contained in this report are
advised to perform their own due-diligence to assess accuracy and
relevance of the information and use it at their own risk and responsibility.
Since the data is provided by the licensees, the TRA cannot assume
responsibility for any loss, damage, and cost or expense whether direct,
indirect, or consequential, suffered by any person using or relying on this
information whether caused by reason of any inaccuracy, error, omission
or misinterpretation.
Telecom Market Indicators Report / Q2, 2016 Page 5
Market Observations Major
6201 ,2Q
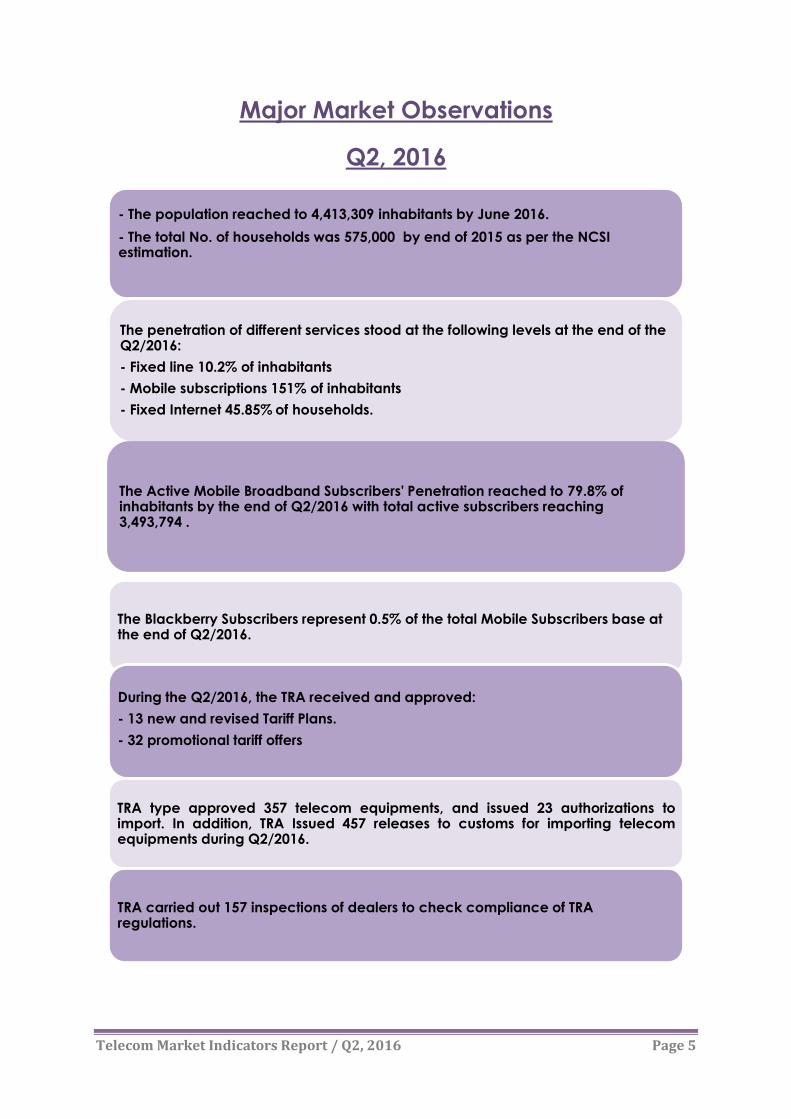
- The population reached to 4,413,309 inhabitants by June 2016.
- The total No. of households was 575,000 by end of 2015 as per the NCSI estimation.
The penetration of different services stood at the following levels at the end of the Q2/2016:
- Fixed line 10.2% of inhabitants
- Mobile subscriptions 151% of inhabitants
- Fixed Internet 45.85% of households.
The Active Mobile Broadband Subscribers' Penetration reached to 79.8% of inhabitants by the end of Q2/2016 with total active subscribers reaching 3,493,794 .
The Blackberry Subscribers represent 0.5% of the total Mobile Subscribers base at the end of Q2/2016.
During the Q2/2016, the TRA received and approved:
- 13 new and revised Tariff Plans.
- 32 promotional tariff offers
TRA type approved 357 telecom equipments, and issued 23 authorizations toimport. In addition, TRA Issued 457 releases to customs for importing telecomequipments during Q2/2016.
TRA carried out 157 inspections of dealers to check compliance of TRA regulations.

Telecom Market Indicators Report / Q2, 2016 Page 6
Summary of Main Telecommunications Indicators
6, 2012Q
Indicator
Fixed Telephony
Service (other than Fixed
Internet)
Fixed Internet
Service Mobile Service
Subscribers
450,936
263,640 6,657,575
Penetration
rate1
78%
of household
45.85%
of household
151%
of inhabitant
Revenue
(Mln.RO)
38.530
24.496
149.973
International
Outgoing Voice
Minutes,
(million)
6.644 NA 271.204
ARPU, (RO) 2 4.67 30.97 7.51
Service
Providers3
Omantel,
Ooredoo, Teo
Omantel, Ooredoo
Oman Mobile,
Ooredoo, Friendi,
Renna, Teo as per the latest bulletin ), 4,413,309( penetration rates are calculated based on the population 6/2012The QNote: 1
published by NCSI – March 2016. Households: 575,000 (as per the NCSI estimation for year 2015).
.paid and prepaid)-telephone lines (postThe Fixed ARPU is based on revenue for the fixed 2
statistics & details of Awaser has started its commercial operations. However, this report does not capture any 3
Awaser.
4Household is NCSI estimation for the year 2015.
Q2/2016 Q1/2016 % Change
Population 4,413,309 4,379,105 0.78
Households4 575,000 575,000 -

Telecom Market Indicators Report / Q2, 2016 Page 7
Service Fixed Telephone
Type of Service Q2/2016 Q1/2016 %
Change
Fixed Telephone Lines:
1.1 Post Paid 342,466 333,554 2.67%
1.2 Pre-Paid 60,936 59,569 2.2%
1.3 Public Telephone – Payphone 6,801 6,801 0.00
1.4 ISDN Equivalent Channels 39,150 45,244 -0.13%
1.5 WLL Connections 1,497 1,750 -14.4%
Total Fixed Telephone Lines in Operation (1.1-1.5) 450,936 446,918 0.89%
Fixed Line Penetration /100 Inhabitant 10.2% 10.2% 0.0%
Fixed Line Penetration /100 household 78% 77.7% 0.3%
Note: The Q2/2016 penetration rates are calculated based on the population (4,413,309), as per the latest
bulletin published by NCSI – June 2016.
Households: 575,000 (as per the NCSI estimation for year 2015).
Second Quarter 2016 achieved 450,936 fixed line subscribers with an increase of
4,018 lines as compared to the previous quarter (Q1/2016).
The penetration rate per inhabitant of the fixed line subscribers stayed constant as
the previous quarter at 10.2%.
However, the penetration rate per household increased by 0.3% during the second
quarter from 77.7% to 78 %.

Telecom Market Indicators Report / Q2, 2016 Page 8
Both the fixed postpaid and pre-paid subscriptions grew during the second quarter 2016 by
2.62%, and 2.2% respectively.
Public payphones remained unchanged since last year with the total of 6,801 pay phones in
service.

Telecom Market Indicators Report / Q2, 2016 Page 9
During the second quarter 2016, the ISDN equivalent channels declined by 13.46%
reaching 39,150 channels. This change was due to recalculation of lines as per ITU
Definition.
Both residential fixed line subscribers and business subscribers grew by 0.40% and 1.39%
respectively during the second quarter 2016.
The split between fixed residential and business lines stood at 62% and 38% respectively in
Q2/2016.

Telecom Market Indicators Report / Q2, 2016 Page 10
Service Mobile
Note: The Q2/2016 penetration rates are calculated based on the population (4,413,309), as per the latest
bulletin published by NCSI – June 2016.
The mobile subscribers increased slightly by 0.26% during the second quarter 2016
achieving a total of 6,657,575 subscribers.
The mobile penetration declined by 1% during the second quarter 2016 due to
change in the population figure.
Mobile Subscribers Q2/2016 Q1, 2016 % change
1 Post Paid
1.1 Operators 603,205 594,558 1.45%
Total Postpaid Subscribers 603,205 594,558 1.45%
2 prepaid
2.1 Operators 4,979,319 5,003,363 -0.48%
2.2 Resellers 1,074,955 1,041,949 3.16%
Total Prepaid Subscribers 6,054,370 6,045,312 0.15%
Total Mobile Subscribers: (2.1+2.2) 6,657,575 6,639,870 0.26%
Mobile Penetration/100 Inhabitant 151% 152% -1%
BlackBerry Subscriptions:
3.1 Post Paid 4,294 4,780 -10.2%
3.2 Pre-Paid 31,945 31,606 1.07%
Total BlackBerry Subscribers (3.1+3.2) 36,239 36,386 -0.40%
% of BlackBerry Mobile Subscribers of total Base in Oman 0.5% 0.5% 0%

Telecom Market Indicators Report / Q2, 2016 Page 11
Post-paid mobile subscribers reached 603,205 with 1.45% growth over the previous
quarter.
Prepaid mobile subscribers increased by 0.15% reaching to 6,045,312 subscribers.
During the second quarter 2016, Omantel mobile and Ooredoo attained the same
percentage of market share, 42% the Resellers reached 16% market share similar to the
previous quarter 2016.

Telecom Market Indicators Report / Q2, 2016 Page 12
Internet Services
Note: The Q2/2016 penetration rates are calculated based on the population (4,413,309), as per the latest
bulletin published by NCSI – June 2016.
Households: 575,000 (as per the NCSI estimation for year 2015).
Type of Service Q2/2016 Q1,2016 % change
Dial Up Subscribers
1.1 Post Paid 2,626 2,672 -1.72%
1.2 Pre-Paid 11 0 -
1. Total Dial-Up Subscribers: (1.1+1.2) 2,637 2,672 -1.3%
Fixed Broadband Subscribers
2. Total Fixed Broadband Subscribers 261,003 249,352 4.7%
Total Fixed Internet Subscribers (1+2) 263,640 252,024 4.6%
Fixed Internet Penetration /100 Household 45.85% %43.83 2.02%
Fixed Broadband Subscribers Penetration/100 Household 45.39% %43.37 2. 02%
Active Mobile Broadband Subscribers
3.1 Dedicated mobile-broadband Subscribers 2,252,074 2,261,329 -0.40%
3.2 Standard mobile-broadband Subscribers 1,241,720 1,116,584 11.2%
Total Active Mobile Broadband Subscribers (3.1+3.2) 3,493,794 3,377,913 3. 4%
Active Mobile Broadband Penetration Rate /100
Inhabitant 79.8% %77.1 2.1%

Telecom Market Indicators Report / Q2, 2016 Page 13
The fixed internet subscribers were added up by 11,616 subscribers during the second
quarter 2016 reaching a total of 263,640 subscribers. This showed 4.6% growth over the
previous quarter.
During the reported quarter, the fixed internet penetration rate per household
reached 45.83 % which is 2.02% higher than the previous quarter.
Since the last year, dial up postpaid internet subscribers have been gradually shrinking
reaching to 2,626 subscribers by end of Q2, 2016.
During the second quarter, number of internet prepaid subscribers registered to 11
compare to the last three quarters when there was no subscribers recorded in this
category.

Telecom Market Indicators Report / Q2, 2016 Page 14
During the second quarter 2016, fixed broadband segment has experienced 4.7% growth
over the previous quarter. Fixed Broadband subscription reached 261,003 subscribers with
penetration rate of 45.39% per household.
During the second quarter 2016, total active mobile broadband subscribers rose by 3.4%
to 3,493,794 from 3,377,913. Also, the penetration rate increased by 2.1% from 77.1% to
79.8% per inhabitant.
Telecom Market Indicators Report / Q2, 2016 Page 15
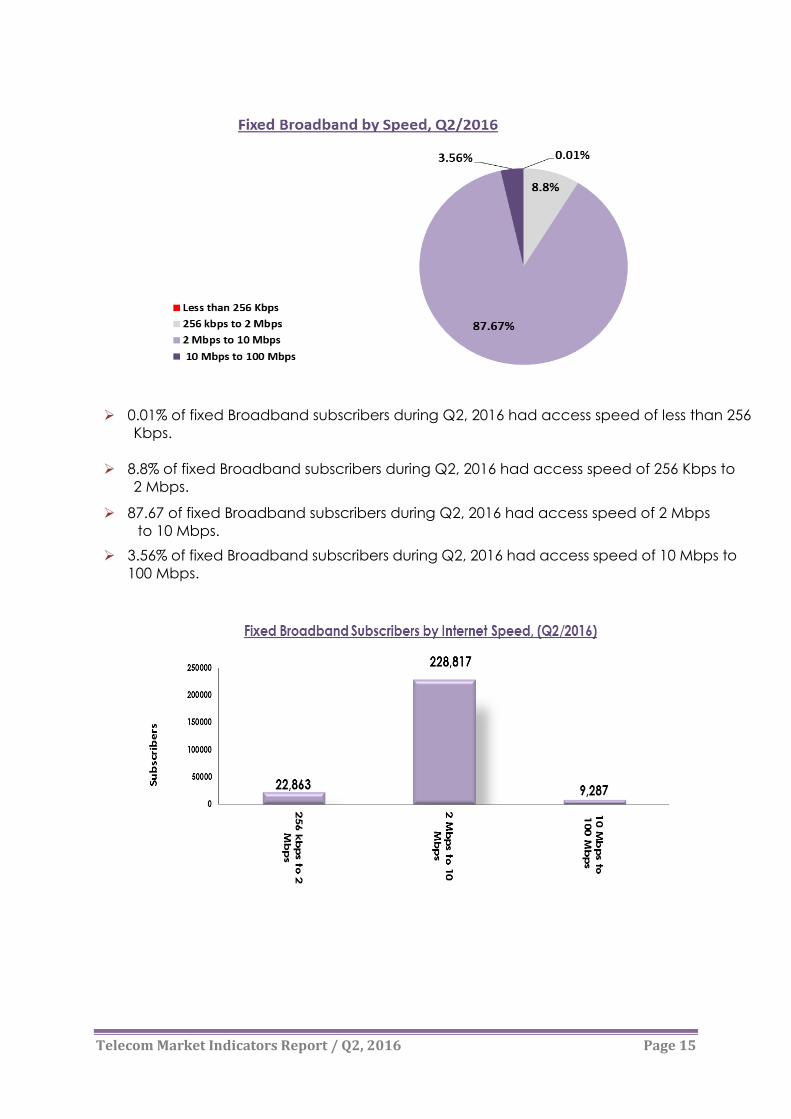
0.01% of fixed Broadband subscribers during Q2, 2016 had access speed of less than 256
Kbps.
8.8% of fixed Broadband subscribers during Q2, 2016 had access speed of 256 Kbps to
2 Mbps.
87.67 of fixed Broadband subscribers during Q2, 2016 had access speed of 2 Mbps
to 10 Mbps.
3.56% of fixed Broadband subscribers during Q2, 2016 had access speed of 10 Mbps to
100 Mbps.

Telecom Market Indicators Report / Q2, 2016 Page 16
The residential broadband subscribers in the above chart registered a growth
of 4.8% during the second quarter 2016, also the residential dial up subscribers
increased by 0.81% over the second quarter 2016.
The below chart presents an increase of 3.07% in the business broadband
segment, while 1.6% drop in the dial up internet subscribers.

Telecom Market Indicators Report / Q2, 2016 Page 17
During the second quarter 2016, the operators had 265,760 Mbps capacity for
international internet bandwidth as compared to the previous quarter when it was
223,240 Mbps.
Out of 265760 Mbps capacity, on average 9.33% was utilized for the outgoing and
54.38% for the incoming traffic.

Telecom Market Indicators Report / Q2, 2016 Page 18
ARPUs

Telecom Market Indicators Report / Q2, 2016 Page 19
Traffic
The second quarter 2016 experienced increase in the international traffic.
The international outgoing traffic increased by 2.5%, similarly the incoming traffic
increased by 3.5% during the second quarter against the first quarter 2016.
During the second quarter 2016, the domestic outgoing mobile declined by 5.6% to
1,330 million minutes from the 1,409 million minutes.

Telecom Market Indicators Report / Q2, 2016 Page 20
By the end of the second quarter 2016, mobile
to mobile (On net) traffic has the major share
of the 77.4% out of the total domestic
outgoing traffic. While the Off net mobile
domestic traffic has 21.0%, and mobile to
fixed represents1.6% of the mobile domestic
traffic.
During the second quarter 2016, the domestic
outgoing fixed traffic achieved 73.8% share for
fixed to mobile, 24.9% for fixed to fixed (On-net),
and 1.3% for fixed to fixed (Off-net) traffic.
Total outgoing SMS decreased to reach 320
million messages by the second quarter 2016
from 316 million messages in the first quarter,
2016.
The number of outgoing MMS has been gradually
decreasing since the last year. In the second
quarter, it decreased from 0.475 to 0.363 million
messages.

Telecom Market Indicators Report / Q2, 2016 Page 21
Quality of Service
Mobile Services KPIs*
*(QoS indicators are as measured and reported by the operators, not audited or verified
figures by TRA)
Mobile Services KPIs Required KPI
(Quarterly)
Q2/2016 Q1/2016
Oman
Mobile
%
Ooredoo
%
Oman
Mobile
%
Ooredoo
%
1. Percentage of Calls
Dropped Less than 0.8% 0.39 0.48 0.40 0.50
2. Percentage of Calls
Blocked due to
Congestion
Less than 1.1% 0.40 0.02 0.41 0.08
3. Percentage of
billing complaints
resolved within 20
working days
More than 96% 99.66 100 99.66 100

Telecom Market Indicators Report / Q2, 2016 Page 22

Telecom Market Indicators Report / Q2, 2016 Page 23
Fixed Services KPIs*
Fixed Services KPIs
Required KPI
(Quarterly)
Q2/2016 Q1/2016
Omantel
%
Ooredoo
%
Omantel
%
Ooredoo
%
1. Faults per 100 lines per quarter Less than 3 2.84 0.095 2.75 0.17
2. % of faults to be cleared within
24 hours More than 90% 96.78 100 96.96 100
3. Unsuccessful call Ratio for
local and national fixed calls
Less than
1% 0.07 0.04 0.05 0.11
4. Percentage of Orders for
access lines in the served
areas completed within 10
days
More than 90% 97.2 93.57 97.98 99.85
5. Billing complaints per 1000 Bills
Less than
1.5 0.48 0.272 0.23 0.83
6. Percentage of billing
complaints resolved within 20
working day
More than 96% 99.26 100
*(QoS indicators are as measured and reported by the operators, not audited or verified
figures by TRA)

Telecom Market Indicators Report / Q2, 2016 Page 24
Telecom Market Indicators Report / Q2, 2016 Page 25
Type Approval
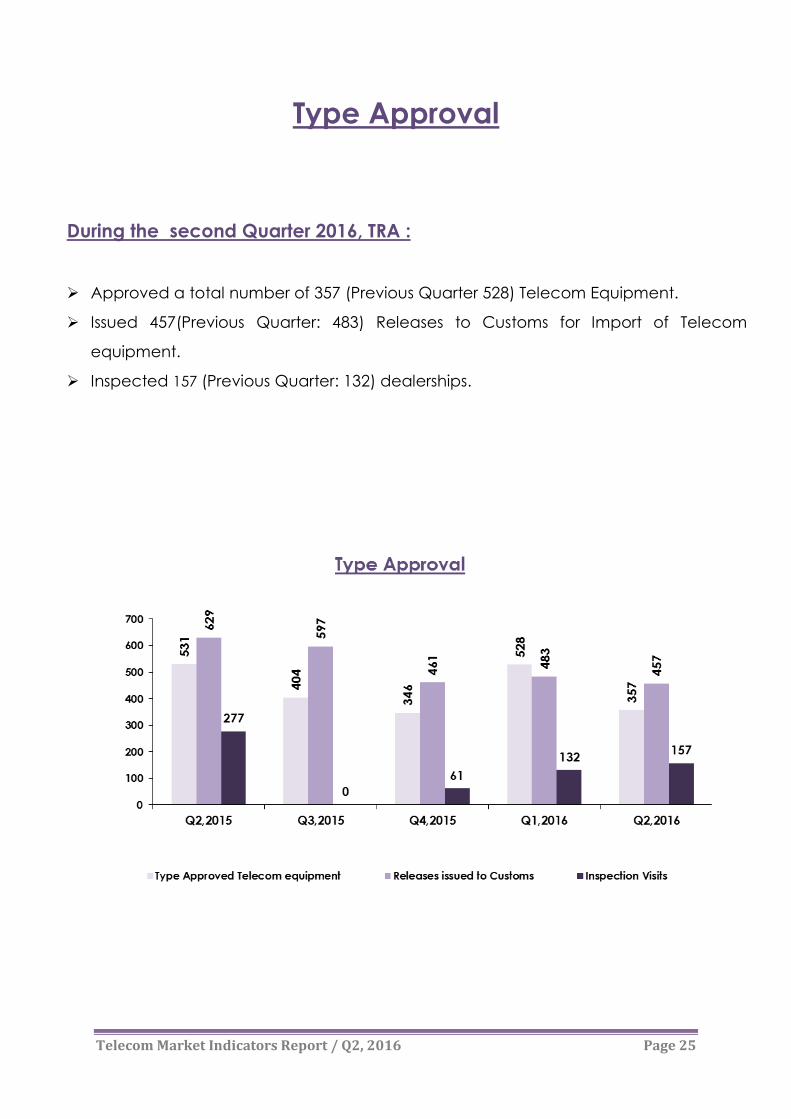
: TRA, 6Quarter 201 second During the
Approved a total number of 357 (Previous Quarter 528) Telecom Equipment.
Issued 457(Previous Quarter: 483) Releases to Customs for Import of Telecom
equipment.
Inspected 157 (Previous Quarter: 132) dealerships.

Telecom Market Indicators Report / Q2, 2016 Page 26

Telecom Market Indicators Report / Q2, 2016 Page 27
Tariffs & Promotions
Mobile Fixed Mobile Fixed Mobile Fixed Mobile Fixed
Renna 1 1 1 3 7%
Friendi 4 3 3 10 22%
Teo 0 0%
Omantel 1 3 2 2 2 2 7 1 20 44%
Ooredoo 1 1 2 1 3 1 1 10 22%
Awaser 2 2 4%
Total 0 0 7 0 8 6 6 0 2 5 9 0 2 45
0.0% 0.0% 16.0% 0.0% 18% 13.3% 13.3% 0.0% 4.0% 11.1% 20.0% 0.0% 4.4% 100%100%
Number of Promotions approved Q2, 2016
%Leased
line/MPLSMiscellanious Total
Value
Added
Services
Top-Up
and
Bundled
services
Licensee
Voice National DataNew Connections/
Starter Pack International
Mobile
Roaming
Voice International
Mobile Fixed Mobile Fixed Mobile Fixed Mobile Fixed
Renna 0 0%
Friendi 0 0%
Teo 1 1 7%
Omantel 1 2 3 1 7 50%
Ooredoo 1 2 1 4 29%
Awaser 2 2 14%
Total 0 0 0 0 0 2 0 0 2 5 0 3 2 14
0% 0% 0% 0% 0% 14% 0% 0% 14% 36% 0% 21% 14% 100%
Number of new services, Tariffs and Revisions approved Q2, 2016
Total %
100%
Licensee
Voice DataNew Connections/
Starter Pack International
Mobile
Roaming
Value
Added
Services
Top-Up
and
Bundled
services
Leased
line/MPLSMiscellanious
Voice International

Telecom Market Indicators Report / Q2, 2016 Page 28
Number of promotions/ new services and revisions segment wise
Mobile FixedMobile &
FixedTotal
36 7 2 45
% 80% 16% 4% 100%
12 2 14
86% 14% 0% 100%
No. of new
services
and
revisions
No. of
Promotions
Personal CorporatePersonal &
CorporateTotal
38 2 5 45
% 84% 4% 11% 100%
5 4 5 14
36% 29% 36% 100%
No. of
Promotions
No. of new
services
and
revisions
Prepaid PostpaidPrepaid &
PostpaidTotal
28 11 6 45
% 62% 24% 13% 100%
1 5 8 14
7% 36% 57% 100%
No. of new
services
and
revisions
No. of
Promotions

Telecom Market Indicators Report / Q2, 2016 Page 29
Summary of Promotion’s Statistics for Q2/2016:
Promotions increased by 29% comparing with the same quarter last year 2015
from 35 to 45.
Most of services and revisions approved dominated by Value Added Services
36%, Bundled Services 21%, and FBB 14%, International Mobile Roaming 14%.
Resellers offered 29% of the total promotions approved this quarter.
This period witnessed launching number of promotions on the occasion of
COMEX event.
Summary of the Tariff Activities in Q2/2016:
The most services and revisions approved this quarter are as follows:
1- Omantel launched new revamped Mada plans marketed as Baqati.
2- Omantel`s Nama Corporate plans were revised.
3- Ooredoo introduced a new improved roaming- plan (Musafir) for roamers
in UAE.
4- TRA approved a new FTTH plan having 1GB speed from Awasr.