quarterly securities report - sony global - sony global … · · 2018-03-26quarterly securities...
TRANSCRIPT

Quarterly Securities Report For the three months ended December 31, 2017
(TRANSLATION)
Sony Corporation

CONTENTS
Page Note for readers of this English translation Cautionary Statement
1 1
I Corporate Information 3 (1) Selected Consolidated Financial Data 3 (2) Business Overview 4
II State of Business 5 (1) Risk Factors 5 (2) Material Contracts 5 (3) Management’s Discussion and Analysis of Financial Condition, Results of Operations and
Status of Cash Flows 5
III Company Information 14 (1) Information on the Company’s Shares 14 (2) Directors and Corporate Executive Officers 18
IV Financial Statements 19 (1) Consolidated Financial Statements 20 (2) Other Information 46

- 1 -
Note for readers of this English translation
On February 8, 2018, Sony Corporation (the “Company” or “Sony Corporation”) filed its Japanese-language Quarterly
Securities Report (Shihanki Houkokusho) for the three months ended December 31, 2017 with the Director-General of the
Kanto Local Finance Bureau in Japan pursuant to the Financial Instruments and Exchange Act of Japan. This document is
an English translation of the Quarterly Securities Report in its entirety, except for (i) information that had been previously
filed with or submitted to the U.S. Securities and Exchange Commission (the “SEC”) in a Form 20-F, Form 6-K or any
other form and (ii) a description of differences between generally accepted accounting principles in the U.S. (“U.S. GAAP”)
and generally accepted accounting principles in Japan (“J-GAAP”), which are required to be described in the Quarterly
Securities Report under the Financial Instruments and Exchange Act of Japan if the Company prepares its financial
statements in conformity with accounting principles other than J-GAAP.
Cautionary Statement
Statements made in this release with respect to Sony’s current plans, estimates, strategies and beliefs and other statements
that are not historical facts are forward-looking statements about the future performance of Sony. Forward-looking
statements include, but are not limited to, those statements using words such as “believe,” “expect,” “plans,” “strategy,”
“prospects,” “forecast,” “estimate,” “project,” “anticipate,” “aim,” “intend,” “seek,” “may,” “might,” “could” or “should,”
and words of similar meaning in connection with a discussion of future operations, financial performance, events or
conditions. From time to time, oral or written forward-looking statements may also be included in other materials released
to the public. These statements are based on management’s assumptions, judgments and beliefs in light of the information
currently available to it. Sony cautions investors that a number of important risks and uncertainties could cause actual
results to differ materially from those discussed in the forward-looking statements, and therefore investors should not place
undue reliance on them. Investors also should not rely on any obligation of Sony to update or revise any forward-looking
statements, whether as a result of new information, future events or otherwise. Sony disclaims any such obligation. Risks
and uncertainties that might affect Sony include, but are not limited to:
(i) the global economic and political environment in which Sony operates and the economic and political conditions in
Sony’s markets, particularly levels of consumer spending;
(ii) foreign exchange rates, particularly between the yen and the U.S. dollar, the euro and other currencies in which Sony
makes significant sales and incurs production costs, or in which Sony’s assets and liabilities are denominated;
(iii) Sony’s ability to continue to design and develop and win acceptance of, as well as achieve sufficient cost reductions for,
its products and services, including image sensors, game and network platforms, smartphones and televisions, which
are offered in highly competitive markets characterized by severe price competition and continual new product and
service introductions, rapid development in technology and subjective and changing customer preferences;
(iv) Sony’s ability and timing to recoup large-scale investments required for technology development and production
capacity;
(v) Sony’s ability to implement successful business restructuring and transformation efforts under changing market and
regulatory conditions;
(vi) changes in laws, regulations and government policies in the markets in which Sony operates, including those related to
taxation and corporate social responsibility;
(vii) Sony’s ability to implement successful hardware, software, and content integration strategies, and to develop and
implement successful sales and distribution strategies in light of new technologies and distribution platforms;
(viii) Sony’s continued ability to devote sufficient resources to research and development and, with respect to capital
expenditures, to prioritize investments correctly (particularly in the electronics businesses);
(ix) Sony’s ability to maintain product quality and customer satisfaction with its products and services;
(x) the effectiveness of Sony’s strategies and their execution, including but not limited to the success of Sony’s
acquisitions, joint ventures and other strategic investments;
(xi) significant volatility and disruption in the global financial markets or a ratings downgrade;
(xii) Sony’s ability to forecast demands, manage timely procurement and control inventories;
(xiii) Sony's reliance on external business partners, including for the procurement of parts, components, software and
network services for its products or services, the manufacturing, supply and distribution of its products, and its other
business operations;

- 2 -
(xiv) the outcome of pending and/or future legal and/or regulatory proceedings;
(xv) shifts in customer demand for financial services such as life insurance and Sony’s ability to conduct successful asset
liability management in the Financial Services segment;
(xvi) the impact of changes in interest rates and unfavorable conditions or developments (including market fluctuations or
volatility) in the Japanese equity markets on the revenue and operating income of the Financial Services segment;
(xvii) the ability of Sony, its third-party service providers or business partners to anticipate and manage cybersecurity risk,
including the risk of unauthorized access to Sony’s business information, potential business disruptions or financial
losses; and
(xviii) risks related to catastrophic disasters or similar events.
Risks and uncertainties also include the impact of any future events with material adverse impact.
- 3 -
I Corporate Information
(1) Selected Consolidated Financial Data
Yen in millions, Yen per share amounts
Nine months ended
December 31, 2016
Nine months ended
December 31, 2017
Fiscal year ended
March 31, 2017
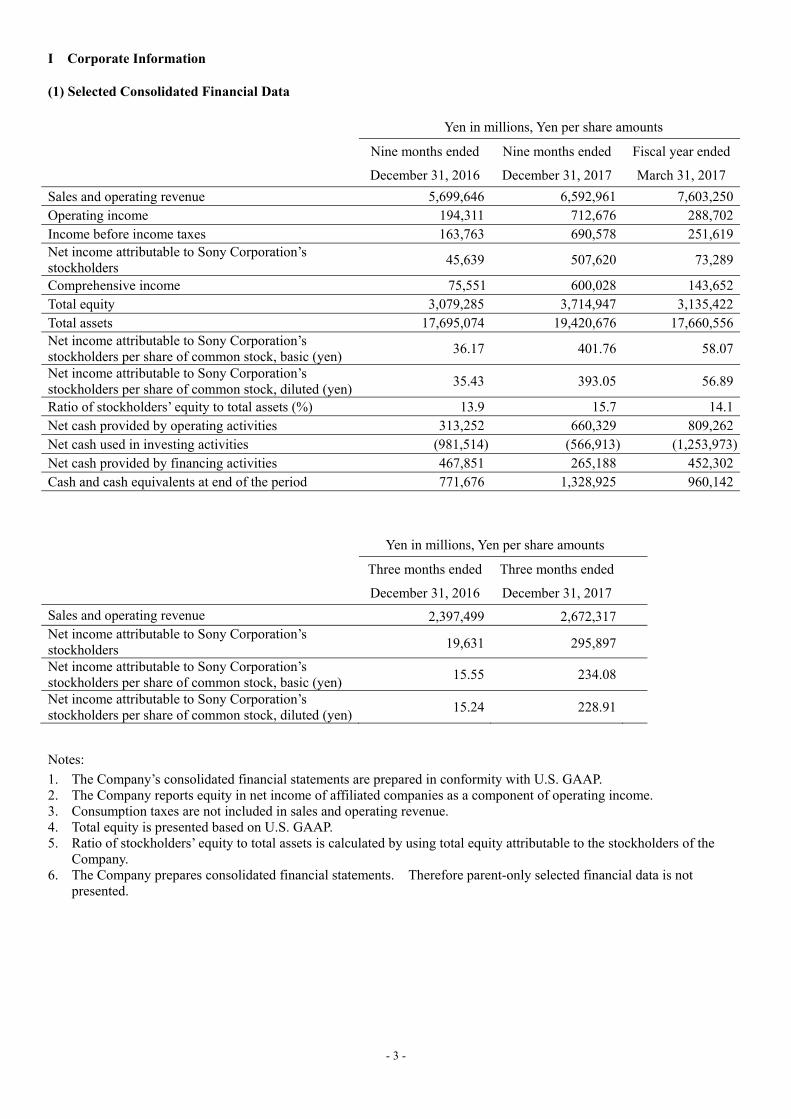
Sales and operating revenue 5,699,646 6,592,961 7,603,250 Operating income 194,311 712,676 288,702 Income before income taxes 163,763 690,578 251,619 Net income attributable to Sony Corporation’s stockholders
45,639 507,620 73,289
Comprehensive income 75,551 600,028 143,652 Total equity 3,079,285 3,714,947 3,135,422 Total assets 17,695,074 19,420,676 17,660,556 Net income attributable to Sony Corporation’s stockholders per share of common stock, basic (yen)
36.17 401.76 58.07
Net income attributable to Sony Corporation’s stockholders per share of common stock, diluted (yen)
35.43 393.05 56.89
Ratio of stockholders’ equity to total assets (%) 13.9 15.7 14.1 Net cash provided by operating activities 313,252 660,329 809,262 Net cash used in investing activities (981,514) (566,913) (1,253,973) Net cash provided by financing activities 467,851 265,188 452,302 Cash and cash equivalents at end of the period 771,676 1,328,925 960,142
Yen in millions, Yen per share amounts
Three months ended
December 31, 2016
Three months ended
December 31, 2017
Sales and operating revenue 2,397,499 2,672,317 Net income attributable to Sony Corporation’s stockholders 19,631 295,897
Net income attributable to Sony Corporation’s stockholders per share of common stock, basic (yen)
15.55 234.08
Net income attributable to Sony Corporation’s stockholders per share of common stock, diluted (yen)
15.24 228.91
Notes:
1. The Company’s consolidated financial statements are prepared in conformity with U.S. GAAP. 2. The Company reports equity in net income of affiliated companies as a component of operating income. 3. Consumption taxes are not included in sales and operating revenue. 4. Total equity is presented based on U.S. GAAP. 5. Ratio of stockholders’ equity to total assets is calculated by using total equity attributable to the stockholders of the
Company. 6. The Company prepares consolidated financial statements. Therefore parent-only selected financial data is not
presented.

- 4 -
(2) Business Overview
There was no significant change in the business of Sony during the nine months ended December 31, 2017. Sony realigned its reportable segments effective from the first quarter of the fiscal year ending March 31, 2018. For
further information on the realignment, please refer to “IV Financial Statements – Notes to Consolidated Financial Statements – 7. Business segment information”.
As of December 31, 2017, the Company had 1,338 subsidiaries and 115 affiliated companies, of which 1,308
companies are consolidated subsidiaries (including variable interest entities) of the Company. The Company has applied the equity accounting method for 109 affiliated companies.

- 5 -
II State of Business
(1) Risk Factors
Note for readers of this English translation:
There was no significant change from the information presented in the Risk Factors section of the Annual Report on Form 20-F filed with the Securities and Exchange Commission (the “SEC”) on June 15, 2017. Any forward-looking statements included in the descriptions below are based on management’s current judgment. URL: The Annual Report on Form 20-F filed with the SEC on June 15, 2017 https://www.sec.gov/Archives/edgar/data/313838/000119312517203939/d358485d20f.htm
(2) Material Contracts
There were no material contracts executed or determined to be executed during the three months ended December 31, 2017.
Note for readers of this English translation:
There was no significant change from the information presented in the Annual Report on Form 20-F (“Patents and Licenses” in Item 4) filed with the SEC on June 15, 2017. URL: The Annual Report on Form 20-F filed with the SEC on June 15, 2017
https://www.sec.gov/Archives/edgar/data/313838/000119312517203939/d358485d20f.htm
(3) Management’s Discussion and Analysis of Financial Condition, Results of Operations and Status of Cash Flows
i) Results of Operations
All amounts are presented on the basis of U.S. GAAP. “Sales and operating revenue” (“sales”) in each business segment represents sales and operating revenue recorded before intersegment transactions are eliminated. “Operating income (loss)” in each business segment represents operating income (loss) reported before intersegment transactions are eliminated and excludes unallocated corporate expenses. For details regarding each segment’s product categories and regarding business segment realignment, please refer to “IV Financial Statements – Notes to Consolidated Financial Statements – 7. Business segment information”.
Consolidated Financial Results (Billions of yen)
Nine months ended December 31 2016 2017
Sales and operating revenue 5,699.6 6,593.0 Operating income 194.3 712.7 Income before income taxes 163.8 690.6
Net income attributable to Sony Corporation’s stockholders 45.6 507.6
Sales for the nine months ended December 31, 2017 (“the current nine months”) increased by 893.3 billion yen compared to the same period in the previous fiscal year (“year-on-year”) to 6 trillion 593.0 billion yen. This significant increase was primarily due to the impact of foreign exchange rates as well as increases in sales in all segments except for the Mobile Communications segment.
Operating income for the current nine months increased 518.4 billion yen year-on-year to 712.7 billion yen. This significant increase was primarily due to a significant improvement in the operating results in the Semiconductors segment
- 6 -
and the absence in the current nine months of the impairment charge of goodwill recorded in the Pictures segment in the same period of the previous fiscal year.
Operating income for the current nine months included the following: ・ A gain resulting from the sale of the entire equity interest in a manufacturing subsidiary in the camera module business:
28.3 billion yen (Semiconductors segment) ・ Insurance recoveries, mainly for opportunity losses related to the 2016 Kumamoto Earthquakes (the “Kumamoto
Earthquakes”): 6.7 billion yen (Semiconductors segment) and 2.6 billion yen (IP&S segment) ・ A gain resulting from the sale of manufacturing equipment: 6.7 billion yen (Semiconductors segment)
Operating income for the same period of the previous fiscal year included the following:
・ An impairment charge of goodwill: 112.1 billion yen (962 million U.S. dollars) (Pictures segment) ・ An impairment charge related to the transfer of the battery business: 32.8 billion yen (All Other) ・ An impairment charge against long-lived assets, resulting from the termination of the development and manufacturing of
certain high-functionality camera modules for external sale: 23.9 billion yen (Semiconductors segment) ・ Net charges in expenses resulting from the Kumamoto Earthquakes: 14.9 billion yen (Semiconductors segment) ・ Inventory write-downs of certain image sensors for mobile products: 8.3 billion yen (Semiconductors segment)
During the current nine months, restructuring charges, net, decreased 32.3 billion yen year-on-year to 7.1 billion yen,
mainly due to the absence in the current nine months of the above-mentioned impairment charge related to the transfer of the battery business. Restructuring charges are recorded as an operating expense and are included in operating income.
Equity in net income of affiliated companies, recorded within operating income, increased 5.8 billion yen year-on-year to 7.4 billion yen.
The net effect of other income and expenses was an expense of 22.1 billion yen, an improvement of 8.5 billion yen year-on-year, mainly due to an increase in interest and dividend income.
Income before income taxes increased 526.8 billion yen to 690.6 billion yen.
During the current nine months, Sony recorded 138.5 billion yen of income tax expense, resulting in an effective tax rate of 20.1% which was lower than the effective tax rate of 49.4% in the same period of the previous fiscal year. This lower effective tax rate was mainly due to profits recorded in Sony Corporation and its national tax filing group in Japan, and in the U.S. consolidated tax filing group, both of which have established valuation allowances for deferred tax assets, compared to the losses recorded in the same period for those groups in the previous fiscal year. In addition, during the three months ended December 31, 2017, Sony recorded a 13.8 billion yen tax benefit related to deferred tax liabilities as a result of U.S. tax reform.
Net income attributable to Sony Corporation’s stockholders increased 462.0 billion yen year-on-year to 507.6 billion yen.
Operating performance by business segment for the current nine months is as follows: Game & Network Services (G&NS)
Sales increased 231.3 billion yen to 1 trillion 499.2 billion yen, primarily due to an increase in PlayStation®4 (“PS4”) software sales including sales through the network, as well as the impact of foreign exchange rates. Operating income increased 44.8 billion yen year-on-year to 157.8 billion yen, primarily due to the impact of the above-mentioned increase in sales. Music
The Music segment results include the yen-translated results of Sony Music Entertainment (“SME”) and Sony/ATV Music Publishing (“Sony/ATV”), both U.S.-based operations which aggregate the results of their worldwide subsidiaries on a U.S. dollar basis, and the results of Sony Music Entertainment (Japan) Inc., a Japan-based music company which aggregates its results in yen. The segment also includes equity in net income (loss) for EMI Music Publishing (“EMI”), an affiliated company accounted for under the equity method for which Sony records 39.8% of EMI’s net income in the segment’s operating income.
Sales increased 122.9 billion yen year-on-year to 593.6 billion yen, primarily due to higher Visual Media and Platform sales due to the continued strong performance of the mobile game application Fate/Grand Order, as well as higher Recorded Music sales due to an increase in digital streaming revenues. Operating income increased 36.5 billion yen year-on-year to 96.9 billion yen primarily due to the above-mentioned increase in sales.
- 7 -
Pictures The results presented in Pictures are a yen-translation of the results of Sony Pictures Entertainment Inc. (“SPE”), a
U.S.-based operation that aggregates the results of its worldwide subsidiaries on a U.S. dollar basis. Management analyzes the results of SPE in U.S. dollars, so discussion of certain portions of its results is specified as being on “a U.S. dollar basis.”
Sales increased 109.5 billion yen year-on-year to 710.1 billion yen. This significant increase in sales was due to higher advertising and subscription revenues for Media Networks in India primarily due to the acquisition of TEN Sports Network and improved ratings, higher licensing revenues for Television Productions primarily due to various U.S. television series, and higher theatrical revenues for Motion Pictures primarily due to the strong worldwide theatrical performances of Spider-Man: Homecoming and Jumanji: Welcome to the Jungle. Operating income of 8.7 billion yen was recorded compared to an operating loss of 114.2 billion yen in the same period of previous fiscal year. This significant improvement in operating results was due to the absence of a 112.1 billion yen (962 million U.S. dollars) impairment of goodwill that was recorded in the same period of the previous fiscal year as well as the above-mentioned increase in sales. Home Entertainment & Sound (HE&S)
Sales increased 163.4 billion yen year-on-year to 987.6 billion yen, primarily due to an improvement in the product mix of televisions reflecting a shift to high value-added models, as well as the impact of foreign exchange rates. Operating income increased 29.5 billion yen year-on-year to 93.2 billion yen, primarily due to the above-mentioned improvement in the product mix of televisions, partially offset by an increase in marketing costs and an increase in the price of key components. Imaging Products & Solutions (IP&S)
Sales increased 68.7 billion yen year-on-year to 493.5 billion yen, mainly due to the absence in the current nine months of the impact from the Kumamoto Earthquakes that was recorded in the same period of the previous fiscal year, as well as the impact of foreign exchange rates. Operating income increased by 24.6 billion yen year-on-year to 68.1 billion yen, primarily due to the impact of the above-mentioned increase in sales. Mobile Communications (MC)
Sales decreased 32.5 billion yen year-on-year to 570.8 billion yen, mainly due to a decrease in smartphone unit sales. Operating income decreased 8.4 billion yen year-on-year to 17.0 billion yen, mainly due to the above-mentioned decrease in sales as well as an increase in the price of key components, partially offset by reductions in operating costs. Semiconductors
Sales increased 111.5 billion yen year-on-year to 683.6 billion yen, primarily due to a significant increase in unit sales of image sensors for mobile products as well as the absence in the current nine months of a decrease in image sensor production due to the Kumamoto Earthquakes in the same period of the previous fiscal year. Operating income of 165.4 billion yen was recorded, compared to an operating loss of 20.6 billion yen recorded in the same period of the previous fiscal year. This improvement in operating results was primarily due to the impact of the above-mentioned increase in sales, the 28.3 billion yen gain resulting from the sale of the entire equity interest in a manufacturing subsidiary in the camera module business, a 6.7 billion yen gain resulting from the sale of manufacturing equipment, as well as 6.7 billion yen in insurance recoveries related to the Kumamoto Earthquakes, each in the current nine months. Additionally, in the same period of the previous fiscal year, the Semiconductors segment operating results included the above-mentioned 23.9 billion yen impairment charge against long-lived assets relating to camera modules, net charges of 14.9 billion yen in expenses resulting from the Kumamoto Earthquakes, and 8.3 billion yen in inventory write-downs of certain image sensors for mobile products. Financial Services
The Financial Services segment results include Sony Financial Holdings Inc. (“SFH”) and SFH’s consolidated subsidiaries such as Sony Life Insurance Co., Ltd. (“Sony Life”), Sony Assurance Inc. and Sony Bank Inc. (“Sony Bank”). The results of Sony Life discussed in the Financial Services segment differ from the results that SFH and Sony Life disclose separately on a Japanese statutory basis.
Revenue increased by 143.3 billion yen year-on-year to 955.7 billion yen, mainly due to a significant increase in net gains from investment performance in the separate account at Sony Life, resulting from favorable financial market conditions during the current nine months compared to the same period of the previous fiscal year, as well as higher insurance premiums revenue reflecting an increase in the policy amount in force. Operating income increased by 28.0 billion yen year-on-year to 139.1 billion yen, mainly due to a gain recorded on the sale of real estate held for investment purposes in the general account at Sony Life.
- 8 -
Operating Performance by Geographic Area
For operating performance by geographic area, please refer to "sales and operating revenue attributed to countries and areas based on location of external customers" in “IV Financial Statements – Notes to Consolidated Financial Statements – 7. Business segment information”.
* * * * *
Foreign Exchange Fluctuations and Risk Hedging
Note for readers of this English translation:
Except for the information set forth below, there was no significant change from the information presented in the Foreign Exchange Fluctuations and Risk Hedging section of the Annual Report on Form 20-F filed with the SEC on June 15, 2017. Although foreign exchange rates have fluctuated during the nine-month period ended December 31, 2017, there has been no significant change in Sony’s risk hedging policy as described in the Annual Report on Form 20-F. URL: The Annual Report on Form 20-F filed with the SEC on June 15, 2017
https://www.sec.gov/Archives/edgar/data/313838/000119312517203939/d358485d20f.htm
During the current nine months, the average rates of the yen were 111.7 yen against the U.S. dollar and 128.5 yen against the euro, which were 5.1 yen and 10.4 yen lower year-on-year.
For the current nine months, sales were 6 trillion 593.0 billion yen, an increase of 15.7% year-on-year, while on a
constant currency basis, sales increased approximately 11% year-on-year. For further details about the impact of foreign exchange rate fluctuations on sales and operating income, please refer to the below Note.
Consolidated operating income was 712.7 billion yen for the current nine months, an increase of 518.4 billion yen
year-on-year. Most of the foreign exchange rate impact was attributable to the impact of foreign exchange rates in the G&NS, HE&S, IP&S, MC and Semiconductors segments.
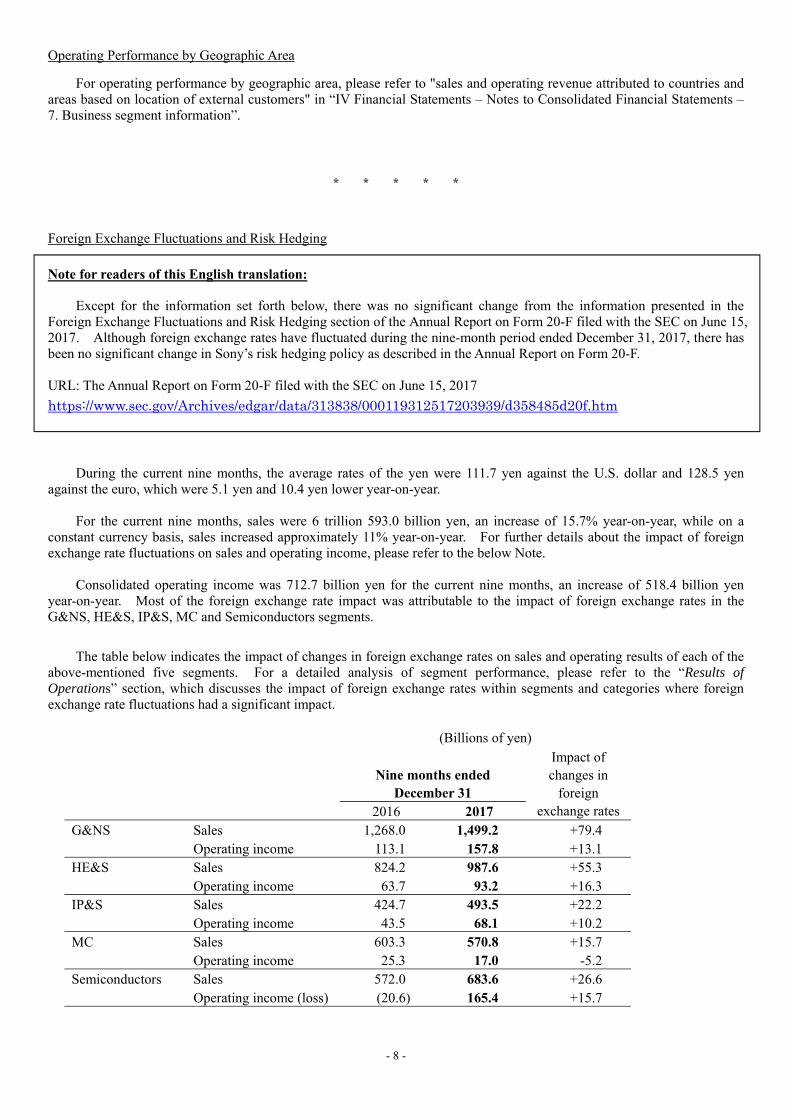
The table below indicates the impact of changes in foreign exchange rates on sales and operating results of each of the above-mentioned five segments. For a detailed analysis of segment performance, please refer to the “Results of Operations” section, which discusses the impact of foreign exchange rates within segments and categories where foreign exchange rate fluctuations had a significant impact.
(Billions of yen) Impact of
changes in foreign
exchange rates
Nine months ended December 31
2016 2017 G&NS Sales 1,268.0 1,499.2 +79.4
Operating income 113.1 157.8 +13.1 HE&S Sales 824.2 987.6 +55.3
Operating income 63.7 93.2 +16.3 IP&S Sales 424.7 493.5 +22.2
Operating income 43.5 68.1 +10.2 MC Sales 603.3 570.8 +15.7
Operating income 25.3 17.0 -5.2 Semiconductors Sales 572.0 683.6 +26.6
Operating income (loss) (20.6) 165.4 +15.7
- 9 -
In addition, sales for the Music segment increased 26.1% year-on-year to 593.6 billion yen, an approximate 23% increase on a constant currency basis. In the Pictures segment, sales increased 18.2% year-on-year to 710.1 billion yen, an approximate 13% increase on a U.S. dollar basis. As most of the operations in Sony’s Financial Services segment are based in Japan, Sony’s management analyzes the performance of the Financial Services segment on a yen basis only.
Note:
The descriptions of sales on a constant currency basis reflect sales calculated by applying the yen’s monthly average exchange rates from the previous nine months to local currency-denominated monthly sales in the current nine months. For SME and Sony/ATV in the Music segment, and in the Pictures segment, the constant currency amounts are calculated by applying the monthly average U.S. dollar / yen exchange rates after aggregation on a U.S. dollar basis.
The impact of foreign exchange rate fluctuations on sales is calculated by applying the change in the yen’s periodic
weighted average exchange rate for the previous nine months from the current nine months to the major transactional currencies in which the sales are denominated. The impact of foreign exchange rate fluctuations on operating income (loss) is calculated by subtracting from the impact on sales the impact on cost of sales and selling, general and administrative expenses calculated by applying the same major transactional currencies calculation process to cost of sales and selling, general and administrative expenses as for the impact on sales. Additionally, the MC segment enters into its own foreign exchange hedging transactions. The impact of those transactions is included in the impact of foreign exchange rate fluctuations on operating income (loss) for that segment.
This information is not a substitute for Sony’s consolidated financial statements measured in accordance with U.S.
GAAP. However, Sony believes that these disclosures provide additional useful analytical information to investors regarding the operating performance of Sony.
* * * * *
Status of Cash Flows
Operating Activities: During the current nine months, there was a net cash inflow of 660.3 billion yen from operating activities, an increase of 347.1 billion yen year-on-year.
For all segments excluding the Financial Services segment, there was a 378.8 billion yen net cash inflow, an increase
of 298.2 billion yen year-on-year. This increase was primarily due to an increase in net income after taking into account non-cash adjustments (including depreciation and amortization, other operating (income) expense, net, deferred income taxes and equity in net (income) loss of affiliated companies), as well as an increase in accrued expenses in other current liabilities. This increase in net cash inflow was partially offset by the negative impact of a larger increase in notes and accounts receivable, trade.
The Financial Services segment had a net cash inflow of 295.6 billion yen, an increase of 49.9 billion yen year-on-year.
This increase was primarily due to an increase in net income after taking into account non-cash adjustments such as depreciation and amortization, including amortization of deferred insurance acquisition costs.
Investing Activities: During the current nine months, Sony used 566.9 billion yen of net cash in investing activities, a
decrease of 414.6 billion yen year-on-year.
For all segments excluding the Financial Services segment, there was a net cash outflow of 141.1 billion yen, a decrease of 100.0 billion yen year-on-year. This decrease was mainly due to a decrease in payments for fixed asset purchases such as semiconductor manufacturing equipment.
The Financial Services segment used 424.8 billion yen of net cash, a decrease of 314.5 billion yen year-on-year. This
decrease was mainly due to a year-on-year decrease in payments for investments and advances at Sony Life and Sony Bank.
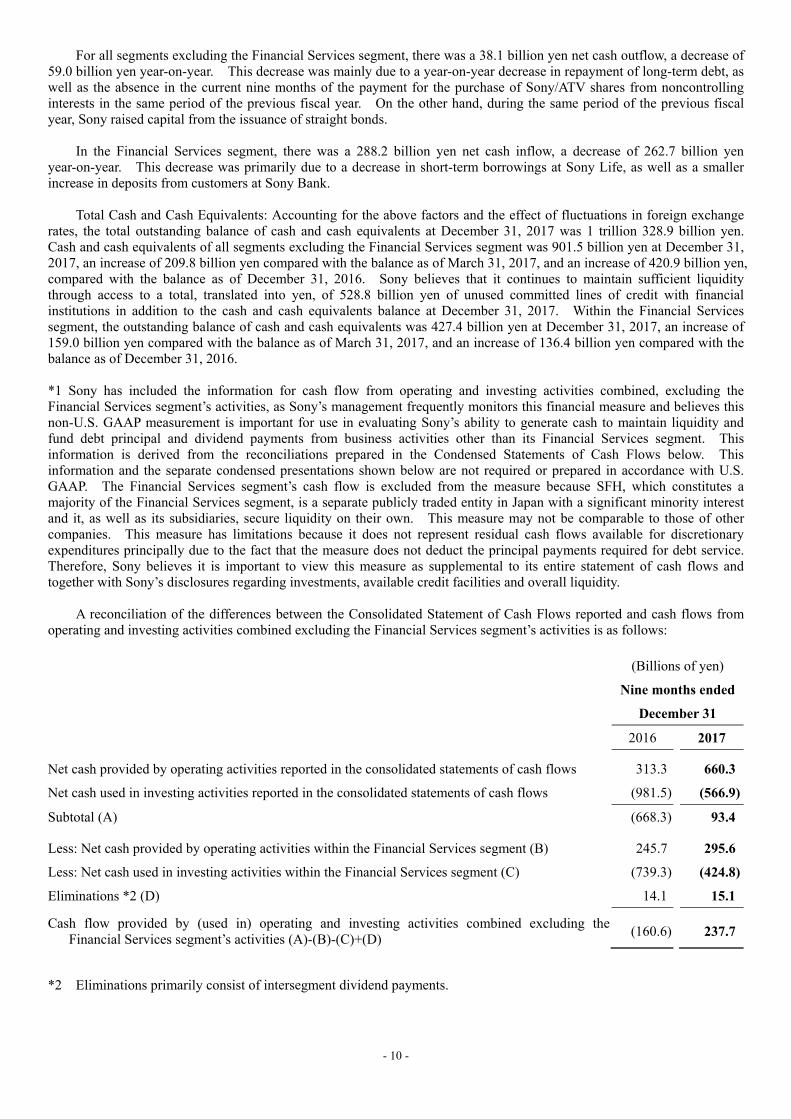
In all segments excluding the Financial Services segment, net cash generated in operating and investing activities combined*1 for the current nine months was 237.7 billion yen, a 398.3 billion yen improvement from net cash used in the same period of the previous fiscal year.
Financing Activities: During the current nine months, there was a net cash inflow of 265.2 billion yen from financing
activities, a decrease of 202.7 billion yen year-on-year.
- 10 -
For all segments excluding the Financial Services segment, there was a 38.1 billion yen net cash outflow, a decrease of 59.0 billion yen year-on-year. This decrease was mainly due to a year-on-year decrease in repayment of long-term debt, as well as the absence in the current nine months of the payment for the purchase of Sony/ATV shares from noncontrolling interests in the same period of the previous fiscal year. On the other hand, during the same period of the previous fiscal year, Sony raised capital from the issuance of straight bonds.
In the Financial Services segment, there was a 288.2 billion yen net cash inflow, a decrease of 262.7 billion yen
year-on-year. This decrease was primarily due to a decrease in short-term borrowings at Sony Life, as well as a smaller increase in deposits from customers at Sony Bank.
Total Cash and Cash Equivalents: Accounting for the above factors and the effect of fluctuations in foreign exchange
rates, the total outstanding balance of cash and cash equivalents at December 31, 2017 was 1 trillion 328.9 billion yen. Cash and cash equivalents of all segments excluding the Financial Services segment was 901.5 billion yen at December 31, 2017, an increase of 209.8 billion yen compared with the balance as of March 31, 2017, and an increase of 420.9 billion yen, compared with the balance as of December 31, 2016. Sony believes that it continues to maintain sufficient liquidity through access to a total, translated into yen, of 528.8 billion yen of unused committed lines of credit with financial institutions in addition to the cash and cash equivalents balance at December 31, 2017. Within the Financial Services segment, the outstanding balance of cash and cash equivalents was 427.4 billion yen at December 31, 2017, an increase of 159.0 billion yen compared with the balance as of March 31, 2017, and an increase of 136.4 billion yen compared with the balance as of December 31, 2016. *1 Sony has included the information for cash flow from operating and investing activities combined, excluding the Financial Services segment’s activities, as Sony’s management frequently monitors this financial measure and believes this non-U.S. GAAP measurement is important for use in evaluating Sony’s ability to generate cash to maintain liquidity and fund debt principal and dividend payments from business activities other than its Financial Services segment. This information is derived from the reconciliations prepared in the Condensed Statements of Cash Flows below. This information and the separate condensed presentations shown below are not required or prepared in accordance with U.S. GAAP. The Financial Services segment’s cash flow is excluded from the measure because SFH, which constitutes a majority of the Financial Services segment, is a separate publicly traded entity in Japan with a significant minority interest and it, as well as its subsidiaries, secure liquidity on their own. This measure may not be comparable to those of other companies. This measure has limitations because it does not represent residual cash flows available for discretionary expenditures principally due to the fact that the measure does not deduct the principal payments required for debt service. Therefore, Sony believes it is important to view this measure as supplemental to its entire statement of cash flows and together with Sony’s disclosures regarding investments, available credit facilities and overall liquidity.
A reconciliation of the differences between the Consolidated Statement of Cash Flows reported and cash flows from operating and investing activities combined excluding the Financial Services segment’s activities is as follows:
(Billions of yen)
Nine months ended
December 31
2016 2017
Net cash provided by operating activities reported in the consolidated statements of cash flows 313.3 660.3
Net cash used in investing activities reported in the consolidated statements of cash flows (981.5) (566.9)
Subtotal (A) (668.3) 93.4
Less: Net cash provided by operating activities within the Financial Services segment (B) 245.7 295.6
Less: Net cash used in investing activities within the Financial Services segment (C) (739.3) (424.8)
Eliminations *2 (D) 14.1 15.1
Cash flow provided by (used in) operating and investing activities combined excluding the Financial Services segment’s activities (A)-(B)-(C)+(D)
(160.6) 237.7
*2 Eliminations primarily consist of intersegment dividend payments.

- 11 -
(Yen in millions)
Nine months ended December 31
Financial Services Sony without
Financial Services Consolidated
2016 2017 2016 2017 2016 2017
Cash flows from operating activities:
Net income (loss) 79,331 99,059 17,856 468,111 82,832 552,097
Adjustments to reconcile net income (loss) to net cash provided by (used in) operating activities:
Depreciation and amortization, including amortization of deferred insurance acquisition costs
52,350 47,887 207,204 210,300 259,554 258,187
Amortization of film costs - - 190,539 259,709 190,539 259,709
Other operating (income) expense, net 69 33 165,385 (40,165) 165,454 (40,131)
(Gain) loss on sale or devaluation of securities investments, net 29 213 4,706 324 4,735 537
(Gain) loss on revaluation of marketable securities held for trading purposes, net
(42,727) (109,888) - - (42,727) (109,888)
Changes in assets and liabilities:
(Increase) decrease in notes and accounts receivable, trade (2,261) (3,165) (371,914) (484,877) (372,978) (488,285)
(Increase) decrease in inventories - - (18,622) (88,954) (18,622) (88,954)
(Increase) decrease in film costs - - (242,875) (279,082) (242,875) (279,082)
Increase (decrease) in notes and accounts payable, trade - - 87,698 90,484 87,698 90,484
Increase (decrease) in future insurance policy benefits and other
336,157 424,084 - - 336,157 424,084
(Increase) decrease in deferred insurance acquisition costs (70,070) (65,248) - - (70,070) (65,248)
(Increase) decrease in marketable securities held for trading purposes
(60,868) (64,727) - - (60,868) (64,727)
Other (46,339) (32,631) 40,605 242,971 (5,577) 211,546
Net cash provided by (used in) operating activities 245,671 295,617 80,582 378,821 313,252 660,329
Cash flows from investing activities:
Payments for purchases of fixed assets (10,452) (10,553) (250,005) (179,240) (260,457) (189,780)
Payments for investments and advances (943,712) (671,982) (7,410) (16,456) (951,199) (688,508)
Proceeds from sales or return of investments and collections of advances
213,629 257,582 13,837 5,404 226,461 262,056
Other 1,256 157 2,425 49,167 3,681 49,319
Net cash provided by (used in) investing activities (739,279) (424,796) (241,153) (141,125) (981,514) (566,913)
Cash flows from financing activities:
Increase (decrease) in borrowings, net 319,188 157,271 28,914 (12,094) 347,830 145,176
Increase (decrease) in deposits from customers, net 254,279 154,374 - - 254,279 154,374
Dividends paid (23,926) (23,921) (25,308) (27,750) (25,308) (27,750)
Other 1,355 457 (100,734) 1,750 (108,950) (6,612)
Net cash provided by (used in) financing activities 550,896 288,181 (97,128) (38,094) 467,851 265,188
Effect of exchange rate changes on cash and cash equivalents - - (11,525) 10,179 (11,525) 10,179
Net increase (decrease) in cash and cash equivalents 57,288 159,002 (269,224) 209,781 (211,936) 368,783
Cash and cash equivalents at beginning of the fiscal year 233,701 268,382 749,911 691,760 983,612 960,142
Cash and cash equivalents at end of the period 290,989 427,384 480,687 901,541 771,676 1,328,925
- 12 -
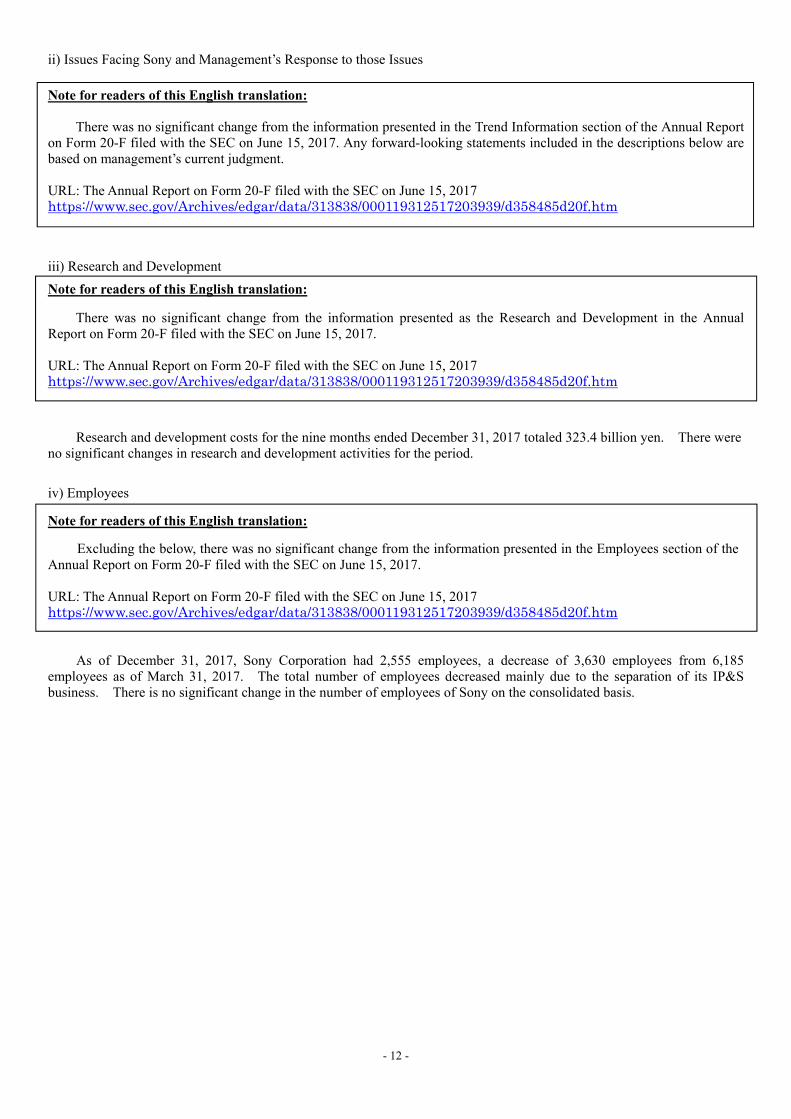
ii) Issues Facing Sony and Management’s Response to those Issues
Note for readers of this English translation:
There was no significant change from the information presented in the Trend Information section of the Annual Report on Form 20-F filed with the SEC on June 15, 2017. Any forward-looking statements included in the descriptions below are based on management’s current judgment. URL: The Annual Report on Form 20-F filed with the SEC on June 15, 2017 https://www.sec.gov/Archives/edgar/data/313838/000119312517203939/d358485d20f.htm
iii) Research and Development
Note for readers of this English translation:
There was no significant change from the information presented as the Research and Development in the Annual Report on Form 20-F filed with the SEC on June 15, 2017.
URL: The Annual Report on Form 20-F filed with the SEC on June 15, 2017 https://www.sec.gov/Archives/edgar/data/313838/000119312517203939/d358485d20f.htm
Research and development costs for the nine months ended December 31, 2017 totaled 323.4 billion yen. There were no significant changes in research and development activities for the period.
iv) Employees
Note for readers of this English translation:
Excluding the below, there was no significant change from the information presented in the Employees section of the Annual Report on Form 20-F filed with the SEC on June 15, 2017. URL: The Annual Report on Form 20-F filed with the SEC on June 15, 2017 https://www.sec.gov/Archives/edgar/data/313838/000119312517203939/d358485d20f.htm
As of December 31, 2017, Sony Corporation had 2,555 employees, a decrease of 3,630 employees from 6,185 employees as of March 31, 2017. The total number of employees decreased mainly due to the separation of its IP&S business. There is no significant change in the number of employees of Sony on the consolidated basis.
- 13 -
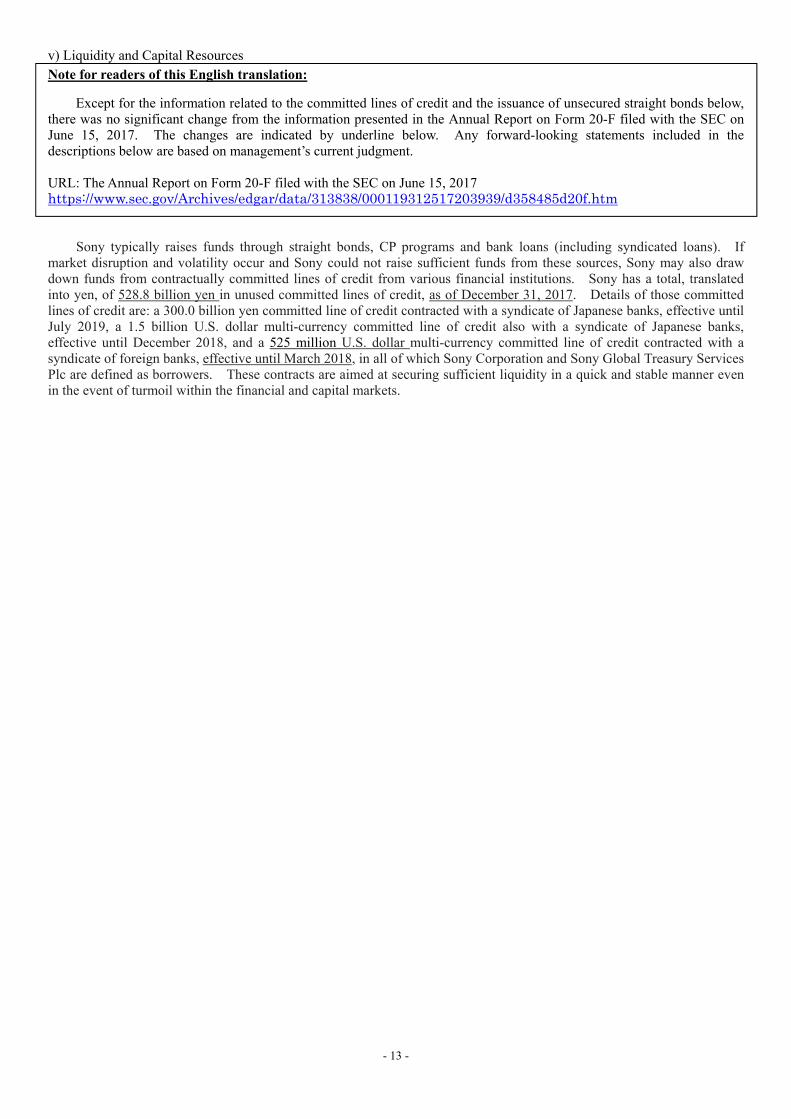
v) Liquidity and Capital Resources Note for readers of this English translation:
Except for the information related to the committed lines of credit and the issuance of unsecured straight bonds below, there was no significant change from the information presented in the Annual Report on Form 20-F filed with the SEC on June 15, 2017. The changes are indicated by underline below. Any forward-looking statements included in the descriptions below are based on management’s current judgment.
URL: The Annual Report on Form 20-F filed with the SEC on June 15, 2017 https://www.sec.gov/Archives/edgar/data/313838/000119312517203939/d358485d20f.htm
Sony typically raises funds through straight bonds, CP programs and bank loans (including syndicated loans). If market disruption and volatility occur and Sony could not raise sufficient funds from these sources, Sony may also draw down funds from contractually committed lines of credit from various financial institutions. Sony has a total, translated into yen, of 528.8 billion yen in unused committed lines of credit, as of December 31, 2017. Details of those committed lines of credit are: a 300.0 billion yen committed line of credit contracted with a syndicate of Japanese banks, effective until July 2019, a 1.5 billion U.S. dollar multi-currency committed line of credit also with a syndicate of Japanese banks, effective until December 2018, and a 525 million U.S. dollar multi-currency committed line of credit contracted with a syndicate of foreign banks, effective until March 2018, in all of which Sony Corporation and Sony Global Treasury Services Plc are defined as borrowers. These contracts are aimed at securing sufficient liquidity in a quick and stable manner even in the event of turmoil within the financial and capital markets.

- 14 -
Ⅲ Company Information
(1) Information on the Company’s Shares
i) Total Number of Shares
1) Total Number of Shares
Class Total number of shares authorized to be issued
Common stock 3,600,000,000
Total 3,600,000,000
2) Number of Shares Issued
Class
Number of shares issued Name of Securities Exchanges
where the shares are listed or
authorized Financial
Instruments Firms Association
where the shares are registered
Description As of the end of the
third quarterly period
(December 31, 2017)
As of the filing date of
the Quarterly
Securities Report
(February 8, 2018)
Common
stock 1,265,651,953 1,265,827,151
Tokyo Stock Exchange
New York Stock Exchange
The number of
shares constituting
one full unit is one
hundred (100).
Total 1,265,651,953 1,265,827,151 — —
Notes: 1. The Company’s shares of common stock are listed on the First Section of the Tokyo Stock Exchange in Japan. 2. The number of shares issued as of the filing date of this Quarterly Securities Report (Shihanki Houkokusho) does not
include shares issued upon the exercise of stock acquisition rights (“SARs”) (including the exercise of unsecured convertible bonds with SARs (6th series)) during February 2018, the month in which this Quarterly Securities Report was filed.
ii) Stock Acquisition Rights
Note for readers of this English translation:
The Japanese-language Quarterly Securities Report includes a summary of the main terms and conditions of the
SARs listed below which were issued during the three months ended December 31, 2017. A summary of such terms and
conditions has previously been filed with or submitted to the SEC under Form 6-K or Form S-8. There has been no
change to such terms and conditions since the applicable date of such filings or submissions.
URL: The list of documents previously filed or submitted by the Company
http://www.sec.gov/cgi-bin/browse-edgar?action=getcompany&CIK=0000313838&owner=include&count=40
Stock acquisition rights issued during the three months ended December 31, 2017
Name
(Date of resolution of the Board of Directors)
Number of
SARs issued
Number of shares of
common stock to be issued
or transferred
The thirty-fourth series of Common Stock Acquisition Rights
(October 31, 2017) 13,915 1,391,500
The thirty-fifth series of Common Stock Acquisition Rights
(October 31, 2017) 15,549 1,554,900
iii) Status of the Exercise of Moving Strike Convertible Bonds
Not applicable.

- 15 -
iv) Description of Rights Plan
Not applicable.
v) Changes in the Total Number of Shares Issued and the Amount of Common Stock, etc.
Period
Change in the
total number of
shares issued
Balance of the
total number of
shares issued
Change in
the amount of
common stock
Balance of
the amount of
common stock
Change in the
legal capital
surplus
Balance of the
legal capital
surplus
(Thousands) (Thousands) (Yen in Millions) (Yen in Millions) (Yen in Millions) (Yen in Millions)
From October 1
to December
31, 2017
1,003 1,265,652 1,922 864,078 1,922 1,077,771
Notes: 1. The increase mentioned above is due to the exercise of SARs (including the exercise of unsecured convertible bonds
with SARs (6th series)) and the issuance of new shares as restricted stock compensation. 2. Upon the exercise of SARs during the period from January 1, 2018 to January 31, 2018 the total number of shares
issued increased by 175 thousand shares, and the amount of common stock and the legal capital surplus increased by 332 million yen, respectively.
- 16 -
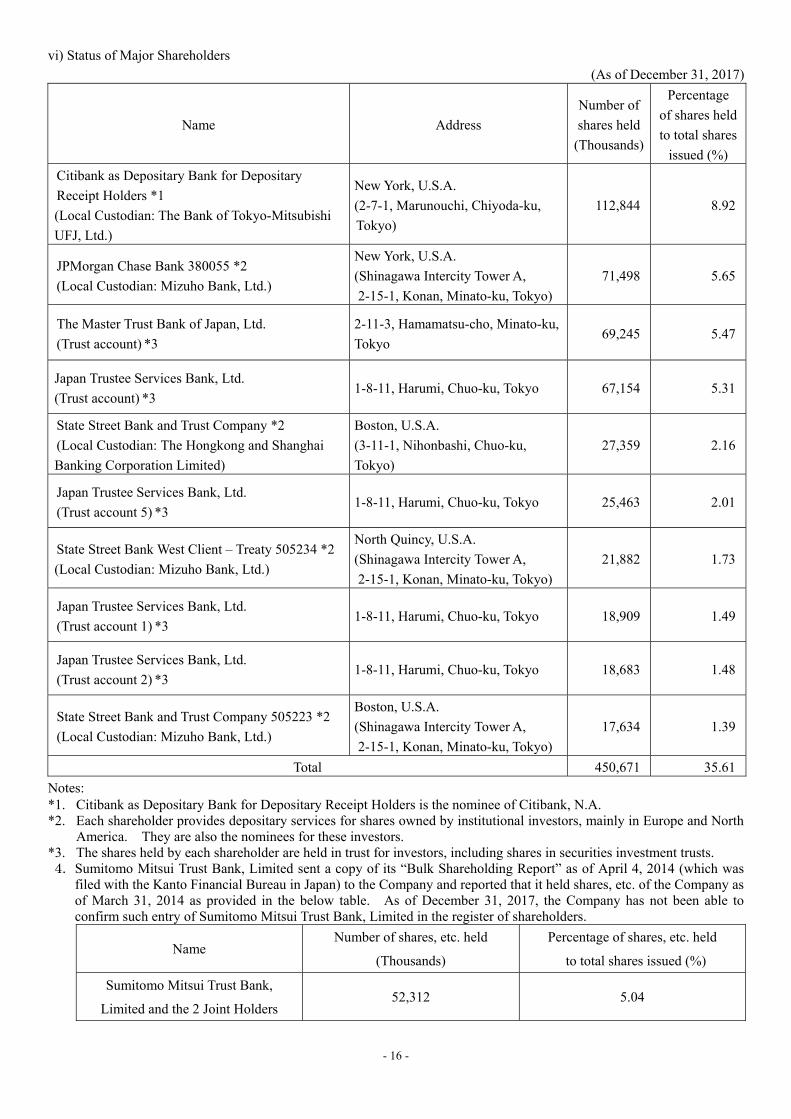
vi) Status of Major Shareholders (As of December 31, 2017)
Name Address
Number of
shares held
(Thousands)
Percentage
of shares held
to total shares
issued (%)
Citibank as Depositary Bank for Depositary
Receipt Holders *1
(Local Custodian: The Bank of Tokyo-Mitsubishi
UFJ, Ltd.)
New York, U.S.A.
(2-7-1, Marunouchi, Chiyoda-ku,
Tokyo)
112,844 8.92
JPMorgan Chase Bank 380055 *2
(Local Custodian: Mizuho Bank, Ltd.)
New York, U.S.A.
(Shinagawa Intercity Tower A,
2-15-1, Konan, Minato-ku, Tokyo)
71,498 5.65
The Master Trust Bank of Japan, Ltd.
(Trust account) *3
2-11-3, Hamamatsu-cho, Minato-ku,
Tokyo 69,245 5.47
Japan Trustee Services Bank, Ltd.
(Trust account) *3 1-8-11, Harumi, Chuo-ku, Tokyo 67,154 5.31
State Street Bank and Trust Company *2
(Local Custodian: The Hongkong and Shanghai
Banking Corporation Limited)
Boston, U.S.A.
(3-11-1, Nihonbashi, Chuo-ku,
Tokyo)
27,359 2.16
Japan Trustee Services Bank, Ltd.
(Trust account 5) *3 1-8-11, Harumi, Chuo-ku, Tokyo 25,463 2.01
State Street Bank West Client – Treaty 505234 *2
(Local Custodian: Mizuho Bank, Ltd.)
North Quincy, U.S.A.
(Shinagawa Intercity Tower A,
2-15-1, Konan, Minato-ku, Tokyo)
21,882 1.73
Japan Trustee Services Bank, Ltd.
(Trust account 1) *3 1-8-11, Harumi, Chuo-ku, Tokyo 18,909 1.49
Japan Trustee Services Bank, Ltd.
(Trust account 2) *3 1-8-11, Harumi, Chuo-ku, Tokyo 18,683 1.48
State Street Bank and Trust Company 505223 *2
(Local Custodian: Mizuho Bank, Ltd.)
Boston, U.S.A.
(Shinagawa Intercity Tower A,
2-15-1, Konan, Minato-ku, Tokyo)
17,634 1.39
Total 450,671 35.61
Notes: *1. Citibank as Depositary Bank for Depositary Receipt Holders is the nominee of Citibank, N.A. *2. Each shareholder provides depositary services for shares owned by institutional investors, mainly in Europe and North
America. They are also the nominees for these investors. *3. The shares held by each shareholder are held in trust for investors, including shares in securities investment trusts. 4. Sumitomo Mitsui Trust Bank, Limited sent a copy of its “Bulk Shareholding Report” as of April 4, 2014 (which was
filed with the Kanto Financial Bureau in Japan) to the Company and reported that it held shares, etc. of the Company as of March 31, 2014 as provided in the below table. As of December 31, 2017, the Company has not been able to confirm such entry of Sumitomo Mitsui Trust Bank, Limited in the register of shareholders.
Name Number of shares, etc. held
(Thousands)
Percentage of shares, etc. held
to total shares issued (%)
Sumitomo Mitsui Trust Bank,
Limited and the 2 Joint Holders 52,312 5.04

- 17 -
5. BlackRock Japan Co., Ltd. filed its “Amendment to the Bulk Shareholding Report” with the Kanto Financial Bureau in Japan as of March 22, 2017 and reported that it held shares of the Company as of March 15, 2017 as provided in the below table. As of December 31, 2017, the Company has not been able to confirm such entry of BlackRock Japan Co., Ltd. in the register of shareholders.
Name Number of shares held
(Thousands)
Percentage of shares held
to total shares issued (%)
BlackRock Japan Co., Ltd.
and the 8 Joint Holders 79,185 6.27
6. Capital Research and Management Company filed its “Amendment to the Bulk Shareholding Report” with the Kanto
Financial Bureau in Japan as of April 7, 2017 and reported that it held shares of the Company as of March 31, 2017 as provided in the below table. As of December 31, 2017, the Company has not been able to confirm such entry of Capital Research and Management Company in the register of shareholders.
Name Number of shares held
(Thousands)
Percentage of shares held
to total shares issued (%)
Capital Research and Management
Company 90,945 7.20
vii) Status of Voting Rights
1) Shares Issued
(As of December 31, 2017)
Classification Number of shares of
common stock
Number of voting rights
(Units) Description
Shares without voting rights — — —
Shares with restricted voting rights
(Treasury stock, etc.) — — —
Shares with restricted voting rights (Others) — — —
Shares with full voting rights
(Treasury stock, etc.) 1,105,600 — —
Shares with full voting rights (Others) 1,262,510,600 12,625,106 —
Shares constituting less than one full unit 2,035,753 —
Shares constituting
less than one full unit
(100 shares)
Total number of shares issued 1,265,651,953 — —
Total voting rights held by all shareholders — 12,625,106 —
Note: Included in “Shares with full voting rights (Others)” under “Number of shares of common stock” are 19,000 shares of common stock held under the name of Japan Securities Depository Center, Incorporated. Also included in “Shares with full voting rights (Others)” under “Number of voting rights (Units)” are 190 units of voting rights relating to the shares of common stock with full voting rights held under the name of Japan Securities Depository Center, Incorporated.
- 18 -
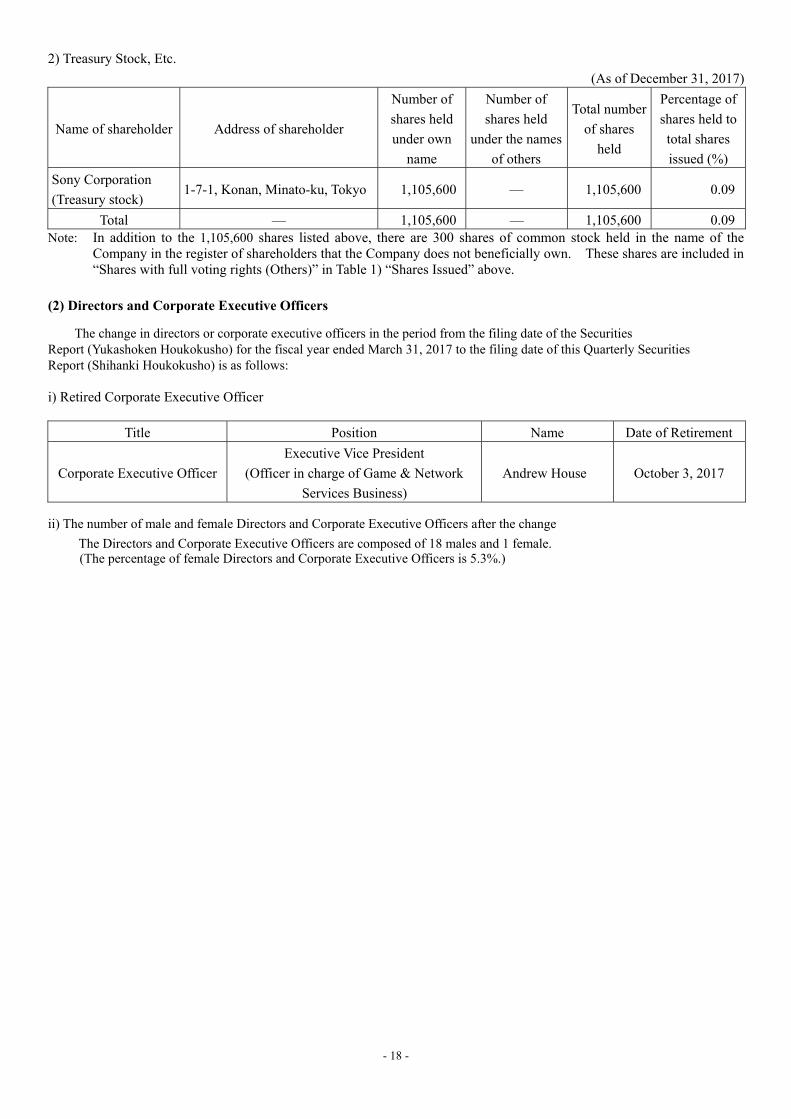
2) Treasury Stock, Etc.
(As of December 31, 2017)
Name of shareholder Address of shareholder
Number of
shares held
under own
name
Number of
shares held
under the names
of others
Total number
of shares
held
Percentage of
shares held to
total shares
issued (%)
Sony Corporation
(Treasury stock) 1-7-1, Konan, Minato-ku, Tokyo 1,105,600 — 1,105,600 0.09
Total — 1,105,600 — 1,105,600 0.09 Note: In addition to the 1,105,600 shares listed above, there are 300 shares of common stock held in the name of the
Company in the register of shareholders that the Company does not beneficially own. These shares are included in “Shares with full voting rights (Others)” in Table 1) “Shares Issued” above.
(2) Directors and Corporate Executive Officers
The change in directors or corporate executive officers in the period from the filing date of the Securities Report (Yukashoken Houkokusho) for the fiscal year ended March 31, 2017 to the filing date of this Quarterly Securities Report (Shihanki Houkokusho) is as follows: i) Retired Corporate Executive Officer
Title Position Name Date of Retirement
Corporate Executive Officer
Executive Vice President
(Officer in charge of Game & Network
Services Business)
Andrew House October 3, 2017
ii) The number of male and female Directors and Corporate Executive Officers after the change
The Directors and Corporate Executive Officers are composed of 18 males and 1 female. (The percentage of female Directors and Corporate Executive Officers is 5.3%.)

- 19 -
IV Financial Statements Page
(1) Consolidated Financial Statements 20
(i) Consolidated Balance Sheets 20
(ii) Consolidated Statements of Income 22
(iii) Consolidated Statements of Comprehensive Income 24
(iv) Consolidated Statements of Cash Flows 25
(2) Other Information 46

- 20 -
(1) Consolidated Financial Statements (i) Consolidated Balance Sheets (Unaudited) Sony Corporation and Consolidated Subsidiaries
Yen in millions
At March 31, 2017
At December 31, 2017
ASSETS Current assets: Cash and cash equivalents 960,142 1,328,925 Marketable securities 1,051,441 1,221,687 Notes and accounts receivable, trade 1,006,961 1,535,912 Allowance for doubtful accounts and sales returns (53,150) (62,135)
Inventories 640,835 753,658 Other receivables 223,632 234,002 Prepaid expenses and other current assets 525,861 548,742
Total current assets 4,355,722 5,560,791
Film costs 336,928 365,783
Investments and advances:
Affiliated companies 149,371 155,303 Securities investments and other 9,962,422 10,401,319
10,111,793 10,556,622
Property, plant and equipment: Land 117,293 114,967 Buildings 666,381 685,576 Machinery and equipment 1,842,852 1,855,459 Construction in progress 28,779 45,041
2,655,305 2,701,043 Less – Accumulated depreciation 1,897,106 1,909,436
758,199 791,607
Other assets: Intangibles, net 584,185 571,027
Goodwill 522,538 552,336
Deferred insurance acquisition costs 568,837 595,180
Deferred income taxes 98,958 91,452
Other 323,396 335,878
2,097,914 2,145,873
Total assets 17,660,556 19,420,676
(Continued on following page.)

- 21 -
Consolidated Balance Sheets (Unaudited)
Yen in millions
At March 31, 2017
At December 31, 2017
LIABILITIES
Current liabilities:
Short-term borrowings 464,655 537,443
Current portion of long-term debt 53,424 245,646
Notes and accounts payable, trade 539,900 658,250
Accounts payable, other and accrued expenses 1,394,758 1,621,542
Accrued income and other taxes 106,037 213,874
Deposits from customers in the banking business 2,071,091 2,159,747
Other 591,874 585,348
Total current liabilities 5,221,739 6,021,850
Long-term debt 681,462 594,195
Accrued pension and severance costs 396,715 403,663
Deferred income taxes 432,824 428,147
Future insurance policy benefits and other 4,834,492 5,104,322
Policyholders’ account in the life insurance business 2,631,073 2,854,660
Other 314,771 284,283
Total liabilities 14,513,076 15,691,120
Redeemable noncontrolling interest 12,058 14,609
Commitments and contingent liabilities
EQUITY
Sony Corporation’s stockholders’ equity:
Common stock, no par value –
At March 31, 2017–Shares authorized: 3,600,000,000, shares issued: 1,263,763,660 860,645
At December 31, 2017–Shares authorized: 3,600,000,000, shares issued: 1,265,651,953 864,078
Additional paid-in capital 1,275,337 1,279,422
Retained earnings 984,368 1,476,194
Accumulated other comprehensive income –
Unrealized gains on securities, net 126,635 131,333
Unrealized gains and losses on derivative instruments, net (58) 92
Pension liability adjustment (308,736) (301,749)
Foreign currency translation adjustments (436,610) (404,996)
(618,769) (575,320)
Treasury stock, at cost
Common stock
At March 31, 2017–1,073,222 shares (4,335)
At December 31, 2017–1,105,679 shares (4,481)
2,497,246 3,039,893
Noncontrolling interests 638,176 675,054
Total equity 3,135,422 3,714,947
Total liabilities and equity 17,660,556 19,420,676
The accompanying notes are an integral part of these statements.

- 22 -
(ii) Consolidated Statements of Income (Unaudited) Sony Corporation and Consolidated Subsidiaries
Yen in millions
Nine months ended December 31
2016 2017
Sales and operating revenue:
Net sales 4,834,013 5,573,273
Financial services revenue 806,954 950,292
Other operating revenue 58,679 69,396
5,699,646 6,592,961
Costs and expenses:
Cost of sales 3,559,927 3,957,700
Selling, general and administrative 1,088,096 1,159,190
Financial services expenses 693,537 810,967
Other operating (income) expense, net 165,454 (40,131)
5,507,014 5,887,726
Equity in net income of affiliated companies 1,679 7,441
Operating income 194,311 712,676
Other income:
Interest and dividends 7,859 16,556
Gain on sale of securities investments, net 155 1,479
Other 1,906 2,529
9,920 20,564
Other expenses:
Interest 11,902 10,782
Loss on devaluation of securities investments 4,860 1,803
Foreign exchange loss, net 19,230 25,154
Other 4,476 4,923
40,468 42,662
Income before income taxes 163,763 690,578
Income taxes 80,931 138,481
Net income 82,832 552,097
Less - Net income attributable to noncontrolling interests 37,193 44,477
Net income attributable to Sony Corporation’s stockholders 45,639 507,620
Yen
Nine months ended December 31
2016 2017
Per share data: - -
Net income attributable to Sony Corporation’s stockholders
– Basic 36.17 401.76
– Diluted 35.43 393.05
The accompanying notes are an integral part of these statements.

- 23 -
Consolidated Statements of Income (Unaudited) Sony Corporation and Consolidated Subsidiaries
Yen
Three months ended December 31
2016 2017
Per share data: - -
Net income attributable to Sony Corporation’s stockholders
– Basic 15.55 234.08
– Diluted 15.24 228.91
The accompanying notes are an integral part of these statements.
Yen in millions
Three months ended December 31
2016 2017
Sales and operating revenue:
Net sales 2,059,578 2,279,714
Financial services revenue 317,342 371,498
Other operating revenue 20,579 21,105
2,397,499 2,672,317
Costs and expenses:
Cost of sales 1,495,036 1,607,962
Selling, general and administrative 411,652 415,532
Financial services expenses 286,740 315,404
Other operating (income) expense, net 113,013 (13,119)
2,306,441 2,325,779
Equity in net income of affiliated companies 1,314 4,299
Operating income 92,372 350,837
Other income:
Interest and dividends 2,502 3,519
Gain on sale of securities investments, net 92 833
Other 189 1,531
2,783 5,883
Other expenses:
Interest 3,749 3,536
Loss on devaluation of securities investments 4,810 1,324
Foreign exchange loss, net 18,420 5,888
Other 1,949 2,853
28,928 13,601
Income before income taxes 66,227 343,119
Income taxes 36,956 28,234
Net income 29,271 314,885
Less - Net income attributable to noncontrolling interests 9,640 18,988
Net income attributable to Sony Corporation’s stockholders 19,631 295,897

- 24 -
(iii) Consolidated Statements of Comprehensive Income (Unaudited) Sony Corporation and Consolidated Subsidiaries
Yen in millions
Nine months ended December 31
2016 2017
Net income 82,832 552,097
Other comprehensive income, net of tax ―
Unrealized gains (losses) on securities (25,645) 7,030
Unrealized gains on derivative instruments 3,690 150
Pension liability adjustment 9,297 7,009
Foreign currency translation adjustments 5,377 33,742
Total comprehensive income 75,551 600,028
Less – Comprehensive income attributable to noncontrolling interests 21,307 48,959
Comprehensive income attributable to Sony Corporation's stockholders 54,244 551,069
Yen in millions
Three months ended December 31
2016 2017
Net income 29,271 314,885
Other comprehensive income, net of tax ―
Unrealized gains (losses) on securities (8,314) 11,688
Unrealized gains (losses) on derivative instruments 3,430 (79)
Pension liability adjustment 3,250 2,365
Foreign currency translation adjustments 112,440 3,655
Total comprehensive income 140,077 332,514
Less – Comprehensive income attributable to noncontrolling interests 2,152 21,603
Comprehensive income attributable to Sony Corporation's stockholders 137,925 310,911
The accompanying notes are an integral part of these statements.

- 25 -
(iv) Consolidated Statements of Cash Flows (Unaudited) Sony Corporation and Consolidated Subsidiaries
(Continued on following page.)
Yen in millions
Nine months ended December 31
2016 2017
Cash flows from operating activities:
Net income 82,832 552,097
Adjustments to reconcile net income to net cash
provided by operating activities– Depreciation and amortization, including amortization
of deferred insurance acquisition costs 259,554 258,187
Amortization of film costs 190,539 259,709
Accrual for pension and severance costs, less payments 7,270 3,948
Other operating (income) expense, net 165,454 (40,131)
Loss on sale or devaluation of securities investments, net 4,706 324 Gain on revaluation of marketable securities held in the
financial services business for trading purposes, net (42,727) (109,888) Loss on revaluation or impairment of securities investments
held in the financial services business, net 29 213 Deferred income taxes 4,450 (4,551)
Equity in net (income) loss of affiliated companies, net of dividends 5,770 (2,125) Changes in assets and liabilities: Increase in notes and accounts receivable, trade (372,978) (488,285) Increase in inventories (18,622) (88,954) Increase in film costs (242,875) (279,082) Increase in notes and accounts payable, trade 87,698 90,484 Increase in accrued income and other taxes 65,951 70,983 Increase in future insurance policy benefits and other 336,157 424,084 Increase in deferred insurance acquisition costs (70,070) (65,248)
Increase in marketable securities held in the financial services business for trading purposes (60,868) (64,727)
Increase in other current assets (46,705) (25,633) Increase in other current liabilities 55,453 189,524 Other (97,766) (20,600)
Net cash provided by operating activities 313,252 660,329

- 26 -
Consolidated Statements of Cash Flows (Unaudited)
Yen in millions
Nine months ended December 31
2016 2017
Cash flows from investing activities:
Payments for purchases of fixed assets (260,457) (189,780)
Proceeds from sales of fixed assets 9,134 15,095
Payments for investments and advances by financial services business (943,712) (671,982)
Payments for investments and advances (other than financial services business) (7,487) (16,526)
Proceeds from sales or return of investments and collections of advances by financial services business 212,624 256,652
Proceeds from sales or return of investments and collections of advances (other than financial services business) 13,837 5,404
Proceeds from sales of businesses 3,262 44,624
Other (8,715) (10,400)
Net cash used in investing activities (981,514) (566,913)
Cash flows from financing activities:
Proceeds from issuance of long-term debt 255,416 92,833
Payments of long-term debt (182,670) (20,570)
Increase in short-term borrowings, net 275,084 72,913
Increase in deposits from customers in the financial services business, net 254,279 154,374
Dividends paid (25,308) (27,750)
Payment for purchase of Sony/ATV shares from noncontrolling interests (76,565) -
Other (32,385) (6,612)
Net cash provided by financing activities 467,851 265,188
Effect of exchange rate changes on cash and cash equivalents (11,525) 10,179
Net increase (decrease) in cash and cash equivalents (211,936) 368,783
Cash and cash equivalents at beginning of the fiscal year 983,612 960,142
Cash and cash equivalents at end of the period 771,676 1,328,925
The accompanying notes are an integral part of these statements.

- 27 -
Index to Notes to Consolidated Financial Statements Sony Corporation and Consolidated Subsidiaries
Notes to Consolidated Financial Statements Page
1. Summary of significant accounting policies 28
2. Marketable securities and securities investments 29
3. Fair value measurements 30
4. Supplemental equity and comprehensive income information 32
5. Reconciliation of the differences between basic and diluted EPS 34
6. Commitments, contingent liabilities and other 35
7. Business segment information 37

- 28 -
Notes to Consolidated Financial Statements (Unaudited) Sony Corporation and Consolidated Subsidiaries
1. Summary of significant accounting policies
The accompanying consolidated financial statements are presented in accordance with accounting principles generally accepted in the United States of America (“U.S. GAAP”), except for certain disclosures which have been omitted. Certain adjustments and reclassifications have been incorporated in the accompanying consolidated financial statements to conform with U.S. GAAP. These adjustments were not recorded in the statutory books and records as Sony Corporation and its subsidiaries in Japan maintain their records and prepare their statutory financial statements in accordance with accounting principles generally accepted in Japan while its foreign subsidiaries maintain their records and prepare their financial statements in conformity with accounting principles generally accepted in the countries of their domiciles. (1) Accounting methods used specifically for interim consolidated financial statements:
Income Taxes -
Sony estimates the annual effective tax rate (“ETR”) derived from a projected annual net income before taxes and calculates the interim period income tax provision based on the year-to-date income tax provision computed by applying the ETR to the year-to-date net income before taxes at the end of each interim period. The income tax provision based on the ETR reflects anticipated income tax credits and net operating loss carryforwards; however, it excludes the income tax provision related to significant unusual or infrequent transactions. Such income tax provision is separately reported from the provision based on the ETR in the interim period in which it occurs.
(2) Reclassifications:
Certain reclassifications of the financial statements and accompanying footnotes for the nine and three months ended December 31, 2016 have been made to conform to the presentation for the nine and three months ended December 31, 2017.

- 29 -
2. Marketable securities and securities investments
Marketable securities and securities investments, primarily included in the Financial Services segment, are comprised of debt and equity securities for which the aggregate cost, gross unrealized gains and losses and fair value pertaining to available-for-sale securities and held-to-maturity securities are as follows:
Yen in millions March 31, 2017 December 31, 2017
Cost
Gross unrealized
gains
Gross unrealized
losses Fair value Cost
Gross unrealized
gains
Gross unrealized
losses Fair value Available-for-sale: Debt securities:
Japanese national government bonds
1,161,493 182,836 (928) 1,343,401 1,189,954 180,640 (504) 1,370,090
Japanese local government bonds
60,450 144 (63) 60,531 66,022 97 (105) 66,014
Japanese corporate bonds
163,785
7,864
(1,846)
169,803 194,204 8,572 (1,386) 201,390
Foreign government bonds
27,601
359
(918)
27,042 47,633 2,203 (314) 49,522
Foreign corporate bonds 396,097 4,168 (719) 399,546 375,729 2,372 (444) 377,657
Other 15,192 - (0) 15,192 82,236 1 - 82,237
1,824,618 195,371 (4,474) 2,015,515 1,955,778 193,885 (2,753) 2,146,910
Equity securities 55,928 69,937 (377) 125,488 55,711 78,807 (269) 134,249 Held-to-maturity securities:
Japanese national government bonds *
5,661,191
1,520,904
(30,553)
7,151,542 5,832,482 1,547,982 (28,878) 7,351,586
Japanese local government bonds
4,101
449
-
4,550 3,913 420 - 4,333
Japanese corporate
bonds
230,011
12,346
(22,071)
220,286 320,165 13,646 (21,692) 312,119
Foreign government bonds
253,019
5,269
(22,868)
235,420 279,810 15,318 (12,014) 283,114
Foreign corporate bonds 198 18 - 216 198 15 - 213
6,148,520 1,538,986 (75,492) 7,612,014 6,436,568 1,577,381 (62,584) 7,951,365
Total 8,029,066 1,804,294 (80,343) 9,753,017 8,448,057 1,850,073 (65,606) 10,232,524 * As of December 31, 2017, held-to-maturity securities include 268,725 million yen of pledged Japanese national government bonds as collateral for transactions with short-term repurchase agreement.

- 30 -
3. Fair value measurements
The fair value of Sony’s assets and liabilities that are measured at fair value on a recurring basis are as follows:
Yen in millions March 31, 2017 Presentation in the consolidated balance sheets
Level 1 Level 2 Level 3 Total
Marketable securities
Securities investments
and other
Other current assets/
liabilities
Other noncurrent
assets/ liabilities
Assets:
Trading securities 611,108 310,212 - 921,320 921,320 - - - Available-for-sale
securities
Debt securities Japanese national
government bonds
- 1,343,401 - 1,343,401 18,483 1,324,918 - - Japanese local
government bonds
- 60,531 - 60,531 8,518 52,013 - - Japanese corporate
bonds
- 168,493 1,310 169,803 8,433 161,370 - - Foreign government
bonds
- 27,042 - 27,042 1,007 26,035 - - Foreign corporate
bonds
- 358,369 41,177 399,546 86,708 312,838 - - Other - - 15,192 15,192 - 15,192 - - Equity securities 125,306 182 - 125,488 - 125,488 - -
Other investments *1 6,589 4,525 10,483 21,597 - 21,597 - - Derivative assets *2, *3 981 26,279 - 27,260 - - 25,409 1,851 Total assets 743,984 2,299,034 68,162 3,111,180 1,044,469 2,039,451 25,409 1,851
Liabilities: Derivative liabilities *2, *3 520 33,930 - 34,450 - - 15,743 18,707 Total liabilities 520 33,930 - 34,450 - - 15,743 18,707

- 31 -
Yen in millions December 31, 2017 Presentation in the consolidated balance sheets
Level 1 Level 2 Level 3 Total
Marketable securities
Securities investments
and other
Other current assets/
liabilities
Other noncurrent
assets/ liabilities
Assets:
Trading securities 742,836 343,916 - 1,086,752 1,086,752 - - - Available-for-sale
securities
Debt securities Japanese national
government bonds
- 1,370,090 - 1,370,090 20,834 1,349,256 - - Japanese local
government bonds
- 66,014 - 66,014 9,388 56,626 - - Japanese corporate
bonds
- 201,390 - 201,390 9,138 192,252 - - Foreign government
bonds
- 49,522 - 49,522 - 49,522 - - Foreign corporate
bonds
- 349,534 28,123 377,657 89,771 287,886 - - Other - - 82,237 82,237 - 82,237 - - Equity securities 133,919 330 - 134,249 - 134,249 - -
Other investments *1 7,047 5,463 9,731 22,241 - 22,241 - - Derivative assets *2, *3 613 16,736 - 17,349 - - 15,358 1,991 Total assets 884,415 2,402,995 120,091 3,407,501 1,215,883 2,174,269 15,358 1,991
Liabilities: Derivative liabilities *2, *3 616 35,822 - 36,438 - - 20,153 16,285 Total liabilities 616 35,822 - 36,438 - - 20,153 16,285
*1 Other investments include certain hybrid financial instruments and certain private equity investments. *2 Derivative assets and liabilities are recognized and disclosed on a gross basis.
*3 The potential effect of offsetting on assets and liabilities, which primarily consists of derivatives subject to master netting agreements and/or collateral, is insignificant.
- 32 -
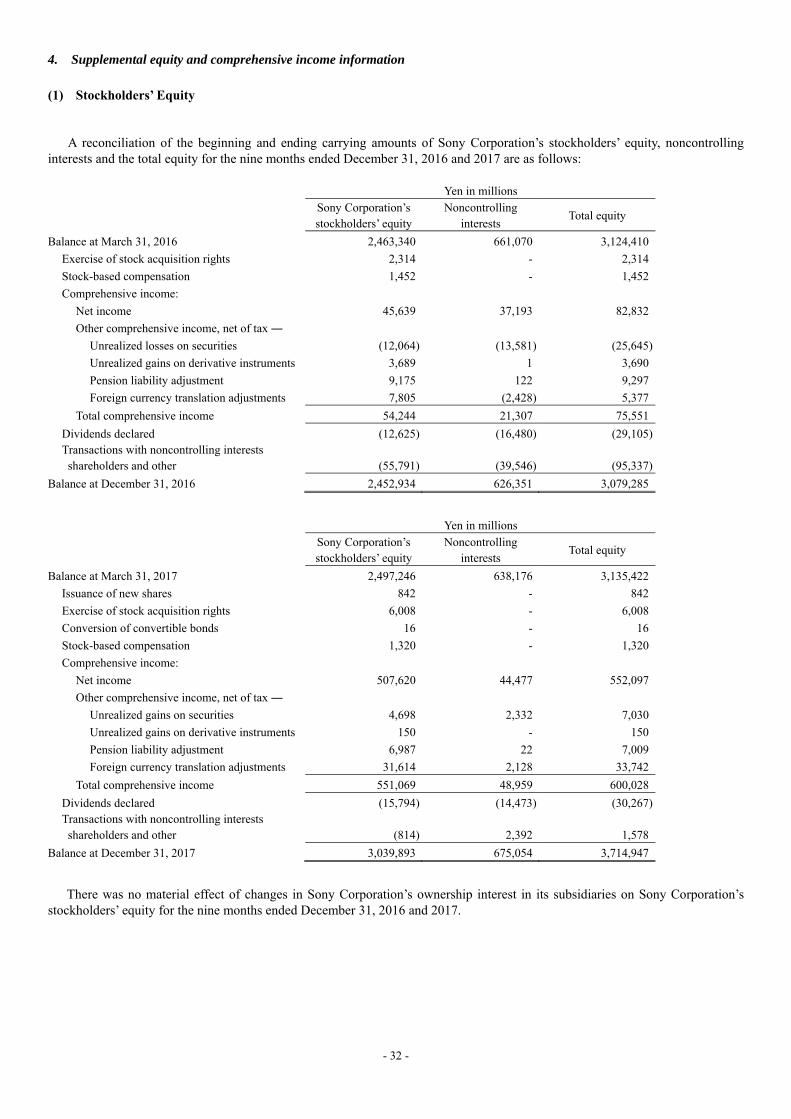
4. Supplemental equity and comprehensive income information
(1) Stockholders’ Equity
A reconciliation of the beginning and ending carrying amounts of Sony Corporation’s stockholders’ equity, noncontrolling
interests and the total equity for the nine months ended December 31, 2016 and 2017 are as follows: Yen in millions
Sony Corporation’s stockholders’ equity
Noncontrolling interests
Total equity
Balance at March 31, 2016 2,463,340 661,070 3,124,410
Exercise of stock acquisition rights 2,314 - 2,314
Stock-based compensation 1,452 - 1,452
Comprehensive income:
Net income 45,639 37,193 82,832
Other comprehensive income, net of tax ―
Unrealized losses on securities (12,064) (13,581) (25,645)
Unrealized gains on derivative instruments 3,689 1 3,690
Pension liability adjustment 9,175 122 9,297
Foreign currency translation adjustments 7,805 (2,428) 5,377
Total comprehensive income 54,244 21,307 75,551
Dividends declared (12,625) (16,480) (29,105) Transactions with noncontrolling interests shareholders and other (55,791) (39,546) (95,337)
Balance at December 31, 2016 2,452,934 626,351 3,079,285
Yen in millions
Sony Corporation’s stockholders’ equity
Noncontrolling interests
Total equity
Balance at March 31, 2017 2,497,246 638,176 3,135,422
Issuance of new shares 842 - 842
Exercise of stock acquisition rights 6,008 - 6,008
Conversion of convertible bonds 16 - 16
Stock-based compensation 1,320 - 1,320
Comprehensive income:
Net income 507,620 44,477 552,097
Other comprehensive income, net of tax ―
Unrealized gains on securities 4,698 2,332 7,030
Unrealized gains on derivative instruments 150 - 150
Pension liability adjustment 6,987 22 7,009
Foreign currency translation adjustments 31,614 2,128 33,742
Total comprehensive income 551,069 48,959 600,028
Dividends declared (15,794) (14,473) (30,267) Transactions with noncontrolling interests shareholders and other (814) 2,392 1,578
Balance at December 31, 2017 3,039,893 675,054 3,714,947
There was no material effect of changes in Sony Corporation’s ownership interest in its subsidiaries on Sony Corporation’s stockholders’ equity for the nine months ended December 31, 2016 and 2017.
- 33 -
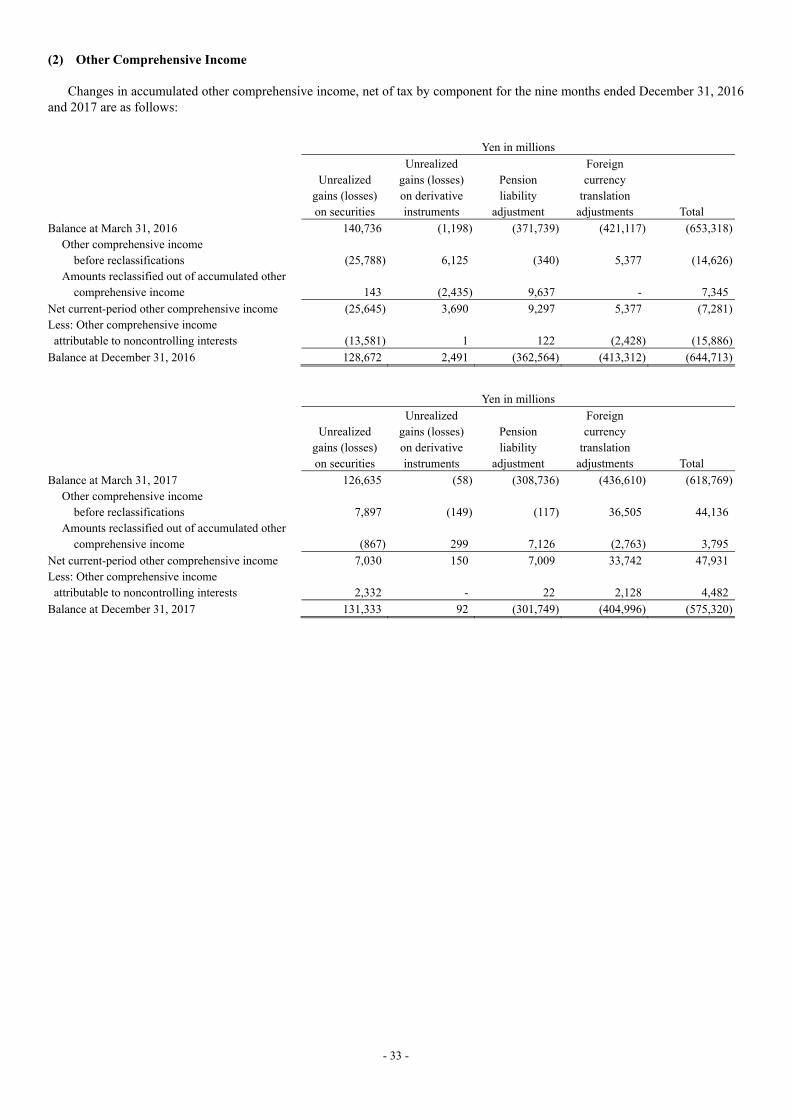
(2) Other Comprehensive Income
Changes in accumulated other comprehensive income, net of tax by component for the nine months ended December 31, 2016 and 2017 are as follows:
Yen in millions
Unrealized gains (losses) on securities
Unrealized gains (losses) on derivative instruments
Pension liability
adjustment
Foreign currency
translation adjustments Total
Balance at March 31, 2016 140,736 (1,198) (371,739) (421,117) (653,318) Other comprehensive income
before reclassifications (25,788) 6,125 (340) 5,377 (14,626) Amounts reclassified out of accumulated other
comprehensive income 143 (2,435) 9,637 - 7,345
Net current-period other comprehensive income (25,645) 3,690 9,297 5,377 (7,281) Less: Other comprehensive income attributable to noncontrolling interests (13,581) 1 122 (2,428) (15,886)
Balance at December 31, 2016 128,672 2,491 (362,564) (413,312) (644,713)
Yen in millions
Unrealized gains (losses) on securities
Unrealized gains (losses) on derivative instruments
Pension liability
adjustment
Foreign currency
translation adjustments Total
Balance at March 31, 2017 126,635 (58) (308,736) (436,610) (618,769) Other comprehensive income
before reclassifications 7,897 (149) (117) 36,505 44,136 Amounts reclassified out of accumulated other
comprehensive income (867) 299 7,126 (2,763) 3,795
Net current-period other comprehensive income 7,030 150 7,009 33,742 47,931 Less: Other comprehensive income attributable to noncontrolling interests 2,332 - 22 2,128 4,482
Balance at December 31, 2017 131,333 92 (301,749) (404,996) (575,320)

- 34 -
5. Reconciliation of the differences between basic and diluted EPS
Reconciliation of the differences between basic and diluted net income attributable to Sony Corporation’s stockholders per share (“EPS”) for the nine and three months ended December 31, 2016 and 2017 is as follows:
Yen in millions
Nine months ended December 31
2016 2017
Net income attributable to Sony Corporation’s stockholders for basic and diluted EPS computation
45,639 507,620
Thousands of shares
Weighted-average shares outstanding 1,261,862 1,263,485
Effect of dilutive securities:
Stock acquisition rights 2,237 4,051
Zero coupon convertible bonds 23,962 23,961
Weighted-average shares for diluted EPS computation 1,288,061 1,291,497
Yen
Basic EPS 36.17 401.76
Diluted EPS 35.43 393.05
Potential shares of common stock that were excluded from the computation of diluted EPS for the nine months ended
December 31, 2016 and 2017 were 8,014 thousand shares and 2,946 thousand shares, respectively. The potential shares related to stock acquisition rights were excluded as anti-dilutive for the nine months ended December 31, 2016 and 2017 when the exercise price for those shares was in excess of the average market value of Sony’s common stock for the period. The zero coupon convertible bonds issued in July 2015 were included in the diluted EPS calculation under the if-converted method beginning upon issuance. Yen in millions
Three months ended December 31
2016 2017
Net income attributable to Sony Corporation’s stockholders for basic and diluted EPS computation
19,631 295,897
Thousands of shares
Weighted-average shares outstanding 1,262,223 1,264,083
Effect of dilutive securities:
Stock acquisition rights 2,187 4,572
Zero coupon convertible bonds 23,962 23,960
Weighted-average shares for diluted EPS computation 1,288,372 1,292,615
Yen
Basic EPS 15.55 234.08
Diluted EPS 15.24 228.91
Potential shares of common stock that were excluded from the computation of diluted EPS for the three months ended
December 31, 2016 and 2017 were 8,014 thousand shares and 2,946 thousand shares, respectively. The potential shares related to stock acquisition rights were excluded as anti-dilutive for the three months ended December 31, 2016 and 2017 when the exercise price for those shares was in excess of the average market value of Sony’s common stock for the period. The zero coupon convertible bonds issued in July 2015 were included in the diluted EPS calculation under the if-converted method beginning upon issuance.

- 35 -
6. Commitments, contingent liabilities and other
(1) Loan commitments
Subsidiaries in the Financial Services segment have entered into loan agreements with their customers in accordance with the condition of the contracts. As of December 31, 2017, the total unused portion of the lines of credit extended under these contracts was 31,817 million yen. The aggregate amounts of future year-by-year payments for these loan commitments cannot be determined.
(2) Purchase commitments and other
Purchase commitments and other outstanding commitments as of December 31, 2017 amounted to 410,064 million yen. The major components of these commitments are as follows:
Certain subsidiaries in the Pictures segment have entered into agreements with creative talent for the development and
production of motion pictures and television programming as well as agreements with third parties to acquire completed motion pictures, or certain rights therein, and to acquire the rights to broadcast certain live action sporting events. These agreements cover various periods mainly within two years. As of December 31, 2017, these subsidiaries were committed to make payments under such contracts of 118,983 million yen.
Certain subsidiaries in the Music segment have entered into contracts with recording artists, songwriters and companies for the
future production, distribution and/or licensing of music product. These contracts cover various periods mainly within five years. As of December 31, 2017, these subsidiaries were committed to make payments of 78,103 million yen under such contracts.
A subsidiary in the Game & Network Services segment has entered into contracts for programming content. These contracts
cover various periods mainly within two years. As of December 31, 2017, this subsidiary was committed to make payments of 33,134 million yen under such contracts.
Sony has entered into sponsorship contracts related to advertising and promotional rights. These contracts cover various
periods mainly within two years. As of December 31, 2017, Sony has committed to make payments of 6,710 million yen under such contracts.
(3) Litigation
Beginning in 2009, the U.S. Department of Justice (“DOJ”), the European Commission and certain other governmental agencies outside the United States have conducted investigations relating to competition in the optical disk drives market. Sony Corporation and/or certain of its subsidiaries have been subject to these investigations. Sony understands that the investigations of several agencies, including the DOJ, have ended, and only one agency continues to investigate. However, proceedings initiated by the European Commission as a result of its investigation continue. In October 2015, the European Commission adopted a decision in which it fined Sony Corporation and certain of its subsidiaries 31 million euros; however, Sony filed an appeal against the decision with the European Union’s General Court. In addition, a number of direct and indirect purchaser lawsuits, including class actions, have been filed in certain jurisdictions in which the plaintiffs allege that Sony Corporation and certain of its subsidiaries violated antitrust laws and seek recovery of damages and other remedies. Certain of these lawsuits have been settled, including the class actions brought by the direct and indirect purchasers in the United States; however, certain other lawsuits continue. Based on the stage of the pending proceedings, it is not possible to estimate the amount of losses or range of possible losses, if any, that might ultimately result from adverse judgments, settlements or other resolution of all of these matters.
Beginning in 2011, the DOJ, the European Commission and certain other governmental agencies outside the United States
conducted investigations relating to competition in the secondary batteries market. Sony Corporation and/or certain of its subsidiaries were subject to these investigations. Sony understands that the investigations by these agencies, including the DOJ and the European Commission, have ended or are no longer active. With respect to the investigation by the European Commission, in December 2016, Sony Corporation and certain of its subsidiaries reached a settlement with the European Commission to pay a fine of approximately 29.8 million euros. In addition, a number of direct and indirect purchaser lawsuits, including class actions, have been filed in certain jurisdictions in which the plaintiffs allege that Sony Corporation and certain of its subsidiaries violated antitrust laws and seek recovery of damages and other remedies. Certain of these lawsuits have been settled, including the class actions brought by the direct and indirect purchasers in the United States; however, certain other lawsuits continue. Based on the stage of the pending proceedings, it is not possible to estimate the amount of losses or range of possible losses, if any, that might ultimately result from adverse judgments, settlements or other resolution of all of these matters.
In addition, Sony Corporation and certain of its subsidiaries are defendants or otherwise involved in other pending legal and
regulatory proceedings. However, based upon the information currently available, Sony believes that the outcome from such legal and regulatory proceedings would not have a material impact on Sony’s results of operations and financial position.
- 36 -
(4) Guarantees
Sony has issued guarantees that contingently require payments to guaranteed parties if certain specified events or conditions occur. The maximum potential amount of future payments under these guarantees as of December 31, 2017 amounted to 3,210 million yen.

- 37 -
7. Business segment information
The reportable segments presented below are the segments of Sony for which separate financial information is available and for which operating profit or loss amounts are evaluated regularly by the chief operating decision maker (“CODM”) in deciding how to allocate resources and in assessing performance. The CODM does not evaluate segments using discrete asset information. Sony’s CODM is its Chief Executive Officer and President.
Sony realigned its business segments from the first quarter of the fiscal year ending March 31, 2018. As a result of this
realignment, the operation of the former Components segment is now included in All Other. In connection with this realignment, the sales and operating revenue and operating income (loss) of each segment for the comparable period have been reclassified to conform to the current presentation.
The Game & Network Services (“G&NS”) segment includes the manufacture and sales of home gaming products, network
services businesses and production and sales of software. The Music segment includes the Recorded Music, Music Publishing and Visual Media and Platform businesses. The Pictures segment includes the Motion Pictures, Television Productions and Media Networks businesses. The Home Entertainment & Sound (“HE&S”) segment includes Televisions as well as Audio and Video businesses. The Imaging Products & Solutions (“IP&S”) segment includes the Still and Video Cameras business. The Mobile Communications (“MC”) segment includes the manufacture and sales of mobile phones and Internet-related service businesses. The Semiconductors segment includes the image sensors business. The Financial Services segment primarily represents individual life insurance and non-life insurance businesses in the Japanese market and a bank business in Japan. All Other consists of various operating activities, including the overseas disc manufacturing, recording media and battery businesses. Sony’s products and services are generally unique to a single operating segment.

- 38 -
Business segments - Sales and operating revenue:
Yen in millions
Nine months ended December 31
2016 2017
Sales and operating revenue: Game & Network Services -
Customers 1,212,613 1,418,955 Intersegment 55,345 80,277
Total 1,267,958 1,499,232 Music -
Customers 458,256 582,180 Intersegment 12,366 11,387
Total 470,622 593,567 Pictures -
Customers 599,920 709,458 Intersegment 665 673
Total 600,585 710,131 Home Entertainment & Sound -
Customers 820,799 986,839 Intersegment 3,422 808
Total 824,221 987,647 Imaging Products & Solutions -
Customers 419,662 488,399 Intersegment 5,055 5,058
Total 424,717 493,457 Mobile Communications -
Customers 598,855 564,025 Intersegment 4,435 6,746
Total 603,290 570,771 Semiconductors -
Customers 484,332 584,389 Intersegment 87,714 99,165
Total 572,046 683,554 Financial Services -
Customers 806,954 950,292 Intersegment 5,417 5,363
Total 812,371 955,655 All Other -
Customers 276,660 286,307 Intersegment 57,113 44,335
Total 333,773 330,642 Corporate and elimination (209,937) (231,695)
Consolidated total 5,699,646 6,592,961
G&NS intersegment amounts primarily consist of transactions with All Other. Semiconductors intersegment amounts primarily consist of transactions with the MC segment, the G&NS segment and the
IP&S segment. All Other intersegment amounts primarily consist of transactions with the Pictures segment, the Music segment and the G&NS
segment.
Corporate and elimination includes certain brand and patent royalty income.

- 39 -
Yen in millions
Three months ended December 31
2016 2017
Sales and operating revenue: Game & Network Services -
Customers 596,997 681,649 Intersegment 20,702 36,317
Total 617,699 717,966 Music -
Customers 173,218 214,267 Intersegment 5,289 4,162
Total 178,507 218,429 Pictures -
Customers 224,771 260,050 Intersegment 385 267
Total 225,156 260,317 Home Entertainment & Sound -
Customers 351,983 429,604 Intersegment 1,442 243
Total 353,425 429,847 Imaging Products & Solutions -
Customers 165,260 179,112 Intersegment 1,859 1,990
Total 167,119 181,102 Mobile Communications -
Customers 247,173 215,141 Intersegment 1,424 2,402
Total 248,597 217,543 Semiconductors -
Customers 205,021 218,303 Intersegment 28,847 32,627
Total 233,868 250,930 Financial Services -
Customers 317,342 371,498 Intersegment 1,800 1,773
Total 319,142 373,271 All Other -
Customers 109,933 96,611 Intersegment 21,713 11,971
Total 131,646 108,582 Corporate and elimination (77,660) (85,670)
Consolidated total 2,397,499 2,672,317
G&NS intersegment amounts primarily consist of transactions with All Other. Semiconductors intersegment amounts primarily consist of transactions with the MC segment, the G&NS segment and the
IP&S segment. All Other intersegment amounts primarily consist of transactions with the Pictures segment, the Music segment and the G&NS
segment.
Corporate and elimination includes certain brand and patent royalty income.

- 40 -
Segment profit or loss:
Yen in millions
Nine months ended December 31
2016 2017
Operating income (loss): Game & Network Services 113,051 157,847 Music 60,373 96,878 Pictures (114,207) 8,688 Home Entertainment & Sound 63,731 93,183 Imaging Products & Solutions 43,467 68,056 Mobile Communications 25,331 16,964 Semiconductors (20,567) 165,370 Financial Services 111,106 139,109 All Other (41,604) (6,004)
Total 240,681 740,091 Corporate and elimination (46,370) (27,415)
Consolidated operating income 194,311 712,676
Operating income (loss) is sales and operating revenue less costs and expenses, and includes equity in net income (loss) of
affiliated companies.
Corporate and elimination includes headquarters restructuring costs and certain other corporate expenses, including the amortization of certain intellectual property assets such as the cross-licensing of intangible assets acquired from Ericsson at the time of the Sony Mobile Communications acquisition, which are not allocated to segments.
Yen in millions
Three months ended December 31
2016 2017
Operating income (loss): Game & Network Services 50,028 85,364 Music 27,982 39,342 Pictures (106,774) 10,489 Home Entertainment & Sound 25,934 46,213 Imaging Products & Solutions 21,101 25,982 Mobile Communications 21,218 15,801 Semiconductors 27,166 60,558 Financial Services 28,996 56,287 All Other (2,049) 2,255
Total 93,602 342,291 Corporate and elimination (1,230) 8,546
Consolidated operating income 92,372 350,837
Operating income (loss) is sales and operating revenue less costs and expenses, and includes equity in net income (loss) of
affiliated companies. Corporate and elimination includes headquarters restructuring costs and certain other corporate expenses, including the
amortization of certain intellectual property assets such as the cross-licensing of intangible assets acquired from Ericsson at the time of the Sony Mobile Communications acquisition, which are not allocated to segments.

- 41 -
Other Significant Items:
The following table includes a breakdown of sales and operating revenue to external customers by product category for certain segments. Sony management views each segment as a single operating segment.
Yen in millions
Nine months ended December 31
Sales and operating revenue: 2016 2017
Game & Network Services
Hardware 505,409 506,366
Network 504,868 718,695
Other 202,336 193,894
Total 1,212,613 1,418,955
Music
Recorded Music 294,296 337,238
Music Publishing 46,791 54,693
Visual Media and Platform 117,169 190,249
Total 458,256 582,180
Pictures
Motion Pictures 265,701 302,005
Television Productions 168,661 201,514
Media Networks 165,558 205,939
Total 599,920 709,458
Home Entertainment & Sound
Televisions 579,811 700,403
Audio and Video 239,770 284,664
Other 1,218 1,772
Total 820,799 986,839
Imaging Products & Solutions
Still and Video Cameras 267,962 326,362
Other 151,700 162,037
Total 419,662 488,399
Mobile Communications 598,855 564,025
Semiconductors 484,332 584,389
Financial Services 806,954 950,292
All Other 276,660 286,307
Corporate 21,595 22,117
Consolidated total 5,699,646 6,592,961

- 42 -
Yen in millions
Three months ended December 31
Sales and operating revenue: 2016 2017
Game & Network Services
Hardware 279,858 270,653
Network 212,701 300,407
Other 104,438 110,589
Total 596,997 681,649
Music
Recorded Music 114,833 128,239
Music Publishing 15,549 18,334
Visual Media and Platform 42,836 67,694
Total 173,218 214,267
Pictures
Motion Pictures 96,427 106,931
Television Productions 73,044 82,227
Media Networks 55,300 70,892
Total 224,771 260,050
Home Entertainment & Sound
Televisions 244,421 301,476
Audio and Video 106,916 127,303
Other 646 825
Total 351,983 429,604
Imaging Products & Solutions
Still and Video Cameras 110,962 121,156
Other 54,298 57,956
Total 165,260 179,112
Mobile Communications 247,173 215,141
Semiconductors 205,021 218,303
Financial Services 317,342 371,498
All Other 109,933 96,611
Corporate 5,801 6,082
Consolidated total 2,397,499 2,672,317
In the G&NS segment, Hardware includes home and portable game consoles; Network includes network services relating to
game, video and music content provided by Sony Interactive Entertainment; Other includes packaged software and peripheral devices. In the Music segment, Recorded Music includes the distribution of physical and digital recorded music and revenue derived from artists’ live performances; Music Publishing includes the management and licensing of the words and music of songs; Visual Media and Platform includes the production and distribution of animation titles, including game applications based on the animation titles, and various service offerings for music and visual products. In the Pictures segment, Motion Pictures includes the worldwide production, acquisition and distribution of motion pictures and direct-to-video content; Television Productions includes the production, acquisition and distribution of television programming; Media Networks includes the operation of television and digital networks worldwide. In the HE&S segment, Televisions includes LCD and OLED televisions; Audio and Video includes Blu-ray disc players and recorders, home audio, headphones and memory-based portable audio devices. In the IP&S segment, Still and Video Cameras includes interchangeable lens cameras, compact digital cameras, consumer video cameras and video cameras for broadcast; Other includes display products such as projectors and medical equipment.

- 43 -
Yen in millions
Nine months ended December 31
2016 2017
Depreciation and amortization: Game & Network Services 18,803 21,486 Music 11,443 12,833 Pictures 14,733 18,190 Home Entertainment & Sound 14,732 15,611 Imaging Products & Solutions 18,627 17,717 Mobile Communications 14,998 14,223 Semiconductors 75,997 73,394 Financial Services, including deferred insurance acquisition costs 52,350 47,887 All Other 5,447 4,385
Total 227,130 225,726
Corporate 32,424 32,461
Consolidated total 259,554 258,187
Yen in millions
Nine months ended December 31, 2016 Total net
restructuring charges
Depreciation
associated with restructured assets
Total
Restructuring charges and associated depreciation: Game & Network Services 6 - 6 Music 1,655 - 1,655 Pictures 1,643 (0) 1,643 Home Entertainment & Sound 542 - 542 Imaging Products & Solutions 174 - 174 Mobile Communications 65 127 192 Semiconductors (0) - (0) Financial Services - - - All Other and Corporate 35,162 32 35,194
Consolidated total 39,247 159 39,406
Yen in millions
Nine months ended December 31, 2017
Total net
restructuring charges
Depreciation
associated with restructured assets
Total
Restructuring charges and associated depreciation: Game & Network Services - - - Music 1,816 - 1,816 Pictures 482 - 482 Home Entertainment & Sound 27 - 27 Imaging Products & Solutions 23 - 23 Mobile Communications 1,229 0 1,229 Semiconductors - - - Financial Services - - - All Other and Corporate 3,544 0 3,544
Consolidated total 7,121 0 7,121
Depreciation associated with restructured assets as used in the context of the disclosures regarding restructuring activities
refers to the increase in depreciation expense caused by revising the useful life and the salvage value of depreciable fixed assets under an approved restructuring plan. Any impairment of the assets is recognized immediately in the period it is identified.

- 44 -
Yen in millions
Three months ended December 31
2016 2017
Depreciation and amortization: Game & Network Services 6,644 7,324 Music 4,070 4,444 Pictures 5,052 6,243 Home Entertainment & Sound 4,962 6,053 Imaging Products & Solutions 6,412 6,152 Mobile Communications 5,071 4,923 Semiconductors 24,620 24,955 Financial Services, including deferred insurance acquisition costs 9,999 15,506 All Other 1,254 815
Total 68,084 76,415
Corporate 10,410 11,810
Consolidated total 78,494 88,225
Yen in millions
Three months ended December 31, 2016 Total net
restructuring charges
Depreciation
associated with restructured assets
Total
Restructuring charges and associated depreciation: Game & Network Services - - - Music 837 - 837 Pictures 752 (4) 748 Home Entertainment & Sound 529 - 529 Imaging Products & Solutions 157 - 157 Mobile Communications 38 6 44 Semiconductors (3) - (3) Financial Services - - - All Other and Corporate 2,741 32 2,773
Consolidated total 5,051 34 5,085
Yen in millions
Three months ended December 31, 2017
Total net
restructuring charges
Depreciation
associated with restructured assets
Total
Restructuring charges and associated depreciation: Game & Network Services - - - Music 1,594 - 1,594 Pictures 39 - 39 Home Entertainment & Sound 8 - 8 Imaging Products & Solutions 2 - 2 Mobile Communications 538 - 538 Semiconductors - - - Financial Services - - - All Other and Corporate 911 - 911
Consolidated total 3,092 - 3,092
Depreciation associated with restructured assets as used in the context of the disclosures regarding restructuring activities
refers to the increase in depreciation expense caused by revising the useful life and the salvage value of depreciable fixed assets under an approved restructuring plan. Any impairment of the assets is recognized immediately in the period it is identified.
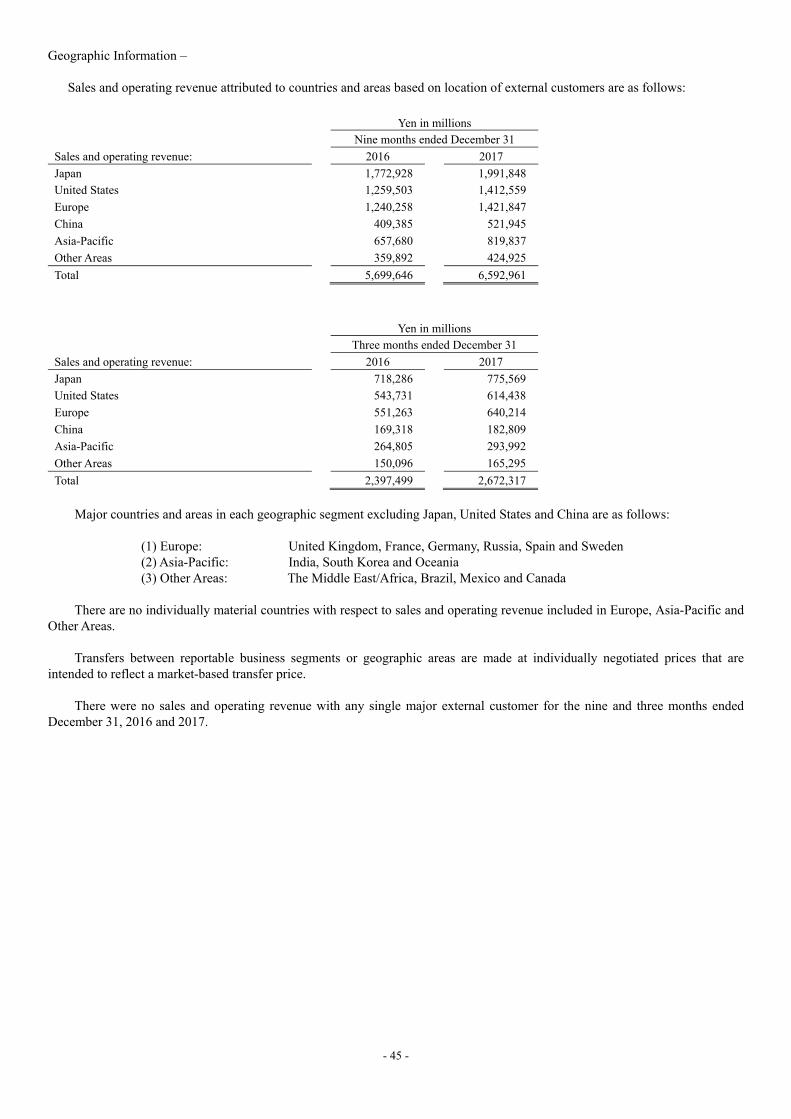
- 45 -
Geographic Information –
Sales and operating revenue attributed to countries and areas based on location of external customers are as follows:
Yen in millions Nine months ended December 31
Sales and operating revenue: 2016 2017
Japan 1,772,928 1,991,848
United States 1,259,503 1,412,559
Europe 1,240,258 1,421,847
China 409,385 521,945
Asia-Pacific 657,680 819,837
Other Areas 359,892 424,925
Total 5,699,646 6,592,961
Yen in millions Three months ended December 31
Sales and operating revenue: 2016 2017
Japan 718,286 775,569
United States 543,731 614,438
Europe 551,263 640,214
China 169,318 182,809
Asia-Pacific 264,805 293,992
Other Areas 150,096 165,295
Total 2,397,499 2,672,317
Major countries and areas in each geographic segment excluding Japan, United States and China are as follows: (1) Europe: United Kingdom, France, Germany, Russia, Spain and Sweden (2) Asia-Pacific: India, South Korea and Oceania (3) Other Areas: The Middle East/Africa, Brazil, Mexico and Canada There are no individually material countries with respect to sales and operating revenue included in Europe, Asia-Pacific and
Other Areas. Transfers between reportable business segments or geographic areas are made at individually negotiated prices that are
intended to reflect a market-based transfer price. There were no sales and operating revenue with any single major external customer for the nine and three months ended
December 31, 2016 and 2017.

- 46 -
(2) Other Information (i) Dividends declared
An interim cash dividend for Sony Corporation’s common stock was approved at the Board of Directors meeting held on October 31, 2017 as below:
1. Total amount of interim cash dividends:
15,794 million yen 2. Amount of interim cash dividends per share:
12.50 yen 3. Payment date:
December 1, 2017 Note: Interim cash dividends were distributed to the shareholders recorded or registered as the holders or pledgees of shares in Sony Corporation’s register of shareholders at the end of September 30, 2017.
(ii) Litigation
For the legal proceedings, please refer to “IV Financial Statements – Notes to Consolidated Financial Statements – 6. Commitments, contingent liabilities and other”.