query-driven search methods for large microarray databases
DESCRIPTION
Query-driven search methods for large microarray databases. Matt Hibbs Troyanskaya Laboratory for BioInformatics and Functional Genomics. Broad Goals/Challenges. Characterize the function of proteins Learn the mechanisms of gene expression and regulation under many conditions - PowerPoint PPT PresentationTRANSCRIPT

Query-driven search methodsfor large microarray databases
Matt Hibbs
Troyanskaya Laboratory for
BioInformatics and Functional Genomics

Broad Goals/Challenges
• Characterize the function of proteins• Learn the mechanisms of gene expression
and regulation under many conditions– Growing amounts of data facilitate this goal
• Noise, heterogeneity, and biases in available data must be addressed

Specific Goals
• Large collection of S. cerevisiae microarray data– From > 80 publications
– Totaling ~2400 conditions
– Divided into ~130 “datasets”
• How can such a large amount of data be leveraged?– What can we learn? Or not learn?
– Accessibility, usefulness to community

Outline
• Microarray methodology• Analysis concerns• Functional Biases• Improved Approaches• Preliminary Conclusions

Outline
• Microarray methodology• Analysis concerns• Functional Biases• Improved Approaches• Preliminary Conclusions

Central Dogma
• Transcription factors recruit or repress polymerase
• Transcription– DNA mRNA
• Translation– mRNA Proteins
• Proteins do work
DNA
mRNA
Proteins
Ribosome
TF
Polymerase
Molecular Measurements
• Measurements of protein abundance in a variety of conditions can suggest function– Difficult to measure accurately in a large-scale
manner
• One off: measure abundance of mRNA transcripts as a proxy– Much easier to measure on a large scale
– Several competing technologies reaching maturity

Basic Microarray Methodology
Step 1: Prepare cDNA spots
Step 2: Add mRNA to slide for Hybridization
Step 3: Scan hybridized array
reference mRNA test mRNA
add green dye add red dye
hybridize

Microarray Outputs
Measure amounts of green and red dye on each spot
Represent level of expression as a log ratio between these amounts
Raw Image from Spellman et al., 98

Microarray Outputs
Experiments
Genes
• Log ratios in data matrix
• Missing values present
• Potentially high levels of noise

Additional Technology
• Two-color (homemade, Agilent)– Process just described, with 2 labeled samples
undergoing competitive hybridization
• Single-color (Affymetrix)– Highly calibrated hybridization spots
– Match and Mis-match spots for each oligo
• Other techniques/tricks– Randomized layouts, barcode arrays, tiling
arrays, etc.

Outline
• Microarray methodology• Analysis concerns• Functional Biases• Improved Approaches• Preliminary Conclusions

Noise Sources
• Transcriptional noise– mRNA transcripts not a direct reflection of protein
levels– Process of isolating mRNA can stress cells
• Especially true of older protocols/data
• Chemical noise– Fluorescent labels sensitive to environment
• Operator noise– High variation between scientists running the
same experiment

Missing Values
• Several choices:– Ignore missing values
– Remove genes with missing values
– Impute missing values
• KNN-Impute– Replace missing values with a weighted average
of the K-nearest neighbors
– Used for analysis presented later

Normalization
• “Bright” arrays– Whole arrays often normalized by average
intensity
• Two-color– Choice of reference population can affect
measurements– Avoid divide by zero errors
• Affymetrix– Convert hybridization values to log ratios
• Divide by average value• Log transform

Clustering Analysis
• Distance metrics– Euclidean– Pearson– Spearman– …
• Algorithms– Hierarchical– K-means– SOM– …

Megaclustering
• Combining data from multiple sources can cause problems– Normalization differences
– Technology differences
– Noise biases
• Requires unified pre-processing and smart application of statistics

Apples to Apples
• Pearson correlation distributions not always normal
– Large dependence on number of conditions
6 condition dataset 40 condition dataset
Histograms of Pearson correlation coefficients
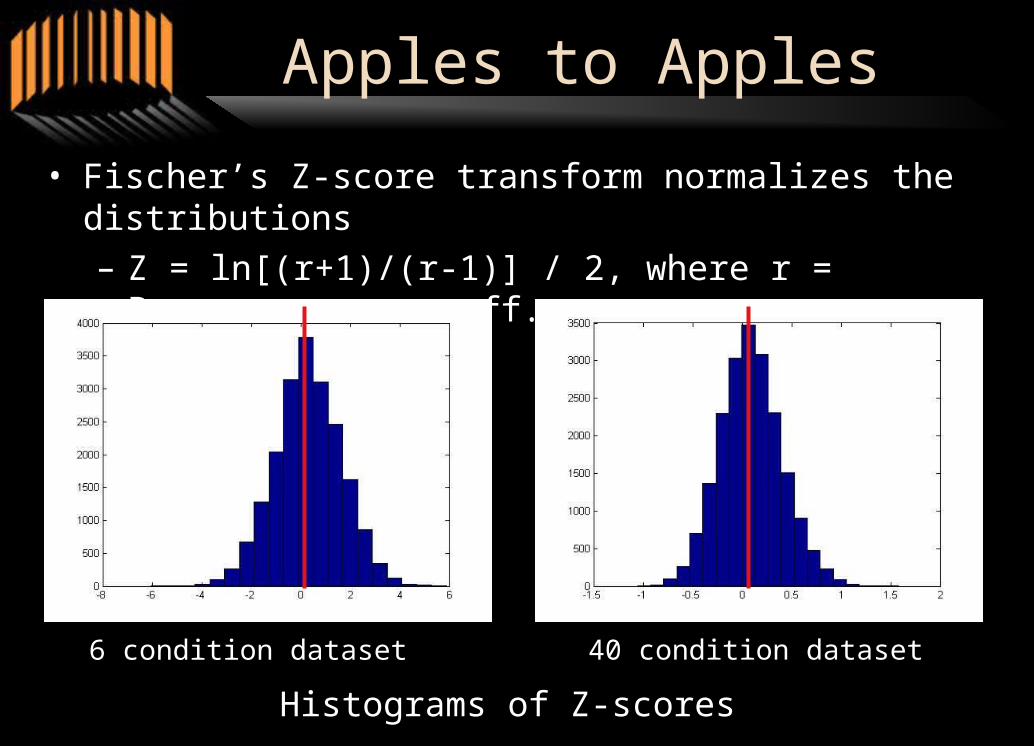
Apples to Apples
• Fischer’s Z-score transform normalizes the distributions
– Z = ln[(r+1)/(r-1)] / 2, where r = Pearson corr. coeff.
6 condition dataset 40 condition dataset
Histograms of Z-scores

Evaluation Measurements
• Gene Ontology (GO)– Hierarchical organization of biological processes,
molecular functions, and cellular components– Cross-organism structure, organism-specific
annotations– Closest available approximation of a “gold
standard”
• True Positives and False Positives can be defined from the ontology– Node size, depth, expert voting used for cutoffs

Precision / Recall
• Calculate and sort distances between all pairs of genes• Determine a cutoff, all pairs below cutoff are predicted
“true,” above “false”• Given these predictions, can calculate precision and
recall– Precision = TP / (TP + FP)– Recall = TP / TotalPositives
• Slide the cutoff from smallest to largest distance to create a curve of precision / recall pairs– Ramp down from few, high confidence predictions to many,
low confidence predictions

Example
QuickTime™ and aTIFF (LZW) decompressor
are needed to see this picture.
Precision/Recall of various data types

Outline
• Microarray methodology• Analysis concerns• Functional Biases• Improved Approaches• Preliminary Conclusions

Functional Biases
• Microarray experiments often targeted at a particular process, pathway, or function
• However, several “global” signals are often present– Ribosomal response
– General Stress Response
• Some datasets do contain more targeted “local” signals as well

Ribosome Bias
QuickTime™ and aTIFF (LZW) decompressor
are needed to see this picture.
Precision/Recall of various data types

Ribosome Bias
QuickTime™ and aTIFF (LZW) decompressor
are needed to see this picture.
Precision/Recall excluding Ribosome Biogenesis

Process-specific P/R
• Can generate PR-curves on a per-GO term basis
– TPs are pairs of genes annotated to term
– TFs are pairs with one gene in term, with smallest common ancestor in very large term
– Normalize by size of GO term
• Results for individual data sets can expose functional biases

Per-dataset Biases
Typical Results

Per-dataset Biases
Poor Results

Per-dataset Biases
Diverse Results

Z-test for significance
• Difference between pair-wise distances for all genes in a term vs. background
QuickTime™ and aTIFF (LZW) decompressor
are needed to see this picture.
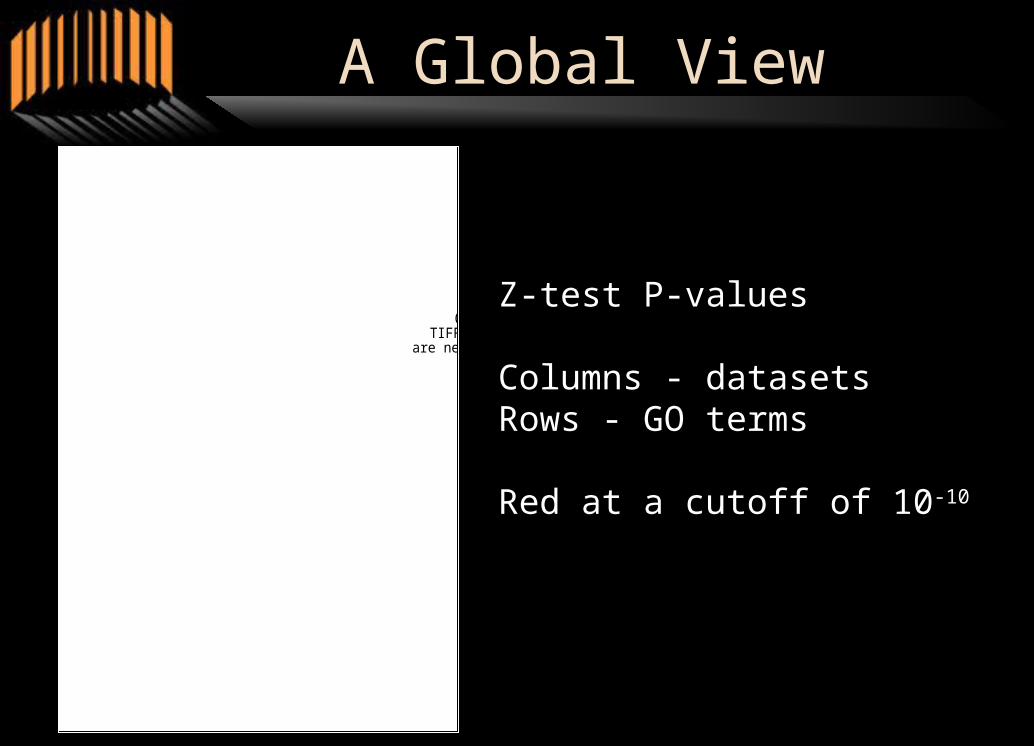
A Global View
Z-test P-values
Columns - datasetsRows - GO terms
Red at a cutoff of 10-10

QuickTime™ and aTIFF (LZW) decompressor
are needed to see this picture.
A Global View
QuickTime™ and aTIFF (LZW) decompressor
are needed to see this picture.

QuickTime™ and aTIFF (LZW) decompressor
are needed to see this picture.
A Global View
QuickTime™ and aTIFF (LZW) decompressor
are needed to see this picture.
A Local View
QuickTime™ and aTIFF (LZW) decompressor
are needed to see this picture.
QuickTime™ and aTIFF (LZW) decompressor
are needed to see this picture.

A Local View
QuickTime™ and aTIFF (LZW) decompressor
are needed to see this picture.
QuickTime™ and aTIFF (LZW) decompressor
are needed to see this picture.
QuickTime™ and aTIFF (LZW) decompressor
are needed to see this picture.

Outline
• Microarray methodology• Analysis concerns• Functional Biases• Improved Approaches• Preliminary Conclusions

Bi-clustering
• Traditional clustering will be driven by “global” signals and ignore “local” signals
• Bi-clustering identifies groups of genes and conditions rather than just genes
Traditional clustering Bi-clustering

Bi-clustering goals/issues
• Better capture biological reality– Genes only cooperate in certain conditions
– Genes can have multiple functions
– Datasets have functional biases
• Computationally difficult problem– Reducible to bi-clique finding
• NP-complete
• Heuristics, simplifications, approximations– e.g. -biclusters, SAMBA, PISA
Bi-clustering goals/issues
• Microarray noise can lead to spurious output– As compendiums increase in size, patterns by
chance increase
– Datasets have “smallest logical groupings”• Restrict co-expression to these groups
• Long running times + large result sets– Difficult to validate results
– Scientifically frustrating
Query-driven approach
• Allow users to specify a starting point for search– Leverages expert knowledge of domain
– Known to be useful in other contexts• bioPIXIE
• Identify conditions/datasets of interest based on the set of query genes
• Expand query set to include additional related genes in these conditions

Query-driven approach
• Reduces problem complexity to allow for real-time results
• Fast results allow for user-driven refinement of search criterions
• Extensible to larger data compendiums and more complex organisms– Locality sensitive hashing
– Pre-processing

Query Weighting
• Identify data conditions related in query set– Average correlation, distance, etc.
– Signal to Noise ratio of query
– Centroid significance
• Additional genes related to query– Correlation, distance, etc. weighted by identified
condition sets

Simple Scheme
• Weighted by correlation of query
QuickTime™ and aTIFF (LZW) decompressor
are needed to see this picture.

QuickTime™ and aTIFF (LZW) decompressor
are needed to see this picture.
Simple Scheme
• Results, weighted sum of correlation to query
decreasing correlation
de
cre
asi
ng
co
rre
latio
n

Ongoing Work
• Compare query weighting schemes• UI challenges• Scalability concerns
– Indexing, Locality Sensitive Hashing
– Human data
• Assess biological usefulness

Preliminary Conclusions
• Noise, functional biases, collection sizes require consideration in microarray analysis
• Evaluation metrics can be influenced by biases creating misleading results
• Query-driven approaches show promise– Targeted search
– Computational feasibility / Real-time results
– Extensibility

Acknowledgements
• Olga Troyanskaya• Chad Myers• Curtis Huttenhower
• Kai Li and lab
• Botstein and Kruglyak labs• Kara Dolinski, Maitreya Dunham
Jessy