querying and creating visualizations by analogy · querying and creating visualizations by analogy...
TRANSCRIPT

Submitted to IEEE Visualization 2007
Querying and Creating Visualizations by Analogy
Carlos E. Scheidegger Huy T. Vo David Koop Juliana Freire, Member, IEEEClaudio T. Silva, Member, IEEE
Abstract— While there have been advances in visualization systems, particularly in multi-view visualizations and visual exploration,the process of building visualizations remains a major bottleneck in data exploration. We show that provenance metadata collectedduring the creation of pipelines can be reused to suggest similar content in related visualizations and guide semi-automated changes.We introduce the idea of query-by-example in the context of an ensemble of visualizations, and the use of analogies as first-classoperations in a system to guide scalable interactions. We describe an implementation of these techniques in VisTrails, a publicly-available, open-source system.
Index Terms—visualization systems, query-by-example, analogy
1 INTRODUCTION
Over the last 20 years, visualization research has emerged as an effec-tive means to help scientists, engineers, and other professionals extractinsight from raw data. Visualization techniques are key to understand-ing complex phenomena, and the field has grown into a mature areawith an established research agenda [23]. Software systems have beendeveloped that provide flexible frameworks for creating complex visu-alizations. These systems can be broadly classified as turnkey appli-cations (e.g., ParaView, VisIt, Amira) [15, 5, 22] and dataflow-basedsystems (e.g., VTK, SCIRun, AVS, OpenDX) [27, 24, 11, 29]. In thispaper, we focus on dataflow systems, since they are more general andoften serve as the foundation of turnkey applications (e.g., both Par-aView and VisIt are based on VTK).
Most dataflow-based systems have sophisticated user interfaceswith visual programming capabilities that ease the creation of visu-alizations. Nonetheless, the path from “data to insight” requires a la-borious, trial-and-error process, where users successively assemble,modify, and execute pipelines [30]. In the course of exploratory stud-ies, users often build large collections of visualizations, each of whichhelps in the understanding of a different aspect of their data. A scien-tist working on a new computational fluid dynamics application mightneed a collection of visualizations such as 3-D isosurface plots, 2-Dplots with relevant quantitative information, and some direct volumerendering images. Although in general each of these visualizationsis implemented in a separate dataflow, they have a certain amount ofoverlap (e.g., they may manipulate the same input data sets). Fur-thermore, for a particular class of visualizations, the scientists mightgenerate several different versions of each individual dataflow whilefine tuning visualization parameters or experimenting with differentdata sets.
In previous work, we proposed a new provenance model that uni-formly captures changes to pipeline and parameter values during thecourse of data exploration [1, 4]. We showed that this detailed his-tory information, combined with a multi-view visualization interface,simplifies the exploration process. It allows users to navigate througha large number of visualizations, giving them the ability to return toprevious versions of a visualization, compare different pipelines andtheir results, and resume explorations where they left off.
In this paper, we show how this provenance information can alsobe used to simplify and partially automate the construction of newvisualizations. Constructing insightful visualizations is a process thatrequires expertise in both visualization techniques and the domain ofthe data being explored. We propose a new framework that enables
• Carlos E. Scheidegger, Huy T. Vo, David Koop and Claudio T. Silva arewith the Scientific Computing and Imaging (SCI) Institute at the Universityof Utah. email: {cscheid, hvo, dakoop, csilva}@sci.utah.edu.
• Juliana Freire is with the School of Computing at the University of Utah.email: {juliana}@cs.utah.edu
the effective reuse of this knowledge to aid both expert and non-expertusers in performing data exploration through visualization.
The framework consists of two key components: an intuitive in-terface for querying dataflows and a novel mechanism for semi-automatically creating visualizations by analogy. The query interfacesupports both simple keyword-based and selection queries (e.g., findvisualizations created by some user), as well as complex, structure-based queries (e.g., find visualizations that apply simplification be-fore an isosurface computation for irregular grid data sets). The queryengine is exposed to the user through an intuitive query-by-exampleinterface whereby users query dataflows through the same familiar in-terface they use to create the dataflows (see Figure 1). This simple, yetpowerful approach lets users easily search through a large number ofvisualizations and identify pipelines that satisfy user-defined criteria.
While the query interface allows users to identify pipelines (andsub-pipelines) that are relevant for a particular task, the visual-ization by analogy component provides a mechanism for reusingthese pipelines to construct new visualizations in a semi-automatedmanner—without requiring users to directly manipulate or edit thedataflow specifications. As Figure 2 illustrates, our technique worksby determining the difference between a source pair of analogous vi-sualizations, and transferring this difference to a third visualization.This forms the basis for scalable updates: the user does not need tohave knowledge of the exact details of the three visualization dataflowsto perform the operation. Together, these contributions are a step to-wards scalable pipeline development and refinement as an integral partof visualization systems.
Contributions and Outline. To the best of our knowledge, this isthe first work that leverages provenance information to simplify andautomate the construction of new visualizations. The paper is orga-nized as follows. We review related work in Section 2. In Section 3,we define a set of basic operations over sets of dataflows. These op-erations include computing the difference between two pipelines, up-dating pipeline definitions, and matching similar pipelines. For thelatter, we describe a new algorithm based on neighborhood similari-ties (Section 5.3). The basic operations are used both in the query-by-example interface and in creating visualizations by analogy, which arepresented in Section 4. An implementation of the proposed frameworkis discussed in Section 5. In Section 6, we present case studies that il-lustrate how our new dataflow manipulations streamline the processof constructing visualizations, and provide scalable mechanisms forexploring a large number of visualizations. We discuss the potentialimpact of our work on existing visualization systems in Section 7. Weconclude in Section 8 where we outline directions for future work.
2 RELATED WORK
Visualization systems have been quite successful at bringing visualiza-tion to a greater audience. Seminal systems such as AVS Explorer and
1

Fig. 1. Querying by example. The interface for building a query over an ensemble of pipelines is essentially the same as the one for constructingand updating pipelines. In fact, they work together: portions of a pipeline can become query templates by directly pasting them onto the QueryCanvas. In his figure, the user is looking for a volume rendered image of a file whose name contains the string “4877”. The system highlights thematches both at the visualization level (version tree, shown in the middle) and at the module level (shown in the right insets).
Data Explorer [29, 11] enabled domain scientists to create visualiza-tions with minimal training and effort. The early success of these sys-tems led to the development of several alternative approaches. SCIRun[24] focuses on computational steering: the intentional placement ofvisualization and human intervention in the process of generating sim-ulations. The Visualization Toolkit [27] is a library that directly ex-poses a powerful dataflow API for several programming languages.
However, as scientific visualization becomes more widely used,several scalability issues have arisen, which range from ensuring goodperformance, handling large amounts of data, capturing provenance,and providing interfaces to interact with a large number of visualiza-tions. Distributed, parallel systems [5, 3] have been developed to ad-dress performance and dataset size concerns. Such systems provide ascalable architecture for creating and running visualization pipelineswith large data.
Another important requirement that has come to the attention ofdevelopers and users of visualization systems is the ability to recordprovenance so that computational experiments can be reproduced andvalidated. Provenance-aware scientific workflow systems have beendeveloped that record provenance both for data products (i.e., how agiven result was generated) and for the exploratory process, the se-quence of steps followed to design and refine the workflows used toprocess the data [25, 26, 4]. Provenance mechanisms have also beenproposed for visualization-specific systems. Kreuseler et al. [16] pro-posed a history mechanism for keeping track of parameter values invisual data mining, and Jankun-Kelly et al. [13] recently proposed aformal calculus for parameter changes. VisTrails uses a scheme thatuniformly captures both parameter and pipeline changes [1, 4].
As multiple workflows are manipulated in exploratory processes, itis important to provide interfaces that allows users to compare theirresults. Jankun-Kelly and Ma [12] have proposed a spreadsheet-likeinterface for quickly exploring the parameter space of a visualization.In the area of user interfaces, Kurlander et al. [18, 17] have presentedapproaches to streamline the repetitive tasks users often face. The sem-inal example of a system which uses the same interface to both manip-ulate and query data is the Query-By-Example database language [31].We propose a similar approach for querying visualization ensemblesin Section 4.2. Graph searching and query languages have also beeninvestigated in database systems [28].
The algorithm we describe for matching two pipelines is similarto a technique developed to match database schemas [21]. It is alsoreminiscent of well-known variations of PageRank, which is the basisfor Google’s successful ranking algorithm [2, 19]. Our visualization-by-analogy mechanism shares some of the objectives of programming-by-example techniques [20].
3 PIPELINE OPERATIONS
Below, we review some terminology and introduce basic pipeline op-erations that serve as the basis for query-by-example and visualizationby analogy.
Definitions. A visualization system is a system that provides func-tionality for graphically displaying data according to a specific set ofrules. The programmatic rules for displaying this data constitute apipeline. Executing the pipeline in the visualization system producesa visualization. The pipeline is composed of modules which definespecific operations and connections which specify the conceptual flowof data between modules. Each connection links an output port of onemodule (the source) with an input port of another module (the destina-tion). Module state is represented by module parameters. We denotethe set of all visualization pipelines asV.
Operations as functions on V. One important observation thatwe leverage throughout the text is that every operation performed ona pipeline (adding and deleting modules, connections and parameters,etc.) can be directly expressed as a (potentially partial) function f :V→V. Many of our results depend on making these functions first-class elements in the visualization system.
3.1 Computing Pipeline DifferencesDataflow-based systems allow users to create a variety of pipelines,rather than being restricted to a predefined set of visualizations. Inthe process of deriving insightful visualizations, a series of pipelinesis often created by iterative refinement. To understand this process aswell as the derived visualizations, it is useful to compare the differ-ent pipelines. The standard representation of a pipeline is a directedgraph, with labeled vertices representing operations. Given a pair ofsuch pipelines, we want to determine the difference between the visu-alizations they generate. In the following, we show how to describeand manipulate differences between pipelines.
We define δ :V→V as a function on the space of visualizations,and ∆ :V×V→ δ as a function that takes two pipelines pa and pb andproduces another function that will transform pa to pb. For brevity, letδab = ∆(pa, pb). From now on, we will use δ to refer to an arbitrary∆(a,b). It is clear that δ is not unique: even though δab(pa) = pbis a necessary constraint, there are no further restrictions. In somesense, we would like to pick the δab that minimally changes all otherpipelines. We define the distance between pa and pb as the number ofchanges necessary to perform the transformation. We then look for theminimal set of operations that takes pa to pb. As we discuss in section4.1, this is computationally impractical, so we relax the minimalityrequirement and instead use heuristics.
2

Submitted to IEEE Visualization 2007
Fig. 2. Visualization by analogy. The user chooses a pair of visualizations to serve as an analogy template. In this case, the pair represents achange where a file downloaded from the WWW is smoothed. Then, the user chooses a set of other visualizations that will be used to derive newvisualizations, with the same change. These new visualizations are derived automatically. The pipeline on the left reflects the original changes, andthe one on the right reflects the changes when translated to the last visualization on the right. The pipeline pieces to be removed are portrayed inorange, and the ones to be added, in blue. Note that the surrounding modules do not match exactly: the system figures out the most likely match.
We also restrict our initial analysis to the simple case where pbis derived from pa — the user created pb by applying a finite set ofchanges to pa. We denote this relationship as pa < pb. Then, a systemwith some knowledge of how the pipelines were constructed should beable to determine the differences between related pipelines using thishistory. We demonstrate such an implementation in Section 5.
When pa < pb, we can then say δab is the sequence of operationsthat was used to derive pb from pa. However, few pairs of pipelinesrespect this property, and we would like ∆ to be completely general.We start with a simple extension: if δab exists, so should δba. In fact,we would like
δabδba = e
where e is the identity function. We can achieve this if our sequenceof changes consists of invertible atomic operations. Specifically, sup-pose δab = fn ◦ · · · ◦ f1 where each fi has a well-defined inverse. Forexample, if fi is the operation of adding a module to the pipeline, f−1
iis the operation of deleting that module from the pipeline. Then,
δba = δ−1ab = f−1
1 ◦ · · · ◦ f−1n
From now on, we assume that any function that operates on V has aninverse (note that both functions might still be partial).
Our ultimate goal is to apply the pipeline difference result δ topipelines other than those used to create it. To analyze where δ is ap-plicable, we introduce the domain and range context of δ . Formally,the domain context of δ , D(δ ), is the set of all pipeline primitives re-quired to exist for δ to be applicable. We represent these contexts assets of identifiers. For example, if δ is a function that changes the filename parameter of a module with id 32, D(δ ) is the set containingthe module with id 32. Similarly, the range context of δ , R(δ ), is theset of all pipeline primitives that were added or modified by δ . Notethat D(δ−1) = R(δ ), which provides an easy way to compute rangecontexts.
3.2 Updating PipelinesFinding differences is not only a useful technique for analyzingpipelines, but it can also be used to create new visualizations. Theidea is similar to applying patches in software systems: the differenceresults can be applied to modify an existing pipeline. Given a δ , it isstraightforward to apply it to a pipeline. Recall that δ is a sequenceof actions that transform a pipeline. Thus, updating a pipeline pa is assimple as computing δ (pa). Note, however, that δ can fail if an ele-ment of D(δ ) does not exist in pa. However, if we allow δ to continuedespite one or more operations failing, we can still achieve a partialupdate.
3.3 Matching PipelinesWhile computing pipeline differences is an integral part in reason-ing about multiple visualizations, another important operation is tomatch similar pipelines, i.e., we wish to find correspondences betweenpipelines. The result of pipeline matching can either be a binary de-cision (whether the pipelines match) or a mapping between the twoinputs. Note that different metrics and thresholds can be used to de-termine the similarity of two pipelines. In the remainder of this sec-tion, we discuss an approach for finding the best mapping between twopipelines.
Let D represent the set of all domain contexts and define map :V×V→ (D → D) as a function which takes two pipelines, pa andpb, as input and produces a (partial) map from the domain context ofpa to the domain context of pc. The map may be partial in cases whereelements of pa do not have a match in pb or vice versa. Notice thatif pa < pb, map(pa, pb) = mapab is the identity on all elements thatwere not added or deleted in the process of deriving pb.
To construct such a mapping, we formulate the problem as aweighted graph matching problem. Let Ga = (Va,Ea) be the graphcorresponding to the pipeline pa. In a straightforward definition, Vawould be the modules in pa and Ea the connections in pa. However,one could consider other definitions such as the dual of this represen-tation. For Va, we define a scoring function s : Va×Vb → [0.0,1.0] thatdefines the compatibility between vertices. For example, the similarityscore of two modules that are exactly the same can be set to 1.0 andthe score of modules M1 and M2 such that M1 is a subclass of M2 maybe set to 0.6.
We define a matching between Ga and Gb as a set of pairs of verticesM = {(va,vb)} where va ∈Va and vb ∈Vb. A matching is good when
∑(va,vb)∈M
s(va,vb)
is maximized. A good matching on pipelines is one that corresponds toa good matching on their representative graphs. Given a good match-ing M, we can define a mapping from pa to pb as va → vb for all(va,vb) ∈ M.
4 SCALABLE PIPELINE MANIPULATION PRIMITIVES
Using the concepts defined in the previous section, we now introducetwo new primitives for manipulating visualizations.
4.1 Complexity AnalysisThe operations described in this section are theoretically hard to com-pute. Computing a minimal ∆(pa, pb), or matching two pipelines pa
3

Fig. 3. Query-by-example and analogy-based updates provide a simple way for users to manipulate multiple pipelines simultaneously. In thisexample, the user selects parts of a query result and updates them all with an analogy that introduces a preprocessing module to the pipeline thatsupersamples the original dataset.
and pb, is, in general, as hard as solving a subgraph isomorphism.This problem is trivially reducible from the MAX-CLIQUE problem,a well-known NP-complete problem. Additionally, MAX-CLIQUE isa particularly hard problem: there is no approximation algorithm for itwith a subpolynomial approximation factor [9]. Since we cannot get agood approximation, heuristics for both problems are well justified.
In this work, we make use of the information stored in δ functionsboth to reduce the search space and to increase the effectiveness ofthese heuristics.
4.2 Query-By-Example
Working with multiple visualizations is problematic if they have to betreated individually. In the process of visualizing different data sets,trying different techniques, and tweaking parameters, a user may cre-ate a large number of visualizations. It is clearly impractical to lo-cate those that match certain criteria by examining each individually.To solve the problem of locating pipelines, we introduce the idea ofquery-by-example for visualizations. Instead of formulating the searchcriteria in a structured language, a user builds a pipeline fragment thatcontains the desired features. The exact same interface used in build-ing a pipeline can be used for building a query, which means that auser familiar with building pipelines can easily query them. Figure 1shows an excerpt of the query-by-example functionality.
Our algorithm is based on the observation that searching allpipelines for a given pattern is equivalent to determining whether acandidate pipeline matches the pattern. Once a query, represented asa pipeline fragment, is constructed, we can use the pipeline match-ing algorithm on each candidate pipeline to determine if it satisfiesthe query. Depending on user preferences, we can require an exactor an approximate match. While each element of the query pipeline(modules, connections, parameters, etc.) needs to be included in thematch, a candidate pipeline that contains more elements than those inthe query pipeline still satisfies the query.
It should be noted that differences can help optimize our matching.For example, suppose that we have a given query pipeline pq and twocandidate pipelines pa and pb. If we find that pa satisfies the query,and we know δab, we can check to see if the domain context D(δab)contains any elements that matched pq. If it does not, we know thatpb also matches. Similarly, if pa does not match pq and R(δab) doesnot contain necessary elements for matching pq, we know that pb willnot satisfy the query. Thus, we can determine all pipelines that satisfyour query by iteratively matching and updating the matches based ondifferences.
4.3 Visualization by AnalogyWhen creating visualizations, users often have to integrate new fea-tures into existing pipelines. For example, a user may wish to improvea given visualization by adjusting parameter so they match a publishedresult. The user might also simply want to switch to a different visu-alization algorithm. In either case, there usually exists an examplethat demonstrates the given technique. A user can infer the necessarychanges, and then apply them to a particular visualization. This ana-logical reasoning is very powerful, and we show that visualization byanalogy can be (partly) automated. Figure 2 illustrates the process ofcreating visualizations by analogy.
Two ordered pairs are analogous if the relationship between the firstpair mirrors the relationship between the second pair. Therefore, if weknow what the relationship is between the first pair, and are given thefirst entity of the second pair, we should be able to determine the otherentity of that pair. More concretely, given a difference between δ twopipelines, we should be able to modify an arbitrary pipeline so that theresulting changes mirror δ .
To automate this operation, we need to compute the difference be-tween two pipelines and apply this difference to another (possibly un-related) pipeline. Suppose that we have three pipelines pa, pb, pc,and wish to compute pd so that pa : pb as pc : pd . We discussed theproblem of finding the difference in Section 3.1, but recall that updat-ing a pipeline pc with an arbitrary δ will fail if pc does not containthe domain context of δ . When this is the case, we need to map thedifference so that it can be applied to pc.
We wish to express δab so that δab(pc) succeeds. This is exactlywhat mapac does; recall that to construct this operator we need tofind a match between pa and pc, as described in Section 3.3. Moreprecisely, we first compute δ ∗cb = mapac(pa, pb) and then find δ ∗cb(pc).
In summary, our algorithm is:
1. Compute the difference: δab = ∆(pa, pb)
2. Compute the map: mapac = map(pa, pc).
3. Compute the mapped difference: δ ∗cb = mapac(δab)
4. Compute pd = δ ∗cb(pc)
5 IMPLEMENTATION
To implement the scalable manipulation primitives introduced in Sec-tion 4, we use the freely available VisTrails system. VisTrails auto-matically captures the evolution of workflows which allows straight-forward implementations of the pipeline operations presented in Sec-tion 3. We provide a quick overview of some key concepts in VisTrails;the reader is referred to [1, 4] for more details.
4

Submitted to IEEE Visualization 2007
Fig. 4. Example of an analogy between pipelines where there is noperfect module matching. The difference in the left pipeline pair is trans-ferred to the right pipeline pair. Note, however, that the module namesare not the same—the system must find the most likely pairing basedon the similarity measure described in Section 5.3.
In VisTrails, as a user constructs a visualization, the entire historyof manipulation is transparently stored in the version tree (the term vis-trail is used interchangeably). Each action f that modifies the pipeline(e.g., adding or deleting a module, connecting modules, or changinga parameter) is represented explicitly as a function f :V→V, whereV is the space of all possible visualizations. A pipeline is then thecomposition of these functions and is materialized by applying the re-sulting function to the empty visualization.
5.1 Pipeline Differences
In a vistrail, the straightforward application of the action-based for-malism allows the computation of simple differences. When pa < pb,∆(pa, pb) is the sequence of actions from pa to pb which can be readdirectly from the vistrail. In addition, we have implemented the in-verse operation of f for each type of operation in VisTrails so δba isalso easily constructed. However, it is likely that we wish to computea difference between pipelines that are not related in such a simplemanner. Specifically, suppose that pa 6< pb and pb 6< pa. Note thatthere exists some pc (possibly the empty pipeline, which is in generalthe least common ancestor of both pa and pb) such that pc < pa andpc < pb. Then,
δab = δacδcb = δ−1ca δcb
Thus, we can find ∆(pi, p j) for any two pipelines, even if they are notdirectly related.
5.2 Pipeline Updates
Pipeline updates are also easily computed by taking the action-basedrepresentation of a pipeline and appending the new actions given bya δ . Although it is always possible to append the new actions in avistrail, the resulting sequence of actions may be invalid. As notedearlier, this update can fail if the domain context of δ does match pa.More specifically, each operation in δ can succeed or fail based onwhether the elements to be modified or deleted exist in pa.
5.3 Pipeline Matching
In our matching algorithm, we use the standard graph representationwhere vertices correspond to modules and edges to connections. Inaddition, even though we still discriminate between input and outputports, we do not enforce directionality on the edges so that we candiffuse similarity along them.
Recall that our goal in pipeline matching is to determine a mappingfrom the context of one pipeline to another. To do so, we convert thepipelines to labeled graphs and define a scoring function for nodesbased on their labels. With a graph for each pipeline, we compute themapping by pairing nodes that score well and enforcing connectivityconstraints between these pairs.
Let Ga and Gb be the graphs corresponding to pa and pb. Forour implementation, we define modules as vertices and connectionsas edges. Denote a connection between two vertices a and b as a ∼ b
Fig. 5. Example matching generated by the pipeline matching algorithm.Thicker edges correspond to stronger correspondences. Notice that thecorrespondences get progressively better as the algorithm iterates. Thismatching corresponds to Example 2 in Section 6.
and define the scoring function that measures the pairwise compatibil-ity of vertices by
c(va,vb) =|ports(va)∩ports(vb)||ports(va)|+ |ports(vb)|
where ports(v) denotes the ports of the module corresponding to thevertex v. This measure emphasizes port matching: it gives higherscores to modules that can be more easily substituted for each other.Such a substitution depends solely on the compatibility of the inputand output ports and not on module name or functionality. Figure 4shows an example of such an approximate matching.
Notice that this scoring function is defined only for nodes, andtherefore, it does not help us in comparing the topologies of thepipelines. While a simple maximum bipartite matching [6] betweennodes may succeed in finding a map between nodes, we would like toenforce some connectivity constraints on the graphs. Intuitively, wewant to define the similarity between vertices as a weighted averagebetween how compatible the modules are and how similar their neigh-borhoods are. The similarity score strikes a balance between the lo-cality of pairwise compatibility and the overall similarity of the neigh-borhood. This definition seems circular, but, surprisingly, it leads toa very simple and elegant matching technique based on the dominanteigenvector of a Markov chain [19].
We create a graph G = Ga ×Gb that combines both Ga and Gb. Inthis graph, we define a vertex va,b for each pair of vertices va ∈Va,vb ∈Vb. Similarly, an edge vi, j ∼ vk,` exists when vi ∼ vk in Ga and v j ∼ v`in Gb. (G is the graph categorical product of Ga and Gb.) Noticethat the connectivity of G encodes the pairwise neighborhoods of thevertices in Ga and Gb. We now want to translate our intuitive algorithmfrom the previous paragraph into an iterative algorithm. First, we needthe following notation:
• πk(G) is the measure of pairwise similarity after k steps
• A(G) is the adjacency matrix of G normalized so that the sum ofeach row is one (a row with sum zero is modified to be uniformlydistributed)
• c(G) is the normalized vector whose elements are the scores forthe paired vertices in G: c(G) = (c(va,vb),va ∈ Ga,vb ∈ Gb)
• α is a user-defined parameter that determines the trade-off be-tween pairwise scoring and connectivity
To iteratively refine our estimate, we diffuse the neighborhood similar-ity according to the following formula:
πk+1 = αA(G)πk +(1−α)c(G)= MGπk
(1)
The final pairwise similarity between modules is given by π∞ =limk→∞ πk. For our purposes, c(G) gives a good measure of similarityso A(G) is used mainly to break ties between two alternatives. Thus,
5
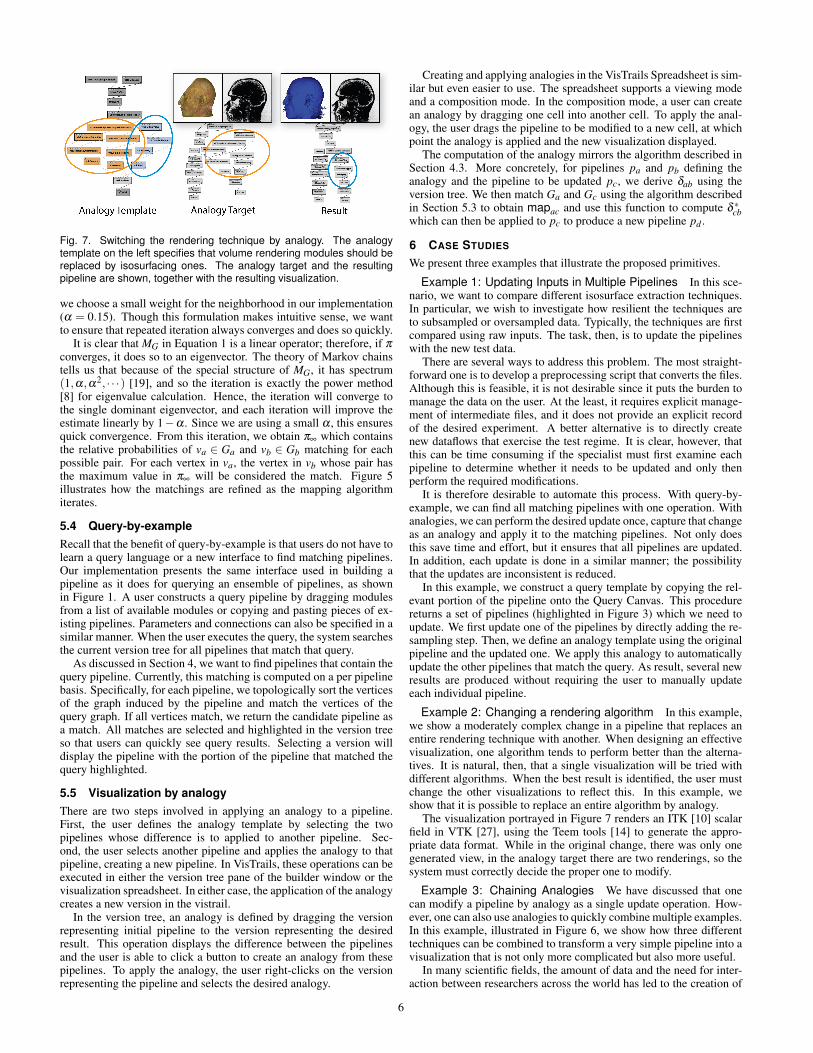
Fig. 7. Switching the rendering technique by analogy. The analogytemplate on the left specifies that volume rendering modules should bereplaced by isosurfacing ones. The analogy target and the resultingpipeline are shown, together with the resulting visualization.
we choose a small weight for the neighborhood in our implementation(α = 0.15). Though this formulation makes intuitive sense, we wantto ensure that repeated iteration always converges and does so quickly.
It is clear that MG in Equation 1 is a linear operator; therefore, if π
converges, it does so to an eigenvector. The theory of Markov chainstells us that because of the special structure of MG, it has spectrum(1,α,α2, · · ·) [19], and so the iteration is exactly the power method[8] for eigenvalue calculation. Hence, the iteration will converge tothe single dominant eigenvector, and each iteration will improve theestimate linearly by 1−α . Since we are using a small α , this ensuresquick convergence. From this iteration, we obtain π∞ which containsthe relative probabilities of va ∈ Ga and vb ∈ Gb matching for eachpossible pair. For each vertex in va, the vertex in vb whose pair hasthe maximum value in π∞ will be considered the match. Figure 5illustrates how the matchings are refined as the mapping algorithmiterates.
5.4 Query-by-exampleRecall that the benefit of query-by-example is that users do not have tolearn a query language or a new interface to find matching pipelines.Our implementation presents the same interface used in building apipeline as it does for querying an ensemble of pipelines, as shownin Figure 1. A user constructs a query pipeline by dragging modulesfrom a list of available modules or copying and pasting pieces of ex-isting pipelines. Parameters and connections can also be specified in asimilar manner. When the user executes the query, the system searchesthe current version tree for all pipelines that match that query.
As discussed in Section 4, we want to find pipelines that contain thequery pipeline. Currently, this matching is computed on a per pipelinebasis. Specifically, for each pipeline, we topologically sort the verticesof the graph induced by the pipeline and match the vertices of thequery graph. If all vertices match, we return the candidate pipeline asa match. All matches are selected and highlighted in the version treeso that users can quickly see query results. Selecting a version willdisplay the pipeline with the portion of the pipeline that matched thequery highlighted.
5.5 Visualization by analogyThere are two steps involved in applying an analogy to a pipeline.First, the user defines the analogy template by selecting the twopipelines whose difference is to applied to another pipeline. Sec-ond, the user selects another pipeline and applies the analogy to thatpipeline, creating a new pipeline. In VisTrails, these operations can beexecuted in either the version tree pane of the builder window or thevisualization spreadsheet. In either case, the application of the analogycreates a new version in the vistrail.
In the version tree, an analogy is defined by dragging the versionrepresenting initial pipeline to the version representing the desiredresult. This operation displays the difference between the pipelinesand the user is able to click a button to create an analogy from thesepipelines. To apply the analogy, the user right-clicks on the versionrepresenting the pipeline and selects the desired analogy.
Creating and applying analogies in the VisTrails Spreadsheet is sim-ilar but even easier to use. The spreadsheet supports a viewing modeand a composition mode. In the composition mode, a user can createan analogy by dragging one cell into another cell. To apply the anal-ogy, the user drags the pipeline to be modified to a new cell, at whichpoint the analogy is applied and the new visualization displayed.
The computation of the analogy mirrors the algorithm described inSection 4.3. More concretely, for pipelines pa and pb defining theanalogy and the pipeline to be updated pc, we derive δab using theversion tree. We then match Ga and Gc using the algorithm describedin Section 5.3 to obtain mapac and use this function to compute δ ∗cbwhich can then be applied to pc to produce a new pipeline pd .
6 CASE STUDIES
We present three examples that illustrate the proposed primitives.
Example 1: Updating Inputs in Multiple Pipelines In this sce-nario, we want to compare different isosurface extraction techniques.In particular, we wish to investigate how resilient the techniques areto subsampled or oversampled data. Typically, the techniques are firstcompared using raw inputs. The task, then, is to update the pipelineswith the new test data.
There are several ways to address this problem. The most straight-forward one is to develop a preprocessing script that converts the files.Although this is feasible, it is not desirable since it puts the burden tomanage the data on the user. At the least, it requires explicit manage-ment of intermediate files, and it does not provide an explicit recordof the desired experiment. A better alternative is to directly createnew dataflows that exercise the test regime. It is clear, however, thatthis can be time consuming if the specialist must first examine eachpipeline to determine whether it needs to be updated and only thenperform the required modifications.
It is therefore desirable to automate this process. With query-by-example, we can find all matching pipelines with one operation. Withanalogies, we can perform the desired update once, capture that changeas an analogy and apply it to the matching pipelines. Not only doesthis save time and effort, but it ensures that all pipelines are updated.In addition, each update is done in a similar manner; the possibilitythat the updates are inconsistent is reduced.
In this example, we construct a query template by copying the rel-evant portion of the pipeline onto the Query Canvas. This procedurereturns a set of pipelines (highlighted in Figure 3) which we need toupdate. We first update one of the pipelines by directly adding the re-sampling step. Then, we define an analogy template using the originalpipeline and the updated one. We apply this analogy to automaticallyupdate the other pipelines that match the query. As result, several newresults are produced without requiring the user to manually updateeach individual pipeline.
Example 2: Changing a rendering algorithm In this example,we show a moderately complex change in a pipeline that replaces anentire rendering technique with another. When designing an effectivevisualization, one algorithm tends to perform better than the alterna-tives. It is natural, then, that a single visualization will be tried withdifferent algorithms. When the best result is identified, the user mustchange the other visualizations to reflect this. In this example, weshow that it is possible to replace an entire algorithm by analogy.
The visualization portrayed in Figure 7 renders an ITK [10] scalarfield in VTK [27], using the Teem tools [14] to generate the appro-priate data format. While in the original change, there was only onegenerated view, in the analogy target there are two renderings, so thesystem must correctly decide the proper one to modify.
Example 3: Chaining Analogies We have discussed that onecan modify a pipeline by analogy as a single update operation. How-ever, one can also use analogies to quickly combine multiple examples.In this example, illustrated in Figure 6, we show how three differenttechniques can be combined to transform a very simple pipeline into avisualization that is not only more complicated but also more useful.
In many scientific fields, the amount of data and the need for inter-action between researchers across the world has led to the creation of
6

Submitted to IEEE Visualization 2007
Fig. 6. Creating complex pipelines by chaining simple analogies. From three simple examples, the user creates a complex visualization that createsa web page with enhanced molecule rendering, whose results are fetched from the Protein Database, an online macromolecular database.
online databases that store much of the domain information required.Scientists are concerned not only with using data from these central-ized repositories but also publishing their own results for others toview. In this example, we show how analogies can be used to modifya simple pipeline that visualizes protein data stored in a local file toobtain data from an online database, create an enhanced visualizationfor that protein, and finally publish the results as an HTML report.
We begin with a vistrail that contains pipelines that accomplish eachof the individual tasks outlined above. Specifically, we have a simplepipeline p0 that reads a file with protein data and generates a visu-alization of that data. We also have pipelines p1 and p′1 where thedifference between the two is that p1 reads a local file and p′1 readsdata from an online database, pipelines p2 and p′2 where p2 featuresa simple line-based rendering and p′2 improves the rendering to usea ball-and-stick model. Finally, p3 displays a visualization while p′3generates an HTML report that contains the visualized image.
To create the new pipeline, we compute the analogy between p1 andp′1 and apply it to p0. Then, we compute the analogy between p2 andp′2 and apply that the result of the previous step. Finally, we computethe analogy between p3 and p′3 and apply it. The new pipeline p∗0prompts the user for a protein name, uses that information to downloadthe data for that protein, creates a ball-and-stick visualization of thedata, and embeds that image in an HTML report.
The benefits of using analogies to generate this new pipeline notonly include faster results but also a lower level of knowledge neededto modify pipelines. One can imagine a scientist who executes apipeline to create a visualization downloading a pipeline which pub-lishes data to the web and adding the same capability to their pipelinevia analogy. Instead of trying to find the correct modules and manu-ally modifying the pipeline, the scientist can use the analogy from theexample pipeline to add the new feature automatically.
7 DISCUSSION
We argue that both query-by-example and visualization by analogyare useful operations that provide efficient solutions for what are oth-erwise manual, time-consuming tasks. The basic operations intro-duced in Section 3 rely both on the graph structure of pipelines andon pipeline modification history. As discussed, global comparisonsof graphs are intractable in general, but the fact that visualizationpipelines translate to labeled graphs where the nodes are largely dis-tinct allows us to define effective heuristics. We believe that thisframework can be used to develop additional primitives that signifi-cantly reduce the amount of work required to maintain and integrateensembles of visualizations.
The proposed primitives can be easily implemented in dataflow-based visualization systems that provide undo/redo capabilities. As
long as undo/redo operations are represented explicitly in the sys-tem (for example, using the Command design pattern [7]), a straight-forward serialization of these would achieve the wanted capabilities.Module and connection representations may vary across systems, butthe framework and techniques apply as long as the elements can betranslated to labeled graphs.
As with most heuristics-based approaches, our approach to match-ing is not foolproof, and there are cases where it may fail to producethe results a user expects. For example, if a user applies an analogy toa pipeline that shares little or no similarity with the starting pipeline,the matching algorithm will return a mapping which is likely to bemeaningless. However, when application of an analogy fails or pro-duce poor results, the user can either discard or refine the resultingpipeline: analogies always construct new pipelines—they do not mod-ify existing pipelines.
Analogies can be highly subjective. In some cases, applying ananalogy can lead to ambiguity and derive multiple results. Figure 8shows an example of an analogy that is supposed to resample an inputfile before continuing with the rest of the pipeline. Instead of removinga connection from the raw file to downstream modules, the applicationkeeps the old connection in addition to adding the new connection tothe resampling module. In this case, a user might have to “clean up”the results of the pipeline. Our current pairwise similarity score tries toestablish a compromise in the absence of domain-specific knowledgeabout modules. Formulating and incorporating such knowledge intothe matching is certainly possible and desirable. An interesting avenuefor future work is to investigate how to acquire this information in anunobtrusive way, for example, by taking user feedback about derivedanalogies into account. as an avenue for future work. Furthermore, ourcurrent implementation finds the best mapping in a greedy fashion, ona per-module basis. There are alternative ways of using π∞, and thisinvestigation is part of future work.
One important consideration when introducing new manipulationprimitives is the impact on how users interact with them. Query-by-example represents an intuitive way for users to query pipelines. Onecould imagine a querying tool that narrows results as the query is built(e.g., similar to auto-completion). Also, to extend our analogy tool,users’ input could be used to guide the matching process, especially incases where the automatic construction fails. Constraint informationmight be incorporated into the matching, allowing it to generate betterresults in situations where the information in the pipeline definitionsis not sufficient. Along the same lines, it may be useful to allow usersto explore the results of many possible matchings.
7

Fig. 8. A situation where creating pipelines by analogy fails. The in-tended effect when defining the analogy was to replace the raw file witha preprocessing step. Note, however, that there still is one lingeringconnection, highlighted in red.
8 CONCLUSIONS AND FUTURE WORK
We have described a new framework that leverages visualizationprovenance to simplify the construction of new visualizations. Thisframework provides scalable and easy-to-use primitives for queryingpipeline ensembles and for creating multiple visualizations by analogy.We have also proposed efficient algorithms and intuitive interfaces forrealizing these primitives in a visualization system.
There are many avenues for future work. The use of domain-specific distance measures between pipelines and modules may beuseful for customizing analogy generation in some domains (for ex-ample, for transfer function design and comparison). We are currentlyinvestigating machine learning techniques for automatically determin-ing common pipeline operations on a large database of visualizations,allowing templates to also be determined automatically.
ACKNOWLEDGMENTS
We acknowledge the generous help of many colleagues and collabo-rators. Suresh Venkatasubramanian helped with discussions on graphmatching and complexity. Erik Anderson and Joao Comba graciouslyprovided their vistrails for this work. Chems Touati and Steven Calla-han helped produce the video and figures. This work uses a number ofexisting open-source software and data repositories. We acknowledgethe VisTrails development team for support, the Teem, VTK, ITK, andtrimesh2 software packages, and the RCSB Protein Database. Thiswork was funded by the National Science Foundation, the Departmentof Energy, and an IBM Faculty Award.
REFERENCES
[1] L. Bavoil, S. Callahan, P. Crossno, J. Freire, C. Scheidegger, C. Silva, andH. Vo. VisTrails: Enabling interactive, multiple-view visualizations. InProceedings of IEEE Visualization, pages 135–142, 2005.
[2] S. Brin and L. Page. The anatomy of a large-scale hypertextual Websearch engine. Computer Networks and ISDN Systems, 30(1–7):107–117,1998.
[3] K. Brodlie, D. Duce, J. Gallop, M. Sagar, J. Walton, and J. Wood. Visu-alization in grid computing environments. In Proceedings of IEEE Visu-alization, pages 155–162, 2004.
[4] S. Callahan, J. Freire, E. Santos, C. Scheidegger, C. Silva, and H. Vo.Managing the evolution of dataflows with VisTrails. In IEEE Workshopon Workflow and Data Flow for Scientific Applications (SciFlow), 2006.
[5] H. Childs, E. S. Brugger, K. S. Bonnell, J. S. Meredith, M. Miller, B. J.Whitlock, and N. Max. A contract-based system for large data visualiza-tion. In Proceedings of IEEE Visualization, pages 190–198, 2005.
[6] T. Cormen, C. Leiserson, R. Rivest, and C. Stein. Introduction to Algo-rithms, chapter 26. MIT Press, 2001.
[7] E. Gamma, R. Helm, R. Johnson, and J. Vlissides. Design Patterns: El-ements of reusable object-oriented software, chapter 5. Addison-Wesley,1995.
[8] G. H. Golub and C. F. V. Loan. Matrix computations. Johns HopkinsUniversity Press, Baltimore, MD, USA, 3rd. edition, 1996.
[9] J. Hastad. Clique is hard to approximate within n1−ε . Acta Mathematica,182:105–142, 1999.
[10] L. Ibanez, W. Schroeder, L. Ng, and J. Cates. The ITK Software Guide.Kitware, Inc. ISBN 1-930934-15-7, 2nd. edition, 2005.
[11] IBM. OpenDX. http://www.research.ibm.com/dx.[12] T. Jankun-Kelly and K.-L. Ma. Visualization exploration and encapsula-
tion via a spreadsheet-like interface. IEEE Transactions on Visualizationand Computer Graphics, 7(3):275–287, July/September 2001.
[13] T. Jankun-Kelly, K.-L. Ma, and M. Gertz. A model and framework forvisualization exploration. IEEE Transactions on Visualization and Com-puter Graphics, 13(2):357–369, March/April 2007.
[14] G. Kindlmann. Teem. http://teem.sourceforge.net.[15] Kitware. ParaView. http://www.paraview.org.[16] M. Kreuseler, T. Nocke, and H. Schumann. A history mechanism for
visual data mining. In Proceedings of IEEE Information VisualizationSymposium, pages 49–56, 2004.
[17] D. Kurlander and E. A. Bier. Graphical search and replace. In Proceed-ings of SIGGRAPH 1988, pages 113–120, 1988.
[18] D. Kurlander and S. Feiner. A history-based macro by example system.In Proceedings of UIST 1992, pages 99–106, 1992.
[19] A. N. Langville and C. D. Meyer. Google’s PageRank and Beyond: TheScience of Search Engine Rankings. Princeton University Press, 2006.
[20] H. Lieberman, editor. Your Wish is My Command: Programming by Ex-ample. Morgan Kaufmann, 2001.
[21] S. Melnik, H. Garcia-Molina, and E. Rahm. Similarity flooding: A versa-tile graph matching algorithm and its application to schema matching. InProceedings of the 18th International Conference on Data Engineering,pages 117–128, 2002.
[22] Mercury Computer Systems. Amira. http://www.amiravis.com.[23] T. Munzner, C. Johnson, R. Moorhead, H. Pfister, P. Rheingans, and T. S.
Yoo. NIH-NSF visualization research challenges report summary. IEEEComputer Graphics and Applications, 26(2):20–24, 2006.
[24] S. G. Parker and C. R. Johnson. SCIRun: a scientific programming envi-ronment for computational steering. In Proceedings of the InternationalConference for High Performance Computing, Networking, Storage andAnalysis (Supercomputing), 1995.
[25] Provenance challenge. http://twiki.ipaw.info/bin/view/Challenge.[26] C. Scheidegger, D. Koop, E. Santos, H. Vo, S. Callahan, J. Freire, and
C. Silva. Tackling the provenance challenge one layer at a time. Concur-rency and Computation: Practice and Experience, 2007. To appear.
[27] W. Schroeder, K. Martin, and B. Lorensen. The Visualization Toolkit.Kitware Inc, 2007.
[28] D. Shasha, J. T.-L. Wang, and R. Giugno. Algorithmics and applicationsof tree and graph searching. In Proceedings of the ACM Symposium onPrinciples of Database Systems, 2002.
[29] C. Upson, J. Thomas Faulhaber, D. Kamins, D. Laidlaw, D. Schlegel,J. Vroom, R. Gurwitz, and A. van Dam. The application visualizationsystem: A computational environment for scientific visualization. IEEEComputer Graphics and Applications, 9(4):30–42, 1989.
[30] J. J. van Wijk. The value of visualization. In Proceedings of IEEE Visu-alization, pages 79–86, 2005.
[31] M. Zloof. Query-by-example: a data base language. IBM Systems Jour-nal, 16(4):324–343, 1977.
8