questionnaire analysis - world banksiteresources.worldbank.org/.../resources/analysisv23.docx ·...
TRANSCRIPT

Questionnaire AnalysisSecond draft
Nyenode Business Universiteit
September 2010

Questionnaire Analysis 2010
Sample SelectionThe respondents of this research were classified into the following sectors: business services sector; manufacturing/production related industry; Transport, logistics and communications; Agriculture, hunting or forestry; Trading and repairing of consumers goods; public administration services, government services, and obligatory social security services; construction industry; financial institutions; environmental services, culture, recreation and other services; education services; winning of natural resources; health and welfare services; production, distribution, and trading in electricity, natural gas, steam, and water; renting and trading of real estate and movable properties; catering industry; and fisheries. Despite classifying and including industries in broad and inclusive categories there were, nevertheless, some responses that didn’t fit into this classification. Hence they are treated as “other sectors”.
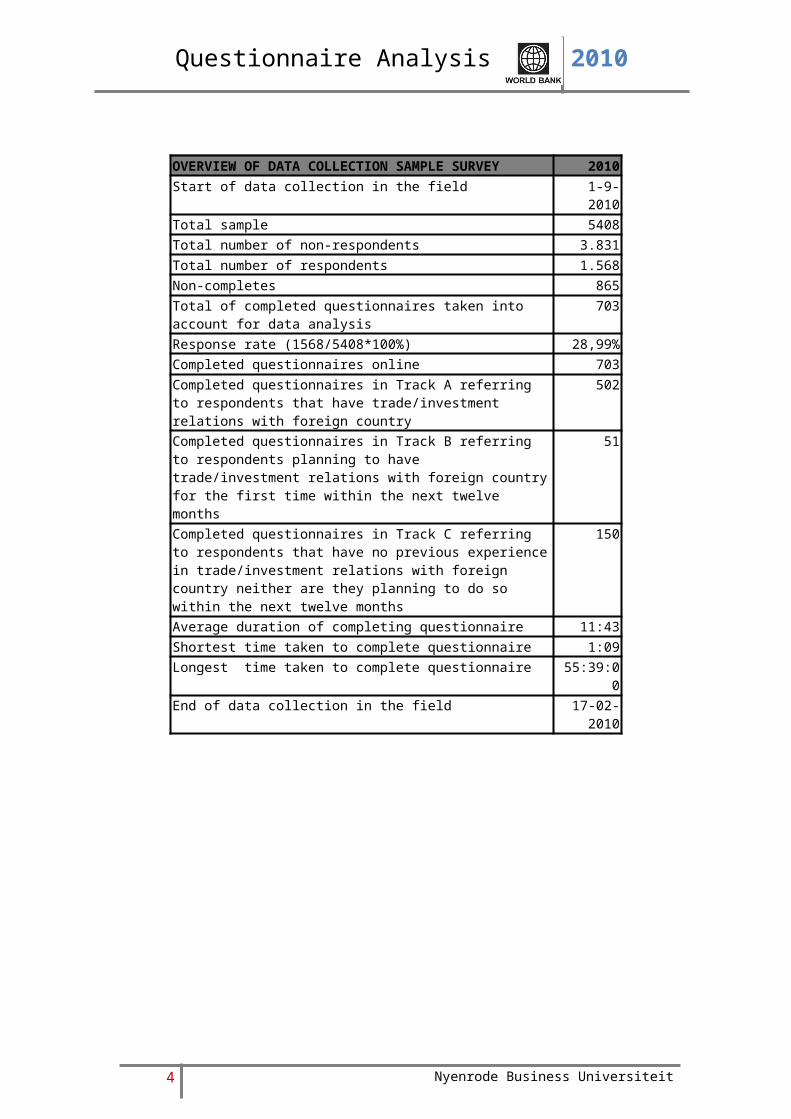
Data CollectionAfter identifying the key sectors that are crucial for the research, a data base was acquired which included foreign and Dutch service and production firms operating from the Netherlands per September 2009. An online questionnaire was designed to capture the objectives of this research. This questionnaire was then tested and discussed with the World Bank and targeted firms. Based on these consultations amendments were incorporated. The questionnaire in its final form consisted of 27 questions capturing the following issues on firm level: company details, gender information of firms’ employees at the domestic location, foreign trade and investment relations, offshoring activities, information about employees employed at foreign locations and other information regarding foreign locations (Appendix #). Based on their response to first question (S1), respondents are divided into one of three categories: those with previous experience in foreign trade/investments (Track A), those planning to have foreign trade/investment relations within the next 12 months (Track B), and those neither having foreign trade/investment experience nor having plans to do so within the next 12 months (Track C) –. An invitation letter specifying the purpose of the research including a link to an online questionnaire was sent per e-mail to the research population represented in our database consisting of 5.408 firms with an emphasis on compliance to strict data secrecy. Appropriate reminders per e-mail and timely follow up per telephone resulted in 1568 companies accepting the invitation to participate in the research while the rest either declined or did not respond. Among these 1.568 companies, 865 respondents did not complete the questionnaire and hence their responses were not considered for the analysis represented in the underlying report. The response rate, defined as the percentage of the invitations versus the number of completed questionnaires, was 28.99% (1568/5408*100%) as depicted in table below.
2 Nyenrode Business Universiteit

Questionnaire Analysis 2010
OVERVIEW OF DATA COLLECTION SAMPLE SURVEY 2010Start of data collection in the field 1-9-2010Total sample 5408Total number of non-respondents 3.831Total number of respondents 1.568Non-completes 865Total of completed questionnaires taken into account for data analysis 703
Response rate (1568/5408*100%) 28,99%Completed questionnaires online 703Completed questionnaires in Track A referring to respondents that have trade/investment relations with foreign country
502
Completed questionnaires in Track B referring to respondents planning to have trade/investment relations with foreign country for the first time within the next twelve months
51
Completed questionnaires in Track C referring to respondents that have no previous experience in trade/investment relations with foreign country neither are they planning to do so within the next twelve months
150
Average duration of completing questionnaire 11:43Shortest time taken to complete questionnaire 1:09Longest time taken to complete questionnaire 55:39:00End of data collection in the field 17-02-2010
3 Nyenrode Business Universiteit
Questionnaire Analysis 2010
Above figure provides an overview of the industry sectors that participated in this research. The majority of respondents (31.58%) belong to the business services sector; followed by respondents in manufacturing/production related industry (18.78%); Transport, logistics and communications (9.53%); Agriculture, hunting or forestry and Trading and repairing of consumers goods (both 7.82%).
4 Nyenrode Business Universiteit

Questionnaire Analysis 2010
The responses are segregated for the organizations’ foreign trade/investment relations with MENA region and the rest of the world. It shows that 1.65% of the respondents engaged in providing business services have relatively high percentage of trade/investment relationship with the MENA region. This is followed by 1.10% of respondents in industry, 0.86% in trading and repairing of consumer goods, and 0.78% in transport, logistics, and communication.
5 Nyenrode Business Universiteit
Agriculture, hunting or forestry
Winning of natural resources
Industry
Production, distribution andtrade in electricity, natural
gas, steam and water
Construction industry
Trading and repairingof consumer goods
Catering industry
Transport, logisticsand communications
Financial institutions
Renting and trading in realestate and movable property
Public administration services,government services andobligatory social security
Education
Business services
Health and welfare services
Environmental services, culture,recreation and other services
Other industries
0 5 10 15 20 25 30
Industrial classification - MENA vs Rest of the World
Trade / investment relations with rest of the worldTrade / investment relations in MENA
Percentage of responses
Indu
stry

Questionnaire Analysis 2010
Agriculture, hunting or forestry
Winning of natural resources
Industry
Production, distribution andtrade in electricity, natural
gas, steam and water
Construction industry
Trading and repairingof consumer goods
Catering industry
Transport, logisticsand communications
Financial institutions
Renting and trading in realestate and movable property
Public administration services,government services andobligatory social security
Education
Business services
Health and welfare services
Environmental services, culture,recreation and other services
Other industries
0 20 40 60 80 100
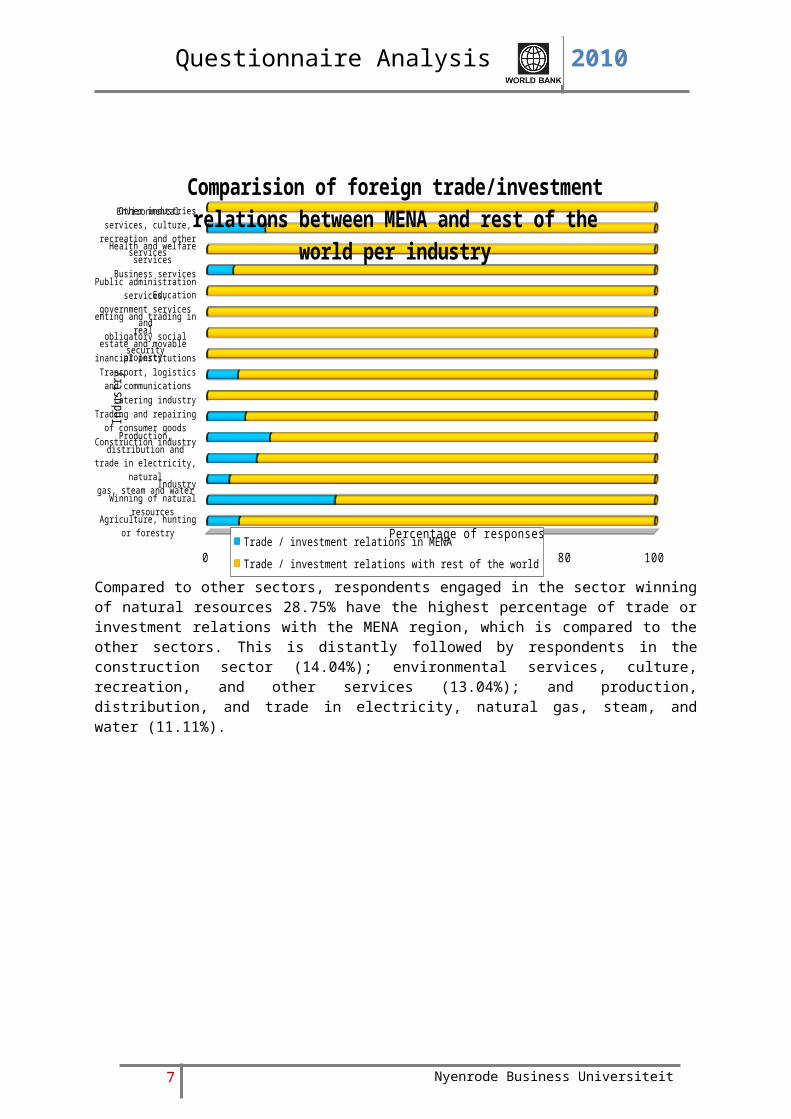
Comparision of foreign trade/investment relations between MENA and rest of the world per industry
Trade / investment relations in MENA Trade / investment relations with rest of the world
Percentage of responses
Indu
stry
Compared to other sectors, respondents engaged in the sector winning of natural resources 28.75% have the highest percentage of trade or investment relations with the MENA region, which is compared to the other sectors. This is distantly followed by respondents in the construction sector (14.04%); environmental services, culture, recreation, and other services (13.04%); and production, distribution, and trade in electricity, natural gas, steam, and water (11.11%).
6 Nyenrode Business Universiteit
Questionnaire Analysis 2010
Trade / investmentrelations in MENA
Trade / investment rela-tions
with rest of the world
0% 10% 20% 30% 40% 50% 60% 70% 80% 90% 100%
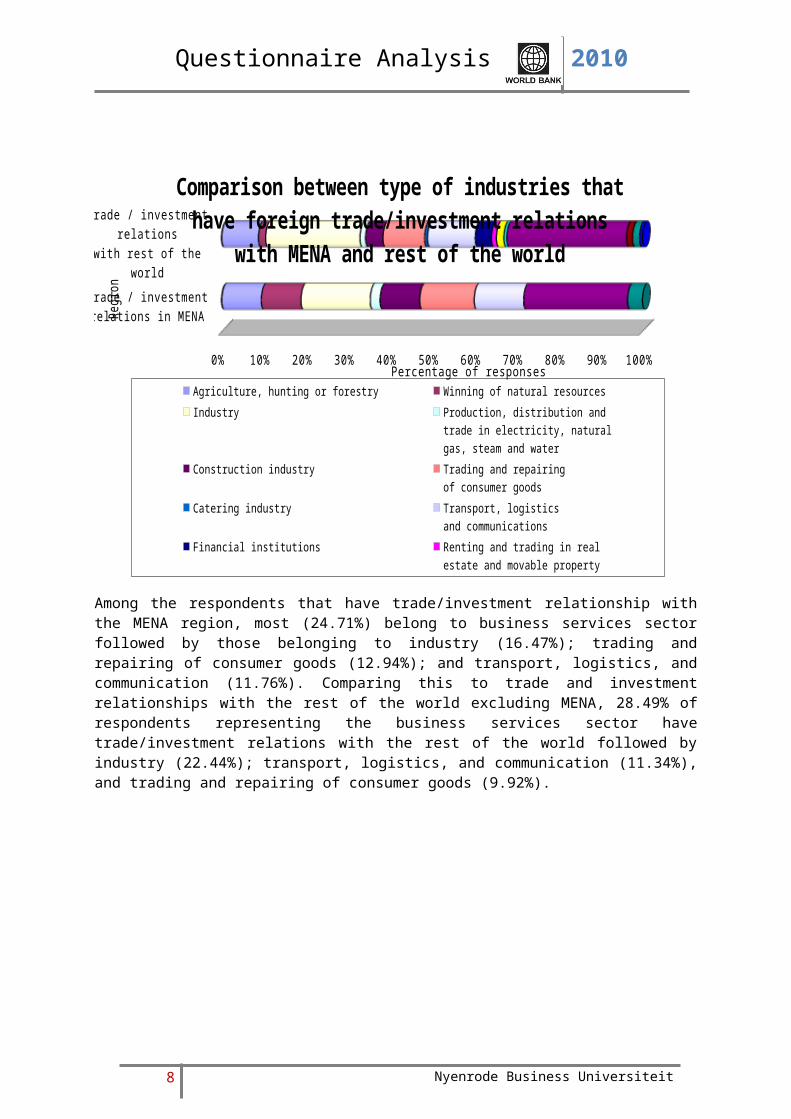
Comparison between type of industries that have foreign trade/investment relations with MENA and
rest of the world
Agriculture, hunting or forestry Winning of natural resources IndustryProduction, distribution andtrade in electricity, naturalgas, steam and water
Construction industry Trading and repairingof consumer goods
Catering industry Transport, logisticsand communications
Financial institutions
Renting and trading in realestate and movable property
Public administration services,government services andobligatory social security
Education
Business services Health and welfare services Environmental services, culture,recreation and other services
Other industries
Percentage of responses
Regio
n
Among the respondents that have trade/investment relationship with the MENA region, most (24.71%) belong to business services sector followed by those belonging to industry (16.47%); trading and repairing of consumer goods (12.94%); and transport, logistics, and communication (11.76%). Comparing this to trade and investment relationships with the rest of the world excluding MENA, 28.49% of respondents representing the business services sector have trade/investment relations with the rest of the world followed by industry (22.44%); transport, logistics, and communication (11.34%), and trading and repairing of consumer goods (9.92%).
7 Nyenrode Business Universiteit
Questionnaire Analysis 2010
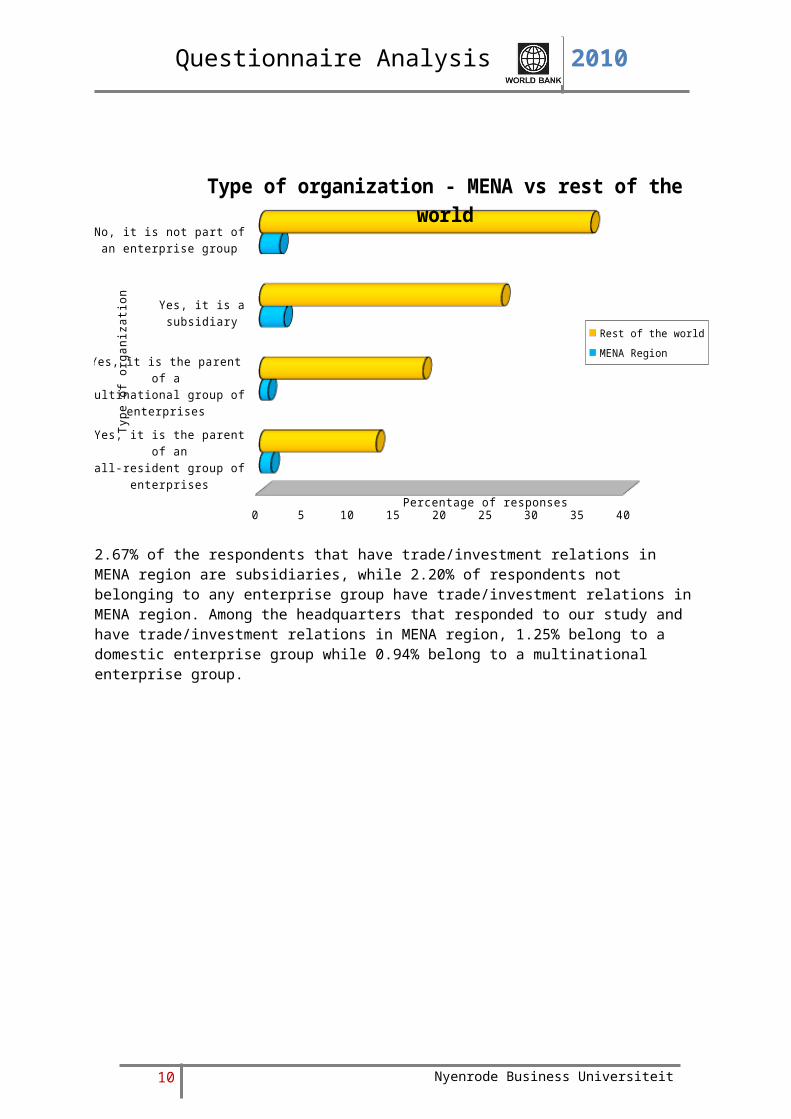
Further, nearly half of the respondents (48.08%) indicated that they are not part of an enterprise, while 24.89% indicated that the organization they are representing is a subsidiary. Further, 14.65% of the respondents represented headquarters of a multinational group of enterprise and 12.38% represented headquarters of domestic group of enterprises, as indicated in figure above.
8 Nyenrode Business Universiteit

Questionnaire Analysis 2010
Yes, it is the parent of anall-resident group of enterprises
Yes, it is the parent of amultinational group of en-
terprises
Yes, it is a subsidiary
No, it is not part of an enterprise group
0 5 10 15 20 25 30 35 40
Type of organization - MENA vs rest of the world
Rest of the worldMENA Region
Percentage of responses
Type
of o
rgan
izat
ion
2.67% of the respondents that have trade/investment relations in MENA region are subsidiaries, while 2.20% of respondents not belonging to any enterprise group have trade/investment relations in MENA region. Among the headquarters that responded to our study and have trade/investment relations in MENA region, 1.25% belong to a domestic enterprise group while 0.94% belong to a multinational enterprise group.
9 Nyenrode Business Universiteit
Questionnaire Analysis 2010
Yes, it is the parent of anall-resident group of enterprises
Yes, it is the parent of amultinational group of en-
terprises
Yes, it is a subsidiary
No, it is not part of an enterprise group
0 20 40 60 80 100 120
Preferred region for foreign trade/investment per type of organization
MENA Region Rest of the world
Percentage of responses
Type
of o
rgan
izat
ion
9.19% of the subsidiaries have trade/investment relation in the MENA region followed by Dutch domestic enterprise group (8.99%); non-enterprise group (5.74%) and then multinational enterprise group (5.02%).
10 Nyenrode Business Universiteit

Questionnaire Analysis 2010
MENA Region
Rest of the world
0 20 40 60 80 100
Type of organization per region
Yes, it is the parent of anall-resident group of enterprisesYes, it is the parent of amultinational group of enterprisesYes, it is a subsidiaryNo, it is not part of an enterprise group
Percentage of responses
Reg
ion
Of all the respondents that have trade/investment relations with the MENA region, 37.78% are subsidiaries of an enterprise groups, followed by those that are a non-enterprise groups (31.11%); headquarters of domestic enterprise groups (17.78%) and headquarters of multinational enterprise groups (13.33%).
These figures change while dealing with trade/investment relations with rest of the world. In this category, non-enterprise group respondents ranked highest with 38.82% having indicated to have trade/investment relations with the rest of the world (excluding the MENA region), followed by respondents that are subsidiaries of an enterprise groups (28.35%); respondents that are headquarters of multinational enterprise groups (19.16%); and respondents that are headquarters of a domestic enterprise group (13.67%).
11 Nyenrode Business Universiteit

Questionnaire Analysis 2010
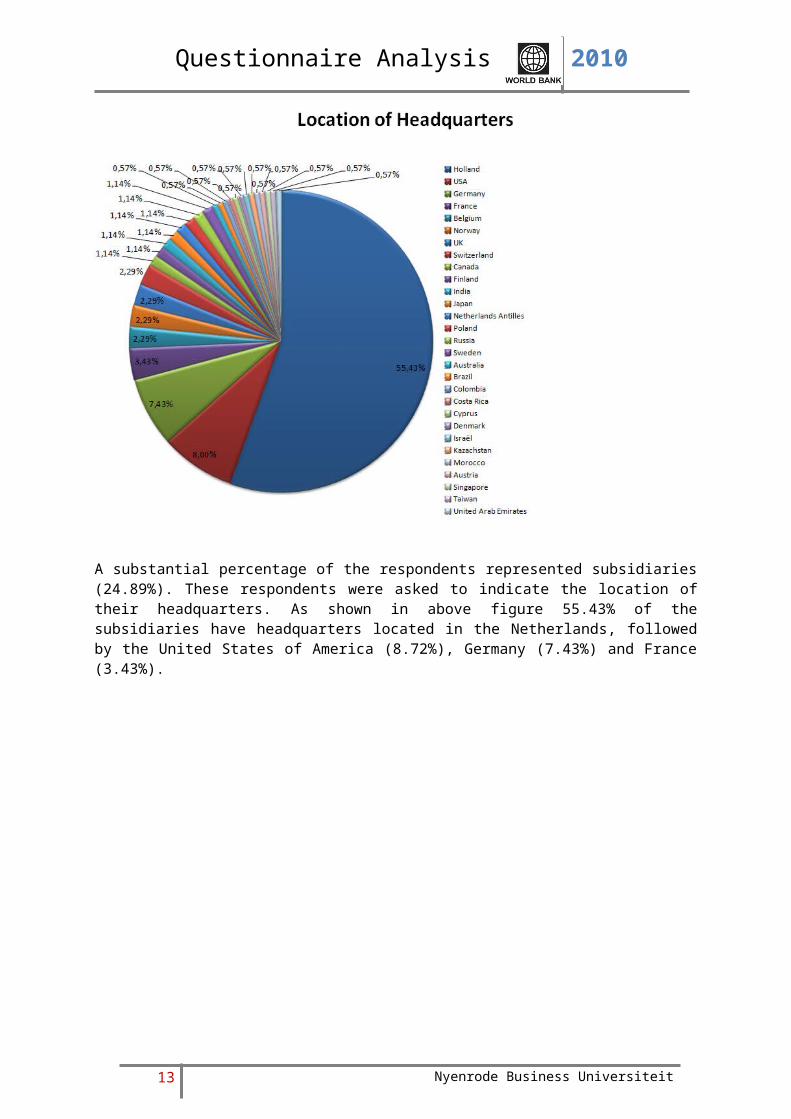
A substantial percentage of the respondents represented subsidiaries (24.89%). These respondents were asked to indicate the location of their headquarters. As shown in above figure 55.43% of the subsidiaries have headquarters located in the Netherlands, followed by the United States of America (8.72%), Germany (7.43%) and France (3.43%).
12 Nyenrode Business Universiteit
Questionnaire Analysis 2010
1%
99%
Comparison of location of headquarters - MENA vs Rest of the world
MENA Rest of the world
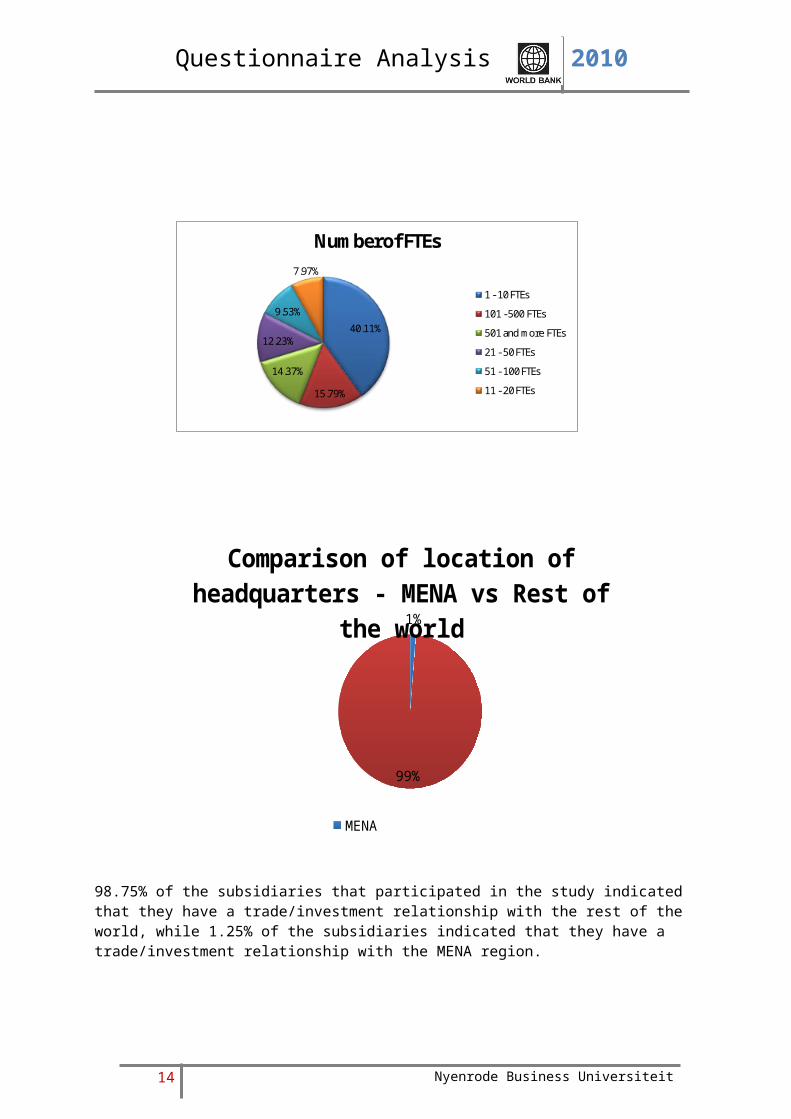
98.75% of the subsidiaries that participated in the study indicated that they have a trade/investment relationship with the rest of the world, while 1.25% of the subsidiaries indicated that they have a trade/investment relationship with the MENA region.
13 Nyenrode Business Universiteit
40.11%
15.79%
14.37%
12.23%
9.53%
7.97%
Number of FTEs
1 - 10 FTEs
101 - 500 FTEs
501 and more FTEs
21 - 50 FTEs
51 - 100 FTEs
11 - 20 FTEs
Questionnaire Analysis 2010
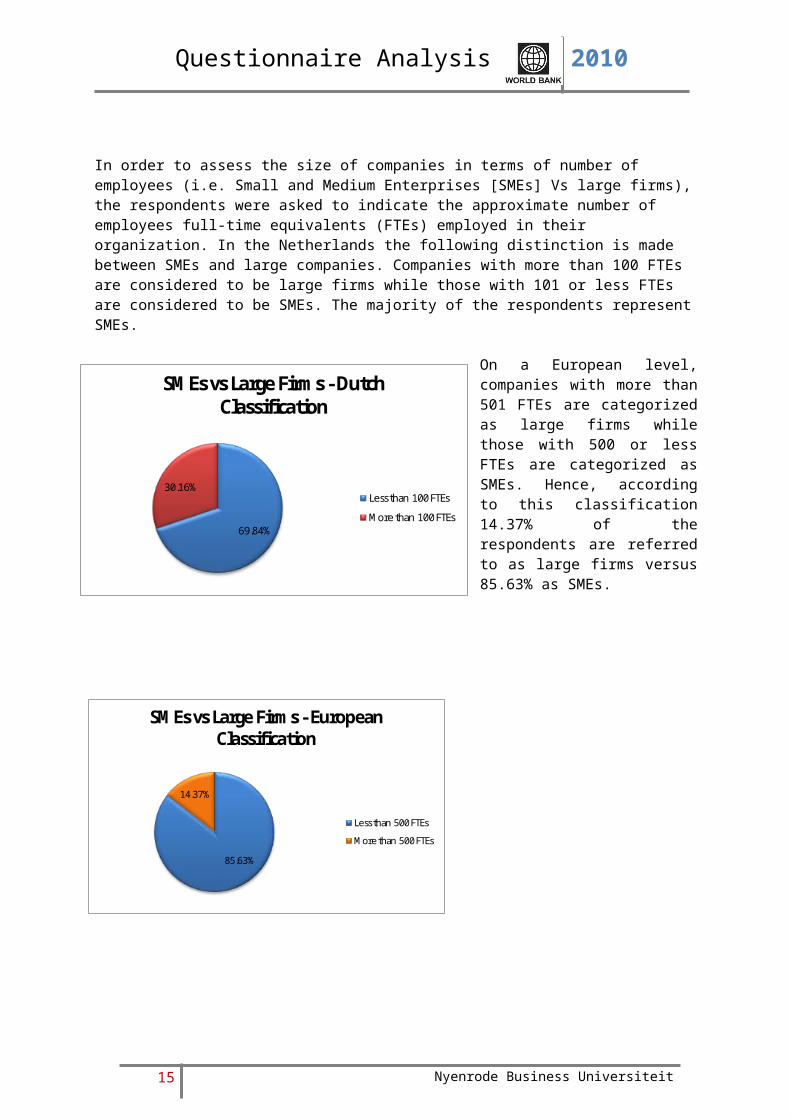
In order to assess the size of companies in terms of number of employees (i.e. Small and Medium Enterprises [SMEs] Vs large firms), the respondents were asked to indicate the approximate number of employees full-time equivalents (FTEs) employed in their organization. In the Netherlands the following distinction is made between SMEs and large companies. Companies with more than 100 FTEs are considered to be large firms while those with 101 or less FTEs are considered to be SMEs. The majority of the respondents represent SMEs.
On a European level, companies with more than 501 FTEs are categorized as large firms while those with 500 or less FTEs are categorized as SMEs. Hence, according to this classification 14.37% of the respondents are referred to as large firms versus 85.63% as SMEs.
14 Nyenrode Business Universiteit
85.63%
14.37%
SMEs vs Large Firms - European Classification
Less than 500 FTEs
More than 500 FTEs
69.84%
30.16%
SMEs vs Large Firms - Dutch Classification
Less than 100 FTEs
More than 100 FTEs
Questionnaire Analysis 2010
1-10
11-20
21-50
51-100
101-500
501 and more
0 5 10 15 20 25 30 35
Comparison of FTEs - MENA vs Rest of the world
Rest of the WorldMENA
Percentage of responses
Num
ber o
f FTE
s
15 Nyenrode Business Universiteit
Questionnaire Analysis 2010
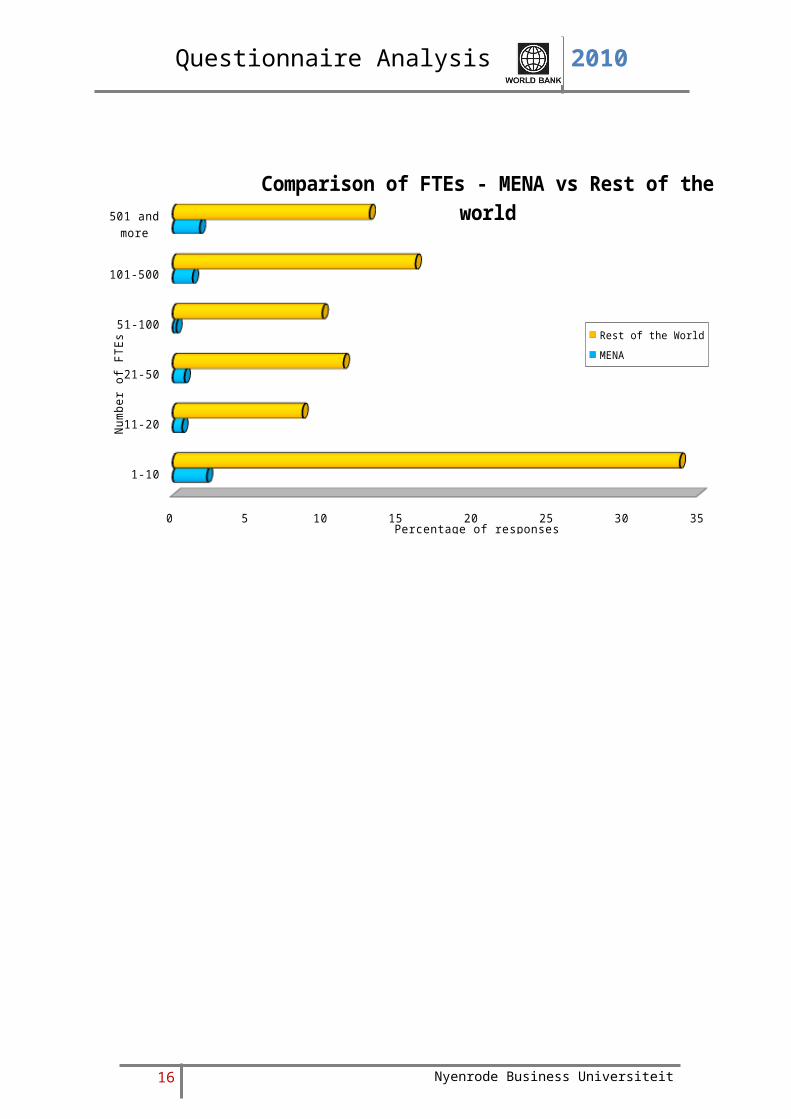
Of those respondents having a trade/investment relationship with the MENA region, 3.92% employ less than 100 FTEs, 1.33% employ between 100 and 500 FTEs and 1.8% employ more than 500 FTEs in the Netherlands.Of those respondents having a trade/investment relationship with countries the rest of the world, 63.69% employ less than 100 FTEs, 16.16% employ between 100 and 500 FTEs, and 13.10% employ more than 500 FTEs in the Netherlands.
1-10
11-20
21-50
51-100
101-500
501 and more
0 20 40 60 80 100
Preferred region for foreign trade/investment per number of FTEs
MENARest of the World
Percentage of responses
Num
ber o
f FTE
s
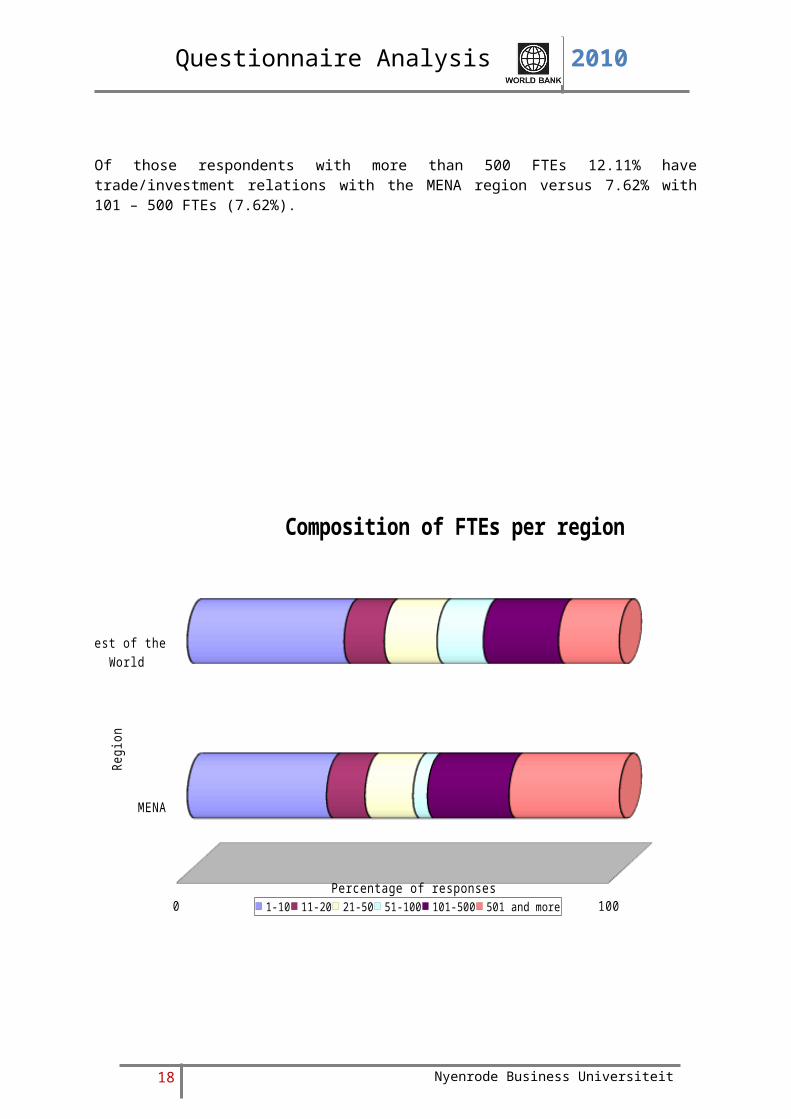
Of those respondents with more than 500 FTEs 12.11% have trade/investment relations with the MENA region versus 7.62% with 101 – 500 FTEs (7.62%).
16 Nyenrode Business Universiteit

Questionnaire Analysis 2010
MENA
Rest of the World
0 20 40 60 80 100
Composition of FTEs per region
1-10 11-20 21-50 51-100 101-500 501 and more
Percentage of responses
Regio
n
Among all the respondents that have trade/investment relations with MENA region, 32.22% have 1 -10 FTEs followed by 25.56% that have more than 500 FTEs and 18.89% that have 100 to 500 FTEs. For respondents with trade/investment relations with the rest of the world, 36.29% of the respondents have 1 – 10 FTEs followed by 17.38% that have 100 – 500 FTEs and 14.09% that have more than 500 FTEs.
17 Nyenrode Business Universiteit
Questionnaire Analysis 2010
The next part of the questionnaire focus is on gender issues. To begin with, we assessed the number of female employees as a percentage of total employees employed by the respondents on the domestic market.
We categorized five proportional brackets classified as following: 0% of total employees are female, 1–24% of total employees are female, 25–49% of total employees are female, 50–74% of total employees are female, and 75–100% of the total employees are female and asked the respondents to choose the option most resembling their organization. In response to this question, 44.95% of the respondents indicated to have 1–24% of female employees within their organization, followed by 19.20% of the respondents having 25–49% of female employees in their organization. 17.07% of the respondents claim to have no female employees in their organization at all as indicated in above figure.
18 Nyenrode Business Universiteit
17.07%
44.95%19.20%
9.96%
8.82%
Percentage of female employees employed on the domestic market
0 %
1 – 24%
25 – 49%
50 – 74%
75 – 100%

Questionnaire Analysis 2010
0 %
1 – 24%
25 – 49%
50 – 74%
75 – 100%
0 5 10 15 20 25 30 35 40 45 50
Comparison of medium to highly educated female employees - MENA vs Rest of the world
Rest of the worldMENA
Percentage of responses
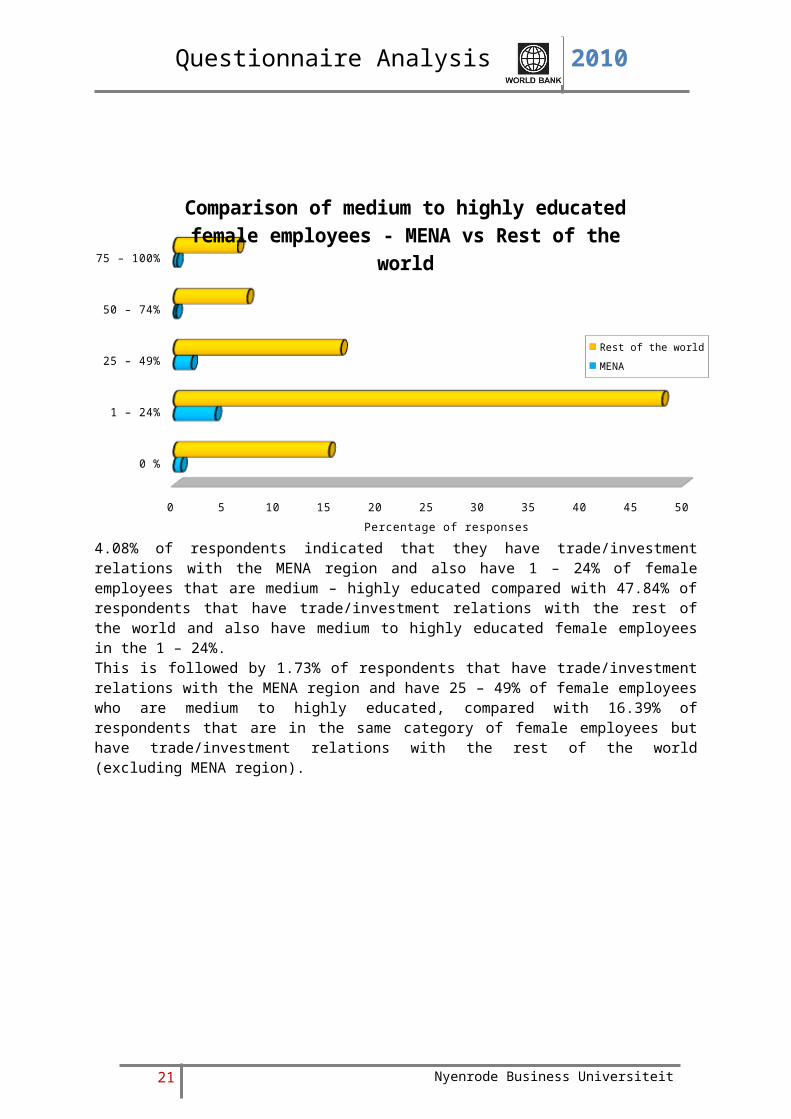
4.08% of respondents indicated that they have trade/investment relations with the MENA region and also have 1 – 24% of female employees that are medium – highly educated compared with 47.84% of respondents that have trade/investment relations with the rest of the world and also have medium to highly educated female employees in the 1 – 24%.This is followed by 1.73% of respondents that have trade/investment relations with the MENA region and have 25 – 49% of female employees who are medium to highly educated, compared with 16.39% of respondents that are in the same category of female employees but have trade/investment relations with the rest of the world (excluding MENA region).
19 Nyenrode Business Universiteit

Questionnaire Analysis 2010
0 %
1 – 24%
25 – 49%
50 – 74%
75 – 100%
0 20 40 60 80 100
Preferred region for foreign trade/investment per category female employees
MENA Rest of the world
Percentage of responses
9.52% of respondents that belong to 25 – 49% bracket have trade/investment relations with the MENA region followed by 7.85% of those in the 1 – 24% bracket and 4.76% in the 75 – 100% bracket.
20 Nyenrode Business Universiteit
Questionnaire Analysis 2010
MENA
Rest of the world
0 20 40 60 80 100
Composition of medium to highly educated employees in organizations per region
0 %
1 – 24%
25 – 49%
50 – 74%
75 – 100%
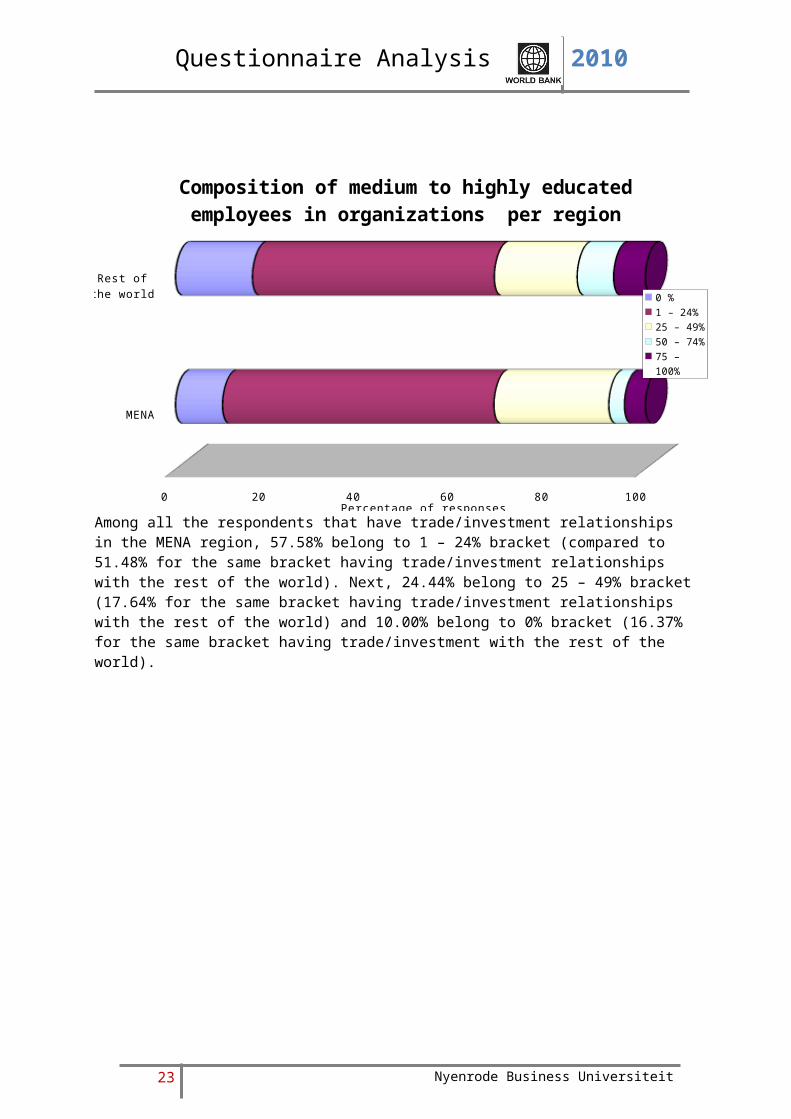
Percentage of responsesAmong all the respondents that have trade/investment relationships in the MENA region, 57.58% belong to 1 – 24% bracket (compared to 51.48% for the same bracket having trade/investment relationships with the rest of the world). Next, 24.44% belong to 25 – 49% bracket (17.64% for the same bracket having trade/investment relationships with the rest of the world) and 10.00% belong to 0% bracket (16.37% for the same bracket having trade/investment with the rest of the world).
21 Nyenrode Business Universiteit

Questionnaire Analysis 2010
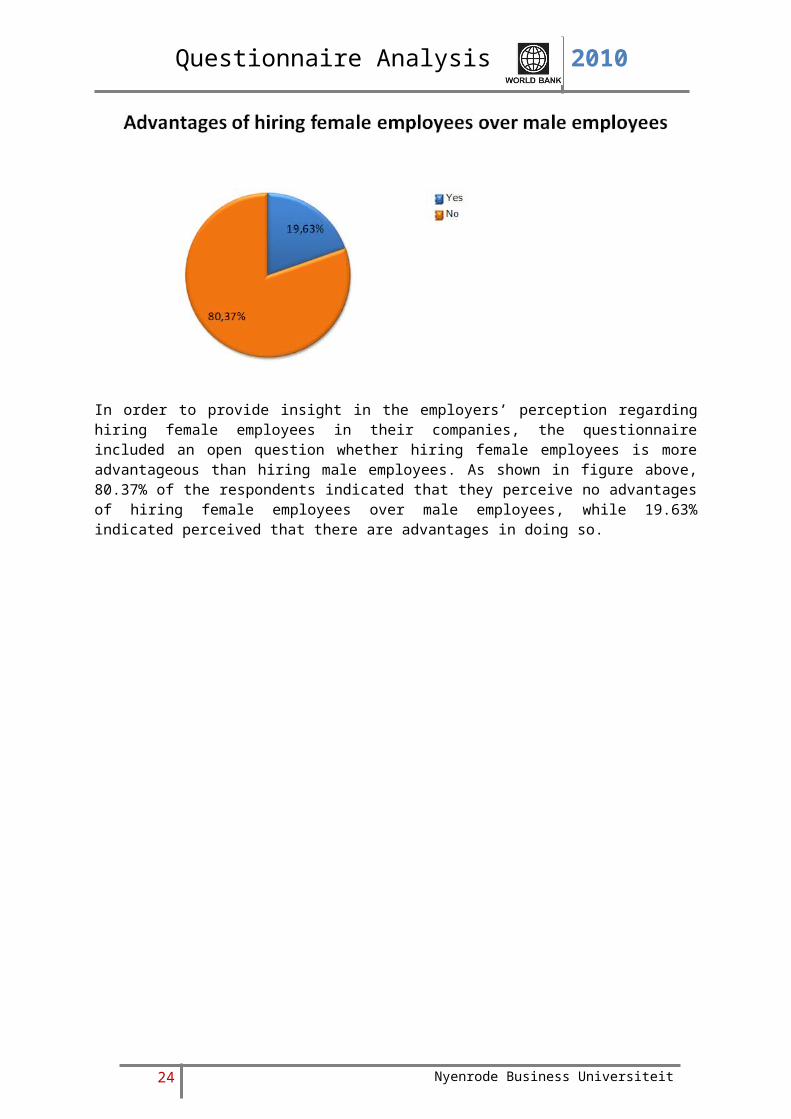
In order to provide insight in the employers’ perception regarding hiring female employees in their companies, the questionnaire included an open question whether hiring female employees is more advantageous than hiring male employees. As shown in figure above, 80.37% of the respondents indicated that they perceive no advantages of hiring female employees over male employees, while 19.63% indicated perceived that there are advantages in doing so.
22 Nyenrode Business Universiteit
Questionnaire Analysis 2010
The next question inquired whether employers perceive disadvantages for hiring female employees over their male counterparts. As shown in figure above, 80.94% of the respondents indicated that they do not perceive any disadvantages of hiring female employees, while 19.06% of the respondents indicated that they do perceive disadvantages associated with hiring female employees over male employees.
23 Nyenrode Business Universiteit
Questionnaire Analysis 2010
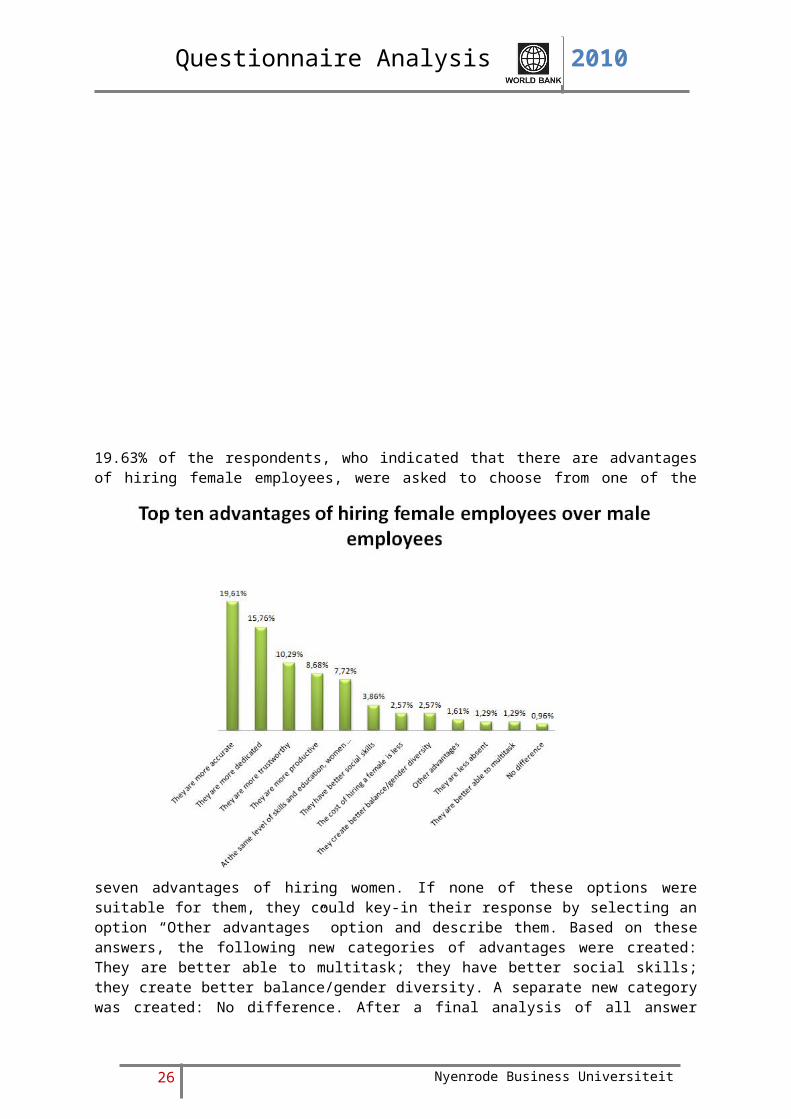
19.63% of the respondents, who indicated that there are advantages of hiring female employees, were asked to choose from one of the seven advantages of hiring women. If none of these options
were suitable for them, they could key-in their response by selecting an option “Other advantages” option and describe them. Based on these answers, the following new categories of advantages were created: They are better able to multitask; they have better social skills; they create better balance/gender diversity. A separate new category was created: No difference. After a final analysis of all answer options, it is found that 25.74% mentioned that women are more accurate than men followed by 20.68% who indicated that women are more dedicated than men. Above figure indicates the top ten advantages associated with hiring female employees.
24 Nyenrode Business Universiteit

Questionnaire Analysis 2010
They are more productive
They are more trustworthy
They are less absent
They are more accurate
They are more dedicated
At the same level of skills and education,
females have a higher level of training
The cost of hiring a female is less
They are better able to multi-task
They have better social skills
They create betterbalance/gender diversity
Meaningless
No difference
Others
0 5 10 15 20 25
Comparison of advantages of hiring female em-ployees over male employees in the Netherlands -
MENA vs Rest of the world
Foreign trade / investment relations with rest of the world Foreign trade / investment relations with MENA
Percentage of responsesAdva
ntag
es o
f hiri
ng fe
mal
e em
ploy
ees
in th
e N
ethe
r-
land
s
Female employees are more accurate (indicated by 23.59% of respondents), female employees are more dedicated (17.16%), female employees are more trustworthy (11.53%), at the same level of skills and education female employees have higher level of training (9.12%), and female employees are more productive (8.85%) are the top five advantages of hiring female employees over male employees in the Netherlands as reported by respondents that have trade/investment relations with rest of the world (excluding MENA).For those respondents that have trade/investment relations with MENA the top five advantages are as follows: female employees are more accurate (2.41%), female employees are more productive (1.34%), female employees are more dedicated (1.61%), female employees are more trust worthy (1.07%), and at the same level of skills and education female employees have higher level of training (1.07%).
25 Nyenrode Business Universiteit
Questionnaire Analysis 2010
They are more productive
They are more trustworthy
They are less absent
They are more accurate
They are more dedicated
At the same level of skills and education,
females have a higher level of training
The cost of hiring a female is less
They are better able to multi-task
They have better social skills
They create betterbalance/gender diversity
Meaningless
No difference
Others
0 20 40 60 80 100
Foreign trade/investment relations per type of advantage of hiring female employees in the
Netherlands
Foreign trade / investment relations with MENA Foreign trade / investment relations with rest of the world
Percentage of responses
Adva
ntag
es o
f hiri
ng fe
mal
e em
ploy
ees
in th
e N
ethe
r-
land
s
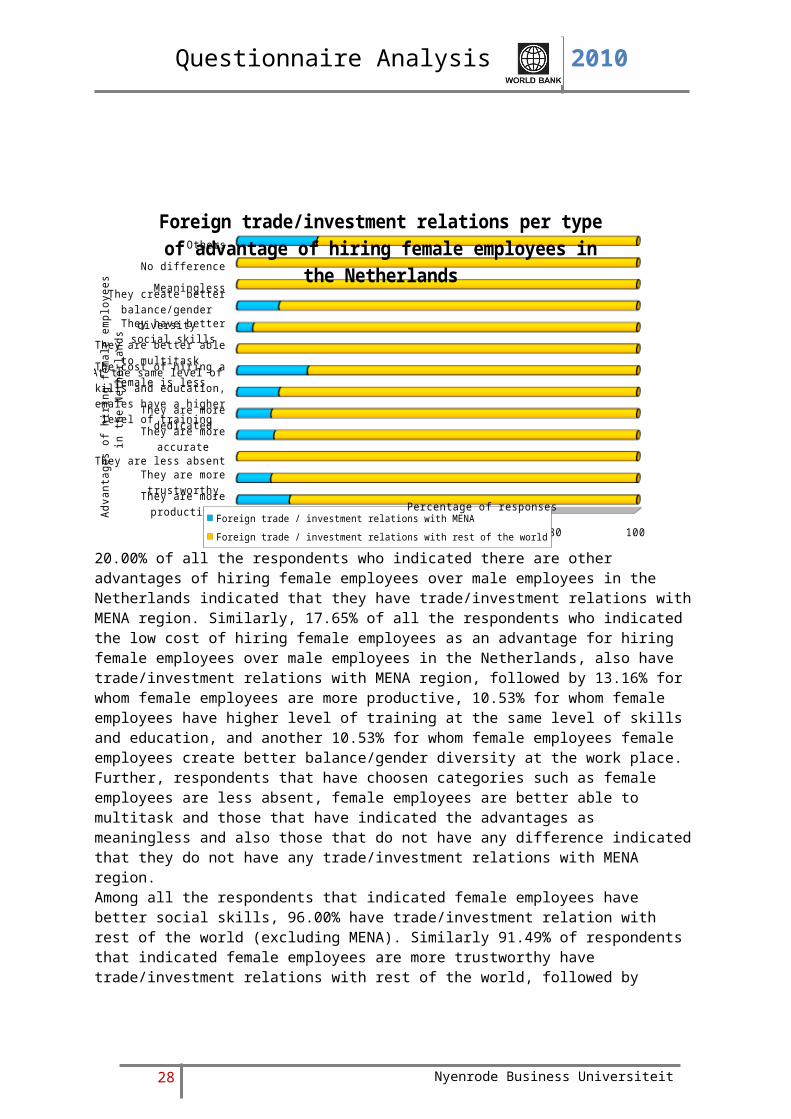
20.00% of all the respondents who indicated there are other advantages of hiring female employees over male employees in the Netherlands indicated that they have trade/investment relations with MENA region. Similarly, 17.65% of all the respondents who indicated the low cost of hiring female employees as an advantage for hiring female employees over male employees in the Netherlands, also have trade/investment relations with MENA region, followed by 13.16% for whom female employees are more productive, 10.53% for whom female employees have higher level of training at the same level of skills and education, and another 10.53% for whom female employees female employees create better balance/gender diversity at the work place. Further, respondents that have choosen categories such as female employees are less absent, female employees are better able to multitask and those that have indicated the advantages as meaningless and also those that do not have any difference indicated that they do not have any trade/investment relations with MENA region.Among all the respondents that indicated female employees have better social skills, 96.00% have trade/investment relation with rest of the world (excluding MENA). Similarly 91.49% of respondents that indicated female employees are more trustworthy have trade/investment relations with rest of the world, followed by 91.43% for whom female employees are more dedicated, and 90.72% for whom female employees are more accurate.
26 Nyenrode Business Universiteit

Questionnaire Analysis 2010
Foreign trade / investment rela-
tions with MENA
Foreign trade / investment rela-tions with rest of the world
0 20 40 60 80 100
Advantages of hiring female employees overmale employees in the Netherlands
They are more productive They are more trustworthy They are less absent
They are more accurate They are more dedicated At the same level of skills and education, females have a higher level of training
The cost of hiring a female is less They are better able to multitask They have better social skills
They create betterbalance/gender diversity
Meaningless No difference
Others
Percentage of responses
Among all the respondents that have trade/investment relations with MENA, 25.00% indicated female employees are more accurate, 16.67% indicated female employees are more dedicated, 13.89% indicated female employees are more productive, 11.11% indicated female employees are more trustworthy, and another 11.11% indicated that at the same level of skills and education, female employees have higher level of training.Among all the respondents that have trade/investment relations with rest of the world (excluding MENA), 26.11% indicated female employees are more accurate, 18.99% indicated female employees are more dedicated, 12.76% indicated female employees are more trustworthy, and another 10.09% indicated that at the same level of skills and education, female employees have higher level of training, and 9.79% indicated female employees are more productive.The pattern of advantages of hiring female employees in the Netherlands chosen by those that have trade/investment with MENA and the rest of the world broadly matches with each other.
27 Nyenrode Business Universiteit
Questionnaire Analysis 2010
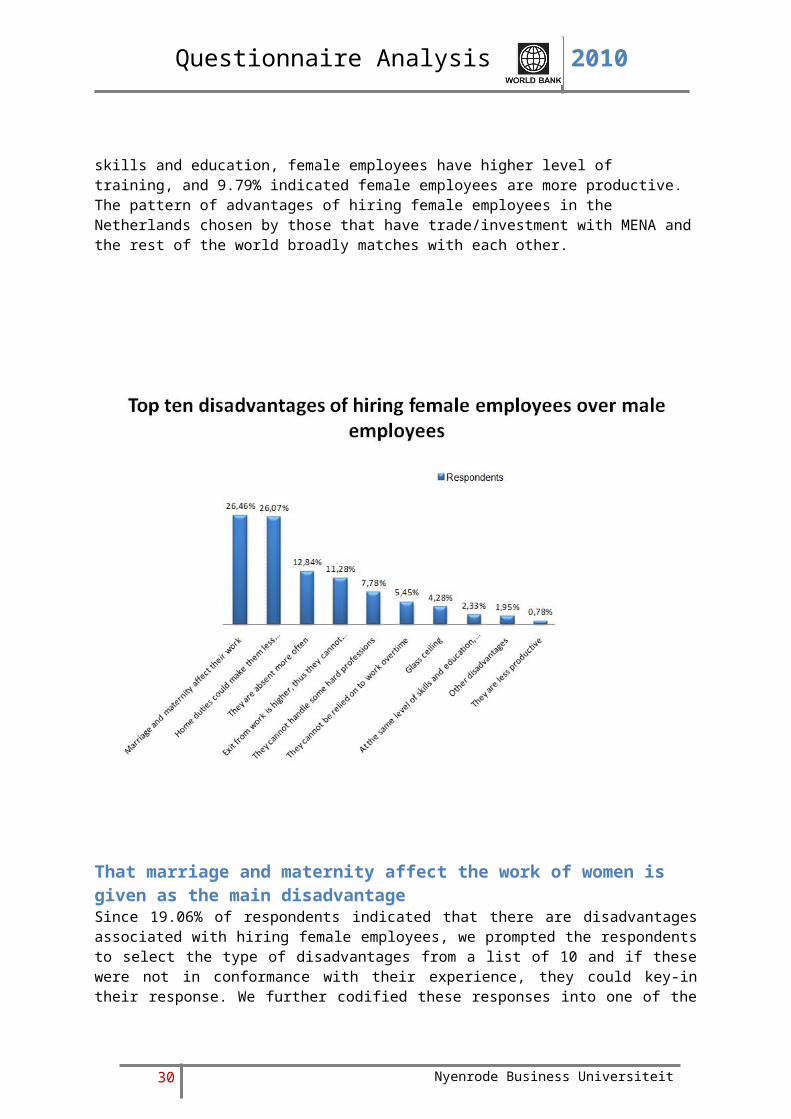
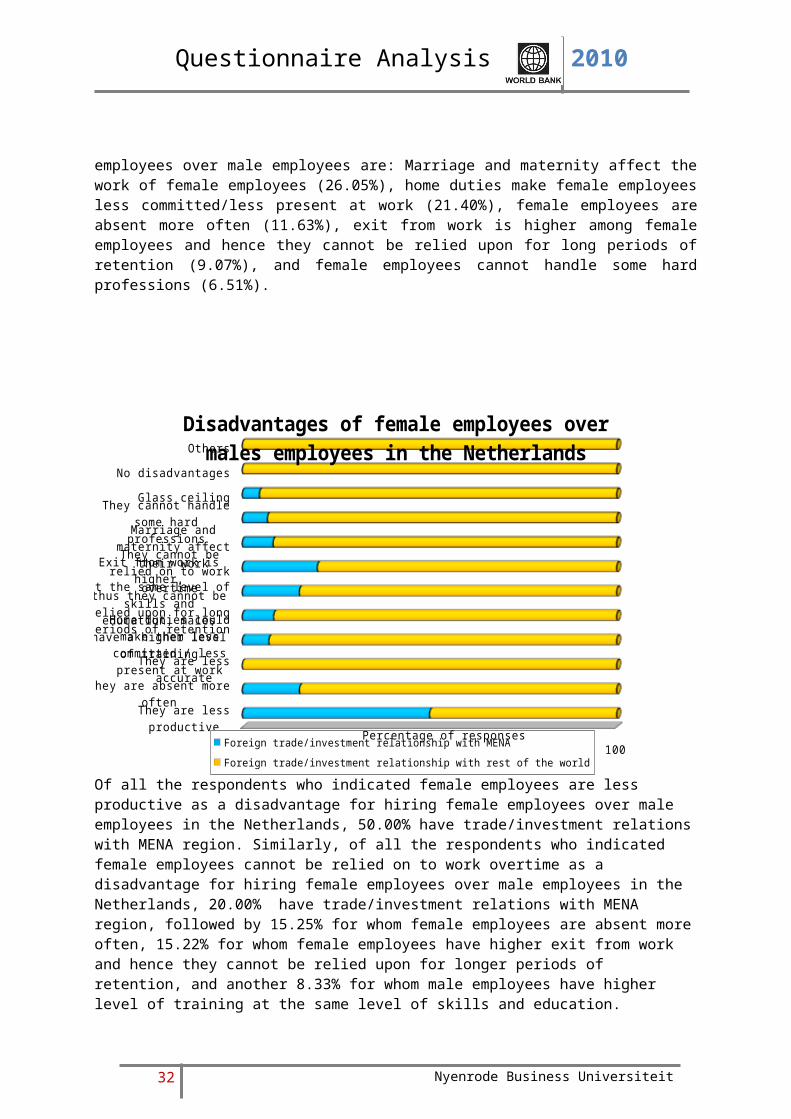
That marriage and maternity affect the work of women is given as the main disadvantageSince 19.06% of respondents indicated that there are disadvantages associated with hiring female employees, we prompted the respondents to select the type of disadvantages from a list of 10 and if these were not in conformance with their experience, they could key-in their response. We further codified these responses into one of the listed categories. There were few responses that did not seem to fit the standard classification. Hence the new category “Glass ceiling” was created to accommodate these responses.As indicated in the figure above, respondent’s assigned marriage and maternity as the top disadvantage associated with women followed by their commitments towards their personal obligations. Above figure provides a detailed listing of top 10 disadvantages associated with women.
28 Nyenrode Business Universiteit

Questionnaire Analysis 2010
They are less productive
They are absent more often
They are less accurate
Home duties couldmake them less committed /
less present at work
At the same level ofskills and education, males
have a higher level of training
Exit from work is higher,thus they cannot be relied
upon for long periods of reten-tion
They cannot be relied on to work overtime
Marriage and maternity affect their work
They cannot handle some hard professions
Glass ceiling
No disadvantages
Others
0 5 10 15 20 25 30
Disadvantages of females employees over male employees in the Netherlands
Foreign trade/investment relationship with rest of the world Foreign trade/investment relationship with MENA
Percentage of responses
Dis
adva
ntag
es
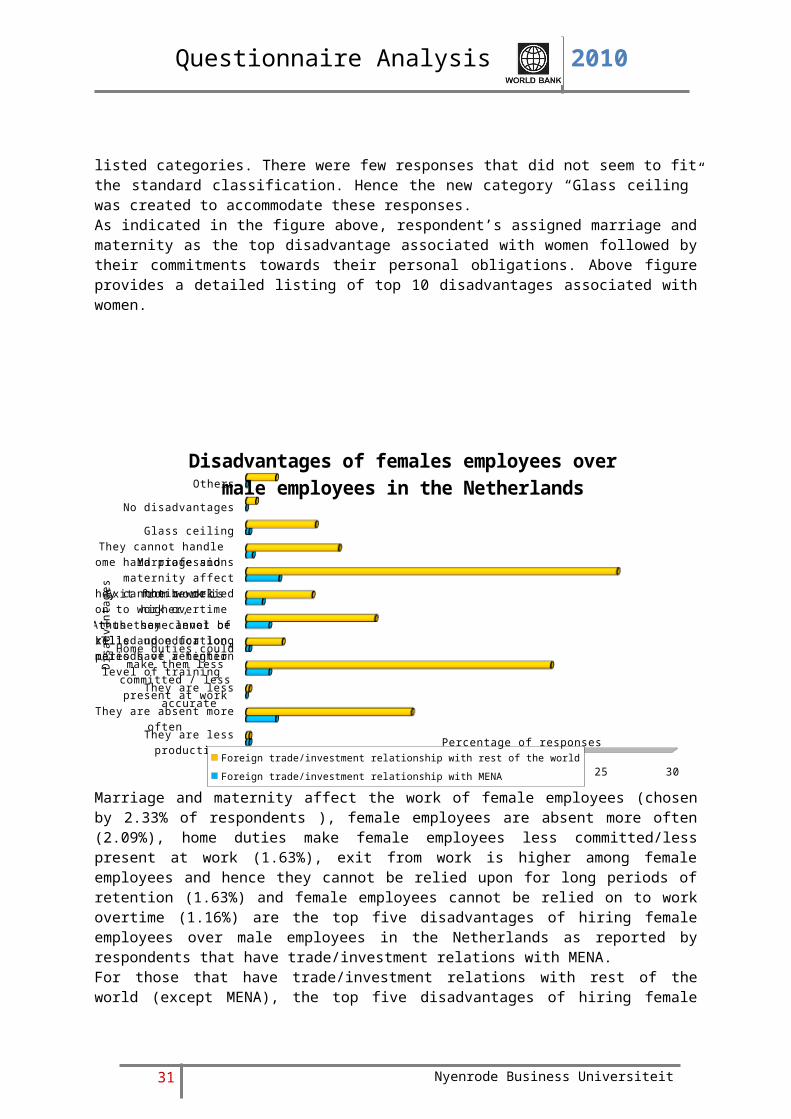
Marriage and maternity affect the work of female employees (chosen by 2.33% of respondents ), female employees are absent more often (2.09%), home duties make female employees less committed/less present at work (1.63%), exit from work is higher among female employees and hence they cannot be relied upon for long periods of retention (1.63%) and female employees cannot be relied on to work overtime (1.16%) are the top five disadvantages of hiring female employees over male employees in the Netherlands as reported by respondents that have trade/investment relations with MENA.For those that have trade/investment relations with rest of the world (except MENA), the top five disadvantages of hiring female employees over male employees are: Marriage and maternity affect the work of female employees (26.05%), home duties make female employees less committed/less present at work (21.40%), female employees are absent more often (11.63%), exit from work is higher among female employees and hence they cannot be relied upon for long periods of retention (9.07%), and female employees cannot handle some hard professions (6.51%).
29 Nyenrode Business Universiteit
Questionnaire Analysis 2010
They are less productive
They are absent more often
They are less accurate
Home duties couldmake them less committed /
less present at work
At the same level ofskills and education, males
have a higher level of training
Exit from work is higher,thus they cannot be relied
upon for long periods of re-tention
They cannot be relied on to work overtime
Marriage and maternity affect their work
They cannot handle some hard professions
Glass ceiling
No disadvantages
Others
0 20 40 60 80 100
Disadvantages of female employees over males employees in the Netherlands
Foreign trade/investment relationship with MENA Foreign trade/investment relationship with rest of the world
Percentage of responses
Of all the respondents who indicated female employees are less productive as a disadvantage for hiring female employees over male employees in the Netherlands, 50.00% have trade/investment relations with MENA region. Similarly, of all the respondents who indicated female employees cannot be relied on to work overtime as a disadvantage for hiring female employees over male employees in the Netherlands, 20.00% have trade/investment relations with MENA region, followed by 15.25% for whom female employees are absent more often, 15.22% for whom female employees have higher exit from work and hence they cannot be relied upon for longer periods of retention, and another 8.33% for whom male employees have higher level of training at the same level of skills and education. Further, respondents that have choosen categories such as female employees are less accurate, female employees have no disadvantages and other reasons indicated that they do not have any trade/investment relations with MENA region.Among all the respondents that indicated female employees have glass ceiling, 95.45% have trade/investment relation with rest of the world (excluding MENA). Similarly 93.33% of respondents that indicated female employees cannot handle some hard professions have trade/investment relations with rest of the world, followed by 92.93% for whom home duties could make female employees less committed/less present at work, and 91.80% for whom marriage and maternity could affect the work of female employees.
30 Nyenrode Business Universiteit
Questionnaire Analysis 2010
Among all the respondents that have trade/investment relations with MENA, 23.26% indicated marriage and maternity affects the work of female employees, 20.93%% indicated female employees are absent more often, 16.28% indicated home duties made female employees less committed/less present at work, 16.28% indicated female employees have higher exit from work and hence they cannot be relied upon for long periods of retention, and another 11.63% indicated that at female employees cannot be relied on to work overtime.Among all the respondents that have trade/investment relations with rest of the world (excluding MENA), 28.94% indicated marriage and maternity affects the work of female employees, 23.77% indicated home duties made female employees less committed/less present at work, 12.92% indicated female employees are absent more often, 10.08% indicated female employees have higher exit from work and hence they cannot be relied upon for long periods of retention, and 7.24% indicated female employees cannot handle some hard profession.The pattern of disadvantages of hiring female employees in the Netherlands chosen by those that have trade/investment with MENA and the rest of the world broadly matches with each other.
31 Nyenrode Business Universiteit
Questionnaire Analysis 2010
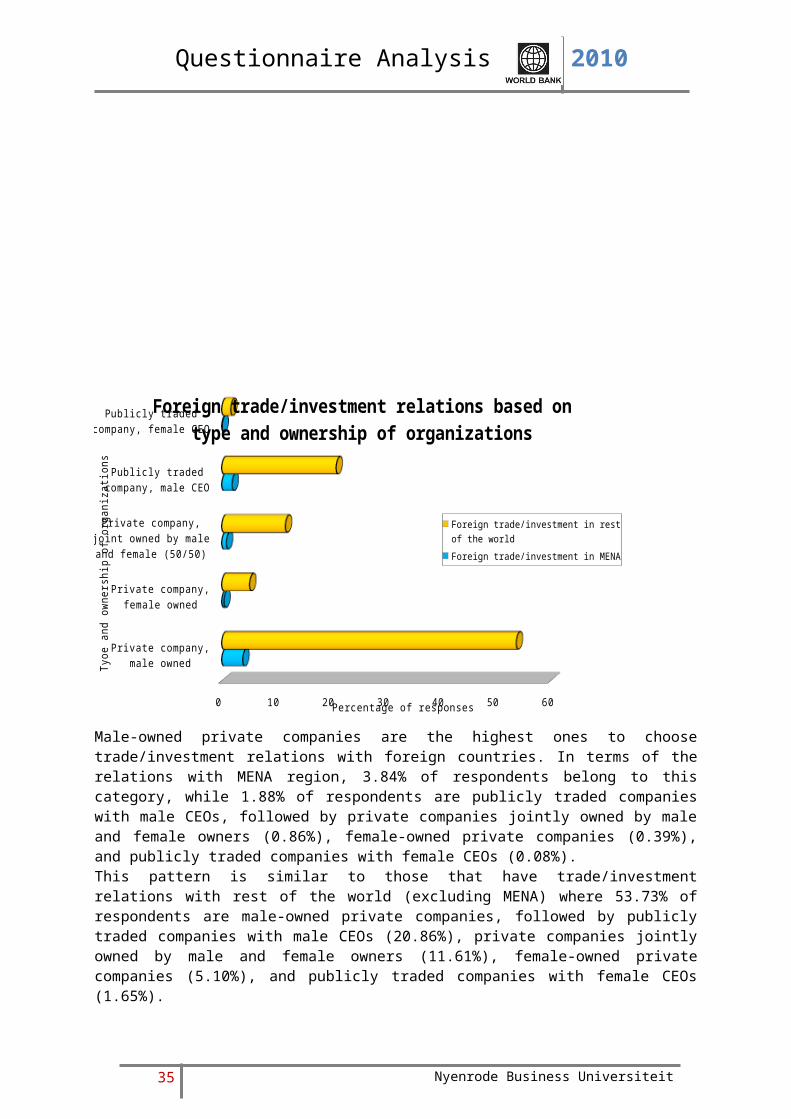
Largest portion of almost 55% are male owned, private companies This question aims to shed some light on the ownership of respondents’ organization based on gender. Above figure shows 54.62% of the organizations who participated in the research to be private companies owned by men versus 7.40% that are private companies owned by women; 23.19% are publicly traded companies with male CEOs versus 3.84% that are publicly traded companies with female CEOs. Thus, majority of the organizations that participated in the research are owned or operated by men. Therefore, we can infer that the majority of opinions about women employees are by employers who are men. Another 10.95% of the organizations are private companies that are equally owned by men and women.
32 Nyenrode Business Universiteit

Questionnaire Analysis 2010
Private company, male owned
Private company, female owned
Private company, joint owned by male and female
(50/50)
Publicly traded company, male CEO
Publicly traded company, female CEO
0 10 20 30 40 50 60
Foreign trade/investment relations based on type and ownership of organizations
Foreign trade/investment in rest of the world
Foreign trade/investment in MENA
Percentage of responses
Tyoe
and
own
ersh
ip o
f org
aniz
ation
s
Male-owned private companies are the highest ones to choose trade/investment relations with foreign countries. In terms of the relations with MENA region, 3.84% of respondents belong to this category, while 1.88% of respondents are publicly traded companies with male CEOs, followed by private companies jointly owned by male and female owners (0.86%), female-owned private companies (0.39%), and publicly traded companies with female CEOs (0.08%).This pattern is similar to those that have trade/investment relations with rest of the world (excluding MENA) where 53.73% of respondents are male-owned private companies, followed by publicly traded companies with male CEOs (20.86%), private companies jointly owned by male and female owners (11.61%), female-owned private companies (5.10%), and publicly traded companies with female CEOs (1.65%).
33 Nyenrode Business Universiteit

Questionnaire Analysis 2010
Private company, male owned
Private company, female owned
Private company, joint owned by male and female (50/50)
Publicly traded company, male CEO
Publicly traded company, female CEO
0 20 40 60 80 100 120
Foreign trade/investment relations based on type and ownership of organizations
Foreign trade/investment in MENA Foreign trade/investment in rest of the world
Percentage of responses
Type
and
ow
ners
hip
of o
rgan
izat
ions
Among all the male-owned private companies, 6.68% have trade/investment relations with MENA region against 93.32% that have trade/investment with rest of the world (excluding MENA). Similarly, the figures are 7.14% against 92.86% for female-owned private companies; 6.92% against 93.08% for private companies jointly owned by male and female executives, 8.28% against 91.72% for publicly traded companies with male CEOs, and 4.55% against 95.55% for publicly traded companies with female CEOs. Clearly, publicly traded companies with male CEOs are leading traders/investors in MENA region followed by female owned private companies, private companies jointly owned by male and female executives, male-owned private companies and lastly publicly traded companies with female CEOs.
34 Nyenrode Business Universiteit
Questionnaire Analysis 2010
Foreign trade/invest-
ment in MENA
Foreign trade/invest-ment in rest of the world
0 20 40 60 80 100
Foreign trade/investment relations based on type and ownership of organizations
Private company, male owned Private company, female ownedPrivate company, joint owned by male and female (50/50) Publicly traded company, male CEOPublicly traded company, female CEO
Percentage of responses
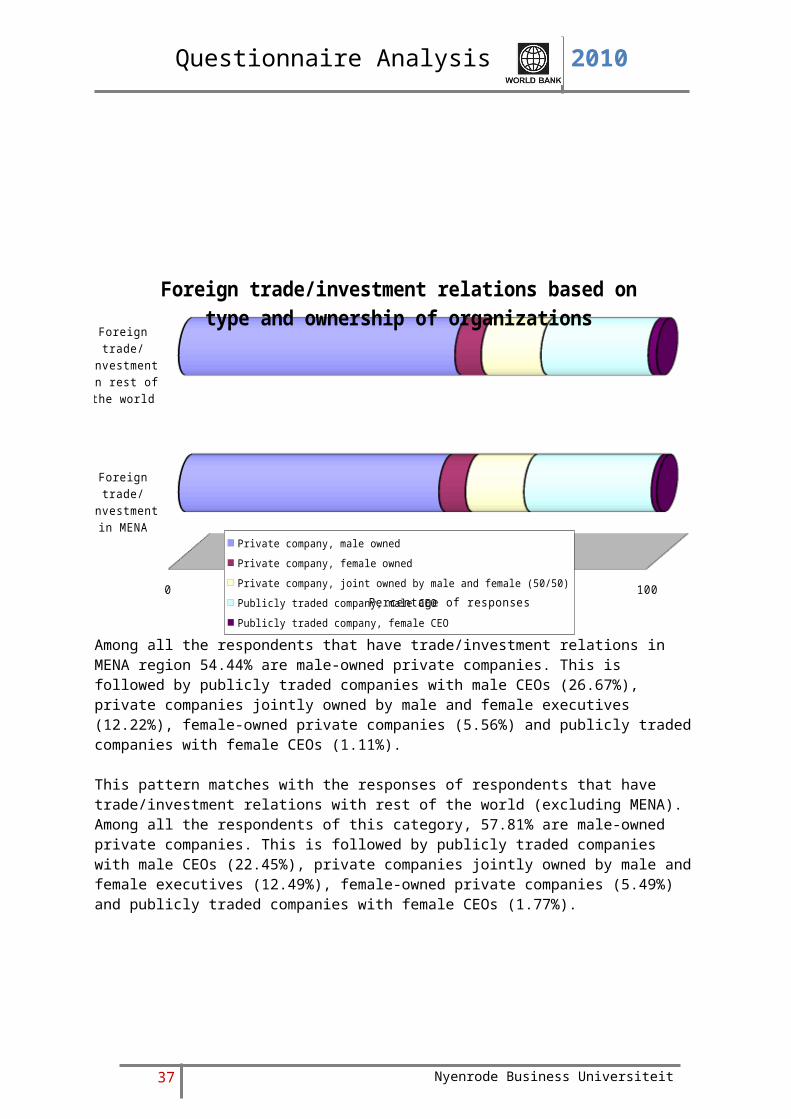
Among all the respondents that have trade/investment relations in MENA region 54.44% are male-owned private companies. This is followed by publicly traded companies with male CEOs (26.67%), private companies jointly owned by male and female executives (12.22%), female-owned private companies (5.56%) and publicly traded companies with female CEOs (1.11%).
This pattern matches with the responses of respondents that have trade/investment relations with rest of the world (excluding MENA). Among all the respondents of this category, 57.81% are male-owned private companies. This is followed by publicly traded companies with male CEOs (22.45%), private companies jointly owned by male and female executives (12.49%), female-owned private companies (5.49%) and publicly traded companies with female CEOs (1.77%).
35 Nyenrode Business Universiteit

Questionnaire Analysis 2010
Almost half of the respondents have no female members in their management team or board of directors at all.Furthermore, figure above shows that 49.08% of the organizations that participated in the research do not have any female employees in their management team and/or board of directors while 50.92% have female employees in their management team and board of directors. Among those who have female employees in their management team and board of directors, 1–24% of the management team and/or board of directors are female in 29.30% of the organizations; 25–49% in 9.53% of the organizations; 50–74% in 6.40% of the organizations; and 75–100% of the management team and board of directors are female in 5.69% of the organizations.
36 Nyenrode Business Universiteit
Questionnaire Analysis 2010
0 %
1 – 24%
25 – 49%
50 – 74%
75 – 100%
0 5 10 15 20 25 30 35 40 45 50
Foreign trade/investment relations based on share of females in management and board of directors
Foreign trade/investment relations with rest of the world
Foreign trade/investment relations with MENA
Percentage of responses
Shar
e pf
fem
ales
in th
e m
anag
emen
t and
boa
rd o
f di
-re
ctor
s
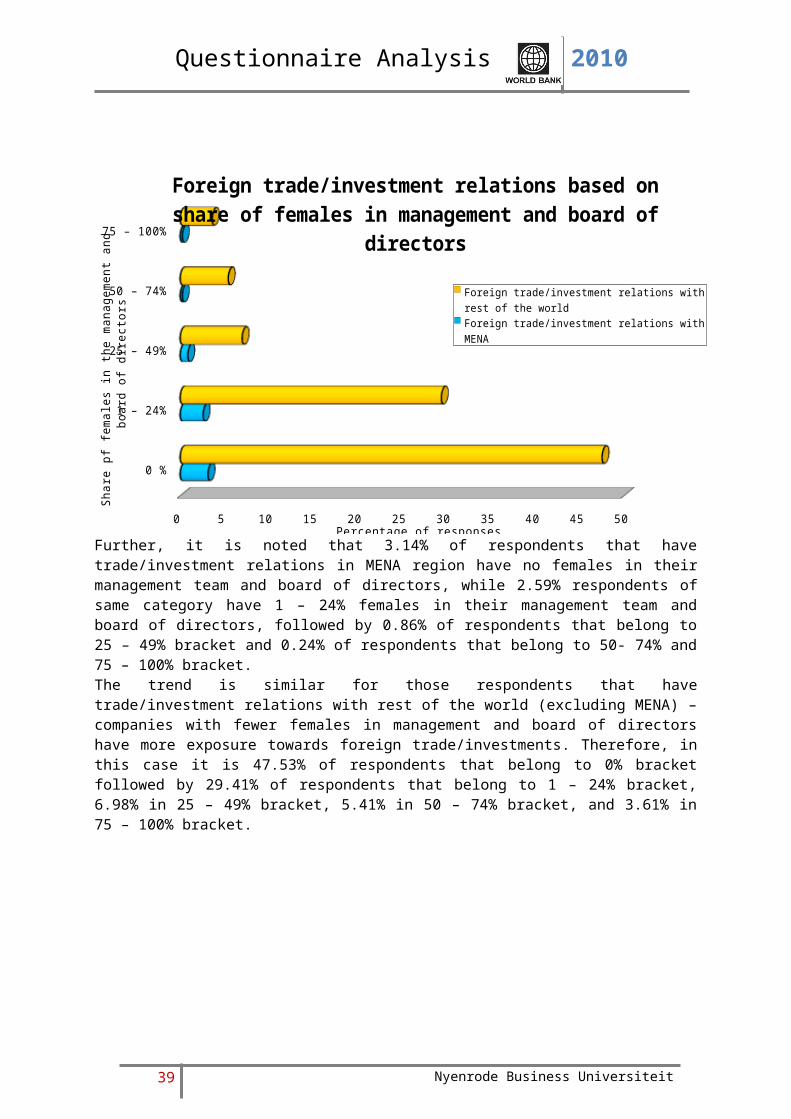
Further, it is noted that 3.14% of respondents that have trade/investment relations in MENA region have no females in their management team and board of directors, while 2.59% respondents of same category have 1 – 24% females in their management team and board of directors, followed by 0.86% of respondents that belong to 25 – 49% bracket and 0.24% of respondents that belong to 50- 74% and 75 – 100% bracket.The trend is similar for those respondents that have trade/investment relations with rest of the world (excluding MENA) – companies with fewer females in management and board of directors have more exposure towards foreign trade/investments. Therefore, in this case it is 47.53% of respondents that belong to 0% bracket followed by 29.41% of respondents that belong to 1 – 24% bracket, 6.98% in 25 – 49% bracket, 5.41% in 50 – 74% bracket, and 3.61% in 75 – 100% bracket.
37 Nyenrode Business Universiteit

Questionnaire Analysis 2010
0 %
1 – 24%
25 – 49%
50 – 74%
75 – 100%
0 20 40 60 80 100 120
Foreign trade/investment relations based on share of females in management and board of directors
Foreign trade/investment relations with MENA Foreign trade/investment relations with rest of the world
Percentage of responsesShar
e of
fem
ales
in th
e m
anag
emen
t and
boa
rd o
f di
-re
ctio
rs
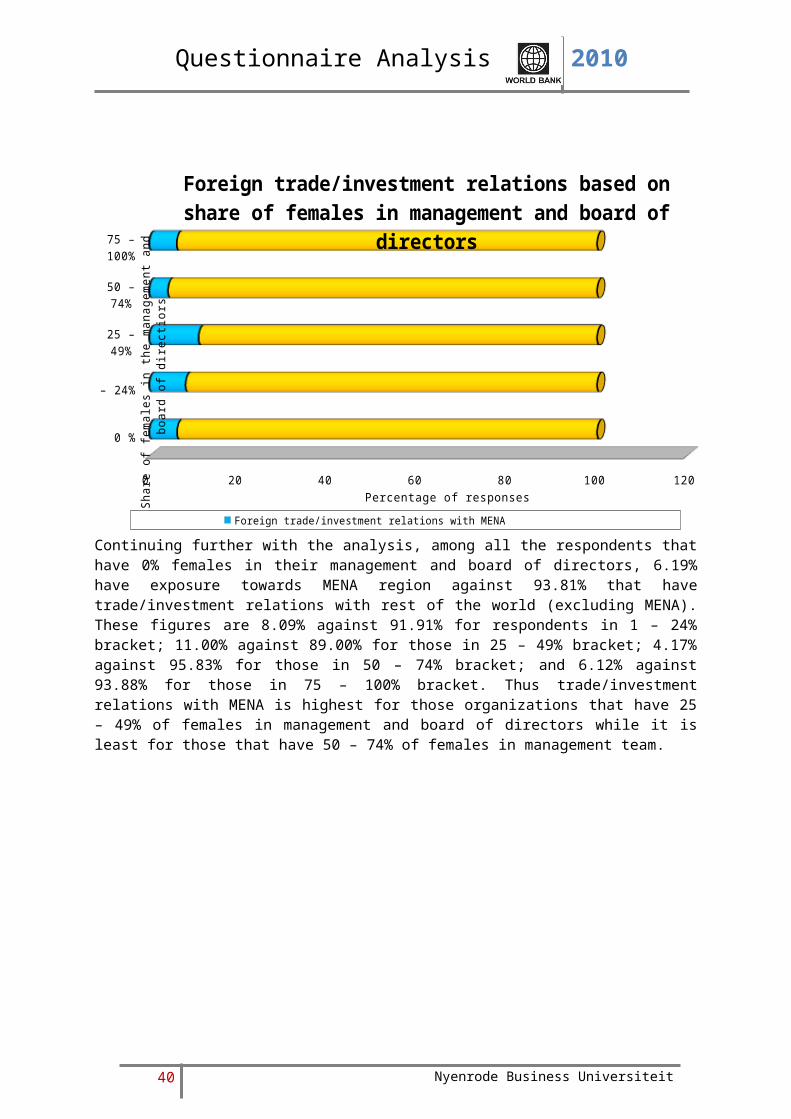
Continuing further with the analysis, among all the respondents that have 0% females in their management and board of directors, 6.19% have exposure towards MENA region against 93.81% that have trade/investment relations with rest of the world (excluding MENA). These figures are 8.09% against 91.91% for respondents in 1 – 24% bracket; 11.00% against 89.00% for those in 25 – 49% bracket; 4.17% against 95.83% for those in 50 – 74% bracket; and 6.12% against 93.88% for those in 75 – 100% bracket. Thus trade/investment relations with MENA is highest for those organizations that have 25 – 49% of females in management and board of directors while it is least for those that have 50 – 74% of females in management team.
38 Nyenrode Business Universiteit
Questionnaire Analysis 2010
Foreign trade/investment rela-tions with MENA
Foreign trade/in-vestment rela-
tions with rest of the world
0 10 20 30 40 50 60 70 80 90 100
Foreign trade/investment relations based on share of females in management and board of directors
0 %1 – 24%25 – 49%50 – 74%75 – 100%
Percentage of responses
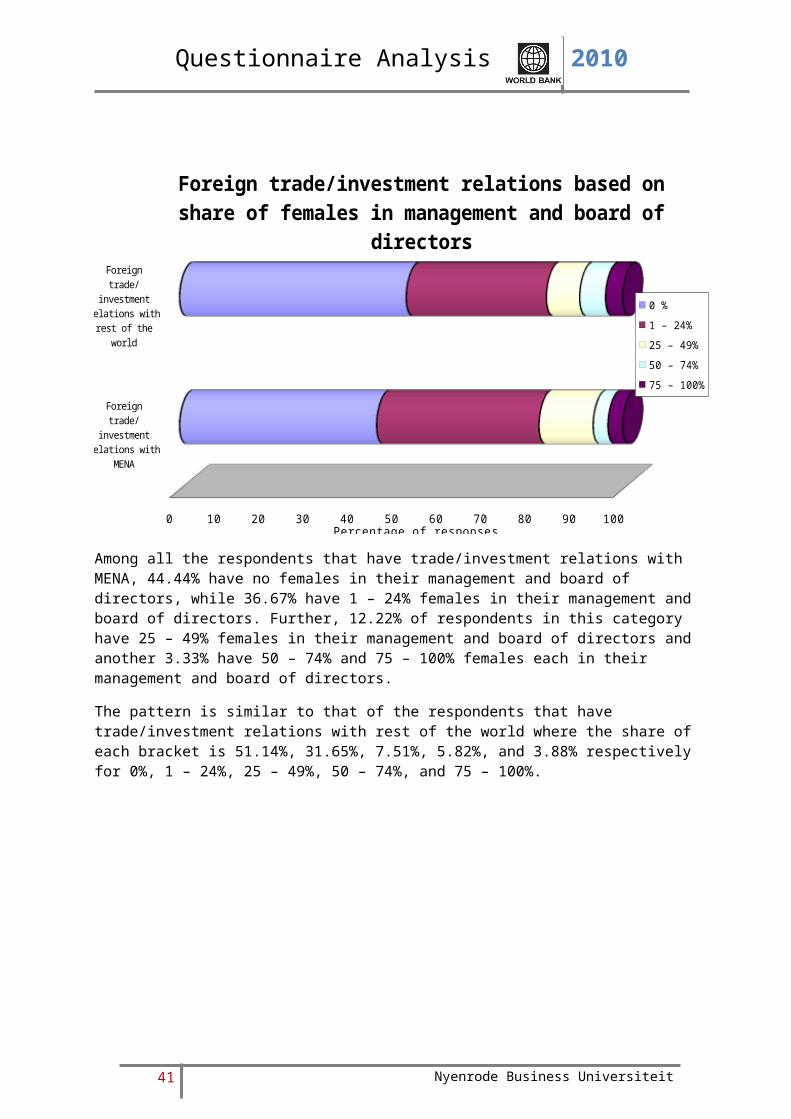
Among all the respondents that have trade/investment relations with MENA, 44.44% have no females in their management and board of directors, while 36.67% have 1 – 24% females in their management and board of directors. Further, 12.22% of respondents in this category have 25 – 49% females in their management and board of directors and another 3.33% have 50 – 74% and 75 – 100% females each in their management and board of directors.
The pattern is similar to that of the respondents that have trade/investment relations with rest of the world where the share of each bracket is 51.14%, 31.65%, 7.51%, 5.82%, and 3.88% respectively for 0%, 1 – 24%, 25 – 49%, 50 – 74%, and 75 – 100%.
39 Nyenrode Business Universiteit
Questionnaire Analysis 2010
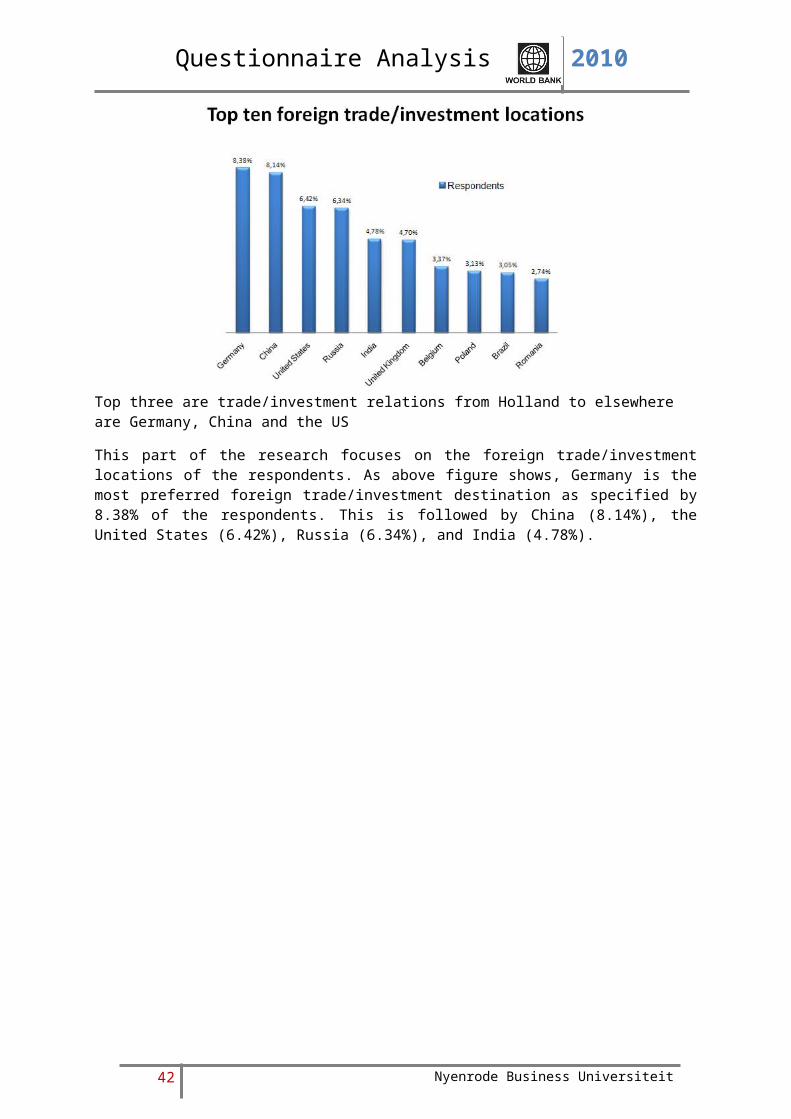
Top three are trade/investment relations from Holland to elsewhere are Germany, China and the US
This part of the research focuses on the foreign trade/investment locations of the respondents. As above figure shows, Germany is the most preferred foreign trade/investment destination as specified by 8.38% of the respondents. This is followed by China (8.14%), the United States (6.42%), Russia (6.34%), and India (4.78%).
40 Nyenrode Business Universiteit
Questionnaire Analysis 2010
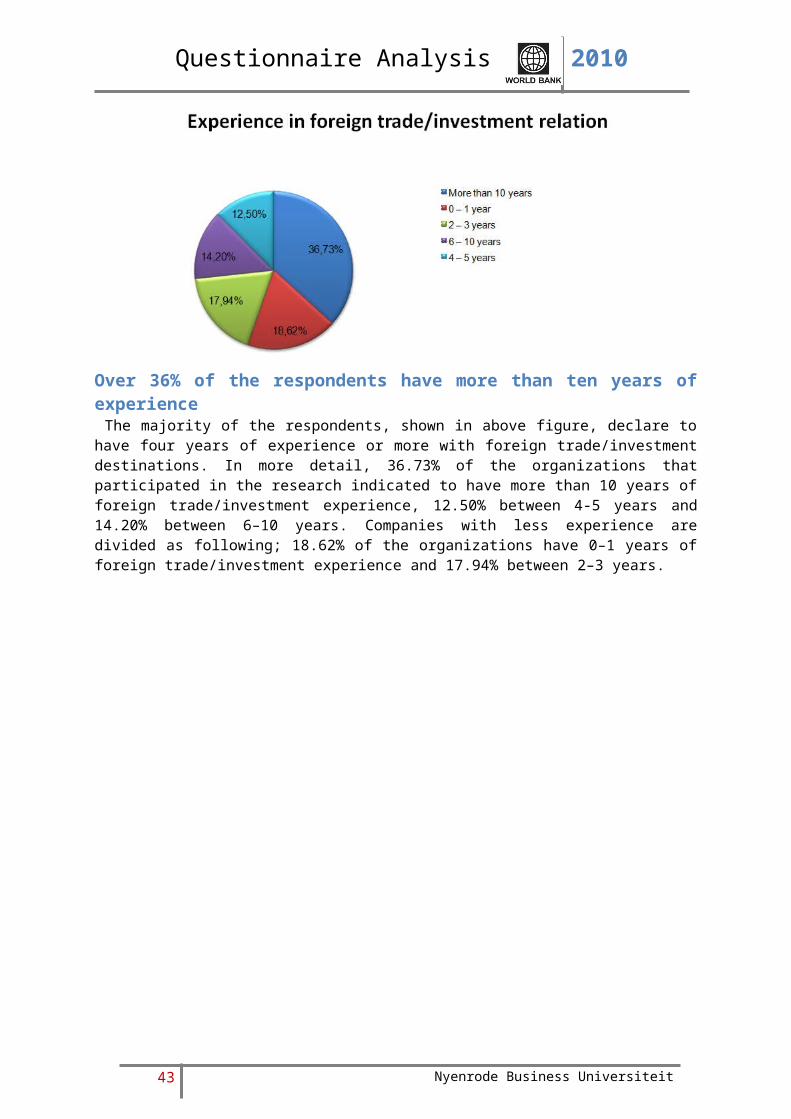
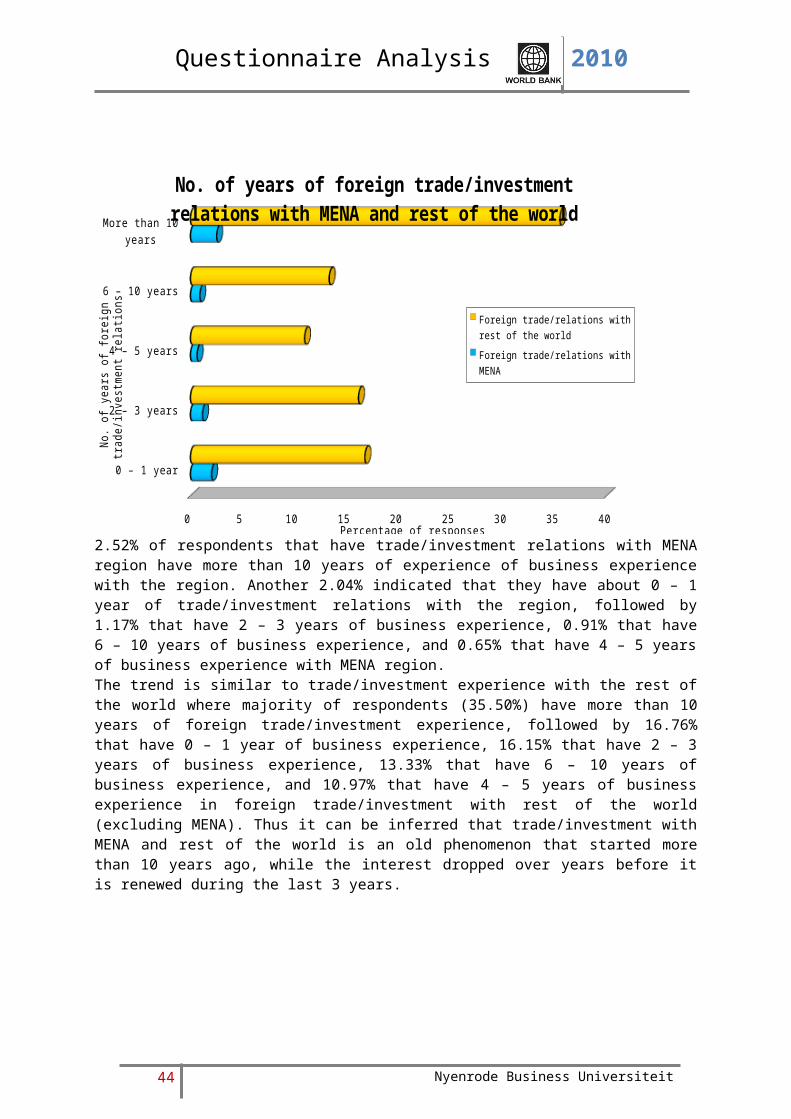
Over 36% of the respondents have more than ten years of experience The majority of the respondents, shown in above figure, declare to have four years of experience or more with foreign trade/investment destinations. In more detail, 36.73% of the organizations that participated in the research indicated to have more than 10 years of foreign trade/investment experience, 12.50% between 4-5 years and 14.20% between 6–10 years. Companies with less experience are divided as following; 18.62% of the organizations have 0–1 years of foreign trade/investment experience and 17.94% between 2–3 years.
41 Nyenrode Business Universiteit
Questionnaire Analysis 2010
0 – 1 year
2 – 3 years
4 – 5 years
6 – 10 years
More than 10 years
0 5 10 15 20 25 30 35 40
No. of years of foreign trade/investment relations with MENA and rest of the world
Foreign trade/relations with rest of the worldForeign trade/relations with MENA
Percentage of responses
No. o
f yea
rs o
f for
eign
trade
/inve
stm
ent r
elatio
ns
2.52% of respondents that have trade/investment relations with MENA region have more than 10 years of experience of business experience with the region. Another 2.04% indicated that they have about 0 – 1 year of trade/investment relations with the region, followed by 1.17% that have 2 – 3 years of business experience, 0.91% that have 6 – 10 years of business experience, and 0.65% that have 4 – 5 years of business experience with MENA region.The trend is similar to trade/investment experience with the rest of the world where majority of respondents (35.50%) have more than 10 years of foreign trade/investment experience, followed by 16.76% that have 0 – 1 year of business experience, 16.15% that have 2 – 3 years of business experience, 13.33% that have 6 – 10 years of business experience, and 10.97% that have 4 – 5 years of business experience in foreign trade/investment with rest of the world (excluding MENA). Thus it can be inferred that trade/investment with MENA and rest of the world is an old phenomenon that started more than 10 years ago, while the interest dropped over years before it is renewed during the last 3 years.
42 Nyenrode Business Universiteit
Questionnaire Analysis 2010
0 – 1 year
2 – 3 years
4 – 5 years
6 – 10 years
More than 10 years
0 20 40 60 80 100
No. of years of foreign trade/investment relations with MENA and rest of the world
Foreign trade/relations with MENA Foreign trade/relations with rest of the world
Percentage of responsesNo.
of y
ears
of e
xper
ienc
e in
fore
ign
trade
/inve
stm
ent
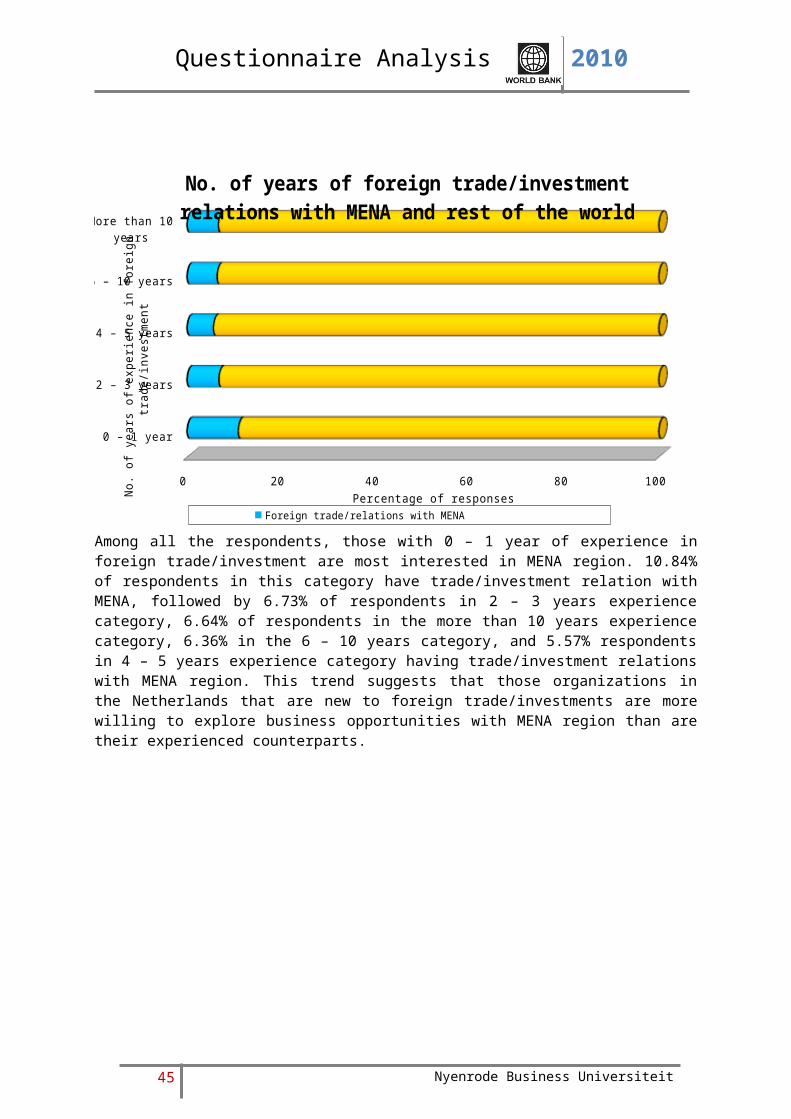
Among all the respondents, those with 0 – 1 year of experience in foreign trade/investment are most interested in MENA region. 10.84% of respondents in this category have trade/investment relation with MENA, followed by 6.73% of respondents in 2 – 3 years experience category, 6.64% of respondents in the more than 10 years experience category, 6.36% in the 6 – 10 years category, and 5.57% respondents in 4 – 5 years experience category having trade/investment relations with MENA region. This trend suggests that those organizations in the Netherlands that are new to foreign trade/investments are more willing to explore business opportunities with MENA region than are their experienced counterparts.
43 Nyenrode Business Universiteit
Questionnaire Analysis 2010
Foreign trade/rela-tions with
MENA
Foreign trade/rela-
tions with rest of the world
0 10 20 30 40 50 60 70 80 90 100
No. of years of foreign trade/investment relations with MENA and rest of the world
0 – 1 year2 – 3 years4 – 5 years6 – 10 yearsMore than 10 years
Percentage of responsesAmong all the respondents that have trade/investment relations with MENA, majority have more than 10 years of experience in the region similar to the trend of the rest of the world. Thus, 34.67% of respondents that have trade/investment relations with MENA have more than 10 years of experience in the region against 38.29% of the respondents that have trade/investment relations with rest of the world (excluding MENA) have more than 10 years of foreign trade/investment relations. These figures are 28.00% for MENA against 18.08% for rest of the world in the 0 – 1 year experience category, 16.00% for MENA against 17.42% for rest of the world in the 2 – 3 years experience category, 12.44% for MENA against 14.38% for rest of the world in the 6- 10 years experience category, and 8.89% for MENA against 11.83 for rest of the world in the category 4 – 5 years experience in foreign trade/investments.
44 Nyenrode Business Universiteit
Questionnaire Analysis 2010
The majority of the respondents export products and or services Since a considerable number of organizations indicated to have sufficient experience in foreign trade/investments, we further probed the type of experience that these organizations possess/are planning to explore with regards to foreign trade/investment. The responses were categorized into 3 categories – our company exports products and/or services to the country, our company made an investment in the country and our company imports products and/or services from the country. The figure above clearly shows that the majority of organizations (46.10%) have exported/or are planning to export their products/services to a foreign location; 34.02% of the organizations indicated that they have invested/or are planning to invest in a foreign location; lastly 19.88% of the respondents indicated that they import/or are planning to import products/services from foreign locations.
45 Nyenrode Business Universiteit

Questionnaire Analysis 2010
Our company made an investment in the country
Our company imports products and / or services
from the country
Our company exports products / and or services
to the country
0 5 10 15 20 25 30 35 40 45 50
Type of foreign trade/investment relations with MENA and rest of the world
Rest of the worldMENA
Percentage of responses
Type
of f
oreig
n tra
de/in
vest
men
t rela
tions
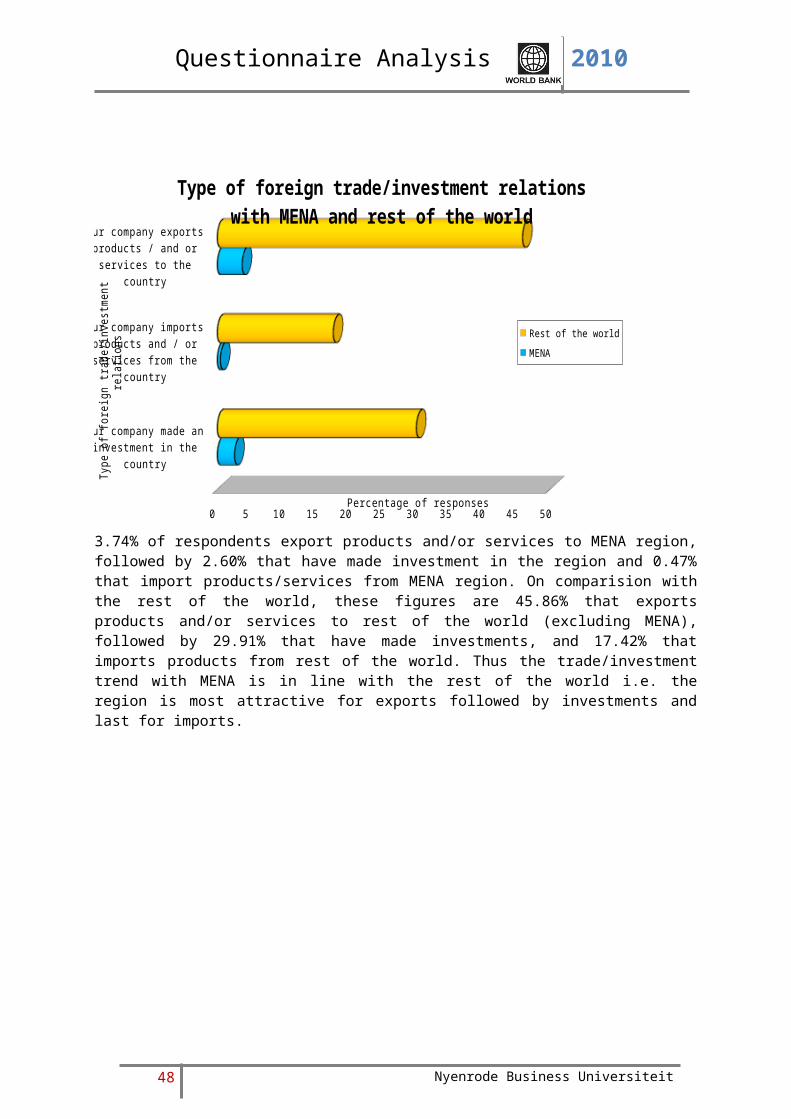
3.74% of respondents export products and/or services to MENA region, followed by 2.60% that have made investment in the region and 0.47% that import products/services from MENA region. On comparision with the rest of the world, these figures are 45.86% that exports products and/or services to rest of the world (excluding MENA), followed by 29.91% that have made investments, and 17.42% that imports products from rest of the world. Thus the trade/investment trend with MENA is in line with the rest of the world i.e. the region is most attractive for exports followed by investments and last for imports.
46 Nyenrode Business Universiteit

Questionnaire Analysis 2010
Our company made an investment in the country
Our company imports products and / or services
from the country
Our company exports products / and or services
to the country
0 10 20 30 40 50 60 70 80 90 100
Type of foreign trade/investment relations with MENA and rest of the world
MENA Rest of the world
Percentage of responses
Type
of f
oreig
n tra
de/in
vest
men
t rela
tions
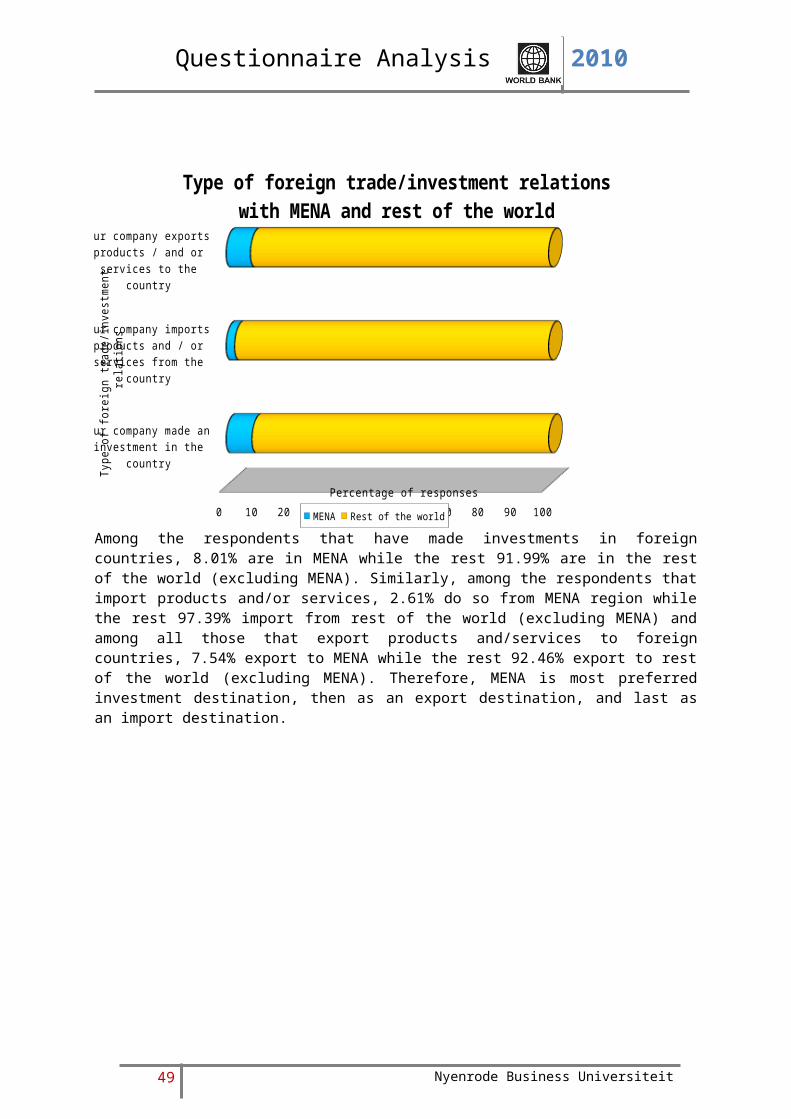
Among the respondents that have made investments in foreign countries, 8.01% are in MENA while the rest 91.99% are in the rest of the world (excluding MENA). Similarly, among the respondents that import products and/or services, 2.61% do so from MENA region while the rest 97.39% import from rest of the world (excluding MENA) and among all those that export products and/services to foreign countries, 7.54% export to MENA while the rest 92.46% export to rest of the world (excluding MENA). Therefore, MENA is most preferred investment destination, then as an export destination, and last as an import destination.
47 Nyenrode Business Universiteit
Questionnaire Analysis 2010
Foreign trade/invest-
ment relations with MENA
Foreign trade/invest-
ment relations with rest of the world
0 10 20 30 40 50 60 70 80 90 100
Type of foreign trade/investment relations with MENA and rest of the world
Our company made an investmentOur company imports products and / or servicesOur company exports products / and or services
Percentage of responses
Among all the respondents that have trade/investment relations with MENA region, 54.90% are engaged in exporting to the region followed by 38.24% of those that have invested in the region, and 6.86% of those that import from the region. This trend is similar to that of the rest of the world where 49.21% of respondents are engaged in exporting their products and/or services, followed by 32.09% that have made foreign investments, and 18.70% that import products and/or services in to the Netherlands.
48 Nyenrode Business Universiteit
Questionnaire Analysis 2010
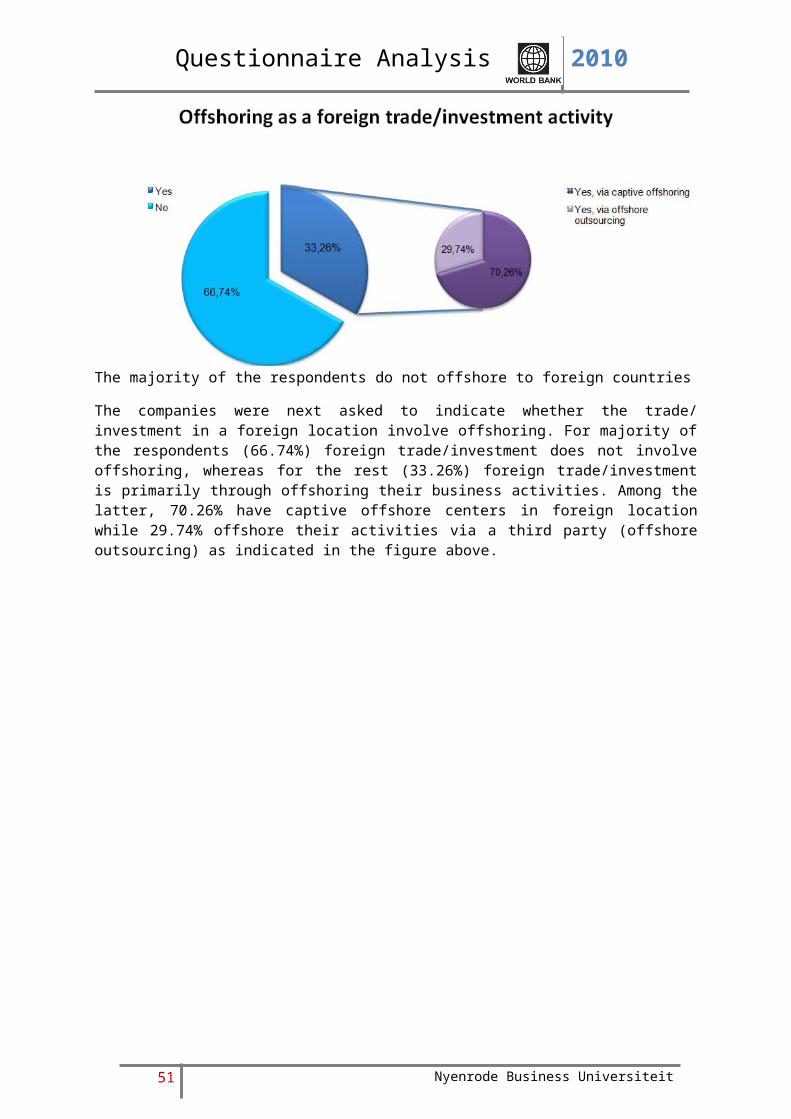
The majority of the respondents do not offshore to foreign countries
The companies were next asked to indicate whether the trade/ investment in a foreign location involve offshoring. For majority of the respondents (66.74%) foreign trade/investment does not involve offshoring, whereas for the rest (33.26%) foreign trade/investment is primarily through offshoring their business activities. Among the latter, 70.26% have captive offshore centers in foreign location while 29.74% offshore their activities via a third party (offshore outsourcing) as indicated in the figure above.
49 Nyenrode Business Universiteit

Questionnaire Analysis 2010
Yes, via captive offshoring
Yes, via offshore outsourcing
No
0 10 20 30 40 50 60 70
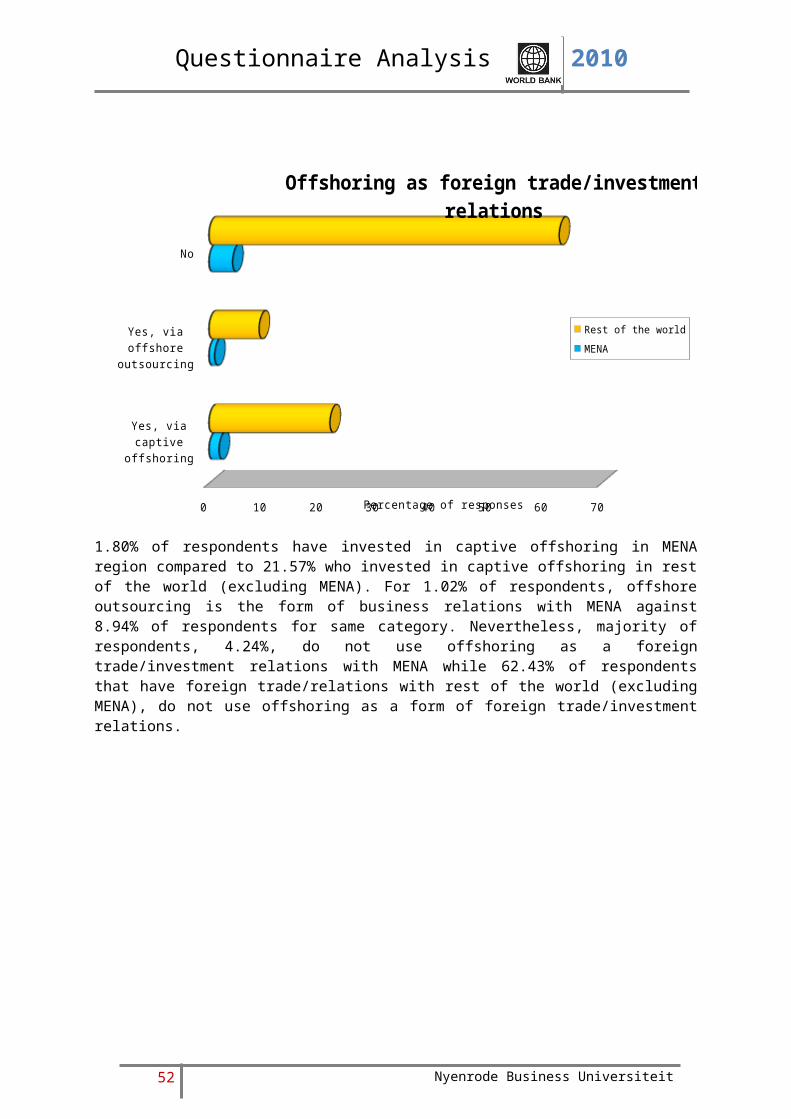
Offshoring as foreign trade/investment relations
Rest of the worldMENA
Percentage of responses
1.80% of respondents have invested in captive offshoring in MENA region compared to 21.57% who invested in captive offshoring in rest of the world (excluding MENA). For 1.02% of respondents, offshore outsourcing is the form of business relations with MENA against 8.94% of respondents for same category. Nevertheless, majority of respondents, 4.24%, do not use offshoring as a foreign trade/investment relations with MENA while 62.43% of respondents that have foreign trade/relations with rest of the world (excluding MENA), do not use offshoring as a form of foreign trade/investment relations.
50 Nyenrode Business Universiteit
Questionnaire Analysis 2010
Yes, via captive offshoring
Yes, via offshore outsourcing
No
0 10 20 30 40 50 60 70 80 90 100
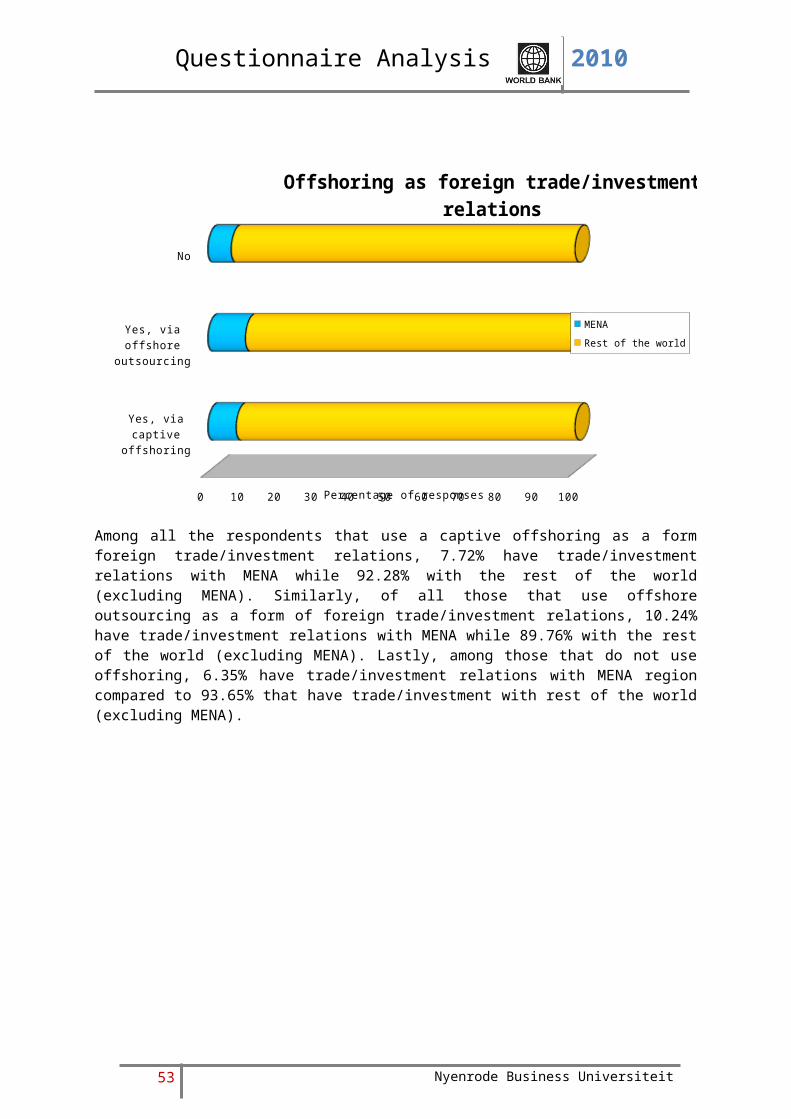
Offshoring as foreign trade/investment relations
MENARest of the world
Percentage of responses
Among all the respondents that use a captive offshoring as a form foreign trade/investment relations, 7.72% have trade/investment relations with MENA while 92.28% with the rest of the world (excluding MENA). Similarly, of all those that use offshore outsourcing as a form of foreign trade/investment relations, 10.24% have trade/investment relations with MENA while 89.76% with the rest of the world (excluding MENA). Lastly, among those that do not use offshoring, 6.35% have trade/investment relations with MENA region compared to 93.65% that have trade/investment with rest of the world (excluding MENA).
51 Nyenrode Business Universiteit
Questionnaire Analysis 2010
MENA
Rest of the world
0 10 20 30 40 50 60 70 80 90 100
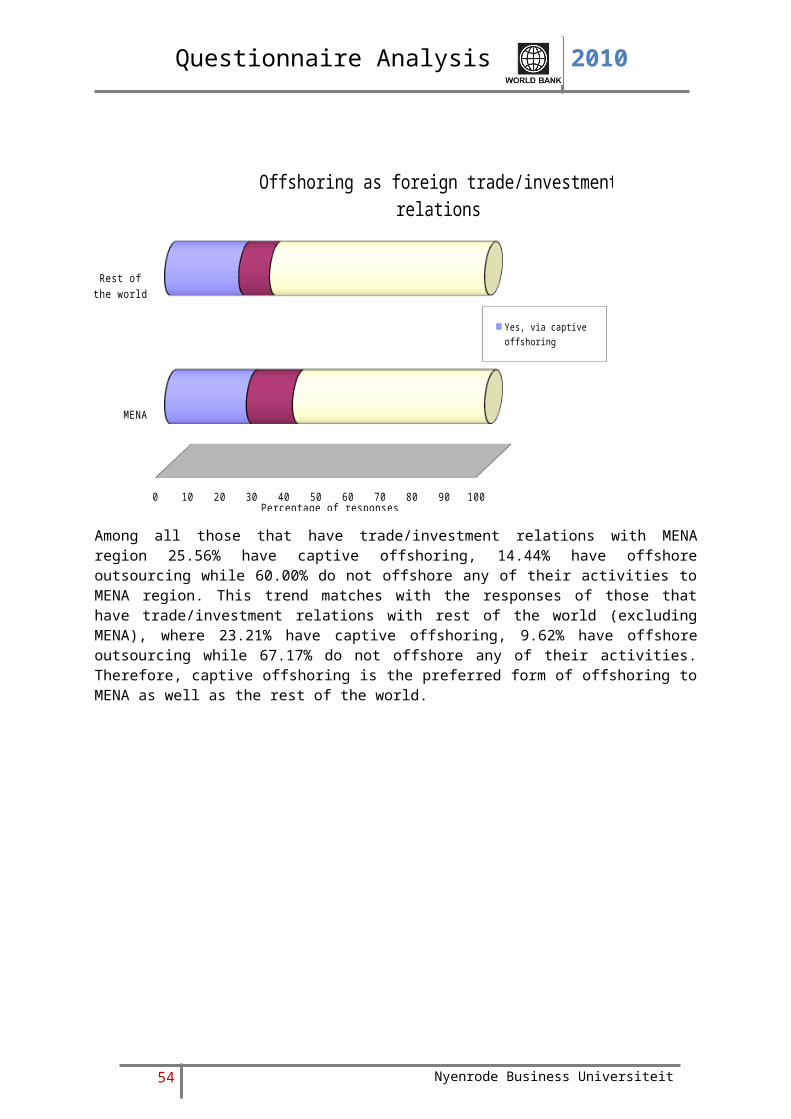
Offshoring as foreign trade/investment relations
Yes, via captive offshoringYes, via offshore outsourc-ingNo
Percentage of responses
Among all those that have trade/investment relations with MENA region 25.56% have captive offshoring, 14.44% have offshore outsourcing while 60.00% do not offshore any of their activities to MENA region. This trend matches with the responses of those that have trade/investment relations with rest of the world (excluding MENA), where 23.21% have captive offshoring, 9.62% have offshore outsourcing while 67.17% do not offshore any of their activities. Therefore, captive offshoring is the preferred form of offshoring to MENA as well as the rest of the world.
52 Nyenrode Business Universiteit
Questionnaire Analysis 2010
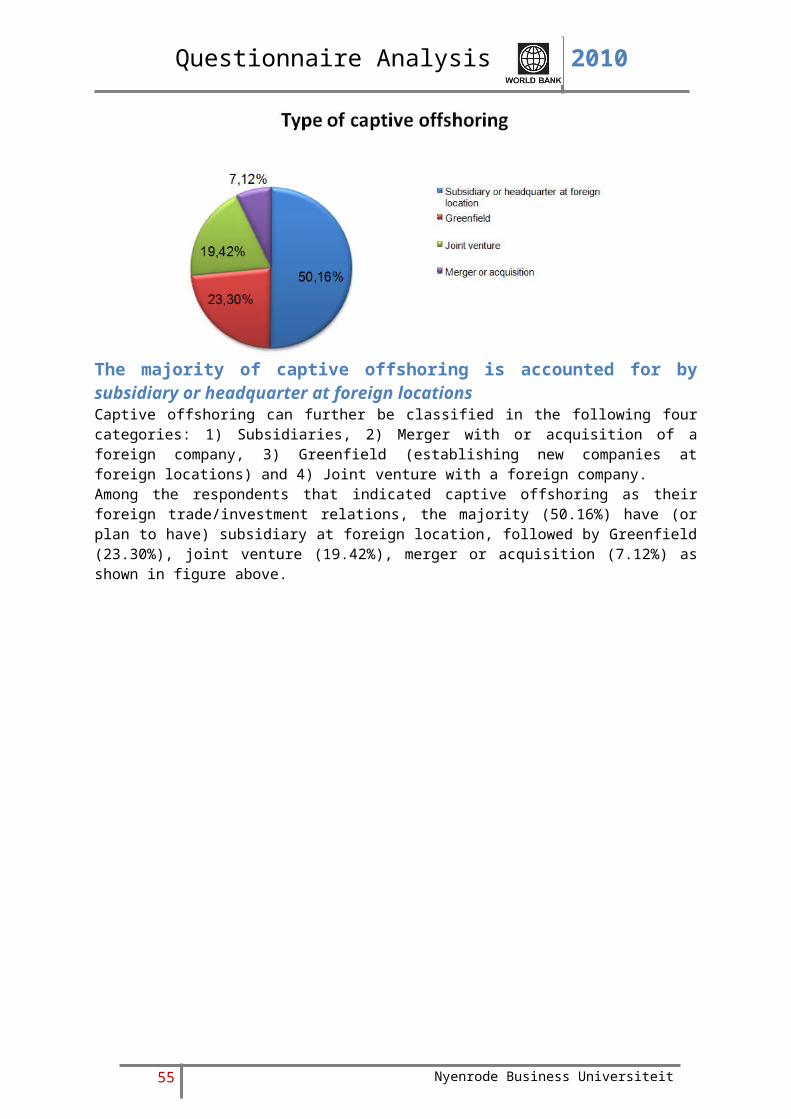
The majority of captive offshoring is accounted for by subsidiary or headquarter at foreign locations Captive offshoring can further be classified in the following four categories: 1) Subsidiaries, 2) Merger with or acquisition of a foreign company, 3) Greenfield (establishing new companies at foreign locations) and 4) Joint venture with a foreign company.Among the respondents that indicated captive offshoring as their foreign trade/investment relations, the majority (50.16%) have (or plan to have) subsidiary at foreign location, followed by Greenfield (23.30%), joint venture (19.42%), merger or acquisition (7.12%) as shown in figure above.
53 Nyenrode Business Universiteit
Questionnaire Analysis 2010
Subsidiary or headquar-ter at foreign location
Merger or acquisition
Greenfield
Joint venture
0 5 10 15 20 25 30 35 40 45 50
Type of captive offshoring as foreign trade/in-vestment relations
Rest of the worldMENA
Percentage of responses
Having a subsidiary or headquarter at foreign location is preferred type of captive offshoring by most respondents (48.48%) that have foreign trade/investment relations (excluding MENA). However, majority those that have trade/investment relations with MENA region (4.55%) prefer to have a joint venture in the region. While Greenfield investment is the next most preferred (22.08%) type of captive offshoring for respondents that have foreign trade/investment (excluding MENA), having a subsidiary or headquarter in MENA region is the next most preferred (1.95%) type captive offshoring for respondents that have trade/investment relations with MENA region. 14.94% of those that have foreign trade/investment (excluding MENA) also have joint venture form of captive offshoring, followed by 7.14% of respondents have merger or acquisition form of captive offshoring. On the other hand, among those that have trade/investment relations with MENA, 0.97% of respondents also have Greenfield investments while none are involved in mergers and acquisitions.
54 Nyenrode Business Universiteit
Questionnaire Analysis 2010
Subsidiary or headquar-ter at foreign location
Merger or acquisition
Greenfield
Joint venture
0 10 20 30 40 50 60 70 80 90 100
Type of captive offshoring as foreign trade/in-vestment relations
MENARest of the world
Percentage of responses
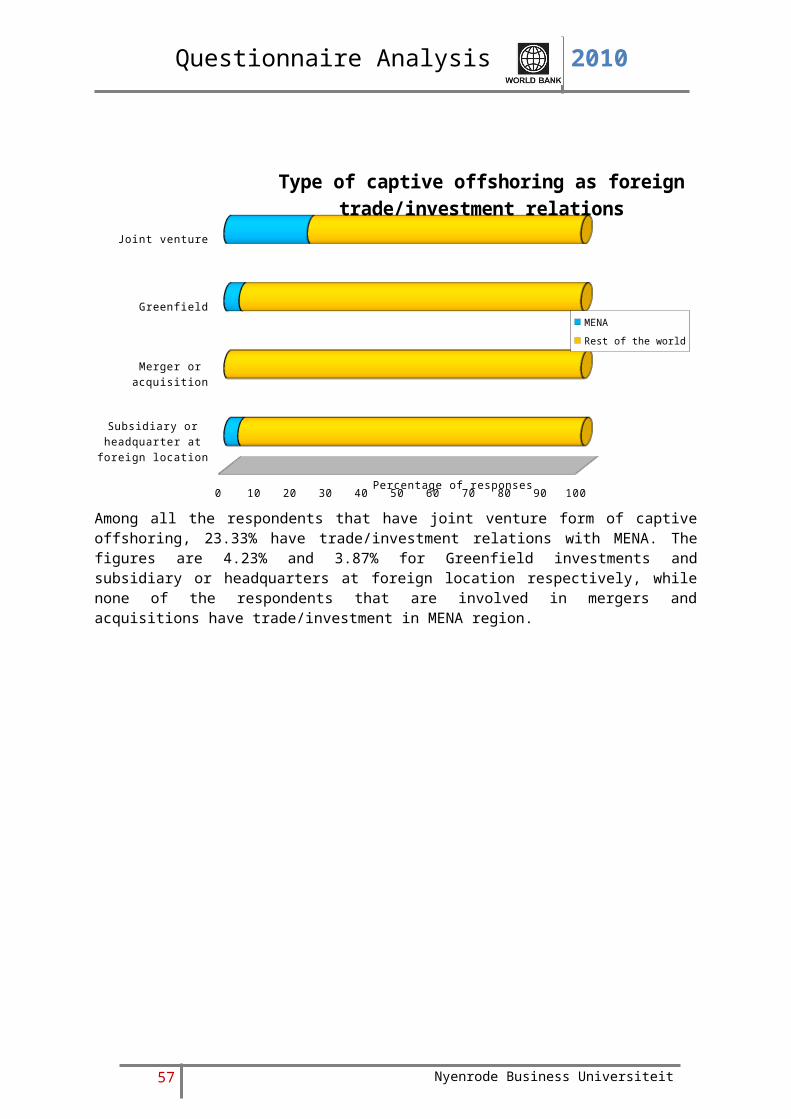
Among all the respondents that have joint venture form of captive offshoring, 23.33% have trade/investment relations with MENA. The figures are 4.23% and 3.87% for Greenfield investments and subsidiary or headquarters at foreign location respectively, while none of the respondents that are involved in mergers and acquisitions have trade/investment in MENA region.
55 Nyenrode Business Universiteit

Questionnaire Analysis 2010
MENA
Rest of the world
0 20 40 60 80 100
Type of captive offshoring as foreign trade/in-vestment relations
Subsidiary or headquarter at foreign location
Merger or acquisition
Greenfield
Joint venture
Percentage of responses
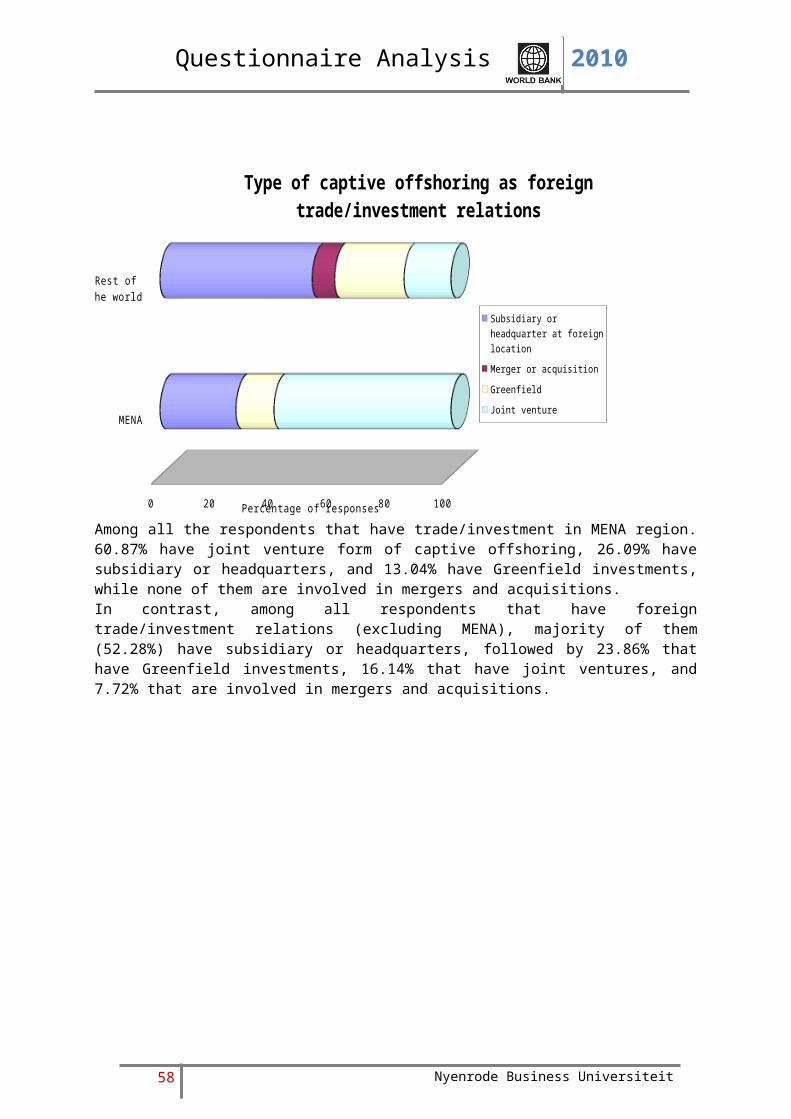
Among all the respondents that have trade/investment in MENA region. 60.87% have joint venture form of captive offshoring, 26.09% have subsidiary or headquarters, and 13.04% have Greenfield investments, while none of them are involved in mergers and acquisitions.In contrast, among all respondents that have foreign trade/investment relations (excluding MENA), majority of them (52.28%) have subsidiary or headquarters, followed by 23.86% that have Greenfield investments, 16.14% that have joint ventures, and 7.72% that are involved in mergers and acquisitions.
56 Nyenrode Business Universiteit
Questionnaire Analysis 2010
Top three locations are the Netherlands, USA and India From the companies that indicated to offshore activities to foreign countries via a third party (9.89%, as described in figure above), 12.03% of the respondents have their third party headquartered in the Netherlands, followed by the USA (8.27%), India (6.77%), Russia (6.02%) and Germany and China both 5.26%.
57 Nyenrode Business Universiteit
Questionnaire Analysis 2010
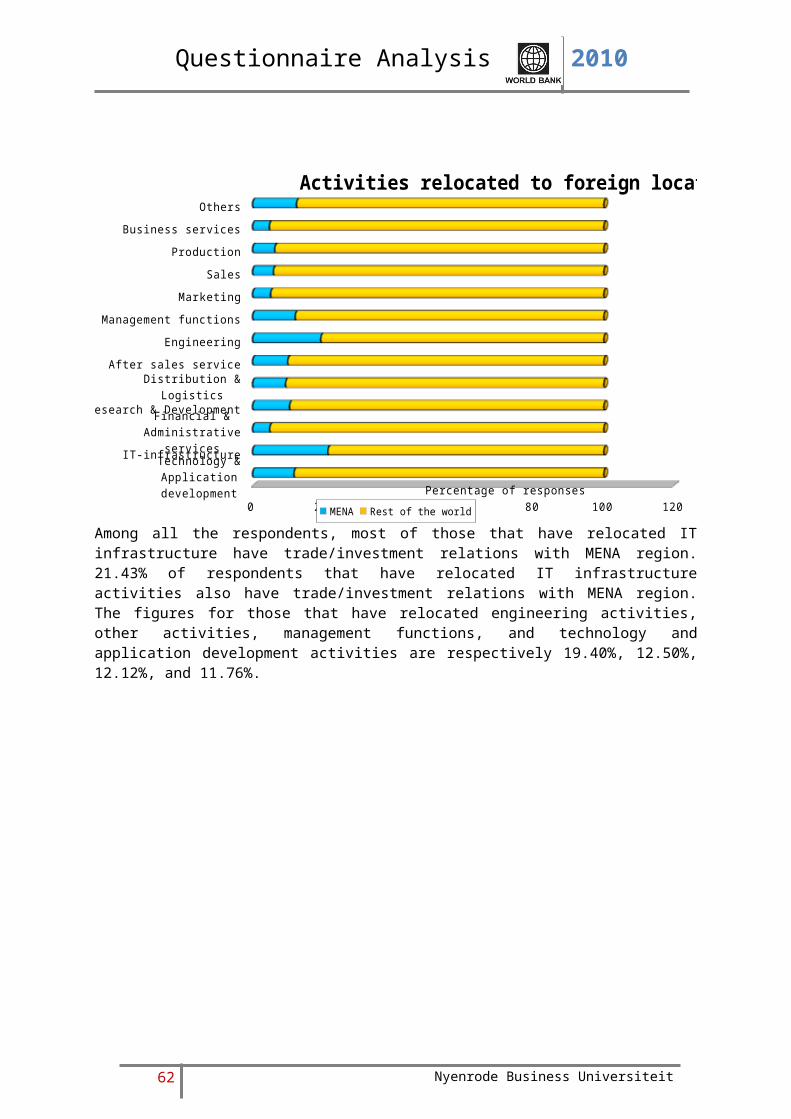
Top three activities that are being relocated to foreign locations are Sales, Production and Marketing As shown in figure above, the majority of relocated activities are related to sales (18.47%). 15.63% of the respondents indicated that they relocated production activities, followed by 12.79% of the respondents referring to marketing activities as being relocated. Above figure provides an overview of type of activities that are relocated from the Netherlands to foreign locations.
58 Nyenrode Business Universiteit

Questionnaire Analysis 2010
Technology & Applicationdevelopment
IT-infrastructure
Financial & Administrative services
Research & Development
Distribution & Logistics
After sales service
Engineering
Management functions
Marketing
Sales
Production
Business services
Others
0 2 4 6 8 10 12 14 16 18
Activities relocated to foreign locations
Rest of the worldMENA
Percentage of responses
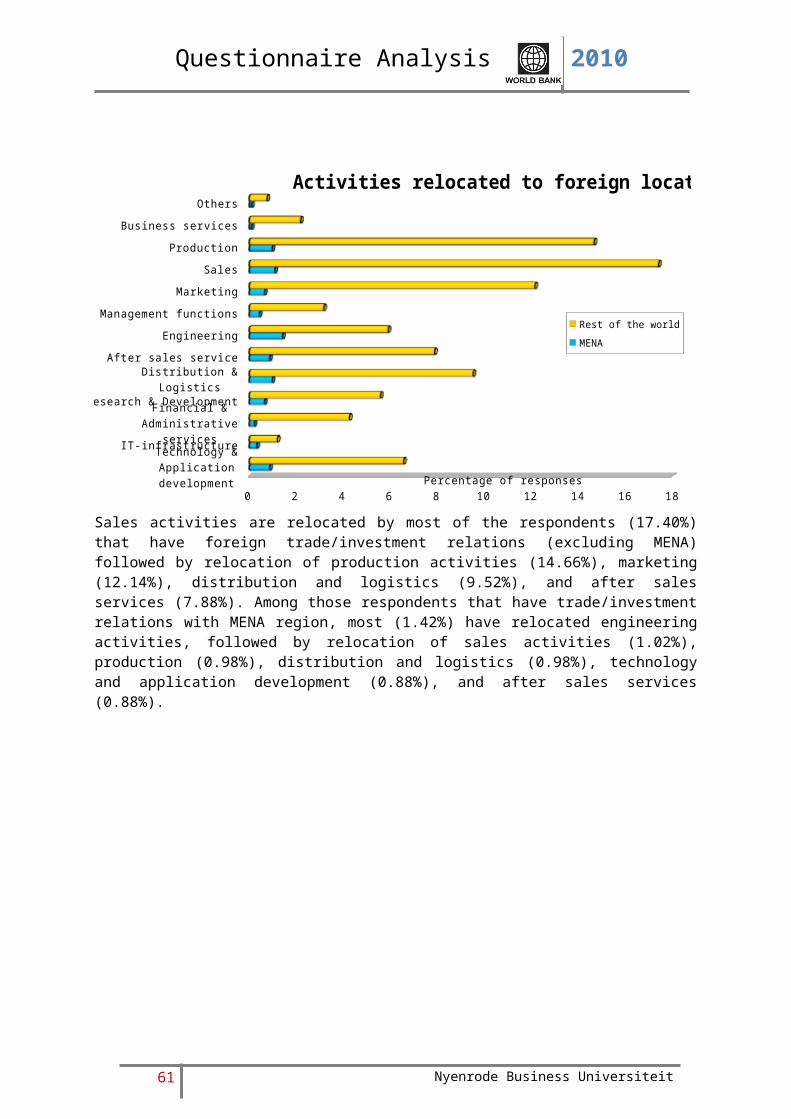
Sales activities are relocated by most of the respondents (17.40%) that have foreign trade/investment relations (excluding MENA) followed by relocation of production activities (14.66%), marketing (12.14%), distribution and logistics (9.52%), and after sales services (7.88%). Among those respondents that have trade/investment relations with MENA region, most (1.42%) have relocated engineering activities, followed by relocation of sales activities (1.02%), production (0.98%), distribution and logistics (0.98%), technology and application development (0.88%), and after sales services (0.88%).
59 Nyenrode Business Universiteit

Questionnaire Analysis 2010
Technology & Applicationdevelopment
IT-infrastructure
Financial & Administrative services
Research & Development
Distribution & Logistics
After sales service
Engineering
Management functions
Marketing
Sales
Production
Business services
Others
0 20 40 60 80 100 120
Activities relocated to foreign locations
MENA Rest of the world
Percentage of responses
Among all the respondents, most of those that have relocated IT infrastructure have trade/investment relations with MENA region. 21.43% of respondents that have relocated IT infrastructure activities also have trade/investment relations with MENA region. The figures for those that have relocated engineering activities, other activities, management functions, and technology and application development activities are respectively 19.40%, 12.50%, 12.12%, and 11.76%.
60 Nyenrode Business Universiteit
Questionnaire Analysis 2010
Technology & Applicationdevelopment
After sales service
Distribution & Logistics
Production
Sales
Engineering
0 2 4 6 8 10 12 14 16 18
Top 5 activities relocated by respondents having trade/investment relations with MENA
Percentage of response
Activi
ties
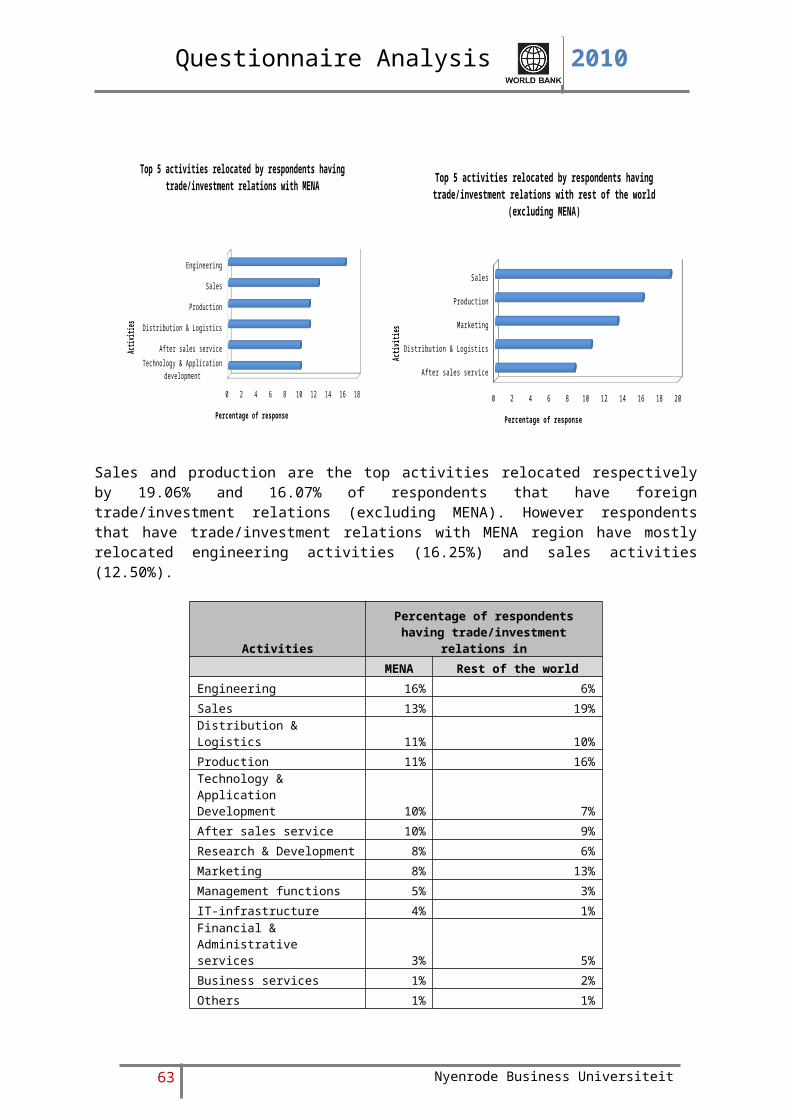
Sales and production are the top activities relocated respectively by 19.06% and 16.07% of respondents that have foreign trade/investment relations (excluding MENA). However respondents that have trade/investment relations with MENA region have mostly relocated engineering activities (16.25%) and sales activities (12.50%).
ActivitiesPercentage of respondents
having trade/investment relations inMENA Rest of the world
Engineering 16% 6%
Sales 13% 19%
Distribution & Logistics 11% 10%
Production 11% 16%Technology & Application Development 10% 7%
After sales service 10% 9%
Research & Development 8% 6%
Marketing 8% 13%
Management functions 5% 3%
IT-infrastructure 4% 1%Financial & Administrativeservices 3% 5%
Business services 1% 2%
Others 1% 1%
Total 100% 100%
61 Nyenrode Business Universiteit
After sales service
Distribution & Logistics
Marketing
Production
Sales
0 2 4 6 8 10 12 14 16 18 20
Top 5 activities relocated by respondents having trade/investment relations with rest of the world (excluding MENA)
Percentage of responseAc
tivitie
s
Questionnaire Analysis 2010
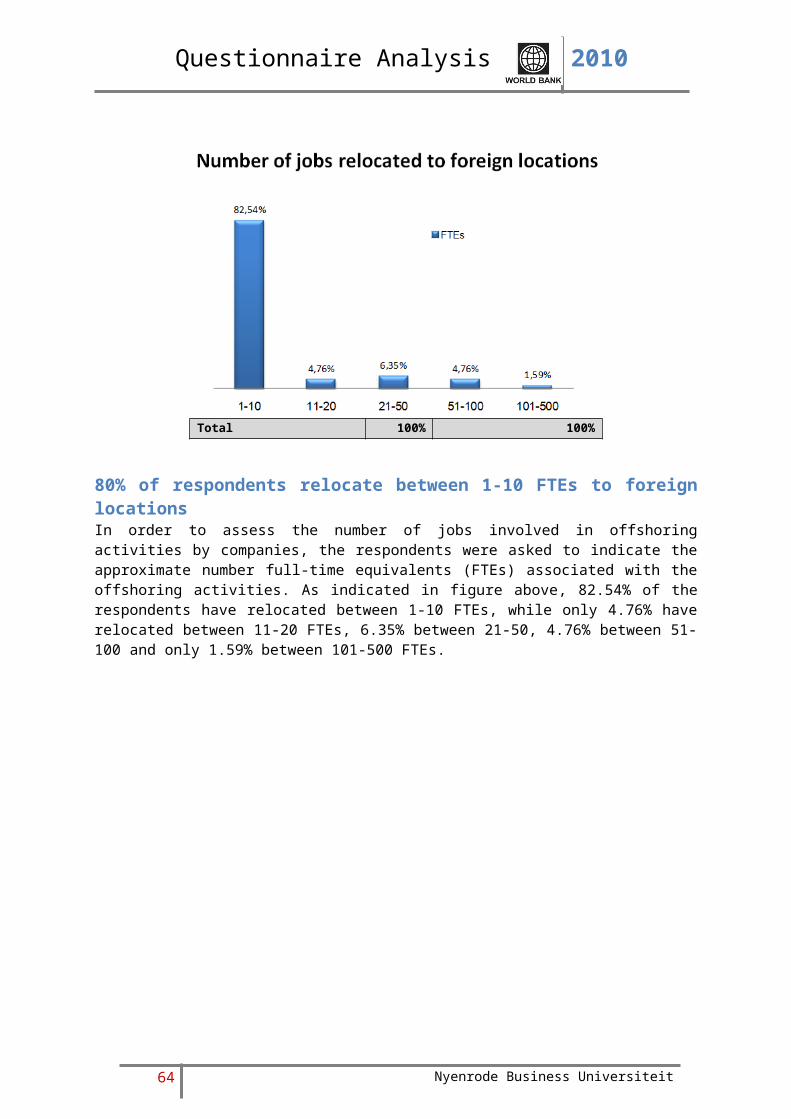
80% of respondents relocate between 1-10 FTEs to foreign locationsIn order to assess the number of jobs involved in offshoring activities by companies, the respondents were asked to indicate the approximate number full-time equivalents (FTEs) associated with the offshoring activities. As indicated in figure above, 82.54% of the respondents have relocated between 1-10 FTEs, while only 4.76% have relocated between 11-20 FTEs, 6.35% between 21-50, 4.76% between 51-100 and only 1.59% between 101-500 FTEs.
62 Nyenrode Business Universiteit
Questionnaire Analysis 2010
1-10
11-20
21-50
51-100
101-500
501 o...
0 10 20 30 40 50 60 70 80
Number of FTEs relocated from The Netherlands to foreign locations
Trade/investment relations with rest of the worldTrade/investment relations with MENA
Percentage of responses
Num
ber
of F
TE
s re
loca
ted
from
the
Net
herla
nds
Most of the respondents that have trade/investment relations with MENA region (7.09%) have relocated 1 – 10 FTEs from the Netherlands followed by 0.65% that have relocated 11 – 20 FTEs, 0.55% that have relocated 21 – 50 FTEs and 51 – 100 FTEs each, and 0.11% that have relocated 101 – 500 FTEs. However, none of the respondents that have trade/investment relations with MENA region have relocated more than 500 FTEs.This pattern is similar to that of respondents that have foreign trade/investment (excluding MENA), where majority of respondents (74.92%) have relocated 1 – 10 FTEs, followed by 7.74% that have relocated 11 – 20 FTEs, 4.14% that have relocated 21 – 50 FTEs, 2.51% that have relocated 51 – 100 FTEs, 1.20% that have relocated 101 – 500 FTEs and 0.55% that have relocated more than 500 FTEs.
63 Nyenrode Business Universiteit
Questionnaire Analysis 2010
1-10
11-20
21-50
51-100
101-500
501 or more
0 20 40 60 80 100
Number of FTEs relocated from The Netherlands to foreign locations
Trade/investment relations with MENA Trade/investment relations with rest of the worldPercentage of responses
Numb
er o
f FTE
s re
locat
ed fr
om th
e Ne
ther
lands
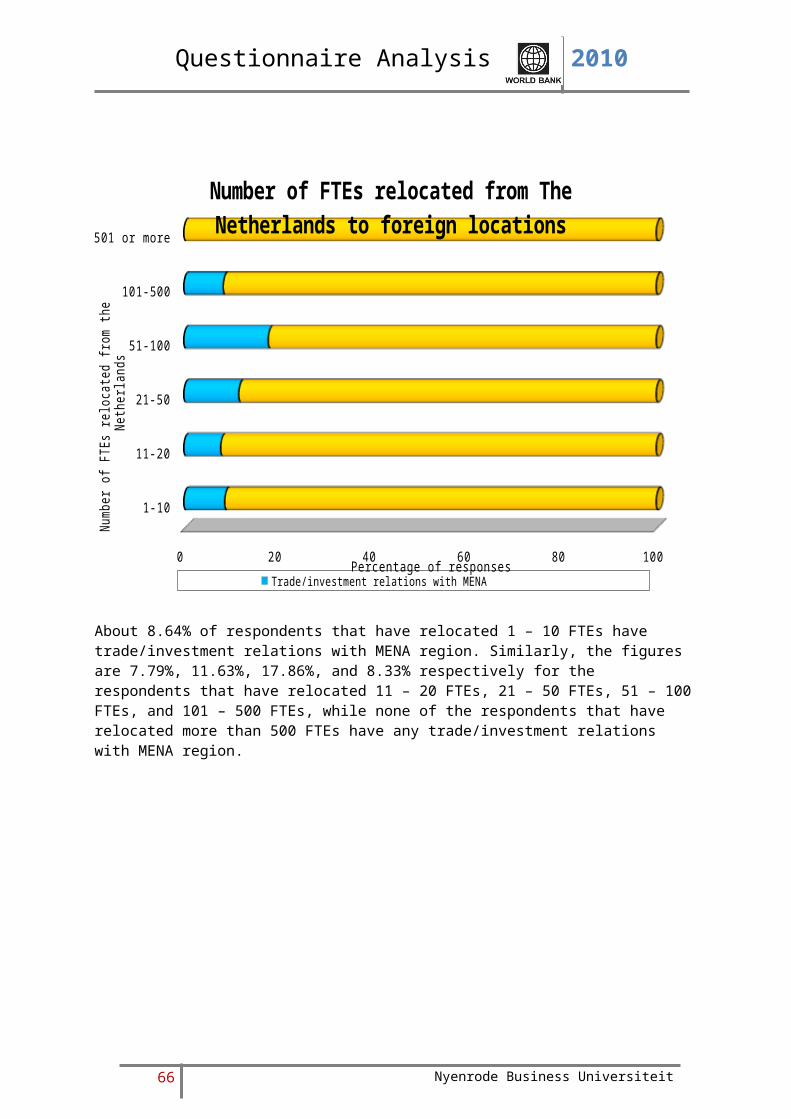
About 8.64% of respondents that have relocated 1 – 10 FTEs have trade/investment relations with MENA region. Similarly, the figures are 7.79%, 11.63%, 17.86%, and 8.33% respectively for the respondents that have relocated 11 – 20 FTEs, 21 – 50 FTEs, 51 – 100 FTEs, and 101 – 500 FTEs, while none of the respondents that have relocated more than 500 FTEs have any trade/investment relations with MENA region.
64 Nyenrode Business Universiteit

Questionnaire Analysis 2010
Trade/in-vestment re-lations with
MENA
Trade/invest-ment relations with rest of the
world
0 10 20 30 40 50 60 70 80 90 100
Number of FTEs relocated from The Netherlands to foreign locations
1-10 11-20 21-50 51-100 101-500 501 or more
Percentage of responses
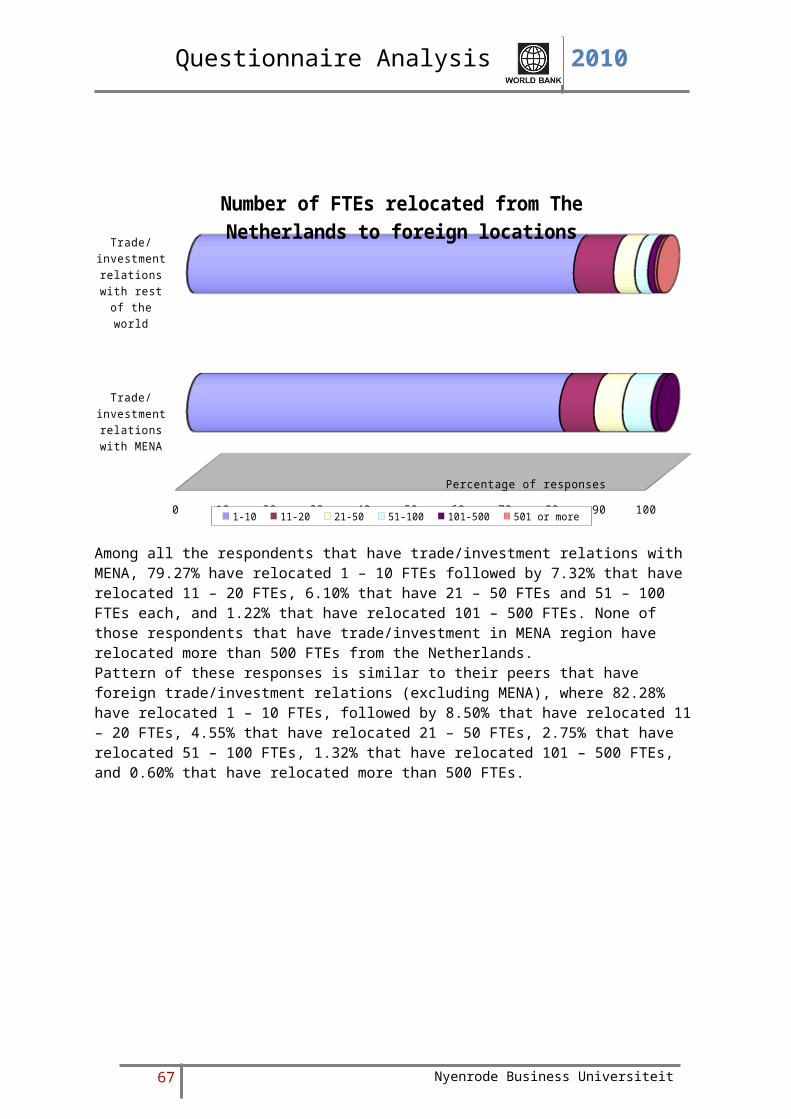
Among all the respondents that have trade/investment relations with MENA, 79.27% have relocated 1 – 10 FTEs followed by 7.32% that have relocated 11 – 20 FTEs, 6.10% that have 21 – 50 FTEs and 51 – 100 FTEs each, and 1.22% that have relocated 101 – 500 FTEs. None of those respondents that have trade/investment in MENA region have relocated more than 500 FTEs from the Netherlands.Pattern of these responses is similar to their peers that have foreign trade/investment relations (excluding MENA), where 82.28% have relocated 1 – 10 FTEs, followed by 8.50% that have relocated 11 – 20 FTEs, 4.55% that have relocated 21 – 50 FTEs, 2.75% that have relocated 51 – 100 FTEs, 1.32% that have relocated 101 – 500 FTEs, and 0.60% that have relocated more than 500 FTEs.
65 Nyenrode Business Universiteit
Questionnaire Analysis 2010
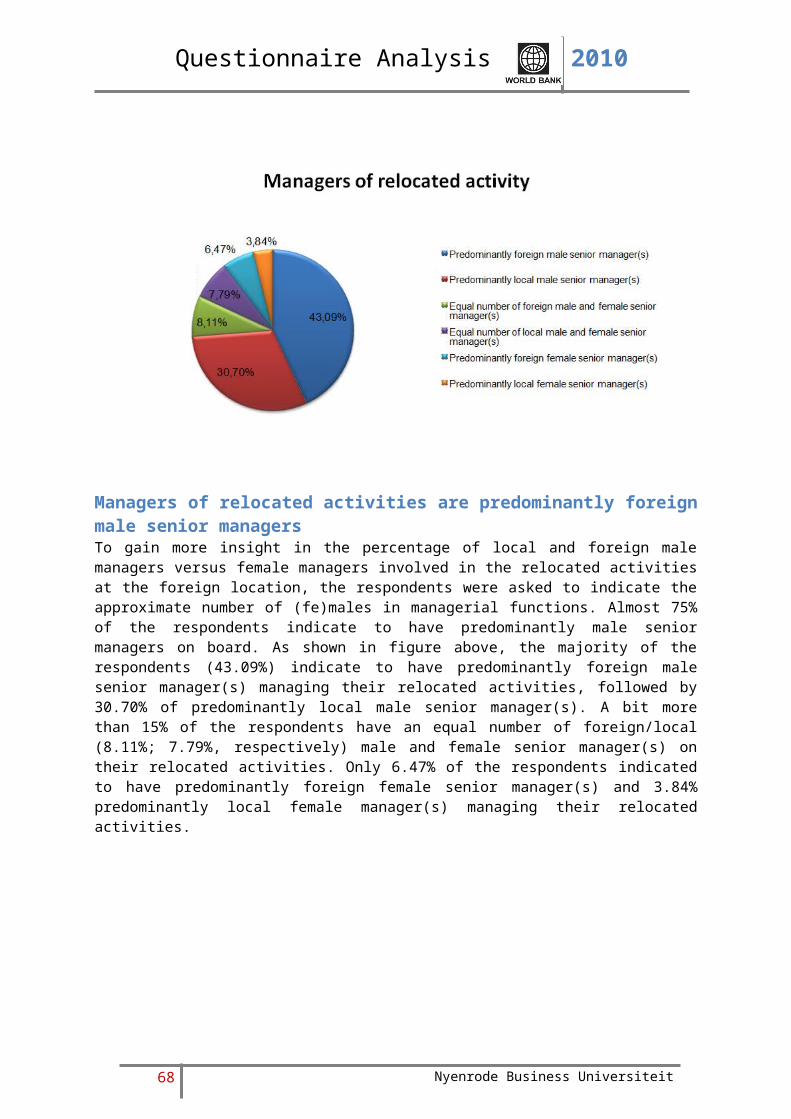
Managers of relocated activities are predominantly foreign male senior managers To gain more insight in the percentage of local and foreign male managers versus female managers involved in the relocated activities at the foreign location, the respondents were asked to indicate the approximate number of (fe)males in managerial functions. Almost 75% of the respondents indicate to have predominantly male senior managers on board. As shown in figure above, the majority of the respondents (43.09%) indicate to have predominantly foreign male senior manager(s) managing their relocated activities, followed by 30.70% of predominantly local male senior manager(s). A bit more than 15% of the respondents have an equal number of foreign/local (8.11%; 7.79%, respectively) male and female senior manager(s) on their relocated activities. Only 6.47% of the respondents indicated to have predominantly foreign female senior manager(s) and 3.84% predominantly local female manager(s) managing their relocated activities.
66 Nyenrode Business Universiteit
Questionnaire Analysis 2010
Predominantly foreign male senior manager(s)
Predominantly foreign female senior manager(s)
Equal number of foreign male and female senior
manager(s)
Predominantly local male senior manager(s)
Predominantly local female senior manager(s)
Equal number of local male and female senior man-
ager(s)
0 5 10 15 20 25 30 35 40
Managers of relocated activity
Trade/investment relations with rest of the worldTrade/investment relations with MENA
Percentage of responses
About 5.27% of respondents have trade/investment relations with MENA and also have predominantly foreign male senior managers managing their relocated activities. Another 2.41% of respondents that have trade/investment relations with MENA region indicated that they have predominantly local male senior managers managing their relocated activities. The figures for other categories are respectively 0.44%, 0.44% and 0.22% for equal number of foreign male and female senior managers, equal number of local male and female senior managers, and predominantly foreign female senior managers managing their relocated activities. None of the respondents that have trade/investment relations with MENA have predominantly local female senior managers managing the relocated activities.The trend is similar for respondents that have foreign trade/investment relations (excluding MENA). Their figures are 37.87%, 28.43%, 7.68%, 7.35%, 6.26%, and 3.62% respectively for predominantly foreign male senior managers, predominantly local male senior managers, equal number of foreign male and female senior managers, equal number of local male and female senior managers, predominantly foreign female senior managers, and predominantly local female senior managers.Therefore, foreign male senior managers are the most preferred while local female senior managers are the least preferred to manage relocated activities.
67 Nyenrode Business Universiteit
Questionnaire Analysis 2010
Predominantly foreign male senior manager(s)
Predominantly foreign female senior manager(s)
Equal number of foreign male and female senior
manager(s)
Predominantly local male senior manager(s)
Predominantly local female senior manager(s)
Equal number of local male and female senior man-
ager(s)
0 20 40 60 80 100
Managers of relocated activity
Trade/investment relations with MENA Trade/investment relations with rest of the world
Percentage of responses
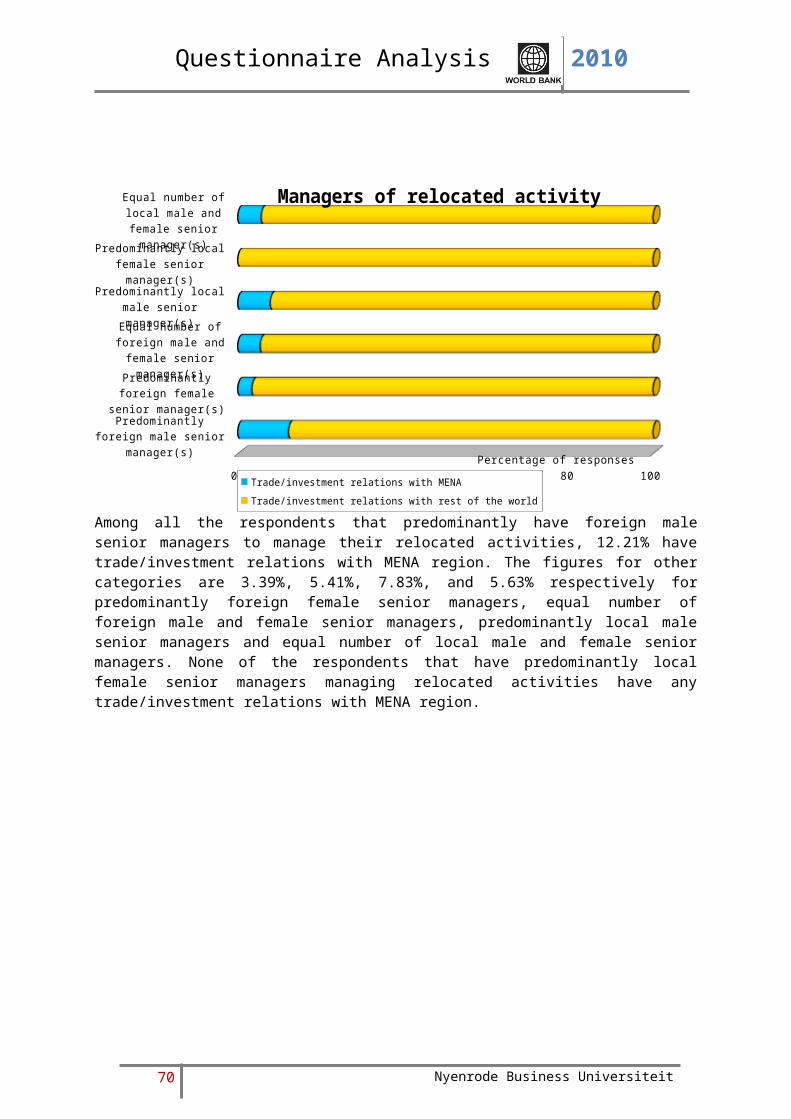
Among all the respondents that predominantly have foreign male senior managers to manage their relocated activities, 12.21% have trade/investment relations with MENA region. The figures for other categories are 3.39%, 5.41%, 7.83%, and 5.63% respectively for predominantly foreign female senior managers, equal number of foreign male and female senior managers, predominantly local male senior managers and equal number of local male and female senior managers. None of the respondents that have predominantly local female senior managers managing relocated activities have any trade/investment relations with MENA region.
68 Nyenrode Business Universiteit

Questionnaire Analysis 2010
Trade/investment relations with
MENA
Trade/investment relations with rest
of the world
0 10 20 30 40 50 60 70 80 90 100
Managers of relocated activity
Predominantly foreign male senior manager(s) Predominantly foreign female senior manager(s)
Equal number of foreign male and female senior manager(s) Predominantly local male senior manager(s)
Predominantly local female senior manager(s) Equal number of local male and female senior manager(s)
Percentage of responses
Among all the respondents that have trade/investment relations with MENA region, 60.00% have indicated that their relocated activities are predominantly managed by foreign male senior manager compared to 41.52% of their peers who have foreign trade/investment relations (excluding MENA). Similarly, for relocated activities predominantly managed by foreign female senior manager the figures are 2.50% against 6.86% for MENA and rest of the world respectively; for relocated activities managed by equal number of foreign male and female senior managers it is 5.00% against 8.42% for MENA and the rest of the world respectively; for relocated activities predominantly managed by local male senior managers it is 27.50% against 31.17% for MENA and rest of the world respectively; for relocated activities predominantly managed by local female senior managers it is 0.00% against 3.97% for MENA and rest of the world respectively; and for equal number of local male and female senior managers it is 5.00% against 8.06% for MENA and rest of the world respectively.
69 Nyenrode Business Universiteit
Questionnaire Analysis 2010
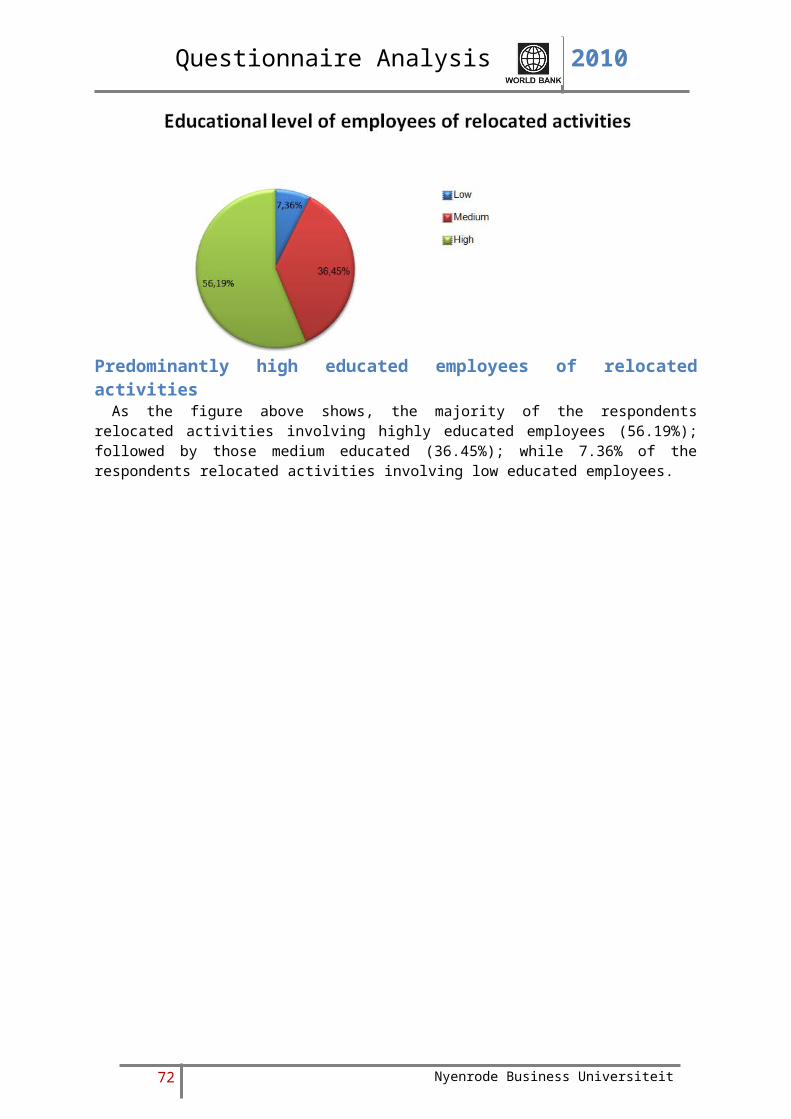
Predominantly high educated employees of relocated activities As the figure above shows, the majority of the respondents relocated activities involving highly educated employees (56.19%); followed by those medium educated (36.45%); while 7.36% of the respondents relocated activities involving low educated employees.
70 Nyenrode Business Universiteit

Questionnaire Analysis 2010
Low
Medium
High
0 10 20 30 40 50 60
Education level of employees involved in relocated activities
Rest of the worldMENA
Percentage of responses For about 51.70% of respondents that have foreign trade/investment relations (excluding MENA) and have relocated their activities from the Netherlands, the relocated activities require highly educated employees at foreign location, where as this number is 4.72% for similar category of respondents that have trade/investment relations with MENA. Further, for 32.93% of respondents that have foreign trade/investment relations (excluding MENA) and have relocated their activities from the Netherlands, the relocated activities require employees with medium education skills at foreign location compared to 3.29% for similar category of respondents that have trade/investment relations with MENA. Lastly about 6.59% of respondents that have foreign trade/investment relations (excluding MENA) have relocated activities that require employees with low educational skills at foreign location compared to 0.77% of respondents of similar category but have trade/investment relations with rest of the world.
71 Nyenrode Business Universiteit
Questionnaire Analysis 2010
Low
Medium
High
0 20 40 60 80 100
Education level of employees involved in relocated activities
MENARest of the world
Percentage of responses
Among all the respondents that have relocated activities that require highly educated employees at foreign location, 8.37% have trade/investment relations with MENA. Similarly among all the respondents that have relocated activities that require employees with medium educational skills at foreign location, 9.09% have trade/investment relations with MENA, while the figure is 10.45% for those in the category that requires employees with low educational skills at foreign location.
72 Nyenrode Business Universiteit

Questionnaire Analysis 2010
MENA
Rest of the world
0 10 20 30 40 50 60 70 80 90 100
Education level of employees involved in relocated activities
LowMediumHigh
Percentage of responses
Among all the respondents that have trade/investment relations with MENA, 53.75% have relocated activities, which require highly educated employees at foreign locations. This is followed by 37.50% which require employees with medium educational skills at foreign locations and 8.75% that require employees with low educational skills at foreign locations.On comparison, among all the respondents that have foreign trade/investment relations (excluding MENA), 56.68% have relocated activities, which require highly educated employees at foreign locations. This is followed by 36.10% which require employees with medium educational skills at foreign locations and 7.22% that require employees with low educational skills at foreign locations.Clearly, majority of activities that require highly educated employees at foreign location are being relocated to MENA as well as to the rest of the world.
73 Nyenrode Business Universiteit

Questionnaire Analysis 2010
Mostly the availability of qualified employees at foreign locations is sufficient While assessing the availability of qualified employees at the foreign location, 38.25% and 29.43% of the respondents indicated the availability of qualified employees in the foreign location to be sufficient and good. 2.11% indicated the availability to be poor while it was not sufficient for 11.24% of the respondents; where as the rest 18.97% has no opinion on this topic.
74 Nyenrode Business Universiteit
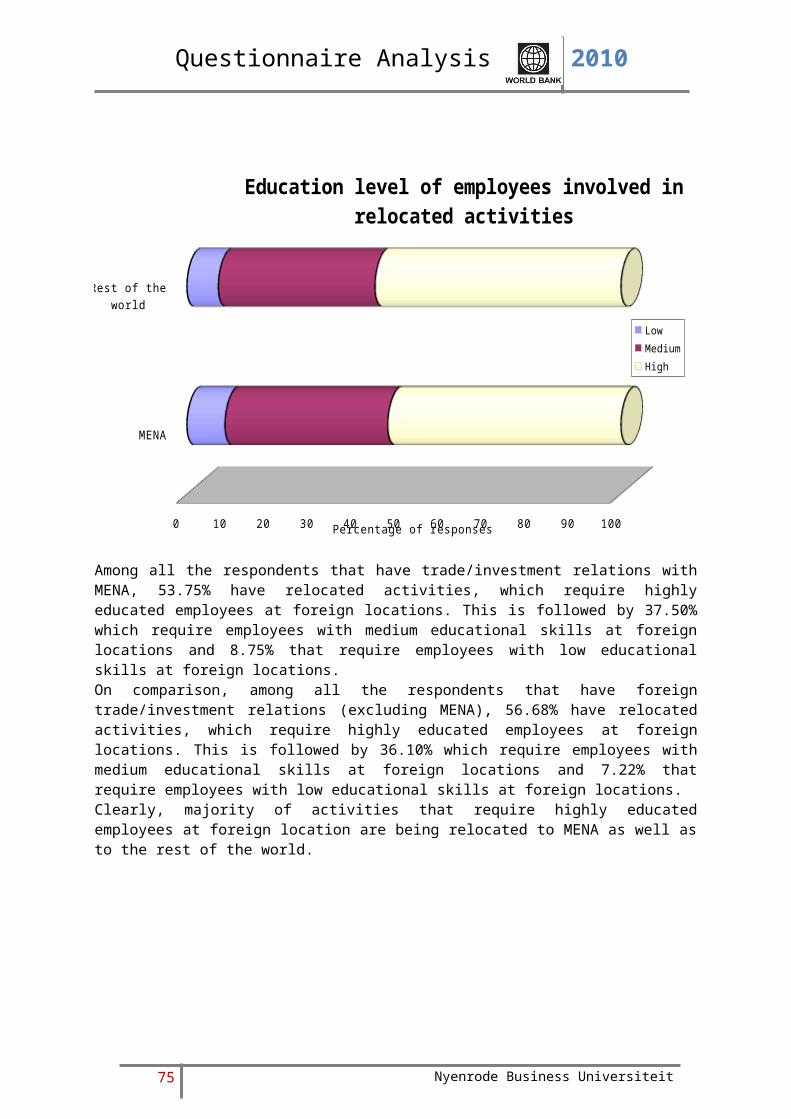
Questionnaire Analysis 2010
Poor
Not sufficient
Sufficient
Good
No opinion
0 5 10 15 20 25 30 35 40
Availability of qualified employees at foreign loca-tion
Rest of the worldMENA
Percentage of responsesAbout 36.24% of the respondents that have foreign trade/investment relations (excluding MENA) indicated that there is sufficient availability of qualified employees at foreign location compared to about 2.12% who shared the same opinion but have trade/investment relations with MENA. Similarly 27.92% of respondents that have foreign trade/investment relations (excluding MENA) indicated that there is good availability of qualified employees at foreign location compared to about 1.65% who shared the same opinion but have trade/investment relations with MENA. The numbers respectively are 17.25% versus 1.57% where the respondents indicated that they have no opinion about the availability of qualified employees at foreign location, 10.12% versus 1.12% that have indicated that there are no sufficient availability of qualified employees at foreign location, and 1.14% versus 0.63% who rated poor availability of qualified employees at foreign locations.
75 Nyenrode Business Universiteit

Questionnaire Analysis 2010
Poor
Not sufficient
Sufficient
Good
No opinion
0 20 40 60 80 100
Availability of qualified employees at foreign loca-tion
MENA Rest of the world
Percentage of responses
Among all the respondents that rated the availability of qualified employees at foreign location as poor, 30.77% have trade/investment relations with MENA region. Further, among all the respondents who rated the availability of qualified employees at foreign location as not sufficient, 9.79% have trade/investment relations with MENA. Next, about 5.52% of respondents who indicated that there is sufficient availability of qualified employees at foreign location have trade/investment relations with MENA. Similarly, the figures for those who rated good and no opinion are 5.57% and 8.33% respectively.
76 Nyenrode Business Universiteit
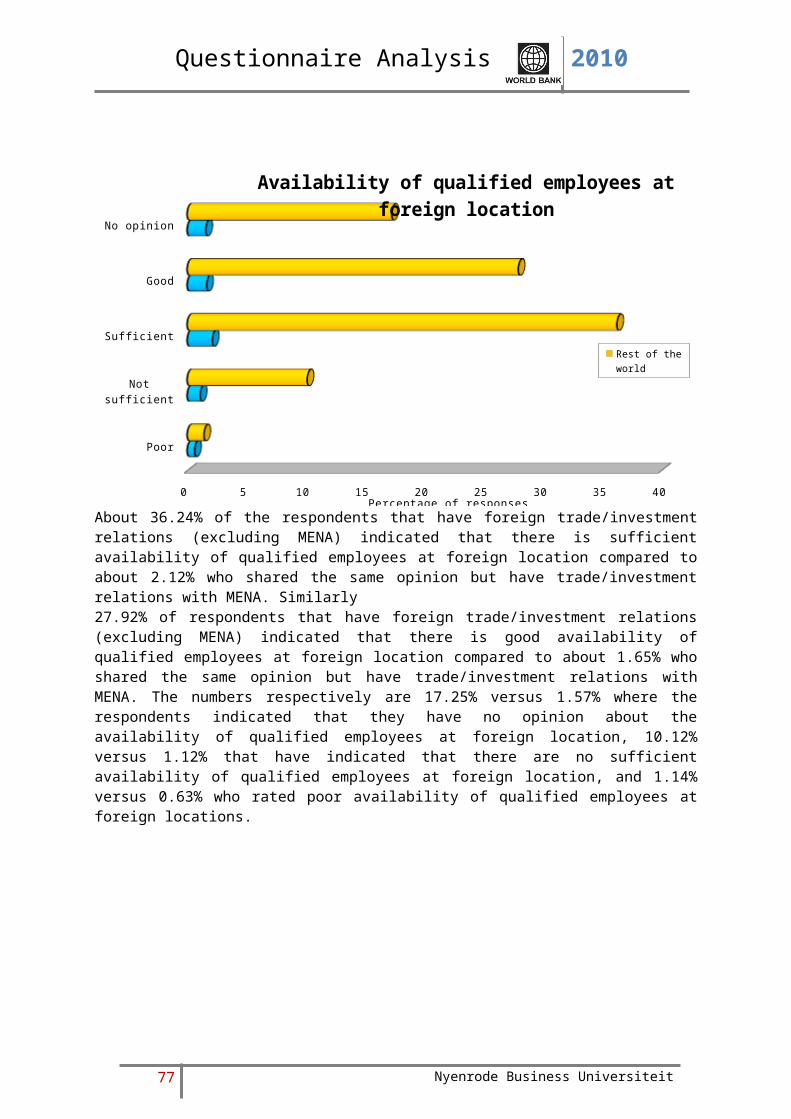
Questionnaire Analysis 2010
MENA
Rest of the world
0 10 20 30 40 50 60 70 80 90 100
Availability of qualified employees at foreign loca-tion
Poor
Not sufficient
Sufficient
Good
No opinion
Percentage of responses
Among all the respondents that have trade/investment relations with MENA, majority (30.00%) indicated that there is sufficient availability of qualified employees at foreign location compared to 38.99% of respondents who share the same opinion but have trade/investment relations with rest of the world (excluding MENA). This is followed by 23.33% who have trade/investment relations and indicated that good availability of qualified employees at foreign location compared 30.04% in the other category but shared the same opinion. The figures for no opinion, no sufficient availability, and poor availability are respectively 22.22% (for those who have trade/investment relations with MENA) versus 18.57% (for those who have trade/investment relations with rest of the world, excluding MENA), 15.56% (for those who have trade/investment relations with MENA) versus 10.89% for those who have trade/investment relations with rest of the world, excluding MENA), and 8.89% (for those who have trade/investment relations with MENA) versus 1.52% (for those who have trade/investment relations with rest of the world, excluding MENA).
77 Nyenrode Business Universiteit

Questionnaire Analysis 2010
Mostly the availability of qualified males at foreign locations is sufficient The availability of qualified men at the foreign location is in line with the overall availability. As indicated in figure above, 36.97% and 28.47% of the respondents indicated the availability of qualified male employees at the foreign location to be sufficient and good, respectively. 1.72% indicated the availability of qualified males to be poor at foreign location while it is not sufficient to 11.47% of the respondents. 21.37%% of the respondents have no opinion on this topic.
78 Nyenrode Business Universiteit
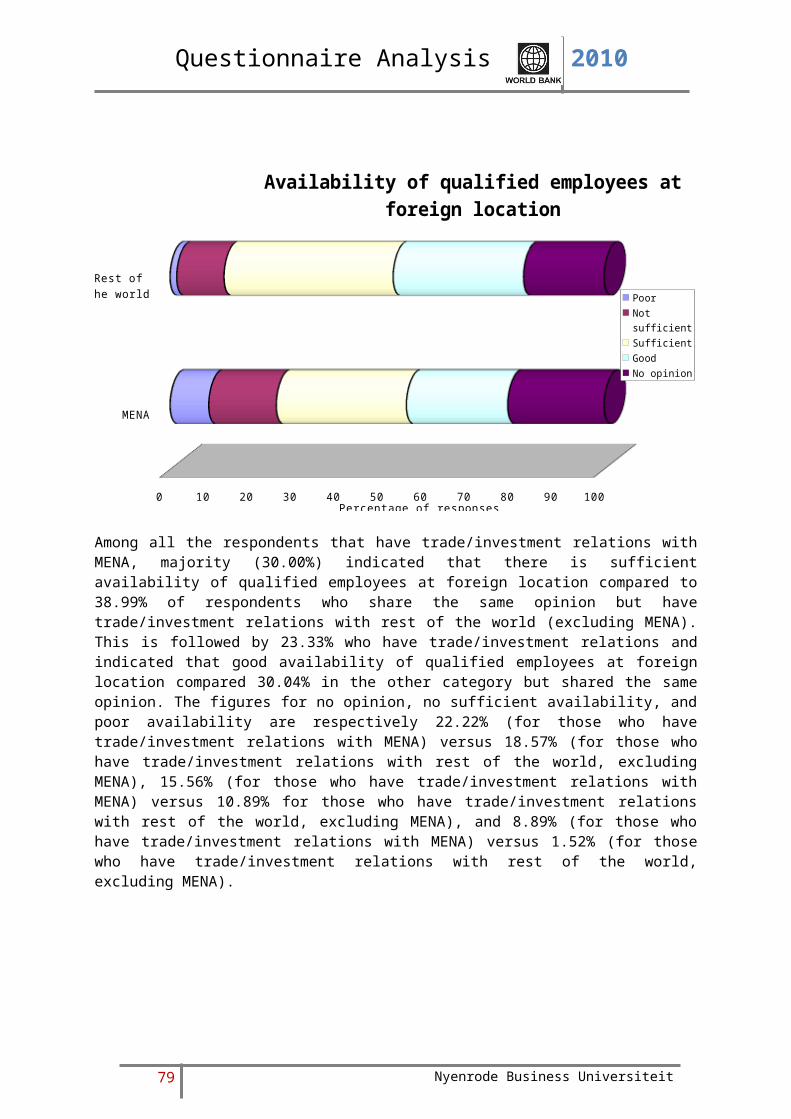
Questionnaire Analysis 2010
Mostly the availability of qualified females at foreign locations is sufficient There is a slight decrease in the availability of qualified female employees at foreign location compared to the overall availability of qualified employees. As figure above demonstrates, 30.50% and 29.02% of the respondents indicate the availability of qualified female employees at foreign location to be sufficient and good, respectively. 3.98% and 11.70% of the respondents indicate the availability of qualified female employees to be poor or not sufficient respectively at the foreign location. 24.80% of the respondents have no opinion on this topic.
Poor
Not suffic ient
Sufficient
Good
No opinion
0 5 10 15 20 25 30 35
Availability of qualified men at foreign location
Rest of the world MENA
Percentage of responses
About 34.38% of respondents indicated that they have trade/investment relations with rest of the world (excluding MENA) and also indicated that there is sufficient availability of qualified male employees at foreign location, while 29.33% of respondents of the same category shared same opinion about female employees. On the other hand 2.12% of respondents indicated that they have trade/investment relations with MENA region and also indicated that there is sufficient availability of
79 Nyenrode Business Universiteit
Poor
Not sufficient
Sufficient
Good
No opinion
0 5 10 15 20 25 30
Availability of qualified women at foreign location
Rest of the world MENA
Percentage of responses
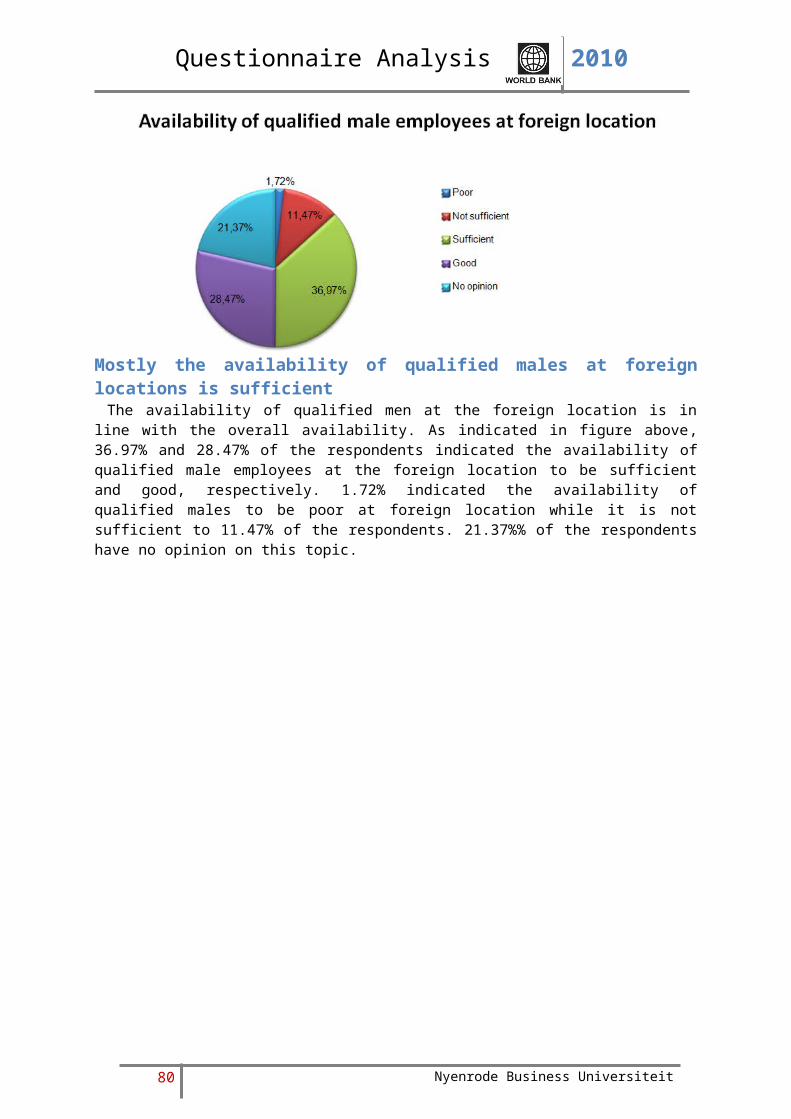
Questionnaire Analysis 2010
qualified male employees at foreign location, while 1.25% of respondents of the same category shared same opinion about female employees.
Next 26.98% of respondents indicated that they have trade/investment relations with rest of the world (excluding MENA) and also indicated that there is good availability of qualified male employees at foreign location, while 28.16% of respondents of the same category shared same opinion about female employees. On the other hand 1.65% of respondents indicated that they have trade/investment relations with MENA region and also indicated that there is sufficient availability of qualified male employees at foreign location, while 1.02% of respondents of the same category shared same opinion about female employees.
The figures of rest of the categories are as follows: 19.45% and 22.75% (trade/investment relations with rest of the world and no opinion respectively about availability of qualified male and female employees); 1.80% and 1.96% (trade/investment relations with MENA and no opinion respectively about availability of qualified male and female employees); 10.43% and 10.35% (trade/investment relations with rest of the world and no sufficient availability of qualified male and female employees respectively); 0.86% and 1.25% (trade/investment relations with MENA and no sufficient availability of qualified male and female employees respectively); 1.10% and 2.35% (trade/investment relations with rest of the world and poor availability of qualified male and female employees respectively); and 0.63% and 1.57% (trade/investment relations with MENA and poor availability of qualified male and female employees respectively).
Among all the respondents that indicated there is poor availability of qualified male employees at foreign locations, 36.36% have trade/investment relations with MENA region, while the figure is 40.00% for those belonging to the same category and share same opinion about female employees. Similarly among all the respondents that have indicated there are no sufficient qualified male employees at foreign location, 7.64% have trade/investment relations with MENA region compared with 10.81% for those who belong to same category and share same opinion about female employees.
The figures for rest of the categories are as follows: 5.71% and 4.10% (respondents who have trade/investment relations with MENA and also indicated there is sufficient availability of qualified
male and female employees respectively at foreign location); 5.75% and 3.49% (respondents who have trade/investment relations with MENA and also indicated there is good availability of qualified male and female employees respectively at foreign location); and 8.49% and 7.49% (respondents
80 Nyenrode Business Universiteit
Poor
Not sufficient
Sufficient
Good
No opinion
0 20 40 60 80 100
Availability of qualified women at foreign location
MENA Rest of the world
Percentage of responses
Poor
Not sufficient
Sufficient
Good
No opinion
0 20 40 60 80 100
Availability of qualified men at foreign location
MENA Rest of the world
Percentage of responses

Questionnaire Analysis 2010
who have trade/investment relations with MENA and also indicated that they have no opinion about the availability of qualified male and female employees respectively at foreign location).
Among all the respondents that have trade/investment relations with MENA region, 30.00% indicated that they have sufficient availability of qualified male employees at foreign location, while the figure is 17.78% for female employees. Responses regarding other categories of availability of male and female employees respectively at foreign location by respondents that
have trade/investment relations with MENA are as follows: 25.56% and 27.78% (no opinion); 23.33% and 14.44% (good); 12.22% and 17.78% (not sufficient); 8.89% and 22.22% (poor).
In comparison, among all the respondents that have trade/investment relations with rest of the world (excluding MENA), 37.64% indicated that they have sufficient availability of qualified male employees at foreign location, while the figure is 31.56% for female employees. Responses regarding other categories of availability of male and female employees respectively at foreign location by respondents that have trade/investment relations with rest
of the world (excluding MENA) are as follows: 20.93% and 24.47%(no opinion); 29.03% and 30.30% (good); 11.22% and 11.14% (not sufficient); 1.18% and 2.53% (poor).
81 Nyenrode Business Universiteit
MENA
Rest of the world
0 10 20 30 40 50 60 70 80 90 100
Availability of qualified women at foreign location
Poor Not sufficient Sufficient Good No opinion
Percentage of responses
MENA
Rest of the world
0 20 40 60 80 100
Availability of qualified men at foreign location
Poor Not sufficient Sufficient Good No opinion
Percentage of responses
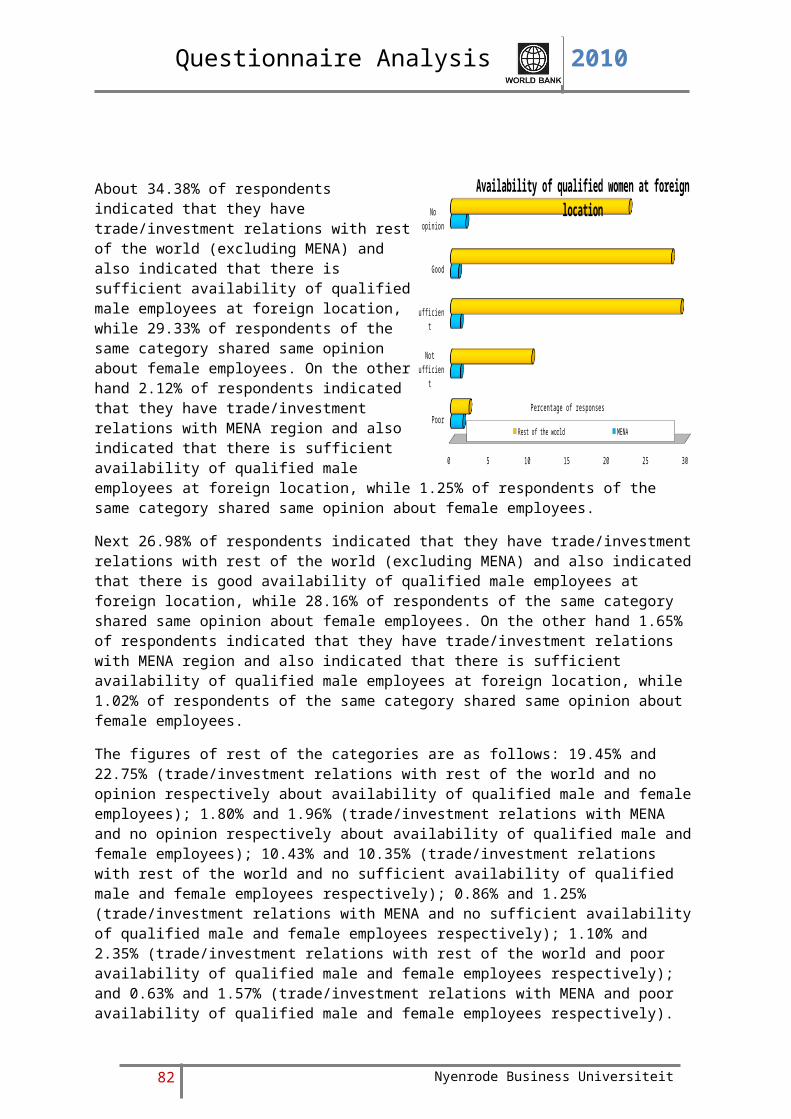
Questionnaire Analysis 2010
Most respondents indicate to have no high educated females at all Respondents were asked to indicate the approximate number of female employees at foreign location who are medium to highly educated. 41.06% of the respondents indicated that they have no medium to highly educated female employees, 32.85% indicated to have between 1-24%. The number is between 25-49% for another 14.80% of the respondents, while 7.19% have between 50-74% and 4.11% have 75-100% of female employees that are medium to highly educated.
82 Nyenrode Business Universiteit

Questionnaire Analysis 2010
0 %
1 – 24%
25 – 49%
50 – 74%
75 – 100%
0 5 10 15 20 25 30 35 40
Percentage of medium to highly educated female employees at foreign location
Rest of the worldMENA
Percentage of responses
Majority of respondents (37.37%) that have trade/investment relations with rest of world (excluding MENA) indicated that they have no medium to highly educated female employees at foreign location. Similarly, majority (3.61%) of those that have trade/investment relations with MENA have no medium to highly educated female employees at their foreign locations. This is followed by 30.50% (that have trade/investment relations with rest of world, excluding MENA) and 2.32% (that have trade/investment relations with MENA) who have 1 – 24% of medium to highly educated employees as females; 14.09% (that have trade/investment relations with rest of world, excluding MENA) and 0.77% (that have trade/investment relations with MENA) who have 25 – 49% of medium to highly educated employees as females; 7.13% (that have trade/investment relations with rest of world, excluding MENA) and 0.09% (that have trade/investment relations with MENA) who have 50 – 74% of medium to highly educated employees as females; and 4.12% (that have trade/investment relations with rest of world, excluding MENA). None of the respondents that have trade/investment relations with MENA have more than 75% of medium to highly educated employees as females.
83 Nyenrode Business Universiteit
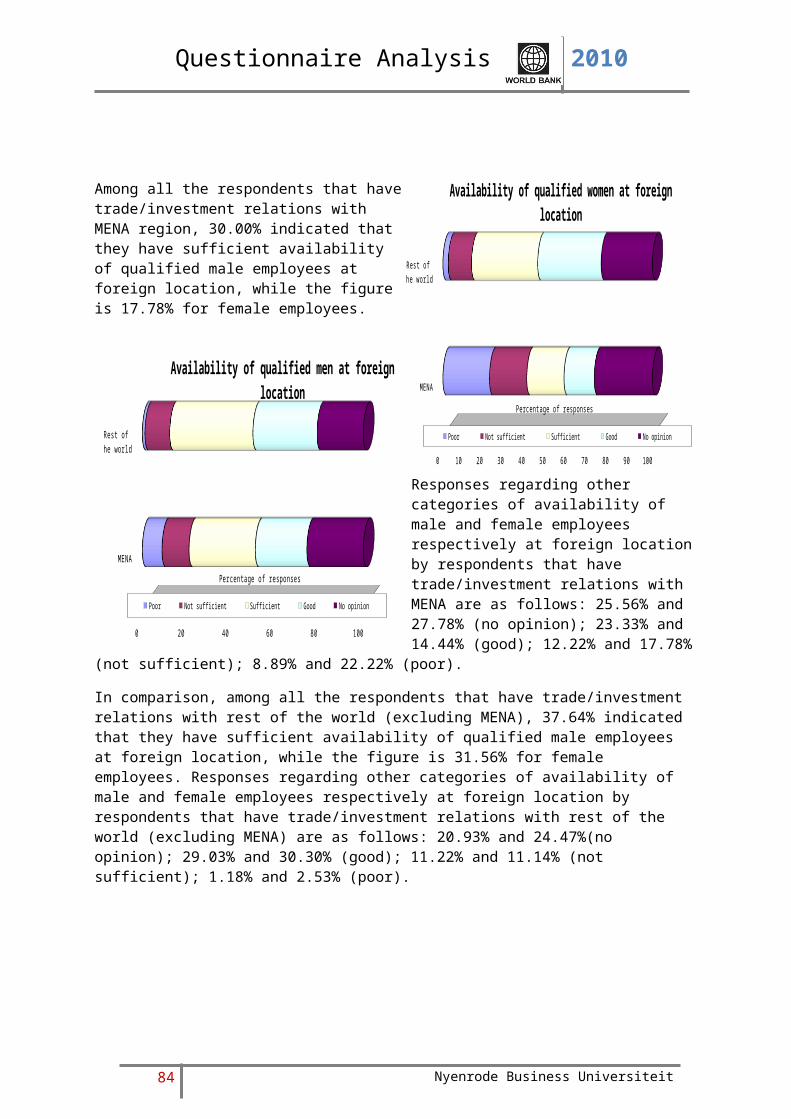
Questionnaire Analysis 2010
0 %
1 – 24%
25 – 49%
50 – 74%
75 – 100%
0 20 40 60 80 100
Percentage of medium to highly educated female employees at foreign location
MENA Rest of the worldPercentage of responses
Among all the employees that have no medium to highly educated female employees, 8.81% have trade/investment relations with MENA region. Similarly, for other categories the figures are 7.07% for 1 – 24% category; 5.20% for 25 – 49% category; and 1.19% for 50 – 74% category. Lastly, none of those that have more than 75% of medium – highly educated employees as females have any trade/investment relations with MENA.
84 Nyenrode Business Universiteit

Questionnaire Analysis 2010
MENA
Rest of the world
0 20 40 60 80 100
Percentage of medium to highly educated female employees at foreign location
0 %
1 – 24%
25 – 49%
50 – 74%
75 – 100%
Percentage of responsesAmong all the respondents that have trade/investment relations with MENA, 53.16% have no female employee at foreign location that has medium to high education, while 34.18% have 1 – 24% of all the medium to highly educated employees at foreign location as females; 11.39% have 25 – 49% of all their medium to highly educated employees at foreign location as females; and 1.27% have 50 – 74% of all their medium to highly educated employees at foreign location as females. However, none of the respondents that have trade/investment with MENA region have more than 75% of all their medium to highly educated employees at foreign location as females.On comparison with those that have trade/investment relations with rest of the world (excluding MENA), the figures are as follows: 40.09% in the category 0%; 32.72% in the category 1 – 24%; 15.12% in the category 25 – 49%; 7.65% in the category 50 – 74%; 4.42% in the category 75 – 100%.
85 Nyenrode Business Universiteit
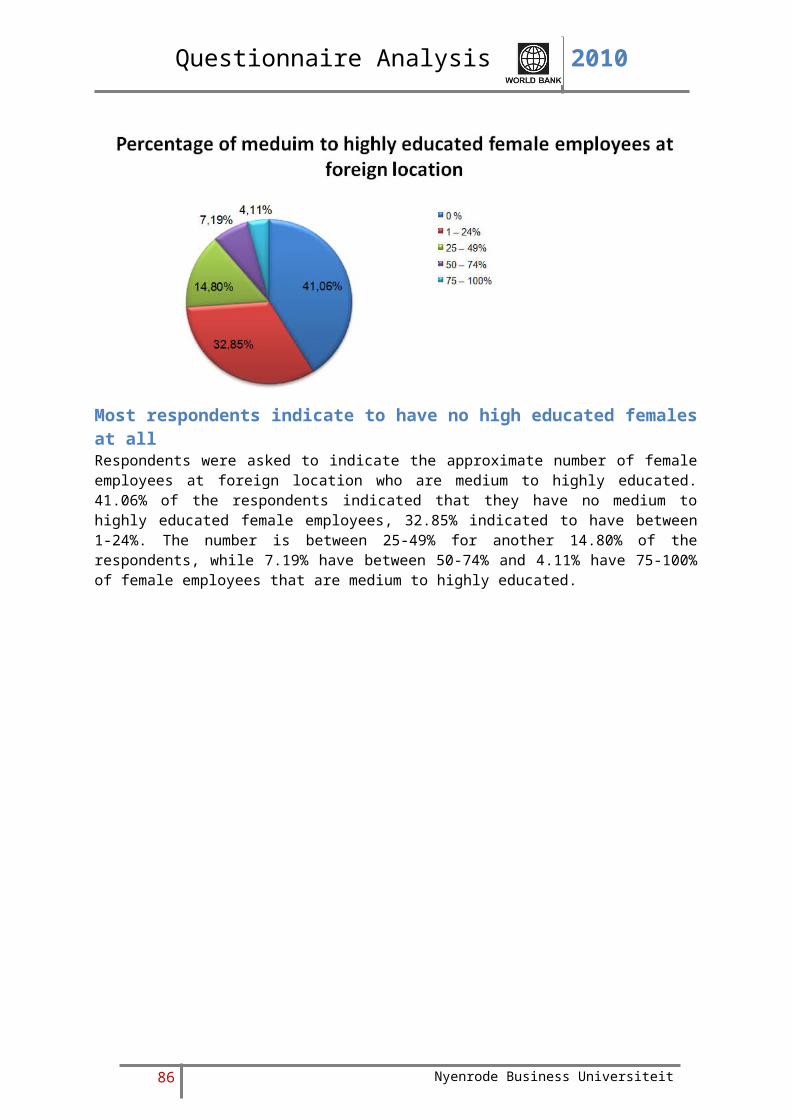
Questionnaire Analysis 2010
13% indicate there to be advantages in hiring females In order to understand employers’ perception of hiring female employees at a foreign location, the research included an open question whether hiring female employees is more advantageous than hiring male employees. 86.17% of the respondents indicated that there is no specific advantage for hiring female employees over male employees at foreign location, where the rest 13.83% of respondents indicated that there are advantages associated with hiring female employees over male employees at a foreign location.
86 Nyenrode Business Universiteit
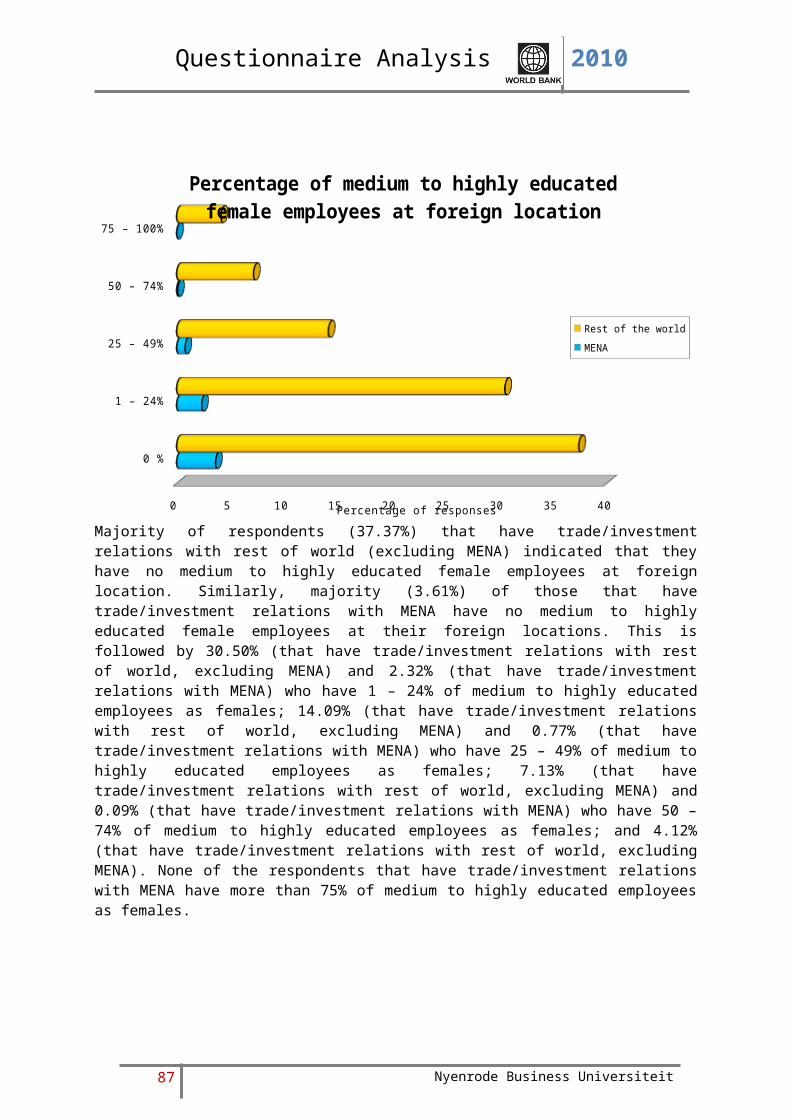
Questionnaire Analysis 2010
Yes
No
0 10 20 30 40 50 60 70 80
Advantages of hiring female employees over male employees at foreign location
Rest of the worldMENA
Percentage of responses79.84% of the respondents indicated that they have trade/investment relations with rest of the world (excluding MENA) and also have no advantages of hiring female employees over male employees at foreign location compared to 6.35% of respondents who shared the same opinion but have trade/investment relations with MENA region.On the other hand, 13.10% of respondents indicated that they have trade/investment relations with rest of the world (excluding MENA) and also have some advantages of hiring female employees over male employees at foreign location compared to 0.71% of respondents who shared the same opinion but have trade/investment relations with MENA region.
87 Nyenrode Business Universiteit
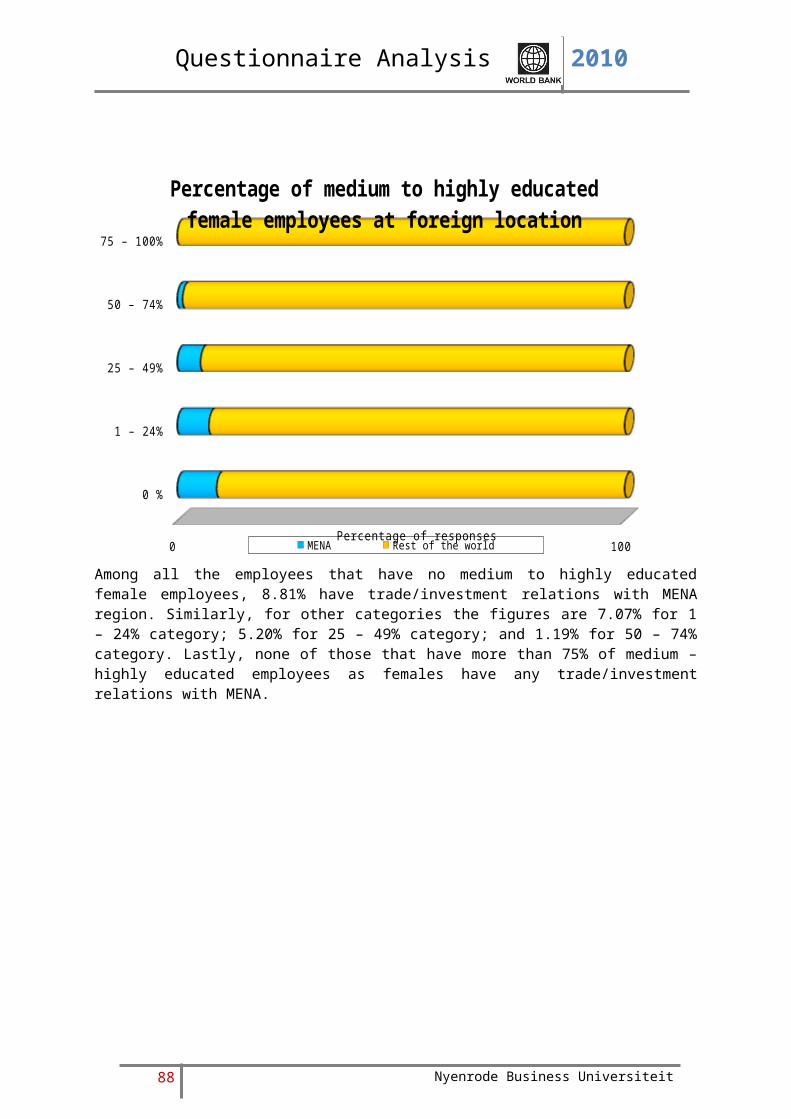
Questionnaire Analysis 2010
Yes
No
0 20 40 60 80 100
Advantages of hiring female over male at foreign location
MENARest of the world
Percentage of responsesAmong all the respondents that have advantages of hiring female employees over male employees at foreign location, 5.11% have trade/investment relations with MENA region and among all those that have no advantages of hiring female employees over male employees at foreign location 7.37% have trade/investment relations with MENA region.
88 Nyenrode Business Universiteit
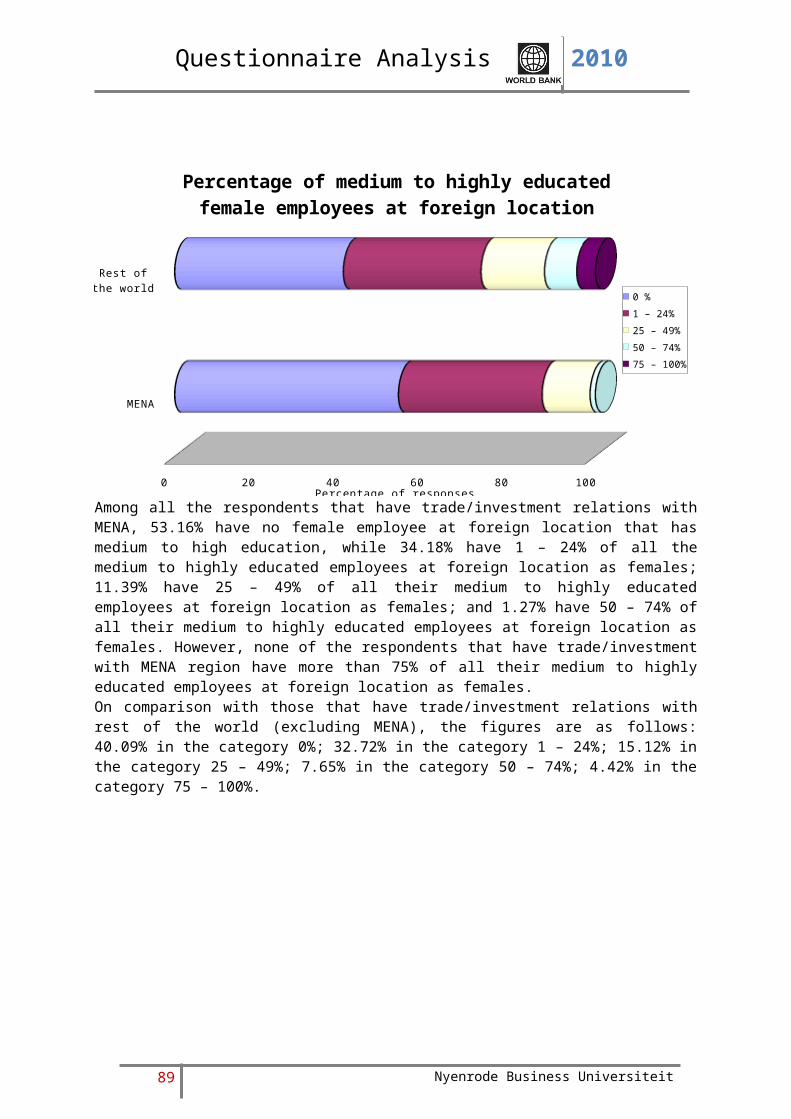
Questionnaire Analysis 2010
MENA
Rest of the world
0 10 20 30 40 50 60 70 80 90 100
Advantages of hiring female over male at foreign location
YesNo
Percentage of responsesAmong all the respondents that have trade/investment relations with MENA region, 10.00% indicated that they have advantages of hiring female employees over male employees at foreign location while 90.00% denied of having any such advantages.In comparison, 14.09% of all the respondents that have trade/investment relations with rest of the world (excluding MENA) indicated that they have advantages of hiring female employees over male employees at foreign location while 85.91% denied of having any such advantages.
89 Nyenrode Business Universiteit
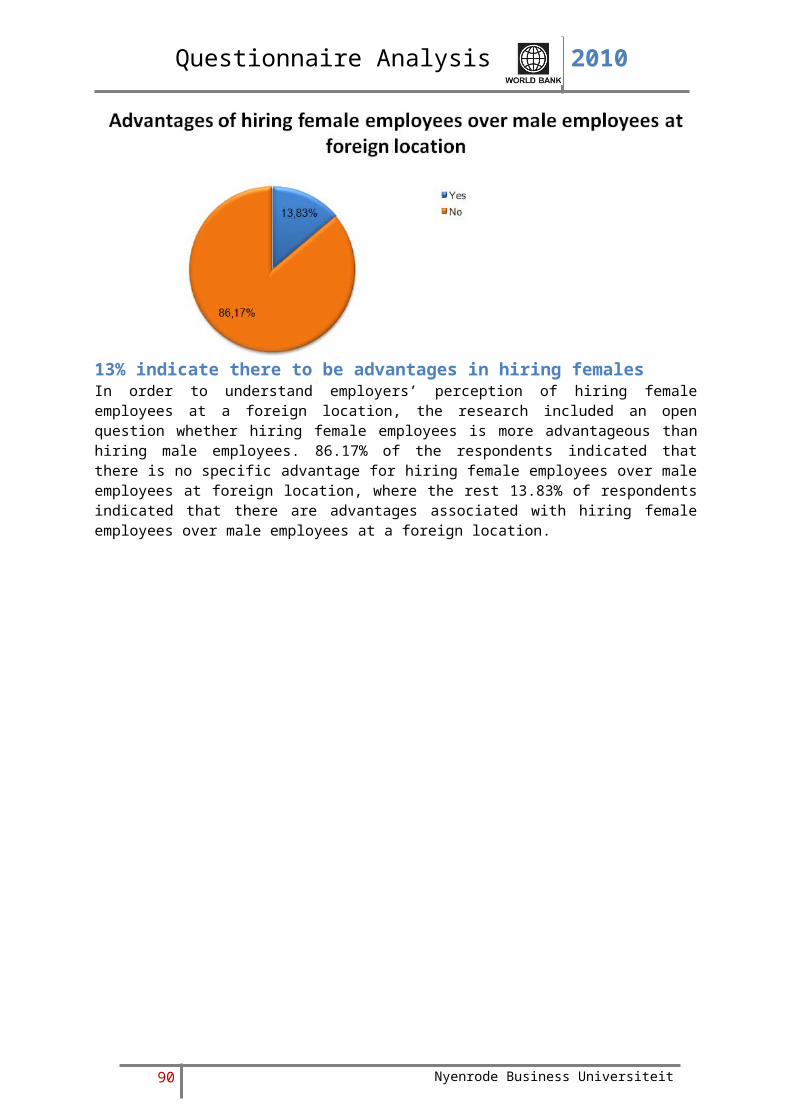
Questionnaire Analysis 2010
15% indicate there to be disadvantages in hiring females The question inquired whether there are any disadvantages in hiring female employees over their male counterparts at a foreign location. 84.06% of the respondents do not see any disadvantages of hiring female employees while 15.94% of the respondents indicated that there are specific disadvantages associated with hiring female employees at foreign location.
Yes
No
0 10 20 30 40 50 60 70 80
Disadvantages of hiring female over male at foreign location
Rest of the worldMENA
Percentage of responses
79.92% of the respondents indicated that they have trade/investment relations with rest of the world (excluding MENA) and also do not have any disadvantages associated with hiring female employees over male employees at foreign location, compared to 4.08% who shared the same opinion but have trade/investment relations with MENA region.On the other hand, 13.02% of the respondents indicated that they have trade/investment relations with rest of the world (excluding MENA) and also have some disadvantages associated with hiring female employees over male employees at foreign location, compared to 2.98% who shared the same opinion but have trade/investment relations with MENA region.
90 Nyenrode Business Universiteit
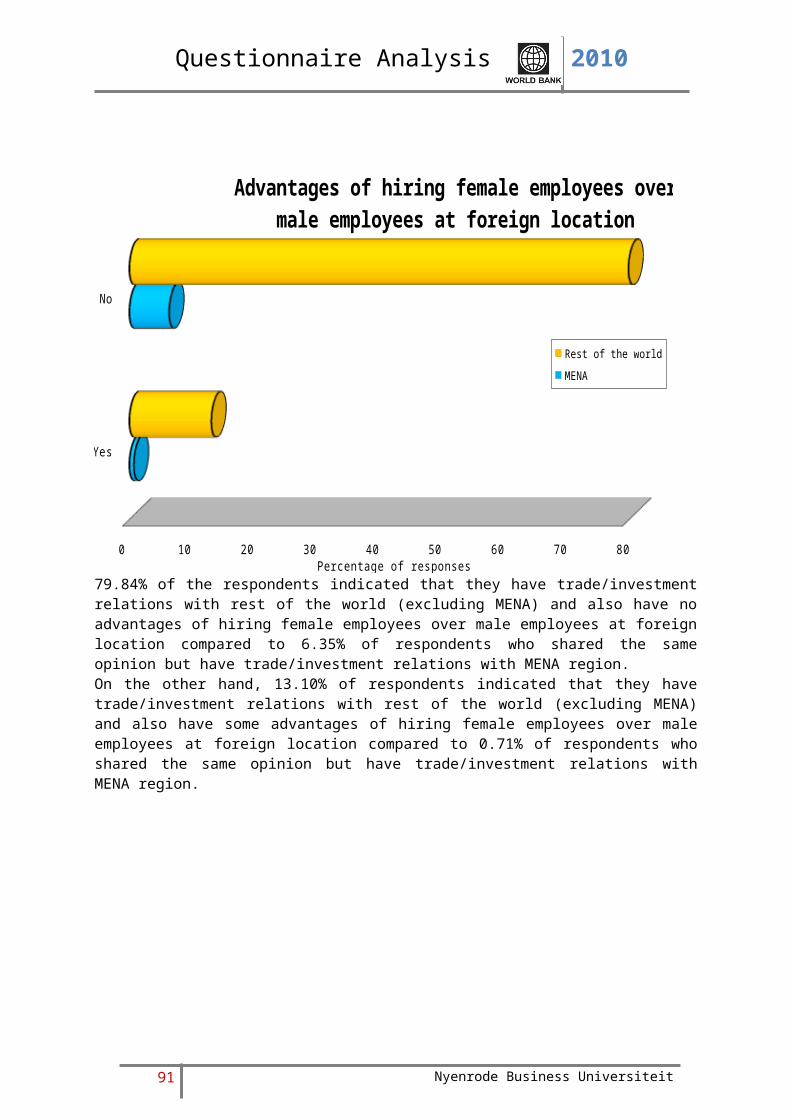
Questionnaire Analysis 2010
Yes
No
0 10 20 30 40 50 60 70 80 90 100
Disadvantages of hiring female over male at foreign location
MENARest of the world
Percentage of responses
Among all the respondents that have some disadvantages associated in hiring female employees over male employees at foreign location, 18.63% have trade/investment relations with MENA. Further, among all the respondents that have no disadvantages associated in hiring female employees over male employees at foreign location, 4.86% have trade/investment relations with MENA.
91 Nyenrode Business Universiteit
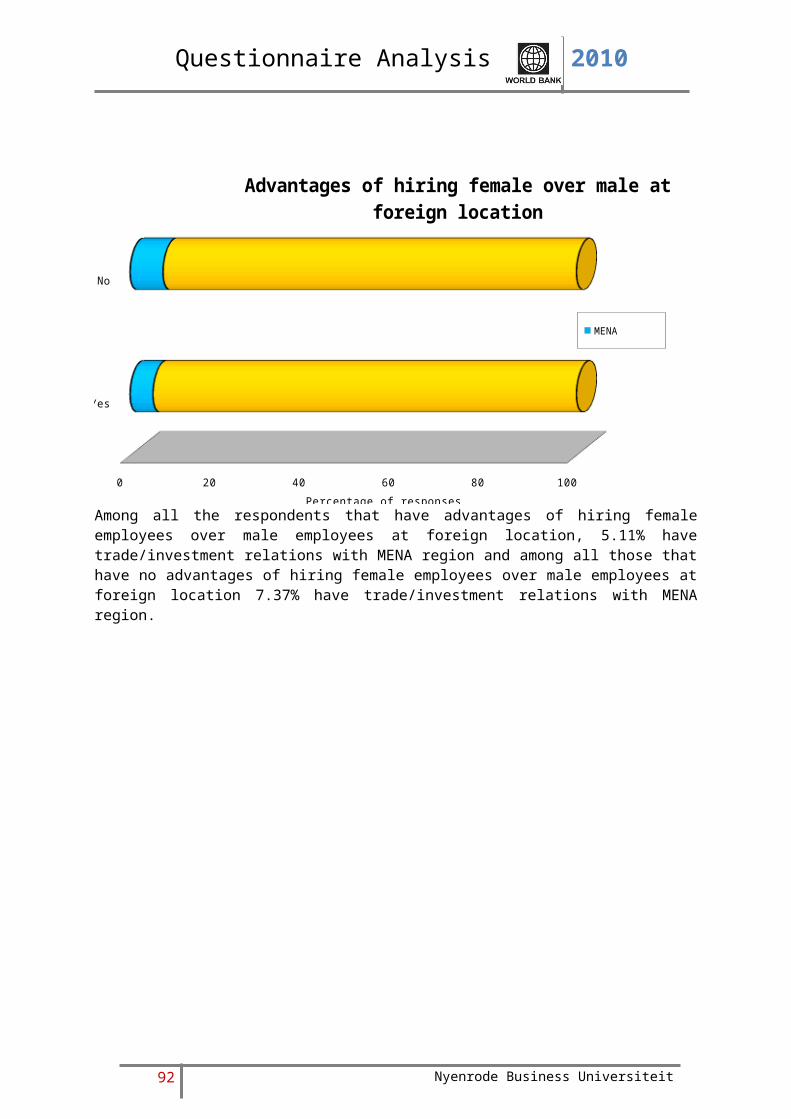
Questionnaire Analysis 2010
MENA
Rest of the world
0 20 40 60 80 100
Disadvantages of hiring female over male at foreign location
Yes No
Percentage of responses
Among all the respondents that have trade/investment relations with MENA, 42.22% indicated that they have some disadvantages associated in hiring female employees over male employees at foreign location, while for the rest 57.78% there were no such disadvantages.
On comparison, among all the respondents that have trade/investment relations with rest of the world (excluding MENA), 14.01% indicated that they have some disadvantages associated in hiring female employees over male employees at foreign location, while for the rest 85.99% there were no such disadvantages.
92 Nyenrode Business Universiteit
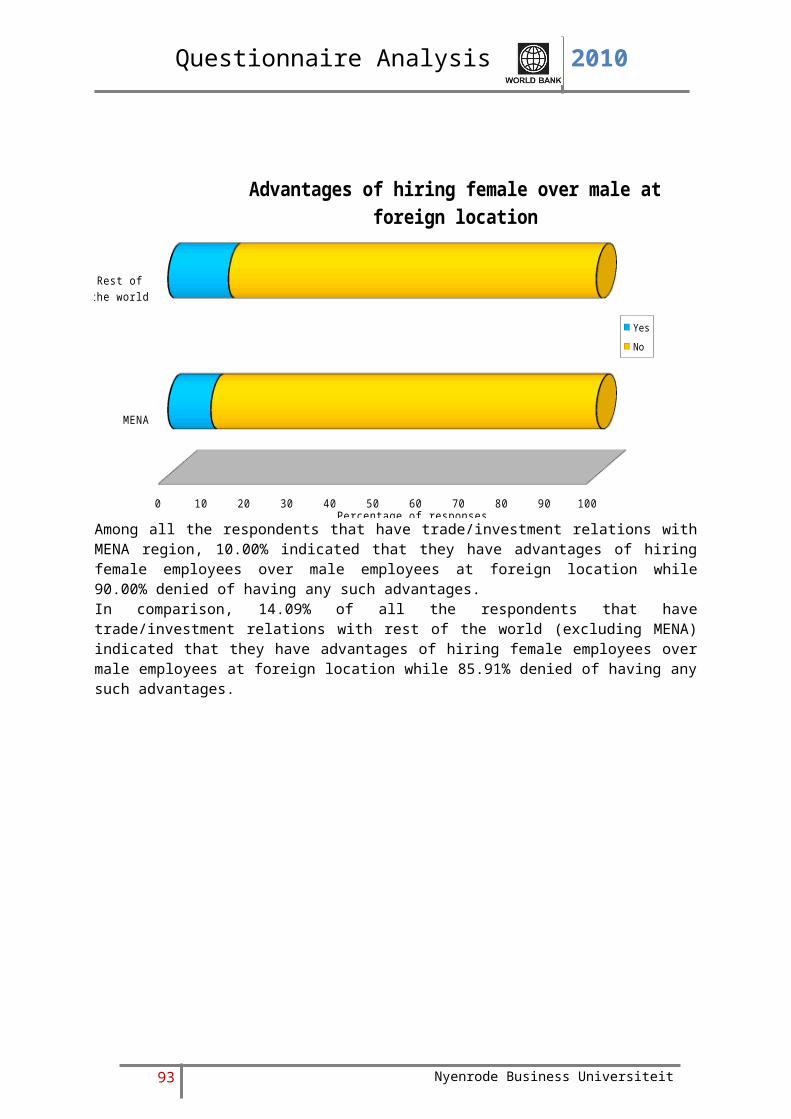
Questionnaire Analysis 2010
Top three advantages of hiring females over males are that they are more trustworthy, dedicated, and more accurate The respondents (13.83%) indicating that there are advantages of hiring female employees over male employees at foreign locations were asked to provide more information regarding the type of their perceived advantages. The majority of the respondents (23.12%) feel that female employees are more trustworthy than their male counterparts, while 19.89% of the respondents mentioned that women are more dedicated to work. Figure above provides the comprehensive list of advantages of hiring female employees over their male counterparts.
93 Nyenrode Business Universiteit
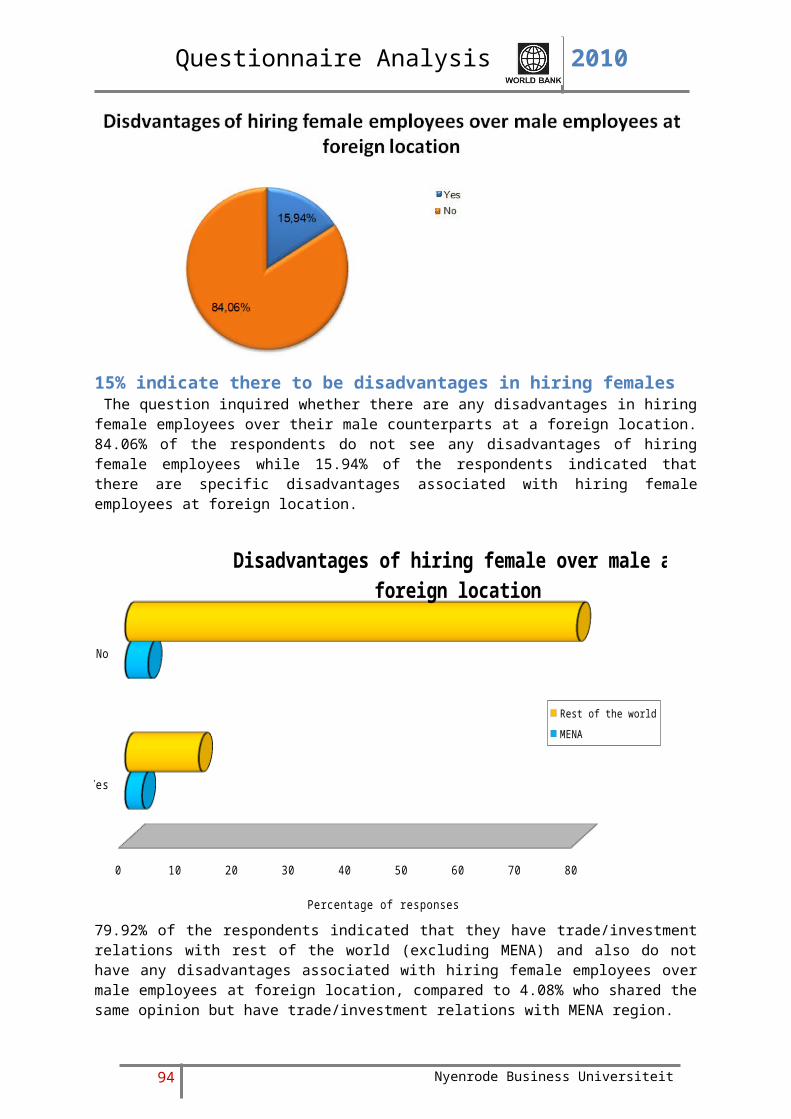
Questionnaire Analysis 2010
They are more productive
They are more trustworthy
They are less absent
They are more accurate
They are more dedicated
At the same level of skills and education,
females have a higher level of training
The cost of hiring a female is less
They have better social skills
They create better balance/gender diversity
No difference
Meaningless
Others
0 5 10 15 20 25
Advantages of female employees at foreign location
Rest of the worldMENA
Percentage of responses
For those respondents that have trade/investment with MENA region and also have advantages of hiring female employees over male employees at foreign location, following are the top five advantages – female employees are more accurate (indicated 1.62% of the respondents); female employees are more trustworthy (1.35%); female employees are more productive (0.81%); female employees are dedicated (0.81%); and cost of hiring female employees is less (0.54%).For those respondents that have trade/investment with rest of the world (excluding MENA) and also have advantages of hiring female employees over male employees at foreign location, following are the top five advantages – female employees are more trustworthy (21.83%); female employees are dedicated (18.87%); female employees are more accurate (18.06%); female employees are more productive (16.17%); and at the same level of skills and education, female employees have higher level of training (5.93%).
94 Nyenrode Business Universiteit
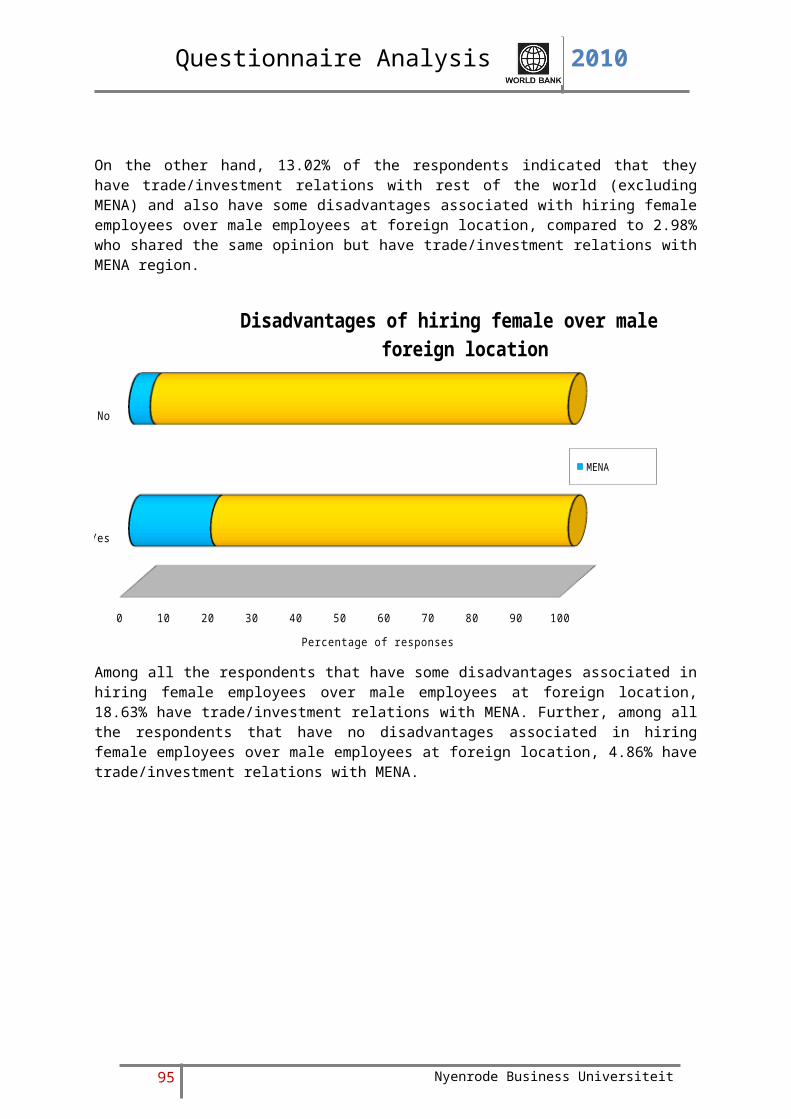
Questionnaire Analysis 2010
They are more productive
They are more trustworthy
They are less absent
They are more accurate
They are more dedicated
At the same level of skills and education,
females have a higher level of training
The cost of hiring a female is less
They have better social skills
They create better balance/gender diversity
No difference
Meaningless
Others
0 10 20 30 40 50 60 70 80 90 100
Advantages of female employees at foreign location
MENA Rest of the world
Percentage of responses
Among all the respondents that indicated cost of hiring female employees at foreign location is less as the advantage associated with hiring female employees at foreign location, 16.67% have trade/investment relations with MENA region. Similarly among all those who indicated female employees are more accurate as the advantage, 8.22% have trade/investment relations with MENA region; 5.81% of those who indicated female employees are more trustworthy have trade/investment relations with MENA region; 4.76% of those who indicated female employees are more productive have trade/investment relations with MENA region; 4.35% of those who indicated that at same level of skills and education, female employees have better training have trade/investment relations with MENA region; and 4.11% of those who indicated female employees are more dedicated have trade/investment relations with MENA region. Respondents that choose rest of the advantages do not have any trade/investment relation with MENA region.
95 Nyenrode Business Universiteit
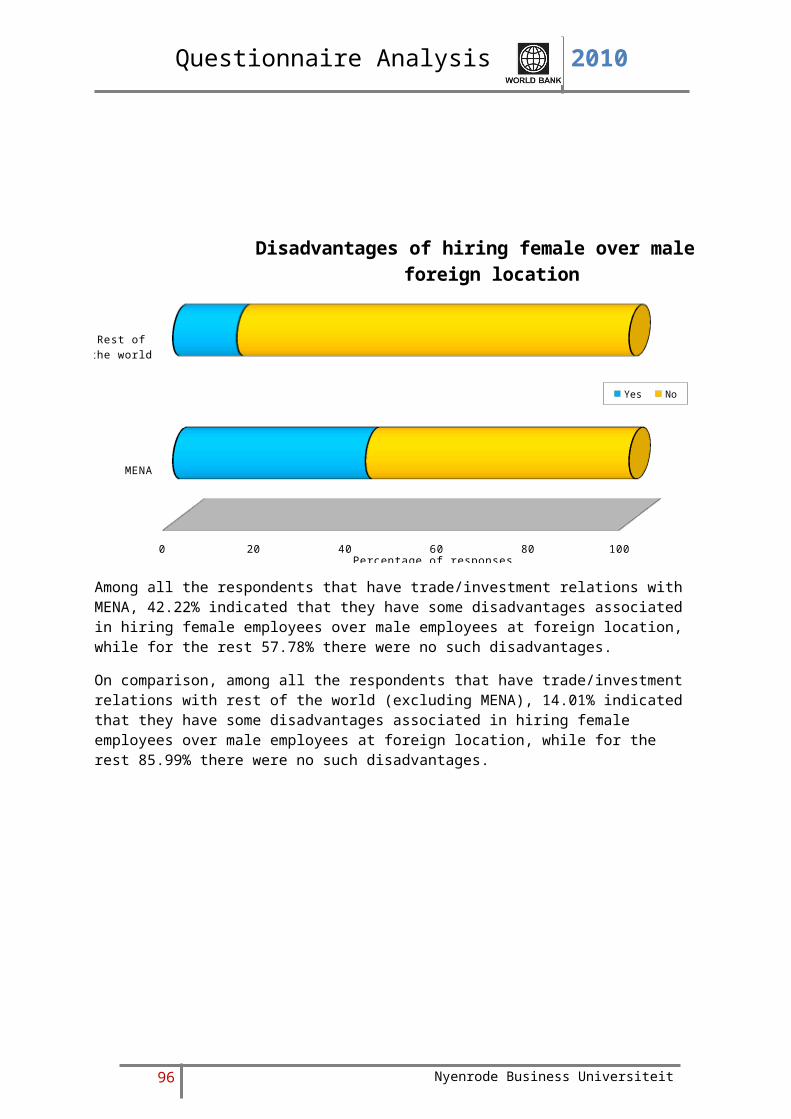
Questionnaire Analysis 2010
MENA
Rest of the world
0 10 20 30 40 50 60 70 80 90 100
Advantages of female employees at foreign location
They are more productive They are more trustworthy They are less absent
They are more accurate They are more dedicated At the same level of skills and education,females have a higher level of training
The cost of hiring a female is less They have better social skills They create better balance/gender diversity
No difference Meaningless Others
Percentage of responses
Among all the respondents that have trade/investment relations with MENA region and also indicated that there are advantages of hiring female employees over male employees at foreign location, majority of them (30.00%) indicated that female employees are more accurate, followed by 25.00% who indicated female employees are more trustworthy; 15.00% for whom female employees are more productive; another 15.00% for whom female employees are more dedicated; 10.00% for whom the cost of hiring female employees is less; and 5.00% who indicated that at the same level of skills and education, female employees have better training.In comparison, among all the respondents that have trade/investment relations with rest of the world (excluding MENA) and also indicate that there are advantages of hiring female employees over male employees at foreign location, 23.08% indicated that female employees are more trustworthy, followed by 19.94% who indicated female employees are more dedicated; 19.09% for whom female employees are more accurate; 17.09% for whom female employees are more productive; and 6.27% who indicated that at the same level of skills and education, female employees have better training.
96 Nyenrode Business Universiteit
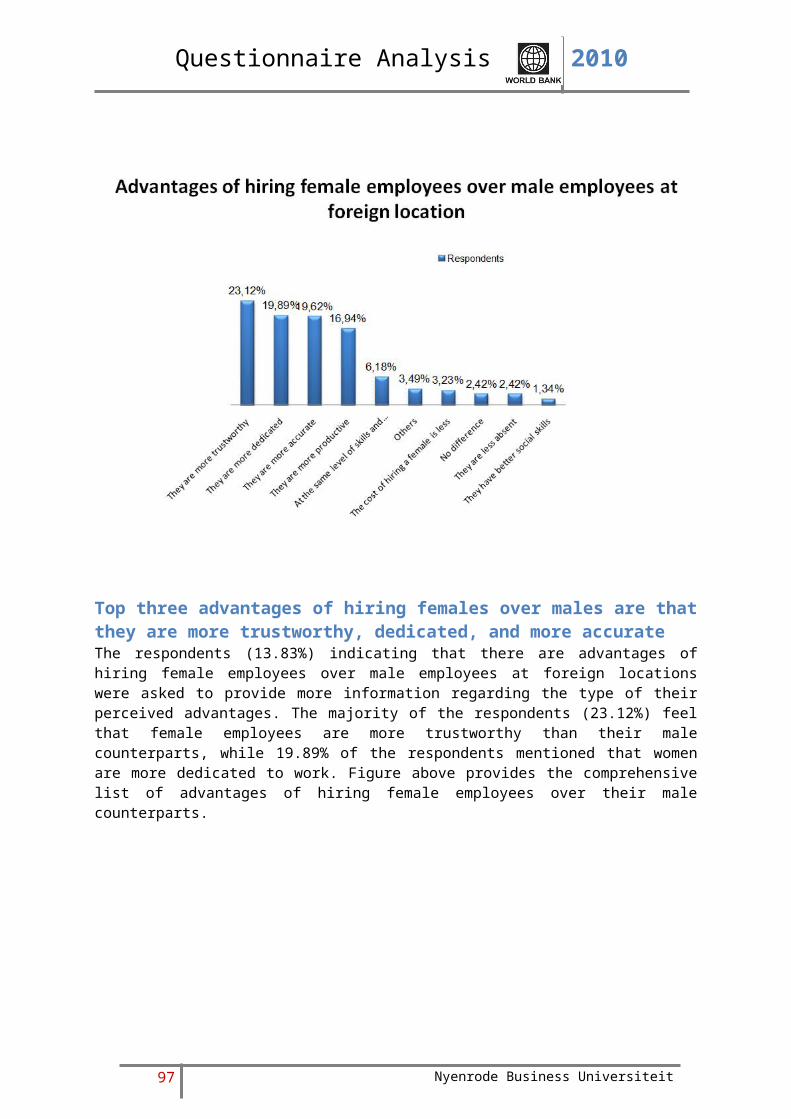
Questionnaire Analysis 2010
Others
Marriag
e and mate
rnity affect
their work
Home duties c
ould make them
less co
mmitted / less p
resent at
work
Exit fr
om work is h
igher,
thus they
cannot be re
lied upon for lo
ng perio
ds of re
tention
They can
not handle some h
ard profes
sions
They are
absen
t more o
ften
At the sa
me level
of skills
and educati
on, male
s have
a high
er leve
l of train
ing
They can
not be relied
on to work over
time
They are
less ac
curate
They are
less p
roductive
They are
less tr
ustworth
y
24%20% 20%
12%9%
5% 4% 3% 1% 1% 1%
Disadvantages of hiring female employees over male employees at foreign location
Those respondents who indicated that there are disadvantages of hiring female employees over male employees at foreign locations were asked to provide more information regarding the type of their perceived disadvantages. 19.81% mentioned that marriage and maternity affected the work of female employees. This was closely followed by 19.50% who mentioned that home duties made female employees less committed or less present at work; 12.07% who mentioned that exit from work is higher for female employees and hence they cannot be relied upon for long periods of retention; and 9.29% mentioned that female employees cannot handle some tough profession. Nevertheless there were 24.46% of respondents that indicated variety of other disadvantages in hiring female employees over male employees at foreign location.
97 Nyenrode Business Universiteit
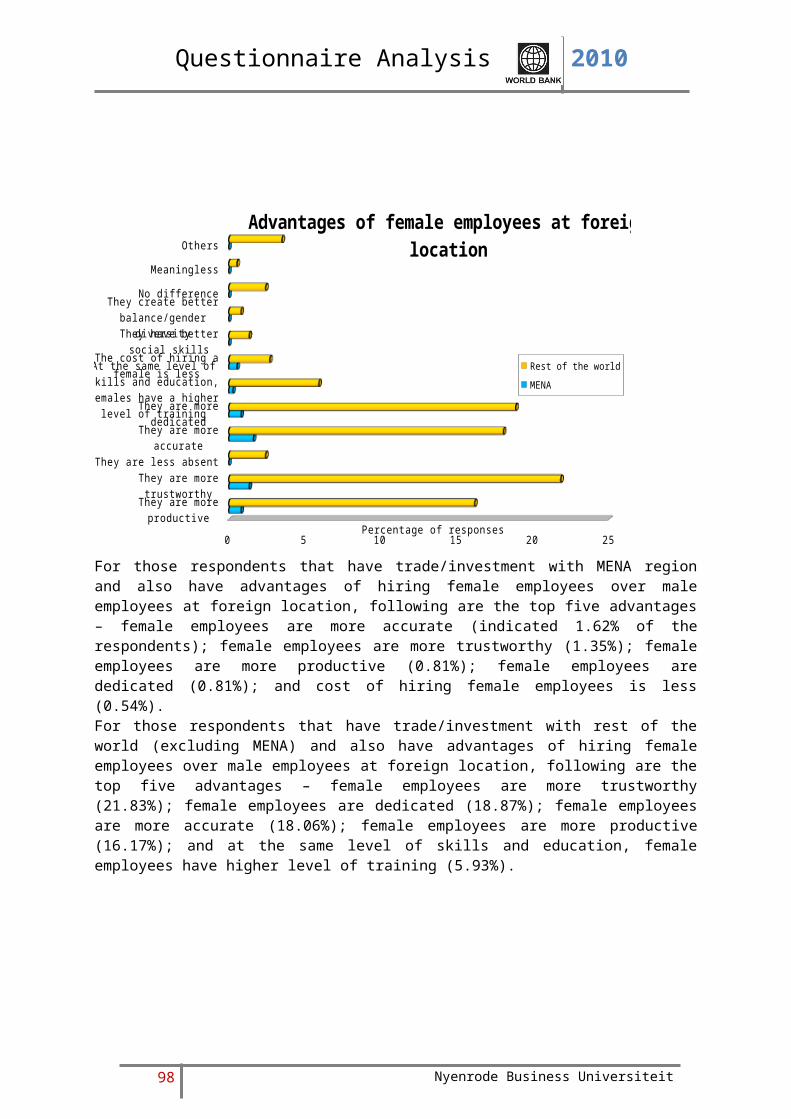
Questionnaire Analysis 2010
They are less productive
They are less trustworthy
They are absent more often
They are less accurate
Home duties could make themless committed / less present at work
At the same level of skills and educa-tion,
males have a higher level of training
Exit from work is higher, thus they cannot be relied upon for long periods
of retention
They cannot be relied on to work over-time
Marriage and maternity affect their work
They cannot handle some hard pro-fessions
Others
0 2 4 6 8 10 12 14 16 18 20
Disadvantages of female employees at foreign loca-tion
Rest of the world MENA
Percentage of responses
Among all the respondents that have trade/investment relations with rest of the world (excluding MENA), majority (18.27%) indicated that marriage and maternity affected the work of female employees followed by 17.03% who indicated that home duties made female employees less committed or present at work; 11.15% who indicated exit from work for female employees is higher and hence they cannot be relied upon for long periods of retention; and 8.67% who indicated female employees cannot handle some tough professions. Also there were 16.10% of respondents in this category who mentioned many other disadvantages that didn’t fit into one of the standard responses.
98 Nyenrode Business Universiteit
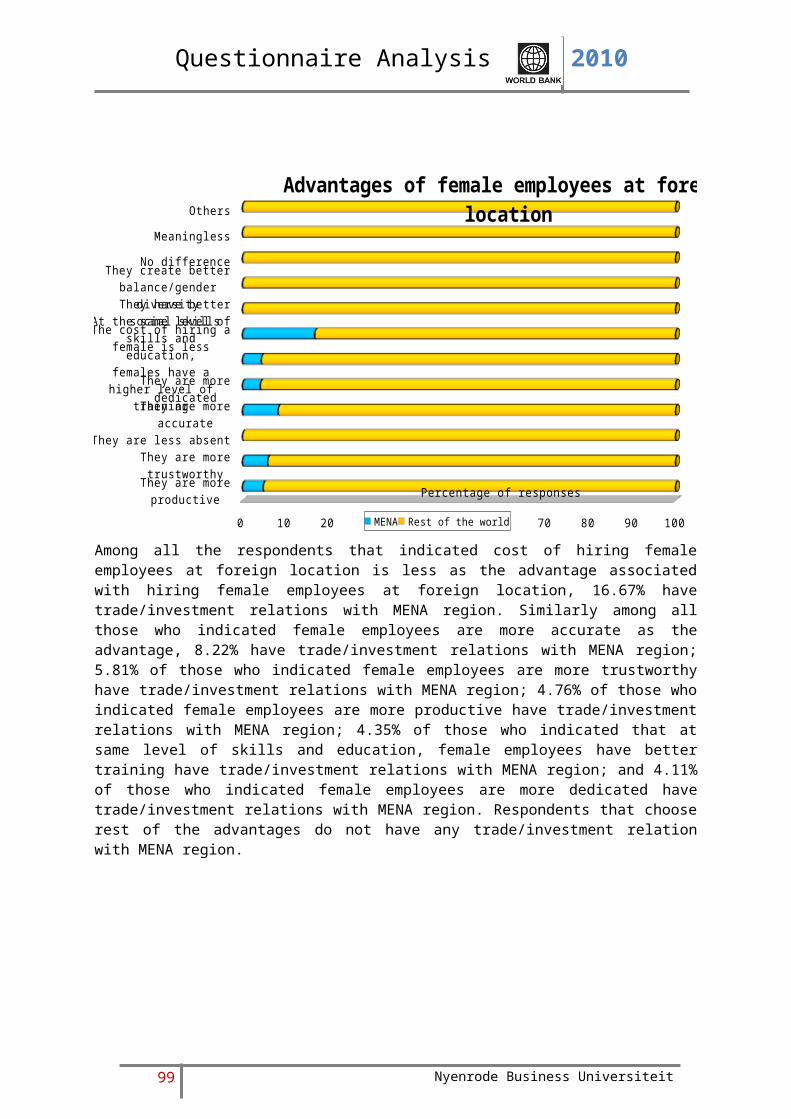
Questionnaire Analysis 2010
They are less productive
They are less trustworthy
They are absent more often
They are less accurate
Home duties could make themless committed / less present at work
At the same level of skills and educa-tion,
males have a higher level of training
Exit from work is higher, thus they cannot be relied
upon for long periods of retention
They cannot be relied on to work overtime
Marriage and maternity affect their work
They cannot handle some hard pro-fessions
Others
0 10 20 30 40 50 60 70 80 90 100
Disadvantages of female employees at foreign loca-tion
MENA Rest of the world
Percentage of responses
Among all the respondents that indicated female employees are less productive, 33.33% have trade/investment relations with MENA. Similarly 16.67% of all those that who indicated that at same level of skills and education male employees have higher levels of training also have trade/investment relations with MENA region; 12.70% of all those who indicated home duties made female less committed or less present at work, also have trade/investment relations with MENA region; and 9.09% of all those who indicated female employees cannot be relied on to work overtime, also have trade/investment relations with MENA. Additionally, 34.18% of all those who mentioned other (non-standard) disadvantages, also have trade/investment relations with MENA region.
99 Nyenrode Business Universiteit

Questionnaire Analysis 2010
MENA
Rest of the world
0 10 20 30 40 50 60 70 80 90 100
Disadvantages of female employees at foreign loca-tion
They are less productive They are less trustworthy They are absent more often
They are less accurate Home duties could make themless committed / less present at work
At the same level of skills and education,males have a higher level of training
Exit from work is higher, thus they cannot be relied upon for long periods of retention They cannot be relied on to work overtime Marriage and maternity affect their work
They cannot handle some hard professions Others
Percentage of responses
Among all the respondents that have trade/investment relations with MENA region and also mentioned that there are disadvantages in hiring female employees over male employees at foreign location, 16.00% indicated home duties made female employees less committed or less present at work; 10.00% indicated marriage and maternity affected the work of female employees; 6.00% indicated exit from work is higher for female employees and hence they cannot be relied upon for long periods of retention; 4.00% indicated that at same level of skills and education, male employees have higher level of training; and another 4.00% indicated that female employees cannot handle some tough professions. Also there were few respondents who didn’t choose one of the standard disadvantages. Instead they mentioned such disadvantages, which could not be classified into any of the standard ones nor could a new category be created as there weren’t sufficient responses of the same category. Hence they were classified as “other” and among them 54.00% had trade/investment relations with MENA region.In comparison, among all the respondents that have trade/investment relations with rest of the world (excluding MENA) and also mentioned that there are disadvantages in hiring female employees over male employees at foreign location, 21.61% indicated marriage and maternity affected the work of female employees; 20.15% indicated home duties made female employees less committed or less present at work; 19.05% mentioned other (various non-standard) disadvantages; 13.19% indicated exit from work is higher for female employees and hence they cannot be relied upon for long periods of retention; and 10.26% indicated that female employees cannot handle some tough professions.
100 Nyenrode Business Universiteit
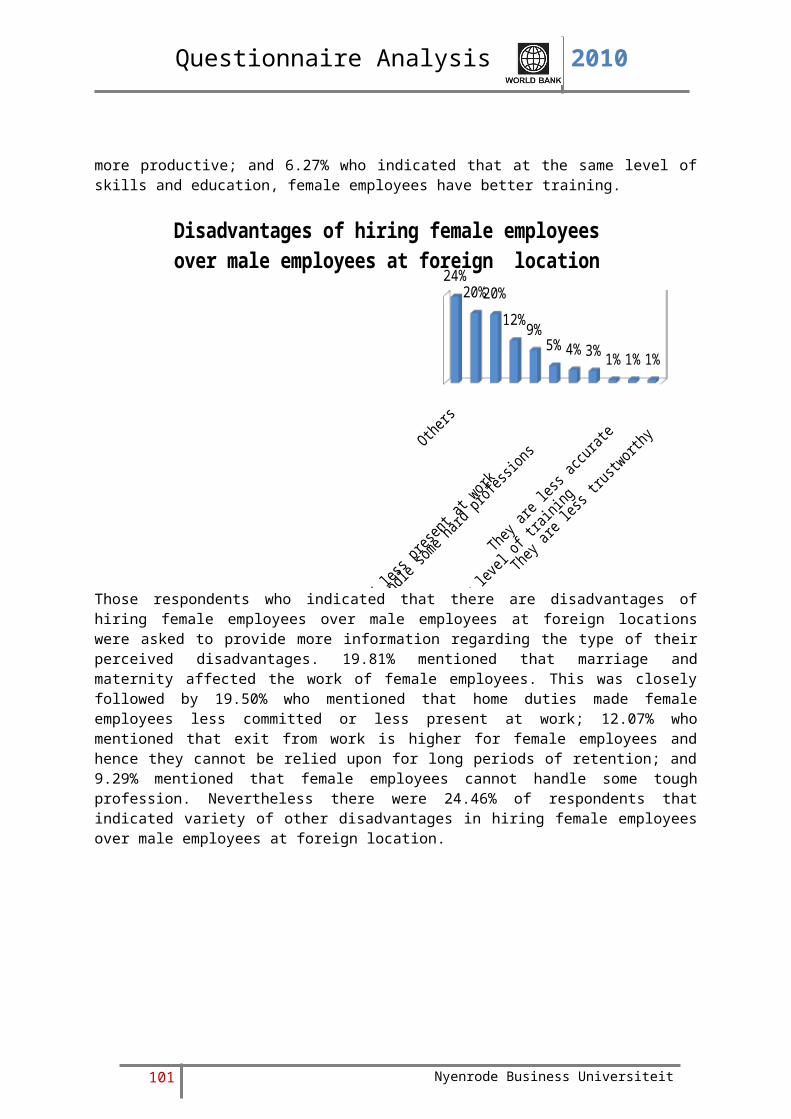
Questionnaire Analysis 2010
The top three for choosing foreign locations are access to market, business and/or personal relationship on the local market, and information on local market opportunitiesThe last section of the questionnaire is focused on the attractiveness of the foreign locations.
To begin with, the respondents were asked to select from a list of 23 parameters that are important for their organization used while deciding on a foreign location for establishing a trade or investment relationship. 16.73% of the respondents indicated Access to market as the important parameter closely followed by Business and/or personal relationship on the local market (16.36%), Information on local market opportunities (10.55%), and Labor costs (6.05%). Figure above provides a list of top ten reasons for choosing foreign location for establishing a trade or investment relationship.
101 Nyenrode Business Universiteit

Questionnaire Analysis 2010
Labor costsCosts (other than labor costs)
Labor productivityEducation and skills of employees
Education and skills of managementKnowledge and/or technology
Legislation and regulationsFinancial including tax advantages
(access to) market
Information on local market oppor-tunities
Business and/or personalrelationship on the local market
Local instruments aimed at strengthening
trade/foreign investment opportuni-ties
EU instruments aimed at strengthen-ing
trade/foreign investment relations with this country
Quality of products and/or servicesTransport and infrastructure
Basic suppliesGeographic proximity
Economic policyPolitical climate
CultureLanguageTime zone
Management of trade relationshipand/or foreign investment
0 2 4 6 8 10 12 14 16
Reasons for choosing foreign location
Rest of the world MENA
Percentage of responses
For majority (14.95%) of the respondents that have trade/investment relations with rest of the world (excluding MENA) access to market is the main reason for choosing a foreign location for new trade/investment relations. This is followed by 14.40% of respondents for whom business and/or personal relationship on the local market and 9.09% for whom information on local market opportunities are the reasons for choosing a foreign location for new trade/investment relations.
For those respondents that have trade/investment relations with MENA region, business and/or personal relationship on the local market (specified by 1.26% of the respondents); access to market (1.07%); and information on local market opportunities (1.00%) are the top reasons for choosing a foreign location for new trade/investment relations.
Clearly, top reasons for both categories of respondents are same, though not in the same order.
102 Nyenrode Business Universiteit

Questionnaire Analysis 2010
Labor costsCosts (other than labor costs)
Labor productivity
Education and skills of em-ployees
Education and skills of management
Knowledge and/or technologyLegislation and regulations
Financial including tax advan-tages
(access to) market
Information on local market opportunities
Business and/or personalrelationship on the local market
Local instruments aimed at strengthening
trade/foreign investment oppor-tunities
EU instruments aimed at strengthening
trade/foreign investment rela-tions with this country
Quality of products and/or services
Transport and infrastructureBasic supplies
Geographic proximityEconomic policyPolitical climate
CultureLanguageTime zone
Management of trade rela-tionship
and/or foreign investment
0 20 40 60 80 100
Reason for choosing foreign location
MENA Rest of the world
Percentage of responses
Among all the respondents that have indicated political climate as the reason for choosing a foreign location for new trade/investment relations, 23.68% have trade/investment relations with MENA region. Similarly, for those that indicted local instruments aimed at strengthening trade/foreign investment opportunities it is 15.87%; for financial including tax advantages it is 14.49%; for legislation and regulation it is 10.75%; and for basic supplies it is 9.09%.
103 Nyenrode Business Universiteit
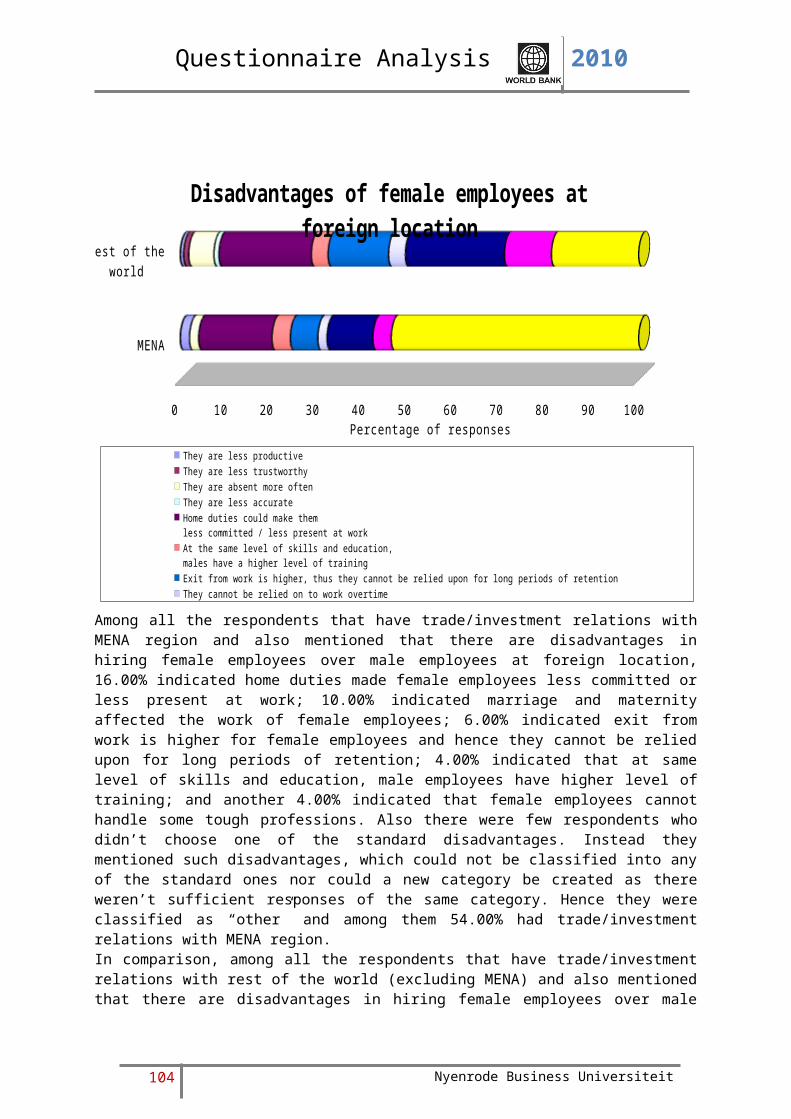
Questionnaire Analysis 2010
MENA
Rest of the world
0 10 20 30 40 50 60 70 80 90 100
Reason for choosing foreign location
Labor costs Costs (other than labor costs)Labor productivity Education and skills of employeesEducation and skills of management Knowledge and/or technologyLegislation and regulations Financial including tax advantages(access to) market Information on local market opportunitiesBusiness and/or personalrelationship on the local market
Local instruments aimed at strengtheningtrade/foreign investment opportunities
EU instruments aimed at strengtheningtrade/foreign investment relations with this country
Quality of products and/or services
Transport and infrastructure Basic suppliesGeographic proximity Economic policyPolitical climate CultureLanguage Time zone
Percentage of responses
Among all the respondents that have trade/investment relations with MENA region, for 18.39% access to market is the reason for choosing a foreign location for new trade/investment relations; for 13.79% it is business and/or personal relationship on the local market; for 12.64% it is information on local market opportunities.
Among all the respondents that have trade/investment relations with rest of the world (excluding MENA), for 16.67% business and/or personal relationship on the local market is the reason for choosing a foreign location for new trade/investment relations; for 14.44% its is information on local market opportunities; and for 12.22% it is access to market.
104 Nyenrode Business Universiteit
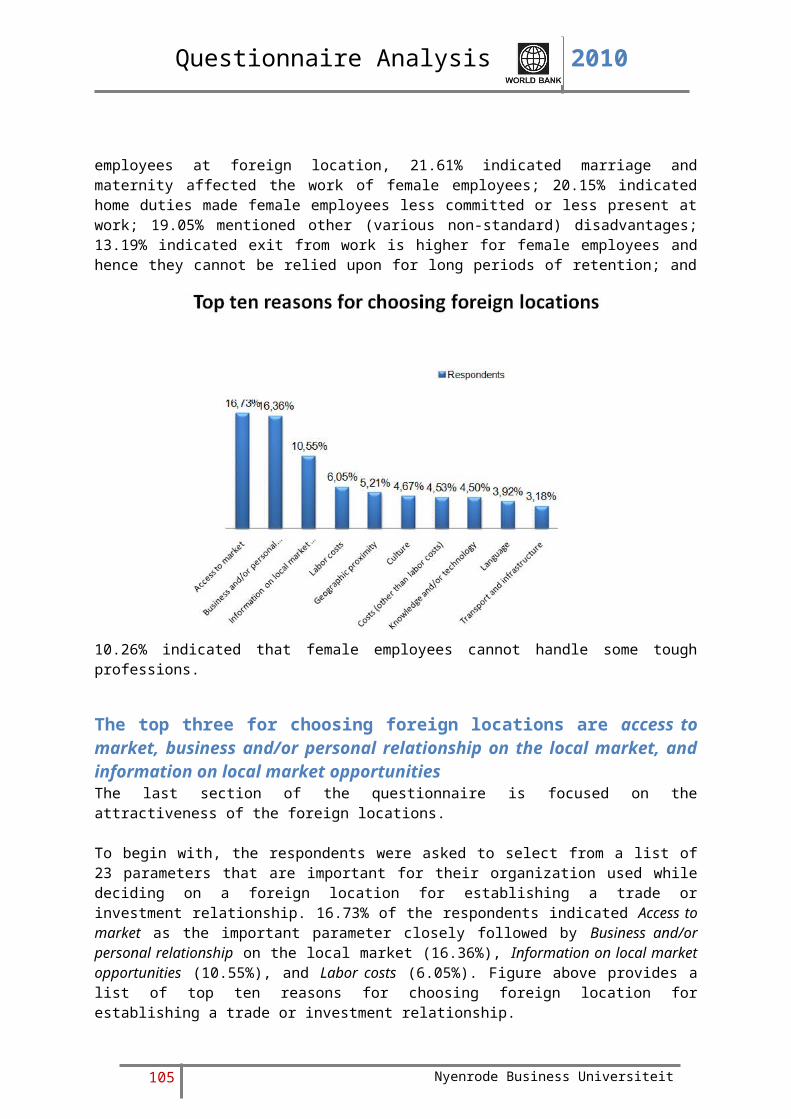
Questionnaire Analysis 2010
The top three barriers encountered at foreign locations are legislation and regulation, culture, and languageThe majority of respondents (14.00%) indicated Legislation and regulations as the barrier to their trade/investment relation at a foreign location, followed by 11.75% indicating Culture as the barrier. Figure above lists the top ten barriers experienced by companies regarding establishing trade or investment relations at foreign locations.
105 Nyenrode Business Universiteit
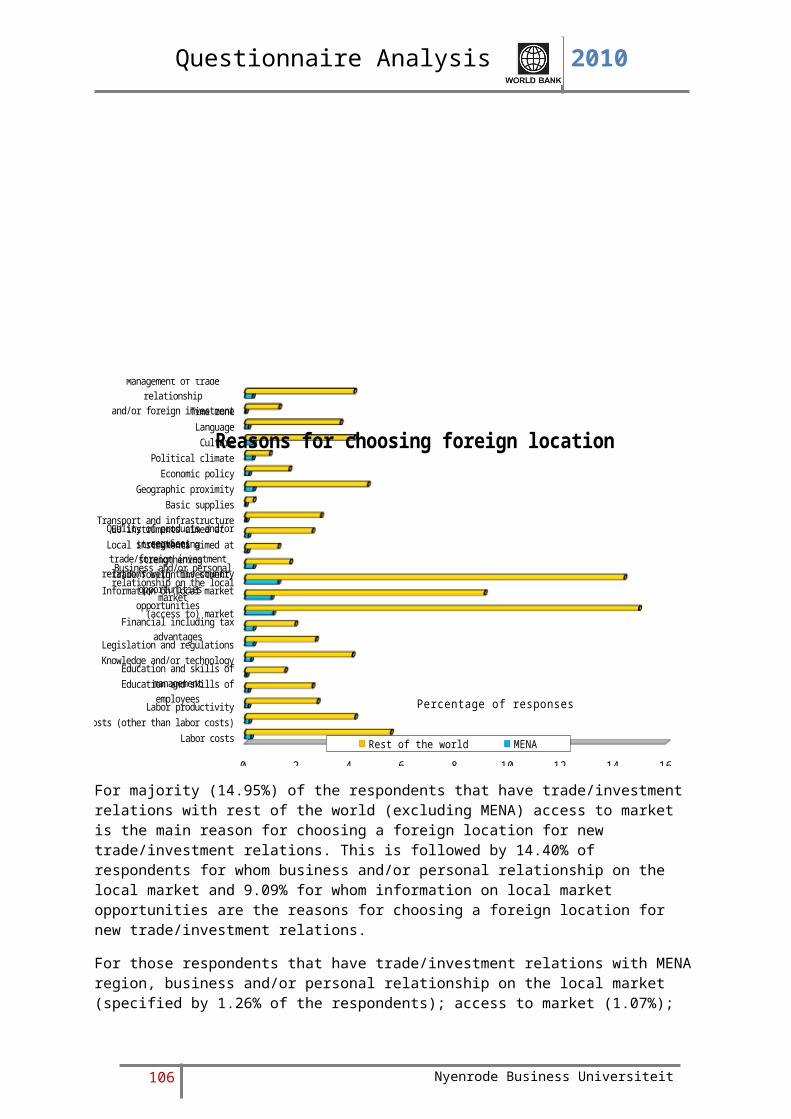
Questionnaire Analysis 2010
Labor costsCosts (other than labor costs)
Labor productivityEducation and skills of employees
Education and skills of managementKnowledge and/or technology
Legislation and regulationsFinancial including tax advantages
(access to) marketInformation on local market opportunities
Business and/or personalrelationship on the local market
Local instruments aimed at strengtheningtrade/foreign investment opportunities
EU instruments aimed at strengtheningtrade/foreign investment relations with this country
Quality of products and/or servicesTransport and infrastructure
Basic suppliesGeographic proximity
Economic policyPolitical climate
CultureLanguageTime zone
Management of trade relationshipand/or foreign investment
CorruptionConflict
Crime, theft and disorder
0 2 4 6 8 10 12 14
Barriers at foreign location
Rest of the world MENA Total
Percentage of responses
For respondents that have trade/investment relations with rest of the world (excluding MENA), the top three barriers at foreign location are – legislations and regulations (indicated by 12.85% of respondents); culture (10.87%); and language (7.38%). Similarly, for those who have trade/investment relations with MENA region these are – legislations and regulations (indicated by 1.13% of respondents); culture (0.85%); and education and skills of employees (0.53%).
106 Nyenrode Business Universiteit
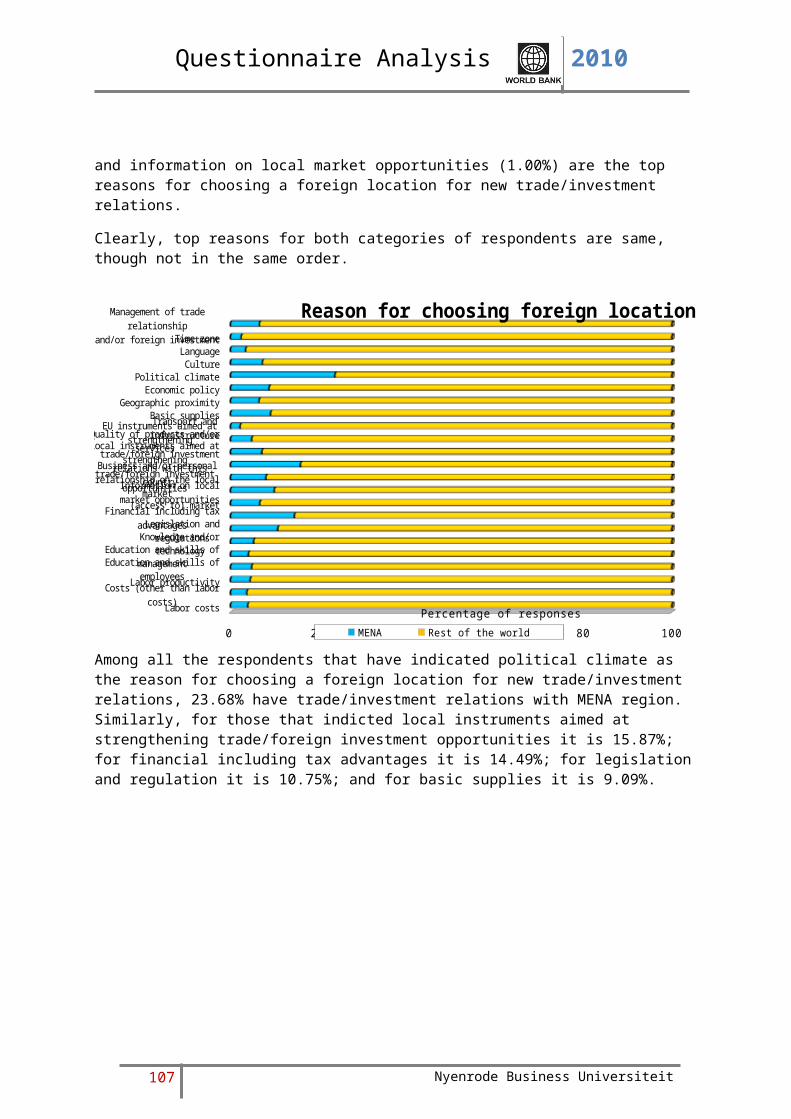
Questionnaire Analysis 2010
Labor costsCosts (other than labor costs)
Labor productivity
Education and skills of em-ployees
Education and skills of man-agement
Knowledge and/or technologyLegislation and regulations
Financial including tax advan-tages
(access to) market
Information on local market opportunities
Business and/or personalrelationship on the local market
Local instruments aimed at strengthening
trade/foreign investment oppor-tunities
EU instruments aimed at strengthening
trade/foreign investment rela-tions with this country
Quality of products and/or services
Transport and infrastructureBasic supplies
Geographic proximityEconomic policyPolitical climate
CultureLanguageTime zone
Management of trade rela-tionship
and/or foreign investment
CorruptionConflict
Crime, theft and disorder
0 20 40 60 80 100 120
Barriers at foreign location
MENA Total Rest of the world
Percentage of responses
Among all the respondents that indicated education and skills of employees as the barrier at foreign location, 13.64% have trade/investment relations with MENA. The figures are 10.67%, 10.64%, 9.33%, 8.82%, and 8.43% respectively for education and skills of management, knowledge and/or technology, management of trade relationship and/or foreign investment, conflict, and business and/or personal relationship on the local market.
107 Nyenrode Business Universiteit
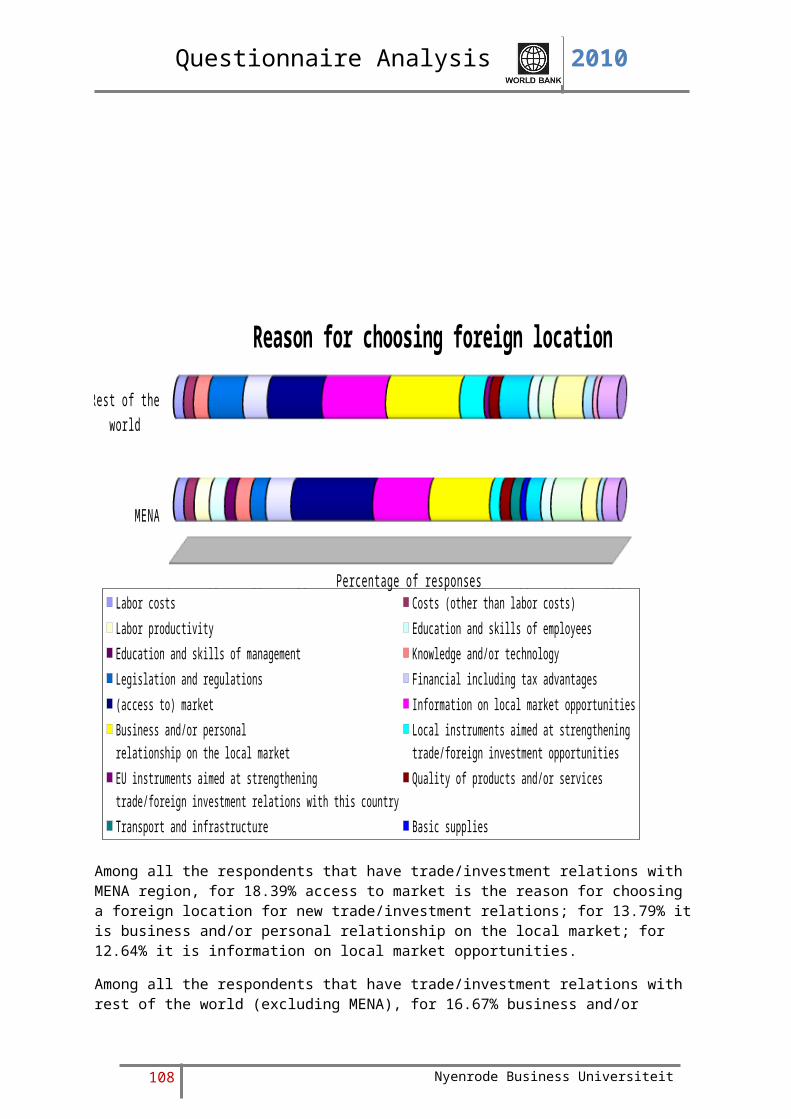
Questionnaire Analysis 2010
MENA Total
Rest of the world
0 20 40 60 80 100
Barriers at foreign location
Labor costs Costs (other than labor costs)Labor productivity Education and skills of employeesEducation and skills of management Knowledge and/or technologyLegislation and regulations Financial including tax advantages(access to) market Information on local market opportunitiesBusiness and/or personalrelationship on the local market
Local instruments aimed at strengtheningtrade/foreign investment opportunities
EU instruments aimed at strengtheningtrade/foreign investment relations with this country
Quality of products and/or services
Transport and infrastructure Basic suppliesGeographic proximity Economic policyPolitical climate CultureLanguage Time zone
Percentage of responses
For most of the respondents that have trade/investment relations with MENA region (17.78%) legislations and regulations are barriers for business in the region, followed by 13.33% for whom culture is the barrier, and 8.33% for whom education and skills of employees are barriers for doing business in the region.On the other hand, for those who have trade/investment relations with rest of the world (excluding MENA) the barriers for business are – legislations and regulations (13.72%), culture (11.61%), and language (7.88%).
108 Nyenrode Business Universiteit

Questionnaire Analysis 2010
Almost 60% is satisfied with their choice for foreign locationsFurther, a small percentage (3.26%) of the respondents indicated that they are not satisfied with their choice for a specific foreign location against 96.74% of respondents who indicated that they are at least somewhat satisfied with their choice. Among the 96.74% of the respondents, 58.23% indicated that they were satisfied with their choice for a foreign location, 19.30% indicated that they are very satisfied, followed by 19.21% who are somewhat satisfied with their choice.
109 Nyenrode Business Universiteit

Questionnaire Analysis 2010
Not satisfied
Somewhat sat-isfied
Satisfied
Very satisfied
0 10 20 30 40 50 60
Satisfaction at foreign location
Rest of the worldMENA
Percentage of responses
Among all the respondents 54.38% informed that they have trade/investment relations with rest of the world (excluding MENA) and are satisfied with their choice of foreign location, while 17.96% of respondents of same category are very satisfied, and 17.78% are somewhat satisfied. Nevertheless, there are 3.09% of respondents who have trade/investment relations with rest of the world (excluding MENA) who mentioned they are not satisfied with their choice of foreign location for trade/investment.In comparison, 3.78% informed that they have trade/investment relations with MENA region and are satisfied with their choice of foreign location, while 1.46% of respondents of same category are somewhat satisfied, and 1.37% are very satisfied. Nevertheless, there are 0.17% of respondents who have trade/investment relations with rest of the world (excluding MENA) who mentioned they are not satisfied with their choice of foreign location for trade/investment.
110 Nyenrode Business Universiteit
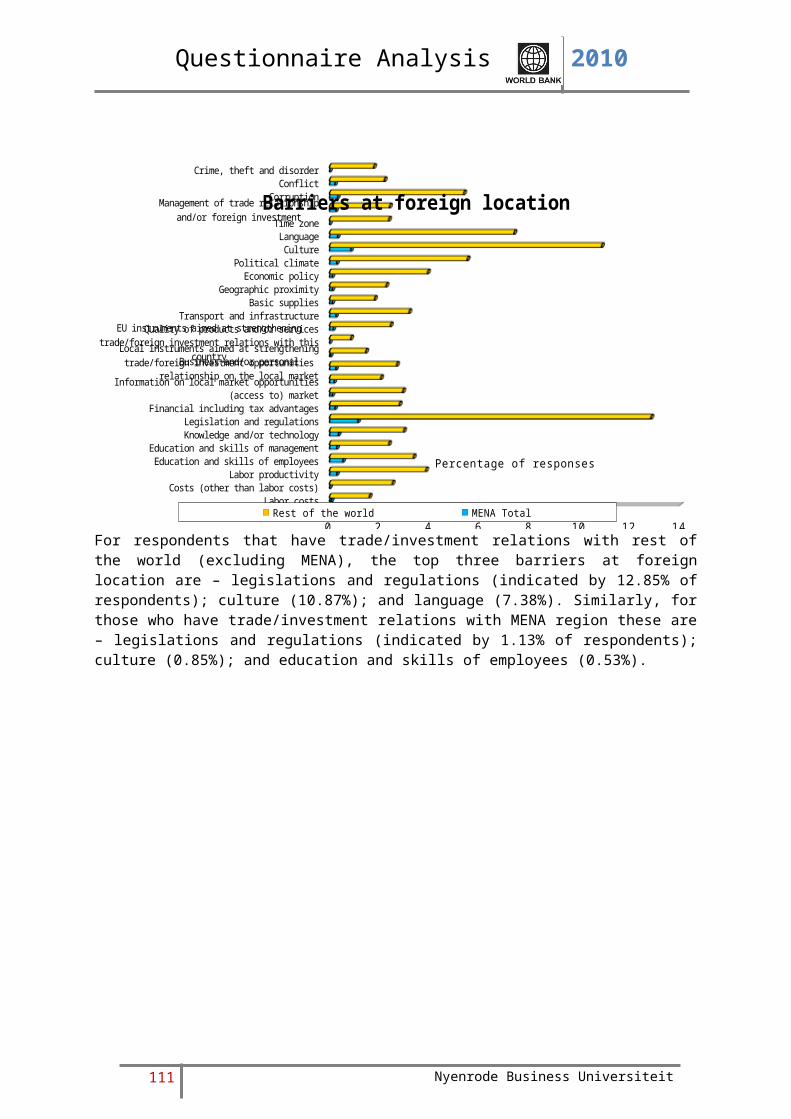
Questionnaire Analysis 2010
Not satisfied
Somewhat sat-isfied
Satisfied
Very satisfied
0 20 40 60 80 100
Satisfaction at foreign location
MENARest of the world
Percentage of responses
Among all the respondents that are very satisfied with their choice of foreign location for trade/investment relations, 7.11% have trade/investment relations with MENA region. The figures for other categories are 6.50%, 7.59%, and 5.26% respectively for those who are satisfied, somewhat satisfied, and not satisfied.
111 Nyenrode Business Universiteit
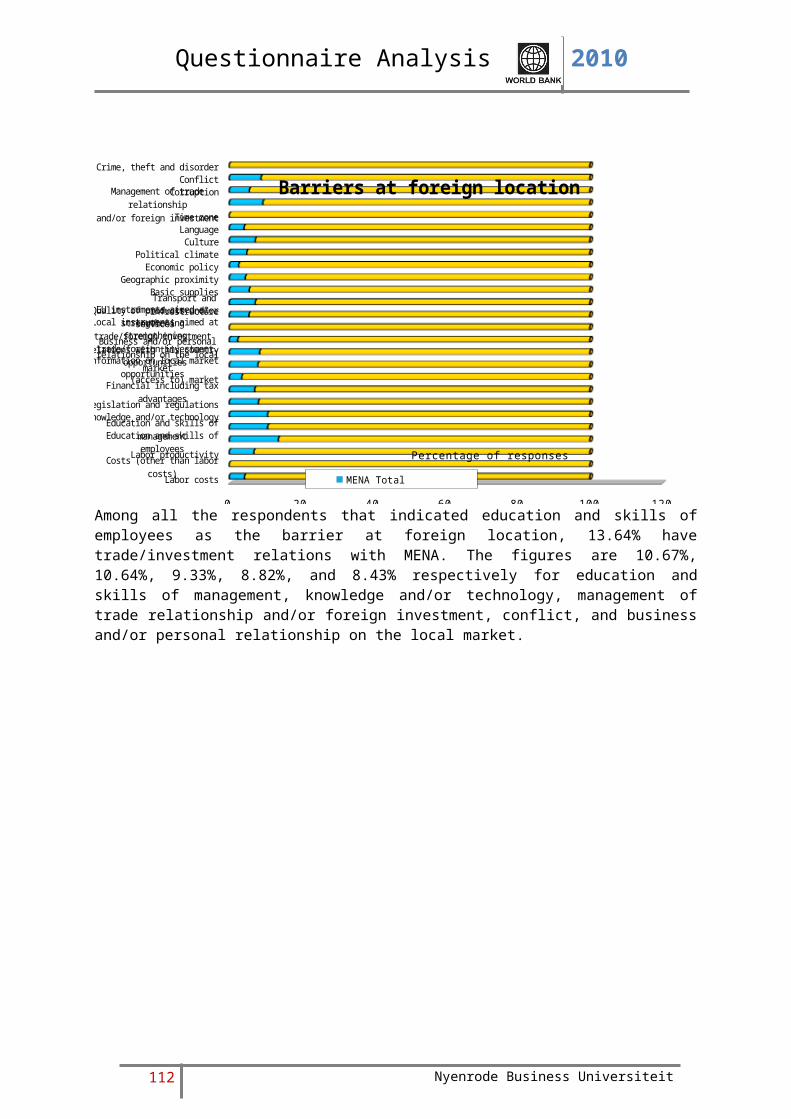
Questionnaire Analysis 2010
MENA
Rest of the world
0 20 40 60 80 100
Satisfaction at foreign location
Not satisfied
Somewhat satisfied
Satisfied
Very satisfied
Percentage of responsesAmong all the respondents that have trade/investment relations with MENA region, 20.25% are very satisfied with their choice of foreign location for trade/investment relations; 55.70% are satisfied; 21.52% are somewhat satisfied; while 2.53% are not satisfied.This pattern matches the responses of those who have trade/investment relations with rest of the world (excluding MENA) – 19.26% are very satisfied; 58.34% are satisfied; 19.08% are somewhat satisfied; and 3.32% are not satisfied with their choice of foreign location for trade/investment relations.
112 Nyenrode Business Universiteit
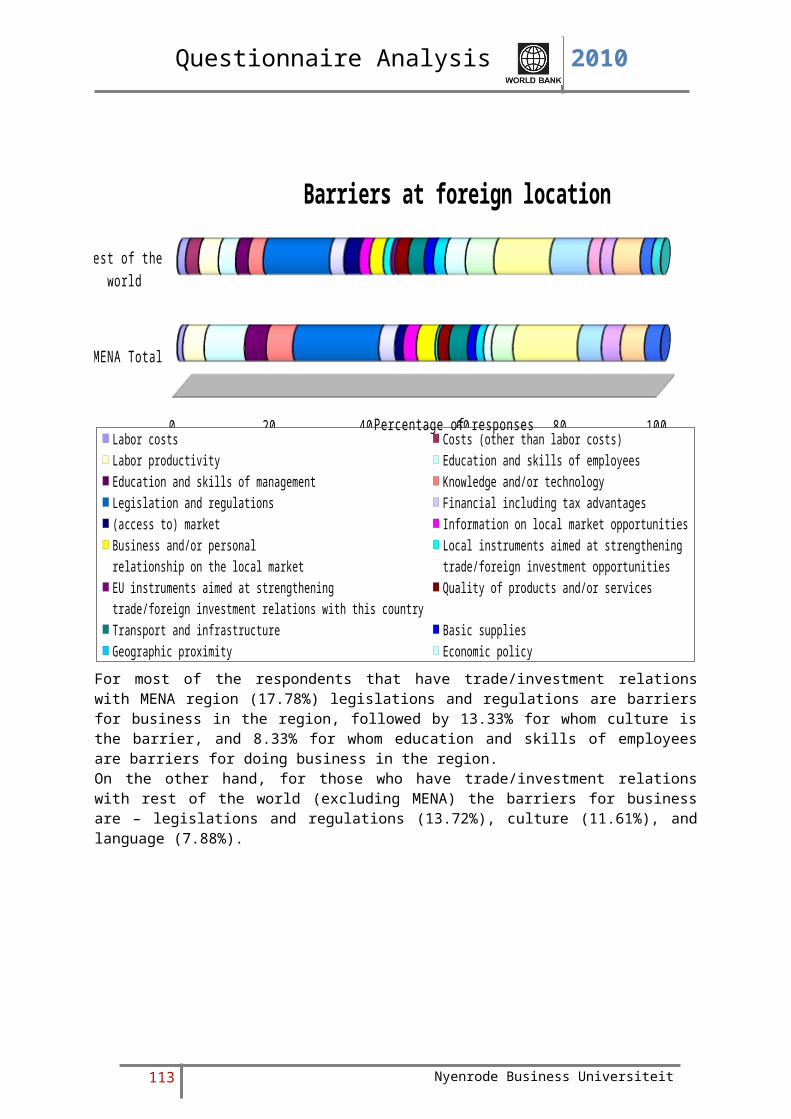
Questionnaire Analysis 2010
Top three foreign locations for trade/investment are China, India, and RussiaIn order to assess the attractiveness of foreign locations to establish new trade/investment relations, the respondents were asked to select from a list of 88 countries the one that is most attractive. China topped the list with 10.09% of the respondents opting for it. China is followed by India with (7.89%), Russia (6.80%), and Brazil (5.48%). Clearly, BRIC countries are the most preferred locations for establishing new trade/investment relations. Figure above lists the top ten foreign locations chosen by the respondents.
113 Nyenrode Business Universiteit
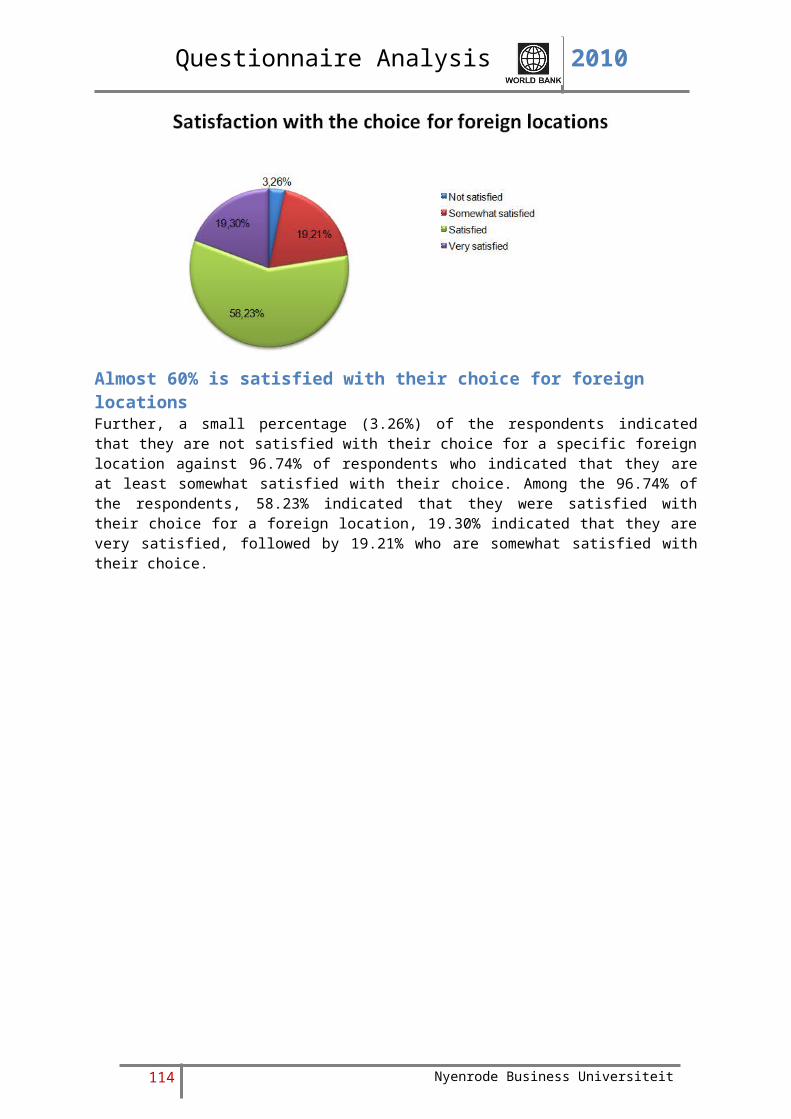
Questionnaire Analysis 2010
On segregating the preferred locations to establish new trade/investment relations, it is found that 7.24% of responses were for MENA region against 92.76% that were for rest of the world (excluding MENA).
The top three reasons for establishing new relationships are access to market, information on local market opportunities, and business and/or personal relationship on the local market Next, the respondents were asked to indicate why the previous mentioned foreign locations were attractive for their organizations. In their response, 15.47% referred to Access to the market, while 11.24% of the respondents choose to establish new trade/investment in order to obtain information on the local market opportunities. Business/personal relationship the respondent organizations have on the local market influenced 10.40% of the respondents to establish new trade/investment relations in the region and the attractive labor costs attracted 6,85% of the respondents. Figure above provides the list of top ten reasons choosing the new foreign location to establish trade/investment relation.
114 Nyenrode Business Universiteit
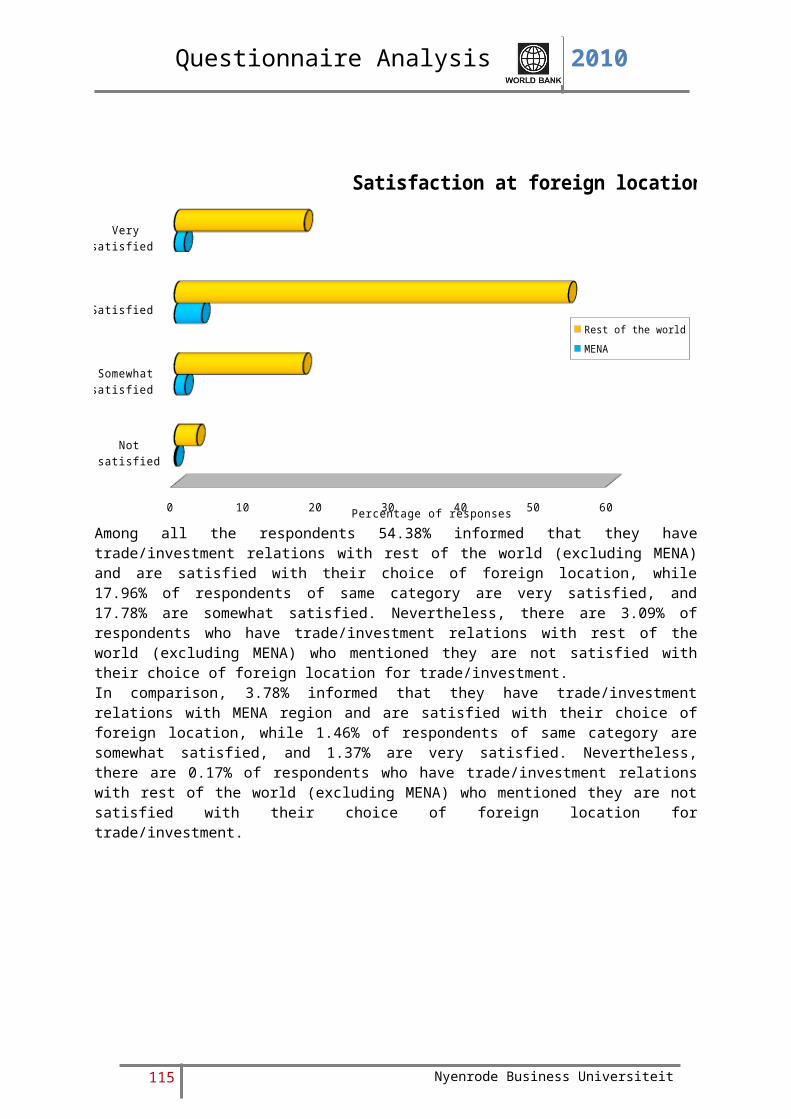
Questionnaire Analysis 2010
Labor costsCosts (other than labor costs)
Labor productivityEducation and skills of employees
Education and skills of managementKnowledge and/or technology
Legislation and regulationsFinancial including tax advantages
(access to) marketInformation on local market opportunities
Business and/or personalrelationship on the local market
Local instruments aimed at strengtheningtrade/foreign investment opportunities
EU instruments aimed at strengtheningtrade/foreign investment relations with this
country
Quality of products and/or servicesTransport and infrastructure
Basic suppliesGeographic proximity
Economic policyPolitical climate
CultureLanguageTime zone
Management of trade relationshipand/or foreign investment
0 2 4 6 8 10 12 14 16
Reason for choosing new foreign location
Rest of the world MENA
Percentage of responses
Those respondents that wish to establish new trade/investment relations with MENA and also with rest of the world (excluding MENA) have indicated access to market, information on local business opportunities, and business and/or personal relationship on local market are the top three reasons for choosing a new foreign location. The figures are respectively 14.29%, 10.40%, and 9.72% for those who wish to establish new trade/investment relations with rest of the world (excluding MENA) and 1.18%, 0.85%, and 0.68% for those who wish to establish new trade/investment relations with MENA.
115 Nyenrode Business Universiteit

Questionnaire Analysis 2010
Labor costs
Costs (other than labor costs)
Labor productivity
Education and skills of employees
Education and skills of management
Knowledge and/or tech-nology
Legislation and regulations
Financial including tax advantages
(access to) market
Information on local market opportunities
Business and/or personalrelationship on the local
market
Local instruments aimed at strengthening
trade/foreign investment opportunities
EU instruments aimed at strengthening
trade/foreign investment re-lations with this country
Quality of products and/or services
Transport and infrastruc-ture
Basic suppliesGeographic proximity
Economic policyPolitical climate
CultureLanguage
Time zone
Management of trade rela-tionship
and/or foreign investment
0 20 40 60 80 100
Reason for choosing new foreign location
MENA Rest of the world
Percentage of responses
Among those respondents that indicated financial including tax advantages as the reason to establish new trade/investment relations, 17.39% wish to do so with MENA region. The figures for rest of the category are – 9.52% for local instruments aimed at strengthening trade/foreign investment opportunities; 7.69% for transport and infrastructure; 7.65% for access to market; and 7.52% for information on local market opportunities. Therefore those who seek financial and tax advantages, are most inclined to trade/invest in MENA region.
116 Nyenrode Business Universiteit
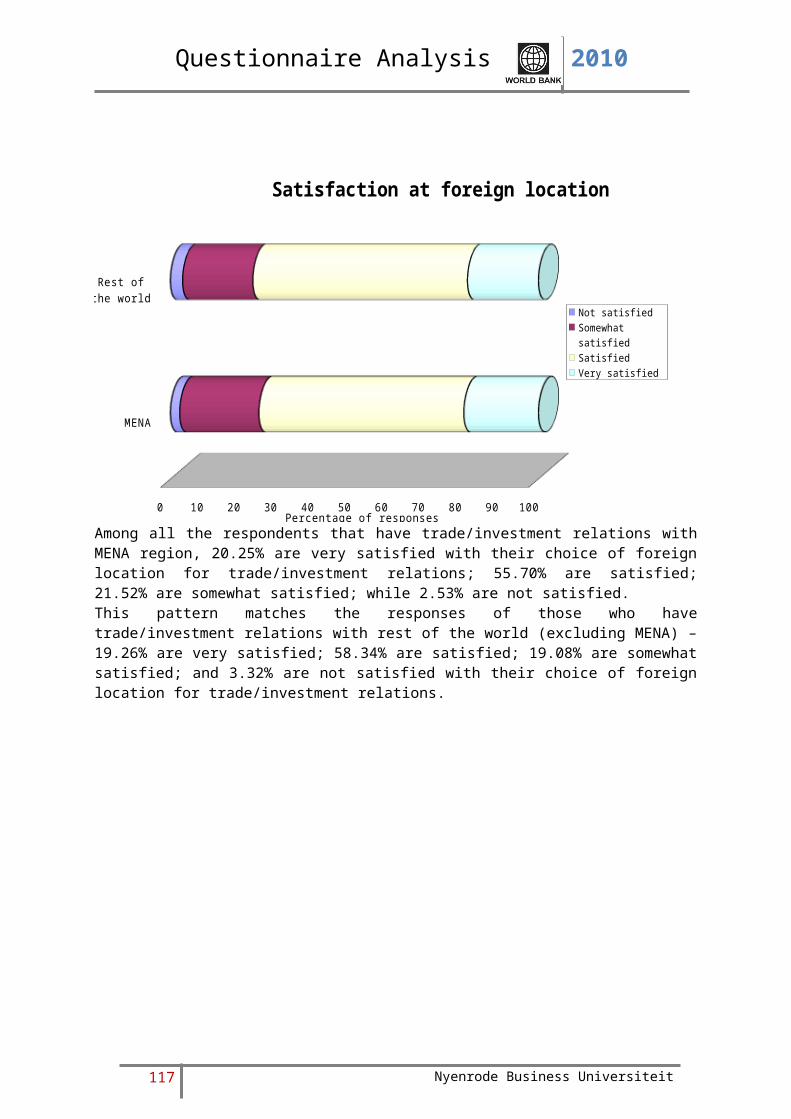
Questionnaire Analysis 2010
MENA
Rest of the world
0 20 40 60 80 100
Reason for choosing new foreign location
Labor costs Costs (other than labor costs)Labor productivity Education and skills of employeesEducation and skills of management Knowledge and/or technologyLegislation and regulations Financial including tax advantages(access to) market Information on local market opportunitiesBusiness and/or personalrelationship on the local market
Local instruments aimed at strengtheningtrade/foreign investment opportunities
EU instruments aimed at strengtheningtrade/foreign investment relations with this country
Quality of products and/or services
Transport and infrastructure Basic suppliesGeographic proximity Economic policyPolitical climate CultureLanguage Time zone
Percentage of responses
Among all the respondents that wish to establish trade/investment relations with MENA, most (25.45%) intend to do so in order to access the MENA market, followed by 18.18% due to information on local market opportunities; and 14.55% due to business and/or personal relationship on the local market.Among all the respondents that wish to establish trade/investment relations with rest of the world (excluding MENA), most (14.98%) intend to do so in order to access new markets, followed by 10.90% due to information on local market opportunities; and 10.20% due to business and/or personal relationship on the local market.
117 Nyenrode Business Universiteit
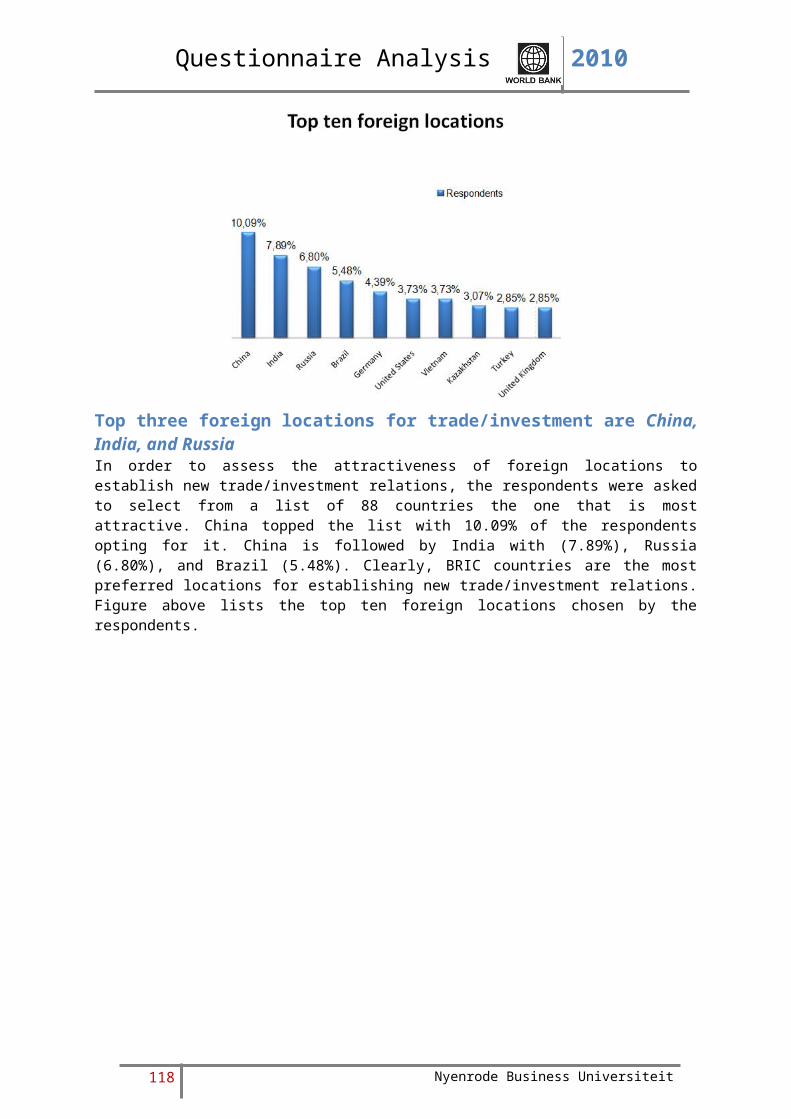
Questionnaire Analysis 2010
The top three reasons to not invest in MENA region are political climate, culture, and access to marketThose respondents that do not have any investment nor have any plans to establish new trade/investment relations in MENA region have been asked to specify the reason for their decision to stay away from MENA region.66.57% of the respondents neither have made investments nor have any plans to establish any new trade/investment in MENA region. Of these respondents, 12.52% indicated that the political climate of MENA region is not conducive to establish trade/investment relations. 11.99% mentioned the difference in culture as the reason for their organization to stay away from MENA region. Figure above provides the list of top ten reasons specified by organization for not have any trade/investment relations with MENA region.
118 Nyenrode Business Universiteit