r. steven pappas hhs public access a mark r. fresquez
TRANSCRIPT

Toxic Metal Concentrations in Mainstream Smoke from Cigarettes Available in the USA
R. Steven Pappasa, Mark R. Fresquezb, Naudia Martonea, and Clifford H. Watsona
R. Steven Pappas: [email protected] for Disease Control & Prevention, National Center for Environmental Health, Division of Laboratory Sciences, Tobacco and Volatiles Branch, 4770 Buford Hwy NE Mail Stop F44, Atlanta GA 30341-3717, U.S.A.
bBattelle – Atlanta Analytical Services, Atlanta, GA, U.S.A.
Abstract
Public health officials and leaders of 168 nations have signaled their concern regarding the health
and economic impacts of smoking by becoming signatory parties to the World Health
Organization Framework Convention on Tobacco Control (FCTC). One of FCTC’s purposes is to
help achieve meaningful regulation for tobacco products in order to decrease the exposure to
harmful and potentially harmful constituents (HPHCs) delivered to users and those who are
exposed to secondhand smoke. Determining baseline delivery ranges for HPHCs in modern
commercial tobacco products is crucial information regulators could use to make informed
decisions.
Establishing mainstream smoke delivery concentration ranges for toxic metals was conducted
through analyses of total particulate matter (TPM) collected with smoking machines using
standard smoking regimens.
We developed a rapid analytical method with microwave digestion of TPM samples obtained with
smoking machines using electrostatic precipitation under the ISO and Intense smoking regimens.
Digested samples are analyzed for chromium, manganese, cobalt, nickel, arsenic, cadmium, and
lead using inductively coupled plasma-mass spectrometry. This method provides data obtained
using the ISO smoking regimen for comparability with previous studies as well as an Intense
smoking regimen that represents deliveries that fall within the range of human exposure levels to
toxic metals.
Keywords
cigarette smoke; metals; cadmium; arsenic
Correspondence to: R. Steven Pappas, [email protected].
DisclaimerThe findings and conclusions in this report are those of the authors and do not necessarily represent the views of the Centers for Disease Control and Prevention.
HHS Public AccessAuthor manuscriptJ Anal Toxicol. Author manuscript; available in PMC 2015 August 18.
Published in final edited form as:J Anal Toxicol. 2014 May ; 38(4): 204–211. doi:10.1093/jat/bku013.
Author M
anuscriptA
uthor Manuscript
Author M
anuscriptA
uthor Manuscript

Introduction
The proportion of smokers in the US has decreased over the last forty years, though the
number appears to have leveled off at approximately 19% of the adult population.1,2
However, it is projected that total worldwide deaths from all smoking attributable diseases
will increase from 5.4 million in 2004 to 8.3 million in 2030, reaching almost 10% of all
deaths. Chronic obstructive pulmonary disease (COPD) alone is forecast to become the third
leading cause of death worldwide by 2030, predominantly due to projected increases in
smoking in developing countries.3
The initiation and progression of disease as a consequence of smoking may be attributed to
the combined pathological impacts of more than 7,000 substances found in the complex
tobacco smoke mixture. Due to the complexity involved in attempting to assess the
individual contributions of these substances to the health risk from smoking, health risk
estimates are generally based on the potential for exposures to multiple individual
constituents or classes of constituents found in the smoke.4 Fowles and Dybing broached the
difficult task of assessing carcinogenic health risk from exposure to the substances found in
tobacco smoke.5 They assessed cancer risk indices from exposure to 40 substances for
which cancer potency factors were available on an individual basis. They calculated
cumulative lifetime exposure based on reports of average concentrations of toxicant
transported in smoke per cigarette. They further assessed the additive risk from the
substances as classes of toxic chemicals. Among the substances which contributed to the
cancer risk from inhaling tobacco smoke are the toxic metals arsenic, beryllium, cadmium,
chromium (VI), nickel (International Agency for Research on Cancer (IARC) group 1
carcinogens), and lead (IARC group 2A carcinogen). Burns et al. also considered assessing
health risk due to exposure to substances in smoke as a basis for product regulation, but they
based their calculations on toxicant delivery per mg of nicotine in smoke instead of per
cigarette.6 This provided justification and rationale for a regulation proposal by the WHO
Study Group on Tobacco Product Regulation (TobReg) to lower toxicants in cigarette
smoke. They also discussed the current scientific consensus that the International
Organization for Standardization (ISO) smoking machine regimen (2000, 35 mL puff
volume, 1 puff per minute, no ventilation blocking) is unsatisfactory for providing valid
estimates of human exposure and for purposes of product regulation, as did Hammond et
al.6,7 Since much of the data available for calculating cancer risk indices were obtained
using the ISO smoking regimen, Fowles and Dybing concluded that the cancer risk indices
underestimate the observed cancer rates by about fivefold when using ISO yields in the
exposure estimate.5 Their conclusion is in agreement with the consensus statements of
Burns et al.5,6
In addition to cancer risks, toxic metals may contribute to non-cancer health risks such as
cardiovascular disease8–10 and diseases such as COPD and smoking related interstitial lung
disease that are characterized by sensitization, chronic inflammation, or tissue
remodeling.11–14 Fowles and Dybing calculated risk indices for the exposure to toxic
substances in tobacco smoke that cause known non-cancer respiratory and cardiovascular
health effects.5 However, they pointed out that the magnitude of non-cancer risks were
underestimated due to gaps in dose-response information and corresponding definitive
Pappas et al. Page 2
J Anal Toxicol. Author manuscript; available in PMC 2015 August 18.
Author M
anuscriptA
uthor Manuscript
Author M
anuscriptA
uthor Manuscript

threshold values from authoritative sources for many substances in smoke. The risk
estimates were probably underestimated to an even greater degree due to the fact that much
of the data available on which to base exposure was obtained from analyses of mainstream
smoke collected using the ISO smoking machine regimen as previously mentioned.
In order to address the need for more data on toxic substances in smoke, information
generated with smoking regimens that more closely approximate human exposure levels is
important to fill these information gaps. Generally, TPM is collected from cigarettes that
have been prepared under ISO 3402 (ISO 1999) conditions and smoked using the standard
ISO smoking machine regimen (ISO 3308 and ISO 4387) or Health Canada Intense regimen
(55 mL puff volume, 2 puffs per minute).15–18 Analyses of TPM obtained from cigarettes
that are conditioned and smoked according to the same standards can be used for comparing
harmful and potentially harmful constituent (HPHC) deliveries from different brands of
cigarettes and for establishing meaningful reference ranges for comparing relative smoke
toxicant deliveries. However, the results obtained using standard regimens should not be
misconstrued as absolutely representing all individual exposures from smoking, since the
smoking habits differ for every individual.6,7
Here, we describe the development of a streamlined approach for analyzing tobacco smoke
particulate for select toxic metals to determine the amounts of these metals (sensitizing
agents, inflammatory agents, and carcinogens) that are transported in the mainstream smoke
particulate matter from popular U.S. domestic cigarette brands.
Experimental
TPM Samples
Fifty cigarette brand varieties were purchased in 2011 from retail outlets in the greater
metropolitan Atlanta area in Georgia, USA. Sampling was according to a geographical
convenience plan, not necessarily intended for the purpose of establishing a nationwide
market comparison. The samples were assigned unique identification numbers and logged
into a database. Samples were stored in their original packaging until needed. Only
authorized personnel had access to the samples.
Cigarettes were conditioned prior to smoking at 22 ± 2 °C and 60 ± 5 % relative humidity
for a minimum of 48 hours, according to ISO method 3402.16 Smoking conditions (i.e., puff
profile, volume, duration and frequency, air flow, etc.) were selected in the Borgwaldt
RM20H rotary smoking machine software settings according to ISO 330817 or Intense
smoking regimen parameters.18 Twenty, forty, or sixty cigarettes, depending on TPM yield,
were smoked for each analysis when the ISO smoking regimen was used with the rotary
smoking machine. Ten cigarettes per analysis were smoked for each TPM sample obtained
using the Intense regimen. When the Intense regimen was used, ventilation-blocking
cigarette holders were substituted for the standard cigarette holders used for the ISO
regimen. The TPM was collected by electrostatic precipitation in preweighed high purity
quartz tubes. Total TPM mass was determined as the difference between the end-capped
quartz tube mass before and after smoking.
Pappas et al. Page 3
J Anal Toxicol. Author manuscript; available in PMC 2015 August 18.
Author M
anuscriptA
uthor Manuscript
Author M
anuscriptA
uthor Manuscript
Sample, Quality Control, and Procedural Blank Preparation
TPM was transferred from quartz precipitation tubes to perfluoroalkoxy (PFA) lined high
purity quartz digestion vessels with clean polystyrene spatulas (Fisher, Pittsburgh, PA,
USA). Transferred mass was determined as the difference between vessel mass before and
after TPM transfer. Transfer recovery was determined as TPM transferred / Total TPM
mass. The TPM was digested with 7 mL Optima ultrapure nitric acid (ThermoFisher,
Pittsburgh, PA, USA) in a Discover SPD+ sequential microwave system (CEM, Matthews,
NC, USA) programmed with a 4 minute ramp to 200°C, then maintained at 200°C for 3
minutes. Transfer recovery factors were combined with conversion factors in the Agilent
MassHunter software (Agilent Technologies, Tokyo, Japan) to convert ng/L diluted
digestate concentrations to ng/cigarette. Approximately 5 mL nitric acid remaining after
digestion and ventilation was diluted to 10 mL final volume.
Quality control (QC) TPM samples from 2R4F and 3R4F research reference cigarettes
(University of Kentucky, Lexington, KY, USA) and CM6 cigarettes (Coresta, Paris, France)
were obtained using the same procedure. The QC digestions were prepared for each
analytical run. Procedural blanks were prepared by performing the digestion procedure in
the PFA-lined digestion vessels with 7 mL nitric acid, and diluting as described for samples
and QCs. Before analysis, aliquots from the 10 mL diluted digestates were further diluted to
1/10 with the internal standard diluent solution: 1.0 µg/L scandium, 1.0 µg/L iridium, 10
µg/L tellurium (internal standards) in 1% v/v ultrapure nitric acid, and 1.1% v/v 2-propanol
(semiconductor grade VLSI, Sigma, St. Louis, MO, USA) prepared in ultrapure water.
Samples collected for each cigarette variety were analyzed in seven analytical batches on
seven different days, with 3R4F and CM6 run as QC samples each day.
ICP-MS Quantification
Five calibration standard solutions were prepared by dilution of High Purity Standards
(HPS, Charleston, SC, USA) arsenic, cadmium, chromium, cobalt, manganese, nickel and
National Institute for Standards and Technology lead standard SRM 981 (NIST,
Gaithersburg, MD, USA). The calibration standards were prepared in 50% v/v ultrapure
nitric acid, the acid concentration of diluted digested samples and QCs before addition of the
internal standard diluent solution. Calibration ranges for all metals spanned the observed
levels in the TPM digests. The following standard ranges (prior to dilution with internal
standard solution), were recorded in the instrument software batches: 111Cd, 10.00 to 150.0
µg/L; total Pb, 10.00 µg/L to 150.0 µg/L; 52Cr, 0.100 to 1.500 µg/L; 55Mn, 0.500 to 7.500
µg/L; 59Co, 0.050 to 0.750 µg/L; 60Ni, 0.500 to 7.500 µg/L; 75As, 1.000 to 15.00 µg/L.
Calibration was performed after 1/10 dilution of a calibration reagent blank and the five
calibration standards in the internal standard diluent solution described above. Calibration
curves for all metals had an R ≥ 0.995.
Scandium (45Sc) was assigned as the internal standard for chromium (52Cr), manganese
(55Mn), cobalt (59Co), and nickel (60Ni). Tellurium (125Te) was assigned as the internal
standard for arsenic (75As) and cadmium (111Cd). Iridium (193Ir) was assigned as internal
standard for lead (Total Pb = 204Pb + 206Pb + 207Pb + 208Pb, individually isotopically
calibrated based on isotopic abundances of NIST SRM 981). The rinse solution between
Pappas et al. Page 4
J Anal Toxicol. Author manuscript; available in PMC 2015 August 18.
Author M
anuscriptA
uthor Manuscript
Author M
anuscriptA
uthor Manuscript
blanks, standards, and samples was 1% v/v ultrapure nitric acid with 1 µg/L tellurium (added
to prevent memory effect and to maintain the equilibration of tellurium with the introduction
system between samples).
Instrument Parameters
The Agilent 7700 ICP-MS was equipped with the following: ISIS valve and sample loop
system for effective rinse between samples; ASX510 autosampler (Cetac, Omaha, NE,
USA); low flow PFA nebulizer and Apex desolvating introduction system (Elemental
scientific, Omaha, NE, USA); 0.44 mm I.D. pump tubing to enable 200 – 300 µL/min flow
rates; and Platinum tipped cones. The Apex system was used without nitrogen addition. Ion
intensity was integrated with peak hopping. Dwell times were 250 ms for all isotopes
except 111Cd, 193Ir, and Pb isotopes. These isotopes were assigned dwell times of 100 ms.
The instrument was operated with standard 1550 watts RF power, 15 L/min argon plasma
gas, and 0 L/min Dilution/Makeup gas. Carrier gas (sample gas) was optimized in the range
of 0.97 to 1.00 L/min for < 0.3% cerium oxide formation while maintaining the highest
possible signal intensity and stability. Sampling position, peristaltic pump speed, and other
parameters were optimized with the same goals. Electrostatic lens parameters were
optimized around Kinetic Energy Discrimination (KED) conditions (−18 V octapole bias,
−15V quadrupole bias). Typical optimized cell gas flows were 5.5 mL/min helium and 0.5
mL/min hydrogen.
Quality Control
TPM QC results were monitored using SAS software (Cary, NC, USA.) The analytical QC
samples were evaluated using a modified Westgard evaluation approach.19 When a QC
analyte was determined to be out of control according to the modified Westgard criteria,
results for the failed analyte in the respective batch were not used and analyses were
repeated.
Lowest Reportable Levels
The Procedural Detection Limits (LODs) were determined as follows:
LOD = [Meanprocedural blank +1.645*(Sprocedural blank + B)] / (1–1.645*A)21
Meanprocedural blank and Sprocedural blank were determined as the mean and total standard
deviation from analyses of procedural digest blanks. Total standard deviations were
calculated as follows:
ST = 3 × [S2within run + S2
between run]1/2.
Swithin run is the standard deviation from analysis of 20 separate procedural blanks in a single
run. Sbetween run is the standard deviation of the analysis of 60 separate procedural blanks in
60 separate runs.
Factors A (slope) and B (intercept) were determined according to Taylor,20 by plotting
between run standard deviation for the procedural blank, 2R4F, 3R4F, and CM6 versus their
mean concentrations over 60 runs.
Pappas et al. Page 5
J Anal Toxicol. Author manuscript; available in PMC 2015 August 18.
Author M
anuscriptA
uthor Manuscript
Author M
anuscriptA
uthor Manuscript
The Lowest Reportable Concentration Limit (LRL) was chosen from the higher of the LOD,
or the concentration lowest calibration standard expressed in terms of ng/cigarette,
whichever was higher. Lowest calibration standard concentration equivalents in ng/cigarette
were obtained by multiplying the concentration by 0.010 L and dividing by 10 (Intense
regimen), or 20 (ISO regimen) cigarettes smoked per run.
Statistical Analyses
Multivariate Statistical Analyses (MSA) of correlations between concentrations of metals
that were transmitted into smoke were performed using JMP software (SAS, Cary, NC,
USA). They were tabulated for arsenic, cadmium, and lead. They were not tabulated here for
chromium, manganese, cobalt, and nickel, because of the low transported concentrations or
significant number of results that were < LRL.
Results
Effect of Instrument Optimization on Accuracy
In preliminary data, the initially indicated helium cell gas flow optimum was 4.3 mL/min.
While performance for 90% or more of the samples was adequate, occasional low level false
positives for 52Cr and 60Ni were noted in a few TPM digests. Adding 0.5 mL/min hydrogen
and increasing the helium flow to 5.5 mL/min eliminated the false positives. These cell
conditions suppressed analyte signal to a greater degree, but avoiding false positive results
was nevertheless advantageous with regard to the LRLs.
Analytical Results
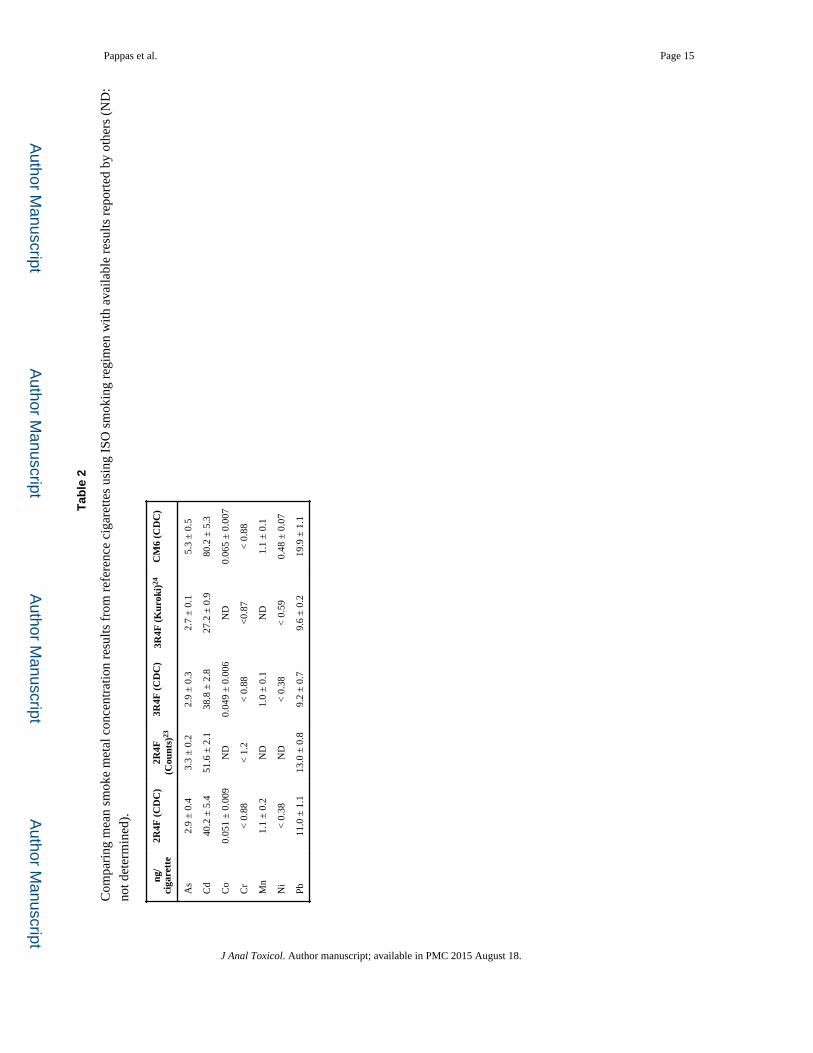
The results from over 30 analyses of TPM obtained from reference cigarettes used as quality
control samples using the ISO smoking regimen are comparable to other reported values
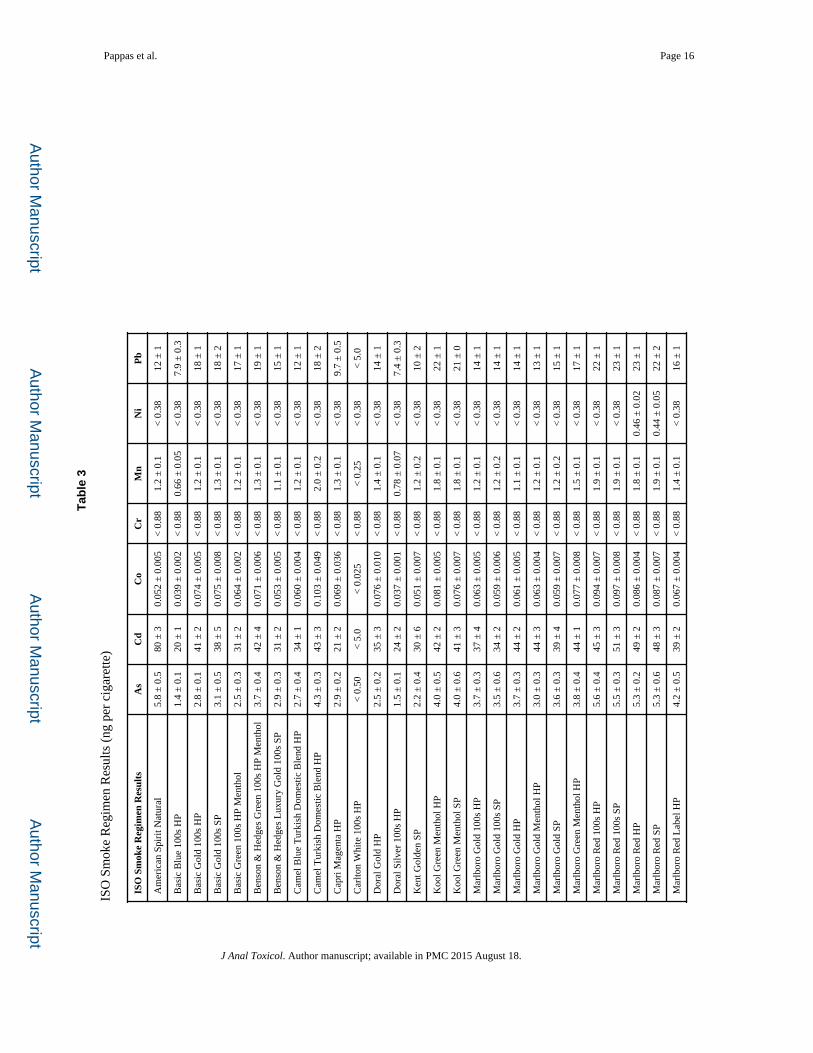
(Table 2). The results of the heptuplicate analyses of TPM for seven toxic metals obtained
from 50 varieties of cigarettes purchased in the greater Atlanta area using ISO and Intense
smoking regimens were determined (Tables 3 and 4). The results from over 30 analyses of
TPM obtained from reference cigarettes used as quality control samples using the Intense
smoking regimen are also reported in Table 4.
Multivariate Statistical Analysis Results
MSA was performed to determine possible cigarette design parameters that were positively
or negatively correlated with delivery of arsenic, cadmium, and lead, the metals that were
transported at the three highest concentrations into smoke. The results for statistical analysis
of correlation of cigarette physical design parameters with arsenic, cadmium, and lead
delivery in both smoking regimens are included in Table 5.
Discussion
Effect of Instrument Optimization on Accuracy
In most cases, a combination of sample liquid and gas flows, optimization of sampling
position, RF power, use of an appropriate nebulizer, and Peltier cooled or desolvating
introduction systems, together with KED conditions, are sufficient for suppressing common
Pappas et al. Page 6
J Anal Toxicol. Author manuscript; available in PMC 2015 August 18.
Author M
anuscriptA
uthor Manuscript
Author M
anuscriptA
uthor Manuscript

interferences. However, there are a few interferences, such as when using employed.22
Though we did not observe significant interferences when using KED with helium alone, the
fact that chromium and nickel concentrations were near the LODs in all samples made even
occasional minimal interferences undesirable. In the absence of hydrogen addition,
occasional false positives for 52Cr and 60Ni were noted in a few diluted TPM digests. We
did not determine the exact causes of the occasional low interferences, but low level argon
(36Ar16O) and calcium (44Ca16O) oxides as described above were considered to be among
the possibilities. The addition of hydrogen (0.5 mL/min) and increased helium flow rate (5.5
mL/min) eliminated even low concentration equivalent interferences, preventing false
positive results.
Analytical Results: Reference Cigarettes
Our analyses of TPM obtained from 2R4F cigarettes for arsenic and lead using the ISO
smoking regimen (Table 2) produced results that were comparable to those reported by
Counts et al.23 Our analyses of TPM obtained from 3R4F cigarettes for arsenic and lead
using the ISO smoking regimen (Table 2) produced results that were comparable to those
reported by Kuroki et al.24 The mean result for arsenic determinations in TPM from 2R4F
reported by three laboratories participating in an intercomparison study was 10.39 with
108% coefficient of variation. The mean lead result for 2R4F from four laboratories
participating in an intercomparison study was 32.95 with 100% coefficient of variation.25
The arsenic and lead data from these intercomparison studies are too scattered to be useful
and thus are not mentioned here.
Our mean results for cadmium concentrations in TPM from 2R4F cigarettes were somewhat
comparable to those of Counts et al.,23 though approximately 11 ng per cigarette lower than
those results. Our 3R4F results for cadmium, however, differed by approximately the same
magnitude higher than the results of Kuroki et al.24 Our cadmium results for 2R4F reference
cigarettes were within one standard deviation below the mean results from four industry
laboratories reported by Chen and Moldoveanu (47.8 ± 12.4 ng cadmium per cigarette).25
There was greater variability between the respective laboratories for cadmium results. We
noted that weekly cleaning of the syringe pump and daily cleaning of the cigarette holder
tube bends in the rotary smoking machine dramatically decreased the variability of the
cadmium and lead results. The greater dependence of these two analytes on machine
maintenance could be related to their volatility relative to the other analytes.
Our chromium results were below reportable levels for both 2R4F and 3R4F, as were those
of Counts et al. and Kuroki et al., respectively.23,24 Chen and Moldoveanu reported a mean
of 73.01 ng chromium per cigarette in TPM obtained from 2R4F from two participating
laboratories.25 The latter 2R4F value was probably due to either contamination or
unresolved interferences.
Our nickel results were below reportable levels for both 2R4F and 3R4F, as were the 3R4F
results of Kuroki et al.24 One laboratory reported 5.12 ng nickel per cigarette for 2R4F in an
intercomparison study.25 We observed occasional false positives in this range when
hydrogen was not used in the collision cell. Neither Counts et al. nor Kuroki et al. reported
Pappas et al. Page 7
J Anal Toxicol. Author manuscript; available in PMC 2015 August 18.
Author M
anuscriptA
uthor Manuscript
Author M
anuscriptA
uthor Manuscript

results for cobalt, manganese, or nickel. Chen and Moldoveanu also did not report cobalt or
manganese results.
The results of our analyses of TPM obtained from the research cigarettes using the Intense
smoking regimen are higher than the ISO values as expected (Table 4). Two-fold and four-
fold greater concentrations of the respective metals in TPM were obtained using the Canada
Intense regimen than in TPM obtained using the ISO regimen. We did not find published
reports from other sources of metals analysis data from TPM obtained from 2R4F, 3R4F, or
CM6 research cigarettes using the Intense regimen. We also reported data for the Coresta
CM6 cigarette obtained using the ISO and Intense regimens (Tables 2, 4). We did not find
other published results for metals concentrations in smoke particulate from the CM6
cigarette.
Study Cigarettes Results: ISO Smoking Regimen
Chromium concentrations were below the LRLs for all cigarettes when using the ISO
smoking regimen (Table 3). Only 12% of TPM samples from all cigarette varieties had
nickel concentrations above the LRL. Though chromium, manganese, and nickel
concentrations in tobacco were higher than the concentrations of arsenic, cadmium, and
lead;26 arsenic, cadmium, and lead form more volatile metallic, chloride, or oxide species
than chromium, manganese, and nickel. This is probably one of the reasons that the latter
metals are not transported as efficiently in smoke.
The results of TPM analyses for other specific toxic metals obtained using the ISO smoking
regimen follow the general expectation of the relationship between TPM transfer and
cigarette filter ventilation. For example, arsenic, chromium, cobalt, and nickel
concentrations in TPM obtained from Carlton White 100s, which may have in excess of
80% ventilation,27 were lower than reportable levels. Concentrations of cadmium and lead
in TPM obtained from Carlton White 100s using the ISO smoking regimen were the lowest
of the 50 varieties analyzed. In like manner, Now Gold 100s, which have greater than 65%
ventilation,27 had the second lowest concentrations of arsenic, cadmium, cobalt, manganese,
and lead. Marlboro (Red) 100s soft pack and Winston (Red) 100s hard pack, which may
only have 10% ventilation,27 had cadmium concentrations second only to the American
Spirit Natural. TPM obtained from the three Newport varieties, which have little or no
ventilation,27 had the highest mean concentrations of cobalt when using the ISO smoking
regimen. TPM from the Marlboro (Red) varieties, along with the Kool (Green) menthol
varieties which may have no ventilation,27 had the highest lead concentrations of the
varieties analyzed in this study. Four of six metals were predicted to have significant impact
from ventilation under ISO smoking conditions. Paper porosity was not predicted to have
impact under ISO smoking conditions, probably due to the greater impact of filter
ventilation.
Study Cigarettes Results: Intense Smoking Regimen
Chromium concentrations were below the LRLs for all cigarettes smoked using the Intense
smoking regimen (Table 4). As a consequence of the more intense smoking parameters of
the Health Canada Intense regimen,7,18 TPM from 68% of the cigarette varieties had
Pappas et al. Page 8
J Anal Toxicol. Author manuscript; available in PMC 2015 August 18.
Author M
anuscriptA
uthor Manuscript
Author M
anuscriptA
uthor Manuscript

reportable nickel concentrations compared to only 12% of TPM samples of the cigarette
varieties when smoked using ISO parameters. In addition to the greater puff volume (55 mL
versus 35 mL) and greater puff frequency (every 30 seconds versus every 60 seconds) used
for the Intense regimen, the greater transport of nickel (and other metals) in TPM could be
attributed in large part to the filter ventilation blocking used in the Canada Intense regimen.
Indeed, higher TPM delivery is observed for cigarettes smoked under Intense conditions
than under ISO conditions.
American Spirit Natural cigarettes stood out with toxic metal concentrations at both the
extreme high and low ends of the ranges for specific metals reported here. Tobacco filler
from the American Spirit Natural cigarettes was previously reported to have lower mean
cobalt and manganese concentrations than tobacco from other cigarettes.26 Transport of
cobalt and manganese in the smoke TPM obtained from these cigarettes using the Canada
Intense regimen corresponded to filler concentrations that are the lowest and second lowest
mean concentrations among the 50 varieties reported here. The filler from American Spirit
also had the highest mean concentrations of cadmium and mercury.26 The data from Table 4
show that transport of cadmium in the smoke TPM obtained from American Spirit Natural
cigarettes using the Canada Intense regimen corresponded to filler cadmium concentrations
that are the highest of all cigarettes in the study. Tobacco filler mean arsenic concentrations
for American Spirit Natural cigarettes were among the top 14% of arsenic concentrations
among the 50 varieties analyzed.26 Arsenic concentrations in smoke TPM obtained from
American Spirit cigarettes using the Canada Intense regimen corresponded to the relatively
high filler arsenic concentrations that are the highest of the fifty varieties analyzed. Lead
concentrations in smoke from American Spirit cigarettes were found to be the second lowest
concentration among the 50 varieties analyzed. Accordingly, American Spirit tobacco filler
was among the lowest 23 % of the tobacco filler lead concentrations previously reported.26
While there were correlations between toxic metal concentrations in tobacco filler and the
concentrations in smoke TPM obtained using ISO smoking parameters, the correlations
generally only held true for a given cigarette design. Filter ventilation in the cigarette design
is a major factor in toxic metal transport especially when using the ISO regimen.27 TPM
transport, and thus toxic metal transport, is dependent upon the level of ventilation in the
filter and the wrapping paper. Since the Health Canada Intense regimen specifies blocking
the filter ventilation, toxic metal transport is less dependent on cigarette filter ventilation and
more dependent on concentration in the tobacco. These are very important considerations for
determining the health risk to the smoker. If a smoker decided to cut his or her exposure to
TPM from smoke by changing the purchase choice from an unventilated to a more highly
ventilated cigarette manufactured with identical tobacco, and smoking the same number of
the more highly ventilated cigarettes per day with the identical puff frequency, puff profile,
puff volume, and without covering ventilation holes with lips or fingers, then the smoker
could in theory achieve a reduced exposure to TPM, though not necessarily to nicotine or
other toxic substances. However, studies by Kozlowski and Pillitteri have shown that when
smokers switch to a lower nicotine yield cigarette (generally a more highly ventilated
cigarette), the majority of smokers compensate for the decreased nicotine delivery with more
intense smoking habits.28 Changes in smoking habits include: intentionally or
Pappas et al. Page 9
J Anal Toxicol. Author manuscript; available in PMC 2015 August 18.
Author M
anuscriptA
uthor Manuscript
Author M
anuscriptA
uthor Manuscript

unintentionally covering ventilation holes with lips or fingers, more frequent puffing, deeper
puff volumes, or increasing the number of cigarettes smoked per day.
Burns et al. and Hammond et al. have expressed the current scientific consensus that the ISO
smoking machine regimen is unsatisfactory for providing valid estimates of human
exposure.6,18 Hammond et al. added to the compensation studies of Kozlowski and
Pilletteri28 by showing that when smokers were given a low tar and nicotine delivery
cigarette, they compensated with a mean smoke volume per cigarette of 802 mL, more than
twice the inhaled smoke volume of the same cigarette smoked using the ISO regimen, and
over 100 mL greater volume than the Massachusetts regimen, the Canadian intense regimen,
and an experimental compensatory regimen.18 This compensation volume was without
regard to any intentional or unintentional ventilation blocking by participants. When regular
yield brands were smoked by study participants, the participants inhaled somewhat smaller
volumes than they inhaled with low tar and nicotine delivery cigarettes, but they still inhaled
approximately twice the ISO regimen puff volume. They smoked with average intensities in
terms of total smoke volume in the ranges of the Massachusetts and Canadian Intense
regimens. This finding still permits a range of exposure possibilities, since for the same
smoke volume, the cigarette burns more intensely with the Canada Intense regimen with
100% filter ventilation blocking than when using the Massachusetts regimen, for which filter
ventilation is only 50% blocked. No smoking regimen is perfectly representative of the
individual habits of all smokers. However, since the regular yield cigarettes would have little
or no ventilation, it appears that the average puffing characteristics for smokers in the
Hammond et al. study were far closer to the parameters of the Intense regimen than the ISO
regimen.18 Thus, the TPM exposure levels one would expect for a smoker who smokes with
an average topography would be more accurately estimated from data obtained using the
Canada Intense smoking regimen. The Intense smoking regimen provides useful information
that may provide a closer approximation to human exposure, or at minimum, using the
Intense regimen alongside the ISO regimen provides information that may bracket human
exposure.
Statistical Analyses
The physical parameter that was most strongly correlated with delivery of arsenic, cadmium,
and lead into smoke was tobacco weight per cigarette (p < 0.0001 for As and Cd in both
smoking regimens, p = 0.0011 for Pb in ISO regimen, p = 0.0002 in Intense regimen).
Higher tobacco mass per cigarette may be achieved by means of a longer portion of the
cigarette rod packed with tobacco filler, or by tighter packing of a rod of given length.
American Spirit Natural is an illustrative example of this correlation. This variety had the
highest mean tobacco mass of the 50 varieties examined here (881 ± 44 mg per cigarette) as
well as the highest mean arsenic and cadmium deliveries in both smoking regimens (Tables
3 and 4).
The cigarette rod length was strongly positively correlated with arsenic and lead delivery
into smoke in both smoking regimens, but not with cadmium delivery (Tables 3 and 4). This
may be due to the higher volatility of cadmium and may indicate that rod length is a more
important determinant of the delivery of less volatile metals. Marlboro red hard pack 100s is
Pappas et al. Page 10
J Anal Toxicol. Author manuscript; available in PMC 2015 August 18.
Author M
anuscriptA
uthor Manuscript
Author M
anuscriptA
uthor Manuscript
an illustrative example of this correlation. This variety had 71 mm of the 100 mm rod
devoted to tobacco content after subtracting the 29 mm filter length. This variety had the
second highest mean arsenic delivery in both smoking regimens and the highest lead
delivery in the Intense regimen (Tables 3 and 4).
Pressure drop shut, a measure of tightness of rod packing and also related to tobacco mass in
a given rod length, was negatively correlated only with arsenic and lead delivery in the ISO
smoking regimen.
Paper porosity was not significantly correlated with arsenic or lead delivery in either
smoking regimen. Paper porosity was negatively correlated with cadmium delivery only in
the ISO smoking regimen.
Filter ventilation was significantly negatively correlated with arsenic, cadmium, and lead
deliveries in the ISO smoking regimen, as would be expected since the ventilation holes are
unblocked. Filter ventilation is significantly negatively correlated only with cadmium
delivery in the Intense smoking regimen. The latter case could also be due to the fact that
filter length is often a greater proportion of the total rod length for ventilated cigarettes.
Indeed filter length was correlated only with cadmium delivery in the Intense smoking
regimen.
Most published data on smokers’ exposure to toxic metals is based on deliveries using the
ISO smoking regimen, which underestimates smoke inhalation of these HPHCs.5,6,7,18 This
paper therefore provides data that will be valuable for more accurate health risk assessments
in keeping with the scientific consensus on estimating the smoke deliveries of toxic metals.
Overall, using the Health Canada Intense smoking regimen, mainstream cigarette smoke
metal levels yield data that more closely represents human exposure levels to toxic metals—
data which could help enable more accurate estimates of cancer and non-cancer health risk
indices.
Acknowledgements
This study was funded through an interagency agreement by the U.S. Food and Drug Administration Center for Tobacco Products.
References
1. Centers for Disease Control and Prevention (CDC). Vital signs: current cigarette smoking among adults aged ≥ 18 years - United States, 2009. Morbidity Mortality Weekly Report. 2010; 59:1135–1140. [PubMed: 20829747]
2. Garrett BE, Dube SR, Trosclair A, Caraballo RS, Pechacek TF. Cigarette smoking - United States, 1965–2008. Morbidity Mortality Weekly Report Surveillance Summary. 2011; (60 Suppl):109–113.
3. World Health Organization (WHO). Geneva, Switzerland: World Health Organization; 2008. World health statistics, 2008. http://www.who.int/whosis/whostat/EN_WHS08_Part1.pdf. [accessed 6 June 2013]
4. U.S. Department Of Health And Human Services. A Report of the Surgeon General. Rockville, MD, USA: U.S. Department Of Health And Human Services, Public Health Service, Office of the Surgeon General; 2010. How Tobacco Smoke Causes Disease: The Biology and Behavioral Basis for Smoking-Attributable Disease. http://www.surgeongeneral.gov/library/reports/tobaccosmoke/full_report.pdf [accessed 19 July, 2013]
Pappas et al. Page 11
J Anal Toxicol. Author manuscript; available in PMC 2015 August 18.
Author M
anuscriptA
uthor Manuscript
Author M
anuscriptA
uthor Manuscript

5. Fowles J, Dybing E. Application of toxicological risk assessment principles to the chemical constituents of cigarette smoke. Tobacco Control. 2003; 12:424–430. [PubMed: 14660781]
6. Burns DM, Dybing E, Gray N, Hecht S, Anderson C, Sanner T, O’Connor R, Djordjevic M, Dresler C, Hainaut P, Jarvis M, Opperhuizen A, Straif K. Mandated lowering of toxicants in cigarette smoke: a description of the World Health Organization TobReg proposal. Tobacco Control. 2008; 17:132–141. [PubMed: 18375736]
7. Hammond D, Wiebel F, Kozlowski LT, Borland R, Cummings KM, O’Connor RJ, McNeill A, Connolly GN, Arnott D, Fong GT. Revising the machine smoking regime for cigarette emissions: implications for tobacco control policy. Tobacco Control. 2007; 16:8–14. [PubMed: 17297067]
8. Navas-Acien A, Selvin E, Sharrett AR, Calderon-Aranda E, Silbergeld E, Guallar E. Lead, cadmium, smoking, and increased risk of peripheral arterial disease. Circulation. 2004; 109:3196–3201. [PubMed: 15184277]
9. Navas-Acien A, Silbergeld EK, Sharrett R, Calderon-Aranda E, Selvin E, Guallar E. Metals in urine and peripheral arterial disease. Environmental Health Perspectives. 2005; 113:164–169. [PubMed: 15687053]
10. Navas-Acien A, Silbergeld EK, Schwartz BS, Nachman K, Burke TA, Guallar E. Arsenic exposure and cardiovascular disease: a systematic review of the epidemiologic evidence. American Journal of Epidemiology. 2005; 162:1037–1049. [PubMed: 16269585]
11. Attili AK, Kazerooni EA, Gross BH, Flaherty KR, Myers JL, Martinez FJ. Smoking-related interstitial lung disease: radiologic-clinical-pathologic correlation. Radiographics. 2008; 28:1383–1396. [PubMed: 18794314]
12. Washko GR, Hunninghake GM, Fernandez IE, Nishino M, Okajima Y, Yamashiro T, Ross JC, San José Estépar R, Lynch DA, Brehm JM, Andriole KP, Diaz AA, Khorasani R, D’Aco K, Sciurba FC, Silverman EK, Hatabu H, Rosas IO. Lung volumes and emphysema in smokers with interstitial lung abnormalities. New England Journal of Medicine. 2011; 364:897–906. [PubMed: 21388308]
13. Pappas RS. Toxic elements in tobacco and in cigarette smoke: inflammation and sensitization. Metallomics. 2011; 3:1181–1198. [PubMed: 21799956]
14. Pappas, RS. World Health Organization Report on the Scientific Basis of Tobacco Product Regulation: Fourth Report of a WHO Study Group. World Health Organization; 2012. Toxic elements in tobacco and in cigarette smoke; p. 37-83.
15. International Organization for Standardization. Tobacco and tobacco products - Atmosphere for conditioning and testing. Vol. 3402. ISO; 1999. p. 1-4.
16. International Organization for Standardization. Routine analytical cigarette-smoking machine — Definitions and standard conditions. Vol. 3308. ISO; 2000. p. 1-23.
17. International Organization for Standardization. Cigarettes — Determination of total and nicotine-free dry particulate matter using a routine analytical smoking machine. Vol. 4387. ISO; 2000. p. 1-17.
18. Hammond D, Fong GT, Cummings KM, O’Connor RJ, Giovino GA, McNeill A. Cigarette yields and human exposure: A comparison of alternative testing regimens. Cancer Epidemiology, Biomarkers & Prevention. 2006; 15:1495–1501.
19. Caudill SP, Schleicher RL, Pirkle JL. Multi-rule quality control for the age-related eye disease study. Statistics in Medicine. 2008; 27:4094–4106. [PubMed: 18344178]
20. Taylor, JK. Quality assurance of chemical measurements. 1st ed.. Boca Raton (FL): CRC Press; 1987. p. 79-81.p. 194
21. National Committee for Clinical Laboratory Standards (NCCLS). Protocols for Determination of Limits of Detection and Limits of Quantitation. 2004; 24(34):9–35.
22. Peachey, E.; Hearn, R.; Elahi, S. Middlesex. United Kingdom: Agilent Technologies; 2008. Multi-element determination of heavy metals in dietary supplements using collision/reaction cell ICP-MS; p. 1-4.Available from: https://www.chem.agilent.com/Library/applications/5989-7959EN.pdf [accessed 6 June 2013]
23. Counts ME, Hsu FS, Tewes FJ. Development of a commercial cigarette “market map” comparison methodology for evaluating new or non-conventional cigarettes. Regulatory Toxicology and Pharmacology. 2006; 46:225–242. [PubMed: 16989926]
Pappas et al. Page 12
J Anal Toxicol. Author manuscript; available in PMC 2015 August 18.
Author M
anuscriptA
uthor Manuscript
Author M
anuscriptA
uthor Manuscript
24. Kuroki, Y.; Yokohama, S.; Takahashi, H.; Fujiwara, M. Development of an analytical method for the simultaneous determination of trace metals and mercury in mainstream cigarette smoke by ICP-MS; Proceedings of the 63rd Tobacco Science Research Conference; Amelia Island, FL, USA. 2009.
25. Chen PX, Moldoveanu SC. Mainstream smoke chemical analyses for 2R4F Kentucky reference cigarette. Beitrage zur Tabakforschung. 2003; 20:448–458.
26. Fresquez MR, Pappas RS, Watson CH. Establishment of toxic metal reference range in tobacco from U.S. cigarettes. Journal of Analytical Toxicology. 2013; 37:298–304. [PubMed: 23548667]
27. Kozlowski LT, Mehta NY, Sweeney CT, Schwartz SS, Vogler GP, Jarvis MJ, West RJ. Filter ventilation and nicotine content of tobacco in cigarettes from Canada, the United Kingdom, and the United States. Tobacco Control. 1998; 7:369–375. [PubMed: 10093170]
28. Kozlowski, LT.; Pillitteri, JL. Monograph 7: The FTC cigarette test method for determining tar, nicotine, and carbon monoxide yields of U.S. cigarettes. Washington (DC): National Cancer Institute, National Institutes of Health, US Department of Health and Human Services; 1996. Compensation for nicotine by smokers of lower yield cigarettes; p. 161-172.http://cancercontrol.cancer.gov/tcrb/monographs/7/index.html [accessed 6 June 2013]
Pappas et al. Page 13
J Anal Toxicol. Author manuscript; available in PMC 2015 August 18.
Author M
anuscriptA
uthor Manuscript
Author M
anuscriptA
uthor Manuscript

Author M
anuscriptA
uthor Manuscript
Author M
anuscriptA
uthor Manuscript
Pappas et al. Page 14
Table 1
Lower Reportable Limits (LRLs) (ng/cigarette)
Analyte Intense Regimen (10cigarettes) LRLs
ISO Regimen (20cigarettes) LRLs
As 1.00 0.50
Cd 10.0 5.0
Co 0.050 0.025
Cr 1.1 0.88
Mn 0.50 0.25
Ni 0.50 0.38
Pb 10.0 5.0
J Anal Toxicol. Author manuscript; available in PMC 2015 August 18.
Author M
anuscriptA
uthor Manuscript
Author M
anuscriptA
uthor Manuscript
Pappas et al. Page 15
Tab
le 2
Com
pari
ng m
ean
smok
e m
etal
con
cent
ratio
n re
sults
fro
m r
efer
ence
cig
aret
tes
usin
g IS
O s
mok
ing
regi
men
with
ava
ilabl
e re
sults
rep
orte
d by
oth
ers
(ND
:
not d
eter
min
ed).
ng/
ciga
rett
e2R
4F (
CD
C)
2R4F
(Cou
nts)
233R
4F (
CD
C)
3R4F
(K
urok
i)24
CM
6 (C
DC
)
As
2.9
± 0
.43.
3 ±
0.2
2.9
± 0
.32.
7 ±
0.1
5.3
± 0
.5
Cd
40.2
± 5
.451
.6 ±
2.1
38.8
± 2
.827
.2 ±
0.9
80.2
± 5
.3
Co
0.05
1 ±
0.0
09N
D0.
049
± 0
.006
ND
0.06
5 ±
0.0
07
Cr
< 0
.88
< 1
.2<
0.8
8<
0.87
< 0
.88
Mn
1.1
± 0
.2N
D1.
0 ±
0.1
ND
1.1
± 0
.1
Ni
< 0
.38
ND
< 0
.38
< 0
.59
0.48
± 0
.07
Pb11
.0 ±
1.1
13.0
± 0
.89.
2 ±
0.7
9.6
± 0
.219
.9 ±
1.1
J Anal Toxicol. Author manuscript; available in PMC 2015 August 18.
Author M
anuscriptA
uthor Manuscript
Author M
anuscriptA
uthor Manuscript
Pappas et al. Page 16
Tab
le 3
ISO
Sm
oke
Reg
imen
Res
ults
(ng
per
cig
aret
te)
ISO
Sm
oke
Reg
imen
Res
ults
As
Cd
Co
Cr
Mn
Ni
Pb
Am
eric
an S
piri
t Nat
ural
5.8
± 0
.580
± 3
0.05
2 ±
0.0
05<
0.8
81.
2 ±
0.1
< 0
.38
12 ±
1
Bas
ic B
lue
100s
HP
1.4
± 0
.120
± 1
0.03
9 ±
0.0
02<
0.8
80.
66 ±
0.0
5<
0.3
87.
9 ±
0.3
Bas
ic G
old
100s
HP
2.8
± 0
.141
± 2
0.07
4 ±
0.0
05<
0.8
81.
2 ±
0.1
< 0
.38
18 ±
1
Bas
ic G
old
100s
SP
3.1
± 0
.538
± 5
0.07
5 ±
0.0
08<
0.8
81.
3 ±
0.1
< 0
.38
18 ±
2
Bas
ic G
reen
100
s H
P M
enth
ol2.
5 ±
0.3
31 ±
20.
064
± 0
.002
< 0
.88
1.2
± 0
.1<
0.3
817
± 1
Ben
son
& H
edge
s G
reen
100
s H
P M
enth
ol3.
7 ±
0.4
42 ±
40.
071
± 0
.006
< 0
.88
1.3
± 0
.1<
0.3
819
± 1
Ben
son
& H
edge
s L
uxur
y G
old
100s
SP
2.9
± 0
.331
± 2
0.05
3 ±
0.0
05<
0.8
81.
1 ±
0.1
< 0
.38
15 ±
1
Cam
el B
lue
Tur
kish
Dom
estic
Ble
nd H
P2.
7 ±
0.4
34 ±
10.
060
± 0
.004
< 0
.88
1.2
± 0
.1<
0.3
812
± 1
Cam
el T
urki
sh D
omes
tic B
lend
HP
4.3
± 0
.343
± 3
0.10
3 ±
0.0
49<
0.8
82.
0 ±
0.2
< 0
.38
18 ±
2
Cap
ri M
agen
ta H
P2.
9 ±
0.2
21 ±
20.
069
± 0
.036
< 0
.88
1.3
± 0
.1<
0.3
89.
7 ±
0.5
Car
lton
Whi
te 1
00s
HP
< 0
.50
< 5
.0<
0.0
25<
0.8
8<
0.2
5<
0.3
8<
5.0
Dor
al G
old
HP
2.5
± 0
.235
± 3
0.07
6 ±
0.0
10<
0.8
81.
4 ±
0.1
< 0
.38
14 ±
1
Dor
al S
ilver
100
s H
P1.
5 ±
0.1
24 ±
20.
037
± 0
.001
< 0
.88
0.78
± 0
.07
< 0
.38
7.4
± 0
.3
Ken
t Gol
den
SP2.
2 ±
0.4
30 ±
60.
051
± 0
.007
< 0
.88
1.2
± 0
.2<
0.3
810
± 2
Koo
l Gre
en M
enth
ol H
P4.
0 ±
0.5
42 ±
20.
081
± 0
.005
< 0
.88
1.8
± 0
.1<
0.3
822
± 1
Koo
l Gre
en M
enth
ol S
P4.
0 ±
0.6
41 ±
30.
076
± 0
.007
< 0
.88
1.8
± 0
.1<
0.3
821
± 0
Mar
lbor
o G
old
100s
HP
3.7
± 0
.337
± 4
0.06
3 ±
0.0
05<
0.8
81.
2 ±
0.1
< 0
.38
14 ±
1
Mar
lbor
o G
old
100s
SP
3.5
± 0
.634
± 2
0.05
9 ±
0.0
06<
0.8
81.
2 ±
0.2
< 0
.38
14 ±
1
Mar
lbor
o G
old
HP
3.7
± 0
.344
± 2
0.06
1 ±
0.0
05<
0.8
81.
1 ±
0.1
< 0
.38
14 ±
1
Mar
lbor
o G
old
Men
thol
HP
3.0
± 0
.344
± 3
0.06
3 ±
0.0
04<
0.8
81.
2 ±
0.1
< 0
.38
13 ±
1
Mar
lbor
o G
old
SP3.
6 ±
0.3
39 ±
40.
059
± 0
.007
< 0
.88
1.2
± 0
.2<
0.3
815
± 1
Mar
lbor
o G
reen
Men
thol
HP
3.8
± 0
.444
± 1
0.07
7 ±
0.0
08<
0.8
81.
5 ±
0.1
< 0
.38
17 ±
1
Mar
lbor
o R
ed 1
00s
HP
5.6
± 0
.445
± 3
0.09
4 ±
0.0
07<
0.8
81.
9 ±
0.1
< 0
.38
22 ±
1
Mar
lbor
o R
ed 1
00s
SP5.
5 ±
0.3
51 ±
30.
097
± 0
.008
< 0
.88
1.9
± 0
.1<
0.3
823
± 1
Mar
lbor
o R
ed H
P5.
3 ±
0.2
49 ±
20.
086
± 0
.004
< 0
.88
1.8
± 0
.10.
46 ±
0.0
223
± 1
Mar
lbor
o R
ed S
P5.
3 ±
0.6
48 ±
30.
087
± 0
.007
< 0
.88
1.9
± 0
.10.
44 ±
0.0
522
± 2
Mar
lbor
o R
ed L
abel
HP
4.2
± 0
.539
± 2
0.06
7 ±
0.0
04<
0.8
81.
4 ±
0.1
< 0
.38
16 ±
1
J Anal Toxicol. Author manuscript; available in PMC 2015 August 18.

Author M
anuscriptA
uthor Manuscript
Author M
anuscriptA
uthor Manuscript
Pappas et al. Page 17
ISO
Sm
oke
Reg
imen
Res
ults
As
Cd
Co
Cr
Mn
Ni
Pb
Mar
lbor
o Si
lver
100
s H
P1.
9 ±
0.1
24 ±
20.
038
± 0
.002
< 0
.88
0.65
± 0
.06
< 0
.38
8.0
± 0
.4
Mar
lbor
o Si
lver
HP
1.9
± 0
.224
± 2
0.03
2 ±
0.0
04<
0.8
80.
61 ±
0.0
5<
0.3
87.
6 ±
0.5
Mav
eric
k G
old
100s
HP
2.8
± 0
.426
± 4
0.07
5 ±
0.0
09<
0.8
81.
2 ±
0.1
< 0
.38
9 ±
1
Mer
it G
old
HP
1.9
± 0
.119
± 1
0.04
3 ±
0.0
02<
0.8
80.
65 ±
0.0
4<
0.3
89.
2 ±
0.4
Mis
ty B
lue
Slim
s2.
5 ±
0.2
29 ±
10.
054
± 0
.007
< 0
.88
1.1
± 0
.1<
0.3
810
± 1
New
port
Gre
en K
ing
SP M
enth
ol3.
2 ±
0.2
50 ±
30.
142
± 0
.009
< 0
.88
1.9
± 0
.20.
43 ±
0.0
217
± 1
New
port
Gre
en M
enth
ol 1
00s
HP
3.3
± 0
.339
± 3
0.15
1 ±
0.0
08<
0.8
82.
0 ±
0.1
< 0
.38
15 ±
0
New
port
Gre
en M
enth
ol H
P2.
6 ±
0.2
42 ±
40.
122
± 0
.007
< 0
.88
1.9
± 0
.2<
0.3
815
± 1
Now
Gol
d 10
0s S
P<
0.5
07.
3 ±
0.9
0.01
5 ±
0.0
02<
0.8
80.
21 ±
0.0
3<
0.3
81.
8 ±
0.1
Pall
Mal
l Blu
e2.
4 ±
0.2
33 ±
20.
081
± 0
.007
< 0
.88
1.3
± 0
.1<
0.3
812
± 1
Parl
iam
ent B
lue
HP
2.3
± 0
.135
± 3
0.05
3 ±
0.0
02<
0.8
80.
90 ±
0.0
8<
0.3
812
± 0
Sale
m G
old
100s
2.5
± 0
.228
± 1
0.05
9 ±
0.0
06<
0.8
81.
3 ±
0.3
< 0
.38
10 ±
1
Sale
m G
old
HP
2.9
± 0
.442
± 4
0.06
9 ±
0.0
06<
0.8
81.
2 ±
0.1
< 0
.38
14 ±
1
Sale
m G
reen
HP
Men
thol
4.6
± 0
.449
± 2
0.10
3 ±
0.0
08<
0.8
82.
1 ±
0.2
0.48
± 0
.04
21 ±
2
Sale
m S
ilver
100
s H
P M
enth
ol1.
4 ±
0.2
24 ±
40.
035
± 0
.003
< 0
.88
0.63
± 0
.08
< 0
.38
6.2
± 1
.0
Tru
e Si
lver
SP
0.9
± 0
.19.
0 ±
1.0
0.03
0 ±
0.0
04<
0.8
80.
59 ±
0.0
6<
0.3
8<
5.0
USA
Gol
d 10
0s S
P3.
2 ±
0.5
51 ±
20.
084
± 0
.005
< 0
.88
1.4
± 0
.1<
0.3
816
± 1
Van
tage
SP
2.7
± 0
.238
± 4
0.06
8 ±
0.0
07<
0.8
81.
4 ±
0.2
< 0
.38
14 ±
1
Vir
gini
a Sl
ims
Gol
d 10
0s H
P2.
6 ±
0.4
30 ±
30.
056
± 0
.007
< 0
.88
1.0
± 0
.1<
0.3
813
± 1
Win
ston
Gol
d H
P2.
8 ±
0.1
46 ±
40.
081
± 0
.006
< 0
.88
1.4
± 0
.1<
0.3
812
± 1
Win
ston
Red
100
s H
P4.
4 ±
0.3
51 ±
20.
093
± 0
.012
< 0
.88
1.9
± 0
.10.
44 ±
0.0
317
± 1
Win
ston
Red
HP
4.6
± 0
.460
± 2
0.11
0 ±
0.0
10<
0.8
82.
1 ±
0.1
0.46
± 0
.02
19 ±
1
Win
ston
Whi
te 1
00s
HP
1.5
± 0
.221
± 2
0.03
3 ±
0.0
04<
0.8
80.
46 ±
0.0
9<
0.3
85.
2 ±
0.5
2R4F
§2.
9 ±
0.4
40 ±
50.
051
± 0
.009
< 0
.88
1.1
± 0
.2<
0.3
813
± 1
3R4F
§2.
9 ±
0.3
39 ±
30.
049
± 0
.006
< 0
.88
1.0
± 0
.1<
0.3
89.
2 ±
0.7
CM
6§5.
3 ±
0.5
80 ±
50.
065
± 0
.007
< 0
.88
1.1
± 0
.10.
48 ±
0.0
720
± 1
§ Dat
a fr
om >
30
anal
ytic
al r
uns.
All
Bra
nd n
ames
are
trad
emar
ks o
f th
e re
spec
tive
man
ufac
ture
rs.
J Anal Toxicol. Author manuscript; available in PMC 2015 August 18.

Author M
anuscriptA
uthor Manuscript
Author M
anuscriptA
uthor Manuscript
Pappas et al. Page 18
Tab
le 4
Inte
nse
smok
e re
gim
en r
esul
ts (
ng p
er c
igar
ette
).
Inte
nse
Smok
e R
egim
en R
esul
tsA
sC
dC
oC
rM
nN
iP
b
Am
eric
an S
piri
t Nat
ural
15.2
± 1
.320
0 ±
12
0.09
± 0
.01
< 1
.12.
2 ±
0.2
*29
± 1
Bas
ic B
lue
100s
HP
6.3
± 1
.294
± 1
60.
14 ±
0.0
2<
1.1
2.8
± 0
.3*
41 ±
3
Bas
ic G
old
100s
HP
7.9
± 0
.610
7 ±
90.
16 ±
0.0
1<
1.1
3.2
± 0
.20.
62 ±
0.0
847
± 3
Bas
ic G
old
100s
SP
7.6
± 0
.410
8 ±
90.
16 ±
0.0
4<
1.1
3.1
± 0
.30.
69 ±
0.0
845
± 3
Bas
ic G
reen
100
s H
P M
enth
ol8.
2 ±
0.9
105
± 2
80.
18 ±
0.0
3<
1.1
3.0
± 0
.20.
65 ±
0.1
246
± 2
Ben
son
& H
edge
s G
reen
100
s H
P M
enth
ol11
.4 ±
1.3
129
± 1
20.
17 ±
0.0
1<
1.1
3.2
± 0
.50.
64 ±
0.1
358
± 3
Ben
son
& H
edge
s L
uxur
y G
old
100s
SP
9.3
± 1
.211
7 ±
16
0.15
± 0
.02
< 1
.12.
8 ±
0.4
*46
± 4
Cam
el B
lue
Tur
kish
Dom
estic
Ble
nd H
P7.
6 ±
0.4
113
± 3
30.
13 ±
0.0
1<
1.1
3.1
± 0
.20.
75 ±
0.2
832
± 3
Cam
el T
urki
sh D
omes
tic B
lend
HP
9.9
± 1
.012
6 ±
12
0.18
± 0
.06
< 1
.14.
1 ±
0.4
0.88
± 0
.13
40 ±
3
Cap
ri M
agen
ta H
P9.
1 ±
0.8
82 ±
90.
15 ±
0.0
1<
1.1
3.4
± 0
.20.
89 ±
0.1
329
± 1
Car
lton
Whi
te 1
00s
HP
4.9
± 0
.791
± 1
10.
12 ±
0.0
4<
1.1
2.7
± 0
.4*
28 ±
3
Dor
al G
old
HP
6.4
± 0
.481
± 4
0.16
± 0
.03
< 1
.13.
6 ±
0.3
*32
± 3
Dor
al S
ilver
100
s H
P6.
3 ±
0.2
113
± 8
0.15
± 0
.02
< 1
.13.
5 ±
0.3
0.70
± 0
.07
37 ±
4
Ken
t Gol
den
SP7.
2 ±
0.4
101
± 7
0.13
± 0
.01
< 1
.13.
1 ±
0.2
*28
± 2
Koo
l Gre
en M
enth
ol H
P10
.7 ±
1.0
109
± 1
00.
19 ±
0.0
4<
1.1
3.9
± 0
.60.
90 ±
0.2
353
± 5
Koo
l Gre
en M
enth
ol S
P9.
7 ±
0.8
133
± 9
0.19
± 0
.03
< 1
.14.
6 ±
0.4
0.82
± 0
.08
52 ±
2
Mar
lbor
o G
old
100s
HP
10.8
± 1
.411
8 ±
70.
14 ±
0.0
4<
1.1
3.3
± 0
.40.
82 ±
0.1
643
± 3
Mar
lbor
o G
old
100s
SP
12.1
± 1
.613
2 ±
11
0.16
± 0
.03
< 1
.13.
9 ±
0.3
0.78
± 0
.17
51 ±
5
Mar
lbor
o G
old
HP
10.4
± 0
.312
8 ±
10
0.15
± 0
.03
< 1
.13.
3 ±
0.3
0.72
± 0
.06
44 ±
5
Mar
lbor
o G
old
Men
thol
HP
8.5
± 0
.711
4 ±
15
0.14
± 0
.02
< 1
.13.
0 ±
0.4
0.63
± 0
.11
37 ±
2
Mar
lbor
o G
old
SP9.
4 ±
1.8
123
± 1
60.
12 ±
0.0
6<
1.1
2.7
± 0
.8*
45 ±
7
Mar
lbor
o G
reen
Men
thol
HP
12.3
± 3
.812
3 ±
18
0.16
± 0
.01
< 1
.13.
2 ±
0.4
0.76
± 0
.16
43 ±
3
Mar
lbor
o R
ed 1
00s
HP
13.9
± 0
.715
4 ±
80.
21 ±
0.0
3<
1.1
4.7
± 0
.51.
06 ±
0.2
057
± 4
Mar
lbor
o R
ed 1
00s
SP12
.8 ±
1.1
135
± 1
70.
18 ±
0.0
3<
1.1
4.1
± 0
.71.
00 ±
0.1
850
± 5
Mar
lbor
o R
ed H
P12
.1 ±
0.5
140
± 7
0.19
± 0
.05
< 1
.14.
0 ±
0.2
0.92
± 0
.06
50 ±
4
Mar
lbor
o R
ed S
P13
.1 ±
0.5
151
± 3
0.20
± 0
.02
< 1
.14.
3 ±
0.3
1.03
± 0
.10
55 ±
3
Mar
lbor
o R
ed L
abel
HP
11.2
± 1
.112
9 ±
15
0.19
± 0
.04
< 1
.13.
8 ±
0.6
0.87
± 0
.30
44 ±
6
J Anal Toxicol. Author manuscript; available in PMC 2015 August 18.

Author M
anuscriptA
uthor Manuscript
Author M
anuscriptA
uthor Manuscript
Pappas et al. Page 19
Inte
nse
Smok
e R
egim
en R
esul
tsA
sC
dC
oC
rM
nN
iP
b
Mar
lbor
o Si
lver
100
s H
P8.
1 ±
1.0
112
± 1
60.
13 ±
0.0
2<
1.1
2.6
± 0
.3*
35 ±
3
Mar
lbor
o Si
lver
HP
8.4
± 0
.899
± 1
60.
13 ±
0.0
4<
1.1
2.7
± 0
.5*
34 ±
3
Mav
eric
k G
old
100s
HP
10.2
± 0
.910
3 ±
50.
22 ±
0.0
5<
1.1
4.3
± 0
.30.
95 ±
0.1
533
± 3
Mer
it G
old
HP
5.7
± 0
.610
9 ±
11
0.12
± 0
.03
< 1
.12.
1 ±
0.2
*35
± 4
Mis
ty B
lue
Slim
s8.
1 ±
1.1
85 ±
21
0.17
± 0
.03
< 1
.13.
2 ±
0.4
0.77
± 0
.13
33 ±
2
New
port
Gre
en K
ing
SP M
enth
ol7.
3 ±
1.4
120
± 3
10.
27 ±
0.0
4<
1.1
3.8
± 0
.6*
35 ±
8
New
port
Gre
en M
enth
ol 1
00s
HP
7.3
± 1
.911
4 ±
19
0.30
± 0
.09
< 1
.13.
9 ±
0.8
0.88
± 0
.22
32 ±
6
New
port
Gre
en M
enth
ol H
P7.
3 ±
1.5
125
± 1
40.
27 ±
0.0
8<
1.1
4.1
± 0
.70.
90 ±
0.1
732
± 5
Now
Gol
d 10
0s S
P4.
9 ±
0.9
91 ±
90.
14 ±
0.0
1<
1.1
2.3
± 0
.2*
26 ±
2
Pall
Mal
l Blu
e8.
8 ±
1.0
125
± 1
20.
21 ±
0.0
4<
1.1
4.4
± 0
.61.
04 ±
0.1
438
± 6
Parl
iam
ent B
lue
HP
6.5
± 0
.290
± 7
0.13
± 0
.01
< 1
.12.
5 ±
0.2
*33
± 1
Sale
m G
old
100s
8.9
± 0
.612
9 ±
40.
18 ±
0.0
3<
1.1
3.9
± 0
.30.
92 ±
0.0
741
± 4
Sale
m G
old
HP
8.0
± 0
.711
4 ±
90.
19 ±
0.0
4<
1.1
3.9
± 1
.10.
87 ±
0.1
638
± 7
Sale
m G
reen
HP
Men
thol
10.5
± 1
.113
0 ±
90.
22 ±
0.0
5<
1.1
4.7
± 0
.51.
09 ±
0.2
252
± 3
Sale
m S
ilver
100
s H
P M
enth
ol6.
8 ±
0.8
127
± 1
20.
15 ±
0.0
4<
1.1
3.4
± 0
.20.
70 ±
0.1
336
± 3
Tru
e Si
lver
SP
6.6
± 0
.788
± 7
0.22
± 0
.02
< 1
.14.
0 ±
1.0
0.88
± 0
.10
32 ±
3
USA
Gol
d 10
0s S
P8.
4 ±
0.4
95 ±
50.
20 ±
0.0
2<
1.1
3.2
± 0
.2*
40 ±
2
Van
tage
SP
7.6
± 0
.511
2 ±
16
0.15
± 0
.01
< 1
.13.
4 ±
0.4
*42
± 6
Vir
gini
a Sl
ims
Gol
d 10
0s H
P8.
1 ±
0.7
94 ±
13
0.14
± 0
.02
< 1
.12.
6 ±
0.2
*43
± 3
Win
ston
Gol
d H
P9.
0 ±
0.7
140
± 2
50.
24 ±
0.0
3<
1.1
3.8
± 0
.61.
04 ±
0.2
537
± 7
Win
ston
Red
100
s H
P10
.4 ±
2.3
150
± 1
60.
20 ±
0.0
4<
1.1
4.3
± 0
.31.
01 ±
0.2
044
± 4
Win
ston
Red
HP
8.5
± 2
.514
2 ±
35
0.17
± 0
.04
< 1
.13.
8 ±
1.0
0.94
± 0
.16
40 ±
10
Win
ston
Whi
te 1
00s
HP
7.9
± 1
.513
2 ±
12
0.16
± 0
.04
< 1
.13.
5 ±
0.4
0.84
± 0
.18
34 ±
3
2R4F
§9.
9 ±
0.8
168
± 1
80.
17 ±
0.0
4<
1.1
3.6
± 0
.40.
76 ±
0.1
341
± 5
3R4F
§9.
9 ±
0.9
152
± 1
50.
15 ±
0.0
2<
1.1
3.2
± 0
.30.
75 ±
0.1
235
± 2
CM
6§10
.9 ±
0.9
176
± 1
50.
10 ±
0.0
2<
1.1
1.9
± 0
.20.
76 ±
0.1
441
± 3
* One
or
mor
e of
the
hept
uplic
ate
resu
lts w
as <
0.5
0 ng
/cig
aret
te.
§ Dat
a fr
om >
30
anal
ytic
al r
uns.
All
bran
d na
mes
are
trad
emar
ks o
f th
e re
spec
tive
man
ufac
ture
rs.
J Anal Toxicol. Author manuscript; available in PMC 2015 August 18.

Author M
anuscriptA
uthor Manuscript
Author M
anuscriptA
uthor Manuscript
Pappas et al. Page 20
Tab
le 5
Mul
tivar
iate
Sta
tistic
al A
naly
sis
Res
ults
for
As,
Cd,
and
Pb
Phy
sica
l Par
amet
ers
- In
tens
e R
egim
en
Ars
enic
Cad
miu
mL
ead
Par
amet
ert
rati
op
t ra
tio
pt
rati
op
Rod
Len
gth
2.97
0.00
310.
370.
7092
5.68
<0.
0001
Filte
r L
engt
h−
0.43
0.66
973.
180.
0016
−0.
320.
7496
% T
ip V
entil
atio
n−
1.28
0.19
99−
2.93
0.00
37−
0.99
0.32
14
Pape
r Po
rosi
ty1.
880.
0608
−1.
230.
2199
−1.
370.
1725
Tob
acco
Wei
ght
6.49
<0.
0001
5.2
<0.
0001
3.78
0.00
02
Pres
sure
Dro
p Sh
ut−
0.95
0.34
281.
890.
0600
2.62
590.
1061
Phy
sica
l Par
amet
ers
- IS
O R
egim
en
Ars
enic
Cad
miu
mL
ead
Par
amet
ert
rati
op
t ra
tio
pt
rati
op
Rod
Len
gth
4.7
<0.
0001
−0.
960.
3402
4.52
<0.
0001
Filte
r L
engt
h−
1.66
0.09
50−
0.09
0.92
88−
0.94
0.34
60
% T
ip V
entil
atio
n−
3.32
0.00
10−
3.62
0.00
03−
2.54
0.01
16
Pape
r Po
rosi
ty0.
380.
7011
−2.
70.
0074
0.89
0.37
16
Tob
acco
Wei
ght
6.38
<0.
0001
4.39
<0.
0001
3.29
0.00
11
Pres
sure
Dro
p Sh
ut−
2.09
0.03
73−
1.85
0.06
48−
3.11
0.00
20
J Anal Toxicol. Author manuscript; available in PMC 2015 August 18.