r3 itea journal jun15
TRANSCRIPT
36(2) • June 2015 | 121
Twenty-one Parameters for Rigorous, Robust, and Realistic Operational Testing
Richard A. Kass, Ph.D.Senior Analyst, GaN Corporation
(d/b/a Geeks and Nerds®)
Parameters for designing rigorous, robust, and realistic operational tests are proposed. Theseparameters unite principles of Design of Experiments (DOE) with test architecture and testexecution considerations.
Keywords: design of experiments, operational test rigor, robustness, and realism
ITEA Journal 2015; 36: 121-138Copyright © 2015 by the International Test and Evaluation Association
OverviewThis paper proposes 21 parameters for designing and
executing rigorous, robust, and realistic operationaltests (OT) within the larger context of implementingDesign of Experiments (DOE) into testing. These 21parameters supplement classical seven-step design andanalysis approaches to DOE (Montgomery, 2011, 2012)by providing rationale and examples for implementingbasic DOE concepts such as power and confidence, sys-tematically varying variables, randomization, control,and factor resolution. These parameters also expand testdesign steps to include considerations for covering theoperational envelope and operational realism. The ter-minology and examples derive from Army T&E, butthese 21 parameters should have wide applicability.
Director Operational Test and Evaluation (DOT&E,October 2010; June 2013; and July 2013) has publishedguidance for implementing DOE methodology into OT.A key DOT&E statement revises the goal of OT.
The goal of operational testing is not solely to verifythat a threshold requirement has been met in a sin-gle or static set of conditions. I advocate the use ofDOE to ensure that test programs (including inte-grated testing where appropriate) are able to deter-mine the effect of factors on a comprehensive set ofoperational mission-focused and quantitativeresponse variables. The determination of whetherrequirements have been met is also a test goal, butshould be viewed as a subset of this larger andmuch more important goal. [DOT&E June 2013op.cit. p.1, underline added]
This is a paradigm shift. Prior to this statement,Army OT focused on determining whether systems metrequirements in an operational environment. Now, wewill test to determine if and where system performancevariations occur across battlefield conditions. Require-ment verification in an operational environment is stillessential but now a secondary goal. Characterizing per-formance across operational battlespaces is the super-seding goal that drives test scope and provides sufficientdata to verify requirements.
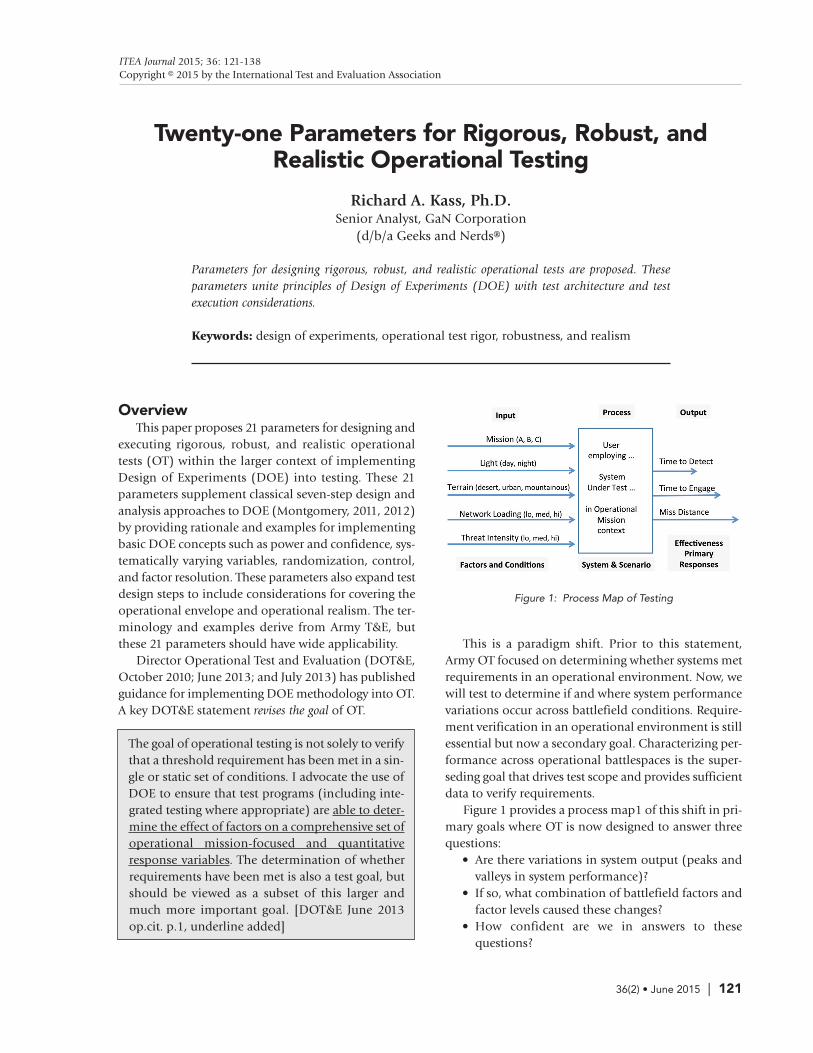
Figure 1 provides a process map1 of this shift in pri-mary goals where OT is now designed to answer threequestions:
• Are there variations in system output (peaks andvalleys in system performance)?
• If so, what combination of battlefield factors andfactor levels caused these changes?
• How confident are we in answers to these questions?
Figure 1: Process Map of Testing
Kass
122 | The ITEA Journal
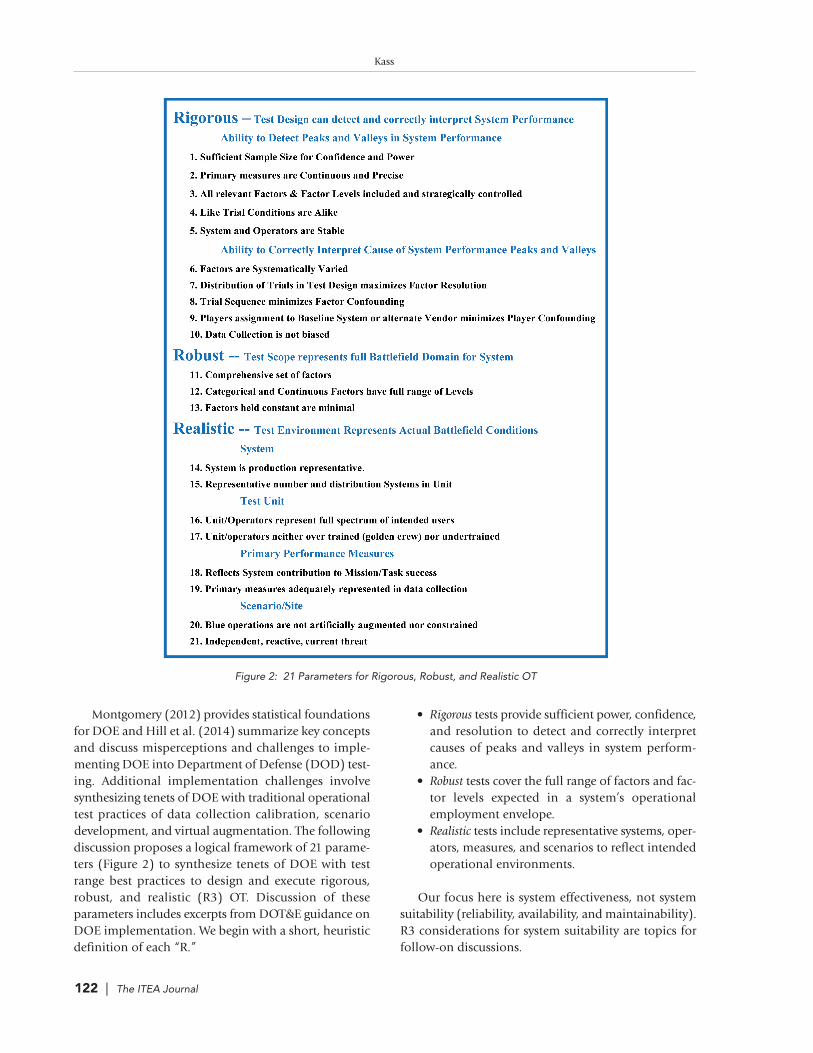
Montgomery (2012) provides statistical foundationsfor DOE and Hill et al. (2014) summarize key conceptsand discuss misperceptions and challenges to imple-menting DOE into Department of Defense (DOD) test-ing. Additional implementation challenges involvesynthesizing tenets of DOE with traditional operationaltest practices of data collection calibration, scenariodevelopment, and virtual augmentation. The followingdiscussion proposes a logical framework of 21 parame-ters (Figure 2) to synthesize tenets of DOE with testrange best practices to design and execute rigorous,robust, and realistic (R3) OT. Discussion of theseparameters includes excerpts from DOT&E guidance onDOE implementation. We begin with a short, heuristicdefinition of each “R.”
• Rigorous tests provide sufficient power, confidence,and resolution to detect and correctly interpretcauses of peaks and valleys in system perform-ance.
• Robust tests cover the full range of factors and fac-tor levels expected in a system’s operationalemployment envelope.
• Realistic tests include representative systems, oper-ators, measures, and scenarios to reflect intendedoperational environments.
Our focus here is system effectiveness, not systemsuitability (reliability, availability, and maintainability).R3 considerations for system suitability are topics forfollow-on discussions.
Figure 2: 21 Parameters for Rigorous, Robust, and Realistic OT
36(2) • June 2015 | 123
Test RigorTest rigor focuses on detecting systematic changes in
system performance and correctly interpreting causesfor these changes. Tested systems may exhibit perform-ance changes, peaks and valleysii in performance, dueto changes in battlefield conditions. Ability to detectperformance peaks and valleys is a signal-to-noise prob-lem and cause-and-effect problem combined. Truepeaks and valleys are signal effects to be detected againstvarious sources of random performance variations(noise). Test factors and conditions are potential causesof performance peak and valley effects. Rigor is con-cerned first with detecting performance differences,
followed by concern for correctly identifying causes ofthese variations. Signal detection problems are dis-cussed first.
Ability to Detect Peaks and Valleys in SystemPerformance
Parameters 1-5 increase detection of performancesignals. Parameter 1, sufficient sample size, is the mostrecognized technique. Parameters 2-5 serve to reducetest noise which indirectly enhances detection of per-formance signals, thereby reducing dependence onsample size. Confidence and power are test design metricsthat quantify ability to detect performance signals frombackground noise.
1. Sufficient sample size is necessary to ensureconfidence and power in test conclusions.
How much testing is enough; how many test trials areneeded? Answers to these questions are a two-stepprocess.
Step one is estimating power for a given confidencevalue and sample size. DOE software programs makethis calculation easy. Power calculation is based onchoosing a desired level of confidence and assumptionsabout tests’ ability to detect desired performance differ-ences (signal) from anticipated random performancevariation (noise).
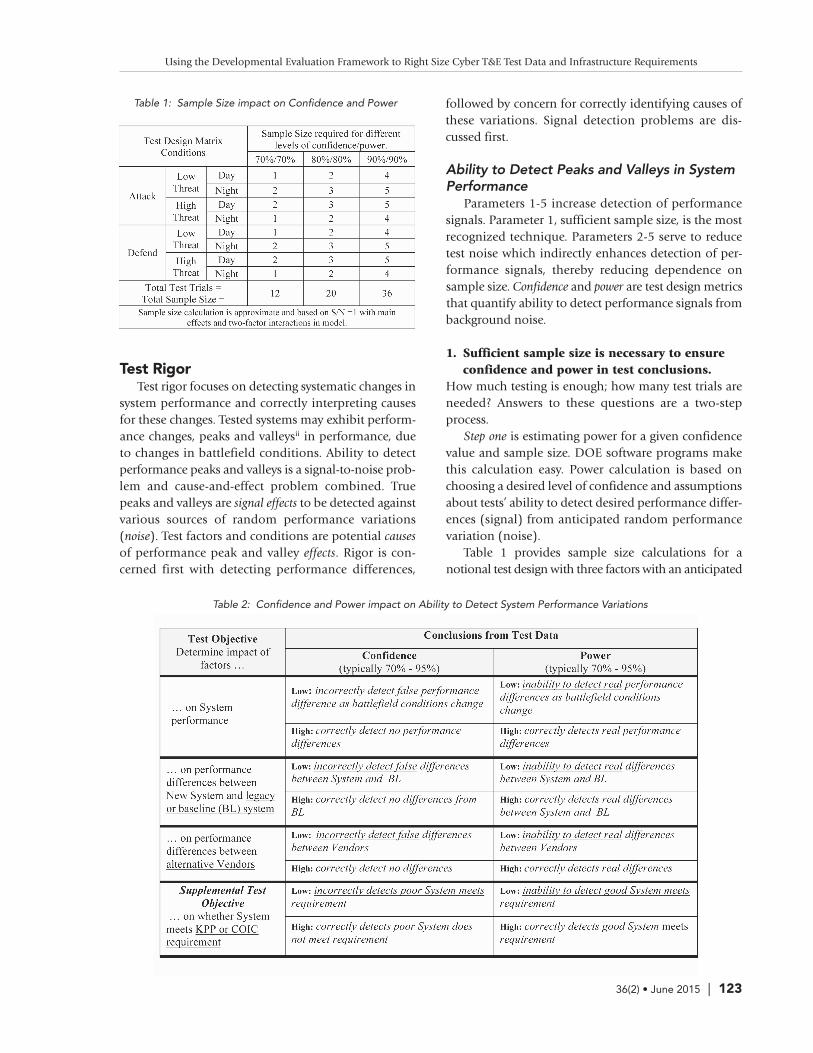
Table 1 provides sample size calculations for anotional test design with three factors with an anticipated
Table 1: Sample Size impact on Confidence and Power
Table 2: Confidence and Power impact on Ability to Detect System Performance Variations
Using the Developmental Evaluation Framework to Right Size Cyber T&E Test Data and Infrastructure Requirements

Kass
124 | The ITEA Journal
signal-to-noise (S/N) ratio of 1.0. S/N ratios compare themagnitude of factor effects on system performance to themagnitude of unaccounted remaining system variation(error). This comparison is represented in the numeratorand denominator of the t-or F-statistics.
In this example, S/N=1.0 indicates our tester antici-pates that differences between performance peaks andvalleys will be about the same magnitude as random sys-tem variation. Tests with more anticipated random vari-ation might require a smaller S/N, such as S/N=0.5.Smaller S/Ns reflecting more relative noise require largersample sizes to achieve equivalent power and confidence.
Examination of the “80%/80%” column indicates20 test trials will provide 80% confidence and 80%power in test conclusions. Individual rows indicate how20 test trials might be distributed across eight combi-nations of test conditions.
Step two is determining what levels of confidenceand power are acceptable for reporting credible results.To determine this, testers and decision makers considerconsequences of low or high levels of confidence andpower on possible test conclusions. Table 2 summarizesthese consequences for four different test objectivesiii.
How high should confidence and power be? Table1 illustrates that higher confidence and power requiremore test trials. There is no “one size fits all” answer. Acase can be made that acquisition systems providingbody and vehicle protection should be in the high 90swhile other systems might be in the low 90s or 80s.Testers, working with decision makers, need to weighrisks of providing misinformation against incrementaltest costs of adding additional trials.
Should confidence and power be the same level? Aca-demic journals focus on high statistical confidence (95%or 99%) in order to publish with statistical power is oftenat 60-70%. However in acquisition decisions, conse-quences of low power can be equally onerous as lowconfidence, as summarized in Table 2. Selection of powerand confidence levels should include discussions of S/Nassumptions, incremental test costs, and risks to inter-preting test results for decisions emanating from testing.
2. Primary measures of performance arecontinuous and precise.
Primary Performance Measures are Continuous
Choice of collecting continuous or binary responsemeasures greatly impacts test efficiency to achievedesired levels of confidence and power. Use of binaryresponse measures, such as those in Table 3, measureperformance signals more coarsely, thereby reducingS/N and increasing sample size requirements. Samplesize values provided previously in Table 1 are based ona continuous response variable. If a binary variable hadbeen considered instead, sample requirements toobtain 80% confidence and 80% power would havebeen closer to 110 instead of 20! Use of comparablecontinuous measures in place of binary measures yieldssubstantial test size-cost reductions.
But can we substitute continuous measures forbinary ones? Aren’t response measures determined bykey performance parameters (KPP) and critical opera-tional issue and criteria (COIC)? To reduce test costs,DOT&E guidance instructs Operational Test Agencies(OTAs) to substitute appropriate continuous measuresfor binary measures even when system requirements arewritten as binary measures.
Metrics must be mission oriented, relevant,informative, and not rigidly adhere to the nar-rowest possible interpretation of definitionsin requirements documents. Another pitfall to avoid is relying on binary metricsas the primary response variable on which to basetest design. I expect that even if the requirementsdefines a probability based metric, that great effortis extended to find a related continuous measureon which to base test design. We cannot affordtests based solely on the evaluation of probability-based metrics. [DOT&E, June 2013, op.cit. p.2]
Table 3: Some Binary and Related Continuous Measures

36(2) • June 2015 | 125
OT testers can and should substitute continuousmeasures for binary measures to right size tests. Typi-cally, requirement binary measures can be derived fromcollected continuous measures; for example computinghit probabilities from miss distance. Additionally, ana-lytic methods can estimate missing continuous valuesfrom censored time data. In practice, both measures canbe analyzed from collected data; but sample sizerequirements to achieve specific level of confidence andpower would be based on continuous measures –reducing test trials.
Primary performance measures are Precise(Reliable)
Whether performance responses are continuous orbinary, ability to detect performance differencesdepends on response measurement precision, heredefined as reliability and discriminant validity (Table4). Measurement reliability requires that identical per-formance outputs result in identical collected results(consistency). Measure reliability ensures trial-to-trialdifferences in system performance are not veiled due toinconsistencies in collection system performance.
Discriminant validity requires that different system
outputs yield different collection results. For example,collected data should accurately reflect the full range ofpeaks and valleys in system detect times under differenttrial conditions. There are two threats to discriminantvalidity. Collection systems can incorrectly produceconsistent output even when tested systems actuallyvary in output. Secondly, collection devices may pro-duce differentiated output but only for moderate out-puts, failing to yield lowest or highest values. Thisartificial capping is called ceiling or floor effects, respec-tively. Measurement discrimination ensures large per-formance differences are not artificially constrained bycollection devices. Services have standardized proce-dures for assessing reliability and discrimination in testinstrumentation. These two attributes can also beassessed and calibrated for player surveys, data collec-tors, and subject matter experts (SMEs).
The consistency and discrimination of data collec-tors (DCs) with entries on paper or electronic note-books can be assessed during data collector training byhaving DCs record similar and dissimilar incidents sev-eral times. SME measurements are more susceptible toinconsistencies since SMEs judge the value of activities.During SME training and pilot testing, SME consistency
Table 4: Calibration of Performance Measurement for Rigor and Realism
Twenty-one Parameters for Rigorous, Robust, and Realistic Operational Testing

Kass
126 | The ITEA Journal
and discrimination can be assessed when individualSMEs rate similar and dissimilar events at differenttimes. SME calibration occurs by having SMEs discusswhy similar events were rated differently or dissimilarevents were not rated differently. If needed, testers candevelop more observable anchors on rating forms tobetter focus SME ratings.
Training does not apply to building player surveyreliability and discrimination. Most player surveys pro-vide system-use context and diagnostic information;they do not measure overall system effectiveness. Thesediagnostic surveys are not a concern for test rigor. Insome OT however, player rating scales may provide pri-mary quantitative measures for “effectiveness” wherenew systems are specifically designed to reduce work-load or increase usability. In these cases, DOT&E (June2014) encourages use of industry established surveysthat have academically pre-calibrated reliability and dis-criminate validity. Remaining calibration goals in Table4 are discussed later.
3. All relevant factors and factor levels areincluded and strategically controlled.
The next rigor challenge is to identify all relevant factorsand factor levels in a test environment that can poten-tially cause variations in system or mission perform-ance. If any of the five factors in Figure 1 were notidentified as a test-design factor, but still occur duringtest execution, then the impacts of these unidentifiedconditions on system performance would be regulatedto “noise,” making it difficult to detect performance dif-ferences due to remaining factors.
Important factors must be strategically controlled in test design and execution.Significant factors must be controlled wheneverpossible; this will ensure coverage of the full oper-ational envelope. As an additional benefit, control-ling significant factors helps us to better explain thevariance in the data, leading to more meaningfulresults. [DOT&E June 2013, op.cit. page 3]
A comprehensive list of test factors and factor levelsimpacting tested performance includes test scenariosconditions, test range characteristics, and artifacts of testarchitecture such as different types of users, weather,inter-visibility, and so forth. Once identified, all rele-vant factors are accounted for in one of three controlcategories:
Strategically controlled: This includes factors that aresystematically varied or held constant during test exe-cution. Systematically varying or holding factors con-
stant are central to identifying causes of performancevariations and are discussed as parameter #6.
Uncontrolled but measured (recordable conditions):Some factors expected to impact system performanceare difficult to control during testing, but can be meas-ured. An example is inter-visibility between an aircraftand its target; difficult to control but measurable. Meas-uring atmospheric visibility with range instrumentationallows analysis techniques called analysis of covariance(ANCOVA) to statistically remove impacts of measura-ble uncontrolled factors; thereby reducing performancevariation noise.
There is always a tug in OT between allowing tacticalconditions to flow and record them as they occur topromote operational realism (discussed later); or strate-gically controlling these tactical conditions to enhancetest rigor and robustness. When the goal of the test isto characterize system performance, recording free-flow-ing tactical conditions is rarely useful. If these tacticalconditions will have a strong impact on system per-formance then use of ANCOVA to statistically removethem from consideration is not a good option. Disad-vantages to test rigor and robustness when critical con-ditions are allowed to tactically vary are discussed underparameters #6 and #12.
Uncontrolled and not measured: These are conditionsimpacting system performance that can neither be con-trolled nor measured during testing. These noise factorsmight include different levels of operator proficiencyand fluctuations in weather. Tests with many uncon-trolled, unmeasured factors increase test noise makingit more difficult to detect true performance differences.Blocking test trials is a primary technique to reduceimpacts of this noise.
Blocking test trials is a strategic design technique toreduce impacts of artificial noise induced incidental totest-execution, thus increasing test efficiency. Blocking
Figure 3: Test Design With and Without Blocking

36(2) • June 2015 | 127
does this by attributing some of the noise to blockingfactors thereby reducing our estimate of overall testnoise, residual error.
Blocking test trials is best illustrated with an exam-ple, presented in Figure 3. In the blocking example, testdays serve as a blocking factor to remove impacts ofday-to-day uncontrolled, changing conditions (weather,visibility, player learning, etc.) that might cause day-to-day fluctuations in system performance, thus poten-tially masking performance differences due to thesystematically-varied trial conditions. In this example,blocking would remove day-to-day noise from residualtest error but would not remove trial-to-trial noisewithin each individual day of testing. Appropriateapplication of blocking test trials can greatly reduce esti-mates of test noise.
4. Like trial conditions are alike.Systematically varied trial conditions require repeatableconditions during execution. All planned test trials des-ignated to be a high level of a factor (e.g. high networkloading, high jamming, or high altitude) should be exe-cuted with similar high levels of network loading, jam-ming, and altitude. Similarly, execution of the low levelsof these factors needs to be, in fact, lower and the lowlevel consistently applied to subsequent low-level trials.Inconsistent execution of like-trial conditions increasesperformance variability making it difficult to detect per-formance differences between factor levels as illustratedin the following examples:
• Factors with categorical levels: All designated nighttrials should be conducted during periods of dark-ness and not allowed to start early or end lateincorporating day-light conditions. If execution ofday versus night trials is not distinct and consis-tent, it may be difficult to detect true differencesin performance due to day-versus-night condi-tions.
• Factors with continuous levels: Tests employingthreat jammers to disrupt Blue Force communi-cations should include an independent measureof jamming signals received at intended areas inorder to verify actual levels of jamming impactingBlue Forces. While jammer operators can recordjammer output levels; without an independentreceiver located down range, testers do not knowif intended high or low jamming actually arrivedat target areas; or whether received jamming levelsfluctuated during jamming intervals. Inability todeliver consistent jamming intensities (high orlow) for multiple like-trial conditions decreasestest rigor.
Similar difficulties can occur when stimulations (viamodeling and simulation (M&S)) are employed to cre-ate trial conditions such as network loading or higherlevels of threat activity. Part of verification, validation,and accreditation (VV&A) for M&S use in OT ensuresconsistent levels of stimulation are recreated for similarsubsequent trials. Stimulations should be monitoredreal-time during trial execution and recalibratedbetween trials, if necessary, to ensure like trials areindeed alike.
5. Tested system and operators are stable.A stable system yields similar outputs given similarinputs. Inconsistent output can result from unstablesystems (software or hardware) or inconsistent opera-tors. Variation due to either can mask trial-to-trial per-formance differences. Rigorous test design strategiesavoid “fixing” systems after each trial when the test goalis to assess impacts of trial conditions on system per-formance. If system fixes must be incorporated duringtest execution, it is best to group system fixes at specificbreaks between test trials and add another factor (pre-and post-fix blocking factor) to the test design.
Stable operators provide consistent operation of sys-tems through successive trials. Variations in operatorperformance may be due to inexperience with new sys-tems. Well-trained, consistently performing operatorsreduce performance variation, thereby increasingchances of detecting true shifts in system performance.
Test Indices of Ability to Detect PerformanceSignals
An early indication of how well test design andarchitecture will reduce test noise to make detection ofsystematic performance changes more efficient is to exe-cute test trials with identical conditions during pilottesting (called replication trials). Any variation in systemperformance between replicated trials indicates noisecaused by instability in data collection (P-2), insuffi-cient factors and factor levels to characterize system andtest architecture (P-3), inability to hold like test condi-tions alike (P-4), or instability in system and operators(P-5). System performance variation between replicatedtrials is an early index of lower test rigor.
It should be noted that increasing sample size (P-1)will allow tests with larger noise to still displaydetectable signals. Efficient test designs however, findperformance signals by decreasing noise, rather thanincreasing test size.
Post-test data analysis can provide a more compre-hensive indicator analogous to signal-to-noise detec-tion. All DOE analysis programs provide a numerical
Twenty-one Parameters for Rigorous, Robust, and Realistic Operational Testing
128 | The ITEA Journal
Kass
index of total performance variability that can be attrib-uted to test factors (signal). This R-Squared (R2) indexiv
varies from 0 to 1.0 with high values (0.7 - 0.9) indi-cating that most system performance variability duringtesting was due to test factors, which is analogous to ahigh signal-to-noise detection. Lower R2 values indicatemost system variability could not explain by test factors,indicating we did not learn why our tested system per-formed as it did. Low R2 values would prompt testersto review one or more of the first five rigor parameters.
Ability to Correctly Interpret Cause of SystemPerformance Peaks and Valleys
Confounding factors must be avoided. I have observed cases where the test plan varies fac-tors in such as a way as to confound the effects, evenwhen it was eminently feasible to avoid doing so.…Test strategies that confound factors are uninforma-tive, inefficient, eliminate the ability to predict per-formance in other conditions, and preclude theability to determine which factor affects perform-ance the most. [[DOT&E, June 2013, op.cit. page 3]
Given that test designs have sufficient rigor to detectpeaks and valleys in system performance, the next logicalquestion is “What caused these variations?” Determina-tion of causality is critical to explaining where and whenperformance peaks and valleys will occur on battlefields.
Inability to identify causes of system variation is theproblem of confounding. Confounded results yield twoor more potential explanations for an individual per-formance peak or valley. Confounded results are not use-ful; system developers will not know what to fix andWarfighters will not know what to expect on battlefields.
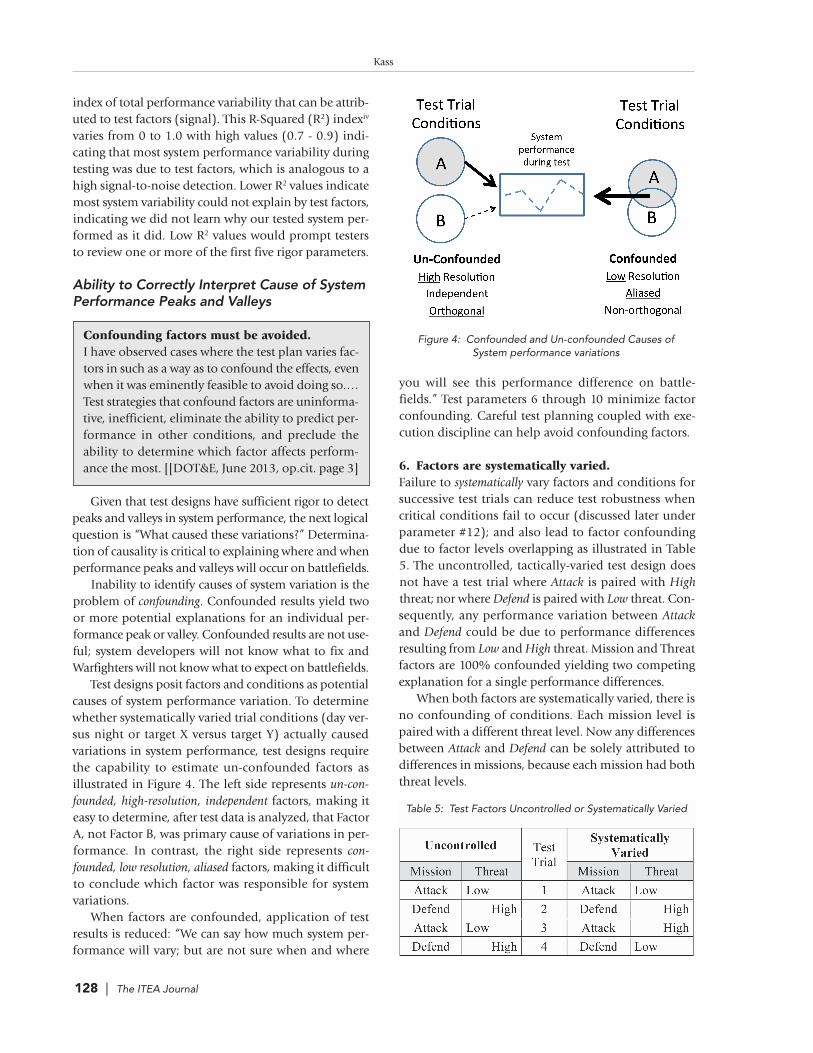
Test designs posit factors and conditions as potentialcauses of system performance variation. To determinewhether systematically varied trial conditions (day ver-sus night or target X versus target Y) actually causedvariations in system performance, test designs requirethe capability to estimate un-confounded factors asillustrated in Figure 4. The left side represents un-con-founded, high-resolution, independent factors, making iteasy to determine, after test data is analyzed, that FactorA, not Factor B, was primary cause of variations in per-formance. In contrast, the right side represents con-founded, low resolution, aliased factors, making it difficultto conclude which factor was responsible for systemvariations.
When factors are confounded, application of testresults is reduced: “We can say how much system per-formance will vary; but are not sure when and where
you will see this performance difference on battle-fields.” Test parameters 6 through 10 minimize factorconfounding. Careful test planning coupled with exe-cution discipline can help avoid confounding factors.
6. Factors are systematically varied. Failure to systematically vary factors and conditions forsuccessive test trials can reduce test robustness whencritical conditions fail to occur (discussed later underparameter #12); and also lead to factor confoundingdue to factor levels overlapping as illustrated in Table5. The uncontrolled, tactically-varied test design doesnot have a test trial where Attack is paired with Highthreat; nor where Defend is paired with Low threat. Con-sequently, any performance variation between Attackand Defend could be due to performance differencesresulting from Low and High threat. Mission and Threatfactors are 100% confounded yielding two competingexplanation for a single performance differences.
When both factors are systematically varied, there isno confounding of conditions. Each mission level ispaired with a different threat level. Now any differencesbetween Attack and Defend can be solely attributed todifferences in missions, because each mission had boththreat levels.
Figure 4: Confounded and Un-confounded Causes of System performance variations
Table 5: Test Factors Uncontrolled or Systematically Varied

36(2) • June 2015 | 129
If Threat had been held constant at high in the un-controlled design, comparisons between Attack andDefend would be un-confounded because both missionlevels would experience the same high threat level.Holding some conditions constant can eliminatepotential confounding when systematically varyingthose conditions is not an option. Unfortunately, thisreduces test robustness, discussed later.
Some factors may be difficult to systematicallychange trial to trial. For example, a test team may needan entire administrative day to move test executionfrom desert to mountainous terrain. Sophisticated split-plot test designs are available when it is more econom-ical to group test trials into discrete “hard to change”conditions.
7. Distribution of trials in test design maximizesfactor resolution.
Even when all test conditions are systematically varied,factor confounding can still occur when there are emptytest cells in the test design matrix, or there is an unbal-anced distribution of trials (Table 6). This confoundingis termed factor aliasing. Design resolution represents theextent of non-aliasing, independence among test factors.
Not all factor aliasing is equally harmful. We oftenrequire tests with large numbers of factors and levels tohave some empty cells to economize test costs, as illus-trated later in Table 10. These empty cells can be allo-cated in specific, balanced patterns to minimize factoraliasing for main effects and lower order factor interac-tions. DOE software programs provide an index of fac-tor aliasing, called variance inflation factorV (VIF); andallocate placement of test points to minimize factoraliasing (test rigor) while maximizing coverage of factormain effects and important lower order interactions.
While factor aliasing is a source of factor confound-ing, this confounding could be fixed post-test by exe-cuting additional test trials to selectively fill-in missingor unbalanced test cells. Other sources of confounding(parameters 6, 8, 9, and 10) are not fixable post-test,meaning we are stuck with a non-rigorous test.
8. Trial sequence minimizes factor confounding.Even when factors are systematically varied and theirdistribution supports sufficient factor resolution, con-founding still occurs if the sequence of trial executionis inappropriate. Figure 5 illustrates impacts of trialsequencing on factor confounding.
Imagine a new test officer is to design a quick four-day test to assess whether a New System performs betterthan the Current System. Our test officer might employSequence #1 in Figure 5. In this “natural” design, the
Table 6: Test Design with Empty or Unbalanced Trials
Figure 5: Results of Three Test-Trial Sequences
Twenty-one Parameters for Rigorous, Robust, and Realistic Operational Testing

Kass
130 | The ITEA Journal
test unit operates Current System in first two trials andNew System in last two trials.
To illustrate problems with Sequence #1, we quan-tify what can happen in each separate trial to producetest results. The three numbers below each test trialquantify system effect, order effect (learning effect), andobserved results. In this example, system effect is heldconstant by making the first number equal to “1” forall four trials. Designating system effect constant indi-cates that Current and New systems are equivalent incapability. Consequently, any observed differencesbetween systems during testing must have resulted fromsome other factor.
The other factor in this example is a “learningeffect.” Each test day our test unit gets better; repre-sented by increasing the second number for each suc-cessive trial. The third number represents test resultsobtained by adding system and learning effects. Whentest analysts use this third number in Sequence #1, theyconclude New System greatly outperformed CurrentSystem, 7 versus 3. This incorrect conclusion was dueto a learning-effect factor, not system factor.
The balanced design in Sequence #2 helps some, butdoes not eliminate confounding. Only the counterbal-anced design Sequence #3 provides interpretable results.In all three designs, test officers faithfully executed alltrials and collected all data; but inadequate trialsequences in designs 1 and 2 rendered these two testsuseless for comparing systems.
While it is easy to establish a best sequence in thissmall notional example, it is not so easy in tests withmultiple factors and factor levels. In complex testdesigns where the number of test trials is large, usingDOE software to randomize trial sequence for test exe-cution works well.
9. Player assignment to baseline system oralternate vendors minimizes system factorconfounding.
Parameters 6-8 discussed thus far are considerations forreducing confounding in every test design. Parameter#9 is only applicable to tests that involve system-versus-system comparisons:
(a) comparison of new systems with their legacy orbaseline (BL) systems, (b) comparison of alternativesystem configurations, or (c) comparison of alternativevendor prototypes. In all three system-versus-systemtests, assignment of test players (operators or test units)to alternate systems is critical to interpreting causes ofsystem differences.
System-versus-system testing does not occur often.Most tests involve a single player unit operating a single
new system (with multiple prototypes to outfit testunits) across all test conditions as illustrated in Table7. Assignment of a player unit to operate this system isnot an issue for test rigor but is an issue for test robust-ness and test realism. For example, we can still have arigorous test (detect effects and interpret causes) even ifsystem contractors were to operate tested systems. How-ever, we would not have robust or realistic testing becausewe could not apply these rigorous conclusions tointended users in an operational environment.
In contrast, player assignment is a major challengein system-versus system testing. A notional test to com-pare alternative vendors is displayed in Table 8. In thisexample, Vendor X and Y systems are totally con-founded with test unit. If there is a performance differ-ence between the two vendor rows, we would not knowif differences were due to real differences between ven-dors or due to real differences between player units.There are two traditional attempts to justify rigor of thisdesign, neither works well.
(1) Random assignment was used to decide which oftwo units were matched to a particular vendor. This isnot a viable option as the problem of separatingunit effects from vendor effects still exists, regard-less which unit operates which system. (2) The units are “declared equivalent” for militaryskills, combat experience, prior test scores, etc. This isalso not a viable option as traits that determinemission success are not easily measurable.
Table 9 illustrates four rigorous designs for system-versus-system tests comparing alternative vendors. Eachdesign minimizes unit-vendor confounding and eachhas advantages and disadvantages.
Design 1: Multiple Units crossover to Alternate Vendors:Each unit operates each vendor’s systems. Unit-vendor
Table 7: Test Design matrix where Single Unit conductsall trials employing New System
Table 8. Non-rigorous Test Design comparing two alternate Vendors

36(2) • June 2015 | 131
confounding is neutralized because unit differencesimpact each vendor equally. This design works best whenthere are only two or three competing vendors and littleadditional training is required to move from one vendorsystem to another. The trial sequence would not be com-pletely randomized. To ensure comparability betweenvendors, first randomize the sequencing of 16 trials forVendor X and then mirror this sequence for Vendor Y.
Design 2: Single Unit crossover to Alternate Vendor: Asingle player Unit operates each vendor’s system elimi-nating player-system confounding. This design worksbest when the transition from vendor to vendor aftereach trial is easy. Unfortunately, total test time isincreased, since a single unit cannot execute both ven-dor trials simultaneously. As above, trial sequencewould be randomized for one vendor, and the secondvendor mirrors this sequence. The overall test sequencewould inter-mingle vendor trials to ensure each vendor
had equal opportunities to “go first.” This mitigatespotential player learning enhancing the vendor per-formance that always went second.
Design 3: Multiple Units crossover to BL: Each unitoperates a single vendor system and the baseline (BL)legacy system. Unit-vendor confounding is neutralizedas long as comparisons between vendor and BL arewithin a unit to determine which vendor produced alarger delta from its BL, as in Situation A in Figure 6. Arigorous conclusion can be made that Vendor X pro-vides better improvement over our BL system eventhough Vendor Y had more successes.
In Situation B, the addition of a baseline operatedby an independent unit does not provide test rigor.Each vendor and BL is confounded with performanceof its test unit. One cannot conclude how much of eachsystem-unit result (X, Y, or BL) is due to inherent dif-ferences between units or due to real differencesbetween systems.
Crossover designs illustrated in Situation A are use-ful when vendor training is complex. Each test unit onlytrains on a single vendor system. There are disadvan-tages. Direct comparisons between vendors are con-founded and only comparison between a vendor andits BL are valid. Additionally, there are 50% fewer ven-dor trials for the same total trials in Designs 1 and 2.Finally, test results may indicate a vendor with thefewest overall successes is the better performer (as inSituation A) – a difficult result to explain.
Table 9. Rigorous Test Designs comparing two alternative Vendors
Figure 6: Example Results of Testing Vendors X and Y with Baseline (BL)
Twenty-one Parameters for Rigorous, Robust, and Realistic Operational Testing

132 | The ITEA Journal
Kass
Design 4: Multiple Player Random Assignment to Ven-dors. While random assignment of participants to alter-native treatments is a “gold standard” in rigorousmedical research, it is seldom applicable to acquisitiontesting. Random player assignment is only meaningfulin a subset of system-versus-system designs where eachvendor has multiple prototypes that are operated inde-pendently or for a single prototype that can be operatedby alternate operators sequentially and independentlyin relatively short vignettes. Generally this occurs whentesting new systems for individuals, such as modifica-tions to individual weapons, body armor, hearing pro-tectors, parachutes; and each individual soldier-systemreceives an independent score.
For random assignment to work in our example, wewould need an initial pool of 20 or more potentialoperators/players to randomly assign at least 10 to eachvendor’s prototype to ensure that one or two outliers ina group of 10 would not greatly impact the group aver-age for an individual vendor. Advantage of this designis that each operator only needs to be trained on a sin-gle vendor’s system. The disadvantage is that each ven-dor needs sufficient prototypes to accommodate all 10operators and each operator is expected to operate indi-vidually and independently, not as a cohesive unit. Thesequence of test conditions for each vendor should mir-ror each other.
10. Data collection is not biased.Data collection inconsistencies and lack of discriminationwere discussed earlier in parameter #2. Here we are con-cerned with convergent validity (see Table 4) to countermeasurement bias. A biased measure is one that is “consis-tently off mark” (consistently too high or too low).
Over or under measurement of system performanceis of greatest concern in system-versus-system testingwhere alternative systems or vendors are assessed withdifferent data collection capabilities: different instru-mented collection, different manual data collectors, ordifferent SMEs. Data collection bias makes it difficult todetermine if system differences are due to system or datacollection differences. For example, when new collectioninstrumentation is developed for “new” tested systemsand legacy systems are instrumented with “old” collec-tion devices, potential measurement bias exists. Bias canalso occur when test instrumentation is tailored foralternative vendors or when data collectors and SMEsare different for alternative systems and vendors.
To minimize collection bias, data collectors andSMEs should be systematically rotated among alterna-tive vendors and between new and legacy systems. Certification of test instrumentation should ensure that
collection devices for alternative systems provide equiv-alent results for equivalent system performance.
Robust
Test Scope Represents Full Battlefield Domainfor System
Rigorous tests, as just discussed, have strong internalvalidity (Shadish, et. al. 2007). Test rigor permits con-clusions about cause and effect to characterize systemperformance. The remaining 11 parameters pertain totests’ external validity. Test robustness, discussed here,indicates the extent that rigorous cause and effect con-clusions will apply across the entire operational enve-lope. Test realism indicates how well cause-and-effectconclusions from an individual test environment rep-resent actual battlefield causes and effects.
In this proposed framework test robustness pertainsto breadth of battlefield envelopes represented in indi-vidual test environments. Parameter #3 focused onincluding all conditions resident in a test environment.Test robustness is wider as it includes all conditionsfound in the system’s operational envelopes, even thosethat do not naturally occur in test environments. Adequatecoverage of systems’ operational employment environ-ments means all relevant factors and factor levels areidentified and assessed. Robustness of an individual testis a comparison of its design space to the tested system’sfuture operational space. After establishing a robust setof factors and conditions, sophisticated DOE space-fil-ing designs are available as well as fraction of designspace (FDS) metrics to ensure adequate trial coveragewithin a robust test design space.
11. Comprehensive set of factors
Factors varied in test must not be limited tothose defined in the requirements documents.…users will employ the system in conditions that aredifferent from those identified for system develop-ment and specification compliance. As operationaltesters we are responsible for evaluating a systemacross the conditions under which the system willactually be employed.…Replicating runs/eventsunder one condition (such as that identified inrequirements document is less informative than astrategic spread of runs/events across all relevant con-ditions. [DOT&E June 2013, op.cit. page 2]
OT should reflect a system’s full potential opera-tional environment. There are two keys to representing

36(2) • June 2015 | 133
all intended battlefield conditions in test events. First,gather experts from across a Service to augment andrefine factors and factor levels defined in systemrequirement documents and test support packages(TSPs). Secondly, these experts should assist in deter-mining the subset of factors that might cause variationsin system performance on its primary responses. Resultsof this effort can be summarized in a fishbone causeand effect diagram (Figure 7). Common mistakes indeveloping a robust set of factors are to list only thoseused in prior tests of similar systems, only list those inplayer unit training scenarios, or only list those avail-able at test sites.
Results from tests with limited robustness onlyapply to a portion of the intended operational enve-lope. However, a single robust test encompassing allconditions may not be affordable. Strategies for reduc-ing the number of factors and factor levels in a singletest are discussed under parameter #13.
12. Categorical and continuous factors have full range of levels.
Ensuring testing across the full range of factor levels for
categorical and continuous factors requires an initialidentification of the full range of conditions for eachfactor and then ensuring the full range occurs duringtest execution.
Categorical factors have discrete levels — differentmissions, different system configurations, differenttypes of targets, or different types of terrain. For exam-ple, if a new system will engage six different target types,but testing includes only four, our test is not robust.Some tests might require two levels of light (day andnight) and some tests four levels (day, dusk, night, anddawn); if four different levels could impact system per-formance differently.
Continuous factors have naturally continuous con-ditions — e.g., target speed 0-40 mph, range to target3-10 km, azimuth and elevation, network loading, andjammer power levels. Robust tests include low and highendpoints that represent true high and low operationalconditions. Having established robust endpoints,testers should not convert naturally continuous factorsto categorical factors. For example, converting targetspeed that ranges from 0-40 mph to two categorical lev-els of “stationary and moving” should be avoided. This
Figure 7. Cause and Effect Fishbone Diagram
Figure 8. Linear and Non-Linear Continuous Factors
Twenty-one Parameters for Rigorous, Robust, and Realistic Operational Testing

Kass
134 | The ITEA Journal
categorical conversion reduces consistency of the highend-point for target speed. For example, some trials des-ignated as moving may have target speeds as low as 10or 15 mph or as high as 30 or 40 mph. This violates testrigor parameter #4, calling subsequent like conditionsto be alike.
Additionally, continuous factors should ofteninclude mid points. Testing only at low and high endpoints assumes that any causal relationship betweenfactor levels and system performance is linear as in Fig-ure 8, graph A. If potential non-linear relationshipsbetween factors and system response are present, suchas in graphs B and C of Figure 8, testing without midpoints would not be sufficiently robust to assess non-linear effects.
Once a robust set of categorical and continuous con-ditions are included in test designs, we need to ensureall specified factor levels occur during test execution bystrategically controlling factors and sometimes aug-menting tests with simulations.
Important factors must be strategically con-trolled in test design and execution. Although … test design process identifies factors,the proposed run plan often relegates them torecordable conditions. This is a risky test strategybecause all levels of the factor of interest might notbe observed in the operational test. Significant fac-tors must be controlled whenever possible; this willensure coverage of the full operational envelope.[DOT&E, June 2013, op.cit. page 3]
Relegating factors to “recordable conditions”(DOT&E text box) allows test units to tactically varytheir operations and record these tactical variations, ifand when they occur. Recordable conditions are suffi-cient to promote test rigor as discussed under parameter#3 since their impact is statistically removed from sys-tem noise variation when they occur. However if record-able conditions do not occur, envelope coverage isreduced; reducing test robustness.
Augmenting tests via virtual methods is a means toachieve robustness in the face of limited assets. Battlecommand systems may require both live and simulatedoperational traffic to ensure full levels of system stresswhen it is cost prohibitive to including all “live” subor-dinate and adjacent units and systems in a test. Simi-larly, tactical networks may require stimulation to testoperationally high levels of network loading whenthere are insufficient transmitters for full communica-tions architectures.
13. Factors held constant are minimal.What if the list of robust factors and factor levels is quitelong? There are at least three strategies for reducing thenumber of factors for individual tests.
(1) Holding some test conditions constant is a commonstrategy to reduce test scope and save costs. For example,test only desert terrain instead of desert and forest, ortest only benign conditions instead of benign and jam-ming. Holding conditions constant reduces test costand maintains test rigor even though it reduces testrobustness.
Holding conditions constant makes sense when con-ditions are expensive to achieve or are simply uniqueconditions. For example, extreme environmental condi-tions may not be easily reproduced in field tests and aremore economically assessed in chamber testing. In thesesituations, it is usually more cost effective to address thefull spectrum of factors across separate assessmentevents (OT, DT, DT/OT, demonstrations, and M&S).While individual test events may not be fully robust, acampaign of assessment events may still provide arobust milestone assessment.
(2) Factor screening with sequential testing is a strategyfor reducing the number of factors in subsequent tests.This strategy loads early tests with all, or most, factorsand assesses (screens) these factors statistically. Any fac-tors found to be statistically insignificant is eliminatedfrom consideration in subsequent testing. Thus “factor-loading” early tests may serve to reduce scope require-ments for subsequent testing.
Constructing sequential test programs where earlytests screen-out unimportant factors to focus andreduce the size of subsequent tests have worked well inindustry but their application to acquisition testing maybe limited. In acquisition testing, systems-under-testcontinually evolve in functionality while the level ofmission participation also increases from early singleprototypes to fully equipped units for final testing.These evolving characteristics make it less likely that fac-tors eliminated in early prototype testing would notapply to subsequent full-up unit testing. Additionally,results of early screening tests may not be available untiljust weeks prior to start of subsequent testing, makingit practically difficult to apply information about non-relevant factors to the next, near-term sequential tests.
(3) Removing factors to reduce number of test trials hasminimal impact on reducing test trials for traditionalweapon system testing (see DOT&E text box). Addingor removing factors or factor levels does have someimpact on sample size requirements. However, impactsare relatively gradual as factors and levels increase asillustrated in the following example.

36(2) • June 2015 | 135
Understand that adding a condition/level/factor does not necessarily increase the size ofthe test.Although this effect is true for [full] factorialdesigns, many other design types exist to overcomethese difficulties and ensure testing adequately cov-ers the operational envelope without significantlyincreasing the necessary test resources.… Therefore,important factors should not be eliminated fromthe test design … in an attempt to avoid increasingthe test size. Instead, the test design should includeall operationally relevant factors and capitalize onthe statistical tenets of DOE which enable the testsize to remain manageable while ensuring the oper-ational envelope is covered adequately. [DOT&EJune 2013, op.cit. page 5]
Table 2 indicated a sample size of 20 is sufficient toachieve 80% confidence and 80% power for two factorswith four combinations. The notional test design inTable 10 has six factors with 64 combinations of con-ditions. Here, an increase of only 8 trials, a sample sizeof 28 instead of 20, is sufficient for 80% confidence andpower to evaluate all six main effects and two-factorinteractions. Moreover, factor aliasing (parameter #7)is minimal even with unbalanced and missing cells.
This 6-factor test with only 28 trials is robust. DOEstatistical modeling allows estimates of system perform-ance for all factors and factor levels even when mostindividual combinations are not tested! Test efficiencythrough DOE implementation.
Realistic
Test Environment Represents Actual Battle-field Conditions
Test results are only useful to the extent they saysomething about actual combat operations. Generaliz-ability is the scientific term for applying results outsideof test context. Test realism enhances generalizability oftest results to actual operational battlefield conditions.A realistic test requires realism in four areas: represen-tative systems under test, test players, performancemeasures, and test environment.
System Representative
14. System is production representative.Experienced test officers know it is an exception whentruly “production representative” systems show up fortest. The system test and evaluation master plan (TEMP)provides details on production representative capabili-ties and software versions. It is important to documentsystem software and hardware capabilities in the ver-sion available for test. Services have procedures for con-trolling system configuration during test execution.Testing immature prototypes yields less realistic results.Initial Operational Test and Evaluation (IOTE) eventsrequire fully realistic, representative systems.
15. Appropriate number and distribution ofsystems in unit
TEMPs and System Basis of Issue Plans (BOIP) provideinformation on distribution of new systems within andbetween operational units. The level of player unit(team, section, platoon, company, and battalion/squadron) appropriate for a realistic “fighting unit”depends on the unit level that will independentlyemploy the new system.
Test Unit Representative
16. Full spectrum of units/operators in testHow well do test players represent operators and actualunits that will eventually employ the new capability? Agood practice to ensure representative test players is toselect players directly from those operational unitsamong the first to receive the new capability. A chal-lenge to player representativeness occurs when new sys-tems are fielded to different types of units and only onetype of unit is assigned to test. In this situation, a cam-paign of multiple tests needs to show that the full range
Table 10: Test Design with Six Factors
Twenty-one Parameters for Rigorous, Robust, and Realistic Operational Testing

Kass
136 | The ITEA Journal
of units will be tested in different events. If not, multi-ple units need to participate in a single test event.
17. Unit/operators not over trained (goldencrew) nor undertrained
Realism requires appropriate levels of player training.If test units are under-trained or over-trained, true capa-bilities of new systems in the hands of typical users willbe misrepresented. Under-training can result from com-pressed schedules as well as new equipment training(NET) that focuses on operating new systems rather thanemploying them to maximize their capability. Unfortu-nately, too often initial pilot tests and first days ofrecord testing are used to improve system employmentprocedures. This is further rationale for randomizingtest-trial sequences as discussed under test rigor.
Over-training arises when player units undergoextensive training not planned for typical units receiv-ing fielded systems. The temptation is to over-train testunits to ensure success. Over-trained test units are“golden crews.” Our realism challenge is to producewell-trained, typical users as test players rather thanover- or under-trained unique players.
Primary Measures Representative
18. Primary measures reflect system contributionto mission/task success.
Metrics must be mission-oriented, relevant,informative, and not rigidly adhere to the nar-rowest possible interpretation of definitions inrequirements documents.Too often the goals of OT&E are not captured bytechnical performance requirements. This is espe-cially true when responses are limited to the tech-nical performance requirements of the systemunder test when, in fact, the mission capabilityrequires a system of systems to succeed. Ideal OTshould provide a measure of mission accomplish-ment (not technical performance for a single sys-tem), lend themselves to good test design (i.e. to becontinuous in nature), and in general comprehen-sively cover the reason for procuring the system.[DOT&E Memorandum, June 2013, op.cit. page 2]
Ensuring that primary measures directly reflect missionaccomplishment is easiest when system performanceresponses and mission measures are complimentary.This occurs rather easily for combat systems that engageenemy forces such as sensors and shooters: targetsdetected, identified, engaged, and destroyed. Measure
realism is more difficult when (a) tested systems are notexpected to have large impacts on mission success; and(b) when tested systems impact complex militaryprocesses.
Some tested systems do not have large impacts onunits’ capability to succeed. It is unrealistic to expect asoftware change to unit radios to have large impacts oncombat outcomes. In these cases, testers should lookfor meaningful “sub-mission” tasks that can beexpected to be more directly impacted.
Other tested systems may have a major impact onmission success, but mission success is a complex out-come such as increased information superiority,increased situational awareness, or improved commandand control. In these instances, system requirementstend to focus on technical, sub-aspects of the complexprocess supported. For example, increased messagecompletion rate is often an approximate measure forimproved command and control. When technical sys-tem measures are “too distant” to measure complexoperational process outcomes, testers add expert ratersto assess mission or process success. Ensuring realismof collected measures is discussed next.
19. Primary measures adequately represented indata collection
Table 4 summarized three calibration goals for test real-ism in data collection. Test agencies have establishedprocedures to calibrate and certified test instrumenta-tion to ensure it does not adversely impact the testedsystem (non-intrusive validity), it provides interpretabledata (face validity), and its output agrees with expecta-tions (concurrent validity). The following discussionfocuses on player surveys, data collectors, and SMEs.
Surveys are a key mechanism to obtain needed datato aid the operational evaluation. Properly designedsurveys, which measure the thoughts and opinionsof operators and maintainers, are, therefore, essen-tial elements in the evaluation of a system's opera-tional effectiveness and suitability. A substantialbody of scientific research exists on survey design,analysis, and administration that we should lever-age in OT&E. [DOT&E Memorandum, June 2014op.cit. page 1]
Similar to parameter #2, (DOT&E June 2014,op.cit.) pre-calibrated survey rating scales are useful tomeasure workload reduction or increase in systemusability. These pre-calibrated surveys have acceptedadministration procedures to ensure non-intrusivenessand academically verified face and concurrent validity

36(2) • June 2015 | 137
as accurate measures of system workload and usability.DOT&E also recommends best practices for developingcustom designed surveys to adequately collect diagnos-tic information. These best practices include developingshort, confidential surveys with clear, singular, inde-pendent, and neutral questions that are within opera-tors’ knowledge.
With adequate training, data collectors (DCs) canmeet all three test realism goals listed in Table 4. DCsmay need to be monitored for fatigue effects duringlong test periods. When DC observations are critical tomeasuring primary performance responses, realismgoals are better assured by aggregating the observationsof two independent DCs.
Discussions on subject matter experts (SMEs) ratingsusually focus on the number of rating scale options,typically employing 3, 4, 5, or 7 options. This discus-sion is not sufficient for realistic ratings of complex out-comes. SME ratings of mission success may not alwaysclearly connect to systems under evaluation. Techniquesfor better connecting SME ratings to system-related mis-sion performance include the following:
• SMEs should minimize verbal interactions with testplayers during mission execution. (non-intrusive)
• Ensure SMEs are truly knowledgeable of the activ-ities to be rated. Use SME rating scales withobservable “anchor” points -- for example “1= notcompleted within time and multiple steps missed,4= all steps completed within allotted time;”rather than “1= very poor, 4=very good.” (face andconcurrent validity)
• Have two or more SMEs observe the same eventand provide their ratings independently. (concur-rent validity)
• Correlate SME rating to additional data-drivenquantitative metrics related to system and unitperformance. Evaluators can use these technical(but still mission-focused) metrics together withSME ratings to form an overall determination ofeffectiveness. (concurrent validity)
Scenario/Site Representative
20. Blue operations not artificially augmentednor constrained
Realistic Blue operations depend on implementing real-istic tactics, techniques, and procedures (TTP). Testingartifacts can make it difficult for test units to developand acquire realistic TTPs. Modifying current Blue forcetactics to incorporate new capabilities often follows,rather than precedes new capability development. Evenwhen new techniques and procedures have been
developed, adequate training is difficult due to untriednew TTP. Implementation of trained TTP may be ham-pered by range terrain restrictions, collecting and har-vesting data collection, or safety restraints.
There will be restrictions on full Blue “free tacticalplay” in order to execute designed trial conditions. Sys-tematically varied trial conditions may stipulate specifictactical maneuvers, movement rates, or route directionsinstead of allowing player units to freely adjust. Thereare always trade-offs between full Blue free-play andrequirements for test rigor and robustness.
Completely independent free play is not in the inter-est of efficient testing. Experienced testers permit suffi-cient force-on-force free-play to promote test realismwhile adhering to assigned systematically-varied condi-tions for that trial (test rigor) and ensuring the full rangeof conditions occur in the trial (test rigor). This is “real-istic free-play within a box.” Requirements for realisticBlue and Threat tactical operations need to also be bal-anced with requirements for data collection, data har-vesting, and test instrumentation calibration duringextended trials.
Realistic Blue operations are dependent on mini-mizing adverse impacts of test operations during testexecution. For example, directing players to an assem-bly area to calibrate instrumentation during continuousoperations provides advance warning to units that abattle will soon occur. Additionally, test players under-going similar scenarios over successive trials know whatto expect.
Realistic Blue situational awareness may also requirevirtual augmentation. It was previously noted that vir-tual augmentation supports test robustness to achievefull ranges of conditions (parameter #12). Here, virtualand constructive simulations can provide a more real-istic context for test unit operations by supplying adja-cent units and systems not available as “live”components. Full, live joint context for system-of-sys-tem testing is costly. Virtual and constructive simula-tions, interlaced to live test players, can efficientlyprovide full realistic tactical context.
21. Independent, reactive, current threatRealistic tests include current threats anticipated in theintended battlespace, not limited to threats describe inrequirement documents written 7-10 years previously.Robust tests (parameter #12) ensure threat representa-tion spans the space of current threats (different targettypes, electronic attack types, computer attacks, etc.)that can stress the system differently. Threat expertsfrom national agencies can assist identifying currentthreat capabilities and scenarios. Full representation of
Twenty-one Parameters for Rigorous, Robust, and Realistic Operational Testing

138 | The ITEA Journal
Kass
threat tactics and weapons is difficult. Most testsapproximate threat realism by employing operationalunits to emulate threat tactics augmented with liveactual threat systems available from the Service’s ThreatSystems Management Offices (TSMOs). Test realismmay also require real-time virtual augmentation toachieve adequate levels of threat forces and activities.
Force-on-force engagements during test executioncan take place within restricted free-play discussed above.Conducting field tests at Service combat training centers(CTCs) employing their dedicated, well-trained, andequipped threats can enhance test realism. However,rigor and robustness are more difficult to achieve con-ducting trials during CTCs training missions.
R3 SummaryThis paper proposes 21 parameters to design and
conduct rigorous, robust, and realistic tests; and sug-gests no single event can achieve 100% of all three con-ditions. There are tradeoffs between enhancing one thatplaces limits on the other two. It is a zero-sum situa-tion. Enhancing test rigor necessarily constrains robust-ness and realism and vice versa. Understanding these21 parameters coupled with careful planning and testexecution can assist in test events with appropriate lev-els of rigor, robustness, and realism to support acquisi-tion decisions. �
RICHARD A. KASS, Ph.D., is a Senior Analyst with Geeksand Nerds®. He currently provides technical support onDesign of Experiments (DOE) to US Army Operational TestCommand (USAOTC). Previously in civil service, Dr. Kassconducted all levels of operational testing for US Army Testand Evaluation Command (USATEC) for 18 years anddeveloped methodology for joint experimentation in US JointForces Command (USJFCOM) for eight years. Dr Kass is aformer Marine officer and graduate of Southern Illinois Uni-versity where he earned his Ph.D. in Psychology. Email:[email protected]
DisclaimerViews expressed in this article are those of the
author and do not reflect official policy or position ofthe United States Army, Department of Defense, or U.S.Government.
Notesi Figure 1 and discussion points adapted from chart and pres-
entation by Dr. Mark E. Kiemele, Air Academy Associates, during
Webinar on "Operationalizing Design of Experiments (DOE)"hosted by ITEA 20 June 2013.
ii Performance “peaks and valleys” as used here refers to theobserved multiple highs and lows in performance results exhib-ited by tested systems during OT. This descriptive terminology isnot meant to restrict OT analysis to response surface methodology(RSM) that focuses on finding performance minimum and max-imums for a given response surface. The challenge in OT, rather,is to ensure true system highs and lows are allowed to exhibitthemselves during testing and that appropriate causes of thesevariations are available and unambiguous.
iii Service Operational Test Agencies (OTAs) do not characterizehypothesis testing similarly for the two test objectives that com-pare results to thresholds or compare new systems to baselines.Army OTA traditionally uses the null hypothesis to express thatnew systems are less or equal to the threshold or baseline system;and alternative hypothesis to express that new systems are betterthan threshold or baseline system. Other OTAs use null hypothe-sis to express that new systems are better than or equal to thresh-old or baseline system; and alternative hypothesis to express thatnew systems are less than threshold or baseline system. This sec-ond hypothesis convention changes the tabled meaning of confi-dence and power for these two test objectives.
iv R2 = ratio of sum of squares model to sum of squares total(SSmodel / SStotal); while a post-test equivalent S/N = ratio of mean-square factor effect to mean-square error (MSeffect / MSerror).
v VIF=1.0 indicates linearly independent, column-wise, pair-wise orthogonal factors; while higher VIFs indicate correlated fac-tors known as multicollinearity.
ReferencesDOT&E Memorandum October, 2010. SUBJECT:
Guidance on Use of DOE in OTE.------ June 2013. SUBJECT: Flawed Application of
DOE to OT&E.------ July 2013. SUBJECT: Best Practices for Assess-
ing the Statistical Adequacy of Experimental DesignsUsed in OT&E.
------ June 2014. SUBJECT: Guidance on Use andDesign of Surveys in OT&E.
Hill, R., Ahner, D. K., and Gutman, A. J. 2014. Whatthe Department of Defense Leaders Should Know aboutStatistical Rigor and Design of Experiments for Test andEvaluation. The ITEA Journal 35 (3): 258-265.
Montgomery, D. C. 2011. The Principles of Testing.The ITEA Journal 32 (3): 231-234.
------ 2012. The Design and Analysis of Experiments(8th ed.). Hoboken, NY: John Wiley & Sons, Inc.
Shadish, W. R., Cook, D. T., and Campbell, D. T.2002. Experimental and Quasi-Experimental Designsfor Generalized Causal Inference, Boston, MA:Houghton Mifflin Company.