race betting in australia - australian institute of family ... · race betting in australia author:...
TRANSCRIPT
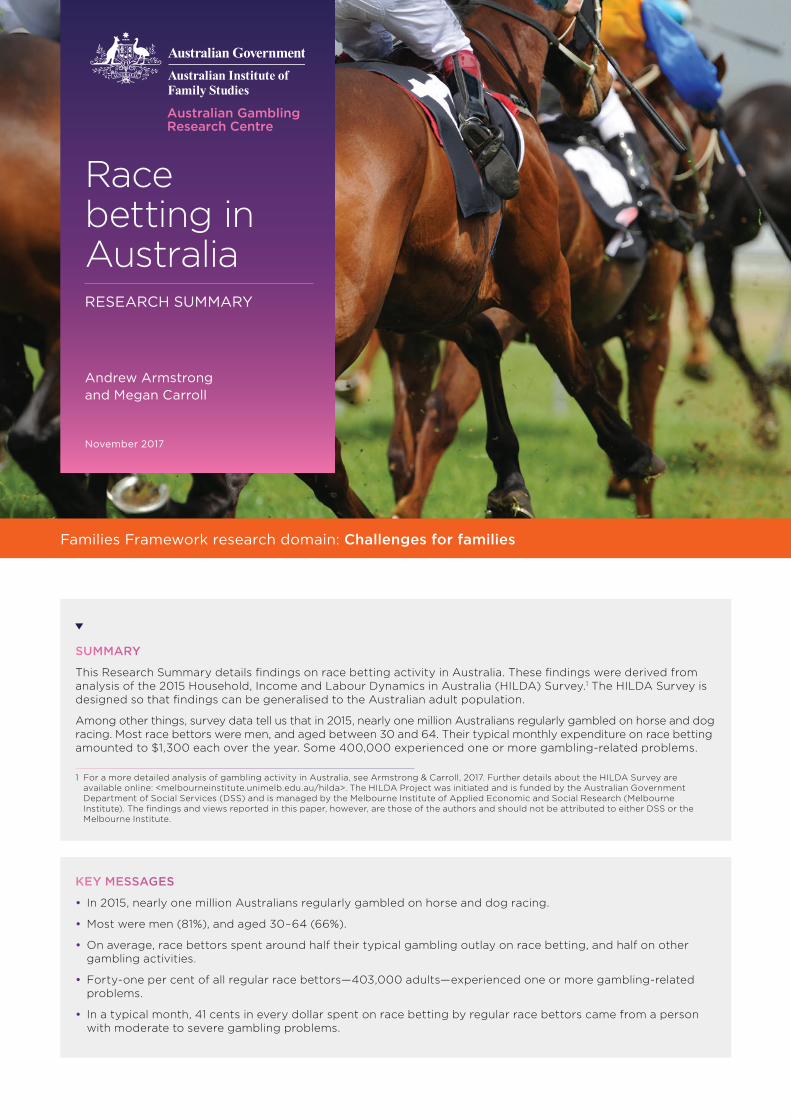
Families Framework research domain: Challenges for families
Australian Gambling Research Centre
KEY MESSAGES
• In 2015, nearly one million Australians regularly gambled on horse and dog racing.
• Most were men (81%), and aged 30–64 (66%).
• On average, race bettors spent around half their typical gambling outlay on race betting, and half on other gambling activities.
• Forty-one per cent of all regular race bettors—403,000 adults—experienced one or more gambling-related problems.
• In a typical month, 41 cents in every dollar spent on race betting by regular race bettors came from a person with moderate to severe gambling problems.
SUMMARY
This Research Summary details findings on race betting activity in Australia. These findings were derived from analysis of the 2015 Household, Income and Labour Dynamics in Australia (HILDA) Survey.1 The HILDA Survey is designed so that findings can be generalised to the Australian adult population.
Among other things, survey data tell us that in 2015, nearly one million Australians regularly gambled on horse and dog racing. Most race bettors were men, and aged between 30 and 64. Their typical monthly expenditure on race betting amounted to $1,300 each over the year. Some 400,000 experienced one or more gambling-related problems.
1 For a more detailed analysis of gambling activity in Australia, see Armstrong & Carroll, 2017. Further details about the HILDA Survey are available online: <melbourneinstitute.unimelb.edu.au/hilda>. The HILDA Project was initiated and is funded by the Australian Government Department of Social Services (DSS) and is managed by the Melbourne Institute of Applied Economic and Social Research (Melbourne Institute). The findings and views reported in this paper, however, are those of the authors and should not be attributed to either DSS or the Melbourne Institute.
Andrew Armstrong and Megan Carroll
November 2017
Race betting in AustraliaRESEARCH SUMMARY
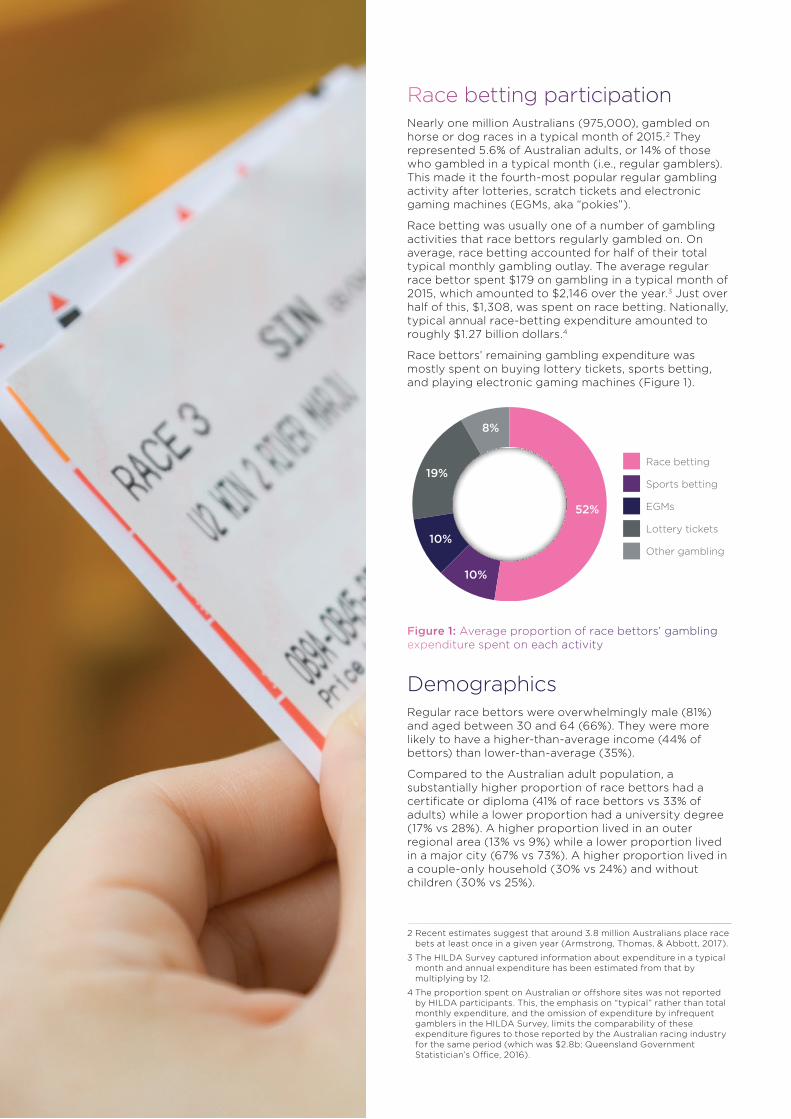
Race betting participationNearly one million Australians (975,000), gambled on horse or dog races in a typical month of 2015.2 They represented 5.6% of Australian adults, or 14% of those who gambled in a typical month (i.e., regular gamblers). This made it the fourth-most popular regular gambling activity after lotteries, scratch tickets and electronic gaming machines (EGMs, aka “pokies”).
Race betting was usually one of a number of gambling activities that race bettors regularly gambled on. On average, race betting accounted for half of their total typical monthly gambling outlay. The average regular race bettor spent $179 on gambling in a typical month of 2015, which amounted to $2,146 over the year.3 Just over half of this, $1,308, was spent on race betting. Nationally, typical annual race-betting expenditure amounted to roughly $1.27 billion dollars.4
Race bettors’ remaining gambling expenditure was mostly spent on buying lottery tickets, sports betting, and playing electronic gaming machines (Figure 1).
Other gambling
Lottery tickets
EGMs
Sports betting
Race betting
10%
10%
19%
8%
52%
Figure 1: Average proportion of race bettors’ gambling expenditure spent on each activity
DemographicsRegular race bettors were overwhelmingly male (81%) and aged between 30 and 64 (66%). They were more likely to have a higher-than-average income (44% of bettors) than lower-than-average (35%).
Compared to the Australian adult population, a substantially higher proportion of race bettors had a certificate or diploma (41% of race bettors vs 33% of adults) while a lower proportion had a university degree (17% vs 28%). A higher proportion lived in an outer regional area (13% vs 9%) while a lower proportion lived in a major city (67% vs 73%). A higher proportion lived in a couple-only household (30% vs 24%) and without children (30% vs 25%).
2 Recent estimates suggest that around 3.8 million Australians place race bets at least once in a given year (Armstrong, Thomas, & Abbott, 2017).
3 The HILDA Survey captured information about expenditure in a typical month and annual expenditure has been estimated from that by multiplying by 12.
4 The proportion spent on Australian or offshore sites was not reported by HILDA participants. This, the emphasis on “typical” rather than total monthly expenditure, and the omission of expenditure by infrequent gamblers in the HILDA Survey, limits the comparability of these expenditure figures to those reported by the Australian racing industry for the same period (which was $2.8b; Queensland Government Statistician’s Office, 2016).
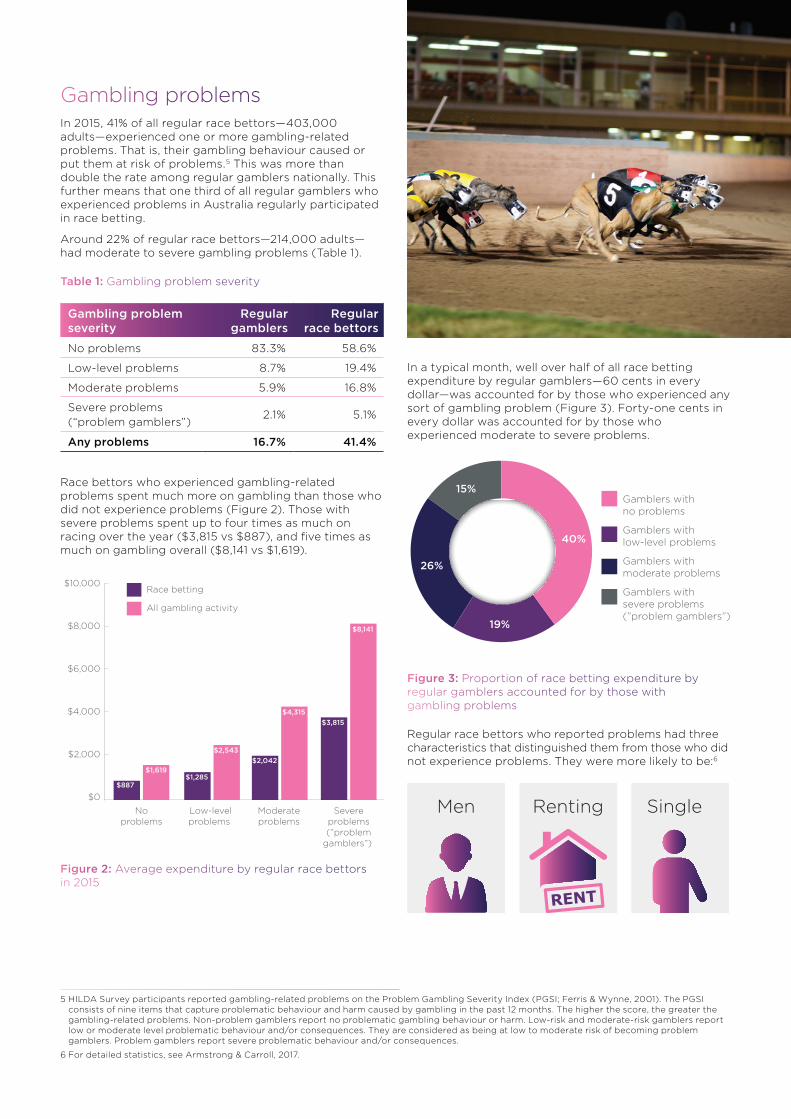
Gambling problems
5 HILDA Survey participants reported gambling-related problems on the Problem Gambling Severity Index (PGSI; Ferris & Wynne, 2001). The PGSI consists of nine items that capture problematic behaviour and harm caused by gambling in the past 12 months. The higher the score, the greater the gambling-related problems. Non-problem gamblers report no problematic gambling behaviour or harm. Low-risk and moderate-risk gamblers report low or moderate level problematic behaviour and/or consequences. They are considered as being at low to moderate risk of becoming problem gamblers. Problem gamblers report severe problematic behaviour and/or consequences.
6 For detailed statistics, see Armstrong & Carroll, 2017.
In 2015, 41% of all regular race bettors—403,000 adults—experienced one or more gambling-related problems. That is, their gambling behaviour caused or put them at risk of problems.5 This was more than double the rate among regular gamblers nationally. This further means that one third of all regular gamblers who experienced problems in Australia regularly participated in race betting.
Around 22% of regular race bettors—214,000 adults—had moderate to severe gambling problems (Table 1).
Table 1: Gambling problem severity
Gambling problem severity
Regular gamblers
Regular race bettors
No problems 83.3% 58.6%
Low-level problems 8.7% 19.4%
Moderate problems 5.9% 16.8%
Severe problems (“problem gamblers”)
2.1% 5.1%
Any problems 16.7% 41.4%
Race bettors who experienced gambling-related problems spent much more on gambling than those who did not experience problems (Figure 2). Those with severe problems spent up to four times as much on racing over the year ($3,815 vs $887), and five times as much on gambling overall ($8,141 vs $1,619).
$0
$2,000
$4,000
$6,000
$8,000
$10,000
All gambling activity
Race betting
Noproblems
$887
$1,619
Low-levelproblems
$1,285
$2,543
Moderateproblems
$2,042
$4,315
Severeproblems(”problem
gamblers”)
$3,815
$8,141
Figure 2: Average expenditure by regular race bettors in 2015
In a typical month, well over half of all race betting expenditure by regular gamblers—60 cents in every dollar—was accounted for by those who experienced any sort of gambling problem (Figure 3). Forty-one cents in every dollar was accounted for by those who experienced moderate to severe problems.
Gamblers withsevere problems(”problem gamblers”)
Gamblers withmoderate problems
Gamblers withlow-level problems
Gamblers withno problems
26%
19%
15%
40%
Figure 3: Proportion of race betting expenditure by regular gamblers accounted for by those with gambling problems
Regular race bettors who reported problems had three characteristics that distinguished them from those who did not experience problems. They were more likely to be:6
Men Renting Single
Visit the Australian Gambling Research Centre (AGRC) website at aifs.gov.au/agrc to explore our work, publications and events, and to discover our research agenda in more detail.
© Commonwealth of Australia 2017. With the exception of AIFS branding, the Commonwealth Coat of Arms, content provided by third parties, and any material protected by a trademark, all textual material presented in this publication is provided under a Creative Commons Attribution 4.0 International licence (CC BY 4.0) <creativecommons.org/licenses/by/4.0/au>. You may copy, distribute and build upon this work for commercial and non-commercial purposes; however, you must attribute the Commonwealth of Australia as the copyright holder of the work. Content that is copyrighted by a third party is subject to the licensing arrangements of the original owner.
Australian Gambling Research Centre
Discovering what works for families
Types of problemsThe types of gambling-related problems experienced by regular gamblers were also explored. Financial problems were most evident, followed by health problems. In 2015, close to a quarter of race bettors (22%; 214,000) bet more than they could afford to lose; 24% (237,000) tried to win back money they had lost on another day. For 10% (97,000) of race bettors, gambling had caused them physical or mental health problems. These problems stemmed from bettors’ overall gambling activity, including race wagering.
Race bettors who experienced gambling-related problems were also much more likely to live in households that experienced financial problems. The likelihood of household financial problems escalated with the severity of race bettors’ gambling problems. Well over a third of all households containing a race bettor with severe gambling problems had to ask family and friends for financial help (39%), while close to a third could not pay the electricity, gas or telephone bills on time (30%). More than a quarter could not pay the rent or mortgage on time (27%). These and other financial problems were substantially less prevalent among households where bettors reported no gambling problems.
References & further readingArmstrong, A, & Carroll, M. (2017). Gambling activity in Australia. Melbourne: Australian Gambling Research Centre, Australian Institute of Family Studies.
Armstrong, A., Thomas, A., & Abbott, M. (2017). Gambling participation, expenditure and risk of harm in Australia, 1997–98 and 2010–11. Journal of Gambling Studies. doi: 10.1007/s10899-017-9708-0
Ferris, J., & Wynne, H. (2001). The Canadian Problem Gambling Index: Final report. Ottowa: Canadian Centre on Substance Abuse.
Queensland Government Statistician’s Office. (2016). Australian gambling statistics, 32nd Edition. Queensland, Australia: Queensland Treasury.
Suggested Citation
Armstrong, A. R., & Carroll, M. (2017). Race betting in Australia. Melbourne: Australian Gambling Research Centre, Australian Institute of Family Studies.
Views expressed in this publication are those of the individual authors and may not reflect those of the Australian Institute of Family Studies or the Australian Government.
ConclusionOur analysis of the 2015 HILDA survey data shows that nearly one million Australian adults gambled regularly on the races. These people were twice as likely to experience gambling-related problems as the average Australian regular gambler. It shows that those who experienced greater problems spent substantially more than those without problems, and that they were more likely to live in households that experienced financial problems.
RS
S_
Rac
e b
etti
ng
in A
ust
ralia
_A
GR
C
Images: p. 1—istockphoto/Sportlibrary; p. 2—istockphoto/joxxxxjo; p. 3—istockphoto/contrastaddict; p. 4—istockphoto/Serega.