racing towards representation: a hurdle model of latino ... · implicit in this conceptualization...
TRANSCRIPT

Racing Towards Representation:A Hurdle Model of Latino Incorporation
March 25, 2009

Abstract
Despite 35 years of empirical research, the question of how electoral structure influencesLatino representation continues to be debated. Motivated by the uncertainty surroundingelectoral systems, in this paper I argue that the inconsistent and inconclusive results of pre-vious research stem from two limitations – one theoretical and the other methodological –of commonly-used models. In the following analysis, I utilize an alternative theoretical con-ceptualization and the appropriate methodological approach to shed light on several puzzlesencountered in the literature. My findings suggest, for example, that electoral structure andvoting strength are key components in determining the likelihood of Latino representation,but specific demographic and institutional contexts determine how these matter: Ceterisparibus, ward elections hurt Latino chances of representation, unless there are high levels ofsegregation within a district. Moreover, I find that the impact of the Latino population isin great part determined by the likelihood that the populace (1) has voting rights (i.e. UScitizenship), (2) is not in direct competition with blacks for elected seats, and (3) residesin an area of the United States with a long history of Latino incorporation. In short, inthe race towards representation, Latinos cannot simply tread the same path as their blackcounterparts, but must forge new roads to victory.

Introduction
Despite 35 years of empirical research, the question of how electoral structure influences
Latino representation continues to be debated. A review of the literature reveals what ap-
pear to be the fault-lines of this debate - that ward elections increase the likelihood of Latino
representation at the municipal level (MacManus 1978, Taebel 1978, Karnig 1979), that elec-
toral structure has no statistically significant impact on Latino representation (Alonzie &
Manganaro 1993, Bullock & MacManus 1991, Welch 1990, Zax 1990) and that ward struc-
tures may actually decrease the likelihood of representation (Meier et al. 2005, Leal 2004).
With the reauthorization of the Voting Rights Act in 2006, and the subsequent continued
reliance on ward-based elections as the presumed key mechanism to avoid voter dilution, the
suggestion that these types of electoral systems in fact either do nothing or actually dimin-
ish Latino representation gives pause for concern. Motivated by the uncertainty surrounding
electoral systems, in this paper I argue that the inconsistent and inconclusive results of pre-
vious research stem from two limitations – one theoretical and the other methodological –
of commonly-used models.
Theoretically, urban scholarship has tended to extend what we know of black representa-
tion – in particular, that electoral structure and numerical voting strength matter the most –
to the study of Latino representation as well. But this substantive extension is problematic
on several fronts. As I describe below, for example, the effects of electoral structure are
conditioned specifically on Latinos’ unique segregation patterns, the distinct context of im-
migration, and Latino political and social assimilation. Ignoring these particulars has thus
led to underspecified models that obscure the true effects of electoral structure and Latino
voting strength.
Methodological limitations have also constrained extant research on Latino representa-
tion. Specifically, at its most basic level descriptive representation is a mere head count
– in a sea of faces, how many are black, Latino, female, etc? Yet the vast majority of
research examining descriptive representation has focused on a more complex conceptual-
1

ization – proportional representation. Implicit in this conceptualization is the notion that
descriptive representation is an outcome (either you are descriptively represented or you are
not), and that this is the necessary but not sufficient step for substantive policy change
(see e.g., Gills & Betancur 2000, Browning, Marshall & Tabb 1984, Jennings 2003). But
this conceptualization limits our ability to ask more detailed questions about the process of
descriptive representation: Why do some communities only have one Latino school board
member, whereas others have 4 or 5? Put differently, what specifically about a community
and its institutional framework predicts any representation, and is this the same or different
than the factors that predict more than one Latino representative? Explicitly delineating
these two hurdles of Latino descriptive representation can further our understanding of the
relationships between voting strength, electoral structure, and ultimately policy responsive-
ness.
In the following analysis, I utilize this alternative theoretical conceptualization and the
appropriate methodological approach to shed light on several puzzles encountered in the
literature. My findings suggest, for example, that electoral structure and voting strength
are key components in determining the likelihood of Latino representation, but specific de-
mographic and institutional contexts determine how these matter: Ceteris paribus, ward
elections hurt Latino chances of representation, unless there are high levels of segregation
within a district. Moreover, I find that the impact of the Latino population is in great part
determined by the likelihood that the populace (1) has voting rights (i.e. US citizenship),
(2) is not in direct competition with blacks for elected seats, and (3) resides in an area of
the United States with a long history of Latino incorporation. In short, in the race towards
representation, Latinos cannot simply tread the same path as their black counterparts, but
must forge new roads to victory.
I structure my arguments and evidence as follows. In the next section I provide a brief
overview of the two main explanatory variables of descriptive representation - electoral struc-
ture and voting strength - analyzing their theoretical relationship to minority incorporation
2
in general, and their relationship to the unique characteristics the Latino population in the
US. I next move to a reconceptualization of descriptive representation as a process, describ-
ing the two steps of incorporation. Armed with this new conceptual framework, I analyze the
institutional and contextual determinants of Latino school board representation, and con-
clude with an analysis of my findings’ implications for a dynamic understanding of Latino
descriptive representation.
Electoral Structure and Segregation
Electoral structure is purported to influence the probability of representation because of two
persistent factors: (1) most US cities are segregated spaces, and (2) non-whites tend to be
a minority within any jurisdiction. At-large systems thus create an additional burden for
minority candidates: Minority candidates must secure not only their constituency’s support
but also engender substantial cross-over voting from non-minority voters. At the same time,
ward arrangements often result in majority-minority districts in which minorities can be
reasonably assured of securing a candidate of choice. Indeed, the importance of electoral
systems in preventing voter dilution is one of the capstones of the Voting Rights Act, and
to this day, attempts to change from a ward to at-large system are denied based on such
changes’ potential for vote dilution (see e.g. US Congress HR 109-478).
To be sure, evidence that this electoral system works for black representation isn’t hard
to find. More than thirty years of research findings consistently point to a positive and
significant impact of ward electoral structures on black representation at the local level (see
e.g., Engstrom & McDonald 1981, Engstrom & McDonald 1982, Engstrom & McDonald
1986, Karnig 1979, Karnig & Welch 1980, Robinson & Dye 1978, Stewart, England & Meier
1989). However, attempts to extend this phenomenon to Latino representation have been
anything but successful. For example, while studies by MacManus (1978), Taebel (1978),
and Karnig (1979) find a weak positive relationship between ward-based elections and Latino
3

representation on city councils, Bullock (1991), Welch (1990), Zax (1990), and Alonzie (1993)
find no significant effects of structure per se. Recent papers by Meier et al. (2005) and Leal
et al. (2004) further confuse the issue by determining that both at-large and ward-based
systems systematically underrepresent Latinos on school boards (although Latinos fare worse
in at-large elections).
Why these disparate findings? In most jurisdictions Latinos constitute less than a ma-
jority of the population, and thus we would expect them to face the same hurdles as blacks
in jurisdictions with at-large elections. However, the spatial distribution of Latinos differs
markedly from that of blacks. The legacy of segregation in most metropolitan and Southern
cities continues to this day (Massey & Denton 1993), with black-white dissimilarity scores
- indices that measure the proportion of a population that would have to move to different
census tracts to achieve equal representation throughout an area - ranging from 60 to 90
(Logan 2001). Thus, the value-added by ward electoral systems continues to be significant
for blacks seeking elected office. In contrast, segregation between Latinos and whites has
been stable between 1980 and 2000 and is considerably less than that for blacks and whites.
In particular, Latino-white segregation was recorded at 50.6 in 1990 and 51.5 in 2000, and
since 1980, Latinos have tended to move from more segregated areas to less segregated ar-
eas (Logan 2002, Logan 2001). Similarly, levels of segregation between Latinos and blacks
remain relatively low, with an average dissimilarity index score of 49.2 in 2000 (Logan 2001).
These differences in segregation patterns of Latinos and blacks provide the first clue as
to why previous studies have found electoral structure to matter little for Latinos, unlike the
case for blacks. Specifically, with more Latinos becoming residentially integrated with whites
and blacks, Latinos are likely to reap fewer benefits from a ward electoral system. This is
not to say that ward elections will not improve Latino representation outcomes, but that
rather the likelihood of a ward structure leading to Latino representation will be conditional
on the level of segregation within a jurisdiction. Others have noted this relationship between
segregation and structure (Davidson & Korbel 1981, Engstrom & McDonald 1982, Mladenka
4

1989, Vedlitz & Johnson 1982), yet few have tested this claim directly (but see Sass 2000,
Trounstine & Valdini 2008).
The Impact of the Size of the Latino Population
Assuming that given the choice, minorities will elect a fellow minority candidate over a
white candidate, the impact of the size of the minority population on the likelihood of
representation is not in doubt (Alonzie & Manganaro 1993, Welch 1990, Welch & Karning
1978). However, when this assumption is imposed on Latino representation the results
tend to be rather weaker. For example, while studies have found a consistent and positive
relationship between Latino population size and Latino representation on school boards and
city councils, the coefficient on Latino population size has been markedly smaller than that
for black representation (see e.g. Leal 2004, Meier et al. 2004, Meier et al. 2005, Rocha,
Wrinkle & Polinard 2005, Zax 1990). What these other studies have not accounted for,
however, are the combined effects of immigration and citizenship, and political and social
assimilation. As I detail below, each of these factors condition the strength of the Latino
electorate.
Immigration and Citizenship
Since the 1970s, immigration has represented by far the fastest and the largest source of
Latino population growth, and, as a result, the first generation – the foreign born – has
become more numerous than the second or the third-plus generations – those born in the
United States of U.S.-born parents (Suro & Passel 2003). The fact that most Latinos in the
US are foreign born has several consequences. First, foreign born Latinos are most often
not citizens, and although naturalization rates have been increasing for Latinos (Pachon
& DeSipio 1992), the barriers of attaining legal residency remain considerable (Highton &
Burris 2002). Thus, the Latino population eligible to participate in politics is often much
5

smaller than the overall population. Second, foreign born Latinos come to the US with little
education and few financial resources (DeSipio 1996, Suro & Passel 2003). According to the
2002 National Survey of Latinos (Suro 2002), foreign born Latinos tend to maintain their
native tongue, and it is generally not until the second or third generation that Latinos become
bilingual. Consequently, the potential pool of Latino candidates and voters is diminished by
issues of language, citizenship and access to resources.
Political and Social Assimilation
Concurrent with the continued growth has been a broader distribution of the Latino popula-
tion throughout the country. Although the vast majority of immigrants continue to be con-
centrated in the Southwest or the “established” metropolitan areas of Los Angeles, Chicago,
New York, Miami, and Houston (Singer 2004, Suro & Singer 2002), in the 1990s the South
became a new destination for many Mexican- and other Latino-Americans. These changes
in immigration patterns create a varied landscape across the U.S. in terms of levels of Latino
political and social incorporation. Traditional destinations, like California, Texas, and New
Mexico have had long histories of Latino settlement, and constitute the “heartland” of more
socially and politically incorporated Latinos. Indeed, the majority of Latinos who have as-
similated in the US – i.e. become naturalized; are bilingual or monolingual in English; have
graduated from high school (Massey 1995) – reside in these traditional destinations (Suro &
Passel 2003). Moreover, almost all Latino elected officials (75%) are found in these states
(National Assocation of Latino Elected Officials 2002). This is in sharp contrast to states
like Georgia and Alabama, who witnessed large increases in their Latino population, but
have had relatively little experience with Latino populations and no Latinos represented in
political office. These Latino populations are more likely to be non-citizens, and lack the
language skills and resources of their more established counterparts in traditional destina-
tions. Lastly, these destinations have witnessed some anti-immigration backlash recently
(Kochar, Suro & Tafoya 2005), and thus Latinos may have additional barriers to cross in
6

gaining elected office.
In sum, that population size matters for descriptive representation is not in question. How
it matters, however, is. The size of the minority electorate is crucial only insofar as it indicates
minority voting strength and the likelihood of a minority candidate emerging from the polity
(Marschall & Ruhil 2004). When should we expect to see a large minority population with
a low likelihood of a representative running for office? New immigrant populations and
minority populations with language and citizenship barriers are prime examples of groups
that may comprise as much as 75% of the population and yet lack the opportunity to be
represented in elected office (see e.g. Bowler, Donovan & Brockington 2003). Thus, models
that do no include variables that capture voting and candidacy eligibility, and social and
political assimilation may misrepresent the true effect of population size.
A New Model of Descriptive Representation
Beyond these problems resulting from inadequate attention paid to the specific context of
Latino representation, almost all studies of minority descriptive representation post-1980 suf-
fer from a greater theoretical deficiency that results directly from the conflation of the concept
of descriptive representation with its outcome. Engstroms and McDonald’s (1981) seminal
work on minority descriptive representation radically altered how scholars conceptualized
representation, moving the operationalization of representation from a ratio or difference
score to a proportion. And while Engstrom and McDonald’s work confronted the method-
ological problems associated with those methods1, it also added additional theoretical and
methodological limitations. No longer was descriptive representation seen as a head count
– how many Latino school board members are there? – but now descriptive representation
was assessed according to population size.
This narrow focus on proportionality masks the sequential nature of representation –
seats are not won proportionally, but rather one by one. And for many jurisdictions, minority
7

candidates and their supporters work very hard to overcome an initial hurdle of acquiring
one seat (see e.g. Browning, Marshall & Tabb 1984), and may wait years to gain another.
Indeed, of the nearly 15,000 black and Latinos in local office in 2000, almost 50% of these
elected officials were the sole brown face at the table2. Moreover, the mechanism by which
institutional and contextual variables affect likelihood of election may change – whereas
a particular electoral arrangement and large voting pool may be sufficient to overcome the
first hurdle, it may be the generation of competitive electoral coalitions (Liu 2001, Browning,
Marshall & Tabb 1984), or number of available seats (Marschall, Ruhil & Shah 2008), or
the resources available to Latinos (Meier 1993) that pull additional Latino candidates into
elected office.
The current body of research has conflated the distinct stages of descriptive representa-
tion, and thus we have yet to adequately understand how crossing the initial hurdle of no
representation is substantively different than adding additional minorities to legislative bod-
ies. I hypothesize that the first leg of the race – overcoming the hurdles of getting onto the
ballot and being elected as the first Latino school board member (minimum representation)
– dramatically alters council and school board politics, and thus the factors responsible for
the election of a single candidate may be substantively different than those responsible for
the election of subsequent candidates (i.e., the extent of representation; see also Marschall,
Ruhil and Shah 2008). In other words, the race towards descriptive representation is not an
all or nothing game, but rather happens sequentially.
In sum, extant research on Latino descriptive representation in urban America demon-
strates two shortcomings – the assumption that models of Black incorporation translate
directly to the Latino experience, and a narrowly defined and conceptualized model of rep-
resentation that obscures more than it reveals. Addressing these limitations thus requires a
more comprehensive model of political incorporation, a broader definition of representation,
and a methodology that holds true to both the nature of descriptive representation as a head
count and a process of representation that occurs in stages.
8

Data
To test this theory of descriptive representation, I examine the likelihood of Latino school
board representation in 2000. Although electoral representation occurs at many levels of
government in the United States, with over 10,000 local school boards in place across the
United States, this is not only a highly prevalent form of government in the United States
but also the most common point of entry into office holding among Latinos (Hardy-Fanta
et al. 2005). Among the 3,929 Latino elected officials in the United States in 2000, 42.8%
(1,682) serve on school boards (National Assocation of Latino Elected Officials 2002). The
school board often serves as the first rung on the political ladder and it is here that Latinos,
much like blacks, gain the expertise and experience to run for higher level offices (Pachon &
DeSipio 1992). Thus, an examination of school board elections provides a unique opportunity
to examine the politics of Latino incorporation at its broadest level.
Using the school district as the unit of analysis, I investigate Latino representation in
a national sample of 1,664 districts that have at least a 5% Latino voting age population,
located in 224 metropolitan statistical areas (MSAs) dispersed across 40 states3. I further
restricted my sample to elected boards with either pure ward or at-large, elected systems4.
Figure 1 provides an overview of the distribution of Latino school board members across
the United States, as well as the percent of the state’s Latino population. My dependent
variable is a count of the number of Latino members on the school board, and ranges from
0 to 7 in the sample.
[Figure 1 about Here]
Building upon previous literature, I reevaluate the explanatory leverage provided by the
principal explanatory factors in the literature, as well as variables that theoretically should
be linked to the emergence of Latino descriptive representation. Given the discussion of the
existing literature in the preceding section, I restrict my explanatory focus to such factors
that tap institutional structures and segregation, population size and influence, resources
9

and social/political incorporation.
Institutional factors include a set of dummy variables for the selection method for school
boards in the district – At-Large or Ward-based Elections. As discussed in the preceding sec-
tion, ward elections are expected to yield more Latino school boards members than at-large
elections, albeit conditional on levels of Latino Segregation within the district. Specifically,
I expect ward-based elections to positively impact the likelihood of Latino representation in
those districts with high levels of segregation. Segregation is determined at the census tract
level using an index of dissimilarity, which measures the evenness with which two mutually
exclusive groups are distributed across the geographic units that make up a larger geographic
entity; for example, the distribution of blacks and whites across the census tracts that make
up a school district. Its minimum value is zero and its maximum value is 1005. Finally, I
include a variable that captures School Board Size (total number of seats), and I expect that
as the opportunities to serve on the board increase, so does the probability of a Latino being
elected.
I expect the Latino Population size to matter, but only insofar as there is a large eligible
pool of voters within the district. Thus, I include the percentage of the voting age population
that is Latino (Latino VAP), with the expectation that this will be positively related to
the number of Latinos on a school board. On the other hand, I expect a larger district
percentage of Non-Citizen Latinos to hinder the election of Latinos to school boards 6. Much
as been written recently about the relationship between Latino and black constituents within
a district, probing the question of group commonality or competition(see e.g. Marschall 2005,
Rocha, Wrinkle & Polinard 2005, Gay 2006, Kaufmann 2003, Rocha 2007, Vaca 2004). In
general, the findings suggest a larger black constituency reduces the likelihood of Latino
representation, and thus I include a measure of the percent black voting age population
(Black VAP) to test this hypothesis.
Resource factors have long been included in models for Black representation, and thus
I include them, although I am open to the possibility that their effects will be different for
10

Latino representation. In short, the resource argument implies that the supply of minority
candidates is not simply a function of population, but a function of the eligible population
in which a candidate may emerge. Thus, Blacks who live in situations where they have
a significant disadvantage in terms of monetary and educational resources will have lower
likelihoods of competing with Whites for elected positions. Scholars found that education
levels and wealth are positively related to Black representation (Engstrom & McDonald
1986, Karnig & Welch 1980) and more recently, that these indicators are significant even after
controlling for institutional factors and racial demographics (Canon 1999, Lublin 1997, Meier
et al. 2005). To assess this relationship for Latino representation, I include the percentage of
Latinos with a Bachelors degree (Latino BA) and the Latino median family income (Latino
MFI ) for the district.
Lastly, I include variables that capture the importance of geographic location in deter-
mining likelihood of representation. Figure 1 illustrates the heterogeneous distribution of
Latinos and Latino representation across the United States, and confirms that Latino repre-
sentation is markedly concentrated in a few states and cities. Yet, the probability of Latino
representation in other, less concentrated locations is still an empirical question. Therefore
I control for differences in political and social assimilation by utilizing patterns of Latino
immigrant and settlement patterns as a proxy7. Borrowing from demographers, I catego-
rize each state as either a Traditional Latino destination, a New Latino destination, or a
Non-Latino destination (Chapa & de la Rosa 2004)). Therefore, compared to New and
Non-Latino destinations, I expect more Latino school board representation in traditional
destinations. I also control for Urban school districts, which have historically housed more
Latinos than rural districts, and the size of the district (Log of Population). Table 1 pro-
vides the descriptive statistics for the full sample (n=1,664 school districts), and the districts
with representation (n=218) in my analysis (see appendix for summary statistics of districts
without representation, and additional discussion).
[Table 1 about Here]
11

An Alternative Methodological Strategy
I hypothesize that the process of Latino descriptive representation is a phased event in
which the first step requires overcoming the hurdle of attaining minimum (here defined as
one Latino) representation. Once this threshold is overcome, I hypothesize that the politics
of representation change, and thus expect the extent of representation to potentially be
explained by different factors.
In order to model this phased event, I utilize a hurdle negative binomial model8. A hurdle
model is “a modified count model in which the two processes generating the zeros and the
positives are not constrained to be the same” (Cameron & Trivedi 1998, King 1989, Zorn
1998). Further, as Mullahy (1986) explains, “The idea underlying the hurdle formulations
is that a binomial probability model governs the binary outcome of whether a count variate
has a zero or a positive realization. If the realization is positive, the ‘hurdle is crossed’, and
the conditional distribution of the positives is governed by a truncated-at-zero count data
model” (p. 345). Thus I estimate two equations. The first predicts the probability of seeing
any Latino school board representation, and thus yields an empirical estimate of factors
related to the threshold or tipping point that must be overcome for a school board to move
from no representation to at least a single Latino board member (minimum representation).
The second predicts the expected number of Latino school boards members conditional upon
the explanatory variables specified. In other words, the fundamental question answered by
the second equation is this: Once the initial hurdle has been overcome and Latinos are
represented, what factors explain the extent of representation?
12

Analysis and Findings
Minimum Representation
Table 2 provides the results of each step of the hurdle model: column 1 presents the results
from the binary outcome (logit estimates), and column 2 presents the results from a trun-
cated count model (zero-truncated poisson). I begin with a discussion of stage 1: minimum
representation. Calculating the probability of representation confirms the empirical obser-
vation that Latino school board representation is indeed a rare event: with all explanatory
variables at their mean, the probability is practically zero (0.05)9. Further, the extremely low
probability of any representation supports my earlier arguments that models solely looking
at variables such as electoral structure and voting strength may overestimate the effects of
these two factors in determining representation. Instead, and as the results enumerated in
Table 2 show, the ability to cross this first hurdle depends upon a number of institutional
and contextual factors.
[Table 2 about Here]
First, ward-based elections in and of themselves hinder the election of a single Latino
school board members - the probability of having a single Latino representative decreases
44% in jurisdictions with ward (versus at-large) elections. At first glance, then, these results
support research that has found ward elections to be detrimental to Latino representation
(Meier et al. 2005, Leal 2004). However, these effects dissipate when we consider the level
of segregation within districts, as illustrated in Figure 2.
[Figure 2 about Here]
Once a district has a black-Latino index of dissimilarity of around 30, Latinos in school
districts with ward-based elections are more likely to attain office than those with at-large
elections. Moreover, it is levels of black-Latino segregation, rather than white-Latino segre-
gation, that result in a higher likelihood of Latino representation. Given the large number
13

of black and Latino students in public schools, and that school board positions have often
served as the first rung of electoral ambition for both blacks and Latinos, these results are
not surprising, and support previous work that has found higher levels of cooperation among
Latino and whites than Latinos and blacks (Dyer, Vedlitz & Worchel 1989). Thus, although
the probabilities of any representation remain low, this analysis demonstrates that the ability
of an electoral arrangement to strengthen Latino voting power depends heavily on the levels
of Black/Latino segregation within a district.
How do a school district’s racial demographics impact the likelihood of Latino repre-
sentation? As expected, a larger Latino voting age population significantly increases the
probability of any Latino on the school board, tempered by the number of Latino non-
citizens within the district. Moreover, these effects are conditioned by method of election
and segregation. For example, school districts with a mean Latino VAP of 22% (the average
for the sample), have a 2.5 % probability of electing a Latino school board member if they
use ward systems, compared to a 5.8% probability if they use at-large systems. However,
higher levels of Black-Latino segregation reverse the relative positions of ward and at-large
systems. With a Black-Latino index of dissimilarity of 45, the probability of representation
is 6% for at-large elections, and 9.4% for ward elections. At the same time, the proportion
of the Latino population ineligible to participate in electoral politics reduces the chances of
electing any Latino representation. A one standard deviation increase in the proportion of
non-citizens (to 40%) reduces the likelihood of representation by half.
Contrary to my expectations regarding the size of the board, I find that increasing the
opportunities for representation (i.e. larger school boards) decreases the probability of Latino
representation. This finding is surprising but may be an artifact of the variation in school
board size across the United States. In particular, board size is loosely correlated with
population size: school boards with three seats were found in districts with an average
population of 5,000 residents, whereas school boards with five seats were found in districts
with an average population of 33,000 residents. Thus, it may be that greater representation
14

on smaller school boards is a function of the ability of voters to organize around a single
candidate (i.e. fewer options), and candidates ability to more effectively mobilize voters.
The results for the resource variables are also contrary to those expected from the lit-
erature on black representation. Specifically, I find that a unit standard deviation increase
in the Latino median family income in a district (to $57,000) results in a 50% decrease in
the likelihood of any Latino representation (from 0.033 to 0.016). Similarly, a unit standard
deviation increase in the proportion of the Latino electorate with a Bachelor’s degree reduces
the likelihood of representation by 66%. What explains these results? The counterintuitive
findings regarding the resource variables could be a function of social incorporation wherein
either wealthier and more educated Latinos mirror their white counterparts and participate
less in school politics than in other elections (Howell 2005), or are less likely to vote along
ethnic lines. To be sure, my results could also stem from Latinos with more resources hold-
ing higher ambitions for elected office and hence skipping this first rung (school boards)
altogether (see also Bositis 2002).
Lastly, I find evidence of significant differences based on levels of assimilation and in-
corporation. To reiterate, the dummy variables of traditional and new destinations were
included in the model as blunt approximations of generational diversity, assimilation and
acculturation, and familiarity with political incorporation. As expected, those districts in
traditional destinations are more likely to have Latino representation. Specifically, the prob-
ability of any representation in a school district located in a traditional destination is 0.034,
as opposed to 0.012 in a new destination.
Extent of Representation
The crux of my theory of descriptive representation rests on the notion that the politics of
getting to the table changes once minimum representation is achieved. Column 2 in Table
3 reports the results from the zero-truncated poisson model, which provides estimates of
how each of the independent variables impact the actual number of Latinos on a school
15

board (between 1 and 7). The findings from stage 2 suggest that the key differences lie in
how the complex racial composition of the district impacts representation. For example, the
estimates show that a larger Latino voting age population increases the expected count of
Latino representatives, whereas a large non-citizen Latino population decreases the expected
count. Specifically, a one standard deviation increase in the Latino VAP (26%) translates into
more than one Latino representatives on average, whereas a standard deviation increase in
the percentage of the Latino population that are non-citizens (13.3%) decreases the expected
number by more than two Latino school board members.
What about the response from the black population? At the first stage, it appears that a
large black population does not pose an additional burden on Latino candidates and Latino
representation. However, once Latinos have a representative on the school board, the results
suggest that there is indeed some backlash from the black community. As illustrated in Figure
3 (corresponding table available in appendix), the expected count of Latino school board
members is only significantly greater than 1 when the proportion of the black VAP is less than
50%. Moreover, these effects are attenuated by levels of segregation: small black populations
that are more segregated from the Latino population ensure greater representation. Again,
the differences between the first and second phases of representation highlight how the impact
of contextual factors are really conditioned on the number of Latino representatives already
in office, and suggest that previous studies that have examined representation as a one-stage
event have missed this important feature.
[Figure 3 about Here]
The story behind the two other movers of representation – electoral structure and popu-
lation size – are similar for this second stage of representation. Latino candidates in districts
with low levels of black-Latino segregation benefit from at-large structures, but that dis-
trict elections facilitate more representation once the index of dissimilarity index reaches 20.
Thus, while the expected count of Latino representatives stays within 2 or 3 for all levels of
16

segregation in at-large systems, they reach 6 Latino members in districts with almost perfect
segregation between the black and Latino populations.
Finally, the results reported in Table 2 support my contention that the levels of political
and social assimilation play an important role in determining Latino representation. Recall
that in the first stage, the results supported my hypothesis that compared to non-immigrant
destination, Latino candidates in traditional destinations fare better at overcoming the hur-
dle. In the second stage, I find that the real difference involves new destinations and non-
immigrant destinations. Specifically, ceteris paribus, school boards in new destinations have
almost two fewer Latino school board members than those in non-immigrant destinations.
Given than these destinations have had a very short history of Latino immigration, these
results may suggest that communities with newly arrived Latinos have not had enough time
to incorporate them into political life, or that non-Latinos have organized against Latino
representation.
Conclusions and Policy Implications
So how do minorities win the race to representation? The analysis presented here indicates
that the answer to this question depends in part on whether a district is achieving minimum
representation (i.e. a single Latino school board member), or adding additional members. In
the first stage, electoral structure and voting strength matter, but how they do so depends
largely on the geographical distribution of Latinos within a school district. In particular, the
ability of a district to achieve minimum representation appears to be dependent on selection
method, but only when in conjunction with higher levels of black-Latino segregation within a
district. Further, I find support for my argument that assimilation and incorporation factors
impact the overall strength of the Latino population. In particular, districts in locales that
have had a longer history of Latino immigration, more second- and third-generation Latinos,
and more experience with the American political process are more likely to overcome this
17

first hurdle of electing a single Latino representative.
Once a district has achieved minimum representation, the models examining the extent
of representation point to distinct demographic features within the district as the driving
force behind increasing the number of Latino school board members. Specifically, I find
that a large Latino voting age population increases the expected count of Latino school
board members, but that the impact of this population is dampened by a large non-citizen
population, and competition among the black population. Moreover, I again find that the
level of political and social assimilation of the Latino population is also a good predictor of
the extent of representation. Those districts in traditional destinations have greater voter
and candidate strength because of their second and third-generation populations and their
experience with American politics.
In addition, these results provide some important markers for subsequent research. First,
models developed to explain black descriptive representation may be unable to explain the
Latino experience precisely because these models are incomplete. As I have demonstrated,
the incorporation of Latinos into the political arena does share some characteristics with
black incorporation, such as board selection methods and size of the Latino population, but
issues of immigration and assimilation pose additional challenges that must be addressed.
Consistently, I found that the influence of the Latino voting age population is diminished by
a large Latino non-citizen population and that the variation in representation can partly be
explained by levels of Latino political and social assimilation within a district. Thus, models
that do no account or control for these more nuanced effects of racial demographics may
underestimate the role of Latino population on representation.
Second, the majority of research has utilized a restrictive proportionality definition of
descriptive representation that neglects the inherent process of representation. As I hypoth-
esized, the politics surrounding the election of a single Latino school board member may be
substantially different from that surrounding the election of subsequent members. Minority
candidates are not elected “proportionally,”but rather one at a time, and understanding
18
how the politics of descriptive representation change at the different stages of incorporation
are especially salient as we move towards more multi-racial and ethnic legislative bodies.
Moreover, these findings support efforts to create comprehensive large data bases of local
elections across the United States that reflect the full diversity of representation.
Although I have restricted my analysis to Latino representation on school boards, these
findings also have more broad policy implications. First, my findings contradict current
normative claims of the divisive effects of continued racial segregation in most places across
the country, and the prospects of “rainbow coalitions” in developing minority voting blocs
or representatives. In particular, they demonstrate the unique tradeoff between the negative
consequences stemming from segregation (on education, housing, economic development,
and social mobility for example) and the positive effects that flow from increased minority
representation. Indeed, recent state and local legislation has moved towards using residential
segregation patterns to draw school boundaries, with the explicit intent of moving towards
increased minority representation, participation and substantive influence (see e.g. Omaha
School District legislation LB 1024, May 2007). Insofar as this is indicative of a trend
or preference, my results indicate that continued intra-minority segregation may be key in
ensuring minority political incorporation at all levels of government.
Further, the results regarding Latino school board representation suggest that a con-
tinued reliance on ward-based elections as the structural solution to voter dilution may be
misplaced. Indeed, depending on the demographic context of a district, at-large elections
may be better suited to increase the likelihood of Latino representation. The results again
highlight the basic premise that theories, models and policy solutions based on a black-
white dichotomy cannot be wholly translated to racially heterogeneous communities, cities
and districts. Rather than looking to electoral structures, the findings presented here point
to changes in who can vote as a key component in increasing Latino representation. Re-
laxing citizenship rules in particular have long been a contentious issue for local elections
(Hayduk 2004, Kini 2005), but as the US immigrant demography continues to shift, the
19

rights and roles of non-citizens have become important topics in state elections as well. And
while the policy initiatives addressing non-citizen voting may be most salient in the areas
of the US that have and continue to witness large increases in foreign-born populations, the
rise of new destinations portends the need to address the rights of non-citizens on a national
level.
These findings additionally highlight the fluid and dynamic nature of competition and
commonality among blacks and Latinos at the local level. Concurrent with other works(Rocha
2007, Gay 2006), this research suggests that when and how minority groups come together
varies with understandings of the outcomes of this cooperation. In instances of no minority
representation, blacks and Latinos may recognize their shared subordination to white gov-
ernance. But once Latinos are in office, the struggle for power on a school board seems to
shift, and ultimately pits Latinos against blacks for power.
Lastly, the evidence presented here points to several future directions for scholarship on
race and representation. In particular, what or who encourages Latinos to run for office
in the first place? Others have examined the concept of candidate emergence and its rela-
tionship to gender(Fox & Lawless 2005), but none have investigated this process for racial
minorities. Are organizations and leadership important factors? How does the changing,
racially heterogenous nature of local cities and school districts impact the likelihood of Lati-
nos running? How and under what circumstances do term limits and voting patterns impact
representation? Future research must incorporate these factors and expand the foundation
of urban scholarship on race and representation.
Appendix
As was noted by an observant reviewer, there are school districts with few Latinos (less
than 10%) with Latino representation, and school districts with many Latinos (greater than
75%) with no Latino school board members, skewing the means for these two samples, and
20

Table A1: Additional Descriptive Statistics without Latino Representation
Sample without Latino Representation (n = 1446)
Mean Std. Dev. RangeWard Elections (=1) 0.23 0.42 (0,1)At-large Elections (=1) 0.76 0.42 (0,1)Index of Dissimilarity, white-Latino 16.06 15.99 (0,91)Index of Dissimilarity, black-Latino 19.04 16.77 (0,100Latino Voting Age Population (%) 17.17 14.05 (5,96)Latino Non-Citizens (%) 25.74 15.19 (0,100)Black Voting Age Population (%) 5.14 9.67 (0,81)Traditional Destination (=1) 0.86 0.34 (0,1)New Destination (=1) 0.07 0.26 (0,1)Other Destination (=1) 0.06 0.23 (0,1)School Board Size (# seats) 6.23 1.51 (2,12)Latino Median Family Income ($k) 42.65 17.27 (0,200)Latino with Bachelors Degree (%) 9.30 9.30 (0,100)Urban District (=1) 0.75 0.43 (0,1)District Population (logged) 9.54 1.62 (3,16)
perhaps the results. Conceptually, the school districts with few Latinos is less problematic
– given that these models do no capture every possible scenario in which a person is elected
to a school board, it is not so surprising that there were 9 school districts in the U.S.
with less than a 10% Latino voting age population and Latino representation on the board
(see also Figure 1: there are several states with small overall Latino populations that have
one Latino school board member). The school districts with large Latino populations and
no representation highlight the issue of relying solely on minority elected official rosters
to determine extent of representation. The National Association of Latino Elected and
Appointed Officials (NALEO) takes a survey of school boards across the country to create
its Directory of Latino Elected Officials, but there is no way to know if those locations
not included in the directory have no representation, or did not fill out the survey. In this
analysis, there are 7 school boards with greater than 75% Latino VAP without representation,
all in California. Additional models were run without these outliers, and the results remain
robust. Models and data available from author.
21

Table A2: Expected Count of Latino School Board Members,
Conditional on Black VAP and Black-Latino Segregation (for Figure 3)
Black-Latino Segregation LevelBlack VAP 68 48 28
0 2.27 1.73 1.4210 1.99 1.57 1.3420 1.78 1.45 1.2730 1.61 1.36 1.2140 1.48 1.29 1.1750 1.38 1.23 1.1460 1.30 1.18 1.1170 1.24 1.15 1.0980 1.19 1.12 1.0790 1.16 1.09 1.06100 1.13 1.08 1.05
Note: Mean Black-Latino Segregation=28, +1SD=48, +2SD=68.Predicted probabilities calculated with all categorical variables at mode(at-large, traditional destinations and Urban=1; Board size=7), all else at mean.
22

Notes
1See McClain and Garcia (1993) for a summary of these methodological limitations.
2Local office includes city council and school board members. Data was provided by the
Joint Center for Political and Economic Studies (Black Elected Officials Roster), and the
National Association of Latino Elected Officials (Latino Roster) for 2000.
3Other recent studies have focused on school board representation and Latinos, but these
data have either been restricted to one state (Meier et al. 2005)or a national sample of larger
school districts (Leal 2004). Data for this project comes from an original project investi-
gating the policy implications of Latino representation in education, and included collecting
information from the National Association of School Boards, district websites and phone
calls to individual school districts. In all, information on 10,995 school districts in 46 states
was collected. This data was then merged with representation data from NALEO, Census
2000 data, and segregation data from the Lewis Mumford Center for Comparative Urban
and Regional Research, yielding an effective sample of 4510 school districts in 40 states, ex-
cluding Alaska, Arkansas, Hawaii, Idaho, Kentucky, Nevada, North Dakota, South Dakota,
Vermont, and Wyoming. None of the excluded school districts had Latino representation in
2000. In addition, the multiple school boards in Chicago (Local School Councils) and New
York City (District Councils) were excluded from the sample.
4Less than 2% of the districts in my sample had appointed school boards, and less than
3% used a mixed method of election.
5Index of Dissimilarity = 12
∑(ai/A) − (bi/B), where ai is one racial group’s population
in the census tract, and A is that racial groups total population within the school district,
and bi is another racial group’s population in the census tract, and B is the total population
of racial group B within the school district.
23

6A single measure of Latino citizens of voting age would have been most appropriate.
However, this data is not currently available at the school district level
7Although this is a blunt measure of assimilation and incorporation, it does control for
the distribution and history of Latino populations better than other measures, such as census
regions and divisions.
8Other two-stage model specifications, including the zero-inflated negative binomial (ZINB)
model, were tested but rejected in favor of the hurdle model for both theoretical and method-
ological reasons. Theoretically, the estimator should be capable of modeling the two-stages
as distinct processes in which once the hurdle of any representation was overcome, realiza-
tion of a Latino presence on the school board is realized as a non-negative integer. Because
the hurdle model can be estimated as two separate model (a binary model and a count
model), a more complete estimation of the determinants of representation could be included
(McDowell 2003).
9Unless otherwise noted, all predicted probabilities are calculated with categorical vari-
ables at mode (at-large, urban, and traditional destinations =1; school board size=7), all
else at mean. Predictions calculated using SPost (Long & Freese 2006).
24

References
Alonzie, Nicholas O. & Lynn L. Manganaro. 1993. “Black and Hispanic Council Represen-tation.” Urban Affairs Review 29(2):276–98.
Bositis, David. 2002. Black Elected Officials: A Statistical Summary, 2000. Technical reportJoint Center for Political and Economic Studies.
Bowler, Shaun, Todd Donovan & David Brockington. 2003. Electoral Reform and MinorityRepresentation: Local Experiments with Alternative Elections. Columbus: Ohio StateUniversity Press.
Browning, Rufus, Dale Marshall & David Tabb. 1984. Protest is Not Enough: The Struggleof Blacks and Hispanics for Equality in Urban Politics. Los Angeles: University ifCalifornia Press.
Bullock, Charles S. & Susan A. MacManus. 1991. “Municipal Electoral Structure and theElection of Councilwomen.” Journal of Politics 53:75–89.
Cameron, A. C. & P. K. Trivedi. 1998. Regression Analysis of Count Data. New York:Cambridge University Press.
Canon, David. 1999. Redistricting and Representation: The Unintended Consequences ofBlack Majority Districts. Chicago, IL: University of Chicago Press.
Chapa, Jorge & Belinda de la Rosa. 2004. “Latino Population Growth, Socioeconomic andDemographic Characteristics, and Implications for Educational Attainment.” Educationand Urban Society 36:130–149.
Davidson, Chandler & George Korbel. 1981. “At-Large Elections and Minority-Group Repre-sentation: A Re-Examination of Historical and Contemporary Evidence.” The Journalof Politics 43:982–1005.
DeSipio, Louis. 1996. Counting on the Latino Vote: Latinos as a New Electorate. Char-lottesville: University of Virginia Press.
Dyer, James, Arnold Vedlitz & Stephen Worchel. 1989. “Social Distance among Racialand Ethnic Groups in Texas: Some Geographic Correlates.” Social Science Quarterly70:607–616.
Engstrom, Richard & Michael McDonald. 1981. “The Election of Blacks to City Councils:Clarifying the Impact of Electoral Arrangements on the Seats/Population Relationship.”American Political Science Review 75(2):344–54.
Engstrom, Richard & Michael McDonald. 1982. “The Underrepresentation of Blacks on CityCouncils.” Journal of Politics 44:1088–1105.
Engstrom, Richard & Michael McDonald. 1986. The Effect of At-large vs. District Electionson Racial Representation in US Municipalities. In Electoral Laws and Their PoliticalConsequences, ed. Bernard Grofman & Arend Lijphart. New York: Agathon Press.
25

Fox, Richard L. & Jennifer L. Lawless. 2005. “To Run or Not to Run for Office: ExplainingNascent Political Ambition.” American Journal of Political Science 49(3):642–659.
Gay, Claudine. 2006. “Seeing Difference: The Effects of Economic Disparity on Black Atti-tudes towards Latinos.” American Journal of Political Science 50:982–997.
Gills, Douglas C. & John Betancur. 2000. The Collaborative City: Opportunities and Strug-gles for Blacks and Latinos in U.S. Cities. New York: Garland Press.
Hardy-Fanta, Carol, Christine Marie Sierra, Pei te Lein, Dianne Pinderhughes & Wartyna LDavis. 2005. ”Race, Gender and Descriptive Representation: An Exploratory View ofMulticultural Elected Leadership in the United States.” Paper presented at the AnnualMeeting of the American Political Science Association.
Hayduk, Ronald. 2004. “Democracy for All: Restoring Immigrant Voting Rights in the US.”New Political Science 26:499–523.
Highton, Benjamin & Arthur L. Burris. 2002. “New Perspectives on Latino Voter Turnoutin the United States.” American Politics Research 30(3):285–306.
Howell, William G. 2005. “School Board Surrounded.” American School Board Journal(May):24–27.
Jennings, James. 2003. Blacks, Latinos and Asians in Urban America. Westport: Praeger.
Karnig, Albert. 1979. “Black Resources and City Council Representation.” Journal of Poli-tics 41:134–49.
Karnig, Albert & Susan Welch. 1980. Black Representation and Urban Policy. Chicago:University of Chicago Press.
Kaufmann, Karen M. 2003. “Cracks in the Rainbow: Group Commonality as a Basisfor Latino and African-American Political Coalitions.” Political Research Quarterly56(2):199–210.
King, Gary. 1989. Unifying Political Methodology. New York: Cambridge University Press.
Kini, Tara. 2005. “Sharing the Vote: Noncitizen Voting Rights in Local School BoardElections.” California Law Review 93(271).
Kochar, Rakesh, Roberto Suro & Sonya Tafoya. 2005. The New Latino South: The Contextand Consequences of Rapid Population Growth. Technical report Pew Hispanic Center.
Leal, David. 2004. “The Politics of Latino Education: The Biases of At-Large Elections.”The Journal of Politics 66(4):1224.
Liu, Baodong. 2001. “Racial Contexts and White Interests: Beyond Black Threat and RacialTolerance.” Political Behavior 23:157–180.
26

Logan, John. 2001. Ethnic Diversity Grows, Neighborhood Integration Lags Behind. Tech-nical report Lewis Mumford Center.
Logan, John. 2002. Hispanic Populations and Their Residential Patterns in the Metropolis.Technical report Lewis Mumford Center.
Long, J. Scott & Jeremy Freese. 2006. Regression Models for Catergorical Dependent Vari-ables Using Stata. Stata Press.
Lublin, David. 1997. The Paradox of Representation: Racial Gerrymandering and MinorityInterests in Congress. Princeton, NJ: Princeton University Press.
MacManus, Susan A. 1978. “City Council Election Procedures and Minority Representation:Are they Related?” Social Science Quarterly 59(June):153–61.
Marschall, Melissa. 2005. Minority Incorporation and Local School Boards. In Besieged:School Boards and the Future of Education Politics, ed. William G. Howell. WashingtonD.C.: Brookings Institution Press.
Marschall, Melissa, Anirudh Ruhil & Paru Shah. 2008. “The New Racial Calculus: ElectoralInstitutions and Black Representation in Local Legislatures.”.
Marschall, Melissa J. & Anirudh Ruhil. 2004. ”The New Racial Calculus: Electoral Insti-tutions and Black Gains in City Hall.” Paper presented at the Annual meeting of theMidwest Political Science Association.
Massey, Douglas. 1995. “The New Immigration and the Meaning of Ethnicity in the UnitedStates.” Population and Development Review 21:631.
Massey, Douglas S. & Nancy A. Denton. 1993. American Apartheid: Segregation and theMaking of the Underclass. Cambridge: Harvard University Press.
McClain, Paula & John Garcia. 1993. Expanding Disciplinary Boundaries: Black, Latino,and Racial Minority Group Politics in Political Science. In Political Science: The Stateof the Discipline, II, ed. Ada W. Finifter. American Political Science Association.
McDowell, Allen. 2003. “From the help desk: Hurdle Models.” The Stata Journal 3:178–184.
Meier, Kenneth, Eric Juenke, Robert Wrinkle & J. L. Polinard. 2005. “Structural Choicesand Representational Biases: The Post-Election Color of Representation.” AmericanJournal of Political Science 49(4):758–768.
Meier, Kenneth J. 1993. “Latinos and Representative Bureaucracy: Testing the Thompsonand Henderson Hypotheses.” Journal of Public Administration Research and Theory3(October):393–415.
Meier, Kenneth, Paula McClain, J. L. Polinard & Robert Wrinkle. 2004. “Divided or To-gether? Conflict and Cooperation between African Americans and Latinos.” 57(3):399.
27

Mladenka, Kennth R. 1989. “Barriers to Hispanic Employment Success in 1200 Cities.”Social Science Quarterly 70(2):391.
Mullahy, J. 1986. “Specification and testing of some modified count data models.” Journalof Econometrics 3:341–365.
National Assocation of Latino Elected Officials. 2002. National Directory of Latino ElectionOfficials. Technical report NALEO.
Pachon, Harry & Louis DeSipio. 1992. “Latino Elected Officials in the 1990s.” PS: PolicticalScience and Politics 25(2):212.
Robinson, T. P. & T. R. Dye. 1978. “Reformism and Black Representation on City Councils.”Social Science Quarterly 59(1):133–141.
Rocha, Rene. 2007. “Black-Brown Coalitions in Local School Board Elections.” PoliticalResearch Quarterly 60:315–327.
Rocha, Rene, Robert Wrinkle & J. L. Polinard. 2005. ”The New Dynamics of Interracialcoalitions in Urban School Districts.” Paper presented at the Annual Meeting of theMidwest Political Science Association.
Sass, T. R. 2000. “The determinants of Hispanic representation in municipal government.”Southern Economic Journal 66(3):609–630.
Singer, Audrey. 2004. The Rise of New Immigrant Gateways. Technical report BrookingsInstitute.
Stewart, Joseph, Robert England & Kenneth Meier. 1989. “Black representation in UrbanSchool Districts: From School Board to Office Classroom.” Western Political Quarterly42(June):287–305.
Suro, Roberto. 2002. 2002 National Survey of Latinos. Technical report Pew Hispanic Cen-ter/Kaiser Family Foundation.
Suro, Roberto & Audrey Singer. 2002. Latino Growth in Metropolitan America : ChangingPatterns, New Locations. Technical report Brookings Institution.
Suro, Roberto & Jeffrey Passel. 2003. The rise of the second generation : changing patternsin Hispanic population growth. Technical report Pew Hispanic Center.
Taebel, Delbert. 1978. “Minority Representation in City Councils: The Impact of Structureon Blacks and Hispanics.” Social Science Quarterly 59(June):142–145.
Trounstine, Jessica & Melody Ellis Valdini. 2008. “The Context Matters: The Effects ofSingle Member vs. Multimember Districts on Diversity.” American Journal of PoliticalScience 52:554–569.
Vaca, Nicholas. 2004. Presumed Alliance. New York: Harper Collins.
28

Vedlitz, Arnold & CA Johnson. 1982. “Community Racial Segregation, Electoral Structureand Minority Representation.” Social Science Quarterly 63:729–736.
Welch, Susan. 1990. “The impact of at-large elections on the representation of blacks andhispanics.” Journal of Politics 52(4):1050.
Welch, Susan & Albert Karning. 1978. “Representation of Blacks on Big City School Boards.”Social Science Quarterly 59:162–72.
Zax, Jeffrey. 1990. “Election Methods and Black and Hispanic City Council Membership.”Social Science Quarterly 71(June):339–55.
Zorn, Christopher. 1998. “An Analytic and Empirical Estimation of Zero-Inflated and HurdlePoisson Specifications.” Sociological Methods and Research 26:368–400.
29

Tab
le1:
Sum
mar
ySta
tist
ics
ofSch
ool
Dis
tric
tsin
Sam
ple
Full
Sam
ple
(n=
1664
)Sam
ple
Wit
hL
atin
oR
epre
senta
tion
(n=
218)
Mea
nStd
.D
ev.
Ran
geM
ean
Std
.D
ev.
Ran
ge
#L
atin
oSch
ool
Boa
rdM
emb
ers
(DV
)0.
361.
17(0
,7)
2.78
1.94
(1,7
)W
ard
Ele
ctio
ns
(=1)
0.25
0.43
(0,1
)0.
310.
46(0
,1)
At-
larg
eE
lect
ions
(=1)
0.75
0.43
(0,1
)0.
690.
46(0
,1)
Index
ofD
issi
milar
ity,
whit
e-L
atin
o17
.16
16.5
1(0
,92
)24
.30
18.0
8(0
,77
)In
dex
ofD
issi
milar
ity,
bla
ck-L
atin
o20
.25
17.4
7(0
,100
)28
.28
19.7
7(0
,90
)L
atin
oV
otin
gA
geP
opula
tion
(%)
22.2
720
.64
(5,
99)
53.3
226
.42
(5,
99)
Lat
ino
Non
-Cit
izen
s(%
)25
.68
14.9
6(0
,100
)25
.23
13.3
7(0
,62.
5)B
lack
Vot
ing
Age
Pop
ula
tion
(%)
5.15
9.50
(0,
81)
5.16
8.27
(0,7
1)T
radit
ional
Des
tinat
ion
(=1)
0.88
0.33
(0,1
)0.
970.
17(0
,1)
New
Des
tinat
ion
(=1)
0.07
0.25
(0,1
)0.
010.
09(0
,1)
Oth
erD
esti
nat
ion
(=1)
0.06
0.23
(0,1
)0.
020.
14(0
,1)
Sch
ool
Boa
rdSiz
e(#
seat
s)6.
211.
49(2
,12)
6.07
1.32
(3,1
1)L
atin
oM
edia
nF
amily
Inco
me
($k)
41.4
216
.80
(0,2
00)
33.2
49.
92(1
7,69
)L
atin
ow
ith
Bac
hel
ors
Deg
ree
(%)
8.68
8.92
(0,
100)
4.55
3.70
(0,2
2)U
rban
Dis
tric
t(=
1)0.
770.
42(0
,1)
0.89
0.32
(0,1
)D
istr
ict
Pop
ula
tion
(log
ged)
9.64
1.64
(3,1
6)10
.25
1.62
(5,1
6)
30

Table 2: Hurdle Model Estimates of Latino Descriptive Representation
Dependent Variable = Number of Latino school Board Members
Stage 1 Stage 2Logit ZTP
Ward Elections -0.868** -0.382(0.393) (0.217)
Percent Latino Voting Age Population .017*** .010**(0.003) (0.004)
Percent black Voting Age Population 0.008 -.021*(0.009) (0.009)
White-Latino Segregation 0.003 -0.005(0.009) (0.005)
Black-Latino Segregation 0.009 0.004(0.006) (0.004)
Ward*White-Latino Segregation -0.008 -0.005(0.013) (0.006)
Ward*Black-Latino Segregation 0.030* 0.019***(0.012) (0.005)
School Board Size -0.304*** -0.045(0.085) (0.055)
Latino Median Family Income -0.042*** -0.027**(0.009) (0.009)
Percent Latino with Bachelors Degree -0.111*** -0.038(0.025) (0.027)
Percent Latino Non-citizens -0.020** -0.013***(0.007) (0.004)
Traditional Destination 1.045* 1.419(0.471) (0.931)
New Destination -1.135 -12.306***(0.849) (1.203)
Urban District 1.089*** 0.208(0.280) (0.234)
District Population (logged) 0.453*** 0.043(0.088) (0.063)
Constant -4.612*** -0.126(1.023) (1.134)
N 1664 218χ2 223.666 565.396AIC 1011.079 668.637BIC 1097.750 722.789
∗p < 0.05, ∗ ∗ p < 0.01, ∗ ∗ ∗p < 0.001Note: Robust standard errors reported in parentheses.Note: At-large elections and Other Destinations reference categories.
31

Figure 1: Distribution of the Latino Population and Latino School Board Members
N.H.
R.I.3
16
153
T e x a s
U t a h
M o n t a n a
Cal i forn ia
A r i z o n a
I d a h o
N e v a d a
O r e g o n
I o w a
C o l o r a d oK a n s a s
W y o m i n g
N e w M e x i c o
I l l i n o i sO h i o
M i s s o u r i
Minnesota
N e b r a s k a
Florida
G e o r g i a
O k l a h o m a
A l a b a m a
W a s h i n g t o n
S o u t h D a k o t a
A r k a n s a s
W i s c o n s i n
N o r t h D a k o t aMaine
Vi r g i n i a
N e w Y o r k
Indiana
Louisiana
M i c h i g a n
K e n t u c k y
T e n n e s s e e
P e n n s y l v a n i a
No r t h Ca r o l i n a
M i s s .
SouthCarolina
WestVirginia
Mich. Vt.
Md.N.J.
Mass.Conn.
Del.
701
1
1
2
4842
2
1
2
11
1
1
1
113
Latino Population and Latino School Board Members
A l a s k a
Hawaii
Cartography by Birgit Mühlenahus, 2007Data Sources: US Census Bureau,
Census 2000, Summary File 1;ESRI; NALEO Roster 2002
0 250 500 Miles
Alaska and Hawaii not drawn to scale.
Percent Latinoof the Population
0.68 - 2.912.92 - 6.416.42 - 13.2813.29 - 25.25
Number ofLatino SchoolBoard Members16
25.26 - 42.08
32

Figure 2: Effects of Electoral Structure, Conditional on Segregation
0 20 40 60 80 100
0.0
0.1
0.2
0.3
0.4
0.5
Black/Latino Segregation (Index of Dissimilarity)
Pro
babi
lity
of L
atin
o R
epre
sent
atio
n
0 20 40 60 80 100
0.0
0.1
0.2
0.3
0.4
0.5
WardAt−Large
Note: Predicted probabilities calculated with all categorical variables at mode (at-large,
traditional destinations and Urban=1; Board size=7), all else at mean.
33
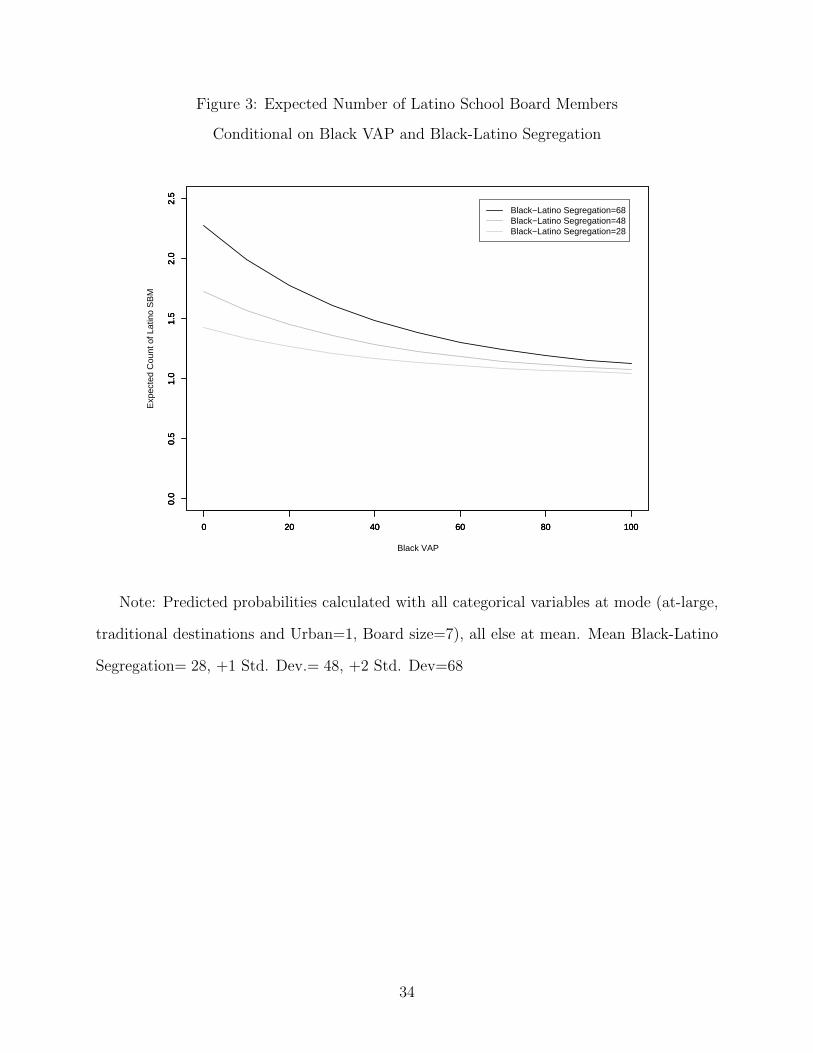
Figure 3: Expected Number of Latino School Board Members
Conditional on Black VAP and Black-Latino Segregation
0 20 40 60 80 100
0.0
0.5
1.0
1.5
2.0
2.5
Black VAP
Exp
ecte
d C
ount
of L
atin
o S
BM
0 20 40 60 80 100
0.0
0.5
1.0
1.5
2.0
2.5
0 20 40 60 80 100
0.0
0.5
1.0
1.5
2.0
2.5
Black−Latino Segregation=68Black−Latino Segregation=48Black−Latino Segregation=28
Note: Predicted probabilities calculated with all categorical variables at mode (at-large,
traditional destinations and Urban=1, Board size=7), all else at mean. Mean Black-Latino
Segregation= 28, +1 Std. Dev.= 48, +2 Std. Dev=68
34