radioactivity in the risø district july-december 2011 · 3 40 4 55 5 50 6 55 mean 49 ....
TRANSCRIPT

General rights Copyright and moral rights for the publications made accessible in the public portal are retained by the authors and/or other copyright owners and it is a condition of accessing publications that users recognise and abide by the legal requirements associated with these rights.
• Users may download and print one copy of any publication from the public portal for the purpose of private study or research. • You may not further distribute the material or use it for any profit-making activity or commercial gain • You may freely distribute the URL identifying the publication in the public portal
If you believe that this document breaches copyright please contact us providing details, and we will remove access to the work immediately and investigate your claim.
Downloaded from orbit.dtu.dk on: Dec 20, 2017
Radioactivity in the Risø District July-December 2012
Nielsen, Sven Poul; Andersson, Kasper Grann; Miller, Arne
Publication date:2013
Document VersionPublisher's PDF, also known as Version of record
Link back to DTU Orbit
Citation (APA):Nielsen, S. P., Andersson, K. G., & Miller, A. (2013). Radioactivity in the Risø District July-December 2012. DTUNutech. (DTU-Nutech-R; No. 0005(EN)).
Ris
ø-R
-Re
po
rt
Radioactivity in the Risø District July-December 2012
Sven P. Nielsen, Kasper G. Andersson and Arne Miller
DTU-Nutech-R-0005(EN)
June 2013
DT
U N
ute
ch
Rep
ort

Author: Sven P. Nielsen, Kasper G. Andersson and Arne Miller Title: Radioactivity in the Risø District July-December 2012 Division: Radiation Research
DTU-Nutech-R-0005(EN)
June 2013
Abstract (max. 2000 char.): The environmental surveillance of the
Risø environment was continued in July - December 2012.
The mean concentrations in air were: 0.320.31 Bq m–3
of 137
Cs, 3.040.99 mBq m–3
of 7Be and 0.220.18 mBq m
–3 of
210Pb (1 S.D.; N = 26). The depositions by precipitation at
Risø in the second half of 2012 were: 0.039 Bq m–2
of 137
Cs,
615 Bq m–2
of 7Be, 40.3 Bq m
–2 of
210Pb and < 0.6 kBq m
–2 of
3H. The average background dose rate (TLD) at Risø (Zone
I) was 54 nSv h–1
compared with 58 8 nSv h–1
(1 S.D.; N =
3) in the four zones around Risø.
ISBN: 978-87-995321-5-5
Contract no.:
Group's own reg. no.: 59514 E-1
Sponsorship:
Cover :
Pages: 24 Tables: 14
References:
Center for Nuclear Technologies
Technical University of Denmark
P.O.Box 49 DK-4000 Roskilde
Denmark
Telephone +45 46775300 www.dtu.dk

DTU-Nutech-R-0005(EN)
3
Contents
Table 1. Radionuclides in air 5
Table 2.1. Radionuclides in precipitation 6
Table 2.2. Radionuclides in precipitation 6
Table 2.3. Tritium in precipitation 7
Table 2.4. Tritium in precipitation 7
Table 3.1. Radionuclides in sediment samples 8
Table 4.1. Radionuclides in seawater 8
Table 4.2. Tritium in seawater 8
Table 5.1. Radionuclides in grass 9
Table 5.2. Radionuclides in sea plants 10
Table 7.1. Waste water 11
Table 8.1. Background dose rates around the border of Risø (TLD) 12
Table 8.2. Background dose rates around Risø (TLD) 13
Table 8.3. Terrestrial dose rates at the Risø zones (NaI(Tl) detector) 14
Fig. 1. Map of Risø 15
Fig. 1.1. Caesium-137 in air 16
Fig. 1.2. Beryllium-7 and lead-210 in air 16
Fig. 2.3.1 Tritium in precipitation (1 m2 rain collector) 17
Fig. 2.3.2 Tritium in precipitation (10 m2 rain collector) 17
Fig. 3.1 Caesium-137 in sediment samples 18
Fig. 4.1 Caesium-137 in seawater 19
Fig. 4.2 Tritium in seawater 19
Fig. 7.1 Total-beta radioactivity in waste water 20
Fig. 8.1. Map of Risø with locations for TLD measurements 21
Fig. 8.2. The environment of Risø 22

4 DTU-Nutech-R-0005(EN)

DTU-Nutech-R-0005(EN)
5
Table 1. Radionuclides in ground level air collected at Risø (cf. Figs. 1, 1.1
and 1.2), July - December 2012. (Unit: Bq m–3
)
Date 7Be
137Cs
210Pb
02-Jul-12 – 09-Jul-12 3006 0.131 159
09-Jul-12 – 16-Jul-12 2315 0.103 82
16-Jul-12 – 23-Jul-12 3656 0.103 103
23-Jul-12 – 30-Jul-12 5139 0.271 264
30-Jul-12 – 06-Aug-12 3990 0.117 168
06-Aug-12 – 13-Aug-12 5266 0.318 244
13-Aug-12 – 20-Aug-12 3330 0.244 202
20-Aug-12 – 27-Aug-12 3683 0.147 164
27-Aug-12 – 04-Aug-12 4645 0.142 227
04-Sep-12 – 10-Sep-12 3041 0.117 118
10-Sep-12 – 17-Sep-12 3913 0.161 271
17-Sep-12 – 24-Sep-12 2550 0.242 168
24-Sep-12 – 01-Oct-12 2554 0.140 151
01-Oct-12 – 08-Oct-12 2014 0.161 84
08-Oct-12 – 15-Oct-12 2734 0.176 234
15-Oct-12 – 22-Oct-12 2761 0.362 417
22-Oct-12 – 29-Oct-12 1421 0.264 152
29-Oct-12 – 05-Nov-12 2021 0.320 292
05-Nov-12 – 12-Nov-12 2114 0.175 418
12-Nov-12 – 19-Nov-12 2848 0.398 955
19-Nov-12 – 26-Nov-12 2608 0.694 88
26-Nov-12 – 03-Dec-12 3352 0.382 146
03-Dec-12 – 10-Dec-12 1900 0.494 88
10-Dec-12 – 17-Dec-12 3035 0.698 321
17-Dec-12 – 24-Dec-12 1858 1.628 93
24-Dec-12 – 31-Dec-12 3372 0.251 190
Mean 3043 0.317 223
SD 986 0.313 177

6 DTU-Nutech-R-0005(EN)
Table 2.1. Radionuclides in precipitation in the 10 m2 rain collector at Risø (cf. Fig. 1),
July - December 2012. (Unit: Bq m–3
)
Month 7Be
137Cs
210Pb
July 4967 0.497 321
August 2387 0.155 136
September 1712 0.059 106
October 1230 0.056 92
November 1243 0.044 52
December 1613 0.122 131
Table 2.2. Radionuclides in precipitation in the 10 m2 rain collector at Risø (cf. Fig. 1),
July - December 2012. (Unit: Bq m–2
)
Month Precipitation
(m)
7Be
137Cs
210Pb
July 0.029 144 0.0144 9.3
August 0.039 93 0.0060 5.3
September 0.067 114 0.0040 7.1
October 0.072 89 0.0040 6.6
November 0.045 56 0.0020 2.3
December 0.074 119 0.0090 9.7
Sum 0.326 615 0.0394 40.3

DTU-Nutech-R-0005(EN)
7
Table 2.3. Tritium in precipitation collected at Risø (cf. Figs. 1, 2.3.1
and 2.3.2). July - December 2012. (Unit: kBq m–3
)
Month 10 m2 rain collector*
July 2.2
August < 1.7
September < 1.7
October < 1.7
November < 1.7
December < 1.7
Double determinations*.
Table 2.4. Tritium in precipitation collected at Risø (cf. Fig. 1). July - December 2012.
(Unit: kBq m–2
)
Month Precipitation (m) 10 m2 rain collector
July 0.029 0.064
August 0.039 < 0.066
September 0.067 < 0.114
October 0.072 < 0.122
November 0.045 < 0.077
December 0.074 < 0.126
Sum 0.326 < 0.569

8 DTU-Nutech-R-0005(EN)
Table 3.1. Radionuclides in sediment samples collected at Bolund in
Roskilde Fjord.(cf. Fig. 3.1) July - December 2012. (Unit: Bq kg–1
dry)
Date 137
Cs K*
1 July 2.4 16.6
*Unit: g kg-1
dry
Table 4.1. Radionuclides in seawater collected in Roskilde Fjord
(cf. Fig. 4.1) July - December 2012. (Unit: Bq m–3
)
Date 137
Cs
1 July 10.9
Table 4.2. Tritium in seawater collected in Roskilde Fjord (Risø pier)
(cf. Fig. 4.2) July - December 2012.
Month kBq m–3
July < 1.7 *
August < 1.7 *
September 1.7 *
October # -
November # -
December < 1.7 *
* Double determinations
# starting autumn 2012, tritium in seawater is measured quarterly.
DTU-Nutech-R-0005(EN)
9
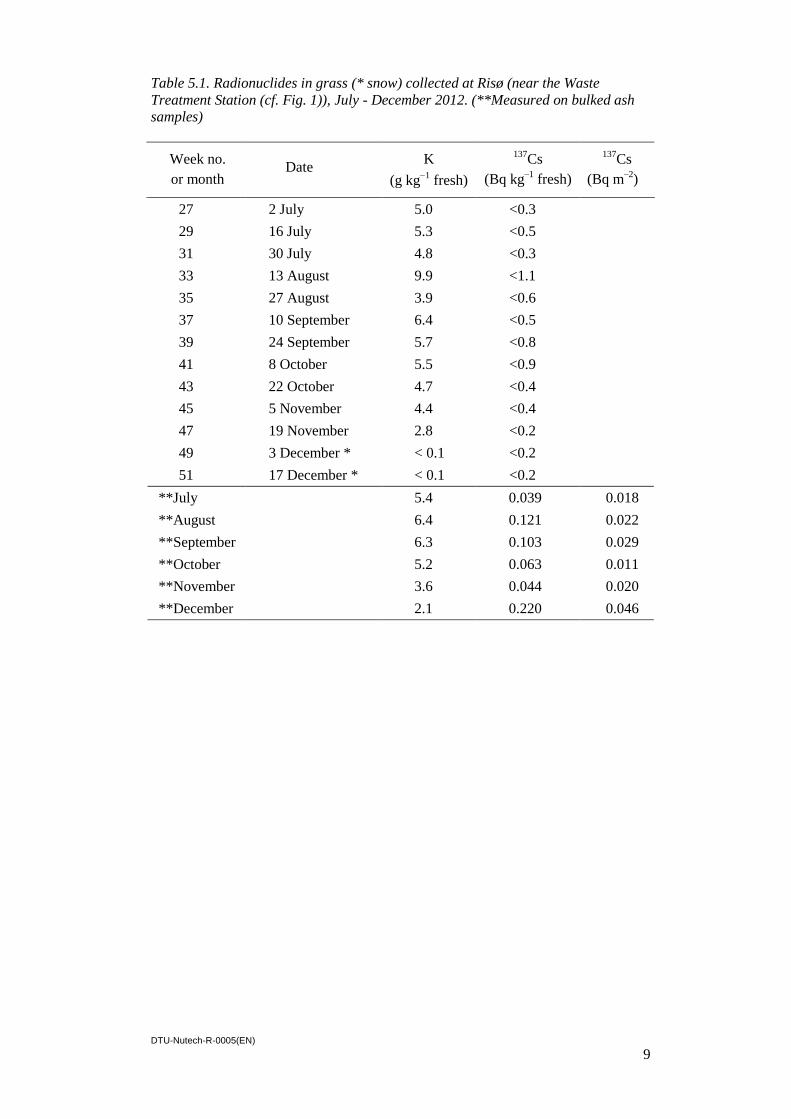
Table 5.1. Radionuclides in grass (* snow) collected at Risø (near the Waste
Treatment Station (cf. Fig. 1)), July - December 2012. (**Measured on bulked ash
samples)
Week no. Date
K 137
Cs 137
Cs
or month (g kg1
fresh) (Bq kg–1
fresh) (Bq m–2
)
27 2 July 5.0 <0.3
29 16 July 5.3 <0.5
31 30 July 4.8 <0.3
33 13 August 9.9 <1.1
35 27 August 3.9 <0.6
37 10 September 6.4 <0.5
39 24 September 5.7 <0.8
41 8 October 5.5 <0.9
43 22 October 4.7 <0.4
45 5 November 4.4 <0.4
47 19 November 2.8 <0.2
49 3 December * < 0.1 <0.2
51 17 December * < 0.1 <0.2
**July 5.4 0.039 0.018
**August 6.4 0.121 0.022
**September 6.3 0.103 0.029
**October 5.2 0.063 0.011
**November 3.6 0.044 0.020
**December 2.1 0.220 0.046

10 DTU-Nutech-R-0005(EN)
Table 5.2. Radionuclides in Fucus vesiculosus collected at Bolund
in Roskilde Fjord. July - December 2012. (Unit: Bq kg–1
dry)
Date 137
Cs K* % dry matter
1 July 3.4 29 18
*Unit: g kg-1
dry

DTU-Nutech-R-0005(EN)
11
Table 7.1. Waste water collected at Risø (cf. Fig. 1), July - December 2012.
Week
number
eqv. mg
KCl l-1
137Cs
(Bq m–3
)
131I
(Bq m–3
)
226Ra
(Bq m–3
)
27 85 < 72 < 71 < 140
28 84 < 109 < 108 < 207
29 73 < 105 < 110 < 216
30 74 < 106 < 109 < 213
31 122 < 111 < 116 < 217
32 163 < 115 < 116 < 224
33 130 < 111 < 114 < 211
34 115 < 101 < 110 < 201
35 117 < 111 < 110 < 225
36 123 < 107 < 111 < 223
37 142 < 111 < 113 < 213
38 148 < 99 < 106 < 202
39 160 < 106 < 115 < 204
40 147 < 74 < 175 < 154
41 136 < 110 < 109 < 209
42 175 < 116 < 118 < 223
43 149 < 100 < 106 < 204
44 211 < 110 < 113 < 205
45 181 < 122 < 120 < 237
46 143 < 107 < 107 < 203
47 113 < 103 < 112 < 202
48 159 < 112 < 113 < 230
49 108 < 116 < 115 < 221
50 109 < 101 < 114 < 205
51 118 < 107 < 109 < 209
52 79 < 83 < 175 < 239
Mean 129.4
SD 34.8
12 DTU-Nutech-R-0005(EN)
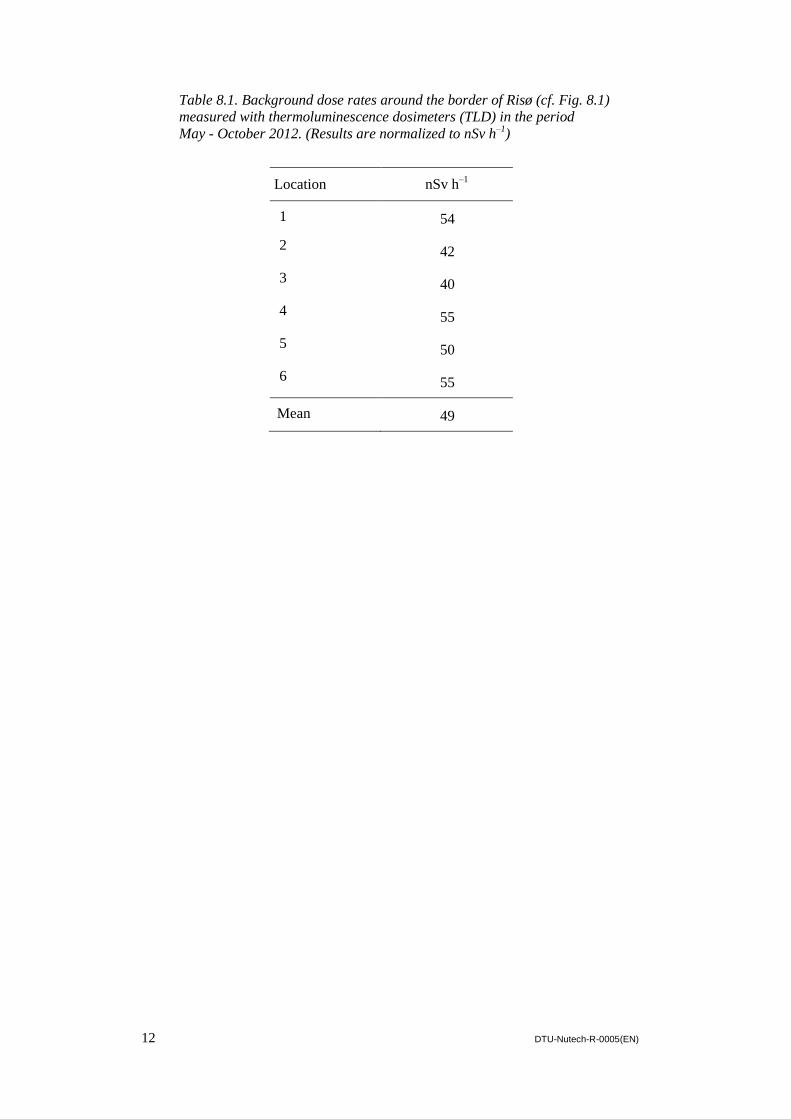
Table 8.1. Background dose rates around the border of Risø (cf. Fig. 8.1)
measured with thermoluminescence dosimeters (TLD) in the period
May - October 2012. (Results are normalized to nSv h–1
)
Location nSv h–1
1 54
2 42
3 40
4 55
5 50
6 55
Mean 49

DTU-Nutech-R-0005(EN)
13
Table 8.2. Background dose rates around Risø (cf. Fig. 8.2 and Fig. 1)
measured with thermoluminescence dosimeters (TLD) in the period
May – October 2012. (Results are normalized to nSv h–1
)
Risø zone Location nSv h–1
I 1 35
I 2 46
I 3 79
I 4 -
I 5 57
Mean 54
II P1 42
II P2 63
II P3 68
II P4 51
Mean 56
III P1 56
III P2 57
III P3 53
Mean 55
IV P1 39
IV P2 38
IV P3 50
IV P4 51
IV P5 42
IV P6 43
IV P7 50
Mean 45
V P1 49
V P2 55
V P3 54
V P4 40
V P5 60
V P6 50
V P7 45
V P8 61
V P9 61
V P10 61
Mean 54
14 DTU-Nutech-R-0005(EN)
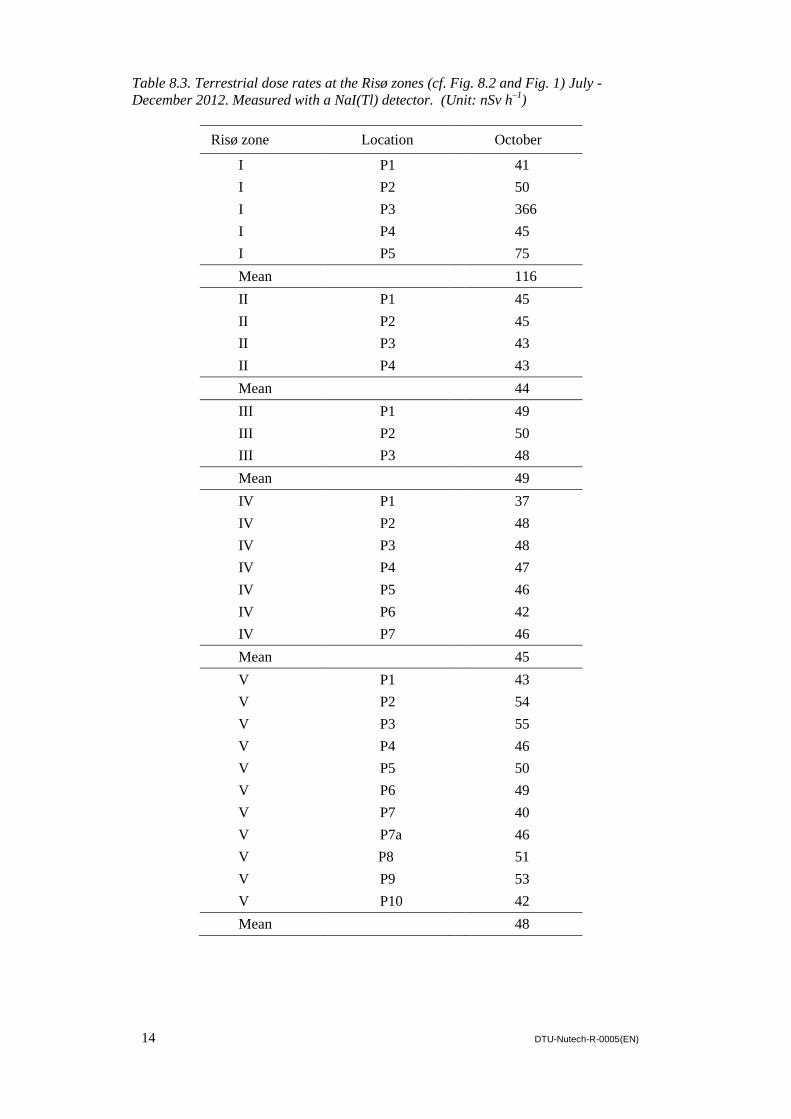
Table 8.3. Terrestrial dose rates at the Risø zones (cf. Fig. 8.2 and Fig. 1) July -
December 2012. Measured with a NaI(Tl) detector. (Unit: nSv h–1
)
Risø zone Location October
I P1 41
I P2 50
I P3 366
I P4 45
I P5 75
Mean 116
II P1 45
II P2 45
II P3 43
II P4 43
Mean 44
III P1 49
III P2 50
III P3 48
Mean 49
IV P1 37
IV P2 48
IV P3 48
IV P4 47
IV P5 46
IV P6 42
IV P7 46
Mean 45
V P1 43
V P2 54
V P3 55
V P4 46
V P5 50
V P6 49
V P7 40
V P7a 46
V P8 51
V P9 53
V P10 42
Mean 48
DTU-Nutech-R-0005(EN)
15
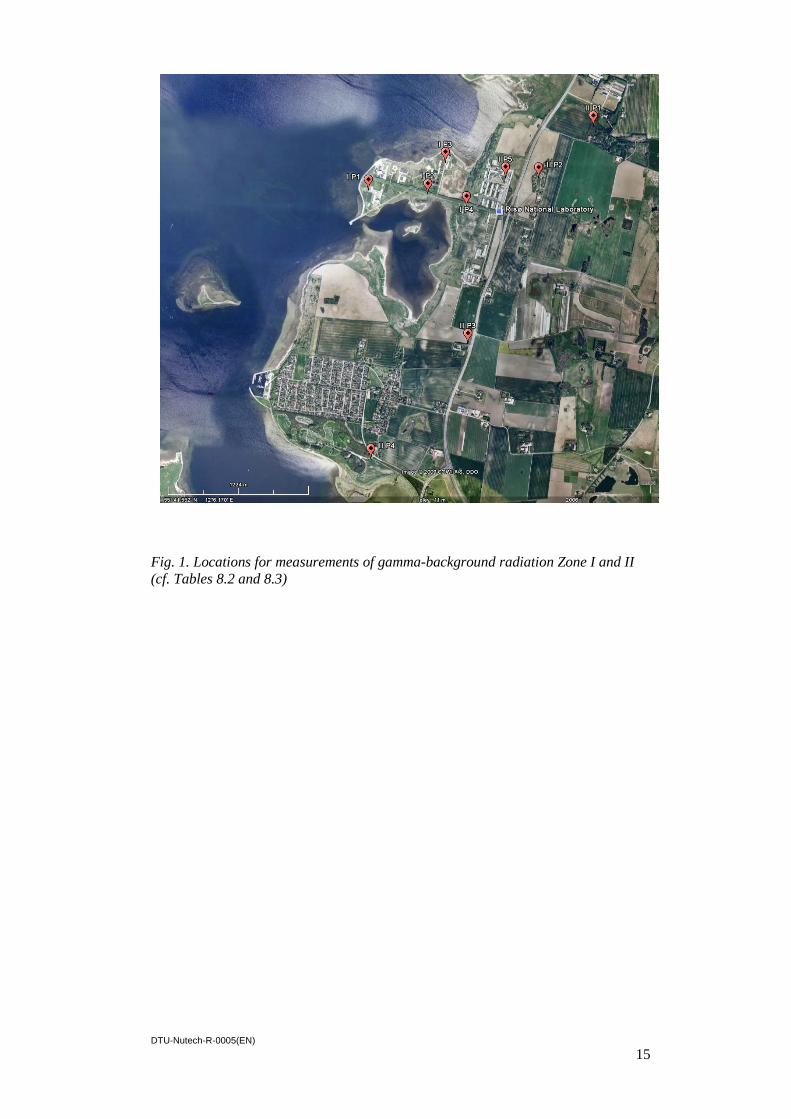
Fig. 1. Locations for measurements of gamma-background radiation Zone I and II
(cf. Tables 8.2 and 8.3)

16 DTU-Nutech-R-0005(EN)
0.10
1.00
10.00
26 31 36 41 46 51
13
7C
s µ
Bq m
-3
Week
Fig. 1.1. Caesium-137 in ground level air collected at Risø in July-December 2012.
(Unit: µBq m–3
)
10
100
1000
10000
26 31 36 41 46 51
13
7C
s µ
Bq
m-3
Week
Be-7 Pb-210
Fig. 1.2. Beryllium-7 and lead-210 in ground level air collected at Risø in July-
December 2012. (Unit: µBq m–3
)

DTU-Nutech-R-0005(EN)
17
0
20
40
60
1980 1985 1990 1995 2000 2005 2010
kB
q 3
H m
-3
Year
DL
Fig. 2.3.1. Tritium in precipitation collected at Risø ( 1 m2 rain collector )
1980 - 2012. (Unit: kBq m–3
; DL = detection limit )
0
40
80
120
1980 1985 1990 1995 2000 2005 2010
kB
q 3
H m
-3
Year
DL
Fig. 2.3.2. Tritium in precipitation collected at Risø ( 10 m2 rain collector )
1980 - 2012. (Unit: kBq m–3
; DL = detection limit )

18 DTU-Nutech-R-0005(EN)
0
20
40
60
1980 1985 1990 1995 2000 2005 2010
Bq
137C
s k
g-1
dry
wei
gh
t
Year
Fig. 3.1. Caesium–137 in sediment samples collected at Bolund in Roskilde Fjord.
1980 – 2012. (Unit: Bq kg–1
dry matter)

DTU-Nutech-R-0005(EN)
19
0
5
10
15
20
25
0
50
100
150
200
250
1980 1985 1990 1995 2000 2005 2010
Sal
init
y i
n o
/oo
Bq 1
37C
s m
-3
Year
Cs-137 Salinity
Fig. 4.1. Caesium–137 in seawater collected in Roskilde Fjord 1980 - 2012.
(Unit: Bq m–3
)
0
40
80
120
1980 1985 1990 1995 2000 2005 2010
kB
q 3
H m
-3
Year
DL
Fig. 4.2. Tritium in seawater collected in Roskilde Fjord 1980 - 2012.
(Unit: kBq m–3
; DL = detection limit )

20 DTU-Nutech-R-0005(EN)
0
100
200
300
400
500
600
700
1994 1998 2002 2006 2010
eqv.
mg
KC
l 1
-1
Year
Fig. 7.1. Total-beta radioactivity in waste water collected at Risø 1994 - 2012.
(Unit: eqv. mg KCl l–1
)

DTU-Nutech-R-0005(EN)
21
Fig. 8.1. Locations (1-6) for TLD measurements around the border of Risø
(cf. Table 8.1).

22 DTU-Nutech-R-0005(EN)
Fig. 8.2. Locations for measurements of background radiation around Risø in Zones
III, IV and V.

DTU-Nutech-R-0005(EN)
23

Center for Nuclear Technologies is Denmark’s national competency center for nuclear technology. With roots in research in the
peaceful use of nuclear power, DTU Nutech works with the applications of ionizing radiation and radioactive substances for the
benefit of society.
DTU
Center for Nuclear Technologies
Technical University of Denmark
Frederiksborgvej 399
PO Box 49
DK-4000 Roskilde
Denmark
Phone +45 4677 4677
Fax +45 4677 5688
www.dtu.dk