radiological survey report for the former … · doe/or/20722-20 uc-70a radiological survey report...
TRANSCRIPT
II l7aa AMY y
~UJs,bp 7
DOE/OR/20722-20 *1
F
F
c
Formerly Utilized Sites Remedial Action Program (FUSRAP) Contract No. DE-AC05-810R20722
RADIOLOGICAL SURVEY REPORT FOR THE FORMER MIDDLESEX
SAMPLING PLANT Middlesex, New Jersey
Bechtel Job 14501 Bechtel National, Inc.
Advanced Technology Division
March 1985
Technical Information Center Office of Scientific and Technical Information
U.S. Department of Energy
---___- __-_ __~__ .-_. ..__ - ~-___

LEGAL NOTICE
This report was prepared as an nccount of work sponsored by the United Static Government. Neither the United States nor the United States Department of Energy, nor any of their cmployaes, nor any of their contracton, subcontractors, or their employees, makes any warranty, crprem or implied, or aemmes any legal liability or responsibility for the accuracy, completeness or usefulness of any information, apparatus, product or process disclosed, or represents that ita use would not infringe privately owned righti.
_

,-
DOE/OR/20722-20 UC-70A
RADIOLOGICAL SURVEY REPORT
FOR THE
FORMER MIDDLESEX SAMPLING PLANT
MARCH 1985
Prepared for
UNITED STATES DEPARTMENT OF ENERGY
OAK RIDGE OPERATIONS OFFICE
Under Contract No. DE-ACOS-810R20722
BY
Bechtel National, Inc.
Advanced Technology Division
Oak Ridge, Tennessee
Bechtel Job No. 14501
.I__ __.__. .-- .--..--__.-.---
ABSTRACT
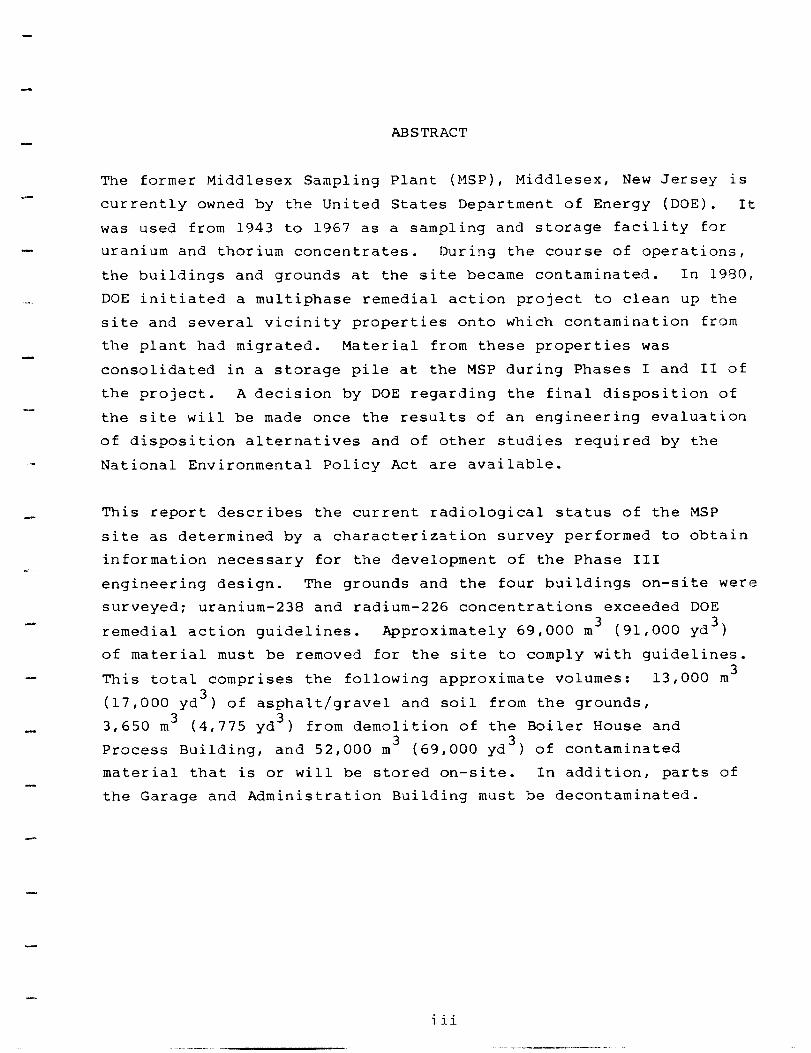
The former Middlesex Sampling Plant (MSP), Middlesex, New Jersey is currently owned by the United States Department of Energy (DOE). It was used from 1943 to 1967 as a sampling and storage facility for uranium and thorium concentrates. During the course of operations, the buildings and grounds at the site became contaminated. In 1980,
DOE initiated a multiphase remedial action project to clean up the site and several vicinity properties onto which contamination from the plant had migrated. Material from these properties was consolidated in a storage pile at the MSP during Phases I and II of the project. A decision by DOE regarding the final disposition of the site will be made once the results of an engineering evaluation of disposition alternatives and of other studies required by the National Environmental Policy Act are available.
This report describes the current radiological status of the MSP site as determined by a characterization survey performed to obtain information necessary for the development of the Phase III engineering design. The grounds and the four buildings on-site were surveyed: uranium-238 and radium-226 concentrations exceeded DOE remedial action guidelines. Approximately 69,000 m3 (91,000 yd3) of material must be removed for the site to comply with guidelines. This total comprises the following approximate volumes: 13,000 m3
(17,000 ydJ) of asphalt/gravel and soil from the grounds, 3,650 m3 (4,775 yd3) from demolition of the Boiler House and Process Building, and 52,000 m3 (69,000 yd3) of contaminated material that is or will be stored on-site. In addition, parts of the Garage and Administration Building must be decontaminated.
iii

TABLE OF CONTENTS
Abbreviations
Page
ix
1.0 Introduction and Summary
1.1 Introduction 1.2 Summary
2.0 Site History and Description
3.0 Survey Procedures
3.1 Field Measurements 3.1.1 Methods of Measurement 3.1.2 Sample Collection and Analysis
3.2 Building Measurements 3.2.1 Interior Measurements 3.2.2 Exterior Measurements
4.0 Survey Results
4.1 Field Measurement Results 4.1.1 Measurements Made to Define the Limits
of Contamination 4.1.2 Measurements Made to Assess Other
Radiological Conditions at the Site 4.2 Building Measurement Results
4.2.1 Process Building 4.2.2 Boiler House 4.2.3 Administration Building 4.2.4 Garage
1
1 3
4
7
7
7 9
11 11 13
14
14
14
15 27 27 36 39 41
V
-. --_-

Page
5.0 Significance of Findings
5.1 Field Survey 5.2 Building Surveys
5.2.1 Process Building 5.2.2 Boiler House 5.2.3 Administration Building 5.2.4 Garage
References
44
44 47 47 48 49 49
50
vi

LIST OF FIGbkES
Fiqure
l-1
2-l
3-1
3-2
4-1
4-2
4-3
4-4
4-5
5-1
5-2
Title Paqe
Location of the Former MS? 2
Aerial View of the Former MSP Site, Looking South
Master Survey Grid for the Former MSP Site
5
8
Borehole Locations at the Former MSP Site 10
Locations of Soil Samples from the Asphalt/ Soil Interface that Exceeaea Uranium-238, Radium-226, and Thorium-232 Guidelines 17
Locations of Soil Samples from Borirlgs that Exceeded Uranium-238, Radium-226, and Thorium-232 Guidelines
Areas of the Former MSP Boiler House Where Readings Exceeded the Limit for Alpha Surface Contamination 37
Areas of the Former MSP AUministration builuing Where Readings Exceeded the Limit for Alpha Surface Contamination 40
Areas of the Former MSP Garage Where Readings Exceeded the Limit for Alpha Surface Contamination 42
Areas of Surface Contamination Based on Near- Surface Gamma Measurements 45
Areas of Subsurface Contamination Baseu on Soil Sample Results and Boring Logs 46
vii
---
LIST OF TAbLES
Table Title Page
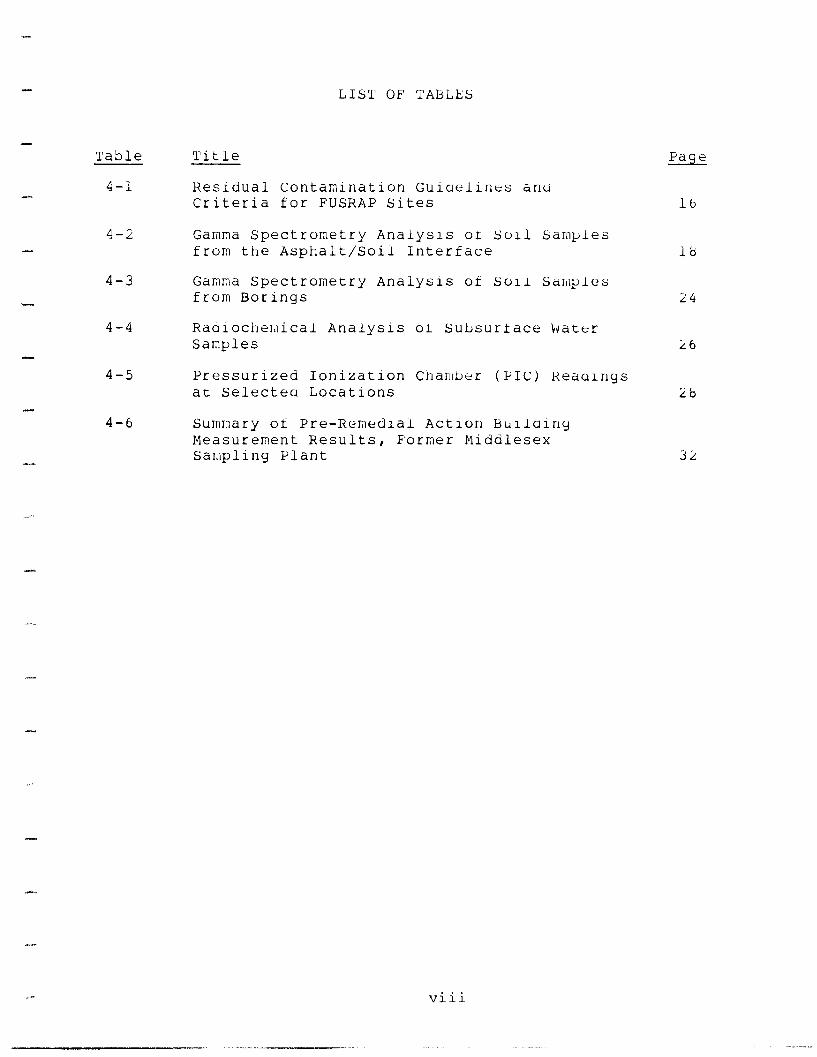
4-l Residual Contamination Guiuelines anti Criteria for FUSRAP Sites lb
4-2 Gamma Spectronetry Analysis ot soil Samples from the Asphalt/Soil Interface lb
4-3 Gamma Spectrometry Analysis ot Soil Samples from Borings 24
4-4 Raaiocilemical Analysis ot Subsurface 'Water Samples 26
4-5 Pressurized Ionization Chamber (PIG) Heaoings at Selectea Locations 2b
*-A
,a/-
“._
-
.u
4-6 Summary of Pre-Remedial Action Builaing Measurement Results, Former Middlesex Sampling Plant
-- _l_l__. _. _.. . I-
32
viii
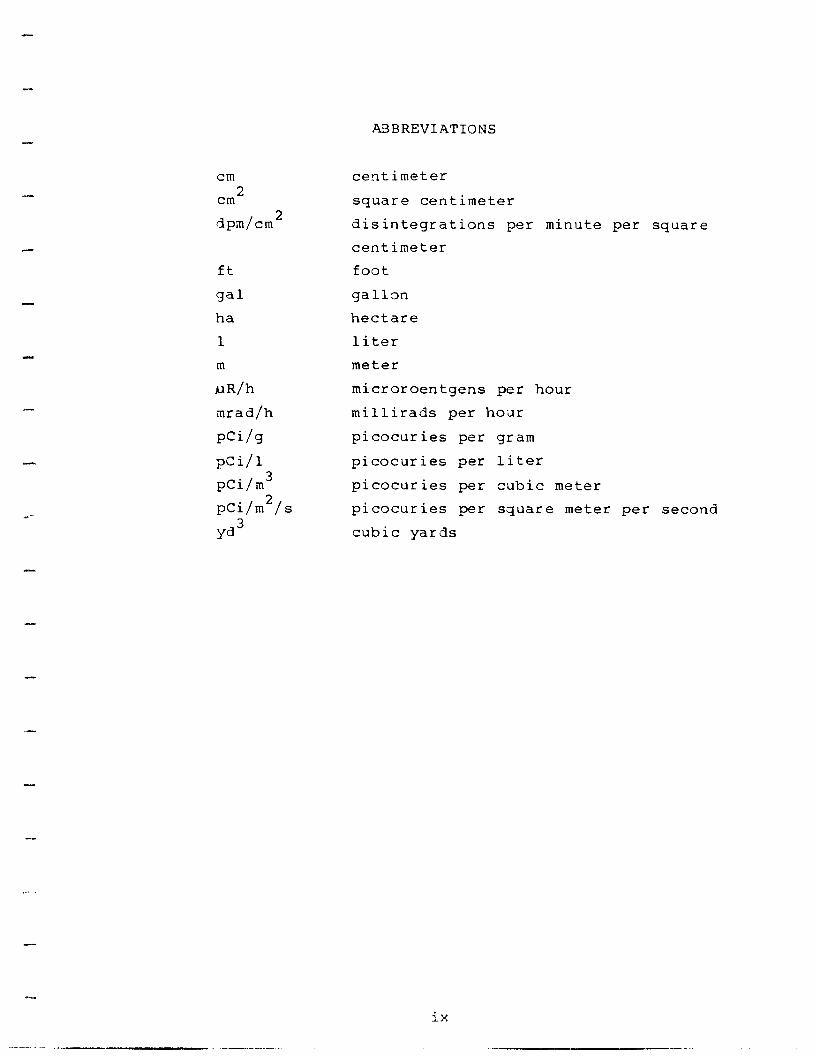
ABBREVIATIONS
cm 2 cm
dpm/cm2
ft
gal ha 1 m
r-IR/h mrad/h
PWg pCi/l pCi/m3 pCi/m2/s
yd3
centimeter square centimeter disintegrations per minute per square centimeter foot gallon hectare liter meter microroentgens per hour millirads per hour picocuries per gram picocuries per liter picocuries per cubic meter picocuries per square meter per second cubic yards
ix

1.0 INTRODUCTION AND SUMMARY
1.1 INTRODUCTION
A radiological characterization of the former Middlesex Sampling Plant (MSP) was performed by Bechtel National, Inc. (BNI) from April through June 1983. This report describes the procedures used in performing the survey, the results of the survey, and their significance.
The site is located in the Borough of Middlesex, Middlesex County, New Jersey as shown in Figure l-l. It was designated for remedial action under the United States (U.S.) Department of Energy (DOE) Formerly Utilized Sites Remedial Action Program (FUSRAP) responsible for the cleanup of low-level radioactive contamination at former Manhattan Engineer District/Atomic Energy Commission (MED/AEC) sites.
The plant is a DOE-owned facility that was used for sampling and storage of uranium and thorium concentrates from 1943 until 1967. It is currently used for the interim storage of low-level radioactive soils and rubble resulting from remedial action on surrounding properties that had become contaminated as a result of MSP operations. DDE initiated this multiphase remedial action project at the MSP and vicinity properties in 1980. During Phases I and II, contaminated material from vicinity properties was consolidated at two storage piles on the MSP site in order to control migration of contaminants until a final disposition for the site is determined. BNI, the Project Management Contractor for FUSRAP, is performing a preliminary engineering evaluation to assess the alternatives of on-site stabilization of the waste or decontamination and decommissioning of the site. The results of this assessment and of others required by the National Environmental Policy Act will provide the basis for a DDE decision regarding the final disposition of the site.
BNI conducted the 1983 radiological characterization to provide the detailed information necessary for the Phase III engineering
1

e”.
. .
*-
.-
lY
Iem
2 /-& / M E W A R K /
f l
0
N
fc
> 1 &q ..5
//’
SOMERSET CWKTY
YIDLESEX
PlSCATA*Lj
\ READING RR
FIGURE l-l LOCATION OF THE FORMER M S P
2
._ -.-
I . .
C
evaluat ion. T h e ma jo r ob ject ives o f th e character izat ion w e r e to d e te r m i n e th e b o u n d a r i e s o f c o n ta m i n a tio n o n th e g r o u n d s a t th e si te a n d th e extent o f c o n ta m i n a tio n in th e fou r bu i ld ings rema in ing
th e r e . A fur ther ob jec t ive w a s to d e te r m i n e th e feasibi l i ty o f d e c o n ta m i n a tin g th e s e structures.
1 .2 S U M M A R Y
T h e survey charac ter ized th e b o u n d a r i e s a n d extent o f c o n ta m i n a tio n a t th e fo rmer M S P property . It i nc luded b o th hor izonta l a n d vert ical character izat ion o f th e g r o u n d s . A s i l lustrated in s u b s e q u e n t figures , a reas o f sur face a n d subsur face c o n ta m i n a tio n a re n o t i d e n tical, ind icat ing th a t th e aspha l t wi th wh ich m u c h o f th e si te h a s b e e n p a v e d h a s b e e n c o n ta m i n a te d .
T h e survey a lso d e te r m i n e d th e extent o f c o n ta m i n a tio n in th e fou r bu i ld ings on-si te. S u r fa c e m e a s u r e m e n ts ind ica ted ex tens ive f ixed a l p h a c o n ta m i n a tio n in th e P rocess Bu i ld ing a n d th e Bo i le r H o u s e . A s d iscussed in S e c tio n 5 .0 , p re l im inary a s s e s s m e n t ind icates th a t it wi l l b e necessary to demo l i sh a n d r e m o v e th e s e structures fo r th e si te to comp ly wi th remed ia l ac t ion gu ide l ines .
S u r fa c e m e a s u r e m e n ts o b ta i n e d in th e G a r a g e a n d th e A d m inistrat ion
Bu i ld ing i d e n tifie d severa l a reas in e a c h bu i ld ing w h e r e c o n ta m i n a tio n exceeds gu ide l ines ( A l p h a sur face lim it o f 2 0 0 d p m /lO O
2 a n d b e ta - g a m m a d o s e rates o f 1 .0 m rad/h in a n y loo -cm 2 c m or 0 .2 0 m rad/h a v e r a g e d over a n y a r e a n o t e x c e e d i n g 1 m 2 ) . It wi l l b e necessary to d e c o n ta m i n a te th e s e areas.
A n es t imated 6 9 ,0 0 0 m 3 (91 ,000 yd3) o f m a ter ia l m u s t b e r e m o v e d fo r th e si te to m e e t remed ia l ac t ion gu ide l ines . Th is to ta l compr ises th e fo l low ing a p p r o x i m a te vo lumes: 1 3 ,0 0 0 m 3 (17 ,000 yd3) o f asphal t /grave l a n d soi l f rom th e g r o u n d s ; 3 ,4 0 0 m 3 (4 ,500 yd3) a n d 2 1 0 m 3 ( 2 7 5 yd3) f rom demol i t ion o f th e P rocess Bu i ld ing a n d Bo i le r H o u s e , respect ively: 2 7 ,5 0 0 m 3 (36 ,000 yd3) f rom th e s to rage pi les: a n d a p p r o x i m a te ly 2 5 ,0 0 0 m 3 (33 ,000 yd3) o f c o n ta m i n a te d m a ter ia l to b e t ransferred to th e si te f rom th e M idd lesex Mun ic ipa l L a n d fill.
3
- -___. - _ - -- .~

2.0 SITE HISTORY AND DESCRIPTION
,-
-
.-
.-
_-
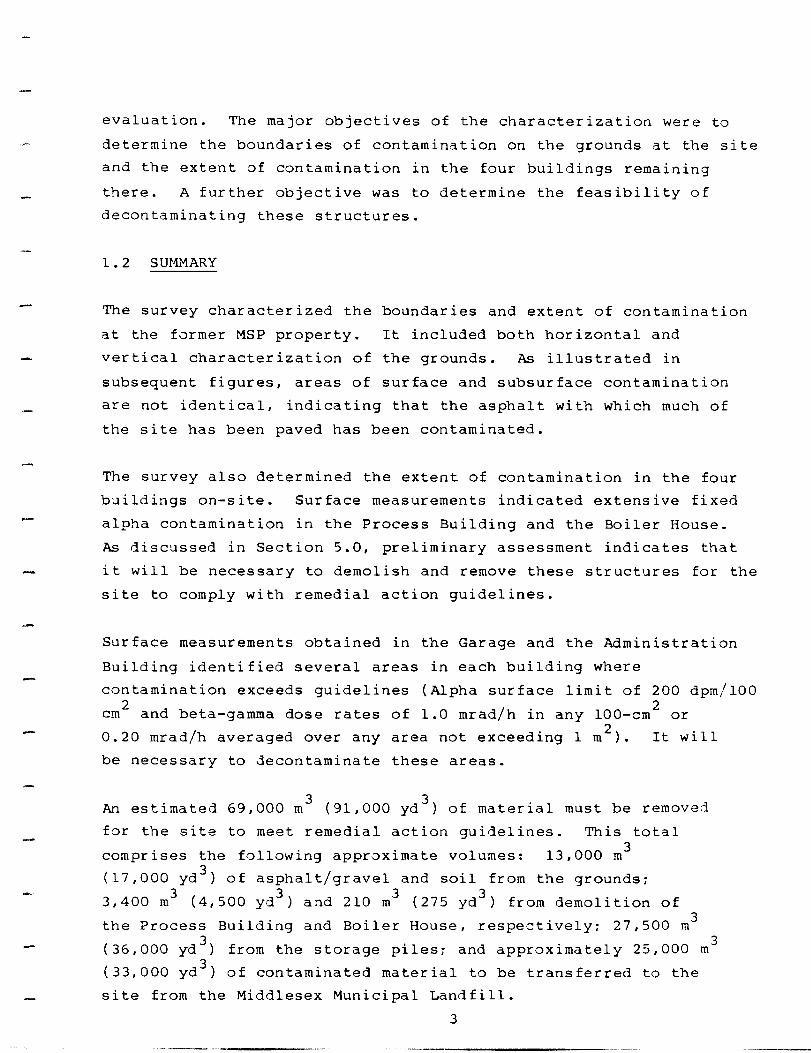
The MSP site is a 3.9-ha (9.Gacre) tract of land with improvements located in the Borough of Illiddlesex, Middlesex County, New Jersey. Figure 2-l is an aerial view of the site. From 1943 to 1954, the
MSP facility was used to receive and assay uranium ores - primarily "pitchblende", an ore containing high concentrations of
uranium and radium. During this period, the buildings and grounds became extensively contaminated due to the manner in which the uranium ore was handled (Ref. 1). The material was reportedly received in burlap bags that were stacked on the bare ground. Some breakage of the bags occurred, ore concentrates spilled out, and subsequent rains led to runoff and leaching of contamination into the soil.
During uranium ore sampling and assay operations, a concrete floor was poured in the Process Building and an asphalt pad, ranging in thickness from 6 in. to 24 in., was placed over the grounds. Little effort was made to remove contaminated soil before concrete or asphalt was laid. However, a limited amount was removed and taken to the Middlesex Municipal Landfill (shown in Figure l-1).
Uranium ores were assayed and stored at the MSP until 1954 when the new Feed Materials Processing Center at Fernald, Ohio, was completed and took over the operation. Shortly thereafter, the AEC began purchasing large amounts of thorium, most of which was received and sampled at the Middlesex facility. Due to changes in programs, the
anticipated uses for the thorium did not develop and the AEC was left with a large stockpile (Ref. 21, which it decided to keep at the plant.
Approximately 11,000,000 kg (5,000,OOO lb) of oxide, nitrate, concentrates, sludge, and sand were stored at the site. The thorium content ranged from about 3 percent in the sand to about 55 percent in the oxide (Ref. 3). The material was stored in the Process
4
.-
,,.A.
,I
,-
a.“-
FIGURE 2-l AERIAL V IEW OF THE FORMER M S P SITE, LOOKING SOUTH
-
5

.1
.-
Bu i ld ing a n d a q u o n s e t h u t loca ted n e a r th e e a s te rn b o u n d a r y o f th e site. It w a s s tored in steel, fiber , a n d p l y w o o d d r u m s o f 76 - to 208- l i ter (20- to 55-ga l ) capaci ty . S o m e o f th e d r u m s w e r e m o v e d o u ts ide a n d later d e ter iora ted o n th e aspha l t p a d , the i r c o n te n ts w e a t'ne r ing wi thout c o n ta i n m e n t.
U s e o f th o r i u m f rom th e M idd lesex inventory r e s u m e d in S e p te m b e r 1 9 6 4 ; in January 1 9 6 6 a dec is ion w a s m a d e to r e m o v e al l th o r i u m f rom M iddlesex. Th is w a s c o m p l e te d in , June o f th a t year (Ref. 4).
In Apr i l 1 9 6 5 h e a l th phys ics pe rsonne l f rom D O E ( then A E C ) O a k R i d g e O p e r a tio n s O ffice m a d e s o m e pre l im inary rad io log ica l m e a s u r e m e n ts to d e te r m i n e th e rad io log ica l cond i t ion o f th e site. U r a n i u m a n d th o r i u m c o n ta m i n a tio n w a s fo u n d o n th e g r o u n d s , in th e bu i ld ings, a n d o n e q u i p m e n t. C l e a n u p o p e r a tio n s b e g a n in 1 9 6 6 wi th th e remova l o f m o s t o f th e e q u i p m e n t a n d ini t ial d e c o n ta m i n a tio n a n d restorat ion o f th e bu i ld ings. T h e s e o p e r a tio n s w e r e c o m p l e te d in 1 9 6 7 (Refs. 4 , 5 , a n d 6) a n d th e si te w a s cert i f ied by th e A E C for unrestr ic ted re lease b a s e d o n ex is t ing gu ide l ines .
I--
In 1 9 6 8 th e A E C o fficially repor ted th e M S P as excess property : th e G e n e r a l Serv ices A d m inistrat ion t ransferred it to th e D e p a r tm e n t o f th e Navy U .S . M a r i n e Corps, wh ich u s e d it fo r reserve t ra in ing u n til M a r c h 1 9 7 9 .
e -
In 1 9 7 6 th e fo rmer M S P proper ty w a s d e s i g n a te d a F U S R A P site a n d w a s resurveyed to d e te r m i n e w h e the r or n o t a d d i tio n a l remed ia l ac t ion w a s requ i red (Ref. 7). A ll pr ivate a n d mun ic ipa l proper ty in th e i m m e d i a te vicini ty w a s d e c o n ta m i n a te d a n d backf i l led in 1 9 8 0 a n d 1 9 8 1 dur ing P h a s e s I a n d II o f th e M idd lesex remed ia l ac t ion p r o g r a m . Res idues a n d rubb le w e r e p laced in a n in ter im s torage p i le n e a r th e s o u th w e s t corner o f th e si te (Ref. 8). A smal le r s to rage p i le o f o rgan ic a s h e s f rom P h a s e II inc inera t ion o p e r a tio n s w a s c rea ted a d j a c e n t to th e m a i n pi le.
6

3.0 SURVEY PROCEDURES
L
*-
.-
a--
3.1 FIELD MEASUREMENTS
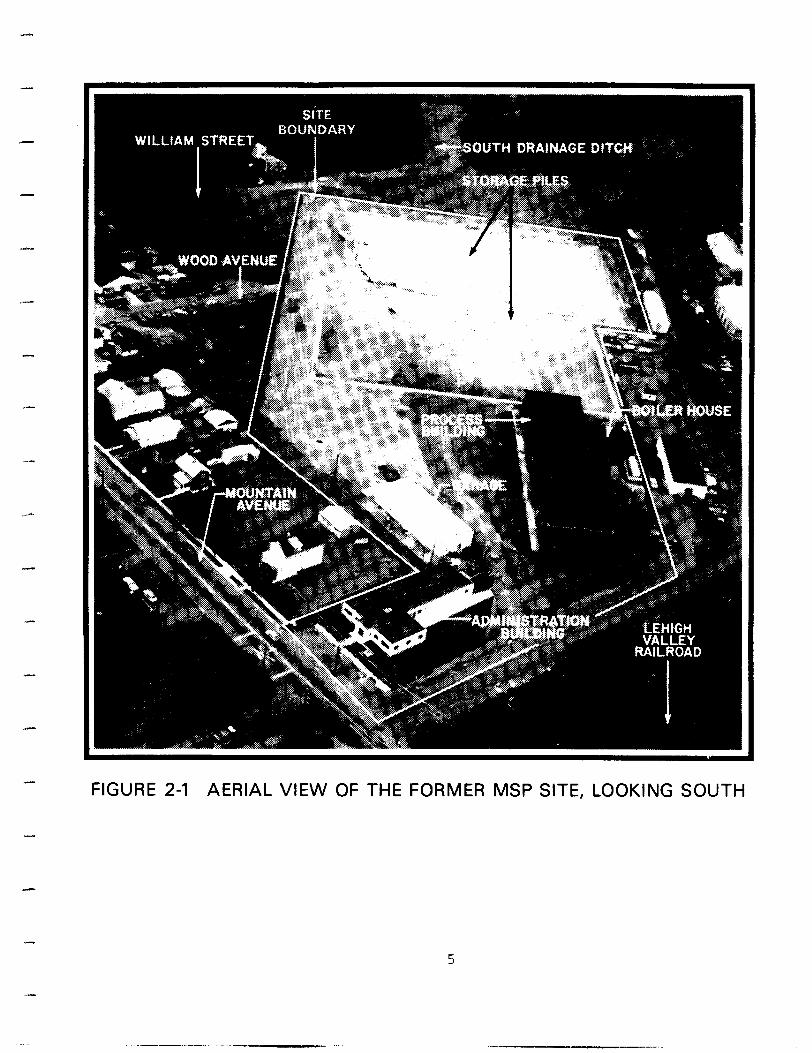
The current radiological field survey was conducted in accordance with the FUSRAP Radiological Protection Program (Ref. 9), Project Instruction 20.01, Revision 1 and used an extension of the same grid as that used during Phase II. The grid consisted of mutually perpendicular lines spaced 10 m (33 ft) apart as shown in Figure 3-l. In areas of elevated readings, a smaller grid of 2.5 m x 2.5 m (8.2 ft x 8.2 ft) was established by the field survey crew to obtain closely spaced measurements for better definition of the contamination boundaries.
3.1.1 Methods of Measurement
Beta-gamma measurements were made on the ground surface at 2.5-m (8.2-ft) intervals within the grid blocks. The measurements were made using a pancake [Geiger-Mueller (G-M)] geometry probe coupled to a digital ratemeter/scaler [Eberline Instrument Corporation (EIC) models HP-210 and PRS-1, respectively].
Near-surface gamma radiation measurements were made 30 cm (12 in.) above the ground surface at 2.5-m (8.2-ft) intervals within the grid using a 5 cm x 5 cm (2 in. x 2 in.) sodium-iodide (NaI) detector. This detector (EIC model SPA-3) was mounted in a probe assembly surrounded by a conical lead shield to reduce the gamma intensity through the sides, thus producing a downward directional response. The near-surface gamma readings provide a reliable estimate of the concentrations of radium-226 in surface soil.
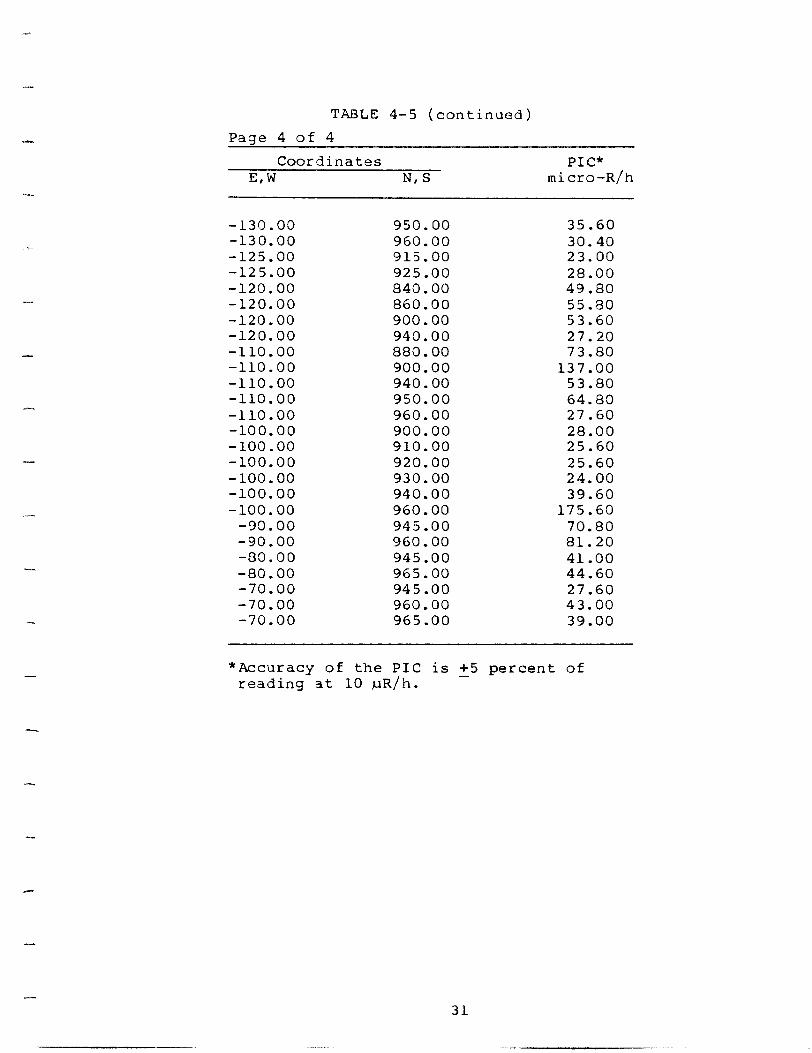
Gamma exposure rates at 1 m (3 ft) above the ground were measured using a pressurized ionization chamber (PIC) with a response to gamma radiation that is proportional to exposure in roentgens. Readings were made at 5-m (16-ft) intervals above all open area surfaces where the residue piles did not invalidate the measurements.
rs..
. .
7
c 8 $ v 9 E e* 2 +?
>> 1 j I .--c
4 ms. BOROUG~,,OF MIDDLESEX ,,, --..m,w.mv..v
. . . TOWN OF PISCATAWAY IlL-NAY 5.r)EF’
FIGURE 3-l MASTER SURVEY GRID FOR THE FORMER MSP SITE
8
---.-.

.-
*-
.-
.-
*-
.-
-
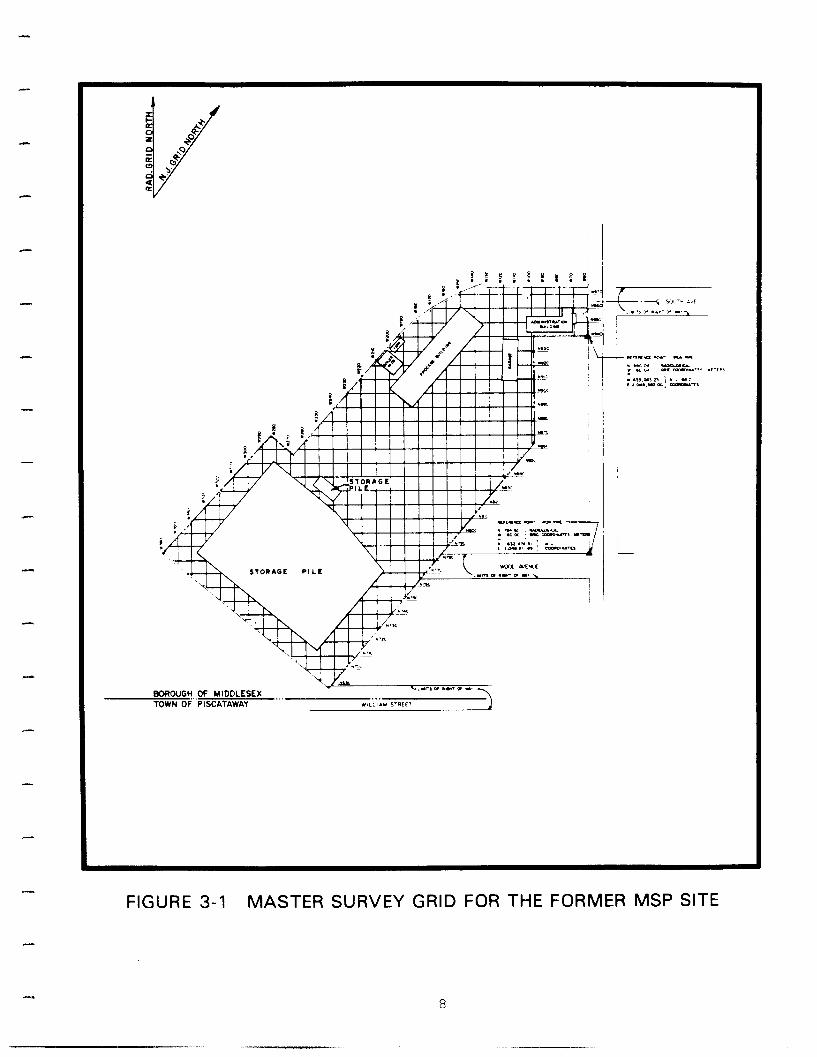
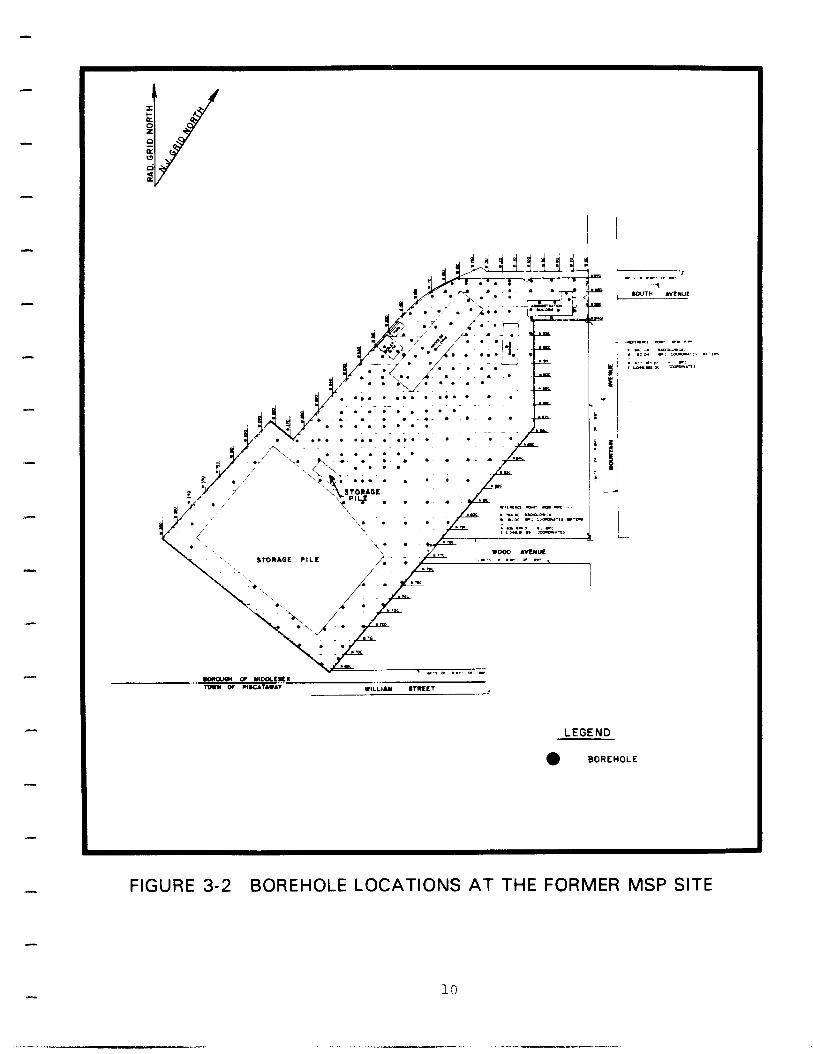
Boreholes were drilled over the entire site on a 15-m (50-ft) grid as shown in Figure 3-2. On-site areas excluded from drilling were t'nose ilnder the two residue storage piles located on the southern portion of the asphalt storage pad and a 0.6-m (2-ft) strip along the inside of the perimeter fence that had been excavated during Phase II. The boreholes were drilled to the soil-shale interface, and temporarily cased with a PVC tube for gamma logging. Gamma logs
or profiles of boreholes were measured using a SPA-3 detector. By calibrating these measurements with the results from laboratory analysis of soil samples, borehole logs can provide a reliable estimate of radium-226 concentration in subsurface soil.
3.1.2 Sample Collection and Analysis
In this report, all soil samples (except for those around the Administration Building) will be considered subsurface samples in view of the thickness of asphalt covering the site. The corresponding guidelines will apply.
Soil samples were collected with Shelby tube samplers at the asphalt/soil interface of each borehole (Figure 3-2). Core samples were removed in approximately lo-cm (4-in.) increments. Each sample was placed in a 0.5-liter (O.l-gal) plastic container, capped, and labelled. The majority of soil samples were analyzed on-site for uranium-238, radium-226, and thorium-232 in the EIC mobile laboratory (in situ van). The samples were counted for 10 minutes by gamma spectroscopy using an intrinsic germanium detector housed in a lead counting cave lined with cadmium and copper.
Subsurface water samples were collected and analyzed for uranium-238 and radium-226. The samples were shipped to the EIC laboratory in Albuquerque, New Mexico for analysis by standard radiochemical techniques.
9
-
I i d 4 i-$LLLl-ti I . ,r , . l . ’
> lie
. l ,’ . l /
.I .
pi *
.
CI
d J&y-. i- .;..;e.y.-:- y ‘- .f _*_ d %
~.-‘~.-r_*Iw.rn.~r._.. r . * I . . . .
Id/f r*;: E i ;
4 -i+-3---~---~ 4 . . . 1 ;i:
-=y y-
.;‘i:.:4> ,I: +%iis;$
i !! 3y”iii
=:i;; -.,‘. . *..I< :;;.: *r-y. L, ..*=‘.. .-em
. . . . r . . . . , . . . z.sL ji
STclR.BL PILL STclR.BL PILL
. , , -* C T YIDOLL~I . , , -* C T YIDOLL~I
m w OF PtscA~A~A” m w OF PtscA~A~A”
w-5 m .e. JI . . . 1
uuw WENUt
i ~rnl_ - - .T “n-v
( : %Z -: --I.
$ i i&Z-, -c;T,
gi
LEGEND
0 BOREHOLE
.r.e.s
FIGURE 3-2 BOREHOLE LOCATIONS AT THE FORMER MSP SITE
13

3.2 BUILDING MEASUREMENTS
.-
Indoor measurements were also made in accordance with the FUSRAP Radiological Protection Program (Ref. 9). The building survey followed a 2 m x 2 m (6.5 ft x 6.5 ft) grid established on the
walls, floors, and roofs of the four structures remaining on the site: the,Process Building, Boiler House, Administration Building,
and Garage. Their locations are shown in Figure 2-l.
Each building was monitored through a series of measurements appropriate to its functions and documented historical contaminati.on levels. The monitoring program comprised, in varying degrees, a radiological survey of each structure including the walls, floors, ceilings, ventilation systems, drain systems, roofs, and subsurface materials.
3.2.1 Interior Measurements
The floors of each building were monitored for alpha and beta-gamma radiation on the 2-m (6.5-ft) grid. A total of five alpha surface measurements were made in each grid segment using a 5%cm 2
(g-in. 2, zinc sulfide scintillation probe (EIC model AC-3) coupled with a PRS-1 detector. Beta-gamma and gamma measurements were made in the same grid section locations as the alpha measurements. Beta-gamma measurements were made using a thin-window G-M detector (EIC Model HP-210). The detectors were in contact with the floor surfaces during one-half-minute counts. Measurements for alpha and beta-gamma were also made at the floor/wall intersections in each building. The number of readings obtained varied in each building depending on its historical data and size.
Gamma measurements were made using an NaI detector (EIC Model SPA-31 supported 30 cm (12 in.) above the surface of the floor in a cone shield. The detector was used in an unshielded configuration to measure gamma radiation levels at 1 m (3 ft) above surfaces and in other locations such as drains and sumps.
11
.-
,-
Alpha and beta-gamma radiation measurements were taken on most interior lower wall surfaces of the four buildings. Only original interior wall surfaces were surveyed: interior partitions were not included. Wall measurements were obtained in the same manner as measurements taken on fl.oors. In this report, the lower walls are considered to be from the floor to 2 m (6.5 ft) above the floor, t1 area with which human contact is considered most likely to occur. Interior wall readings were also taken from the second story walls in the Process Building.
le
Horizontal surfaces such as window sills were scanned for alpha and beta-gamma radiation.
Ceilings were monitored on a 4-m (13-ft) grid in the same manner as floors. Specific measurement points were selected on both vertical
and horizontal surfaces such as beams, pipes, and ledges.
Following a review of the directly measured alpha and beta-gamma radiation levels from building surfaces, standard paper smears were used to determine whether or not surface contamination was removable. Smear samples were collected only from surfaces where surface radiation levels exceeded DOE criteria. Approximately 175 samples were collected on interior building and equipment surfaces.
During the survey, one particulate air sampler (EIC model RAS-1) was deployed in each of the four buildings. Samples were collected in accordance with the FUSRAP Radiological Protection Program (Ref. 9) when work was being performed inside the buildings. The filters were sent to the EIC laboratory in Albuquerque, New Mexico for gross alpha analysis.
During work activities radon samples were also collected daily using gas bag containers and pulse pumps. Integrated samples, collected over 3-hour periods, were taken twice daily. These samples were collected per the FUSRAP Radiological Protection Program (Ref. 9) and were counted on-site in the in situ van, using a SAC-R5 alpha counter.
12 -- . . ^-- __._ . ..__---.
/ I
.-
.ex
.-
R a d o n flux m e a s u r e m e n ts w e r e m a d e o n th e inter ior wal ls a n d floors o f th e fou r bu i ld ings in acco rdance wi th p rocedures o u t l ined in th e P rocedures M a n u a l fo r th e O R N L R e m e d i a l A c tio n Survey a n d Cert i f icat ion A c tivit ies ( R A S C A ) P r o g r a m (Ref. 10) . A c t ivated charcoa l canis ters w e r e d e p l o y e d fo r a pe r iod o f 4 8 hours . T h e E n v i r o n m e n ta l M o n i to r ing L a b o r a tory in N e w York City w a s u s e d to act ivate th e charcoa l a n d c o u n t th e canis ters a fte r th e y w e r e retr ieved.
F i f teen-cent imeter-d iameter (6- in. - d i a m e ter) bo reho les w e r e dr i l led th r o u g h th e concre te floo rs o f e a c h bu i ld ing to th e so i l /shale interface. B o r e h o l e locat ions w e r e b a s e d o n rev iews o f sur face m o n i to r ing d a ta . T h e s e ho les w e r e temporar i l y c a s e d wi th P V C tu b i n g fo r th e p u r p o s e o f g a m m a logg ing . G a m m a prof i les w e r e m e a s u r e d us ing a S P A -3 d e tector. S a m p l e s w e r e ta k e n f rom th e s e ho les us ing th e s a m e te c h n i q u e as desc r ibed in S u b s e c tio n 3 .1 .2 .
G a m m a prof i le m e a s u r e m e n ts w e r e no rma l i zed to th e soi l s a m p l e resul ts f rom labora tory ana lys is to p rov ide re l iab le est imates o f r a d i u m - 2 2 6 c o n c e n trat ions in th e soi ls b e l o w th e fou r bu i ld ings.
3 .2 .2 E x ter ior M e a s u r e m e n ts
Bu i ld ing exter iors w e r e m o n i to r e d in th e s a m e m a n n e r as th e inter iors. T h e concre te dock a n d roof a l o n g th e e a s t s ide o f th e P rocess Bu i ld ing w e r e m o n i to r e d in th e s a m e m a n n e r as th e floors. T h e ins ide sur face o f th e roof p a r a p e t a n d its ceramic to p w e r e m o n i to r e d a t 2 .5 - m (8.2-ft) intervals.
A p p r o x i m a te ly 1 6 0 s m e a r samp les w e r e co l lec ted f rom exter ior bu i ld ing sur faces w h e r e sur face rad ia t ion leve ls e x c e e d e d D O E cri teria.
.- 1 3

4.0 SURVEY RESULTS
4.1 FIELD MEASUREMENT RESULTS
In this report, all direct field survey measurements and laboratory results represent gross readings: background measurements and concentrations were not subtracted. Background levels applicable to Middlesex have been previously measured. New Jersey statewide background soil concentrations in pCi/g have been measured as 0.86 for radium-226, 0.89 for thorium-232, and 0.87 for uranium-238. Average background for the external gamma exposure rate is 6.1 uF'./h
(Ref. 11).
4.1.1 Measurements Made to Define the Limits of Contamination
Both beta-gamma dose rate measurements made at the ground surface and near-surface gamma radiation measurements were used to define the area1 extent of contamination. Beta-gamma dose rate measurements ranged from less than 0.01 to 7.25 mrad/h. DOE criteria for release of property for unrestricted use state that beta-gamma dose rates at 1 cm from the surface shall not exceed an average of 0.2 mrad/h over a l-m 2 area or a maximum of 1.0 mrad/h in an area no greater than 100 cm 2 (Ref. 13).
Elevated near-surface gamma-radiation measurement readings are considered to be those that are equal to or greater than twice background. These readings would, under normal circumstances, be correlated with soil sample analysis to establish a calibration factor relating the detector's response in counts per minute (cpm) to the specific radionuclide concentration in pCi/g. Because the MSP site grounds are covered with varying thicknesses of asphalt, a correlation factor could not be determined. However, high gamma readings did generally relate to elevated concentrations of radionuclides in the soil. Results were determined for uranium-238, radium-226, and thorium-232. The maximum concentration for uranium-238 was 961 pCi/g; the DOE remedial action guideline for
- - I_
14
_.- ..__. ._ __-.

uranium-238 is 150 pCi/g above background. The maximum radium-226 concentration was 736 pCi/g compared with the DOE limit of 15 pCi/g above background for subsurface soil. The maximum thorium-232
concentration was 19.3 pCi/g compared with the DOE limit of 15 pCi/g above background for subsurface soil. These guidelines are presented in Table 4-l. The lateral excavation limits are based on gamma readings, which supply reasonable guidance for the removal of soil containing radionuclide concentrations in excess of guidelines. Locations at which readings above guidelines were observed in samples from the asphalt/soil interface are shown in Figure 4-l; results are listed in Table 4-2.
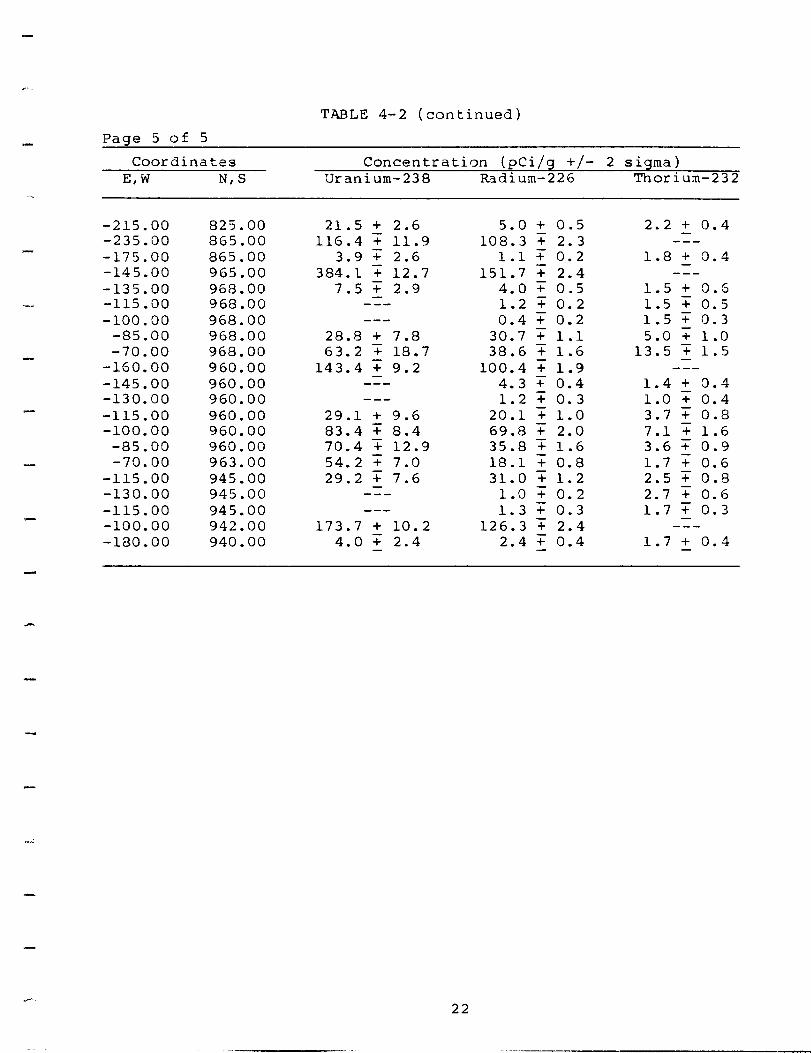
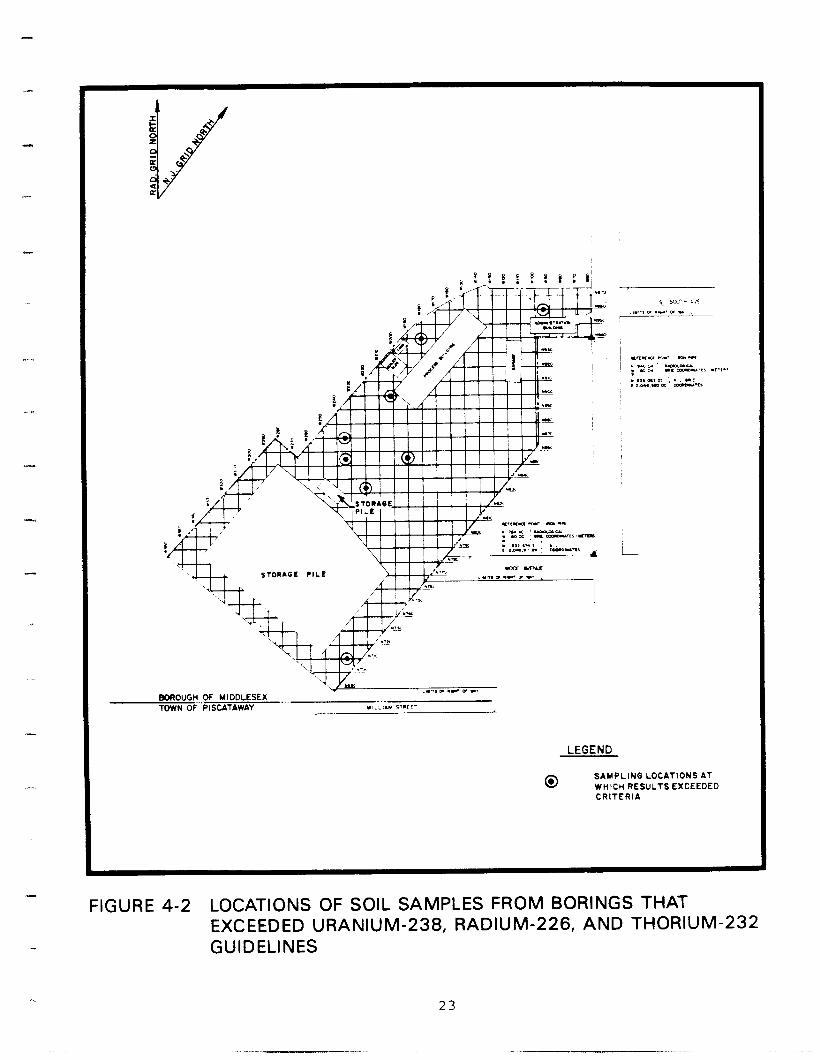
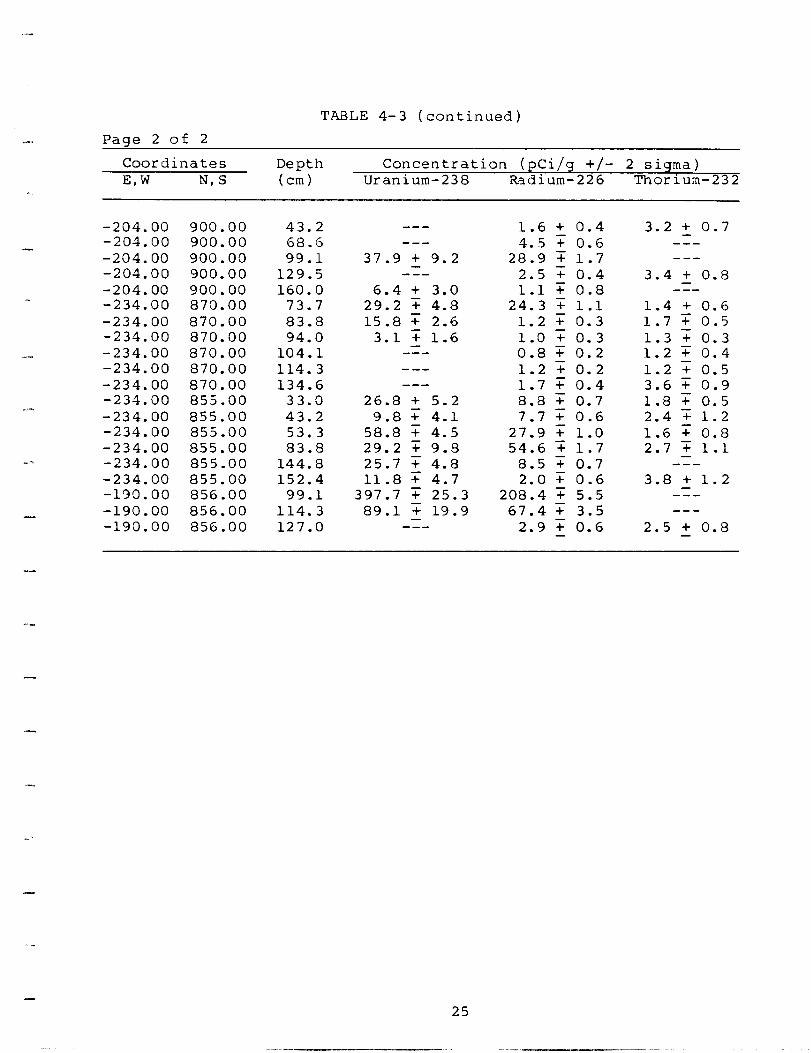
The major contaminants in soil samples taken from borings were uranium-238 and radium-226. The maximum uranium-238 concentration was 398 pCi/g; the maximum radium-226 concentration was 208 pCi/g. Locations at which readings above guidelines were observed in samples from borings are shown in Figure 4-2. Correlations betweer concentrations of radionuclides in soil samples given in Table 4-3 and borehole gamma count rates were used to determine the depth of contamination.
4.1.2 Measurements Made to Assess Other Radiological Conditions at the Site
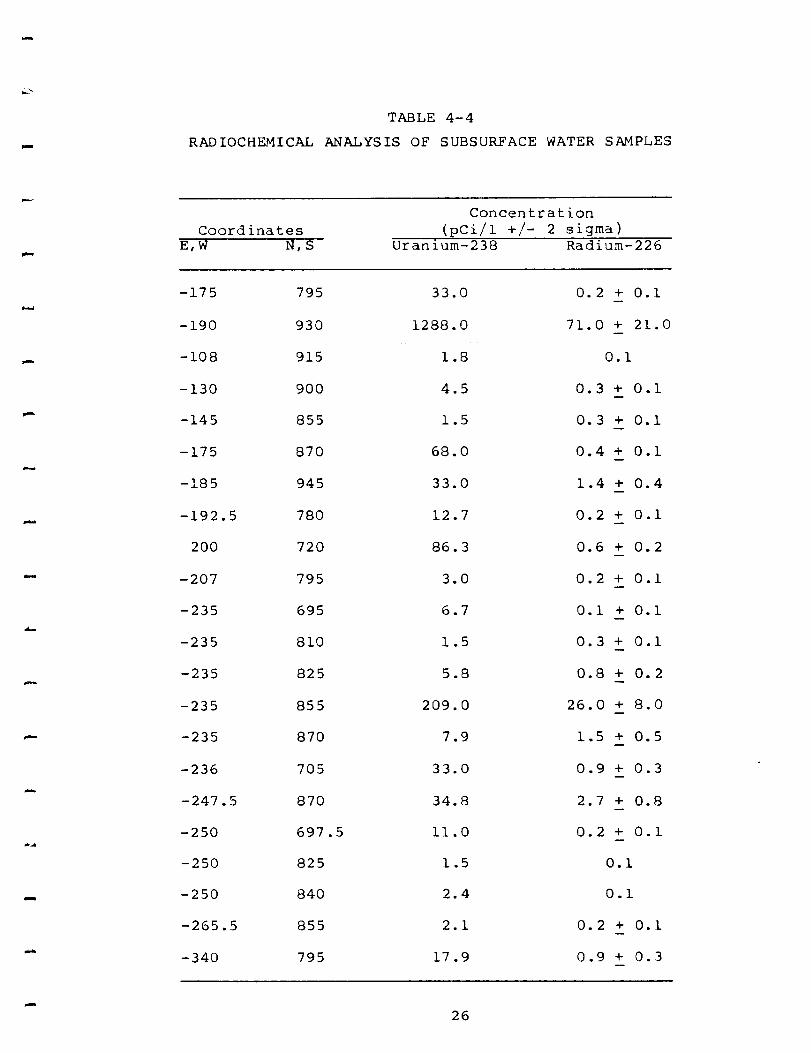
Samples were taken of water that was present in several of the borings. These samples were analyzed for uranium and radium at the EIC Laboratory in Albuquerque, New Mexico. The uranium-238 concentration ranged from 1.5 to 1,288 pCi/l; the radium-226 concentration ranged from less than 0.1 to 71.0 pCi/l. The DOE msximum permissible concentrations in water for release to uncontrolled areas are 600 pCi/l for uranium-238 and 30 pCi/l for radium-226 (Ref. 12). Water sample results are listed in Table 4-4.
Gamma exposure rates were measured using a PIC at 1 m above the ground. The exposure rates ranged from 16 to 371 pR/h. As noted earlier, the natural background gamma exposure rate was measured as
15 --- --
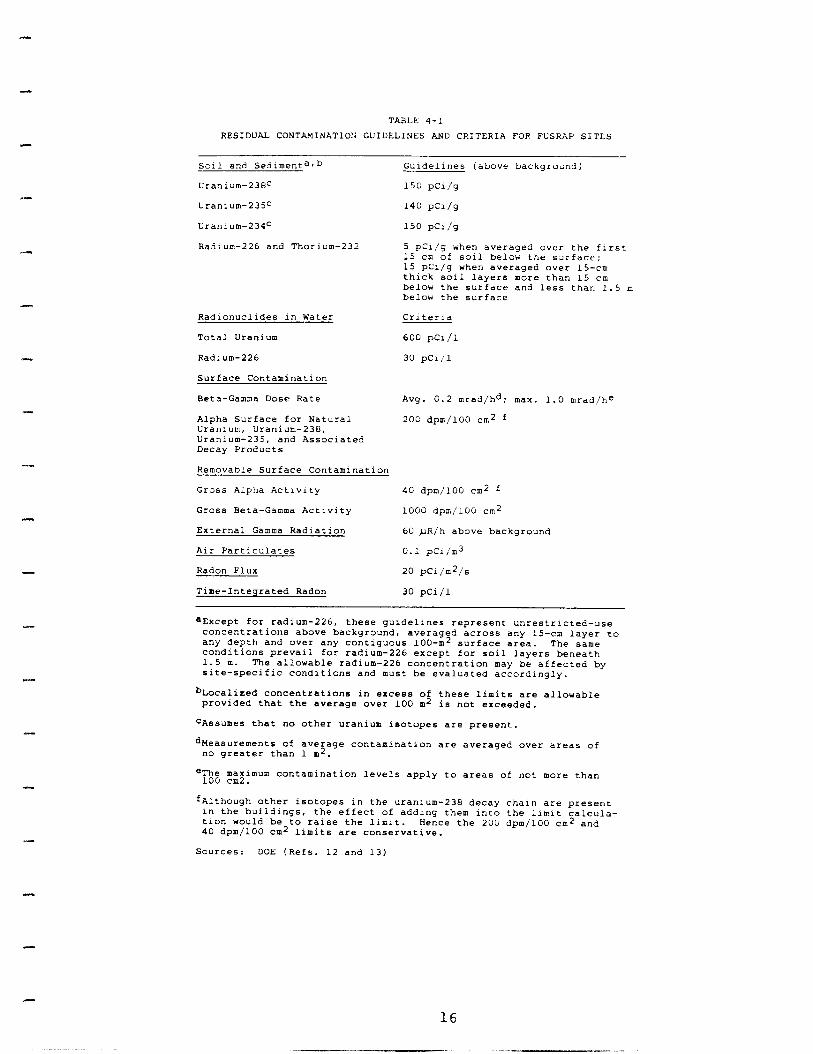
TABLE 4-1 RESIDUAL CONTAMINATIOli GUIDELINES AND CRITERIA FOR FUSRAP SITES
I-
,-
sz11 and Sedimentarb Guidelines (above background)
Uranium-238c 150 pCi/g
Uranium-23Sc 140 pCi/g
Uranium-234c 150 pc1/g
Radium-226 and Thorium-232 5 pCi/g when averaged over the first 15 cm of soil below the surface; 15 pCi/g when averaged over 15-cm thick soil layers more than 15 cm below the surface and less than 1.5 m below the surface
Radionuclides in Water
Total Uranium
Radium-226
Surface Contamination
Beta-Gamma Dose Rate
Alpha Surface for Natural Uran1un, Uranium-238, Uranium-235, and Associated Decay Products
Criteria
600 pCi/l
30 pc1/1
Avg. 0.2 mrad/hd: max. 1.0 mradjhe
200 dpm/lOO cm2 f
Removable Surface Contamination
Gross Alpha Activity 40 dpm/lOO cm2 f
Gross Beta-Gamma Activity 1000 dpm/lOO cm 2
External Gamma Radiation 60 pR/h above background
Air Particulates 0.1 pCi/m3
Radon Flux 20 pCi/m2/s
Time-Integrated Radon 30 pCi/l
aExcept for radium-226, these guidelines represent unrestricted-use concentrations above background, averaged across any 15-cm layer to any depth and over any contiguous 100-m2 surface area. The same conditions prevail for radium-226 except for soil layers beneath 1.5 m. The allowable radium-226 concentration may be affected by site-specific conditions and must be evaluated accordingly.
bbocalized concentrations in excess of these limits are allowable provided that the average over 100 m2 is not exceeded.
=Assumes that no other uranium isotopes are present.
dbteasurements of average contamination are averaged over areas of no greater than 1 m2.
"Foe, rnnqimum contamination levels apply to areas of not more than
fAlthough other isotopes in the uranium-238 decay chain are present in the buildings, the effect of adding them into the limit calcula- tion would be to raise the limit. 40 dpm/lOO cm2
Hence the 200 dpm/lOO cm2 and limits are conservative.
sources: DOE (Refs. 12 and 13)
16

. i l
A& /’
s ,I’ /
i .
i Lx,-- :.I _I” .I n .A-. ‘, Y.
1
“l”cl v ,u .,I .UP’ -u : L u mc cnmo-“.II “E-I.? . ,11.m, n ; . “: ,*Du.~cc -v3
.I II 1 I I I I If ..2, STORAGE I PILE I 11)‘ .w
I I I I I/ l,Uraac mm.*
STORAGE PILE
BOROUGb4~OF MIDDLESEX ,,, . . . TOWN OF PISCATAWAY WIL.i.Y *‘WI’
LEGEND
a SAMPLING LOCATIONS Al WHICH RESULTS EXCEEDED CRITERIA
FIGURE 4-l LOCATIONS OF SOIL SAMPLES FROM THE ASPHALT/SOIL INTERFACE THAT EXCEEDED URANIUM-238, RADIUM-226, AND THORIUM-232 GUIDELINES
17

-
r-
TABLE 4-2 GAM%lA SPECTROMETRY ANALYSIS OF SOIL SAMPLES FROM THE
ASPHALT/SOIL INTERFACE Page 1 of 5
Coordinates Concentration (pCi/g +/- 2 sigma) E,W N, S Uranium -238 Radium-226 Thorium -232
-85.00 945.00 -GS.OO 945 .oo
-190.00 930.00 -130.00 930.00 -108.00 930.00 -205.00 915 .oo -190.00 915.00 -160.00 915.00 -145.00 915.00 -130.00 915.00 -108.00 915.00 -220.00 900.00 -205.00 890.00 -160.00 900.00 -150.00 900.00 -115.00 900.00 -235.00 885.00 -220.00 885.00 -205.00 885.00 -190.00 890.00 -175.00 885.00 -160.00 885.00 -145.00 885.00 -130.00 885.00 -115.00 885.00 -247.50 870.00 -235.00 870.00 -220.00 870.00 -205.00 870.00 -191).00 870.00 -175.00 870.00 -162.50 870.00 -145.00 870.00 -130.00 870.00 -115.00 870.00 -283.00 850.00 -262.50 855.00 -253.00 845.00 -220.00 855.00 -205.00 855.00 -190.00 855.00 -177.50 855.00 -160.00 855.00 -145.00 855.00
---
D-w
56.6 + 5.3 - --- ---
12.9 + 2.6 15.2 ‘7 3.2 - m m -
0.4 + 0.9 7.3 + 2.4 - --- 6.7 + 1.7
10.7 T 2.7 1.3 + 2.7 5.8 + 2.2 3.8 z 1.8
--- 1.5 + 1.6 4.2 7 1.8 8.8 T 4.6
98.7 T 8.0 91.5 'T 5.6
2.3 7 1.4 - m m - 3.5 + 1.3 1.7 T 0.2
419.6 ? 16.5 - --- 1.2 + 2.5 0.9 T 0.2 6.3 + 0.3 2.6 7 2.3 9.9 T 0.5
12.1 T 2.0 - --- 8.2 + 2.0 1.3 T 1.1
35.8 + 5.5 95.1 T 6.4 31.2 -i 3.5
961.4 T 23.9 2.8 7: 2.0 1.9 ? 1.8 1.7 T 1.1 -
0.8 + 0.1 4.5 T 0.3
36.0 + 0.9 0.8 7: 0.2 0.5 T 0.1 9.8 T 0.5
11.2 T 0.5 1.4 T 0.2 0.5 T 0.1 8.1 7 0.4 0.6 T 0.2 3.2 + 0.3 8.6 T 0.5 9.3 T 0.5 5.8 + 0.4 2.3 T 0.2 1.1 1F 0.2 2.6 T 0.2 0.9 T 1.7 4.8 7 0.3
72.2 ‘7 1.3 60.3 + 1.2
1.6 + 0.2 1.2 ? 0.1 0.5 T 0.1 0.9 T 0.2
468.7 ‘T 3.7 0.6 ‘i 0.2 4.9 T 0.4 1.0 + 0.2 4.5 T 0.3 3.7 T 0.3 7.6 7 0.5 5.5 T 0.3 0.3 T 0.2 2.1 T 0.3 0.7 T 0.1
35.2 + 0.9 50.4 T 1.3
1.3 'T 0.4 735.7 T 5.4
2.6 T 0.2 2.4 + 0.3 0.4 T 0.1 -
18
1.1 + 0.3 0.7 T 0.5 - --- 0.9 + 0.3 0.9 T 0.2 0.7 T 0.5 - --- 0.7 + 0.2 0.7 T 0.2 0.8 ?: 0.5 0.7 T 0.2 0.3 T 0.2 1.0 ?: 0.8 6.6 T 0.2 0.6 T 0.4 - -me 1.9 + 0.3 1.0 + 0.4 0.6 T 0.4 0.5 T 0.4 0.5 T 1.0 - --- 1.1 + 3.3 1.2 + 0.3 1.3 + 0.3 1.2 T 0.5 - --- 1.4 + 0.3 0.5 T 0.3 0.5 T 0.3 0.9 T 0.4 0.5 T 0.3 0.9 T 0.5 0.5 T 0.3 0.9 T 0.5 - ---
--- 3.2 + 0.8 - ---
19.3 + 1.0 - --- 0.6 + 0.3 0.7 T 0.5 0.7 T 0.3 -
)I
-”
e-
-.
..-
.-
,,-,
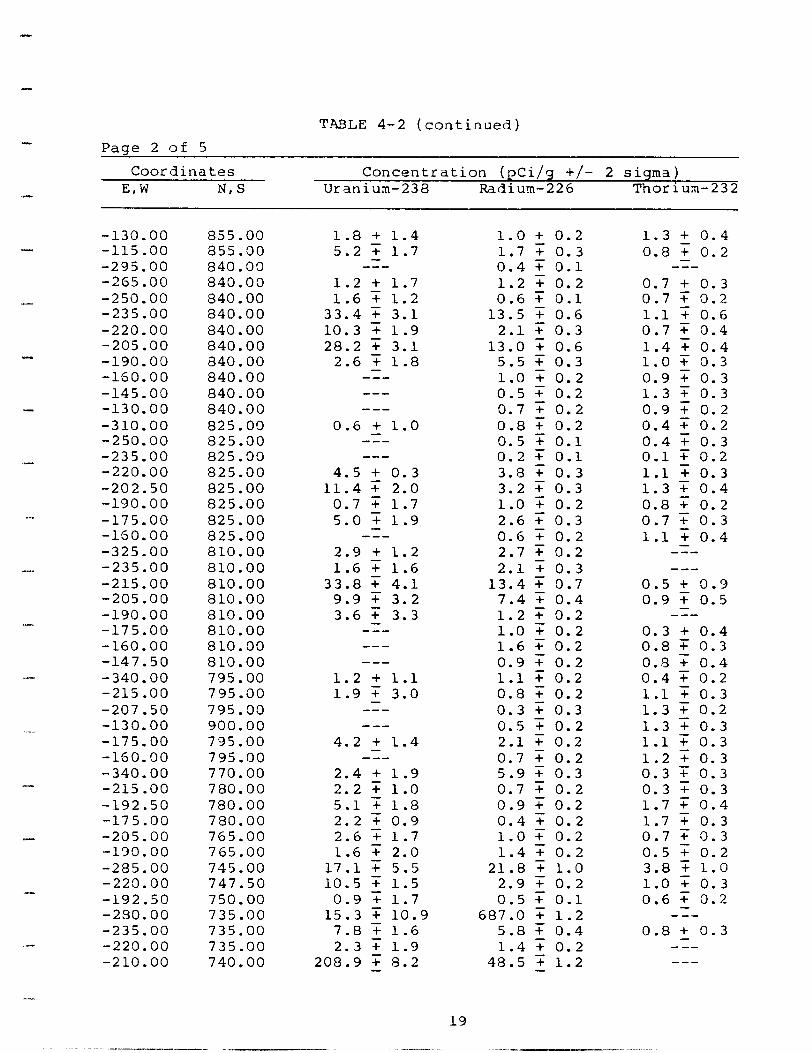
Paae 2 of 5 TABLE 4-2 (continued)
Coordinates Concentration (pCi/g +/- 2 sigma) E,W N,S Uranium -238 Radium-226 Thorium -232
-130.00 855.00 -115.00 855.00 -295.00 840.03 -265.00 840.00 -250.00 840.00 -235.00 840.00 -220.00 840.00 -205.00 840.00 -190.00 840.00 -160.00 840.00 -145.00 840.00 -130.00 840.00 -310.00 825.00 -250.00 825.00 -235.00 825.00 -220.00 825.00 -202.50 825.00 -190.00 825.00 -175.00 825.00 -160.00 825.00 -325.00 810.00 -235.00 810.00 -215.00 810.00 -205.00 810.00 -190.00 810.00 -175.00 810.00 -160.00 810.00 -147.50 810.00 -340.00 795.00 -215.00 795.00 -207.50 795.00 -130.00 900.00 -175.00 795.00 -160.00 795.00 -340.00 770.00 -215.00 780.00 -192.50 780.00 -175.00 780.00 -205.00 765.00 -130.00 765.00 -285.00 745.00 -223.00 747.50 -192.50 750.00 -290.00 735.00 -235.00 735.00 -220.00 735.00 -210.00 740.00
1.8 + 1.4 5.2 + 1.7 - --- 1.2 + 1.7 1.6 + 1.2
33.4 T 3.1 10.3 7 1.9 28.2 7 3.1
2.6 ? 1.8 - --- --- ---
0.6 + 1.0 - --- ---
4.5 + 0.3 11.4 T 2.0
0.7 T 1.7 5.0 7 1.9 - --- 2.9 + 1.2 1.6 ? 1.6
33.8 T 4.1 9.9 T 3.2 3.6 'i 3.3 -
es-
--e
1.2 + 1.1 1.9 'i 3.0 - ---
--- 4.2 + 1.4
D-w 2.4 + 1.9 2.2 T 1.0 5.1 -? 1.8 2.2 T 0.9 2.6 T 1.7 1.6 T 2.0
17.1 T 5.5 10.5 T 1.5
0.9 ? 1.7 15.3 + 10.9
7.8 ? 1.6 2.3 T 1.9
208.9 7: 8.2 -
1.0 + 0.2 1.7 T 0.3 0.4 T 0.1 1.2 T 0.2 0.6 T 0.1
13.5 T 0.6 2.1 T 0.3
13.0 + 0.6 5.5 T 0.3 1.0 '? 0.2 0.5 T 0.2 0.7 T 0.2 0.8 T 0.2 0.5 T 0.1 0.2 T 0.1 3.8 T 0.3 3.2 T 0.3 1.0 T 0.2 2.6 T 0.3 0.6 T 0.2 2.7 T 0.2 2.1 7 0.3
13.4 r 0.7 7.4 T 0.4 1.2 T 0.2 1.0 + 0.2 1.6 T 0.2 0.9 T 0.2 1.1 + 0.2 0.8 'T 0.2 0.3 T 0.3 0.5 T 0.2 2.1 7 0.2 0.7 T 0.2 5.9 7: 0.3 0.7 T 0.2 0.9 T 0.2 0.4 T 0.2 1.0 T 0.2 1.4 + 0.2
21.8 ? 1.0 2.9 T 0.2 0.5 T 0.1
687.0 + 1.2 5.8 + 0.4 1.4 T 0.2
48.5 ? 1.2 -
19
1.3 + 0.4 0.8 T 0.2 - --- 0.7 + 0.3 0.7 T 0.2 1.1 T 0.6 0.7 T 0.4 1.4 ? 0.4 1.0 T 0.3 0.9 T 0.3 1.3 T 0.3 0.9 T 0.2 0.4 T 0.2 0.4 T 0.3 0.1 7 0.2 1.1 -i 0.3 1.3 T 0.4 0.8 T 0.2 0.7 T 0.3 1.1 T 0.4 - ---
-em 0.5 + 0.3 0.9 T 0.5 - --- 0.3 + 0.4 0.8 T 0.3 0.8 + 0.4 0.4 T 0.2 1.1 ?1 0.3 1.3 + 0.2 1.3 7 0.3 1.1 1F 0.3 1.2 ? 0.3 0.3 T 0.3 0.3 T 0.3 1.7 T 0.4 1.7 T 0.3 0.7 T 0.3 0.5 T 0.2 3.8 ? 1.0 1.0 T 0.3 0.6 T 0.2 - --- 0.8 + 0.3 - ---
---

Page 3 of 5 TABLE 4-2 (continued)
Coordinates Concentration (pCi/g +/- 2 sigma) E,W N, S Uranium-238 Radium-226 Thorium-232
-280.00 717.50 -265.00 720.00 -235.00 720.00 -220.00 720.00 -260.00 710.00 -250.00 705.00 -250.00 705.00 -235.00 695.00 -267.50 731.00 -170.00 777.50 -185.00 945.00 -125.00 915.00 -135.00 915.00 -142.50 925.00 -125.00 925.00 -235.00 705.00 -235.00 855.00 -250.00 720.00 -145.00 865.00 -145.00 825.00 -155.00 965.00 -145.00 965.00 -135.00 965.00 -125.00 965.00 -115.00 965.00 -156.00 955.00 -135.00 955.00 -125.00 955.00 -115.00 955.00 -166.00 945.00 -135.00 945.00 -125.00 945.00 -175.00 935.00 -145.00 935.00 -135.00 935.00 -125.00 934.00 -185.00 925.00 -135.00 925.00 -192.50 915.00 -155.00 915.00 -214.00 905.00 -205.00 905.00 -165.00 905.00 -155.00 905.00 -145.00 905.00 -135.00 905.00 -125.00 905.00
--- 2.9 + 2.1 4.7 T 2.6 5.1 T 0.9 - ---
33.2 + 2.7 5.2 + 1.9 0.5 T 1.4 2.8 ? 1.7
86.9 T 4.6 307.6 ‘T 9.9
5.5 + 0.4 - --- D-e
--- 73.5 + 4.9 15.4 T 4.7 21.9 T 3.4 - -me
10.2 + 0.5 - --- 246.0 + 7.8 - --- 121.4 + 8.0 -
D-e
---
--- --- B-e
9.0 + 3.3 - B-e
---
B-B
23.7 + 5.4 - --- ---
4.5 + 2.2 - --- 14.5 + 2.8 - ---
--- 22.3 + 4.5
132.7 + 9.4 7.0 T 4.6 -
D-e
2.4 + 0.5 -
1.0 + 0.2 1.2 -t 0.3 0.9 T 0.3 0.8 ?: 0.1 1.3 T 0.3 1.2 T 0.2 1.2 T 0.3 0.7 T 0.1 0.8 ?: 0.2 6.0 + 0.4
45.4 ? 1.2 6.8 T 0.5 6.0 + 0.5 1.1 7 0.3 1.0 + 0.3
50.7 T 1.2 7.2 + 0.6 1.7 T 0.3 1.2 T 0.3 1.6 + 0.3 2.5 + 0.4 1.4 T 0.5
20.8 ?- 0.9 1.1 + 0.2
62.4 7 1.7 3.4 T 0.4 0.7 T 0.2 1.3 T 0.4 4.1 T 0.4 4.8 + 0.6 3.8 T 0.4 1.2 T 0.2 2.9 T 0.4
10.9 + 0.7 15.0 r 0.3
0.9 T 0.3 1.9 T 0.3 1.3 T 0.3 1.4 T 0.4 8.9 T 0.6 1.0 T 0.2 1.1 T 0.2 8.9 + 0.7
158.0 7 2.6 5.6 + 0.6 1.3 T 0.2
12.8 + 0.9 -
20
1.7 + 0.7 0.5 T 0.4 1.4 T 0.4 0.9 T 0.2 0.9 T 0.5 1.0 + 0.3 0.5 T 0.4 - --- 0.3 + 0.3 1.1 + 0.6 - --- 1.2 + 0.5 - --- 1.6 + 0.6 1.8 T 0.4 3.8 7 1.0 2.1 + 0.7 2.1 7 0.4 1.9 T 0.4 2.8 + 0.5 0.7 T 0.2 1.1 + 0.4 3.0 + 0.8 1.2 T 0.4 4.6 7 1.0 3.5 T 0.6 2.2 T 0.5 1.5 T 0.7 1.2 T 0.4 1.9 + 0.5 1.5 T: 0.4 2.4 '7 0.5 2.0 T 0.5
--- ---
1.1 + 0.4 1.7 T 0.6 2.9 T 0.6 2.4 7: 0.6
--- 1.1 + 0.5 1.7 T 0.4 1.7 'i 0.4 - --- 0.8 + 3.5 1.8 T 0.4 2.2 r 0.7 -

Page 4 of 5 Coordinates
E,W N,S
TABLE 4-2 (continued)
Concentration (pCi/g +/- 2 sigma) Uranium-238 Radium-226 Thorium-232
-215.00 895.00 -205.00 895 .OO -195.00 895.00 -175.00 895.00 -165.00 895.00 -165.00 896.00 -155.00 895.00 -145.00 895 .OO -135.00 895.00 -225.00 885.00 -215.00 885.00 -195.00 885.00 -185.00 885.00 -165.00 885.00 -155.00 885.00 -235.00 875.00 -225.00 875.03 -215.00 875.00 -205.00 875.00 -195.00 875.00 -185.00 875.00 -175.00 875.00 -165.00 875.00 -155.00 875.00 -245.00 865.00 -225.00 865.00 -215.00 865.00 -205.00 865.00 -195.00 865.00 -185.00 865.00 -255.00 855.00 -245.00 855.00 -225.00 855.00 -215.00 855.00 -185.00 855.00 -245.00 845.00 -235.00 845.00 -225.00 845.00 -215.00 845.00 -205.00 845.00 -195.00 845.00 -195.00 845.00 -225.00 835.00 -215.00 835.00 -205.00 835.00 -195.00 835.00 -225.00 825.00
--- 289.3 + 9.0
20.2 T 3.8 13.3 7 5.7
128.9 7 12.1 - Me-
8.2 + 4.3 5.2 T 2.5
13.9 T 5.1 52.4 ‘T 8.2
6.7 T 3.7 58.2 T 5.1
469.8 + 15.5 - --- 10.3 + 4.0 - ---
we-
--- es-
93.9 + 6.4 30.0 ‘i 4.9
7.9 T 3.8 - we- ---
31.5 + 5.0 -
---
me-
6.2 + 2.5 8.5 'T 3.1 8.3 + 4.5
27.7 + 3.7 32.0 + 4.4
B-e
22.5 + 4.0 9.7 SF 5.4 - --- 6.7 + 3.1
78.0 + 7.8 5.4 T 2.4
31.3 r 4.4 40.2 T 4.8 - ---
m-e 6.6 + 3.1 4.1 T 1.8
31.6 + 7.5 -
1.2 + 0.2 2.7 T 0.4
27.4 T 1.1 12.3 + 0.8 98.6 T 2.1
1.2 T 0.3 55.7 ? 1.5
7.0 T 0.6 3.0 T 0.4
13.2 7 0.7 7.5 + 0.6 7.5 '? 0.6 8.2 ? 0.7
293.3 7 4.0 1.9 + 0.3 7.6 7: 0.6 2.2 T 0.3 1.1 + 0.3 1.6 7 0.3 0.6 + 0.3
35.6 T 1.4 8.1 T 0.7 5.6 T 0.5 0.9 T 0.2
48.6 T 1.9 13.6 -? 0.7
1.4 T 0.2 1.1 ? 0.4 2.1 + 0.3 2.9 T 0.4 2.3 T 0.6
19.0 + 0.8 1.3 T 0.2 1.9 + 0.3 7.1 T 0.6 2.2 T 0.3 1.1 T 0.3 4.2 T 0.5
32.4 ? 1.2 1.6 ‘7 0.3 2.8 + 0.4
34.4 ? 1.3 6.9 T 0.5 2.0 T 0.3 3.3 T 0.4 1.3 7 0.3
19.3 T 0.9 -
21
3.0 + 0.6 ---
4.8 + 0.3 - --- ---
2.3 + 0.4 - --- 3.3 + 0.6 2.1 T 0.4 1.6 7 0.8 1.5 7- 0.4 - --- 2.2 + 0.7 - --a 2.1 + 0.6 1.0 + 0.1 2.4 T 0.5 1.9 T 0.4 2.5 'i 0.5 2.3 T 0.5 - --- 3.0 + 0.6 - --- 0.9 + 0.2 - --a 3.5 + 0.7 1.4 T 0.5 2.3 T 0.6 2.6 T 0.6 - --- 3.0 + 1.2 1.3 T 0.4 1.9 T 0.4 2.5 T 0.4 2.4 -i 0.5 2.5 + 0.4 1.6 T 0.5 2.6 T 0.5 1.4 T 1.2 2.1 ? 0.7 1.3 T 0.4 3.7 T 1.2 1.5 T 0.5 - --- 2.8 + 0.G 2.2 T 0.5 2.3 T 0.7
,.
“.-
Paae 5 of 5 TABLE 4-2 (continued)
Coordinates Concentration (pCi/g +/- 2 sigma) E, W N,S Uranium-238 Fbdium-226 Thorium-232
-215.00 825.00 -235.00 865.00 -175.00 865.00 -145.00 965.00 -135.00 968.00 -115.00 968.00 -100.00 968.00
-85.00 968.00 -70.00 968.00
-160.00 960.00 -145.00 960.00 -130.00 960.00 -115.00 960.00 -100.00 960.00
-85.00 960.00 -70.00 963.00
-115.00 945.00 -130.00 945.00 -115.00 945.00 -100.00 942.00 -180.00 940.00
21.5 + 2.6 116.4 TT 11.9
3.9 + 2.6 384.1 + 12.7
7.5 T 2.9 - m-e
--- 28.8 + 7.8 63.2 ? 18.7
143.4 7 9.2 - --- B-e
29.1 + 9.6 83.4 T 8.4 70.4 7 12.9 54.2 T 7.0 29.2 T 7.6 - we-
--- 173.7 + 10.2
4.0 7 2.4 -
5.0 + 0.5 108.3 7 2.3
1.1 + 0.2 151.7 + 2.4
4.0 T 0.5 1.2 + 0.2 0.4 T 0.2
30.7 T 1.1 38.6 ? 1.6
100.4 T 1.9 4.3 T 0.4 1.2 '7 0.3
20.1 T 1.0 69.8 7: 2.0 35.8 T 1.6 18.1 + 0.8 31.0 '7 1.2
1.0 + 0.2 1.3 'i 0.3
126.3 ‘T 2.4 2.4 'T 0.4 -
2.2 + 0.4 - --- 1.8 + 0.4 - --- 1.5 + 0.6 1.5 T 0.5 1.5 T 0.3 5.0 T 1.0
13.5 ? 1.5 - --- 1.4 + 0.4 1.0 7 0.4 3.7 T 0.8 7.1 -7 1.6 3.6 + 0.9 1.7 + 0.6 2.5 7 0.8 2.7 T 0.6 1.7 T 0.3 - B-s 1.7 + 0.4 -
22
a r ii111 i ! I I I I I I I I I I I II.-.
B . I
2 2P i ,I
ii:?’ --
f *,‘I / ,’
STORkGE PILE
< SCL-. ‘n .,I,., w .Y. c. Y.
, 1-cm”x.c-- m-.-T ~ * - - -gg!g!.@, “r-I.. : Lo.
.SIIPIP ;..u: I 1.ou.sm a. W Y
~ .1*1 c. .m w I. GOROUG~, ,W MIDDLESEX ,.. . . . TOWN OF PISCATAWAY WI.&I.Y STltE-
LEGEND
0 SAMPLING LOCATIONS AT WHICH RESULTS EXCEEDED CRITERIA
FIGURE 4-2 LOCATIONS OF SOIL SAMPLES FROM BORINGS THAT EXCEEDED URANIUM-238, RADIUM-226, AND THORIUM-232
.a GUIDELINES
23

.a
L-
-.
TABLE 4-3 GAMMA SPECTROMETRY ANALYSIS OF SOIL SAMPLES FROM BORINGS
Page 1 of 2
Coordinates Depth Concentration (pCi/g +/- 2 sigma) E,W N, S (cm ) Uranium -238 Radium-226 Thorium -232
-180.00 940.00 33.0 -180.00 940.00 43.2 -180.00 940.00 53.3 -180.00 940.00 76.2 -180.00 940.00 86.4 -180.00 940.00 96.5 -180.00 940.00 106.7 -180.00 940.00 116.8 -180.00 940.00 147.3 -170.00 950.00 38.1 -170.00 950.00 48.3 -170.00 950.00 58.4 -170.00 950.00 68.6 -170.00 950.00 79.7 -170.00 950.00 88.9 -170.00 950.00 119.4 -170.00 950.00 149.9 -137.50 960.00 35.6 -137.50 960.00 48.3 -137.50 960.00 58.4 -137.50 960.00 68.6 -137.50 960.00 78.7 -137.50 960.00 86.4 -137.50 960.00 111.8
-92.50 960.00 10.2 -92.50 960.00 20.3 -92.50 960.00 30.5 -92.50 960.00 43.2 -92.50 960.00 73.7 -92.50 960.00 104.1 -92.50 960.00 147.3
-220.00 832.50 30.5 -220.00 832.50 91.4 -220.00 832.50 121.9 -220.00 832.50 152.4 -235.00 710.00 40.6 -235.00 710.00 50.8 -235.00 710.00 61.0 -235.00 710.00 71.1 -235.00 710.00 81.3 -235.00 710.00 104.1 -235.00 710.00 127.8 -212.50 732.50 76.2 -212.50 732.50 86.4 -212.50 732.50 111.8 -204.00 900.00 33.0
--- ---
31.6 + 4.7 - --- 1.2 + 0.2 - ---
B-m
--- 9.0 + 2.6 6.5 T 2.3 - ---
--- --- --- --- --- --- --- --- --- --- -me
2.8 + 1.7 3.8 'T 2.3
59.7 T 10.7 40.5 T 4.9 15.0 T 4.0 - --a 11.3 + 4.5 - ---
6.5 + 3.4 - --- 20.9 + 6.5 - ---
--- 21.4 + 5.9 - ---
--- --- --- --- ---
16.5 + 5.4 11.8 + 3.4
8.1 T 5.5 -
4.4 + 0.5 0.9 T 0.2
47.7 T 1.4 0.8 7 0.3 2.6 T 0.4 3.6 T 0.4 1.6 T 0.3 1.1 T 0.2 1.7 T 0.3 1.2 T 0.2 0.8 T 0.2 0.9 T 0.4 0.9 T 0.2 0.8 T 0.3 0.8 7 0.2 1.4 T 0.3 0.9 T 0.7 1.2 T 0.3 1.3 ‘7 0.2 1.0 + 0.2 1.2 'T 0.3 1.0 T 0.2 1.0 T 0.2 1.3 T 0.4
32.0 T 1.5 36.9 + 1.3
6.8 T 0.6 4.7 T 0.7 3.7 'i 0.8 1.4 T 0.4 1.1 7 0.4
79.2 7 1.6 19.5 ‘T 1.1
2.6 T 0.4 1.3 T 0.4
21.5 ? 1.0 1.7 'T 0.3 1.1 + 0.2 1.2 T 0.3 1.1 + 0.2 1.0 T 0.8 1.4 + 0.4 6.9 T 0.6 1.9 + 0.3 2.1 T 0.5 1.6 T 0.3 -
1.5 + 0.6 2.2 T 0.8 4.2 + 1.1 1.5 7 0.4 2.1 T 0.5 3.1 T 0.5 2.5 T 0.4 2.3 T 0.8 2.0 T 0.4 1.7 T 0.4 - -s-
--- 1.4 + 0.3 1.5 T 0.4 1.3 T 0.4 2.2 r 0.8 2.7 T 0.7 - --- 1.5 + 0.4 1.2 T 0.3 1.1 -i 0.5 1.0 T 0.7 1.6 T 0.4 1.8 + 0.6 3.1 + 0.9 2.2 ? 1.0 1.5 + 0.8 3.4 ? 1.0 3.0 T 1.7 2.8 T 0.8 3.0 T 0.7 1.5 T 1.0 4.1 + 0.9 1.6 T 0.5 2.0 T 0.5 3.0 T 0.9 2.0 ?: 0.6 1.8 T 0.4 2.0 T 0.4 3.3 + 0.6 2.1 T 0.7 2.3 7 1.0 0.8 7 0.7 2.5 + 0.5 - Be- 1.8 + 0.4
24
Paqe 2 of 2 TABLE 4-3 (continued)
Coordinates Depth Concentration (pCi/g +/- 2 sigma) E,W N, S (cm) Uranium-238 Radium-226 Thorium-232
-204.00 900.00 43.2 -204.00 900.00 68.6 -204.00 900.00 99.1 -204.00 900.00 129.5 -204.00 900.00 160.0 -234.00 870.00 73.7 -234.00 870.00 83.8 -234.00 870.00 94.0 -234.00 870.00 104.1 -234.00 870.00 114.3 -234.00 870.00 134.6 -234.00 855.00 33.0 -234.00 855.00 43.2 -234.00 855.00 53.3 -234.00 855.00 83.8 -234.00 855.00 144.8 -234.00 855.00 152.4 -130.00 856.00 99.1 -190.00 856.00 114.3 -190.00 856.00 127.0
--- m-e
37.9 + 9.2 me-
6.4 + 3.0 29.2 ‘T 4.8 15.8 T 2.6
3.1 5 1.6 --- -em ---
26.8 + 5.2 9.8 T 4.1
58.8 + 4.5 29.2 T 9.8 25.7 + 4.8 11.8 T 4.7
397.7 T 25.3 89.1 + 19.9 -
1.6 + 0.4 4.5 + 0.6
28.9 7 1.7 2.5 T 0.4 1.1 T 0.8
24.3 + 1.1 1.2 + 0.3 1.0 T 0.3 0.8 + 0.2 1.2 T 0.2 1.7 T 0.4 8.8 ‘T 0.7 7.7 T 0.6
27.9 ‘i: 1.0 54.6 ? 1.7
8.5 + 0.7 2.0 + 0.6
208.4 7 5.5 67.4 T 3.5
2.9 + 0.6 -
3.2 + 0.7 -Me ---
3.4 2 0.8 ---
1.4 + 0.6 1.7 T 0.5 1.3 7 0.3 1.2 T 0.4 1.2 T 0.5 3.6 + 0.9 1.8 + 0.5 2.4 + 1.2 1.6 T 0.8 2.7 T 1.1 - --- 3.8 + 1.2 - -we
--- 2.5 + 0.8 -
.
25
L
c
Y
-
c
TABLE 4-4 RADIOCHEMICAL ANALYSIS OF SUBSURFACE WATER SAMPLES
Coordinates E,W N, S
Concentration (pCi/l +/- 2 sigma)
Uranium -238 Radium-226
-175 795
-190 930
-108 915
-130 900
-145 855
-175 870
-185 945
-192.5 780
200 720
-207 795
-235 695
-235 810
-235 825
-235 855
-235 870
-236 705
-247.5 870
-250 697.5
-250 825
-250 840
-265.5 855
-340 795
33.0
1288.0
1.8
4.5
1.5
68.0
33.0
12.7
86.3
3.0
6.7
1.5
5.8
209.0
7.9
33.0
34.8
11.0
1.5
2.4
2.1
17.9
0.2 + 0.1 -
71.0 + 21.0 -
0.1
0.3 + 0.1 -
0.3 + 0.1
0.4 + 0.1 -
1.4 + 0.4 -
0.2 + 0.1 -
0.6 + 0.2
0.2 + 0.1 -
0.1 + 0.1 -
0.3 + 0.1 -
0.8 + 0.2 -
26.0 + 8.0 -
1.5 + 0.5 -
0.9 + 0.3 -
2.7 + 0.8
0.2 + 0.1 -
0.1
0.1
0.2 + 0.1 -
0.9 + 0.3 -
26

TABLE 4-5 PRESSURIZED IONIZATION CHAMBER (PIC) READINGS
AT SELECTED LOCATIONS Page 1 of 4
Coordinates PIc* E,W N, S micro-R/h
-350.00 790.00 16.20 -340.00 780.00 26.80 -340.00 800.00 17.00 -330.00 770.00 17.60 -330.00 800.00 19.60 -330.00 810.00 21.80 -320.00 760.00 17.80 -320.00 810.00 25.60 -320.00 820.00 23.80 -310.00 750.00 16.80 -310.00 830.00 55.40 -300.00 840.00 59.80 -290.00 740.00 24.40 -290.00 850.00 37.80 -290.00 860.00 17.20 -285.00 735.00 41.00 -280.00 860.00 43.60 -275.00 725.00 57.40 -275.00 735.00 37.60 -270.00 850.00 24.80 -265.00 715.00 53.00 -265.00 725.00 30.60 -260.00 840.00 21.20 -260.00 850.00 24.80 -255.00 705.00 35.20 -255.00 715.00 36.40 -250.00 730.00 33.20 -250.00 830.00 31.00 -250.00 840.00 27.00 -250.00 860.00 33.00 -245.00 695.00 19.20 -245.00 705.00 21.00 -245.00 715.00 21.60 -245.00 825.00 32.40 -240.00 700.00 17.20 -240.00 710.00 17.80 -240.00 720.00 22.00 -240.00 730.00 31.00 -240.00 820.00 33.80 -240.00 860.00 23.20 -240.00 870.00 33.60 -230.00 710.00 19.60 -230.00 720.00 57.60 -230.00 730.00 26.00
28

TABLE 4-5 (continued) Page 2 of 4
Coordinates PICf E,W N, S micro-R/h
-230.00 -230.00 -230.00 -230.00 -230.00 -230.00 -220.00 -220.00 -220.00 -220.00 -220.00 -220.00 -220.00 -220.00 -220.00 -210.00 -210.00 -210.00 _ -210.00 -213.00 -210.00
I- -210.00 -210.00 -210.00
_I -210.00 -210.00 -200.00 -200.00 .,I. -200.00 -200.00 -200.00
-. -200.00 -200.00 -200.00 -200.00 ._ -200.00 -200.00 -200.00 -190.00 -190.00 -190.00 -190.00 -190.00 -190.00 -190.00 t . -190.00 -190.00
,,-w
740.00 29.80 810.00 34.20 820.00 38.80 840.00 22.60 870.00 21.20 880.00 60.40 720.00 23.40 730.00 63.60 750.00 42.80 800.00 28.20 810.00 24.80 840.00 19.60 850.00 23.20 880.00 27.60 890.00 75.40 730.00 29.40 740.00 107.00 750.00 92.80 760.00 43.00 790.00 41.40 800.00 28.40 820.00 17.60 850.00 21.00 860.00 18.80 890.00 25.60 910.00 55.80 750.00 40.60 760.00 121.80 770.00 46.00 780.00 25.40 790.00 22.60 820.00 78.00 830.00 18.40 860.00 53.00 870.00 28.40 890.00 22.20 900.00 56.60 910.00 49.20 760.00 29.60 770.00 72.80 780.00 22.00 800.00 40.80 830.00 117.60 840.00 23.80 870.00 20.60 890.00 49.20 920.00 49.00
29
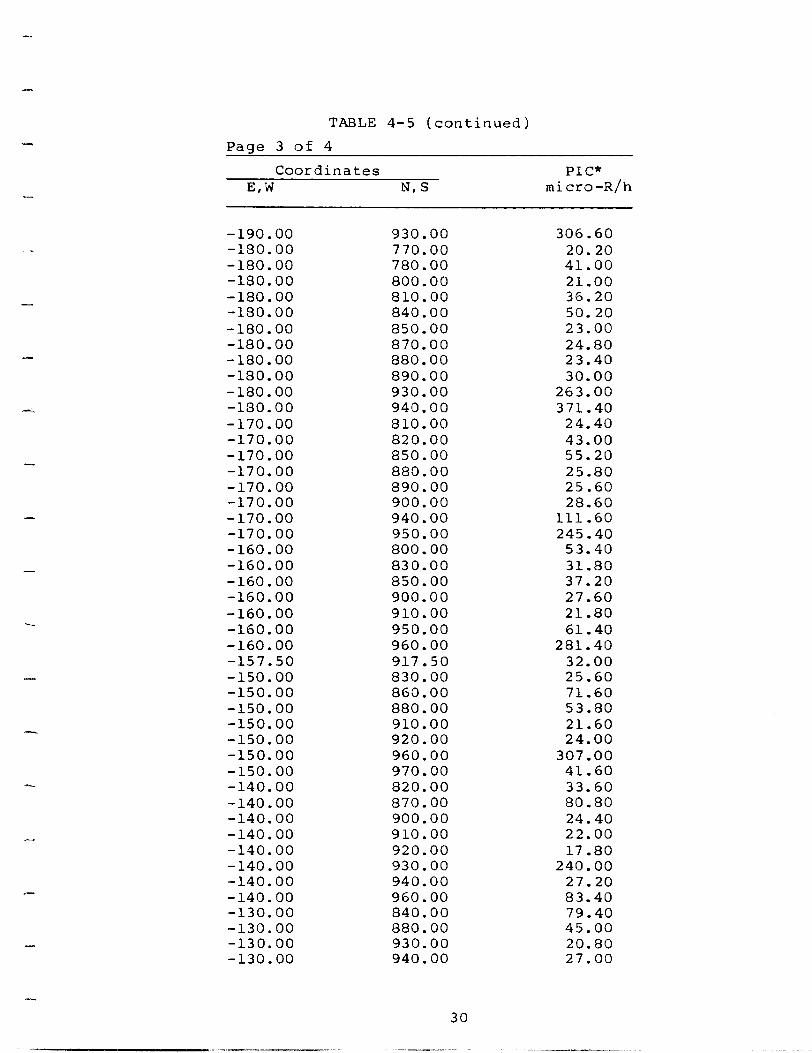
TABLE 4-5 (conti nued) Page 3 of 4
Coordinates PICf E,W N, S micro-R/h
-190.00 930.00 306.60 -130.00 770.00 20.20 -180.00 780.00 41.00 -180.00 800.00 21.00 -180.00 810.00 36.20 -180.00 840.00 50.20 -180.00 850.00 23.00 -180.00 870.00 24.80 -180.00 880.00 23.40 -180.00 890.00 30.00 -180.00 930.00 263.00 -180.00 940.00 371.40 -170.00 810.00 24.40 -170.00 820.00 43.00 -170.00 850.00 55.20 -170.00 880.00 25.80 -170.00 890.00 25.60 -170.00 900.00 28.60 -170.00 940.00 111.60 -170.00 950.00 245.40 -160.00 800.00 53.40 -160.00 830.00 31.80 -160.00 850.00 37.20 -160.00 900.00 27.60 -160.00 910.00 21.80 -160.00 950.00 61.40 -160.00 960.00 281.40 -157.50 917.50 32.00 -150.00 830.00 25.60 -150.00 860.00 71.60 -150.00 880.00 53.80 -150.00 910.00 21.60 -150.00 920.00 24.00 -150.00 960.00 307.00 -150.00 970.00 41.60 -140.00 820.00 33.60 -140.00 870.00 80.80 -140.00 900.00 24.40 -140.00 910.00 22.00 -140.00 920.00 17.80 -140.00 930.00 240.00 -140.00 940.00 27.20 -140.00 960.00 83.40 -130.00 840.00 79.40 -130.00 880.00 45.00 -130.00 930.00 20.80 -130.00 940.00 27.00
30
- . . - - I I . . _ . - - . .____,__I__-
.-
-
-
,-
*-
-
--
TABLE 4-5 (continued) Page 4 of 4
Coordinates PICf E,W N, S micro-R/h
-130.00 950.00 35.60 -130.00 960.00 30.40 -125.00 915.00 23.00 -125.00 925 .oo 28.00 -120.00 840.00 49.80 -120.00 860.00 55.80 -120.00 900.00 53.60 -120.00 940.00 27.20 -110.00 880.00 73.80 -110.00 900.00 137.00 -110.00 940.00 53.80 -110.00 950.00 64.80 -110.00 960.00 27.60 -100.00 900.00 28.00 -100.00 910.00 25.60 -100.00 920.00 25.60 -100.00 930.00 24.00 -100.00 940.00 39.60 -100.00 960.00 175.60
-90.00 945.00 70.80 -90.00 960.00 81.20 -83.00 945 .oo 41.00 -80.00 965.00 44.60 -70.00 945.00 27.60 -70.00 960.00 43.00 -70.00 965.00 39.00
*Accuracy of the PIC is +5 percent of reading at 10 wR/h.
31
--
t I
'TABLE 4-6
SUMMAKY OF PKE-KEMEDIAL ACTION BUILDING MEASUKEMENT RESULTS
FOHMEK MIDDLEYEX SAMPLING PLANT
PROCESS BUILDING
INTERIOR MEASUREMENT MEASUREMENT LOCATIONS TYPE
NO. OF HEADINGS GKID BLOCK AVERAGE MAXIMUM READING UNITS CKITEHION TAKEN RANGE OBSERVED
Floor Beta-Gamma Dose Rates Direct Alpha Activity on Surfaces
1755
1755
Beta-Gamma Dose Rates 1610
Direct Alpha Activity on Surfaces 1610
CO.01 - 0.19 58 - 2375
0.65 mrad/h 7Uc)Y dpm/lUlJ cm2
(1’ LOU!I’
Walls CO.01 - 0.15 0.28 34 - 2422 3842
mrad/h dpm/lUO cm2
mrad/h dpm/lUO cm2
(1) 2uo
(1) 200
(I' 2uo
(1) 200
(1' 200
(A) zoo
(1' 200
LO
3 30
3’
3)
3)
3)
3)
3)
3)
Window Ledges(') Beta-Gamma Dose Rate 116
Direct Alpha Activity on Surfaces 116
Beta-Gamma Dose Rate Direct Alpha Activity on Surfaces
179 179
CO.01 - 0.48
68 - 2108
CO.01 - 1.43 34 - 4335
0.48 2lOt)
Floor/Wall IntersectionsfZl 1.43 mrad/h 4335 dpm/lUO cm2
Beta-Gamma Dose Rate Direct Alpha Activity on Surfaces
61 do.01 - 0.26 0.26 Bl 0 - 2635 2635
Beta-Gamma Dose Rate 69
Direct Alpha Activity on Surfaces 6Y
mrad/h dpm/lOO cm2
0.43 mrad/h 40256 dpm/lOO cm2
Steel Beamsf21 <O.Ul - 0.43 51 - 40256
c O.Ul - 0.64 17 - 13532
< 0.01 - O.OB 51 - 5U4Y
w N Wood BeamsC2) Beta-Gamma Dose Rate
Direct Alpha Activity on Surfaces
Beta-Gamma Dose Rate Direct Alpha Activity on Surfaces
71 71
0.64 mrad/h 13532 dpm/lUO cm2
mrad/h dpm/lUO cm2
pCi/m2/s
pci/m3 pCi/l
Miscellaneous Itemsf21 20
20 0.08 5U4Y
Floor and Wallsf21 Radon Flux
Room Air Air Particulate Activity 20 Time-Integrated Radon 9
25 0.42 - 168.0 168.U
Below MUA - 0.05 0.40 - 3.54
0.05 3.54
EXTERIOR MEASUREMENT LOCATIONS
Walls Beta-Gamma Dose Rates 2445 Direct Alpha Activity on Surfaces 2445
< 0.01 - 0.40 51 - 18tM7
0.49
lt(t187 mrad/h dpm/luO cm2
(1) LOU(~)
Roof Beta-Emma Dose Rates Drrect Alpha Activity oh Surfaces
Beta-Gamma Dose Rates Direct Alpha Activity on Surfaces
Beta-Gamma Dose Rates
Direct Alpha Activity on Surfaces
1755 1755
cu.01 - 0.84 41 - 527
c 0.01 - 0.26
17 - 5Y16
4.17 1122
mrad/h dpm/lOO cm2
(1' 2uof3)
Wrndow Ledgesf2) 0.26 mrad/h 5916 dpm/lUU cm2
(I' 2uu(3'
Dock U.UL - u.u4 U.UY
122 - 6LY t41b mrad/h dpm/lUO cm'
(1) LUU(3
Page 1 of 4

‘I’AHLF: 4-6 (cant InlIed)
BOILER HOUSE
INTERIOR MEASUKEMENT MEASUREMENT NO. OF HEADINGS GRIU BLOCK AVERAGE MAXIMUM REAUING UNITS CKITERION LUCATION 'TYPE 'TAKEN HANG E Ut3StKVED
Floors Beta-Gamma Dose Rates 120 < 0.01 - 0.02 0.03 mrad/h (1) Direct Alpha Activity on SUrfaceS 120 7B - 219 476 dpm/lUO cm2 ZUO(~)
Beta-Gamma Dose Rates 170 < II.01 - 0.05 0.08 mrad/h (1) Direct Alpha Activity on Surfaces 170 54 - 364 612 dpm/lUO cm2 200(J)
(1) zuo(3)
(1) 200(j)
(1) &O(3)
20
3 30
Walls
Floor/Wall IflteKSeCtiOn(2) Beta-Gamma Dose Rates 34 < 0.01 - 0.05 0.05 mrad/h Direct Alpha Activity on SUrfaCeS 34 34 - 442 442 dpm/lUU cm2
Window Ledgesi Beta-Gamma Dose Rates 8 0.02 - 0.17 0.17 mrad/h Direct Alpha Activity on Surfaces 8 17 - 799 799 dpm/lUO cm2
Beta-Gamma Dose Rates 10 < 0.01 - 0.17 0.17 mrad/h Direct Alpha ACtlVity on Surfaces 10 34 - 5049 5049 dpm/lUO cm2
Miscellaneous Items(2)
W Floors and Walls(2) W
Room A1ri2)
pCi/m2/s
pCl/m3 pCi/l
Radon Flux Measurements 2 0.60 - 8.93 8.93
Air Particulate Activity Time-Integrated Radon
1u Below MDA - 0.05 0.05 1 0.53 0.53
EXTERIOR MEASUREMENT LOCATIONS
Walls Beta-Gamma Dose Rates Direct Alpha Activity on Surfaces
245 < 0.01 - 0.07 245 146 - 4482
0.15 mrad/h 6494 dpm/lUU cm2
(1) 200(-1)
(1) 200(3)
Roof Beta-Gamma Dose Rates Direct Alpha Activity on Surfaces
240 < 0.01 - 0.02 240 51 - 153
0.03 mrad/h 272 dpm/lUO cm2
Page 2 of 4
t 1 I I 1 1
ADMINISTRATION BUILDING
TABLE 4-6 (continued)
INTERIOR MEASUREMENT LOCATIONS
MEASUKEMENT TYPE
NO. OF HEADINGS GRID BLOCK AVEKAGE MAXIMUM KEAUING UNI'PS CHITEKIVN TAKEN HANGE OBSEKVEU
Beta-Gamma Dose Rate Direct Alpha Activity on Surfaces
600 60U
c 0.01 - 0.07 0 - 1317
0.09 mrad/h 3536 dpm/lOO cm2
ill 200(3)
mrad/h (1) dpm/lOO cm2 ZOO(~)
Floors
Walls Beta-Gamma Dose Rate Direct Alpha Activity on Surfaces
Floor/Wall InterSeCtiOn(2) Beta-Gamma Dose Rate 106 Direct Alpha Activity on Surfaces 106
Window Ledges(2l Beta-Gamma Dose Rate Direct Alpha Activity on Surfaces
Drains(2l Beta-Gamma Dose Rate 8
Direct Alpha Activity on Surfaces 8
Floors and Walls(2l Radon Flux
Room Air Air Particulate Activity 17 Below MDA - 0.09 Time-Integrated Radon 2 Nondetectable
W 4
EXTEHIOK MEASUREMENT MCATIONS
Window Ledgesf21 Beta-Gamma Dose Rate 25
Direct Alpha Activity on Surfaces 25
Roof Beta-Gamma Dose Rate 600
18 1B
< 0.01 - 0.02 17 - 119
< 0.01 - 0.06 34 - 1360
0.02
119
0.06 mrad/h 1360 dpm/lOO cm2
(1) 200
(11 200
(11 200 (
20
3 30
26 < 0.01 - 0.02 26 34 - 204
0.02 mrad/h 204 dpm/lOO cm2
mrad/h dpm/lOO cm2
pCi/m2/s
pCi/m3 pCi/l
< 0.01 - 0.13 34 - 1071
0.11 - 0.15
0.13 1071
2 0.15
0.09
c 0.01 - 0.02 0.02 mrad/h (11 17 - 68 68 dpm/lOO cm2 200i31
0.04 - 0.07 0.08 mrad/h (1)
Page 3 of 4
'TABLE 4-b
GARAGE
(continued)
INTERIOR MEASUREMENT MEASUHEMENT NO. OF HEADINGS GRID BLOCK AVEKAGE MAXIMUM READING UNITS CKITEKION LOCATIUNS TYPE TAKEN RANGE OBSERVED
INTERIOR MEASUREMENT LOCATIONS
Floor 375 < 0.01 - 0.04 0.05 375 19 - 253 680
Beta-Gamma Dose Rate Direct Alpha Activity on Surfaces
mrad/h (1) dpm/lUU cm2 LUO(‘)
mrad/h (1) dpm/lUU cm2 WU(~)
mrad/h (1) dpm/lUU cm2 zulJ(3)
pCi/m3 3 pCi/l JO
Floor/Wall Intersection(21 Beta-Gamma Dose Rate Direct Alpha Activity on SUrfaCe
Beta-Gamma Dose Rate Direct Alpha Activity on Surfaces
40 < 0.01 - 0.11 40 51 - 527
0.11 527
Miscellaneous Items(21 20 20
< 0.01 - 0.13 34 - 5015
0.13 5015
Room Air(2l Air Particulate Activity 17 Below MDA - 0.10 Time-Integrated Radon 2 Nondetectable
0.10
EXTERIOR MEASUREMENT LOCATIONS
Roof Beta-Gamma Dose Rate 195 Direct Alpha Activity on Surfaces 195
< 0.01 - 0.02 68 - 144
0.02 mrad/h (1) 204 dpm/lUU cm2 200(31
(11 1.0 mrad/h maximum dose rate in any loo-cm2 area; 0.20 mrad/h average dose rate in any area not to exceed 1 m2.
(21 Only one measurement was read per grid block.
(31 The 200 dpm/lOO cm2 is based on a one to one composition ratio of uranium-238 to radium-226 (Ref. 14).
MDA Minimum Detectable Activity
Page 4 of 4
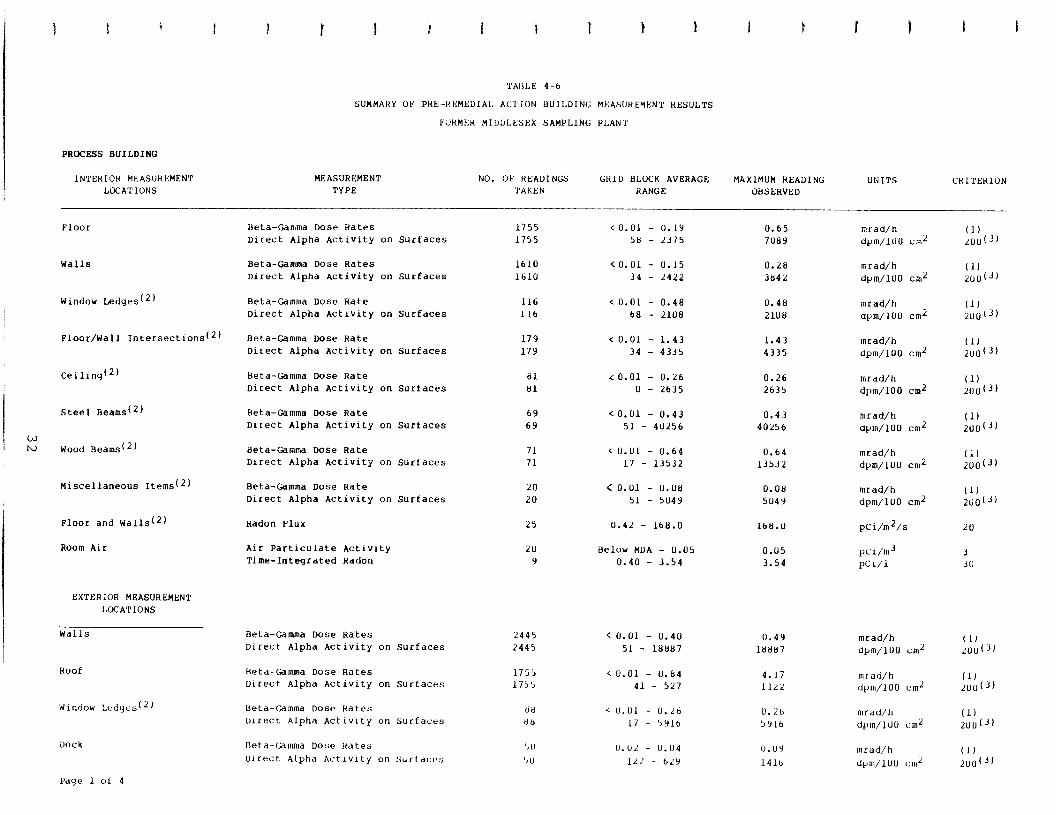
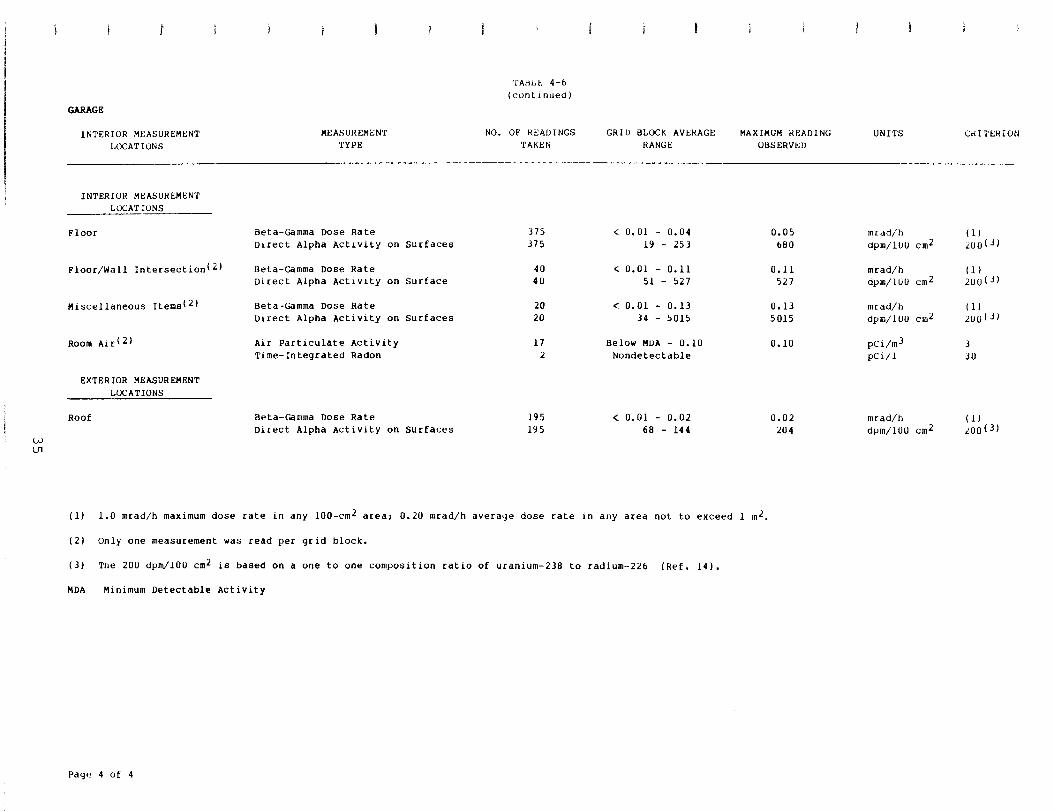
Alpha surface measurement averages ranged from 0 to 40,256 dpm/lOO cm2 (Table 4-6). The remedial action criterion for this equilibrium mixture of uranium-238 and radium-226 is 200 dpm/lOO cm2 (Table 4-6). Approximately 90 percent of the interior alpha surface measurements exceeded this limit.
Radon flux measurements were also taken on the floor and walls.
--
Measurement results ranged from 0.42 to 168 pCi/mz/s. The DOE criterion is 20 pCi/m2/s (Ref. 13).
Exterior beta-gamma dose rates and alpha surface measurements were taken on the walls, roof, and dock. Approximately 90 percent of the exterior alpha surface contamination measurements exceeded the DOE criterion (200 dpm/lOO cm2). The exterior grid block averages for
2 alpha surface measurements ranged from 17 to 18,887 dpm/lOO cm . Beta-gamma dose rate averages per grid block ranged from less than 0.01 to 0.84 mrad/h, with a maximum reading of 4.17 mrad/h.
Smear samples were collected from 280 locations on surfaces that exhibited radiation levels in excess of DOE criteria. Results from these samples indicated that removable activity was less than 20 dpm alpha and less than 70 dpm beta, both of which are below criteria (40 dmp/lOO cm2 2 and 1,000 dpm/lOO cm , respectively).
4.2.2 Boiler House
The Boiler House is a one-story building. It was surveyed in the same manner as the Process Building.
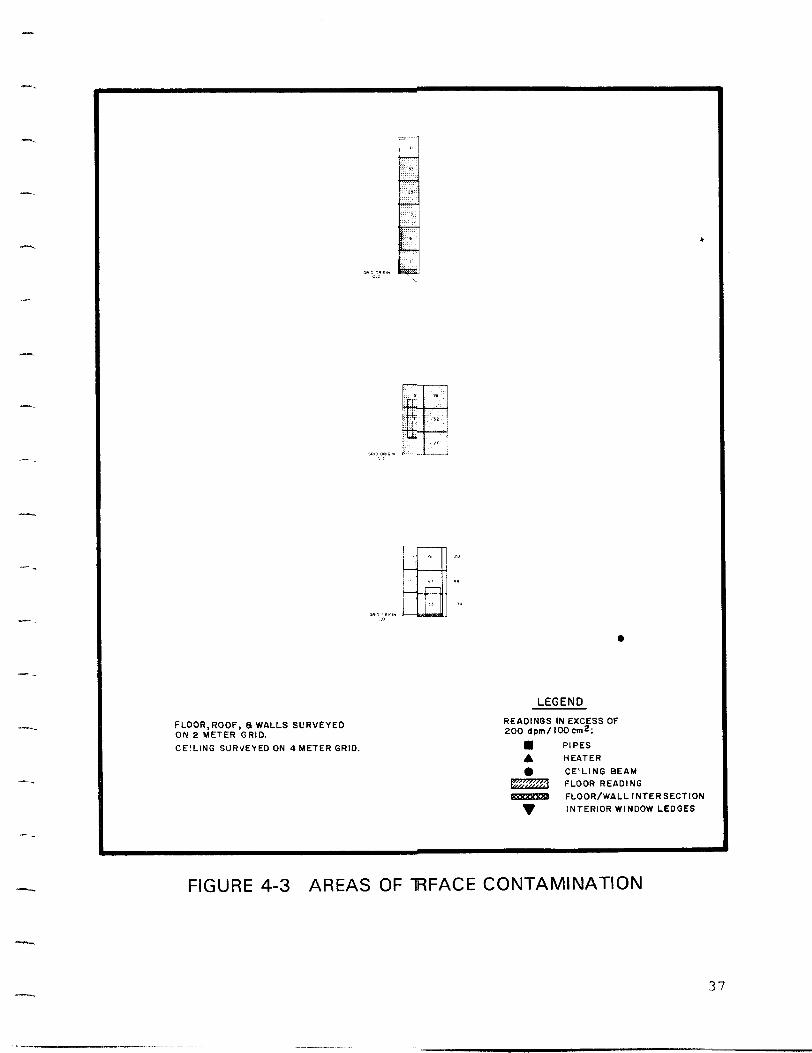
The floors showed beta-gamma dose rate averages per grid block below the DOE criterion of 1.0 mrad/h. Alpha measurement averages per grid block ranged from 78 to 279 dpm/lOO cm2 with a maximum
2 reading of 476 dpm/lOO cm . Areas of alpha surface contamination in excess of the DOE limit are shown in Figure 4-3.
36
. “ I _
.- I
‘V
,-
T ”
. +
5 1 ) 1 1 _ r , 6 1 * , , O
F L O O t? , R O O F , F I W A L L S S U R V E Y E D O N 2 M E T E R G R ID.
C E ! L I N G S c l R V E Y E D O N 4 M E T E R G R ID.
.
L E - l E A D I N G S !O O d p n /
l A
&
v
G E N D
I N E X C E S S O F i O O c m 2 :
P I P E S
H E A T E R
C E I L I N G B E A M F L O O R R E A D I N G
F L O O R /W A L L I N T E R S E C T IO N
I N T E R IO R W I N D O W L E D G E S
F IG U R E 4 -3 A R E A S O F 7 F tF A C E C O N T A M IN A T IO N
-.
3 7
W-..
C
-
Radon flux measurements were taken on the floor and walls. Measurement results ranged from 0.60 to 8.93 pCi/m*/s. All samples were below the DOE criterion.
Beta-gamma and alpha measurements were made at the floor/wall intersection. Measurements for beta-gamma radiation were all below the DOE criterion. Alpha surface contam ination measurement averages
per grid block ranged from 34 to 442 dpm/lOO cm*. Areas where these exceeded the DOE lim it are shown in Figure 4-3.
Beta-gamma dose rate measurements were taken on the interior walls. All readings were below the dose rate criterion.
The interior wall alpha measurement averages per grid block ranged from 54 to 364 dpm/lOO cm* with a maximum reading of 612 dpm/lOO cm*. Areas of alpha contam ination in excess of the DOE lim it are shown in Figure 4-3.
Alpha measurement averages on interior window ledges ranged from 17 to 799 dpm/lOO cm*. Beta-gamma dose rates were below the criterion.
Beta-gamma and alpha measurements were taken on three exterior walls, but the west wall was not accessible for survey measurements. Beta-gamma dose rates were all below the DOE criterion. Alpha measurement averages per grid block ranged from 146 to 4,482 dpm/lOO cm* with a maximum reading of 6,494 dpm/lOO cm*. Alpha contam ination exceeded the criterion on all exterior walls.
The roof grid is also shown in Figure 4-3. Beta-gamma dose rates measured there were all below the criterion. Alpha surface measurement averages per grid block ranged from 51 to 153 dpm/lOO cm* 2 with a maximum reading of 272 dpm/lOO cm . Areas where readings in excess of the criterion were observed are shown on Figure 4-3.
38

_- .
_ I .
- .
,--
-
,-
B e ta - g a m m a a n d a l p h a m e a s u r e m e n ts w e r e ta k e n o n ce i l ing b e a m s , h e a ters, a n d inter ior p ipes a n d l ight f ixtures. B e ta - g a m m a d o s e rates w e r e al l b e l o w th e D O E cr i ter ion. A l p h a sur face m e a s u r e m e n ts
2 r a n g e d f rom 3 4 to 5 ,0 4 9 d p m /lO O c m . A reas o f a l p h a c o n ta m i n a tio n in excess o f th e cr i ter ion a re s 'nown in F igure 4-3.
S m e a r samp les w e r e co l lec ted f rom 2 3 locat ions o n sur faces th a t exh ib i ted rad ia t ion leve ls in excess o f cri teria. Resul ts ind ica ted th a t r e m o v a b l e activity w a s less th a n 3 d p m a l p h a a n d less th a n 7 d p m b e ta , b o th o f wh ich a re b e l o w the i r respect ive cri teria.
4 .2 .3 A d m inistrat ion Bu i ld ing
A survey gr id w a s es tab l i shed o n th e floo r a n d roof o f th e s ingle-story A d m inistrat ion Bu i ld ing : th e wal ls w e r e s c a n n e d a n d randomly s p o t surveyed. T h e s e m e a s u r e m e n ts w e r e re fe renced to th e floo r gr id.
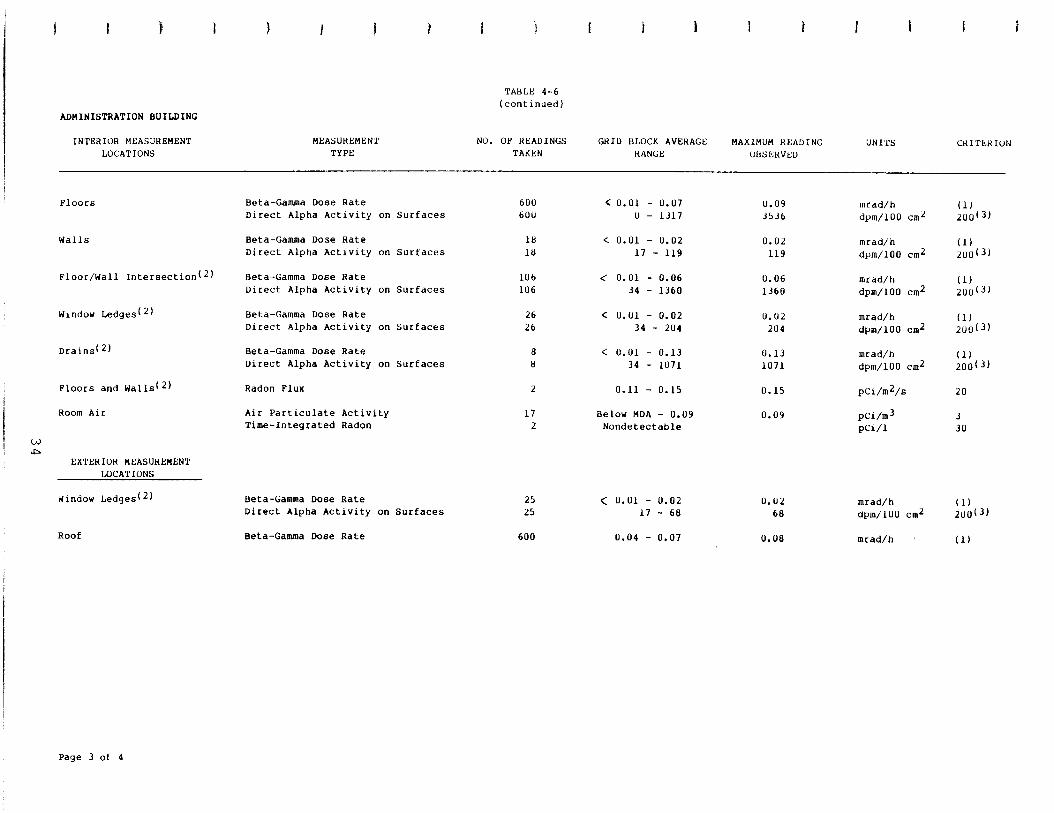
T h e floo r w a s su rveyed fo r b e ta - g a m m a d o s e rates a n d a l p h a c o n ta m i n a tio n . B e ta - g a m m a d o s e rate m e a s u r e m e n ts w e r e al l be lovJ th e cr i ter ion. A l p h a ave rages pe r gr id b lock r a n g e d f rom 0 to 1 ,3 1 7 d p m /lO O cm*, 2 wi th a m a x i m u m read ing o f 3 ,5 3 6 d p m /lO O c m . A reas w h e r e read ings e x c e e d e d th e cr i ter ion a re s h o w n in F igure 4-4.
T w o r a d o n flux m e a s u r e m e n ts w e r e ta k e n o n th e floo r a n d in th e pit
a r e a b e n e a th th e foyer . T h e resul ts w e r e 0 .1 1 a n d 0 .1 5 pCi /mL/s, respect ively.
B e ta - g a m m a d o s e rates a n d a l p h a sur face m e a s u r e m e n ts w e r e ta k e n a t th e floor /wal l intersect ion. A ll b e ta - g a m m a d o s e rates w e r e b e l o w th e cr i ter ion. A l p h a sur face m e a s u r e m e n ts r a n g e d f rom 3 4 to 1 ,3 6 0 d p m /lO O cm*. A reas w h e r e read ings e x c e e d e d th e cr i ter ion a re s h o w n in F igure 4-4.
T h e inter ior wal ls w e r e s c a n n e d a n d randomly s p o t surveyed. Resul ts
w e r e b e l o w th e cr i ter ia fo r b o th b e ta - g a m m a a n d a l p h a m e a s u r e m e n ts.
3 9 -_.. _-. --_.

‘---I ‘4 ‘1 ~~~ e
i rs,D Ol)iG,h j -m O.”
---n
ill,~O~,O,* ,?.t.l
..c
FLOOR, ROOF, BWALLS SURVEYED ON 2 METER GRID.
CEILING SURiJEYEO ON 4 METER GRID.
LEGEND
RE ADINGS IN EXCESS OF 200 dpm/lOOcm2:
FtTzz3 FLOOR READING
w FLOOR/WALL INTERSECTION X DRAIN
m INTERIOR WINDOW LEDGE
40
FIGURE 4-4 AREAS OF THE FOI-IA SURFACE CONTAMINATION
a
. -_.-

. i
- .
. . -
, -
,-
. u
T h e ro o f g ri d i s a l s o s h o w n i n F i g u re 4 -4 . B e ta -g a m m a m e a s u re m e n ts w e re a l l b e l o ,& th e c ri te ri o n . A l p h a m e a s u re m e n ts w e re n o t m a d e o n th e ro o f.
B e ta -g a m m a a n d a l p h a m e a s u re m e n ts w e re m a d e o n th e d ra i n s l o c a te d
i n s i d e . A l l b e ta -g a m m a d o s e ra te s w e re b e l o .& th e c ri te ri o n . T h e 2 m a x i m u m a l p h a s u rfa c e m e a s u re m e n t w a s 1 ,0 7 1 d p m /l O O c m . F i g u re
4 -4 s h o w s th e l o c a ti o n o f th i s d ra i n .
S m e a r s a m p l e s w e re c o l l e c te d fro m 2 2 l o c a ti o n s o n b u i l d i n g s u rfa c e s th a t e x h i b i te d ra d i a ti o n l e v e l s i n e x c e s s o f c ri te ri a . R e s u l ts i n d i c a te d th a t re m o v a b l e a c ti v i ty o n th e s e s u rfa c e s w a s l e s s t' n a n 2 d p m a l p h a a n d l e s s th a n 1 4 d p m b e ta , b o th o f w h i c h a re b e l o w th e i r re s p e c ti v e c ri te ri a .
4 .2 .4 G a ra s e
A s u rv e y g ri d w a s e s ta b l i s h e d o n th e fl o o r a n d ro o f o f th e G a ra g e . T h e w a l l s w e re n o t g ri d d e d a n d s u rv e y e d s i n c e p re l i m i n a ry s c a n s u rv e y m e a s u re m e n ts i n d i c a te d n o e l e v a te d re a d i n g s fo r b e ta -g a m m a o r a l p h a c o n ta m i n a ti o n .
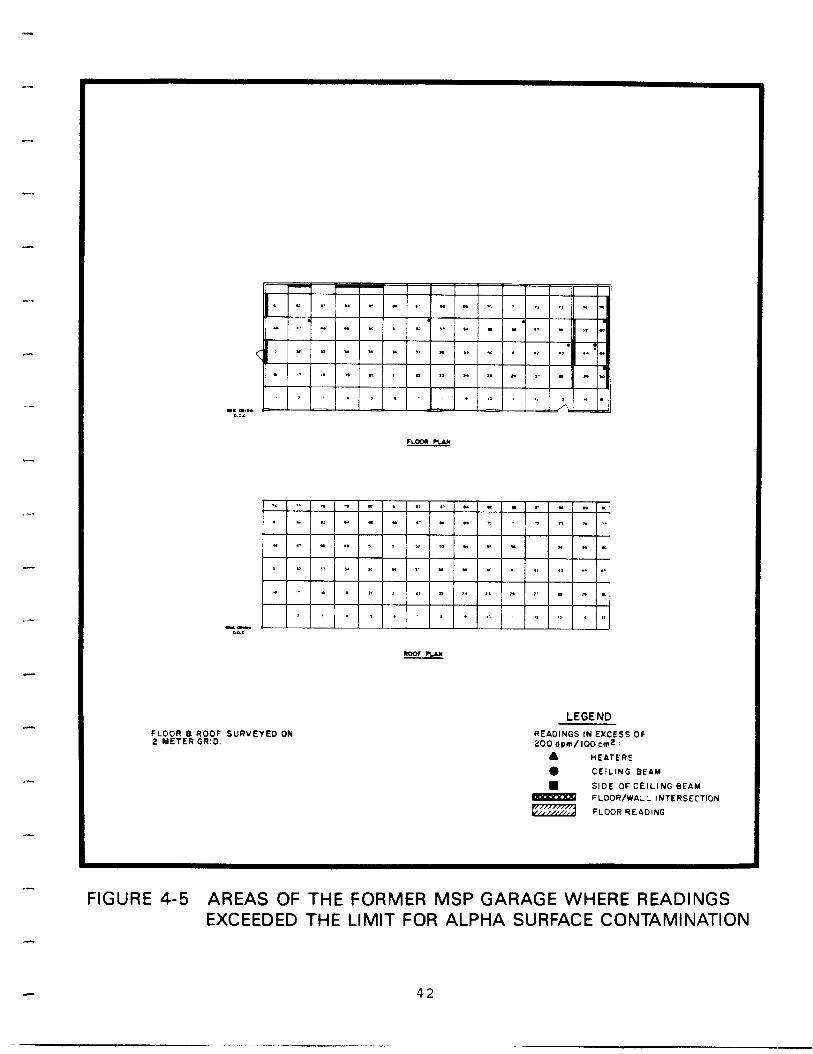
T h e fl o o r w a s s u rv e y e d fo r b o th b e ta -g a m m a a n d a l p h a c o n ta m i n a ti o n . B e ta -g a m m a d o s e ra te a v e ra g e s p e r g ri d b l o c k ra n g e d fro m l e s s th a n 0 .0 1 to 0 .0 4 m ra d /h , w i th a m a x i m u m re a d i n g o f 0 .0 5 m ra d /h . A l l re a d i n g s w e re b e l o w th e D O E c ri te ri o n . A l p h a s u rfa c e m e a s u re m e n t a v e ra g e s p e r g ri d b l o c k ra n g e d fro m 1 9 to 2 5 3 d p m /l O O c m 2 w i th a
2 m a x i m u m re a d i n g o f 6 8 0 d p m /l O O c m . A re a s w h e re re a d i n g s e x c e e d e d th e l i m i t a re s h o w n i n F i g u re 4 -5 .
B e ta -g a m m a a n d a l p h a m e a s u re m e n ts w e re ta k e n a t th e fl o o r/w a l l i n te rs e c ti o n . A l l b e ta -g a m m a d o s e ra te s w e re b e l o w th e c ri te ri o n .
2 A l p h a m e a s u re m e n ts m a x i m u m re a d i n g w a s 5 2 7 d p m /l O O c m . A re a s w h e re re a d i n g s e x c e e d e d th e c ri te ri o n a re s h o w n i n F i g u re 4 -5 .
.“ . .m
_ . _-- . - . .
4 1
FLOOR a ROOF SURVEYED 0N 2 METER GR!D.
LEGEND READINGS IN EXCESS OF 200 dbun/lOO cm2 :
A HEATERS
0 CEILING BEAM
l SIDE OF CEILING BEAM
FLOOR/WALL INTERSECTION
fLOOR READING
FIGURE 4-5 AREAS OF THE FORMER MSP GARAGE WHERE READINGS EXCEEDED THE LIMIT FOR ALPHA SURFACE CONTAMINATION
42
.- _I ---__.

The roof grid is also shown in Figure 4-5. All beta-gamma dose rate measurements there were below the criterion. Alpha surface measurement averages per grid block ranged from 68 to 144 dpm/lOO cm2 2 with a maximum reading of 204 dpm/lOO cm . Areas where readings exceeded the criterion are shown in Figure 4-5.
Beta-gamma dose rates and alpha measurements were taken inside on
window ledges, ceiling beams, and heaters. All beta-gamma dose rate measurements were below the criterion. The maximum alpha surface
2 measurement was 5,015 dpm/l08 cm . These measurements are referenced to the floor grid, and areas where measurements exceeded the criterion are shown in Figure 4-5.
Smear samples were collected from 10 locations on building and equipment surfaces that exhibited radiation levels in excess of criteria. Results indicated that removable activity on building surfaces was less than 4 dpm alpha and less than 14 dpm beta, both of -which are below their respective criteria. Low-level removable cativity was found on two heaters in the Garage. The maximum alpha and beta activities on these heaters were 27 dpm and 95 dpm, respectively.
^1
43

.-
5.0 SIGNIFICANCE OF FINDINGS
5.1 FIELD SURVEY
I-
*-
Results from near-surface gamma measurements were used to determine
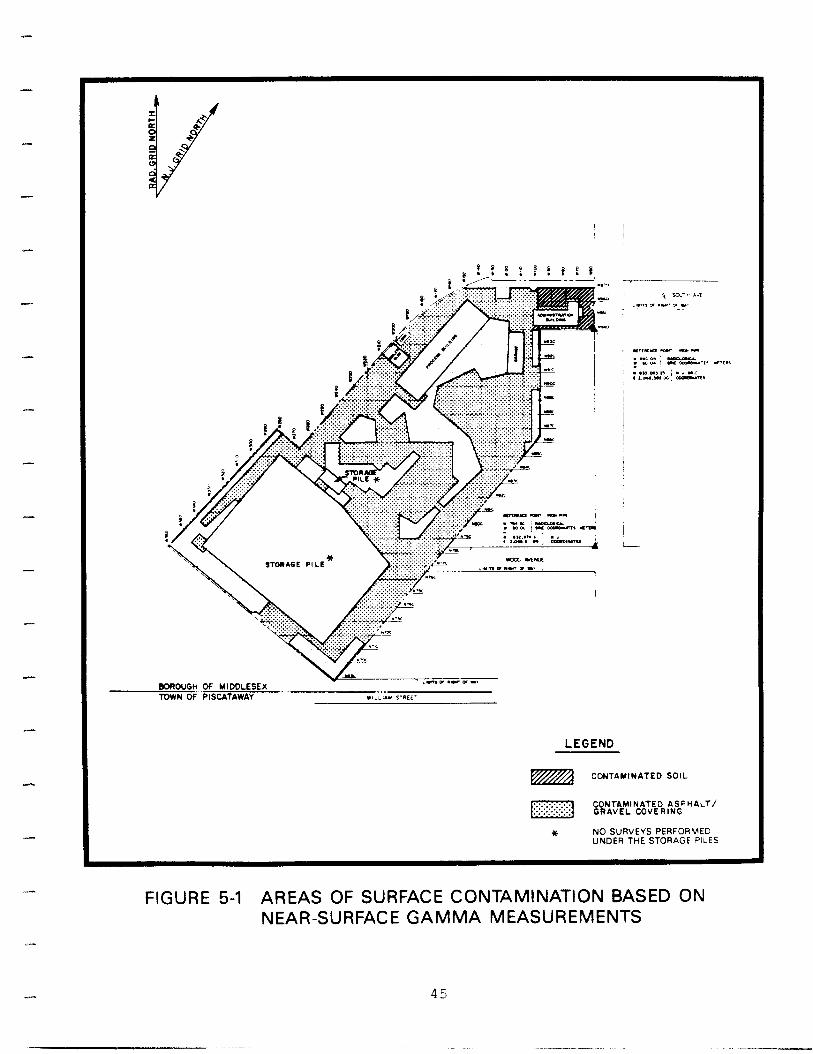
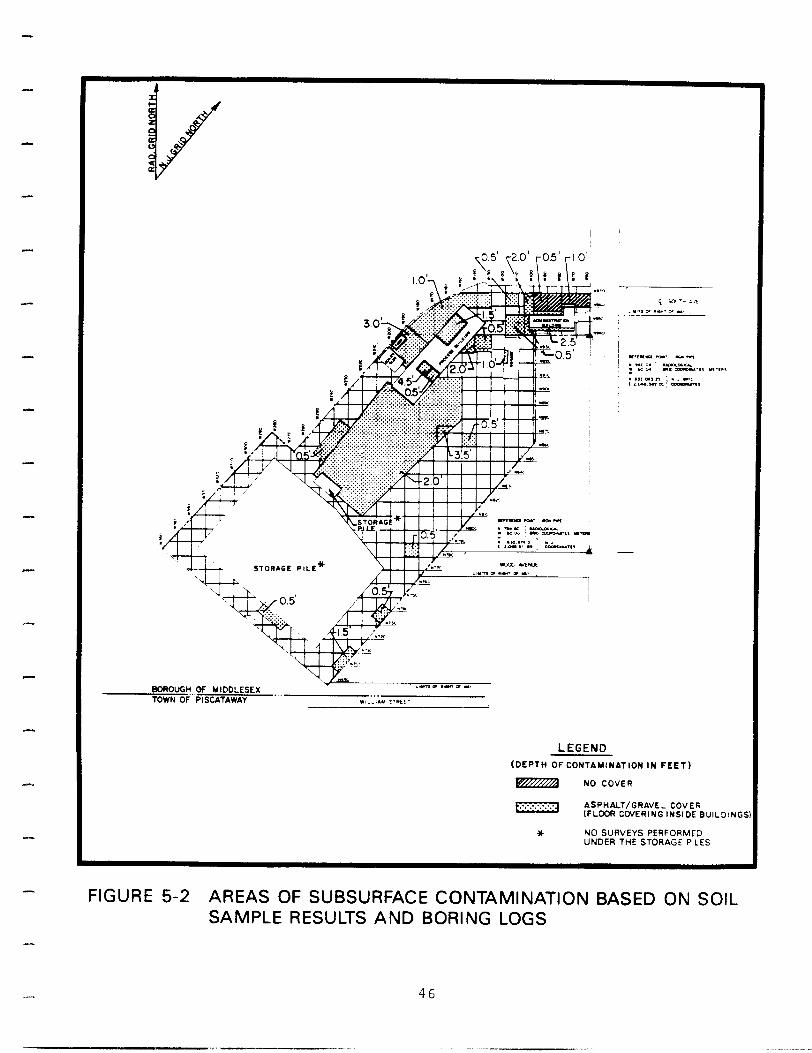
the extent of surface contamination; logs of borehole gamma readings and results of soil samples obtained from borings were used to determine the depth of contamination. These data were plotted on a site grid drawing to determine the area1 extent of contamination. For uranium-238, the remedial action guideline is 150 pCi/g. For radium-226, the extent of contamination was determined based on the limit of 15 pCi/g when averaged over 15-cm (6-in.) thick soil layers more than 15 cm (6 in.) below the surface and less than 1.5 m (5 ft) below the surface (Table 4-l). The results of these determinations are shown in Figures 5-l and 5-2. In situ gamma measurements indicate contamination in the first 15 cm (6 in.) of ground cover. Based on the thickness of the asphalt and the comparatively limited extent of subsurface contamination, the asphalt/gravel covering is contaminated to levels in excess of guidelines.
One water sample collected from an on-site borehole indicated an uranium-238 concentration of 1,288 pCi/l and a radium-226 concentration of 71 pCi/l. These concentrations exceed DOE criteria for unrestricted areas: 600 pCi/l for total uranium and 30 pCi/l for radium-226.
The maximum external gamma radiation measured at 1 m (3 ft) above the ground was 371 uR/h and the maximum beta-gamma dose rate at the surface was 7.25 mrad/h. Elevated concentrations of radium-226 and uranium-238 were found in surface and subsurface soils. Maximum concentrations were 735 pCi/g of radium-226 and 961 pCi/g of uranium-238.
..-- 44
-. .- .-_.. ----_
--II-* , .79.1 ‘-.A . sow ;-o-m,,-
STGRAGE PILE
BOROUGbt,OF MIDDLESEX ,,, TOWN OF PISCATAWAY
‘ so.-- L.T L1”lll OI .m.. CN “.
/ .rlLCl .c.c 0r.t
:a::; - / -
LT -*c “VI.3 , . .,,m,n :. d “I
I t.DU.YIOC, WT.
LEGEND
CC+JTAHINATED SOIL
CONTAMINATED ASPHALT/ GRAVEL COVERING
+ NO SURVEYS PERFORMED UNDER THE STORAGE PILES
FIGURE 5-l AREAS OF SURFACE CONTAMINATION BASED ON NEAR-SURFACE GAMMA MEASUREMENTS
45
.-
!Jj-y ..z.ti+ ..:.:.:.:.:. . . . . . :-‘.‘..i_._
.w ,
: ..2.“‘, . ., c ,Da.’ n ConoIYIU
5 u.-- t.4 .‘.I,, r .L. 1 “1
1 :‘::l.z.r 1u.m
: eda. FszY?zz-., “I.(.% .a,,m>n ;..,.: I IDu.IRoc. -77,
BOAOUGH,.GF MIDDLESEX ._, .m, OI .mn m -7
TDWN OF PISCATAWAY . . .
II..i.Y I’WT-
LEGEND (DEPTH OF CONTAMINATION IN FEET)
NO COVER
B ASPHALT/GRAVEL COVER (FLOOR CDVERING INSIDE BUILDINGS
* NO SURVEYS PERFORMED UNDER THE STORAGE PILES
FIGURE 5-2 AREAS OF SUBSURFACE CONTAMINATION BASED ON SOIL SAMPLE RESULTS AND BORING LOGS
46
,-
I-
I_..”
“-
,--
,,,w
To comply with guidelines, approximately 13,000 m3 (17,000 yd3) of contaminated asphalt/gravel and soil will have to be removed from the grounds in addition to the 27,500 m 3 (36,000 yd3) already in
the storage piles and the approximately 25,000 m 3 (33,000 yd3) of contaminated material to be transferred from the Middlesex Municipal Landfill.
5.2 BUILDING SURVEYS
During the comprehensive decontamination effort carried out at the former Sampling Plant in 1966-67 all removable surface contamination was cleaned using a variety of techniques such as vacuuming, sand blasting, and washing. Thereafter DOE (then AEC) certified that the residual radiation levels were within existing cleanup guidelines. The remaining radioactivity on above-grade building surfaces was believed to be firmly imbedded. The results of the present radiological characterization tend to support this conclusion since no removable radioactivity in excess of the current DOE criteria was found. Consequently, major demolition techniques will be required to remove existing residual radioactivity from building surfaces. The major portion of the rubble will result from the demolition of the Boiler House and the Process Building. Removal of surface contamination in several isolated areas of the Garage and Administration Building will be required. It is estimated that 3650 m3 (4775 yd3) of rubble will be generated from decontamination of the four buildings. Results of the radiological surveys conducted in the four buildings are presented in Table 4-6.
5.2.1 Process Building
Approximately ninety percent of all alpha measurements taken on the interior and exterior surfaces of the Process Building exceeded the criterion for surface contamination. The maximum reading observed was 40,256 dpm/lOO cm2. The maximum beta-gamma dose rate observed was 1.43 mrad/h.
“C
j-
“-
--
e -
-
*-
T h e m a x i m u m r a d o n flux m e a s u r e m e n t w a s 1 6 8 pCi /m2/s; th a t fo r time- in tegra ted r a d o n w a s 3 .5 4 pCi/ l .
S u b s u r fa c e soi l samp les f rom bo reho les dr i l led th r o u g h th e first floo r ind ica ted c o n ta m i n a te d soi ls a t a d e p th o f 1 .4 m (4.5 ft). Th is d e p th co r responds to th e or ig ina l g r a d e pr ior to insta l lat ion o f a concre te floo r in th e bu i ld ing. A n es t imated 1 9 m 3 (25 yd3) o f soi l m u s t b e r e m o v e d to comp ly wi th gu ide l ines .
5 .2 .2 Bo i le r H o u s e
R e a d i n g s f rom inter ior floors, wal ls, a n d th e floor /wal l in tersect ions ind ica ted a l p h a c o n ta m i n a tio n in excess o f th e cr i ter ion in p a tchy areas, as s h o w n in F igure 4-3. T h e m a x i m u m
2 inter ior a l p h a sur face m e a s u r e m e n t obse rved w a s 7 9 9 d p m /lO O c m . A ll b e ta - g a m m a d o s e rate m e a s u r e m e n ts w e r e b e l o w th e cr i ter ion.
M isce l laneous m e a s u r e m e n ts ta k e n o n ins ide h e a ters, p ipes, a n d b e a m s s h o w e d s o m e a l p h a c o n ta m i n a tio n wi th a m a x i m u m read ing o f 5 ,0 4 9 d p m /lO O c m 2 .
T h e m a x i m u m r a d o n flux m e a s u r e m e n t w a s 8 .9 3 pCi /m2/s; th a t fo r time- in tegra ted r a d o n w a s 0 .5 3 pCi/ l .
Th ree exter ior wal ls w e r e su rveyed - th e w e s t exter ior wal l w a s n o t access ib le - a n d a b o u t n i n e ty p e r c e n t o f a l l a l p h a m e a s u r e m e n ts e x c e e d e d th e cr i ter ion. T h e m a x i m u m a l p h a sur face
2 m e a s u r e m e n t w a s 6 ,4 9 4 d p m /lO O c m . A ll b e ta - g a m m a d o s e rates ta k e n o n th e exter ior wal ls w e r e b e l o w th e cr i ter ion.
T h e roof s h o w e d s p o tty c o n ta m i n a tio n ; th e m a x i m u m m e a s u r e m e n t fo r a l p h a sur face c o n ta m i n a tio n w a s 2 7 2 d p m /lO O c m .
B a s e d o n subsur face soi l samp les a n d g a m m a logs, th e c o n ta m i n a tio n in th e soi l u n d e r th e Bo i le r H o u s e is b e l o w gu ide l ines .
4 8
. Y . . m
,-
--
..-
-
(.“..
-
I,-
5 .2 .3 A d m inistrat ion Bu i ld ing
In ter ior m e a s u r e m e n ts w e r e ta k e n o n th e floor , a t th e floor /wal l
intersect ions, o n th e dra ins, a n d a t r a n d o m locat ions o n th e wal ls. T h e m a x i m u m a l p h a sur face m e a s u r e m e n t obse rved w a s 3 ,5 3 6 d p m /lO O c m 2 . A ll b e ta - g a m m a d o s e rate m e a s u r e m e n ts w e r e b e l o w th e cr i ter ion.
T h e m a x i m u m r a d o n flux m e a s u r e m e n t w a s 0 .1 5 pCi /m2/s; time- in tegra ted r a d o n w a s n o n d e tectable.
E x ter ior b e ta - g a m m a d o s e rate m e a s u r e m e n ts w e r e ta k e n o n th e roof: a l l read ings w e r e b e l o w th e cr i ter ion.
A fe w a reas o f e leva ted a l p h a read ings w e r e fo u n d a n d wi l l requ i re h o t s p o t d e c o n ta m i n a tio n . T h e s e a reas a re ind ica ted o n F igure 4-4.
5 .2 .4 G a r a g e
In ter ior m e a s u r e m e n ts w e r e ta k e n o n th e floors, a t th e floor /wal l intersect ions, a n d o n m isce l laneous ite m s ins ide th e G a r a g e . T n e
2 m a x i m u m a l p h a leve l w a s 5 ,0 1 5 d p m /lO O c m , obse rved o n a h e a ter. A ll in ter ior b e ta - g a m m a d o s e rates w e r e b e l o w th e cr i ter ion.
R a d o n flux d a ta w a s lost du r ing process ing. T ime- in tegra ted r a d o n w a s n o n d e tectable.
E x ter ior m e a s u r e m e n ts w e r e ta k e n o n th e roof. E leva ted a l p h a re 'ad ings w e r e obse rved in two a reas as s h o w n o n F igure 4-5. T h e
2 m a x i m u m m e a s u r e m e n t obse rved w a s 2 0 4 d p m /lO O c m .
Severa l a reas o f e leva ted read ings w e r e fo u n d a n d wi l l requ i re h o t s p o t d e c o n ta m i n a tio n . A reas w h e r e read ings e x c e e d e d cr i ter ia a re s h o w n in F igure 4-5.
4 9 - _ _ _ _ _ _ _ - -...- ----

REFERENCES
I-
(I-
l. U.S. Department of Energy. A Background Report for the Formerly Utilized MED/AEC Sites Program, DOE/EV-0097, September 1980.
2. Memorandum, F. P. Baronowski to R. E. Hollingsworth. " AEC Storage Facility at Middlesex, N.J.", April 6, 1965.
3. Memorandum, S. R. Sapirie, Mgr ORO-USAEC, to F. P. Baronowski. "Disposal of AEC Storage Site at Middlesex, N.J. and St. Louis Airport Storage Site," August 13, 1964.
4. Memorandum, S. R. Sapirie, Mgr OR0 USAEC, to F. P. Baronowski, Air Production Division USAEC Headquarters. “Status Report on Middlesex Decontamination Program," August 12, 1966.
5. Memorandum, S. R. Sapirie, Mgr OR0 USAEC, to F. P. Baronowski, Air Production Division USAEC Headquarters. "Transmittal of Study on Disposal of AEC Facility at Middlesex, New Jersey," September 17, 1965.
6. Isotopes, Inc. Decontamination of Middlesex Sampling Plant under USAEC Contract Number AT (40-l)-3637 from March 6, 1967 through June 30, 1967, Undated.
7. U.S. Department of Energy. Radiological Survey of the Middlesex Sampling Plant, Middlesex, New Jersey, DOE/EV-0005/l, Oak Ridge, TN, November, 1977.
8. Bechtel National, Inc. Final Report on Phase II Remedial Action at the Former Middlesex Sampling Plant and Associated Properties, Draft, Oak Ridge, TN, September 1984.
9. Bechtel National, Inc. Radiological Protection Program, Oak Ridge, TN, revised October 9, 1984.
50

.-
.“-
<I
. l l ,
-
,-
10. Oak Ridge National Laboratory. Procedures Manual for the ORNL Remedial Action Survey and Certification Activities (RASCA) Program, Oak Ridge, TN, September 1982.
11. Oak Ridge National Laboratory. State Background Radiation Levels: Results of Measurements Taken During 1975-1979, ORNL/TM-7343, Oak Ridge, TN, November 1981.
12. U.S. Department of Energy. Order 5480,1A, "Environmental Protection, Safety, and Health Protection Program for DOE Operations," Washington, DC, 1982.
13. Letter, E. L. Keller to R. L. Rudolph. "Comments on the Radiological Survey Report for the Former Middlesex Sampling Plant, Middlesex, New Jersey and the Draft Radiological Survey Report for the DuPont Chambers Works Plant, Deepwater, New Jersey," September 11, 1984.
14. U.S. Department of Energy. Radiological Guidelines for Application to DOE's Formerly Utilized Sites Remedial Action Program, ORO-831, Oak Ridge, TN, March 1983.
51