rafael c. nunez - gonzalo r. arce department of electrical and computer engineering university of...
Post on 22-Dec-2015
214 views
TRANSCRIPT

Rafael C. Nunez - Gonzalo R. Arce
Department of Electrical and Computer EngineeringUniversity of Delaware
May 19th, 2005
Diffusion Marking Mechanisms for Active
Queue Management

2
TCP Congestion Control
TCP controls congestion at end points (AIMD)

3
Dropping Packets in the Router’s Queue Tail Dropping Problems:
Penalizes bursty traffic Discriminates against
large propagation delay connections.
Global synchronization. Solution: Active Queue
Management (AQM).0 2 4 6 8 10 12 14 16 18 20
0
10
20
30
40
50
60
70
80
90
100Instantaneous Queue Size - Drop Tail
Time (seconds)
Que
ue (
Pac
kets
)

4
Active Queue Management
Router becomes active in congestion control.
Random Early Detection (Floyd and Jacobson, 1993).
0 2 4 6 8 10 12 14 16 18 200
10
20
30
40
50
60
70
80
90
100Queue Behavior in RED
Time (seconds)
Que
ue (
Pac
kets
)
Instantaneous QueueAverage Queue
0 2 4 6 8 10 12 14 16 18 200
10
20
30
40
50
60
70
80
90
100Queue Behavior in Drop Tail
Time (seconds)
Que
ue (
Pac
kets
)
REDDrop Tail(Not AQM)

5
Random Early Detection (RED)
Drop probability based on average queue:
q n6@
= 1- wq
_ i$q n - 1
6 @+wq$q n
6@
Four parameters: qmin , qmax, Pmax, wq Overparameterized
ECN marking

6
Queue Behavior in RED 20 new flows every 20 seconds qmin = 20, qmax = 40
Wq = 0.01 Wq = 0.001
0 10 20 30 40 50 60 70 80 90 1000
10
20
30
40
50
60
70
80Queue Behavior in RED
Time (seconds)
Que
ue (
Pac
kets
)
Instantaneous QueueAverage Queue
0 10 20 30 40 50 60 70 80 90 1000
10
20
30
40
50
60
70
80
90
100Queue Behavior in RED
Time (seconds)
Que
ue (
Pac
kets
)
Instantaneous QueueAverage Queue

7
Extensive Research in AQM
Adaptive RED, REM, GREEN, BLUE,… Problems:
Over-parameterization Not easy to implement in routers Not much better performance than drop
tail We introduce a statistical approach

8
Diffusion Marking Mechanisms Three components in AQM algorithms:
Drop Probability Function Packet Dropping Scheme (Quantizer) Packet Selection Algorithm (Not exploited
yet)
Diffusion Marking
DropProbabilityFunction
PacketDroppingScheme

9
Defining a New Packet Dropping Scheme with Error Diffusion Packet marking is analogous to
quantization: convert a continuous gray-scale image into black or white dots.
Error diffusion: The error between input (continuous) and output (quantized) is diffused in subsequent outputs.
Diffusion Marking
DropProbabilityFunction
PacketDroppingScheme

10
Packet Marking in DM D(n) is a quantized representation of P(n)
Acumulated Error Feedback model Condition for stability
Diffusion Marking
DropProbabilityFunction
PacketDroppingScheme

11
Error Diffusion vs. Random Drops
80 85 90 95 1000
123
Time (Seconds)
Error Diffusion0
123
Random drops
Dro
ps
80 85 90 95 1000
100
200
Time (Seconds)
Error Diffusion0
100
200Random Drops
Que
ue O
ccup
ancy
rate = 0.0001rate = 0.0003
rate = 0.001rate = 0.003
rate = 0.01
100
101
10210
-1
100
101
102
103
104
105
106
number of flows
vari
ance
que
ue o
ccup
ancy
Probabilistic = dashed Error diffusion = solid
Diffusion Marking
DropProbabilityFunction
PacketDroppingScheme

12
Probability of Marking a Packet
Gentle RED function closely follows:
P [n] / P (qn) = Sqncma
(A)
Diffusion Marking
DropProbabilityFunction
PacketDroppingScheme

13
Evolution of the Congestion Window
TCP in steady state:
PacketsBetweenDrops= 83W2
p1 = 8
3W2
(B)
Diffusion Marking
DropProbabilityFunction
PacketDroppingScheme

14
Traffic in the Network
Congestion Window = Packets In The Pipe + Packets In The Queue
Or:
43W $N = MSS
B $RTT +qd(C)
From (A), (B), (C), and knowing that: RTT =D +q$ BMSS
P (q) = Sqcma
$N2
a =Log S
qd; E
Log 23: D
- 2 $Log MSSB $D +2 $qd
; D
where
Diffusion Marking
DropProbabilityFunction
PacketDroppingScheme

15
Probability Function
P (q) = Sqcma
$N2, if q>S$ N2̂h1/a
1 , otherwise
*
0 0.1 0.2 0.3 0.4 0.5 0.6 0.7 0.8 0.9 10
0.1
0.2
0.3
0.4
0.5
0.6
0.7
0.8
0.9
1P(Q/S, N)
Q/S
P(Q
/S,
N)
N = 1N = 5N = 10
Diffusion Marking
DropProbabilityFunction
PacketDroppingScheme
16
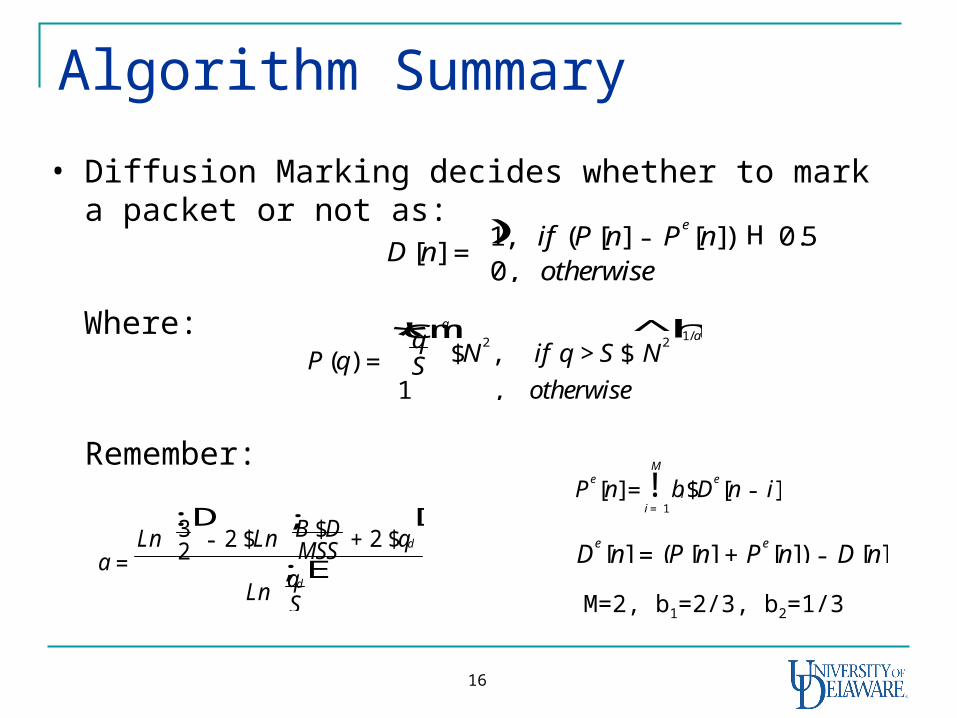
Algorithm Summary
D[n] =1, if (P [n] - Pe[n]) H 0.50, otherwise
)
P (q) = Sqcma
$N2, if q>S$ N2̂h1/a
1 , otherwise
*
a =Ln S
qd; E
Ln 23: D
- 2 $Ln MSSB $D +2 $qd
; D
• Diffusion Marking decides whether to mark a packet or not as:
Where:
Pe[n]= bi$De[n - i]
i = 1
M
!
De[n] =(P [n] +Pe[n]) - D[n]
M=2, b1=2/3, b2=1/3
Remember:

17
Optimizing the Control Mechanism
Adaptive Threshold Control Dynamic Detection of Active
Flows

18
Adaptive Threshold Control
Dynamic changes to the threshold improve the quality of the output.
D[n] =1, if (P [n] - Pe[n]) H 0.50, otherwise
)
D[n] =1, if (P [n] - Pe[n]) H k$P [n]0, otherwise
)
f(P [n]) =k$P [n]

19
Dynamic Detection of Active Flows DEM requires the number of active
flows
Effect of not-timed out flows and flows in timeout during less than RTT:

20
Dynamic Detection of Active Flows (cont’d) The number of packets:
The number of active flows:

21
Active Flows Estimate
150 200 250 300 350 40010
15
20
25
30
35Diffusion Early Marking - Flows Estimate
Time (seconds)
Num
ber of F
low
s
MeasuredDEM EstimatorSRED Estimator
40 60 80 100 120 140 160
4
6
8
10
12
14
16
18Diffusion Early Marking - Flows Estimate
Time (seconds)
Num
ber of F
low
s
MeasuredDEM EstimatorSRED Estimator

22
Results - Window Size
0 5 10 15 20 25 30 35 40 45 500
10
20
30
40
50
60
70
80
90
100RED: Congestion Window Size vs. Time (2 Flows)
Time (seconds)
Con
gest
ion
win
dow
siz
e (p
acke
ts)
Congestion Window 1Congestion Window 2Average Congestion Window 1Average Congestion Window 2
0 5 10 15 20 25 30 35 40 45 500
10
20
30
40
50
60
70
80
90
100Diffusion Early Marking: Congestion Window Size vs. Time (2 Flows)
Time (seconds)C
onge
stio
n w
indo
w s
ize
(pac
kets
)
Congestion Window 1Congestion Window 2Average Congestion Window 1Average Congestion Window 2
RED Diffusion Based
Larger congestion window more data!

23
Stability of the Queue
100 long lived connections (TCP/Reno, FTP) Desired queue size = 30 packets
0 2 4 6 8 10 12 14 16 18 200
10
20
30
40
50
60
70
80
90
100Queue Behavior in RED
Time (seconds)
Que
ue (
Pac
kets
)
Instantaneous QueueAverage Queue
0 2 4 6 8 10 12 14 16 18 200
10
20
30
40
50
60
70
80
90
100Diffusion Early Marking Queue
Time (seconds)
Que
ue (
Pac
kets
)
Instantaneous QueueAverage Queue
RED Diffusion Based

24
Changing the Number of Flows
20 new flows every 20 seconds
0 10 20 30 40 50 60 70 80 90 1000
10
20
30
40
50
60
70
80
90
100Queue Behavior in RED
Time (seconds)
Que
ue (
Pac
kets
)
Instantaneous QueueAverage Queue
0 10 20 30 40 50 60 70 80 90 1000
10
20
30
40
50
60
70
80
90
100Diffusion Early Marking Queue
Time (seconds)
Que
ue (
Pac
kets
)
Instantaneous QueueAverage Queue
RED Diffusion Based
25
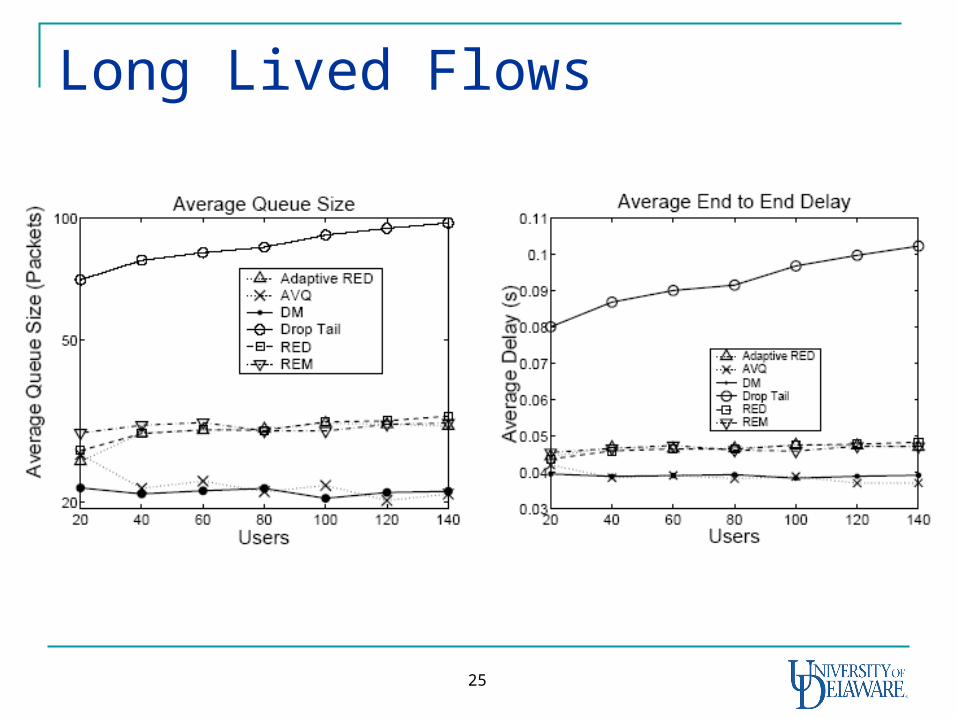
Long Lived Flows

26
Long Lived Flows (cont’d)

27
HTTP Flows
28
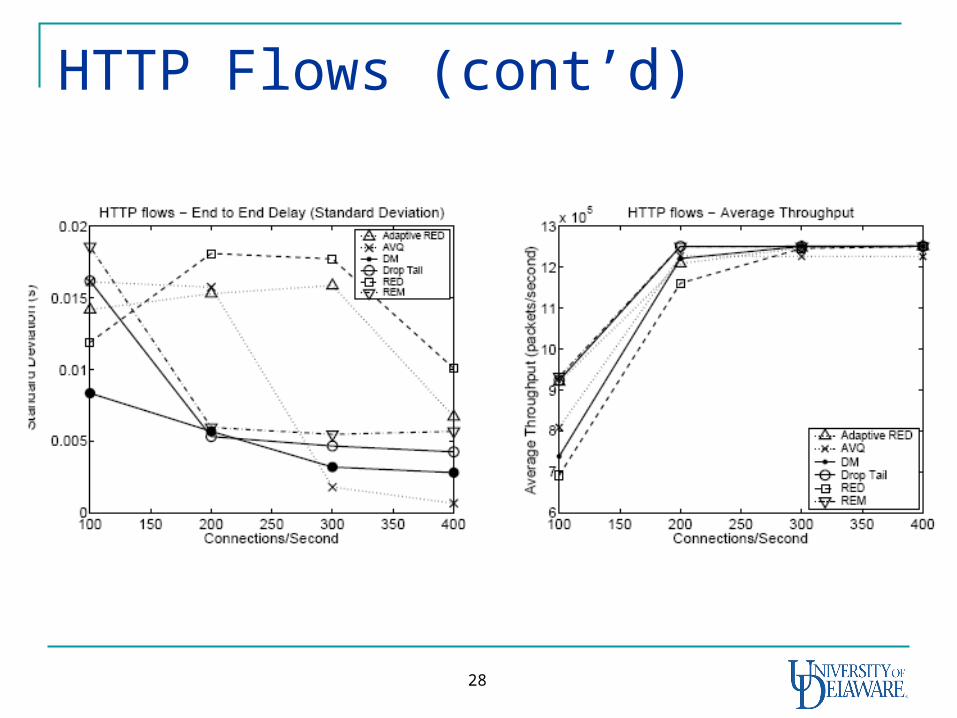
HTTP Flows (cont’d)

29
Evolution of DM DM has evolved to avoid the estimation of
network parameters (RTT, N). The new approach uses a maximum likelihood
ratio for congestion detection.
Queue Size Dropping Rate

30
Conclusions
Error Diffusion dithering can be used in AQM.
Advantages: Increased stability Simpler (only one parameter) Increased throughput
Current Work: Parameter optimization Additional traffic control applications Extension to wireless environments