rail rolling stock oatings growth - the chemquest · pdf file · 2015-05-18coatings...
TRANSCRIPT

by Aggie Lotz,The ChemQuest
Group, Inc.
MARKET ANALYSIS PREVIEW
In 2011, the American Coatings Association partnered with The ChemQuest Group, Inc., the global strategic management consulting firm, to prepare and update the ACA’s longstand-ing Market Analysis, covering the years 2010 to 2015. Continuing with this successful relationship, ChemQuest is currently preparing the ACA Industry Market Analysis, 9th Edition (2014–2019), sched-uled for release in July 2015. This article examines rail rolling stock applications—just one of the many market segments detailed in the publication.
INTRODUCTION
In rail rolling stock applications, heavy-duty protective coating systems are an important line of defense. According to car builders, lessors, and shippers, these coating systems protect railcars and locomotives from corrosion and chemical attack; in some cases, improve aesthetics; and ultimately extend the service life of railcar and locomotive fleets.
The category of rail rolling stock coatings com-prises protective coating systems for tank cars, intermodal freight transport containers and hopper cars, boxcars, auto-rack cars, flat-bed cars, and locomotives. Typical types of commodity freight include crude oil, petrochemical, plastic pellets, coal, cement, gravel, fracking materials, grains, sugar, and corn syrup. Thus, rail transportation serves diverse end-use markets, such as petroleum refining; chemi-cals and plastics; food and agricultural products; and mining, minerals, and aggregates.
In the previous iteration of ACA’s Industry Market Analysis, rail rolling stock was identified as one of two major end-use market segments of “other transportation finishes.” At the time of pub-lication in 2012 (based upon revised 2010 Census data) it was estimated that rail rolling stock repre-sented 47% of the volume (and 24% of the value) of other transportation finishes. Aircraft coatings made up 45% and 72% of volume and value, respectively. The remaining 4% to 8% of other transportation finishes accounted for decorative and protective coatings (based on powder coatings
Rail Rolling StockcoatingS gRowth
May 201526 COATINGSTECH
and e-coat) for miscellaneous specialized vehicles such as bicycles, motorcycles, golf carts, snow-mobiles, and all-terrain vehicles. The U.S. Census Bureau’s Current Industrial Report (CIR) program was the basis for the historical sub-segmentation of other transportation finishes, although its system of segmentation was not always conso-nant with the way in which the coatings industry segmented itself. (In fact, there are several other examples of the CIR program’s reporting that run counter to the way in which coatings marketers typically track their own target markets.)
In 2012, the U.S. Census Bureau termi-nated the collection of data for its CIR program. Consequently, the forthcoming ACA Industry Market Analysis, 9th Edition (2014–2019) will be the first such report produced in the absence of U.S. Census data. Instead of updating and refining the U.S. Census Bureau’s historical coatings volumes, values, and growth rates, the ChemQuest Group, Inc.—no longer constrained by the Census segmen-tation structure—will report on the basis of “real world” market information gleaned from knowl-edgeable market experts with whom ChemQuest has conducted in-depth primary interviews, ensur-ing that ACA’s 9th Edition will in effect be the only authoritative report on the composition and dynam-ics of the U.S. paint and coatings market.
In fact, the following megatrend was cited in primary interviews with value chain participants as the top contributing factor of rail rolling stock’s exponential growth since the publication of ACA’s last Market Analysis.
CRUDE OIL SUPPLY BOOM IN NORTH AMERICA
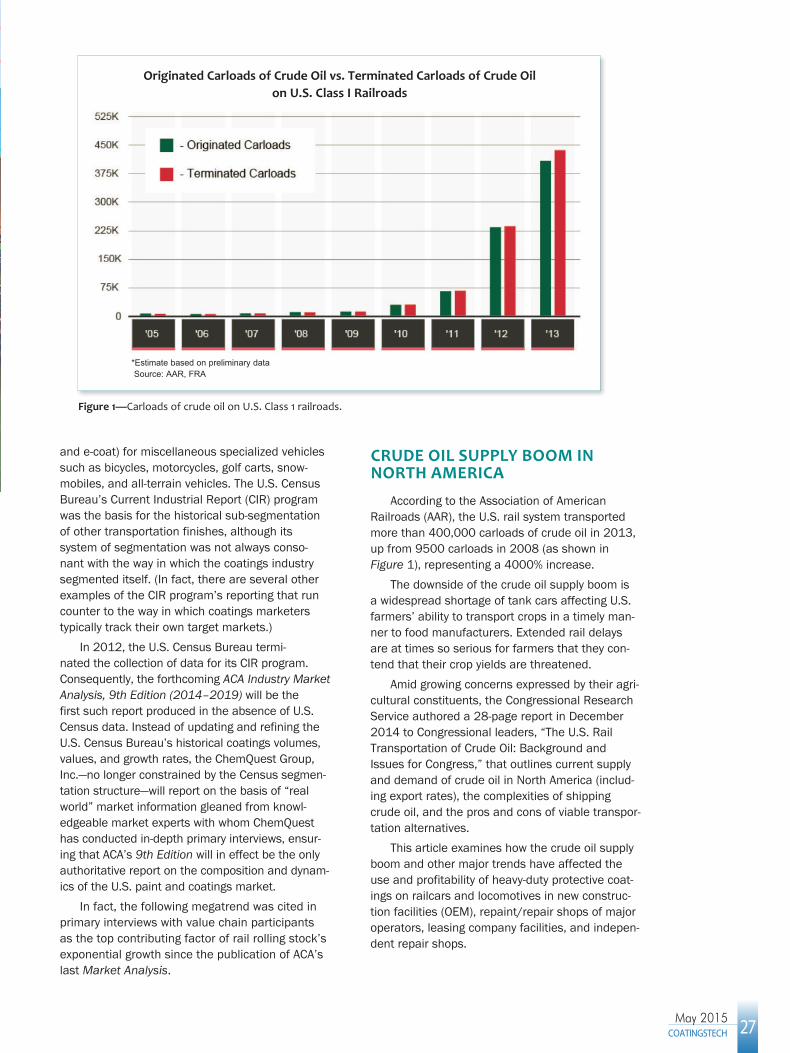
According to the Association of American Railroads (AAR), the U.S. rail system transported more than 400,000 carloads of crude oil in 2013, up from 9500 carloads in 2008 (as shown in Figure 1), representing a 4000% increase.
The downside of the crude oil supply boom is a widespread shortage of tank cars affecting U.S. farmers’ ability to transport crops in a timely man-ner to food manufacturers. Extended rail delays are at times so serious for farmers that they con-tend that their crop yields are threatened.
Amid growing concerns expressed by their agri-cultural constituents, the Congressional Research Service authored a 28-page report in December 2014 to Congressional leaders, “The U.S. Rail Transportation of Crude Oil: Background and Issues for Congress,” that outlines current supply and demand of crude oil in North America (includ-ing export rates), the complexities of shipping crude oil, and the pros and cons of viable transpor-tation alternatives.
This article examines how the crude oil supply boom and other major trends have affected the use and profitability of heavy-duty protective coat-ings on railcars and locomotives in new construc-tion facilities (OEM), repaint/repair shops of major operators, leasing company facilities, and indepen-dent repair shops.
Originated Carloads of Crude Oil vs. Terminated Carloads of Crude Oil on U.S. Class I Railroads
*Estimate based on preliminary data Source: AAR, FRA
Figure 1—Carloads of crude oil on U.S. Class 1 railroads.
COATINGSTECH 27May 2015

MARKET SIZE: VOLUME AND VALUE
Estimated demand for rail rolling stock coat-ings in 2012 was reported in the last Market Analysis as $35 million in value for 2.5 million gallons in volume. By 2014, demand had skyrock-eted to an estimated $185 million in value for 4.2 million gallons in volume. Historically, growth in rail rolling stock coatings has been cyclic, but even given a standard margin for error and allowing for earlier distorted Census numbers, growth on this scale is well beyond normal fluctuations in busi-ness cycles.
In the 9th Edition chapter, Rail Rolling Stock Coatings, readers will gain an understanding of the historic (unprecedented) increases in railcar
coatings consumption in the last seven to eight years, which is largely attributable to a massive scale-up of domestic energy production and the subsequent pent-up demand for rail transporta-tion of crude oil, fracking materials, coal, and plastic pellets.
In 2014, the U.S. coatings market was approxi-mately a $22 billion industry, segmented as archi-tectural ($11 billion), industrial OEM ($6.7 billion), and special purpose coatings ($4.5 billion). Relative to the industrial OEM coatings segment, rail rolling stock coatings represent approximately 3% of the value and 1% of the volume—$185 million and 4.2 million gallons—respectively (see Figure 2).
Over 80% of the $185 million market value is used for painting covered hopper cars ($81 million) and tank cars ($68 million). Locomotives and open hoppers each make up 6% of the share, and the balance is spread among flat cars, boxcars, trans-ports, and other types, as illustrated in Figure 3.
According to the Railway Supply Institute, and validated by key coatings raw material suppliers, railcar coatings manufacturers, and major car builders, 2014 saw historically high backlogs in U.S. railcar manufacturing, peaking at slightly over 50,000 tank cars and 76,000 freight cars.
To keep pace with the exceptionally high demand for rail shipping, new railcars are being built at record numbers, and this trend is expected to continue through 2018, in spite of plummet-ing crude oil prices (given shop backlogs of up to eight months.) Every shop in the country is reportedly working at maximum capacity, and addi-tional capacity is being added by building new car facilities on a large scale; therefore, OEM coatings for new builds have the largest share of volume growth. One major car builder cited his own com-pany’s current ratio of OEM vs. maintenance repair
Figure 2—Rail rolling stock coatings as part of the total coatings market (2014).
2014 Volume 2014 Value
Source: The ChemQuest Group, Inc.
Figure 3—Coatings demand by railcar type (2014).
Rail Car and Locomotive Coatings ($185 million)
Source: The ChemQuest Group, Inc.
Boxcars 1%
Covered hoppers
44% Open hoppers
6%
Flats 2%
Tanks cars 37%
Locomotives 6%
Other 4%
Rail Car & Locomotive Coatings ($185 million)
Architectural 58%
Special Purpose
13%
Rail Rolling Stock
Coatings 1%
Other OEM 28%
OEM 29%
Architectural 48%
Special Purpose
21%
Rail Rolling Stock
Coatings 3%
Other OEM 28%
OEM 31%
Total Volume = 1,254 million gallons Total Value = $21,865 million Total Volume = 1,254 million gallons Total Value = $21,865 millions
May 201528 COATINGSTECH
coatings at 10:1, transitioning to a ratio of 7:1 by the end of 2015 when the company’s newly built repair shops will be operational.
The ratio of the number of OEM new builds vs. the number of existing railcars is important because—while there are 82,000 OEM railcars and locomotives being built—there are 1.5 million exist-ing railcars, all of which get some refurbishment at some interval.
In fact, the existing U.S. fleet of 1.5 million rail-cars is repainted on a schedule, which factors in the type of coatings application (interior vs. exterior) as well as how aggressive the service environment is, relative to the type of cargo that the car is designed to carry. Typical railcar exterior coatings have a ser-vice life of 10 years (although tank car exteriors are recoated every five to seven years), but repainting can sometimes be pushed out to 15 years and may be planned to coincide with taking the railcar out of service for other repairs. Taking a locomotive out of service for refurbishment is far more costly and thus locomotives are refurbished at a much lower rate compared to freight cars: 60–70 railroad cars are painted for every single locomotive.
ChemQuest estimates that the annual share of tank car exterior coatings is in the range of $36 million (the split between OEM coatings for new builds and maintenance repair coatings for the existing fleet is 80% to 20%, respectively). By comparison, the annual share of exterior coatings for hopper cars is estimated at $57 million with a 40% (OEM) to 60% (maintenance repair) split. The $10.5 million annual share of coatings for locomo-tives is estimated to be 2% by volume vs. railcars and 6% by value vs. railcars.
The exterior of a tank car when coated with a single-coat, direct-to-metal (DTM) epoxy coating will require approximately 35 gallons of paint vs. 25 gallons that are required to line an interior tank car with a single coat of 100% solids epoxy. The cost of paint per tank car will range from $740 to $850 for exterior applications and from $1,150 to $1,300 for interior applications. Protective coat-ings constitute 14%–38% of the total cost to paint a tank car, depending on the types of coatings/linings that are used and the number of coats. For example, the total cost of painting an exterior tank car is in the range of $2,500 to $6,000; for interior tank cars the range is $5,000 to $10,000.
The average selling price for a two-component epoxy exterior coating is $25–$33 per gallon vs. phe-nolic linings that are priced at $47–$55 per gallon. (The trend toward using higher volume solids is driv-ing up the price per gallon and adding value because higher performing, higher solids coating systems pro-vide more protection on an applied-thickness basis than conventional lower solids systems.)
MARKET SHARE
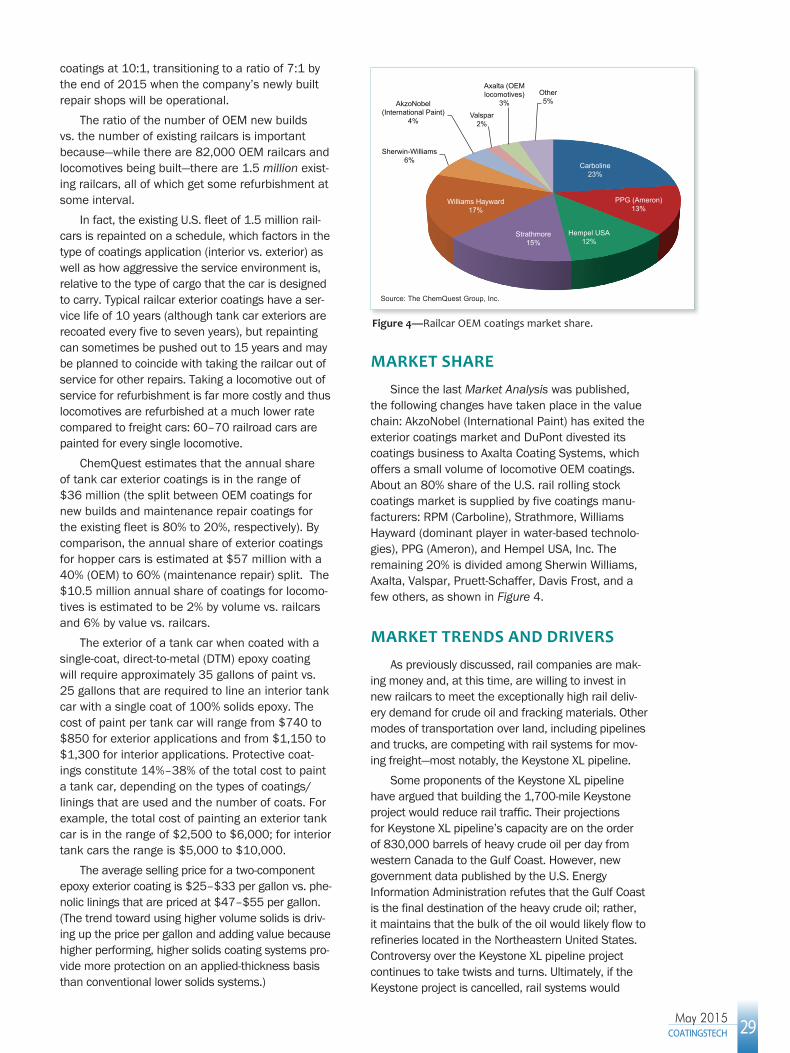
Since the last Market Analysis was published, the following changes have taken place in the value chain: AkzoNobel (International Paint) has exited the exterior coatings market and DuPont divested its coatings business to Axalta Coating Systems, which offers a small volume of locomotive OEM coatings. About an 80% share of the U.S. rail rolling stock coatings market is supplied by five coatings manu-facturers: RPM (Carboline), Strathmore, Williams Hayward (dominant player in water-based technolo-gies), PPG (Ameron), and Hempel USA, Inc. The remaining 20% is divided among Sherwin Williams, Axalta, Valspar, Pruett-Schaffer, Davis Frost, and a few others, as shown in Figure 4.
MARKET TRENDS AND DRIVERS
As previously discussed, rail companies are mak-ing money and, at this time, are willing to invest in new railcars to meet the exceptionally high rail deliv-ery demand for crude oil and fracking materials. Other modes of transportation over land, including pipelines and trucks, are competing with rail systems for mov-ing freight—most notably, the Keystone XL pipeline.
Some proponents of the Keystone XL pipeline have argued that building the 1,700-mile Keystone project would reduce rail traffic. Their projections for Keystone XL pipeline’s capacity are on the order of 830,000 barrels of heavy crude oil per day from western Canada to the Gulf Coast. However, new government data published by the U.S. Energy Information Administration refutes that the Gulf Coast is the final destination of the heavy crude oil; rather, it maintains that the bulk of the oil would likely flow to refineries located in the Northeastern United States. Controversy over the Keystone XL pipeline project continues to take twists and turns. Ultimately, if the Keystone project is cancelled, rail systems would
Figure 4—Railcar OEM coatings market share.
Carboline 23%
PPG (Ameron) 13%
Hempel USA 12%
Strathmore 15%
Williams Hayward 17%
Sherwin-Williams 6%
AkzoNobel (International Paint)
4% Valspar
2%
Axalta (OEM locomotives)
3% Other 5%
Railcar OEM Coatings Market Share
Source: The ChemQuest Group, Inc.
COATINGSTECH 29May 2015

continue to be taxed, as the Keystone XL pipeline is projected to initially carry about 10% of the volume currently transported by rail.
Railcars are also being built in the United States for export to satisfy a strong demand in Australia, Europe, and South America.
Moreover, rail intermodal transport of commodi-ties, automotive loadings, and housing materials is poised for significant growth at the expense of truck transport, due to the relatively poor condition of U.S. infrastructure (bridges, highways) vs. the excel-lent condition of the rail network, a persistent short-age of truck drivers, and significant fuel savings.
Thus, tank cars that carry petrochemical prod-ucts and coal have gained a 15% share at the expense of other rolling stock.
UNMET NEEDS
Improving throughput speed may be the top unmet need in rail rolling stock coatings to offset the rail industry’s backlog and to avoid turning away customers and shipments. For some car builders with plant space constraints, the coatings’ drying time is a bottleneck in production.
With respect to maintenance repair coatings, gaining access to a new technology that promotes good adhesion to the substrate and requires minimal surface preparation is an unmet need that could glean higher pricing for suppliers, i.e., surface-tolerant coatings.
Improving coating and lining lifecycle costs with high performance technologies that extend the service life of the coating was cited as an unmet need, along with high temperature, higher UV
durability, and superior abrasion resistance proper-ties—especially for cars transporting petrochemical products and highly abrasive fracking sand from Canada (although the majority of frack sand is transported in unlined hopper cars).
Improving chalking resistance and gloss reten-tion in some exterior applications where epoxies are used is another unmet need (albeit not a high priority).
There is an unmet need for a lower-cost substi-tute lining material to replace rubber linings with equal or better performance properties, service capability, and quality for service in an aggressive chemical environment.
Not unexpectedly, the above needs are driving innovation in technologies and methods, which are explored in depth in the forthcoming 9th Edition.
TECHNOLOGY INFLUENCES
The U.S. coatings industry is made up of reac-tive chemistries, which have high functionality and are growing at 4–6% (volume) rate. Examples include urethanes, epoxies, and polyureas. These chemistries account for 28% of the demand mix in the United States, as shown in Figure 5.
In terms of resin base, rail rolling stock coatings technology has not changed much in several years.
Protection from corrosion continues to be the main driver for coatings technology choice. With the exception of locomotive coatings, aesthetics—though desirable—do not drive higher value. The best coatings for corrosion prevention, the major function of coatings in this market, are epoxies, which include high solids (75–80%), 100% solids, and water-based technologies.
The industry chooses shorter service life with a good price over long-term performance—a fact that is a barrier to entry for new technologies that claim efficacy for 25 years vs. systems that are limited to 5–10 years. VOC and HAPS regulations have driven conversion from conventional solvent systems to high solids up to and including 100% solids systems, as well as to water-based epoxy and acrylic coatings.
Cost reduction efforts for exterior coatings have driven the major use of direct-to-metal (DTM) coatings vs. two-coat systems, achieving material savings, improved worker productivity (lower labor costs), and better throughput times. For hopper cars, DTM coatings are split 50–50% between two-component epoxy and water-based epoxy technologies (the split for tank cars is 90% two-component epoxy and 10% water-based epoxy.) Caveat: In some aggressive service environments that require higher chemical and corrosion-
Figure 5—U.S. coatings industry 1.2 billion gallons demand by chemistry classification.
Alkyd 11%
Acrylics 33%
Epoxies 12% Polyesters
8%
Polyureas 8%
Urethanes 8%
Vinyls 14%
All Others 6%
U.S. Coa(ngs Industry 1.2 Bn Gallons Demand by Chemistry Classifica(on
Source: The ChemQuest Group, Inc.
May 201530 COATINGSTECH
resistance properties, a two-coat, two-component coating is preferred over a DTM coating.
For most railcars, the use of higher-priced coat-ing technologies, such as polyurethane topcoats over epoxy primers, are small volume applica-tions and employed at the request of the ultimate customer—the lessor or the owner—who values appearance and longer service life.
Locomotive exteriors are coated with epoxy or acrylic primers and polyurethane topcoats to gain higher performance and aesthetic properties. Locomotives are repainted less often than railcars, and so technologies that extend service life are economically feasible.
Coatings must adhere to specifications, and new technologies and formulations must be fully vetted to gain interest. The following technologies are in use in rail rolling stock interior and exterior applications:
• The majority are high solids epoxy-based due to corrosion resistance, chemical resistance, adhesion, and toughness for both exterior and interior coating application.
• Specification-driven polyurethane topcoats over epoxy or acrylic primers account for about 10% of the market for locomotives and railcars.
• Water-based epoxy and acrylic coatings are commonly specified for box cars and some-times for hopper cars due to the perception of faster dry and for improved safety.
• Phenols and high-bake epoxies and modified epoxies are common for linings.
• Alkyd use is in decline, replaced by epoxy due to dry time and VOC compliance.
• Polyaspartic DTM is a new coatings technol-ogy with long service life and low market penetration.
• Hopper car coatings vary based on the type of cargo and climate (tank car coatings also vary based on the type of cargo).
• Major technologies are epoxy, but phenolics, acrylics, and polyurethanes are also common.
• Water-based technology is being replaced by 100% solids for applications in which high abrasion resistance is needed.
• Lining technology varies according to compat-ibility requirements with the type of cargo.
• Although linings are mostly Novolac or Phenolic, conventional HS epoxy and a small volume of polyurethanes are also used. Rubber linings/coatings are also in use.
• The trend to line tank cars carrying crude oil is the driver for switching to 100% solids Novolac epoxy (to reduce the number of coats and to increase throughput in the plant).
• Some believe that elastomeric polyurethane coatings will eventually replace polyureas, and
even some epoxies, as railcars increase in size and the coatings require more flex.
• Newer tank cars that use 9/16-in. steel on the hull vs. 1/2-in. steel may take longer to paint because of the heat-sink effect of the greater mass of steel.
The standard warranty given by the manufac-turer of a railcar tanker is one year (five years into its life cycle, the car will be evaluated for refurbish-ment). By comparison, the typical coating service life is 7–10 years. Conventional coatings offer a 10-year service life for hopper and tank cars; 15–20 years for boxcars (aesthetics are not as critical).
As previously noted, repair and refurbishment costs are high (higher for locomotives vs. railcars), so the economics of lower total life cycle costs with extended service life coatings should be attractive to all owners and lessors. Unfortunately, only a few of them understand or believe the economics of lowering railcar life cycle costs with the use of high performance coatings. At least for the present time, the majority of owners and lessors are not motivated to switch coatings technologies solely on the basis of lower life cycle cost calculations that (to some degree) are dependent on the results of accelerated weathering and corrosion testing to prove that a coating can remain durable and in service for up to 25 years. Indeed, some owners do not trust or buy into accelerated weathering and corrosion testing methods and the statistical models that are employed to demonstrate the benefits of an extended service life of 15–25 years. ChemQuest does not sense that this will change anytime soon.
REGULATORY AND ENVIRONMENTAL INFLUENCES
A significant number of tank linings must com-ply with FDA direct food contact regulations. In the food transport segment, there has likewise been a “market driven” movement away from BPA-based materials for several years.
In 1991, the National Transportation Safety Board (NTSB) declared DOT-111 tank cars (the current configuration) unsafe for transporting flammable liquids including crude oil. Since 1991, the U.S. Department of Transportation (DOT) and its agencies have sought industry comments on proposed mandates on the best approach for addressing safety concerns against a backdrop of several derailments that caused loss of life, serious injuries, and extensive environmental and property damage.
• The FRA HM-216B federal code issued by the Pipeline and Hazardous Materials Safety Administration (PHMSA) and the Federal Railroad Administration (FRA) requires more
COATINGSTECH 31May 2015
frequent inspection of tank cars (every two years). Enhanced inspection has led to more frequent repainting of tank car interior liners.
• Beginning in September 2012, the U.S. govern-ment has led an initiative aimed at upgrading the safety of CPC-1232-compliant tank cars carrying crude oil to prevent derailments in-volving flammable liquids. The PHMSA/FRA action plan includes “unannounced spot inspections, sampling, and monitoring the movement and classification of crude oil within and out of oil fields throughout the U.S.” On February 5, 2015, the U.S. DOT submitted its draft Final Rule on the safe transportation of flammable liquids (including crude oil) by rail to the Office of Management and Budget for formal review. Pending approval, the Final Rule was scheduled to go into effect May 12, 2015 (instead of the originally announced March 31, 2015). Reportedly, Class I Flammable Liquids (those with flash points ≤73º F) will require the new “double-walled” tank car design by October 2017 and Class II Flammable Liquids (those with flash points >100º F) will require the new tank car design by October 2018. AAR and the American Petroleum Institute (API) contend that the tank car industry does not have the capacity to retrofit the 143,000 existing tank cars—or to build new ones fast enough—to meet these deadlines.
BUYING FACTORS
Typically, the car builder defers to the owner or the end user for specifying the type of coating, and the owner’s coatings specification includes three major suppliers from which the paint shop can buy—saving the shop significant production time as it jug-gles multiple customers on its production schedules.
The criteria used for buying protective coatings is said to heavily factor in cost/performance over time, with the coatings suppliers’ history of good customer service to include speed and overall responsiveness with respect to delivering coatings and troubleshoot-ing any technical problems and/or quality issues. Ease of application is important, as is “forgiveness,” insofar as the coatings should provide, to the extent possible, the same degree of performance over the broadest range of dry film thickness (DFT) to meet the specifications. This is an important time-saver to the shop in cases when the coating is inadvertently applied too thin or too thick.
The trend discussed previously of the use of high solids up to and including 100% solids sys-tems is the result of educating owners over time regarding the relationship of volume solids to total coatings cost vs. the price per gallon of the
coating. Periodically, that educational conversa-tion is repeated when “low price per gallon” coat-ings are evaluated by coatings specifiers. Pricing has been steady over the last few years and movement is not expected in 2015.
Warranty requirements absolutely must be met and regular “in-person” calls from technical service representatives are valued.
MARKET FORECAST
The ChemQuest Group, Inc. fully discusses the forecast of rail rolling stock coatings—which is poised for 11% CAGR by volume through 2018—in the forthcoming ACA Industry Market Analysis, 9th Edition (2014–2019).
INDUSTRY STRUCTURE (PORTER’S ‘FIVE FORCES’) ANALYSIS
Since 1979, the “Porter’s Five Forces” frame-work created by Harvard Business School’s then-associate professor, Michael E. Porter, has strongly influenced academic research as well as private business strategy.
Porter’s Five Forces is a famous paradigm that expands one’s view of a company’s competition (i.e., meaning expanding the view of a “traditional” competitor that offers similar products and thus is positioned to take away my customers). Yet the threat of competitors taking away customers isn’t the only threat to company profits. Michael Porter asserted that a business strategy that solely addresses traditional competitors was dangerously narrow in scope, and that a company’s strategic focus should instead identify (and stay ahead of) all possible threats to its profits. “Threats to prof-its” is well beyond the scope of a traditional “com-petitor” vying for market share.
Over a decade ago, The ChemQuest Group, Inc. adopted and modified Porter’s Five Forces, creating a paradigm for viewing and scoring the attractive-ness of specialty chemicals markets through the use of illustrative charts and diagrams. Used in this context, “attractiveness” refers to the overall mar-ket profitability and the likelihood that the market can sustain that level of profitability. ChemQuest’s Porter Analysis is static—it is a snapshot in time, and must be periodically revisited as overall market conditions, which are dynamic, change with time.
The Five Forces are:• Intensity of Rivalry Among Competition• Leverage of Buyers• Leverage of Suppliers• Threat of New Entrants• Threat of Substitute Products
May 201532 COATINGSTECH

ChemQuest uses a proprietary process for evaluating market factors relevant to these five forces to arrive at a Porter Index, with “0” indicat-ing an average market, negative values indicating an undesirable market, and positive values indicat-ing definite market attractiveness.
The more negative the Porter Index, the less attractive a market is; the more positive the Porter Index, the more attractive it is. The Porter Index for rail rolling stock coatings is shown in Figure 6.
The Industry Structure Analysis, with a Porter Index of 7.0, indicates that the rail rolling stock mar-ket is able to sell its products to buyers who place a “high value” on the products and has also been able to pass through the price increases that it has incurred from its raw material suppliers. Despite 80% of the total value of this segment being sup-plied by only five large and well-established coat-ings manufacturers, the remaining 20% represent a group of six additional producers, thus leading to a less-than-perfectly disciplined market, in which rivalry has increased since the last iteration of the Market Analysis; this liquid segment is likely to remain a liquid segment, albeit at increasingly higher solids, and does not seem to be a likely can-didate for substitute products in the short term.
Figure 6—Industry structure analysis—railcars.
Source: The ChemQuest Group, Inc.
AUTHORAggie Lotz, vice president, The ChemQuest Group, Inc., 8150 Corporate Dr., Ste. 250, Cincinnati, OH 45242; [email protected].
For more information on the ACA Industry Market Analysis, 9th Edition (2014–2019), contact ACA’s Allen Irish at [email protected]; 202.462.6272. CT
Industry Structure Five Force Analysis
6
7.7
6.0 6.3
6.0
0
5
10
Intensity of Rivalry Amongst
Competition
Leverage of Buyers (end customers)
Leverage of Suppliers
Threat of New Entrants
Threat of Substitute Products
Porter Index= 7.0
COATINGSTECH 33May 2015