raising pension awareness through letters and social media...
TRANSCRIPT

Raising pension awareness through letters and social media: What works for
whom? Evidence from a randomized and quasi-experiment1
Marike Knoef2 Jim Been3 Marijke van Putten4
Abstract
This paper analyzes the effectiveness of different communication channels and framing on
raising pension awareness. More specifically, we analyze the effectiveness of an informative
letter versus a Facebook-ad and the effectiveness of positive and negative framing to raise
pension awareness. Pension awareness is measured by 1) knowledge of the Dutch pension
system, and 2) actions undertaken to gain information regarding the personal financial situation.
To identify the causal effect of a letter, we rely on a randomized field experiment using a survey
administered to a representative sample of about 4,000 individuals in the Netherlands.
Randomization takes place in 1) receiving a letter with information regarding the pension system
as well as detailed information on where to find information about the personal situation and 2)
the framing (e.g. positive or negative wording) of the letter. To identify causal effects of a
Facebook-ad with the same content, we use an Instrumental Variables approach using self-
reported time spent on Facebook as an instrument. We find a strong effect to login of the
Facebook-ad. However, the ad does not contribute to the general knowledge of the pension
system. An informative letter to respondents is less effective in stimulating logging in, but it is
more effective in raising the knowledge of the pension system. However, this is only true for
negatively-framed letters. Conclusions give new insight in targeting communication strategies for
important life-cycle decisions.
JEL codes: C93, D14, D83, G40, I22
Keywords: Pension Literacy, Communication, Framing, Field experiment, Facebook
1 This project is funded by Pensioenlab and the Netspar Topicality Grant “Raising pension awareness”. Input from
Elisabeth Beusch, Lisa Brüggen, Justine Feitsma, Jessica Hootsen, Eduard Ponds, Femke Sipkema, Anna van der
Schors, and Arthur van Soest is gratefully acknowledged. We thank PanelWizard for collecting the data. 2 Department of Economics, Leiden University and Network for Studies on Pensions, Aging and Retirement
(Netspar). Corresponding author. E-mail: [email protected] 3 Department of Economics, Leiden University and Netspar. E-mail: [email protected] 4 Department of Social and Organizational Psychology, Leiden University and Netspar. E-mail:

1 Introduction
The aging of the population has resulted in a wide range of pension reforms in order to sustain
the public finances in many Western countries. Furthermore, occupational pension systems in
many countries shift from defined benefit plans to defined contribution plans. Whereas
traditional pension plans were a paternal employer responsibility, it has increasingly become an
individual responsibility. This raises concerns how we can ensure that individuals understand
their options and can be guided towards sensible and adequate retirement choices, alongside other
lifetime savings choices.
A vast amount of recent literature has shown that most individuals are ill-informed and lack the
basic knowledge to make well-informed financial decisions (Lusardi and Mitchell, 2014). This
applies to a wide range of countries, and hence, pension systems.5 Financial illiteracy is
overrepresented among women and among low-educated, low-income, non-working, and young
individuals (Lusardi and Mitchell, 2014). Financially illiterate households are generally found to
make worse financial decisions than their financially literate counterparts, which has
consequences for the adequacy of income during retirement (Van Rooij et al. 2012).
Although agents may rationally choose to not invest in acquiring financial knowledge, it may be
socially optimal to increase financial literacy. Especially as ill-informed individuals are less
responsive to designed pension incentives because of misperceptions (Chan and Stevens, 2008;
Van Rooij and Teppa, 2014). Increasing financial knowledge can be costly to acquire (Delavande
et al. 2008; Lusardi et al. 2017). A way of lowering the cost of acquiring financial knowledge is
making it more readily available. This paper aims to increase our knowledge of how to make
information available by investigating the effectiveness of framing and of two different
communication channels on raising pension awareness.
Several studies find that framing plays an important role in economic behavior. For example,
Card and Ransom (2011) find that pension contributions are asymmetrical in the framing of
employer and employee contributions. Framing also affects perceived risk and risk taking
5 E.g. Agnew et al., 2013; Alessie et al. 2011; Almenberg and Säve-Södenberg, 2011; Van Rooij et al., 2011;
Arrondel et al., 2013; Beckmann, 2013; Boisclair et al., 2015; Fornero and Monticone, 2011; Klapper and Panos,
2011; Crossan et al. 2011; Bücher-Koenen et al. 2011; Sekita, 2011; Brown and Graf 2013; Landerretche and
Martinez, 2013; Lusardi and Mitchell, 2011.

behavior (Steul, 2006, and Diacon and Hasseldine, 2007). Furthermore, Krijnen et al. (2016) find
an adverse effect of the word “important” on the attention that people pay to pension
communication. Eberhardt et al. (2017) build upon the prospect theory (Kahneman and Tversky,
1979) and find that an assurance frame (the loss alternative) can be twice as effective than an
investment frame (the gain alternative) in engaging participants to click on a video link that
explains pension scheme changes. Similarly, framing affects social security benefit claiming
decisions (Brown et al., 2016). Although negative framing is generally more effective than
positive framing in inducing pension saving (Block and Keller, 1995; Agnew et al., 2008;
Montgomery et al., 2011; Bateman et al., 2015 and Bockweg et al. 2017), it may also scare off
participants (Brüggen et al., 2017). This fits in the more general view of increasing use of non-
pecuniary strategies to influence households’ behavior by policymakers (Ferraro and Price,
2013). In contrast, Bauer et al. (2017) find that people are more likely to inform themselves about
their individual pension situation with a small financial incentive than with nudging.
With regard to communication channels, Johansen (2013) suggests that pension information
should be spread wider. That is because households collect information through different
channels and at least as much from their social environment as from experts. Hence, it may be
less costly and more effective to increase financial awareness through unofficial communication
channels such as through peers (Kast, Meier, Pomeranz, 2012). Social interactions are found to
affect retirement decisions (Brown and Laschever, 2012; Rege, Telle, Votruba, 2012), the
enrollment in retirement plans (Duflo and Saez 2002, 2003), as well as households’ portfolio
choice.6 Even more so, the choice for a pension fund depends stronger on the choice of peers
than on observable performance measures (Mugerman et al., 2014). Nonetheless, such peer
effects can also induce negative reactions to pension plan enrollment (Beshears et al., 2015).
The importance of peers is likely to have increased because of social media. Next to companies
being able to directly communicate with their customers, social media enables consumer-to-
consumer communication (Mangold and Faulds, 2009). This type of communication is found to
affect purchasing decisions (Wang et al., 2012). Research also suggested that Facebook can be an
effective instrument to find a job (Gee et al., 2017). Social media is not only reserved for
commercial products, but nonprofit organizations are also increasingly involved in increasing
6 E.g. Gali, 1994; Hong et al., 2004; Brown et al., 2008; Georgarakos and Pasini, 2011; Kaustia and Knüpfer, 2012;
Georgarakos et al., 2014.

awareness through social media (Waters et al., 2009). This increasingly takes the form of
governments communicating with civilians on numerous different topics related to public safety
(Kavanaugh et al., 2012). The strategy of governments informing civilians through social media
is especially promising in promoting health (Househ et al., 2014). Also the more disadvantaged
groups can be reached (Chou et al., 2009). Therefore, social media could provide an opportunity
to increase pension awareness, even among more disadvantaged groups that are potentially hard
to target.
This paper analyzes both the effectiveness of different pension communication channels and
framing on raising pension awareness. Here, pension awareness is defined by two components,
namely 1) pension literacy, and 2) logging in to a national website to gain information on one’s
pension entitlements (in the remainder of the paper we will call this the pension check). The first
component measures people’s general knowledge (with five basic questions about the pension
system), while the second component measures the actions taken to get informed about one’s
personal pension. First, we analyze the effectiveness of sending an informative letter. The letter
consists of information regarding the pension system as well as a link to the pension check (in
Dutch: mijnpensioenoverzicht.nl). To identify the causal effect of the letter on pension awareness,
we rely on a randomized field experiment using a survey administered to a representative sample
of about 4,000 individuals in the Netherlands. Secondly, since randomization takes place in
receiving a letter as well as the framing of the letter (positive or negative), we are able to analyze
the effectiveness of positive versus negative wording on financial literacy and doing the pension
check. Thirdly, we analyze the extent to which Facebook is an effective communication channel
to increase pension awareness. Therefore, we targeted individuals between the ages of 20 and 40
with a Facebook-ad. We focus on the effectiveness of using Facebook as a communication
channel for important information. As no randomization takes place in observing the ad, we use
an instrumental variable approach with self-reported time spent on Facebook as an instrument.
The contribution of this paper to the literature threefold. Firstly, whereas others investigated the
effect of framing on outcome measures such as risk perception, annuity choices, social security
claiming, retirement saving intentions, or clicking on a video about pensions, this paper
investigates the effect of framing on pension awareness. As far as we know, this is the first paper
on pension communication that does not only investigate the effect of framing on whether people

search more for information or login at a website, but investigates whether people really have a
better knowledge of the pension system six weeks after receiving the information. Secondly, as
far as we know, we are the first to investigate whether social media can play a role in increasing
pension awareness. Thirdly, the paper follows the suggestions for future research of Lusardi and
Mitchell (2014) who argue that more research is needed that uses carefully-designed experiments
to evaluate effective ways to increase knowledge of personal finances. Especially in an
environment in which respondents are not specifically targeted, like the setting of company-
specific employees in Bernheim and Garrett (2003), but represent a random draw from the entire
population. With our data set that is representative for the Dutch population we even have a
sufficiently large number of observations to focus on large subgroups with respect to age, gender,
and educational level. Finally, the Netherlands is an interesting case as most of the retirement
savings are mandatory (Knoef et al., 2016) which implies fewer incentives to invest in financial
literacy (Jappelli and Padula, 2013). This means that the results can be considered as a lower
bound for other countries. Our conclusions give new insight in target-specific communication
strategies of public policy, pension funds, and insurance companies for important life-cycle
decisions.
The results show that the Facebook-ad is very strong in activating respondents to login at the
mijnpensioenoverzicht.nl to see their personal financial situation. However, the ad does not
significantly contribute to the general knowledge of the pension system. Sending an informative
letter to respondents is less effective in stimulating active logging in to see the personal financial
situation, but does significantly increase pension literacy. However, this is only true if the
informative letter is negatively-framed. Positively-framed letters did not have an effect on raising
pension awareness whatsoever. We do not find significant heterogeneous effects with regard to
age, gender and education level. These results are robust to a variety of specifications.
The structure of the paper is as follows. Section 2 describes the randomized field experiment
regarding the informative letters as well as the quasi-experiment using the Facebook-ad. Data and
descriptive statistics are described in Section 3. Estimation results are presented in Section 4.
Finally, we conclude in Section 5 and provide some additional discussion of the results in Section
6.
2 Method
This section first describes the design of the field experiment that was executed to analyze the
effect of framing and the effectiveness of an informative letter to increase pension awareness.
Secondly, section 2.2 explains the quasi-experimental design used to investigate the effectiveness
of a Facebook-ad to increase pension awareness.
2.1 Letter
To test whether an informative letter increases pension awareness we set up an experiment. In
this experiment we designed a letter consisting of three parts. The first part is the introduction
which is framed either positively or negatively.7 The second part asks people to do the pension
check (i.e. logging in at the personal pension registry to see their personal pension entitlements).
The third part shows seven basic facts about the pension system.
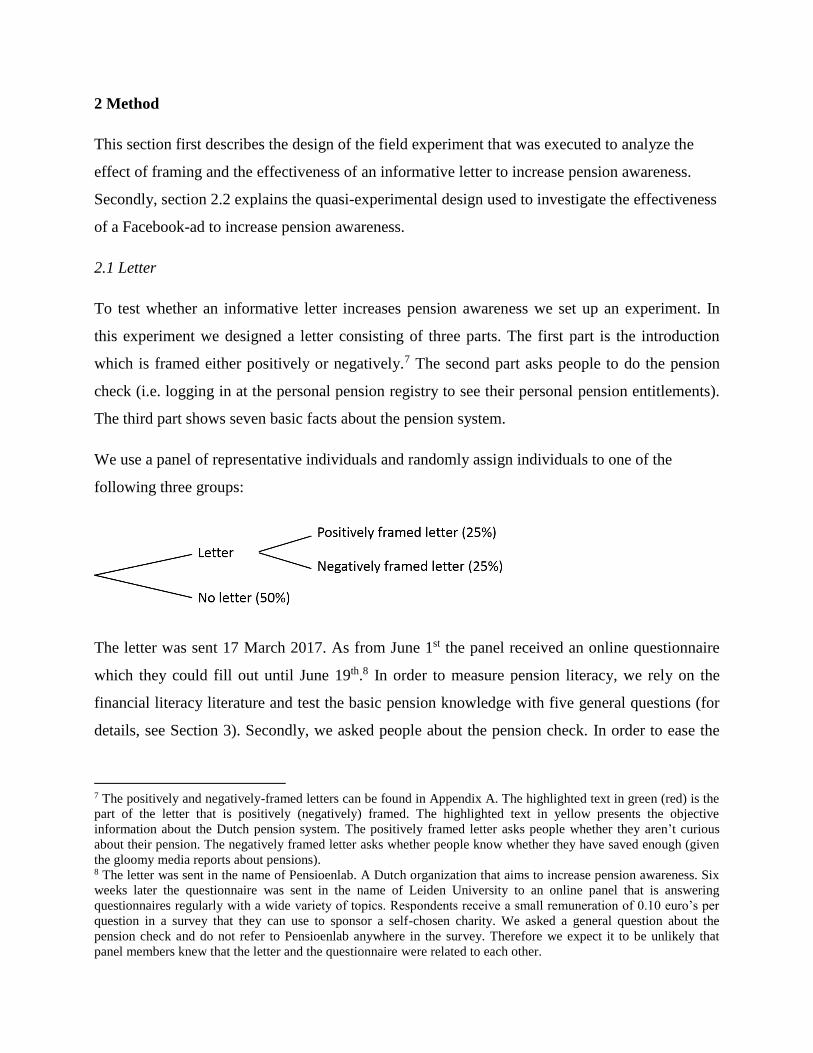
We use a panel of representative individuals and randomly assign individuals to one of the
following three groups:
The letter was sent 17 March 2017. As from June 1st the panel received an online questionnaire
which they could fill out until June 19th.8 In order to measure pension literacy, we rely on the
financial literacy literature and test the basic pension knowledge with five general questions (for
details, see Section 3). Secondly, we asked people about the pension check. In order to ease the
7 The positively and negatively-framed letters can be found in Appendix A. The highlighted text in green (red) is the
part of the letter that is positively (negatively) framed. The highlighted text in yellow presents the objective
information about the Dutch pension system. The positively framed letter asks people whether they aren’t curious
about their pension. The negatively framed letter asks whether people know whether they have saved enough (given
the gloomy media reports about pensions). 8 The letter was sent in the name of Pensioenlab. A Dutch organization that aims to increase pension awareness. Six
weeks later the questionnaire was sent in the name of Leiden University to an online panel that is answering
questionnaires regularly with a wide variety of topics. Respondents receive a small remuneration of 0.10 euro’s per
question in a survey that they can use to sponsor a self-chosen charity. We asked a general question about the
pension check and do not refer to Pensioenlab anywhere in the survey. Therefore we expect it to be unlikely that
panel members knew that the letter and the questionnaire were related to each other.

hassle involved with logging into the registry this information was sent at the time of the yearly
tax filing, where the same password is necessary to file taxes.
In order to analyze the effects of a letter on pension awareness, we compare individuals who
received a letter (treatment group) to individuals who did not receive a letter (control group). We
estimate the following model
𝑦𝑖 = 𝛼1 + 𝛽1𝐷𝑖 + 𝑋𝑖𝛾1 + 𝜖𝑖, (1)
where y is one of the two outcome variables (pension literacy or doing the pension check), α is
the constant, D is a dummy variable indicating whether an individual received a letter , and X is a
vector of individual characteristics such as gender, education, household, age, and work situation.
To differentiate between positively- and negatively-framed letters, we estimate
𝑦𝑖 = 𝛼2 + 𝛽2𝐷𝑖 + 𝛿𝐷𝑖+ + 𝑋𝑖𝛾2 + 𝑢𝑖, (2)
where D+ is a dummy variable which is equal to one for individuals who received a positively-
framed letter and zero for all other individuals. 𝛽2 measures the effect of a negatively-framed
letter. The sum of 𝛽2 and 𝛿 measures the effect of a positively-framed letter. When the
dependent variable is pension literacy we estimate a linear regression model with OLS. In case of
analyzing the probability of doing the pension check, we estimate a probit model with Maximum
Likelihood. Whether people did the pension check is a self-reported variable. Social desirability
may lead to an overestimation of the number of people doing the pension check. However, we do
not expect this to bias our results, because we do not expect the treatment to affect the self-report
bias. That is because the letter was sent in the name of Pensioenlab (a Dutch organization that
aims to increase pension awareness). Six weeks later the questionnaire was sent in the name of
Leiden University to an online panel that is answering questionnaires on a regular basis. We
asked a general question about the pension check and did not refer to Pensioenlab anywhere in
the survey. Therefore, the treated individuals did not know that the letter and the questionnaire
were related to each other and that it was more desirable for them to answer that they did the
pension check.
2.2 Facebook-ad

To test whether pension awareness increases by informing individuals by way of social media,
we set out a Facebook-ad on 4 April that informs people about the pension system and asks them
to do the pension check (see appendix B). The ad does not contain the first framing part of the
letter (it was thus framed in a neutral way). The ad targeted people aged under 40s. This does not
mean that the over 40s were unable to see the ad since members of their network may ‘like’ the
ad, but the chances are small. In the online survey we ask whether respondents have noticed the
Facebook ad.
Since it is not possible to randomize a Facebook ad, regressing our outcome variables on whether
the Facebook-ad was noticed by the respondent by OLS may be endogenous. For example, it
could be that only those who are interested in pensions and are already relatively pension aware
noticed the Facebook ad (only a selective sample noticed the ad). Or, that especially those who
did see the Facebook ad and became more aware of their pension and the pension system
remember that they have seen the ad (selective measurement error in the self-report of having
seen the ad). This would lead to an overestimation of the effect of the Facebook ad on pension
awareness. On the other hand, it could be that especially the individuals who were relatively
unaware of pensions remember the Facebook ad, while those who are already aware of pensions
did not pay attention anymore and scrolled further without noticing the ad consciously. They may
be confronted with the ad, but do not remember this anymore. In that case OLS underestimates
the effect of the Facebook ad on pension awareness.
One could also think of third factors: maybe for some reason some people are relatively a lot of
hours online. Than they may spend relatively a lot of time on Facebook and they may be more
likely to have searched for pension information on the internet and checked their pension on the
national website. On the other hand, there are 1001 things you can do and find on the internet, so
why would heavy internet users more often choose to read pension information and do the
pension check compared to less heavy internet users (unless they are hinted on this by Facebook).
To identify causal effects of the Facebook-ad on pension awareness we use an Instrumental
Variables approach. We asked respondents about their average time spent on Facebook per week
and use this information as an instrument. Time spent on Facebook is likely to predict whether an
individual noticed the Facebook-ad (relevant instrument), but the time spent on Facebook is
unlikely to be correlated with pension awareness other than through the Facebook-ad (valid

instrument). Also, we find it unlikely that the time spent on Facebook is correlated with
measurement error in the self-report of having seen the ad.
We estimate:
𝑦𝑖 = 𝛼3 + 𝛽3𝐹𝐵𝑖 + 𝛿3𝐷𝑖 + 𝑋𝑖𝛾3 + 𝑣𝑖 (3)
𝐹𝐵𝑖 = 𝛼4 + 𝛽4𝑇𝑖 + 𝑋𝑖𝛾4 + 𝜇𝑖 (4)
Where, FB indicates whether a person noticed the Facebook-ad (one if the ad was noticed and
zero otherwise), and T is the average time spent on Facebook per week. Equations (3) and (4) are
estimated simultaneously through Maximum Likelihood such that the error terms ε and μ are
allowed to be correlated.
As a robustness check we include information about the importance that individuals give to the
topic of pensions and the self-reported ability to find pension information easily (both measured
on a 5-point scale). This is important if those who spend a lot of time on Facebook also find
pensions relatively important or are more able to find information about pensions.9 Despite the
fact that these additional variable are highly significant, their inclusion does not change the
results.
3 Data
Data are collected from an online panel of Panelwizard. The planned sample size after
nonresponse was 4,000 individuals, of which 50% aged 20-40 and 50% aged 41-64. The panel
consists of 4560 individuals aged 20-40 and 3387 individuals aged 41-64. These sizes are based
upon expected non-response rates, which are higher for young than for old people. Within the
two age groups we have a stratified sample that is representative to the Dutch population with
regard to age, gender, household composition, labor market participation and education. Details
on the actual survey sample can be found in Table 1. The most important things to note from the
9 This could bias our estimate upwards (as we measure pension importance and the ability to find pension
information through our instrumental variable).

table is that the sample consists of 4,000+ respondents10 and response rates are fairly similar
across type of letter received. Hence, there is sufficient variation in the data and non-response is
not likely to be correlated with receiving a letter or not and the type of letter that was received.
[Insert Table 1. Sample here]
To see that certain characteristics are not over- or underrepresented in the different groups we
present the mean values of characteristics in Table 2. None of the characteristics we observe
seem to be over- or underrepresented in a way that renders our analysis invalid. The Facebook ad
reached 770.134 persons in the Netherlands. 45 of the individuals in our sample remembered
seeing the Facebook ad. The percentage of respondents that noticed the Facebook-ad is quite
similar among the groups that received different letters or no letters.
[Insert Table 2. Descriptives here]
Pension awareness is measured by combining two sets of information from the survey. First, we
use the concept of pension literacy based on five questions regarding the current pension system.
Details on these five question are presented in Table A1 in the Appendix. This table shows that
more than half of the respondents gave a wrong answer to four out of five questions. In general,
we do observe that respondents with a correct answer were more confident in giving the correct
answer (measured by a confidence scale 1-5). Second, we use the concept of the pension check
based on whether the respondent logged in at mijnpensioenoverzicht.nl in order to see their
personal financial situation.
To get a first impression of the effect of the positive and negative letter on pension awareness, we
present the average number of correct answers to the pension literacy questions in Figure 1a. This
figure shows that not more than two out of five questions are answered correctly, on average, in
the three different groups that received a positive letter, a negative letter, or no letter. With an
average of about 2.1 correct answers the group without a letter performs worst. The group with a
10 With 95% confidence this sample does not deviate more than 4.2% of the actual composition of the population, so
we conclude that the sample is representative for the Dutch population.
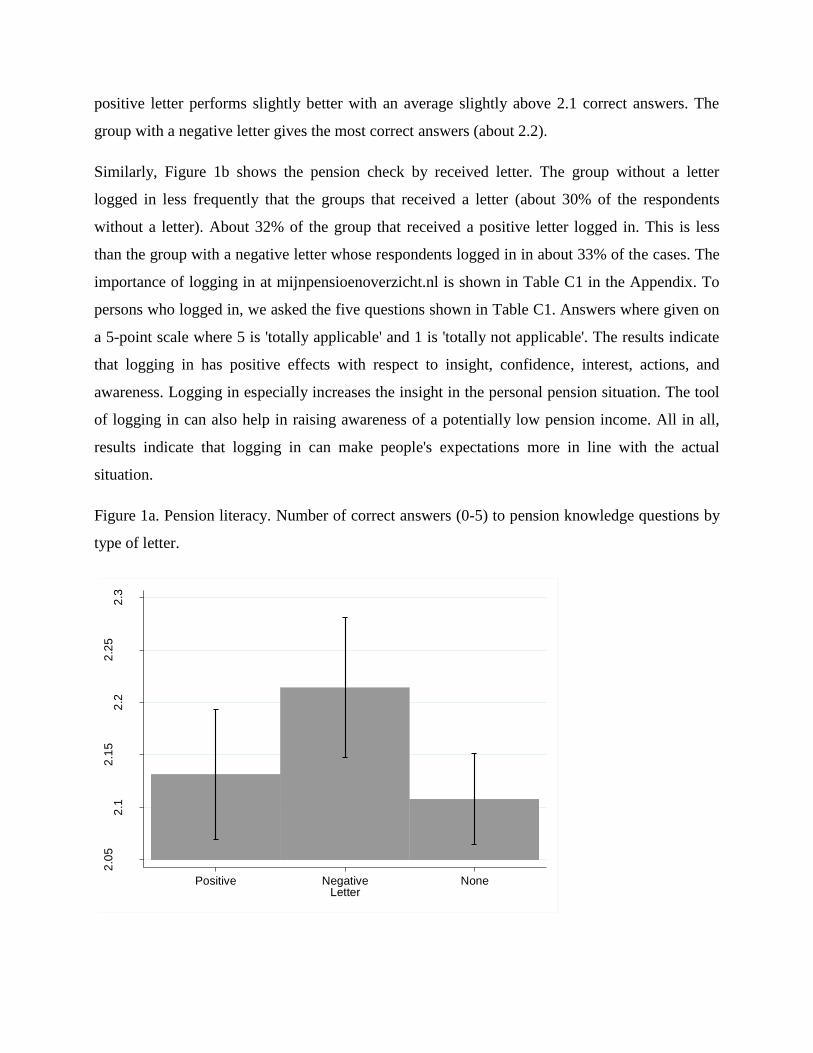
positive letter performs slightly better with an average slightly above 2.1 correct answers. The
group with a negative letter gives the most correct answers (about 2.2).
Similarly, Figure 1b shows the pension check by received letter. The group without a letter
logged in less frequently that the groups that received a letter (about 30% of the respondents
without a letter). About 32% of the group that received a positive letter logged in. This is less
than the group with a negative letter whose respondents logged in in about 33% of the cases. The
importance of logging in at mijnpensioenoverzicht.nl is shown in Table C1 in the Appendix. To
persons who logged in, we asked the five questions shown in Table C1. Answers where given on
a 5-point scale where 5 is 'totally applicable' and 1 is 'totally not applicable'. The results indicate
that logging in has positive effects with respect to insight, confidence, interest, actions, and
awareness. Logging in especially increases the insight in the personal pension situation. The tool
of logging in can also help in raising awareness of a potentially low pension income. All in all,
results indicate that logging in can make people's expectations more in line with the actual
situation.
Figure 1a. Pension literacy. Number of correct answers (0-5) to pension knowledge questions by
type of letter.
2.0
52
.12
.15
2.2
2.2
52
.3
Num
ber
of co
rrect a
nsw
ers
Positive Negative NoneLetter

Figure 1b. Pension check. Percentage logged in by type of letter.
Next to the letters, we used the Facebook-ad to raise pension awareness. Since Facebook is not
made for large messages, we reduced the number of pension literacy questions from five to three.
In the Facebook-ad we only included questions 1, 4, and 5. Hence, the pension literacy scale for
the Facebook-ad runs from 0-3. Figure 2a shows that only 0.8 out of 3 answers are given
correctly among persons that did not see the ad. Persons who did see the ad answered 0.93 out of
5 answers correctly.
Figure 2b shows the percentage of respondents that logged in differentiated by noticing or not
noticing the ad. In the group that did not notice the add only about 15% of the people logged in.
In the group that noticed the ad this percentage is much higher and about 54%.
.28
.3.3
2.3
4.3
6
Log
in (
%)
Positive Negative NoneLetter

Figure 2a. Pension literacy. Number of correct answers (0-3) to pension knowledge questions by
Facebook-ad.
Figure 2b. Pension check. Percentage logged in by Facebook-ad.
.7.8
.91
1.1
1.2
Num
ber
of co
rrect a
nsw
ers
(0-3
)
No YesFacebook ad
.3.4
.5.6
.7
Log
in (
%)
No YesFacebook call

Section 4 tests aforementioned relationships by way of regression analysis. In these analyses we
estimate the effects of the letter and the add conditional on observed characteristics of the
respondent.
4 Results
4.1 Main results
4.1.1 Letters
Table 3 shows the estimation results for Equation 1-2 using the randomized field-experiment of
letters. Models 1-4 estimate the effect of receiving a letter on pension literacy. Models 5-8 use the
pension check as a dependent variable. Models 2, 4, 6, and 8 differentiate between the effects of
positively and negatively-framed letters.
Without controlling for observed characteristics (Model 1) we find that receiving a letter
increases the number of correct answers significantly by 0.06. Model 2 suggests that this effect is
primarily due to receiving a negative letter. Receiving a negative letter significantly increases the
number of correct answers by 0.11. This means that if we ask the five pension literacy questions
to 100 people, we receive 11 additional right answers when this group received the negative letter
(an increase of 5.2% in the number of right answers). A positive letter does not significantly
increase pension literacy.11 After conditioning on the observed characteristics gender, education,
household, work, and age (Model 3-4) the treatment effects remain almost the same (as expected
because of the random assignment). Only, the effect of receiving a negative letter is now 0.10
instead of 0.11.12
Estimation results for the pension check suggest that we find a weakly significant effects of a
letter after conditioning on observed characteristics. The coefficients reported in Models 5-8 are
11 Testing H0: β2 + δ2 = 0 in Model 4 gives a p-value of 0.55. 12 We evaluated the questions and answers with pension experts from Netspar. Some mentioned that the correct
answer of the question “What is roughly the percentage of earnings that is on average used to pay pension
contributions (by all parties)” depends on the interpretation of “pension contributions” which can be interpreted as
first or second pillar contributions only, or both. The experts mention that this could result in 10, 15 and 20% being
correct answers. Despite the fact that 20% is clearly mentioned in the letters and Facebook-ad, we did robustness
checks of the estimation results when marking 10 and/or 15% also as correct. Conclusions are highly robust.

average marginal effects. We find that receiving a letter increases the probability of doing the
pension check by 3%-points. This is not different for positively or negatively-framed letters.13
[Insert Table 3. Effects of randomized letters on pension awareness here]
Heterogeneous effects of the letters are analyzed in Table 4. Model 1-3 analyze pension literacy.
Model 4-6 analyze the pension checks. We differentiate effects of the letters between age
categories (Model 1 and 4), gender (Model 2 and 5), and educational level (Model 3 and 6). The
effect of the letter on pension literacy for people in the age-group 20-40 is not significantly
different than for people in the age-group 41-64 (Model 1). This also applies to the effect of the
letter on the pension check (Model 4). Model 2 and 5 show that the effect of the letter on pension
literacy and the pension check is not different for males and female and Model 3 and 6 show that
there are also no significant differences between low and high educated individuals. Model 6
shows that higher educated individuals are 5%-points more likely to login after a negatively
framed letter. We do not find such effects for positively-framed letters.
[Insert Table 4. Heterogeneous effects of randomized letters here]
4.1.2 Facebook-ad
Table 5 shows the estimations results for Equations 3-4 using the quasi-experiment of the
Facebook ad. Model 1-3 estimate the effects of the Facebook-ad on pension literacy. Note that
the pension literacy indicator runs from 0-3 here because of the information provided in the
Facebook-ad (for details see Section 3).14 The effect of the Facebook-ad on the pension check is
analyzed in Model 4-6. Given the fact that the Facebook-ad was targeted at people aged under
40s, we restrict the sample to persons aged 20-40. Table 4 in Section 4.1.1 showed that the
different age groups are likely to respond similarly.
A simple OLS estimate conditional on observed characteristics (Model 1) shows no effect of the
Facebook-ad on pension literacy. However, the estimated coefficient might be biased due to non-
randomness in the probability of seeing the Facebook-ad. Therefore Model 2 shows estimates
13 Testing H0: β2 + δ2 = 0 in Model 8 gives a p-value of 0.18. 14 Table D2 in the Appendix uses the same set of questions for the analysis of the letters. Conclusions are highly
comparable using 3 and 5 pension literacy questions.

from an IV regression using the total time spent on Facebook per week as an instrumental
variable. The F-statistic of the excluded instrument shows that this instrument is highly relevant
in explaining the visibility of the Facebook-ad since its value is greater than 10. Correcting for
potential endogeneity does not change the conclusions from Model 1; we do not find an
significant effect of noticing the Facebook-call on pension literacy.15 This conclusion holds when
conditioning on self-reported importance and ability to search (Model 3).
From the simple probit (Model 4) we conclude that noticing the Facebook-ad increases the
probability of logging in by about 23%-points. Using an IV-probit to correct for a possible
endogeneity bias between seeing the Facebook-add and logging in we find an effect of 93%-
points (Model 5).16 This effect is slightly smaller, 87%-points, when conditioning on self-
reported importance and ability to search (Model 6).
[Insert Table 5. Effects of a Facebook-ad on pension awareness]
Reconciling our empirical evidence we find that the Facebook-ad is very strong in activating
respondents to do their pension check. However, the ad does not contribute to pension literacy.
Sending an informative letter to respondents is less effective in stimulating to do the pension
check, but it is more effective in raising pension literacy. However, this is only true if the
informative letter is negatively-framed. Positively-framed letters did not have an effect on
pension literacy whatsoever.
4.2 Robustness checks
In the baseline regression, we model pension literacy by assuming that the number of correct
answers (0-5) is a linear continuous dependent variable. However, this neglects the fact that the
indicator is a limited dependent variable. Therefore, we check the robustness of our conclusions
to using an ordered logit estimator. These estimation results are in line with our conclusions
based on using an OLS-estimator.
15 Adding an interaction effect between the letter and having seen the Facebook-ad shows a coefficient that is not
significant and does not change the main conclusions (not reported here). 16 Adding an interaction effect between the letter and having seen the Facebook-ad shows a coefficient that is
negative and significant (at the 1%-level). If a person received a letter and was aware of the Facebook-add, there is a
94,1% probability of logging in.

5 Conclusion
This paper analyzes the effectiveness of different communication channels and framing on
raising pension awareness. More specifically, we analyze the effectiveness of an informative
letter versus a Facebook-ad and the effectiveness of positive and negative framing to raise
pension awareness. Pension awareness is measured by 1) knowledge of the Dutch pension
system, and 2) actions undertaken to gain information regarding the personal financial situation.
To identify the causal effect of a letter, we rely on a randomized field experiment using a survey
administered to a representative sample of about 4,000 individuals in the Netherlands.
Randomization takes place in 1) receiving a letter with information regarding the pension system
as well as detailed information on where to find information about the personal situation and 2)
the framing (e.g. positive or negative wording) of the letter. To identify causal effects of a
Facebook-ad with the same content, we use an Instrumental Variables approach using self-
reported time spent on Facebook as an instrument.
Compared to prior literature we make three contributions. Firstly, whereas others investigated the
effect of framing on risk perception, annuity choices, social security claiming, retirement saving
intentions, or clicking on a video about pensions, this paper investigates the effect of framing on
pension awareness (six weeks after the information is presented). Secondly, we are the first to
investigate whether social media can play a role in increasing pension awareness. Thirdly, the
paper follows the suggestions for future research of Lusardi and Mitchell (2014) who argue that
more research is needed that uses carefully-designed experiments to evaluate effective ways to
increase knowledge of personal finances.
The results show that the Facebook-ad is very strong in activating respondents to login at the
mijnpensioenoverzicht.nl to see their personal financial situation. However, the ad does not
significantly contribute to the general knowledge of the pension system. Sending an informative
letter to respondents is less effective in stimulating active logging in to see the personal financial
situation, but it is significant in raising pension literacy. However, this is only true if the
informative letter is negatively-framed. Positively-framed letters did not have an effect on raising
pension awareness whatsoever. We do not find significant heterogeneous effects with regard to

age, gender and education level. These results are robust to a variety of specifications such as
specifications correcting for possible sample selection.
6 Discussion
Although estimation results are highly robust to different specifications and estimators we should
remain aware of possible drawbacks of our approach taken in the paper that are important to take
into account when interpreting the results. Pension awareness consists of two elements in the
paper. The first being objectively measured by several questions regarding the pension system.
The second, however, is not whether people have taken action to login but whether they say that
they have taken the action. There might be a difference between what people do and what people
say they do. The paper assumes that there is no difference, or at least that the differences are
random across the control and treatment groups, but future research might focus on revealed
instead of stated actions taken by merging administrative data about logins.
A second point of discussion is the small percentage of respondents that mentioned to be aware
of the Facebook-ad. Since only 45 out of the 2,166 targeted respondents remember seeing the
Facebook-ad, identification of the effect of the Facebook-ad relies on a very small sample of
positive respondents. Future research should address this difficulty of social media and
representative survey data more prominently. Also because internet use and survey data have
additional difficulties regarding the representativeness of the panel. Although PanelWizard
stratifies the sample of survey respondents in such a way that the panel is representative for the
Dutch population it should be kept in mind that the panel only consists of internet users. This
may lead to overestimation of the effect of the Facebook-ad. However, in the group aged 20-40,
for whom we test the Facebook-ad, internet coverage is very high in the Netherlands (12-24:
98.7% / 25-44: 98.2%)17 and should, therefore, not be a serious problem for the inference of
conclusions from our estimation results.
References
17 https://www.cbs.nl/nl-nl/nieuws/2016/22/acht-procent-van-de-nederlanders-nooit-op-internet
Agnew, J.R., Anderson, L.R., Gerlach, J.R., Szykman, L.R. (2008) Why choose annuities? An
experimental investigation of the role of gender, framing, and defaults, The American Economic
Review 98(2): 418-422.
Agnew, J.R., Bateman, H., Thorp, S. (2013) Financial literacy and retirement planning in
Australia, Numeracy 6(2): 1-25.
Aguiar, M., Hurst, E. (2005) Consumption versus expenditure, The Journal of Political Economy
113(5): 919-948.
Aguila, E., Attanasio, O., Meghir, C. (2011) Changes in consumption at retirement: Evidence
from panel data, The Review of Economics and Statistics 93(3): 1094-1099.
Alessie, R., Van Rooij, M., Lusardi, A. (2011) Financial literacy and retirement preparation in the
Netherlands, Journal of Pension Economics and Finance 10(4): 527-545.
Almenberg, J., Säve-Söderbergh, J. (2011) Financial literacy and retirement planning in Sweden,
Journal of Pension Economics and Finance 10(4): 585-598.
Arrondel, L., Debbich, M., Savignac, F. (2013) Financial literacy and financial planning in
France, Numeracy 6(2): 1-17.
Banks, J., Blundell, R., Tanner, S. (1998) is there a retirement-savings puzzle? The American
Economic Review 88(4): 769-788.
Bateman, H., Stevens, R., Lai, A. (2015) Risk information and retirement investment choice
mistakes under prospect theory, Journal of Behavioral Finance 16(4): 279-296.
Battistin, E., Brugiavini, A., Rettore, E., Weber, G. (2009) The retirement consumption puzzle:
Evidence from a Regression Discontinuity approach, The American Economic Review 99(5):
2209-2226.
Bauer, R., Eberhardt, I., Smeets, P. (2017) Financial incentives beat social norms: A field
experiment on retirement information search, mimeo.
Beckmann, E. (2013) Financial literacy and household savings in Romania, Numeracy 6(2): 1-22.

Bernheim, B.D., Skinner, J., Weinberg, S. (2001) What accounts for the variation in retirement
wealth among U.S. households? The American Economic Review 91(4): 832-857.
Bernheim, B.D., Garrett, D. (2003) The effects of financial education in the workplace: Evidence
from a survey of households, Journal of Public Economics 87: 1487-1519.
Beshears, J., Choi, J.J., Laibson, D., Madrian, B.C., Milkman, K.L. (2015) The effect of
providing peer information on retirement savings decisions, The Journal of Finance 70(3): 1161-
1201.
Block, L.G., Keller, P.A. (1995) When to accentuate the negative: The effects of perceived
efficacy and message framing on intentions to perform a health-related behavior, Journal of
Marketing Research 32(2): 192-203.
Bockweg, C., Ponds, E., Steenbeek, O., Vonken, J. (2017) Framing and the annuitization decision
– Experimental evidence from a Dutch pension fund. Journal of Pension Economics and
Finance, doi:10.1017/S147474721700018X.
Boisclair, D., Lusardi, A., Michaud, P.-C. (2015) Financial literacy and retirement planning in
Canada, Journal of Pension Economics and Finance 16(3): 277-296.
Brown, M., Graf, R. (2013) Financial literacy and retirement planning in Switzerland, Numeracy
6(2): 1-21.
Brown, J.R., Ivkovic, Z., Smith, P.A., Weisbenner, S. (2008) Neighbors matter: Causal
community effects and stock market participation, The Journal of Finance 63(3): 1509-1531.
Brown, J.R., Kapteyn, A., Mitchell, O.S. (2016) Framing and claiming: How information-
framing affects expected social security claiming behavior, The Journal of Risk and Insurance
83(1): 139-162.
Brown, K.M., Laschever, R.A. (2012) When they’re sixty-four: Peer effects and the timing of
retirement, American Economic Journal: Applied Economics 4(3): 90-115.
Browning, M., Lusardi, A. (1996) Household saving: Micro theories and micro facts, Journal of
Economic Literature 34(4): 1797-1855.

Bücher-Koenen, T., Lusardi, A. (2011) Financial literacy and retirement planning in Germany,
Journal of Pension Economics and Finance 10(4): 565-584.
Card, D., Ransom, M. (2011) Pension plan characteristics and framing effects in employee
savings behavior, The Review of Economics and Statistics 93(1): 228-243.
Chan, S., Stevens, A.H. (2008) What you don’t know can’t help you: Pension knowledge and
retirement decisions-making, The Review of Economics and Statistics 90(2): 253-266.
Chetty, R. (2015) Behavioral economics and public policy: A pragmatic perspective, The
American Economic Review, 105(5): 1-33.
Chou, W.S., Hunt, Y.M., Beckjord, E.B., Moser, R.P., Hesse, B.W. (2009) Social media use in
the United States: Implications for health communication, Journal of Medical Internet Research
11(4): e48.
Crossan, D., Feslier, D., Hurnard, R. (2011) Financial literacy and retirement planning in New
Zealand, Journal of Pension Economics and Finance 10(4): 619-635.
Delavande, A., Rohwedder, S., Willis, R.J. (2008) Preparation for retirement, financial literacy,
and cognitive resources, Michigan Retirement Research Center Research Paper No. 2008-190.
Diacon, S., Hasseldine, J. (2007) Framing effects and risk perception: The effect of prior
performance presentation format on investment fund choice, Journal of Economic Psychology
28(1): 31-52.
Duflo, E., Saez, E. (2002) Participation and investment decisions in a retirement plan: The
influence of colleagues’ choices, Journal of Public Economics 85(1): 121-148.
Duflo, E., Saez, E. (2003) The role of information and social interactions in retirement plan
decisions: Evidence from a randomized experiment, The Quarterly Journal of Economics 118(3):
815-842.
Eberhardt, W., Brüggen, E., Post, T., Hoet, C. (2017) Activating pension plan participants:
Investment and assurance frames Netspar Design Paper 72.

Ferraro, P.J., Price, M.K. (2013) Using nonpecuniary strategies to influence bahevior: Evidence
from a large-scale field experiment, The Review of Economics and Statistics 95(1): 64-73.
Fornero, E., Monticone, C. (2011) Financial literacy and pension plan participation in Italy,
Journal of Pension Economics and Finance 10(4): 547-564.
Galí, J. (1994) Keeping up with the Joneses: Consumption externalities, portfolio choice, and
asset prices, Journal of Money, Credit, and Banking 26(1): 1-8.
Gee, L.K., Jones, J., Burke, M. (2017) Social networks and labor markets: How strong ties relate
to job finding on Facebook’s social network, Journal of Labor Economics 35(2): 485-518.
Georgarakos, D., Pasini, G. (2011) Trust, sociability, and stock market participation, Review of
Finance 15(4): 693-725.
Georgarakos, D., Haliassos, M., Pasini, G. (2014) Household debt and social interactions, The
Review of Financial Studies 27(5): 1404-1433.
Gustman, A.L., Steinmeier, T.L., Tabatabai, N. (2012) Financial knowledge and financial literacy
at the household level, The American Economic Review 102(3): 309-313.
Haider, S.J., Stephens, M. (2007) Is there a retirement-consumption puzzle? Evidence using
subjective retirement expectations, The Review of Economics and Statistics 89(2): 247-264.
Hong, H., Kubik, J.D., Stein, J.C. (2004) Social interaction and stock-market participation, The
Journal of Finance 59(1): 137-163.
Househ, M., Borycki, E., Kushniruk, A. (2004) Empowering patients through social media: The
benefits and challenges, Health Informatics Journal 20(1): 50-58.
Hubbard, R.G., Skinner, J., Zeldes, S.P. (1995) Precautionary saving and social insurance, The
Journal of Political Economy 103(2): 360-399.
Hurd, M.D. (1989) Mortality risk and bequests, Econometrica 57(4): 779-813.
Hurd, M.D., Rohwedder, S. (2013) Heterogeneity in spending change at retirement, The Journal
of the Economics of Ageing Nov(1-2): 60-71.

Hurst, E. (2008) The retirement of a consumption puzzle, NBER Working Paper No. 13789.
Jappelli, T., Padula, M. (2013) Investment in financial literacy and savings decisions, Journal of
Baking & Finance 37(8): 2779-2792.
Johansen, K. (2013) Information search in pension plan decisions, Applied Economics Letters
20(18): 1648-1650.
Kahneman, D., Tversky, A. (1979) Prospect Theory: An analysis of decision under risk,
Econometrica 47(2): 263-292.
Kast, F., Meier, S., Pomeranz, D. (2012) Under-savers anonymous: Evidence on self-help groups
and peer pressure as a savings commitment device, NBER Working Paper No. 18417.
Kaustia, M., Knüpfer, S. (2012) Peer performance and stock market entry, Journal of Financial
Economics 104(2): 321-338.
Kavanaugh. A.L., Fox, E.A., Sheets, S.D., Yang, S., Li, L.T., Shoemaker, D.J., Natsev, A., Xie,
L. (2012) Social media use by government: From routine to the critical, Government Information
Quarterly 29: 480-491.
Klapper, L., Panos, G.A. (2011) Financial literacy and retirement planning: The Russian case,
Journal of Pension Economics and Finance 10(4): 599-618.
Knoef, M., Been, J., Alessie, R., Caminada, K., Goudswaard, K., Kalwij, A. (2016) Measuring
retirement savings adequacy: Developing a multi-pillar approach in the Netherlands, Journal of
Pension Economics & Finance 15(1): 55-89.
Laibson, D. (1997) Golden eggs and hyperbolic discounting, The Quarterly Journal of
Economics 112(2): 443-478.
Landerretche. O.M., Martinez, C. (2013) Voluntary savings, financial behavior, and pension
finance literacy: Evidence from Chile, Journal of Pension Economics and Finance 12(3): 251-
297.
Lusardi, A., Michaud, P.-C., Mitchell, O.S. (2017) Optimal financial knowledge and wealth
inequality, The Journal of Political Economy 125(2): 431-477.

Lusardi, A., Mitchell, O.S. (2011) Financial literacy and retirement planning in the United States,
Journal of Pension Economics and Finance 10(4): 509-525.
Lusardi, A., Mitchell, O.S. (2014) The economic importance of financial literacy: Theory and
evidence, Journal of Economic Literature 52(1): 5-44.
Madrian, B.C., Shea, D.F. (2001) The power of suggestion: Inertia in 401(k) participation and
savings behavior, The Quarterly Journal of Economics 116(4): 1149-1187.
Mangold, W.G., Faulds, D.J. (2009) Social media: The new hybrid element of the promotion
mix, Business Horizons 52(4): 357-365.
Mariger, R.P. (1987) A life-cycle consumption model with liquidity constraints: Theory and
empirical results, Econometrica 55(3): 533-557.
Miniaci, R., Monfardini, C., Weber, G. (2009) How does consumption change upon retirement?
Empirical Economics 38(2): 257-280.
Modigliani, F., Brumberg, R. (1954) Utility analysis and the consumption function: An
interpretation of cross-section data, Post Keynesian Economics, K.K. Kurihara, ed.
Montgomery, N.V., Szykman, L.R., Agnew, J.R. (2011) Temporal distance to retirement and
communication framing: Enhancing retirement financial decisions making, mimeo.
Mugerman, Y., Sade, O., Shayo, M. (2014) Long term savings decisions: Financial reform, peer
effects, and ethnicity, Journal of Economic Behavior & Organization 106: 235-253.
Rege, M., Telle, K., Votruba, M. (2012) Social interaction effects in disability pension
participation: Evidence from plant downsizing, The Scandinavian Journal of Economics 114(4):
1208-1239.
Robb, A.L., Burbidge, J.B. (1989) Consumption, income, and retirement, The Canadian Journal
of Economics 22(3): 522-542.
Rosen, H.S., Wu, S. (2004) Portfolio choice and health status, Journal of Financial Economics
72(3): 457-484.

Sekita, S. (2011) Financial literacy and retirement planning in Japan, Journal of Pension
Economics and Finance 10(4): 637-656.
Smith, S. (2006) The retirement-consumption puzzle and involuntary early retirement: Evidence
from the British Household Panel Survey, The Economic Journal 116(510): C130-C148.
Steul (2006) Does the framing of investment portfolios influence risk-taking behavior? Some
experimental results. Journal of Economic Psychology 27: 557-570.
Thaler, R.H., Benartzi, S. (2004) Save more tomorrow: Using behavioral economics to increase
employee saving, Journal of Political Economy 112(1): s164-s187.
Thaler, R.H., Sunstein, C.R., Balz, J.P. (2012) Choice architecture. The behavioral foundations of
public policy, Ch.25, E. Shafir, ed.
Van Rooij, M.C.J., Lusardi, A., Alessie, R.J.M. (2011) Financial literacy and retirement planning
in the Netherlands, Journal of Economic Psychology 32: 593-608.
Van Rooij, M.C.J., Lusardi, A., Alessie, R.J.M. (2012) Financial literacy, retirement planning,
and household wealth, The Economic Journal 122(560): 449-478.
Van Rooij, M.C.J., Teppa, F. (2014) Personal traits and individual choices: Taking action in
economic and non-economic decisions, Journal of Economic Behavior & Organization 100: 33-
43.
Venti, S.F., Wise, D.A. (1998) The cause of wealth dispersion at retirement: Choice or chance?
The American Economic Review 88(2): 185-191.
Wang, X., Yu, C, Wei, Y. (2012) Social media peer communication and impacts on purchase
intentions: A consumer socialization framework, Journal of Interactive Marketing 26(4): 198-
208.
Waters, R.D., Burnett, E., Lamm, A., Lucas, J. (2009) Engaging stakeholders through social
networking: How nonprofit organizations are using Facebook, Public Relations Review 35(2):
102-106.

Appendix A Positive and negative letter


Appendix B Facebook-ad
Appendix C Effects of logging in at mijnpensioenoverzicht.nl
[Table C1 here]
Appendix D Pension literacy questions
[Table D1 here]
[Table D2 here]

Tables
Table 1. Sample
Letter
Positive Negative None
Sample aged 20-40
Gross sample 1,145 1,124 2,291
Letter sent back 23 21 n/a
Bouncers 46 45 92
Deleted after check 17 33 64
Chipped surveys 14 8 35
No cooperation 504 481 1,073
Complete surveys 542 536 1,027
Response-rate 52% 53% 51%
Sample aged 41-64
Gross sample 883 727 1,777
Letter sent back 6 8 n/a
Bouncers 35 29 71
Deleted after check 26 6 36
Chipped surveys 8 14 37
No cooperation 279 177 595
Complete surveys 528 493 1,038
Response-rate 66% 74% 65%

Table 2. Descriptives
Letter Facebook Total
Positive Negative None No Yes
Mean S.D. Mean S.D. Mean S.D. Mean S.D. Mean S.D. Mean S.D.
Female 0.47 0.50 0.45 0.50 0.44 0.50 0.49 0.50 0.42 0.50 0.45 0.50
Low edu. level 0.18 0.38 0.17 0.37 0.17 0.38 0.13 0.33 0.11 0.32 0.17 0.38
Median edu. level 0.47 0.50 0.46 0.50 0.49 0.50 0.48 0.50 0.56 0.50 0.48 0.50
High edu. level 0.35 0.48 0.37 0.48 0.34 0.47 0.39 0.49 0.33 0.48 0.35 0.48
Single household 0.28 0.45 0.23 0.42 0.18 0.38 0.22 0.41 0.16 0.37 0.22 0.41
Children 0.20 0.40 0.34 0.48 0.32 0.47 0.30 0.46 0.33 0.48 0.29 0.46
Full-time work 0.40 0.49 0.38 0.49 0.41 0.49 0.40 0.49 0.51 0.51 0.40 0.49
Age 20-24 0.07 0.26 0.07 0.26 0.08 0.27 0.15 0.36 0.24 0.43 0.08 0.27
Age 25-29 0.12 0.33 0.12 0.32 0.12 0.33 0.24 0.42 0.40 0.50 0.12 0.33
Age 30-34 0.14 0.35 0.14 0.35 0.13 0.31 0.28 0.45 0.09 0.29 0.14 0.35
Age 35-40 0.17 0.38 0.18 0.39 0.16 0.37 0.34 0.47 0.27 0.45 0.17 0.38
Age 41-49 0.21 0.41 0.20 0.40 0.22 0.41 0.00 0.00 0.00 0.00 0.21 0.41
Age 50-59 0.22 0.42 0.23 0.42 0.11 0.41 0.00 0.00 0.00 0.00 0.22 0.42
Age 60-64 0.06 0.23 0.06 0.23 0.06 0.24 0.00 0.00 0.00 0.00 0.06 0.24
Facebook 0.01 0.12 0.02 0.13 0.01 0.11 0.00 0.00 1.00 0.00 0.01 0.12
Observations 1,092
1,051
2,154
2,121
45
4,297

Table 3. Effects of randomized letters on pension awareness
Dependent variable: Pension literacy (0-5)
Model 1 Model 2 Model 3 Model 4
OLS OLS OLS OLS
Coeff. S.E. Coeff. S.E. Coeff. S.E. Coeff. S.E.
Letter 0.06 ** 0.03 0.11 *** 0.04 0.06 * 0.03 0.10 ** 0.04
Positive letter
-0.08 * 0.05
-0.08 * 0.05
Control variables
Female
-0.04
0.04 -0.04
0.04
Low edu. level
-0.12 *** 0.04 -0.12 *** 0.04
High edu. level
0.19 *** 0.04 0.19 *** 0.04
Single household
0.02
0.04 0.02
0.04
Children
0.01
0.04 0.00
0.04
Full-time work
-0.03
0.04 -0.03
0.04
Age 25-29
0.09
0.07 0.09
0.07
Age 30-34
0.17 ** 0.07 0.17 ** 0.07
Age 35-40
0.30 *** 0.07 0.30 *** 0.07
Age 41-49
0.34 *** 0.07 0.35 *** 0.07
Age 50-59
0.47 *** 0.07 0.48 *** 0.07
Age 60-64
0.53 *** 0.08 0.53 *** 0.08
Constant 2.11 *** 0.02 2.11 *** 0.02 1.79 *** 0.06 1.79 *** 0.06
Observations 4,212
4,212
4,212
4,212

(Continued)
Dependent variable: Pension check (0,1)
Model 5 Model 6 Model 7 Model 8
Probit Probit Probit Probit
Coeff. S.E. Coeff. S.E. Coeff. S.E. Coeff. S.E.
0.02
0.01 0.03
0.02 0.03 * 0.01 0.03 * 0.02
-0.01
0.02
-0.01
0.02
-0.09 *** 0.02 -0.09 *** 0.02
-0.01
0.02 -0.01
0.02
0.04 ** 0.02 0.04 ** 0.02
-0.04 ** 0.02 -0.04 ** 0.02
-0.02
0.02 -0.02
0.02
-0.04 ** 0.02 -0.04 ** 0.02
0.12 *** 0.04 0.12 *** 0.04
0.13 *** 0.03 0.13 *** 0.03
0.11 *** 0.03 0.11 *** 0.03
0.12 *** 0.03 0.12 *** 0.03
0.18 *** 0.03 0.18 *** 0.03
0.29 *** 0.04 0.29 *** 0.04
0.32 *** 0.01 0.32 *** 0.01 0.32 *** 0.01 0.32 *** 0.01
4,124
4,124
4,124
4,124

Table 4. Effects of a Facebook-ad on pension awareness
Dependent variable: Pension literacy (0-3)
Model 1 Model 2 Model 3
OLS IV IV
Coeff. S.E. Coeff. S.E. Coeff. S.E.
Letter 0.03
0.05 0.02
0.04 0.03
0.04
Facebook 0.13
0.12 0.52
1.07 0.36
1.05
Control variables
Female -0.02
0.04 -0.01
0.04 0.00
0.04
Low edu. level 0.00
0.05 0.00
0.05 0.01
0.06
High edu. level 0.07 * 0.04 0.07 * 0.04 0.07 * 0.04
Single household 0.03
0.05 0.03
0.05 0.03
0.05
Children 0.05
0.01 0.05
0.04 0.07
0.05
Full-time work 0.01
0.04 0.01
0.04 0.02
0.04
Age 25-29 0.00
0.06 0.00
0.06 -0.04
0.06
Age 30-34 0.00
0.06 0.01
0.06 -0.04
0.07
Age 35-40 0.05
0.06 0.06
0.06 0.00
0.07
Important (1-5)
0.05 ** 0.02
Search (1-5)
0.02
0.02
Constant 0.73 *** 0.05 0.72 *** 0.06 0.50 *** 0.09
Observations 2,128
2,128
2,007
F-stat. first stage
25.10
26.42

(Continued)
Dependent variable: Pension check (0,1)
Model 4 Model 5 Model 6
Probit IV-Probit IV-Probit
Coeff. S.E. Coeff. S.E. Coeff. S.E.
0.04 ** 0.02 0.03
0.02 0.03 * 0.02
0.23 *** 0.06 0.93 *** 0.03 0.87 *** 0.05
-0.09 *** 0.02 -0.08 *** 0.02 -0.06 *** 0.02
0.04
0.03 0.04
0.03 0.05 * 0.03
0.07 *** 0.02 0.06 *** 0.02 0.04 ** 0.02
-0.06 ** 0.03 -0.06 ** 0.02 -0.04 * 0.02
-0.01
0.02 -0.01
0.02 0.01
0.02
-0.04 ** 0.02 -0.04 ** 0.02 -0.04 * 0.02
0.11 *** 0.03 0.10 *** 0.03 0.04
0.03
0.13 *** 0.03 0.13 *** 0.03 0.05
0.03
0.10 *** 0.03 0.10 *** 0.03 0.01
0.04
0.07 *** 0.01
0.09 *** 0.01
0.28 *** 0.01 0.29 *** 0.01 0.30 *** 0.01
2,067
2,067
1,922

Table 5. Heterogeneous effects of randomized letters
Dependent variable: Pension literacy (0-5)
Model 1 Model 2 Model 3
OLS OLS OLS
Coeff. S.E. Coeff. S.E. Coeff. S.E.
Letter 0.13 ** 0.06 0.13 ** 0.05 0.07
0.05
Letter · Age 20-40a 0.06
0.08
Letter · Femalec
-0.08
0.08
Letter · High educatede
0.08
0.08
Positive letter -0.12 * 0.06 -0.14 ** 0.06 -0.06
0.06
Positive letter · Age 20-40b 0.07
0.09
Positive letter · Femaled
0.13
0.09
Positive letter · High educatedf
-0.04
0.10
Control variables included Yes
Yes
Yes
Observations 4,212
4,124
4,212
Robust standard errors are presented, * denotes significant at the 10% level, ** at the 5% level and *** at the 1% level.
a Linear combination gives a p-value=0.21 (Model 1) and p-value=0.12 (Model 4) respectively.
b Linear combination gives a p-value=0.52 (Model 1) and p-value=0.88 (Model 4) respectively.
c Linear combination gives a p-value=0.35 (Model 2) and p-value=0.38 (Model 5) respectively.
d Linear combination gives a p-value=0.94 (Model 2) and p-value=0.80 (Model 5) respectively.
e Linear combination gives a p-value=0.03 (Model 3) and p-value=0.06 (Model 6) respectively.
f Linear combination gives a p-value=0.20 (Model 3) and p-value=0.70 (Model 6) respectively.

(Continued)
Dependent variable: Pension check (0,1)
Model 4 Model 5 Model 6
Probit Probit Probit
Coeff. S.E. Coeff. S.E. Coeff. S.E.
0.02
0.02 0.03
0.02 0.01
0.02
0.02
0.03
-0.01
0.04
0.04
0.04
-0.02
0.02 0.00
0.03 0.00
0.03
0.02
0.04
0.00
0.04
-0.01
0.04
Yes
Yes
Yes
4,124
4,124
4,124

Table C1. The effects of logging in at mijnpensioenoverzicht.nl
Did logging in increase... (1-5) Mean S.D.
Insight in personal pension situation? 3.59 1.06
Confidence in personsal pension situation? 3.05 1.10
Interest in personal pension situation? 3.31 1.07
Actions that can be taken with the information? 3.42 1.06
Awareness of having a too low pension? 2.71 1.34

Table D1. Pension literacy questions and answers
% Confidence (1-5)
Q1 "What happens with public pension contributions?"
a) Invested for my pension benefits after retirement 12.18 2.77
b) Used to pay pensions for current retirees 37.94 3.39
c) Partly invested and partly used to pay pensions for current retirees 49.88 3.10
Q2 "Who pays contributions to employer-related pensions?"
a) Usually employees only 9.72 2.70
b) Usually employers only 8.56 2.86
c) Usually both employees and employers 81.73 3.63
Q3
"When the financial condition of a pension fund is poor, the pension
fund needs to cut pensions. Which pension fund participants are hit
by a pension cut?"
a) Retirees 32.87 3.32
b) Active employees 20.42 2.86
c) All (ex-)employees and retirees 46.70 3.34
Q4
"What is roughly the percentage of earnings that is on average used
to pay pension contributions (by all parties)?
a) 10% 34.03 2.43
b) 15% 39.23 2.36
c) 20% 20.00 2.57
d) 30% 6.74 2.67
Q5 "Lisa and Femke are colleagues with the same hourly wage
and pension plan. Lisa works 20 h/w and Femke 40 h/w. How high
is Lisa's employer-related pension?"
a) Half of Femke's pension. 27.66 2.81
b) Less than half of Femke's pension. 13.84 2.83
c) Depends on the pension plan. 58.50 2.87

Table D2. Pension literacy with the Facebook information only.
Dependent variable: Pension literacy (0-3)
Model 1 Model 2 Model 3 Model 4
OLS OLS OLS OLS
Coeff. S.E. Coeff. S.E. Coeff. S.E. Coeff. S.E.
Letter 0.05 * 0.02 0.07 ** 0.03 0.05 * 0.02 0.07 ** 0.03
Positive letter
-0.05
0.04
-0.05
0.04
Control variables
included No
No
Yes
Yes
Observations 4,212
4,212
4,212
4,212
Robust standard errors are presented, * denotes significant at the 10% level, ** at the 5% level and *** at the 1% level.