rajadurai subramaniam hsdpa macro-to-indoor …
TRANSCRIPT

RAJADURAI SUBRAMANIAM HSDPA MACRO-TO-INDOOR MOBILITY MEASUREMENTS USING WCDMA REPEATER AND PICO CELL Master of Science Thesis
Supervisors: M.Sc. Tero Isotalo M.Sc. Panu Lähdekorpi Examiner : Prof. Jukka Lempiäinen Examiners and topic approved by the Faculty Council of the Faculty of Computing and Electrical Engineering on October 6 2010.

II
ABSTRACT TAMPERE UNIVERSITY OF TECHNOLOGY Master’s Degree Programme in Information Technology SUBRAMANIAM, RAJADURAI: HSDPA macro-to-indoor mobility measurements using WCDMA repeater and pico cell Master of Science Thesis, 61 pages, 4 Appendix pages August 2011 Major subject: Communication engineering Examiners: Prof. Jukka Lempiäinen, M.Sc. Tero Isotalo, M.Sc. Panu Lähdekorpi Keywords: UMTS, radio network planning, WCDMA Repeater, indoor network planning, HSPA With the advancements in DSP, mobile terminals are becoming smaller and smarter every day. The more the mobile becoming data centric, the more is the number of users from indoors. From radio network planning point of view, these advancements introduced two major demands on mobile communication networks: faster and more spectral efficient networks, and better quality of service in indoors. This thesis studies the implementation of a dedicated indoor system and a WCDMA outdoor-to-indoor analogue repeater for a university building at the cell edge of an outdoor macrocell. The main emphasis is to compare the performance of the two systems in the cell change location when the user enters the indoor from outdoor coverage area.
The thesis is divided into two parts. In the literature study part, the fundamental principles of wireless communication and basics of UMTS are presented. The architecture and basic concepts of HSDPA and guidelines to radio network planning are also discussed. In the measurement campaign part, the pico cell and repeater implementations for indoor coverage are studied, with focus on the HS-DSCH cell change region and the results are compared with the macrocell coverage scenario. The results of measurement rounds carried out under loaded scenario and with lower category mobiles than the one used for the study are also discussed.
The study indicates that the HS-DSCH cell change introduces a momentary drop in throughput of pico cell scenario while the user movement from outdoor coverage to repeater coverage area is seamless. The study also highlights the importance of proper repeater donor antenna implementation. The effect of disoriented donor antenna on CQI value and hence the throughput of HSDPA systems is explicit from the results. It is shown from the study that the interference through repeaters also affects the region under the macrocell that is close to the repeater antenna. According to the results, dedicated indoor base stations are a good choice for indoors with high capacity requirements while repeater offers better coverage solution at lower cost. The conclusion is in accordance with the previous studies carried out with repeaters and dedicated indoor base stations.

III
PREFACE
This Master’s of Science Thesis, ‘Performance comparison of WCDMA outdoor-to-indoor repeater with pico cell in cell reselection region’, bas been written for Master of Science Degree in the Department of Communication Engineering in Tampere University of Technology, Finland. The research work has been carried out and written during summer 2011.
I would like to thank my supervisor M.Sc. Tero Isotalo for his time and guidance all through the process, even during his summer vacation. I would also like to thank M.Sc. Panu Lähdekorpi and my examiner Prof. Jukka Lempiäinen for their great advice and support. Special thanks to my co-workers, Beatriz Molero Ródenas for proof reading my work, M.Sc. Niels Terp Kjeldgaard Jørgensen and Ph.D Jarno Niemelä for their technical support.
I express my sincere gratitude to my sister Geetha Kanniappan for her unconditional love and support towards me and the family. Special thanks to my sister Ananthalakshmi Rameshbabu and my brothers Sandhilyan and Leo Amarnath for their care and support all through my life. Thanks to my friends here in Finland for being with me in all weathers and keeping my social life alive and active.
Dedicated to my parents Shantha Subramaniam and T.M. Subramaniam.
Tampere, August 4, 2011
Rajadurai Subramaniam
[email protected] +358 40 3630055

IV
TABLE OF CONTENTS
1. INTRODUCTION .................................................................................................... 1
2. WIRELESS COMMUNICATIONS PRINCIPLES ................................................... 3
2.1 Cellular concept ............................................................................................. 3
2.2 Multiple access schemes ................................................................................. 4
2.3 Mobile radio channel ...................................................................................... 5
2.3.1 Propagation principles ............................................................................. 6
2.3.2 Multipath propagation .............................................................................. 7
2.4 Propagation environment ................................................................................ 9
2.4.1 Characteristics of propagation environment ............................................. 9
2.4.2 Indoor propagation environment ............................................................ 10
2.1.1 Building penetration .............................................................................. 11
3. UNIVERSAL MOBILE TELECOMMUNICATION SYSTEM ............................ 12
3.1 Architecture.................................................................................................. 13
3.1.1 UE ......................................................................................................... 13
3.1.2 UTRAN ................................................................................................. 13
3.1.3 CN ......................................................................................................... 13
3.2 WCDMA for UMTS..................................................................................... 14
3.2.1 Main Parameters in WCDMA ................................................................ 14
3.2.2 Spreading and Despreading.................................................................... 15
3.2.3 Multipath channels and RAKE receivers ................................................ 17
3.2.4 Power control ........................................................................................ 18
3.2.5 Soft and softer Handover ....................................................................... 18
4. HIGH–SPEED PACKET ACCESS SYSTEM ....................................................... 20
4.1 HSPA Architecture ....................................................................................... 21
4.2 HSDPA ........................................................................................................ 22
4.2.1 Shared-channel concept ......................................................................... 22

V
4.2.2 Channel-dependent scheduling............................................................... 24
4.2.3 Hybrid ARQ with soft combining .......................................................... 24
4.2.4 Rate control and modulation scheme ...................................................... 25
4.2.5 Mobility ................................................................................................. 26
4.2.6 HSUPA ................................................................................................. 26
5. RADIO NETWORK PLANNING FOR UMTS ...................................................... 28
5.1 Macrocellular radio network planning process ................................................. 28
5.1.1 Preplanning – dimensioning........................................................................ 29
5.1.2 Detailed planning ....................................................................................... 29
5.1.3 Post planning – optimization....................................................................... 30
5.2 Indoor radio network planning ......................................................................... 30
5.2.1 Indoor planning principles .......................................................................... 31
5.2.2 Indoor network solutions ............................................................................ 31
5.3 Multi-layer topology........................................................................................ 33
5.3.1 Interference ................................................................................................ 34
5.3.2 Handover and mobility ............................................................................... 34
5.4 Performance indicators .................................................................................... 35
6. MEASUREMENT CAMPAIGN ........................................................................... 36
6.1 Measurement locations .................................................................................... 36
6.2 Measurement setup .......................................................................................... 38
6.2.1 Measurement environment.......................................................................... 38
6.2.2 Measurement equipment ............................................................................. 40
6.3 Measurement routes ........................................................................................ 40
6.4 Preliminary measurements ............................................................................... 41
7. RESULTS ............................................................................................................. 43
7.1 Line of sight measurements: Route A .............................................................. 43
7.2 Non line of sight measurements: Routes B and C............................................. 49
7.3 HS-DSCH cell change ..................................................................................... 51
7.4 Loaded scenario .............................................................................................. 53
7.5 Error analysis .................................................................................................. 55
VI
8. CONCLUSIONS AND DISCUSSION .................................................................. 57
REFERENCES ........................................................................................................... 59
APPENDIX ................................................................................................................ 62

VII
LIST OF SYMBOLS
S Angular spread
Average delay
BTSh Base station antenna height B Breakpoint distance
cf Coherence bandwidth
S Delay spread
d Distance ( )P Distribution of angular power
0/cE N Energy per chip to noise ratio
Mean angle
MSh Mobile station antenna height
( )P Power delay profile
gP Processing gain
rP Received power
rG Receiver antenna gain
cW System chip rate
_ totP Total received power
tP Transmitted power
tG Transmitter antenna gain R User bit rate
Wavelength

VIII
LIST OF ABBREVIATIONS
16-QAM 16 Quadrature Amplitude Modulation 2.5G Enhanced 2nd Generation 2G 2nd Generation 3G 3rd Generation 3GPP 3rd Generation Partnership Project 4G 4th Generation 64-QAM 64 Quadrature Amplitude Modulation AC Admission Control ACK Acknowledgement ADSL Asynchronous Digital Subscriber Line AMC Adaptive Modulation and Coding AMPS Advanced Mobile Phone System BER Bit Error Rate BLER Block Error Rate BMC Broadcast/Multicast Control Protocol BPF Band Pass Filter BPSK Binary Phase Shift Keying BS Base Station CDMA Code Division Multiple Access CN Core Network CQI Channel Quality Indicator CRC Cyclic Redundancy Check CS Circuit Switched D-AMPS Digital Advanced Mobile Phone System DAS Distributed Antenna System DCH Dedicated Channel DL Downlink DPDCH Dedicated Physical Data Channel DS-CDMA Direct Sequence Code Division Multiple Access E-DCH Enhanced Dedicated Channel EDGE Enhanced Data rates for Global Evolution GSM E-DPCCH E-DCH Dedicated Physical Control Channel E-DPDCH E-DCH Dedicated Physical Data Channel EIRP Effective Isotropic Radiated Power FDD Frequency Division Duplex

IX
FDMA Frequency Division Multiple Access FEC Forward Error Correction GGSN Gateway GPRS Support Node GMSC Gateway MSC GPRS General Packet Radio Service GSM Global System for Mobile HARQ Hybrid Automatic Repeat Request HLR Home Location Register HO Handover HS High Speed HSDPA High Speed Downlink Packet Access HS-DPCCH High Speed Dedicated Physical Control Channel HS-DSCH High Speed Downlink Shared Channel HSPA High Speed Packet Access HSPA+ High Speed Packet Access Evolution HS-PDSCH High Speed Physical Downlink Shared Channel HS-SCCH High Speed Shared Control Channel HSUPA High Speed Uplink Packet Access HTTP Hypertext Transfer Protocol IMT-2000 International Mobile Telecommunications-2000 IP Internet Protocol IR Incremental Redundancy ITU International Telecommunication Union KPI Key Performance Indicators L1 Layer 1 L2 Layer 2 L3 Layer 3 LNA Low Noise Amplifier LOS Line-of-sight LTE Long Term Evolution MAC Medium Access Control ME Mobile Equipment MRC Maximal Ratio Combining MS Mobile Station MSC Mobile Switching Centre NACK Negative Acknowledgement NLOS Non-line-of-sight NMT Nordic Mobile Telephone OFDM Orthogonal Frequency Division Multiple Access OVSF Orthogonal Variable Spreading Factor PC Power Control

X
P-CPICH Primary Common Pilot Channel PDC Personal Digital Cellular PDCP Packet Data Convergence Protocol PG Processing Gain PS Packet Switched PSTN Public Switched Telephone Network QoS Quality of Service QPSK Quadrature Phase Shift Keying R4 Release 4 R5 Release 5 R99 Release 99 RAT Radio Access Technology RLC Radio Link Control RMS Root Mean Square RNC Radio Network Controller RNP Radio Network Planning RNS Radio Network Subsystem RRC Radio Resource Control RRM Radio Resource Management RSCP Received Signal Code Power RSSI Received Signal Strength Indicator SF Spreading Factor SfHO Softer Handover SGSN Serving GPRS Support Node SHO Soft Handover SIR Signal-to-interference ratio TB Transport Block TDD Time Division Duplex TDMA Time Division Multiple Access TP Throughput TTI Transmission Time Interval TUT Tampere University of Technology TX Transmission UE User Equipment UL Uplink UMTS Universal Mobile Telecommunication System USIM UMTS Subscriber Identity Module UTRAN UMTS Terrestrial Radio Access Network VLR Visitor Location Register WCDMA Wideband Code Division Multiple Access

1. INTRODUCTION
Mobile communications has witnessed a very rapid growth phase during the last two decades, especially after the successful launch of Global System for Mobile (GSM) communications. This period has also seen the widespread usage of wireless personal terminals for voice and data services. As new data services flooded the market, the devices grew smarter and went data demanding. However, the second generation of telecommunication systems (2G), like GSM, which were voice based networks with limited data handling capabilities, needed improvements to handle the demand. The third generation systems (3G), developed later, have provided higher bit rate services and enabled high quality images and video to be transmitted and received. The 3G systems also strived to use minimum radio spectrum per user, as rapidly growing number of users and limited bandwidth resources required improved spectrum efficiency.
Wideband Code Division Multiple Access (WCDMA), introduced by 3rd Generation Partnership Project (3GPP), emerged as the most widely accepted third generation air interface. In Europe, the 3G mobile cellular system was referred to as Universal Mobile Terrestrial System (UMTS). With a maximum data rate of 384 kbps, UMTS 3G networks provided the convergence between mobile telephony, broadband access, and internet protocol (IP) backbones. Further improvements to UMTS, called High Speed Downlink Packet Access (HSDPA) standard, were introduced by 3GPP in Release 5 in 2002. This specification was followed by the introduction of High Speed Uplink Packet Access (HSUPA) in Release 6 in 2004. HSDPA provided data rates up to 14.4 Mbps in the downlink direction while HSUPA provides 5.7 Mbps in the uplink direction.
With the increase in demand for data traffic, the share of traffic arising indoors also increased over the years. Studies predict the indoor user percentage in 2015 will be around 70% to 80% and the service providers will face a new challenge of cost effective radio network planning [1]. In most of the cases, even a tight grid of traditional macro cell network may not be enough to provide quality coverage in indoors. This is especially true in the case of HSDPA and later releases. Providing the service in indoors is also technically different compared to outdoors. Apart from technicalities, the cost of implementation and the number of available carriers are the limiting factors for service providers for indoor network solutions.
One of the solutions for providing quality indoor coverage is a dedicated indoor base station either with a single antenna or with a distributed antenna system. Studies

2
prove this as the most reasonable solution for high traffic density regions [2, 3]. However, they need changes in the network design and involve HS-DSCH cell change when the user moves from outdoor network coverage to indoor coverage area. Thus, the cost of implementing such networks and planning requirements may sometimes prevent the service providers from choosing dedicated indoor base station when the capacity demands are not high.
WCDMA outdoor-to-indoor repeaters, the other solution for indoor radio network planning, do not involve a separate backhaul link to the core network. It is cost efficient and simple compared to dedicated indoor base stations. The movement of users from outdoor coverage area to repeater coverage is seamless, as they do not involve handovers. Repeaters are flexible as they can be added to a network on need basis. Despite the fact that repeaters offer a better solution for indoor coverage problems, the capacity of repeaters is limited by macro cell capacity.
In this Master of Science thesis, the mobility measurements of a dedicated indoor system and a WCDMA outdoor-to-indoor repeater is compared for HSDPA at cell change region. The special focus is on when the user enters the indoor coverage area from outdoors. The thesis is organized in two divisions, theoretical background and measurement campaign. In the first part, Chapter 2 briefs on wireless communication principles, Chapter 3 on fundamentals of UMTS, Chapter 4 about HSPA system and Chapter 5 about radio network planning with separate sections on indoor network planning. In the second part, Chapter 6 discusses the measurement setup while Chapter 7 discusses the result with their in-depth analysis. Conclusions and discussion on the results are presented in Chapter 8.
3
2. WIRELESS COMMUNICATIONS PRINCIPLES
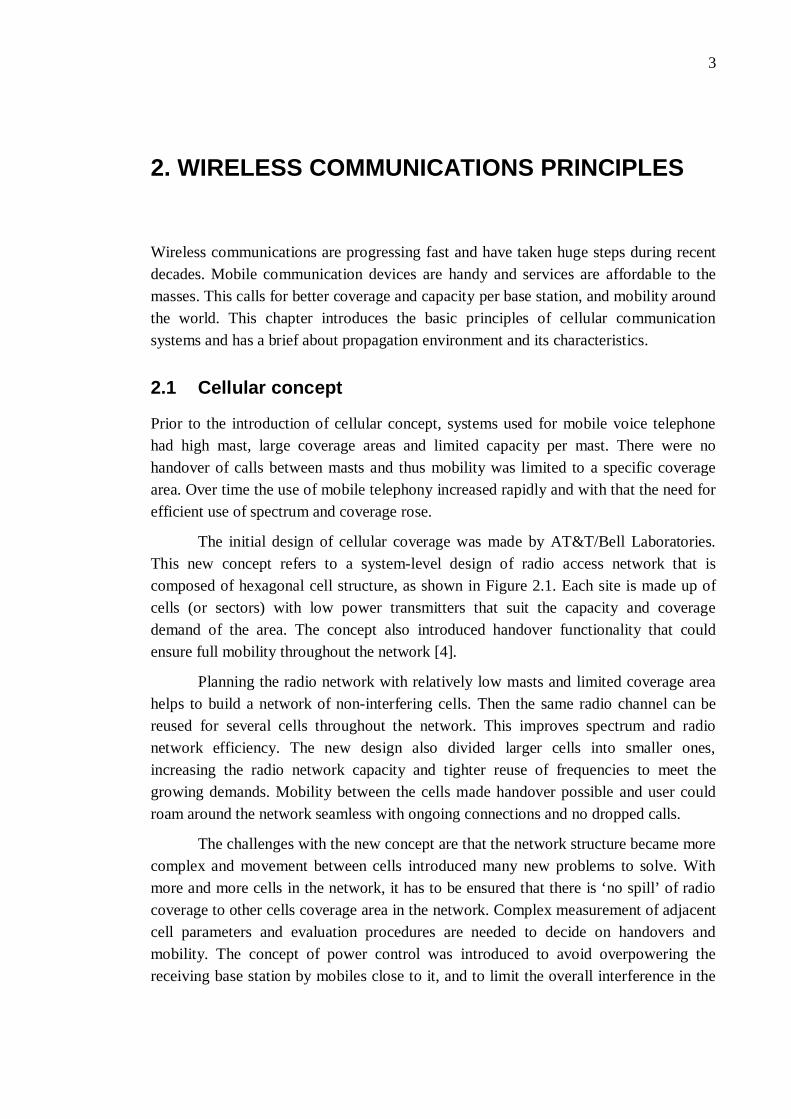
Wireless communications are progressing fast and have taken huge steps during recent decades. Mobile communication devices are handy and services are affordable to the masses. This calls for better coverage and capacity per base station, and mobility around the world. This chapter introduces the basic principles of cellular communication systems and has a brief about propagation environment and its characteristics.
2.1 Cellular concept
Prior to the introduction of cellular concept, systems used for mobile voice telephone had high mast, large coverage areas and limited capacity per mast. There were no handover of calls between masts and thus mobility was limited to a specific coverage area. Over time the use of mobile telephony increased rapidly and with that the need for efficient use of spectrum and coverage rose.
The initial design of cellular coverage was made by AT&T/Bell Laboratories. This new concept refers to a system-level design of radio access network that is composed of hexagonal cell structure, as shown in Figure 2.1. Each site is made up of cells (or sectors) with low power transmitters that suit the capacity and coverage demand of the area. The concept also introduced handover functionality that could ensure full mobility throughout the network [4].
Planning the radio network with relatively low masts and limited coverage area helps to build a network of non-interfering cells. Then the same radio channel can be reused for several cells throughout the network. This improves spectrum and radio network efficiency. The new design also divided larger cells into smaller ones, increasing the radio network capacity and tighter reuse of frequencies to meet the growing demands. Mobility between the cells made handover possible and user could roam around the network seamless with ongoing connections and no dropped calls.
The challenges with the new concept are that the network structure became more complex and movement between cells introduced many new problems to solve. With more and more cells in the network, it has to be ensured that there is ‘no spill’ of radio coverage to other cells coverage area in the network. Complex measurement of adjacent cell parameters and evaluation procedures are needed to decide on handovers and mobility. The concept of power control was introduced to avoid overpowering the receiving base station by mobiles close to it, and to limit the overall interference in the

4
network. The challenge with power control is to monitor the signal strength and the quality of the radio signal received in both ends of the link [4].
Figure 2.1: Cellular network layout with three-cell base station.
Cells are typically classified with prefixes such as macro, micro, pico and femto based on the magnitude of cell coverage area. Generally, macro cell antennas are above the surrounding rooftop level and the cell radius is over 1 km. Microcells are designed for relatively high traffic density region. Picocells and femtocells are designed for indoor environment like small to medium sized office building or residence and have a cell range from 10 to 40 meters [4]. Chapter 5 introduces indoor cells in more detail.
2.2 Multiple access schemes
Multiple access schemes allow several mobile users to share a finite amount of radio spectrum simultaneously. For quality communication, the sharing must be done without much degradation in performance of the system [5]. The three major access techniques used to share the available bandwidth in a wireless communication system are frequency division multiple access (FDMA), time division multiple access (TDMA) and code division multiple access (CDMA). Figure 2.2 depicts the access schemes.
In TDMA, the radio spectrum is divided into time slots, and each slot is assigned to a user to either transmit or receive. Transmission in TDMA system follows buffer-and-burst method making it discontinuous for any user. Hence digital data and digital modulation must be used with TDMA systems [5]. Also TDMA system needs proper synchronization to avoid interference to adjacent channels.
In FDMA, users are allocated a unique frequency band or channel on demand for service. FDMA technique is immune to power dynamic faults and timing problems. The complexity of FDMA mobiles are lower compared to TDMA systems. When a

5
FDMA channel is not in use, it goes idle and cannot be used by other users to share or increase capacity. For this reason it is less efficient and not implemented in modern mobile communications. Orthogonal FDMA (OFDMA) is a combination of TDMA and FDMA and the resources are allocated in the time-frequency space. It is a variable bandwidth multiple access method with better spectral efficiency.
Figure 2.2: Multiple access techniques.
CDMA is based on spread spectrum multiple access techniques and the system separates the user based on codes. Here a spreading signal is used to convert a narrowband message signal into a large bandwidth signal. The spreading signals are pseudo-noise code sequences with a chip rate greater than the message signal. Each user is assigned its own pseudorandom codeword which is approximately orthogonal to all other codewords in the system. A time correlation operation is performed by the receiver to detect the specific desired codeword while other codes come out as noise due to decorrelation. Most CDMA implementations provide power control to avoid stronger received signal levels raising the noise floor at base station demodulator. CDMA technique is more flexible to capacity changes and is a common access method in modern communication systems. Chapter 3 covers the system more comprehensively.
2.3 Mobile radio channel
The mobile radio channel, the air interface between the transmit antenna and the receiving antenna, introduces fundamental limitations on the performance of wireless communication systems. Unlike wired channels, radio channels are extremely random and are affected by various obstacles and movement of the receiver. Modeling the radio channel is one of the most difficult parts of the mobile radio system design and is carried out in a statistical fashion. This chapter describes the basic phenomenon affecting the radio propagation.

6
2.3.1 Propagation principles
The transmission media in which electromagnetic waves propagate is made of boundaries between media, say, between air and ground, between buildings and the air, etc. In practice, these boundaries change the amplitude, phase and direction of propagating waves and all these effects can be examined in terms of combinations of simple mechanisms operating on plane waves.
2.3.1.1 Free space path loss If the transmitter and receiver have a clear, obstacle free, line-of-sight path between them, the free space propagation model can be used to predict the received signal strength. In this model, the propagation loss is calculated using Friis transmission formula.
2
,4
rt r
t
P G GP d (2.1)
where rP and tP are the received and transmitted powers, respectively. Variables tG
and rG are the antenna gains of transmitter and receiver and is the wavelength of the signal. Distance between the transmitter and receiver d, greatly influences the free space path loss as path loss is inversely proportional to the square of the distance.
2.3.1.2 Reflection and refraction
In mobile radio channel, reflection occurs when a propagating electromagnetic wave impinges on obstacles like the surface of the earth, buildings or walls. These obstacles have very large dimensions compared to the wavelength of the signal. The wave is partially reflected and partially transmitted and the proportion of reflection and refraction is determined by the electrical characteristics of the incident medium. Wave polarization, angle of incidence and the frequency of the propagating wave affect the electric field intensity of the reflected and refracted waves [5].
2.3.1.3 Diffraction
Like some light that exists in the shadow of a light source, some signals do exist in shadow region of a transmitter. This shadow region is referred to as non line-of-sight (NLOS) region and the bending of wave phenomenon is called diffraction. Diffraction is explained by Huygens principle [5] which states that all points on a wavefront can be considered as a point source for production of secondary wavelets, and these secondary wavelets combines to produce a new wavefront in the direction of propagation. Though it is impossible to precisely estimate diffraction losses, knife-edge model gives good idea about the order of magnitude of diffraction losses [5].

7
2.3.1.4 Scattering
In practice, the obstacles that reflect and refract the signals are not smooth and therefore the signal energy is scattered in different directions. Degree of smoothness and thus scattering depends on the relative height of surface protuberance to the wavelength and the angle of incidence. Waves reflected from a rough surface are shifted in phase with respect to each other. Scattering often makes the received signal in a mobile radio environment stronger than what is predicted by reflection and diffraction models.
2.3.2 Multipath propagation
Reflection, diffraction and scattering in a mobile radio channel produce replicas of the transmitted signal. The replicated signals, also called multipath components, arrive at the receiver from different directions at different time instants. The multipath components differ by amplitude, phase and time. This concept of multipath propagation can be wisely used at the receiver end to improve signal quality using RAKE receivers. Fundamentals of RAKE reception are discussed in Chapter 3. The propagation characteristics that influence multipath propagation are defined under the subsections here.
2.3.2.1 Delay spread
Each multipath component follows different propagation paths and is received at different time instants at the receiver. This time variation between the components of the same transmitted signal is measured as delay spread. It is one of the parameters that are used to characterize a propagation environment. Root mean square delay spread S
can be calculated from the channel power delay profile ( )P :
2
0
_
( ) ( ),
tot
P dS
P (2.2)
where is the average delay and _ totP is the total received power [6].
2.3.2.2 Angular spread
Angular spread explains the deviation of the signal incident angle and it is calculated from the incident angle of the received power in the horizontal and vertical planes:
1802
_180
( )( ) ,tot
PS dP
(2.3)

8
where is the mean angle, ( )P is the angular power distribution and _ totP is the
total power [6]. Angular spread can be calculated either in horizontal plane or vertical plane, the received power from the horizontal plane being the most important.
2.3.2.3 Coherence bandwidth
Coherence bandwidth, cf , is one of the frequency domain properties of a multipath
radio channel and has a direct relationship to time domain delay spread, S :
1 ,2cf S (2.4)
Coherence bandwidth gives the minimum frequency separation of two carriers that have significantly uncorrelated fading. If the radio signal bandwidth is much narrower than the coherence bandwidth, the system is considered to be narrowband and is called wideband when it is much wider [7].
2.3.2.4 Propagation slope
Propagation slope express the fundamental path loss over decade (one decade is when the distance between the base station and the mobile increases ten times). In free space, the path loss increases with 20 dB/decade. In macrocellular environment the signal level decreases by 25-50 dB/decade depending on the terrain type, which means the propagation slope is 25-50 dB/decade. Thus the slope is not constant over the propagation path and it is lower near the transmitting antenna than the propagation slope at greater distances. The point between the transmitter and receiver where the higher signal degradation starts is called breakpoint distance and it is calculated using:
4 ,BTS MSh hB (2.5)
where BTSh and MSh are the antenna heights of base station and mobile station respectively [7].
2.3.2.5 Slow fading
Obstacles along a signal path, for a given distance, are different for every path and this result in variation in the nominal value given by the path loss models. Some paths will witness increased loss, while others will have fewer obstacles and have increased signal strength. This phenomenon is referred to as slow fading (also called shadowing) [8]. The amplitude change caused by slow fading is usually modeled as log-normal distribution and its standard deviation is called location variability. Factors like antenna height, frequency and the type of environment, influence location variability. Slow fading must be accounted for better channel estimation accuracy [8].

9
2.3.2.6 Fast fading
The amplitude and especially the phase of multipath components are sensitive to small movements of the mobile station and the obstacles along the path. For example, mobile station movement of one signal wavelength causes a phase change of 2 . This kind of small movements leads to constructive and destructive interference between multiple waves reaching the mobile from the base station. The resulting phenomenon of rapid changes in phase and amplitude of the total signal is called fast fading (or multipath fading). Prediction of fast fading phenomenon is approached statistically and there are two probability density functions that help to deal with it. Rayleigh distribution describes the arriving signals in case of NLOS situation. In NLOS situation, there is no single dominating signal path. Rician distribution is employed to handle line of sight (LOS) situation where at least one direct path for incoming signal exist to the base station [8].
2.4 Propagation environment
Mobile radio propagation environment plays a vital role in radio wave propagation and thus it is an important factor in radio network planning. The environment is made up of natural and manmade structures which yield a wide variety of propagation effects. A sensible classification of different environment is needed to study its effects on propagation.
2.4.1 Characteristics of propagation environment
As discussed earlier under section 2.1, based on the coverage area, radio propagation environment are classified as macrocellular, microcellular and indoor classes. Based on the amount and volume of the natural and constructed obstacles, macrocells are further classified as urban, suburban, rural and hilly terrain. Microcell is usually an urban area of smaller scale. Table 2.1 shows the characterization for different environment at 900 MHz carrier frequency [6]. The values remain unchanged for higher frequencies as the wavelengths are considerably smaller than the obstacles in the propagation path [9].

10
Table 2.1: Characteristics of different radio propagation environments at 900 MHz [6].
Propagation environment
type
Angular spread of multipath
component ( )
Delay spread of multipath component
( s )
Slow fading standard deviation
(dB)
Propagation slope
(dB/dec)
Coherence bandwidth
(MHz)
Macrocellular
Urban 5-10 0.5 7-8 40 0.32 Suburban 5-10 0.1 7-8 30 1.6 Rural 5 0.1 7-8 25 1.6 Hilly rural 3 7-8 25 0.05 Microcellular 40-90 < 0.5 6-10 < 16 Indoor 90-360 < 0.5 < 10 < 16
2.4.2 Indoor propagation environment
The indoor and outdoor channels are similar in their basic features and are governed by the same rules of radio propagation mechanics. However, as evident from Table 2.1, the channel conditions are much more different and cell coverage area is much shorter. Main differences between outdoor and indoor propagation environment properties are: [10]
Rapid motions and high velocities are absent in indoor. Therefore negligible Doppler shifts.
The effect of people and vehicles in motion are negligible in outdoor, as the mobile channel is stationary in time and non-stationary in space. Motion of people and equipment around low-level portable antennas leads to an indoor channel which is stationary neither in space nor in time.
Indoor channel is characterized by higher path losses and sharper changes in the mean signal level, as compared to outdoor mobile channel.
Maximum excess delay is usually much shorter in indoor environment, typically less than 1 microsecond. Outdoor mobile channels can have maximum excess delays up to 100 microseconds due to reflections from distant objects such as hills, mountains, and city skylines.
Building materials such as walls, ceilings and floors cause large angular spread in indoor propagation environment, while it is considerably less in outdoor.

11
2.1.1 Building penetration
As indoor propagation is usually associated with buildings, the signal has to penetrate roofs, walls, floors and other obstacles to reach a receiver. This is the most likely case when the antenna is located outdoor and the mobile is in indoor or vice versa. Building penetration loss varies according to building type. According to ETSI GSM recommendations [26], building penetration loss in urban area is estimated to be 15-18 dB and in rural areas 10 dB depending on the frequency used. The loss, however, can vary due to the effect of different types of outside wall construction, building orientation and changes in floor elevation [6]. Further reading on structural attenuation is available in [10].

12
3. UNIVERSAL MOBILE TELECOMMUNICATION SYSTEM
Mobile technologies can be classified based on the speed and access schemes. In the initial days, technologies like Analog Mobile Phone Services (AMPS), Nordic Mobile Telephone (NMT) and Personal Handy Phone System had just enough speed to accommodate voice calls. These were analog FDMA based networks and are categorized as first-generation systems. Later digital mobile networks such as North American TDMA, cdmaOne, European Global System for Mobile communication (GSM) and Japanese Personal Digital Cellular telecommunication system (PDC) were introduced. These techniques used multiple access schemes such as FDMA, TDMA and CDMA. These are generally categorized as second generation (2G) systems. [7]
Later, the progress in mobile phones reduced the gap between compact handheld devices and computers, demanding enhancements to 2G systems. This resulted in GPRS and EDGE (Enhanced data rates for global evolution). These technologies are referred to as 2.5G techniques. GPRS enabled the connectivity of GSM to packet based network and EDGE provided higher data rates. However, the data rates provided by 2G and 2.5G techniques were not enough for the internet era.
To overcome the limitations in data handling capabilities of 2G and 2.5G networks, development of 3G mobile communication systems was started by International Telecommunication Union (ITU) and was referred as International Mobile Telecommunicaitons-2000 (IMT-2000) specifications. In Europe, UMTS standards were managed by European Telecommunication Standard Institute (ETSI). ETSI along with different telecommunication groups established the standardization group 3GPP in the year 1998 to develop 3G mobile systems based on evolved GSM core networks and radio access technologies [11]. By the year 2000, 3GPP completed the first set of Wideband CDMA (WCDMA) specifications, called Release 99. Later, WCDMA technology emerged as the most widely adopted third generation air interface [12]. Universal Mobile Telecommunication System (UMTS), the 3G mobile cellular system developed by 3GPP, was also based on WCDMA technology. UMTS and CDMA2000 can provide data rates ranging from 0 to 2 Mbps depending on the application needs. Applications like online video streaming and mobile games entered the market and mobile phones emerged as data hungry devices.

13
WCDMA evolved strongly alongside High-Speed Downlink Packet Access (HSDPA) and High-Speed Uplink Packet Access (HSUPA), together called High Speed Packet Access (HSPA). HSPA has practical bit rates beyond 10 Mbps, reduced latency and improved network capacity. HSPA solution builds on top of WCDMA radio network and operators can upgrade WCDMA networks straightforward to HSPA.
3.1 Architecture
UMTS network elements are functionally grouped into three sub networks based on network element functionality: UMTS Terrestrial Radio Access Network (UTRAN) that handles all radio-related functionality; Core Network (CN), which is responsible for switching and routing calls and data connections within the UMTS network and towards external networks; and User Equipment (UE) which interacts with the user and the radio interface [12]. The system architecture is shown in the Figure 3.1.
The definition of CN is adopted from GSM. UE and UTRAN are made of quite new protocols, the design of which is based on the needs of the new WCDMA radio technology. This approach gives a global base of known and rugged CN technology and enables advantages such as global roaming [12].
3.1.1 UE
UE has two parts. The Mobile Equipment (ME) is the radio terminal used for radio communication over the Uu interface, and the UMTS Subscriber Identity Module (USIM) is a smartcard that holds the subscriber identity, performs authentication algorithms, and stores authentication and encryption keys along with some subscription information that is needed at the terminal [12].
3.1.2 UTRAN
Like UE, UTRAN has two important elements. NodeB converts the data flow between the Iub and Uu interfaces. It is part of radio resource management (RRM). The Radio Network Controller (RNC) owns and controls the radio resources of all the NodeBs connected to it. It is the service access point for all services UTRAN provides to the CN.
3.1.3 CN
The main elements of the CN are as follows:
Home Location Register (HLR) – database located in the user’s home system that stores the master copy of the user’s service profile.

14
Mobile Services Switching Centre/Visitor Location Register (MSC/VLR) – serves the UE in its current location for Circuit Switched (CS) services.
Gateway MSC (GMSC) – switch at the point where UMTS PLMN is connected to external CS networks.
Serving General Packet Radio Service Support Node (SGSN) – similar to MSC but for Packet Switched (PS) services.
Gateway GPRS Support Node (GGSN) – similar to GMSC, related to PS services.
Figure 3.1: UMTS architecture and network elements in PLMN [12].
The external networks can be divided into two groups. CS networks, which provide circuit-switched connections, and PS networks, which provide connections for packet data services. ISDN and PSTN are examples of CS networks and Internet is an example for PS network.
3.2 WCDMA for UMTS
WCDMA air interface technology in UMTS is the most adopted radio access method for current 3G mobile communication systems. Within 3GPP, WCDMA is otherwise defined as UMTS Terrestrial Radio Access (UTRA). In UTRA, both Frequency Division Duplex (FDD) and Time Division Duplex (TDD) operations are possible and UTRA FDD method is the focus in this Thesis.
3.2.1 Main Parameters in WCDMA
The main system design parameters in WCDMA are presented in this section with brief explanations.
In WCDMA, user information is spread over a wide bandwidth by multiplying the user data with quasi-random bits (called chips) derived from CDMA spreading codes. Hence it’s called wideband Direct-sequence Code Division Multiple Access (DS-CDMA) system.

15
Carrier bandwidth is 5 MHz and chip rate is 3.84 Mcps. This has inherent benefits like high user data rates and also has increased performance benefits such as multipath diversity [12].
WCDMA supports highly variable user data rates i.e. Bandwidth on Demand (BoD) is well supported.
WCDMA supports Frequency Division Duplex (FDD) and Time Division Duplex (TDD) operation.
WCDMA supports asynchronous base station and thus independent of global time reference like GPS.
Table 3.1: Main WCDMA UMTS parameters [12].
Multiple access method DS-CDMA Duplexing method FDD/TDD
Base Station Synchronization
Asynchronous operation Chip rate 3.84 Mcps
Channel bandwidth 5 MHz Frequency band UL: 1920-1980 MHz; DL: 2110 - 2170
MHz Modulation QPSK Frame length 10 ms
Frame structure 15 slots Spreading factor UL: 4-256; DL: 4-512
3.2.2 Spreading and Despreading
The spreading operation is the multiplication of each user data bit with a sequence of spreading code bits, called chips. The resulting spread data has the same random (pseudo-noise like) appearance as the spreading code. For example, a BPSK-modulated bit sequence of rate R and a spreading code factor of 8 will spread the data at a rate of 8xR. This increases the signaling rate by a factor of 8 and corresponds to a widening of the occupied spectrum of the user data signal. Thus, CDMA systems are more generally referred to as spread spectrum systems.
During despreading, the spread user data/chip sequence is multiplied, bit duration by bit duration, with the same spreading code bits used during the spreading of these bits. Despreading restores the bandwidth proportional to the original bit data sequence. Spreading the narrowband signal to a wideband increases the robustness against narrowband interference. The spreading and despreading operation is illustrated in the Figure 3.2.
16
+1- 1
+1- 1
- 1
- 1
- 1
+1
+1
+1
Data
Spreading code
Spreading code
Data = Spread
signalxcode
Spread signal = Data x code
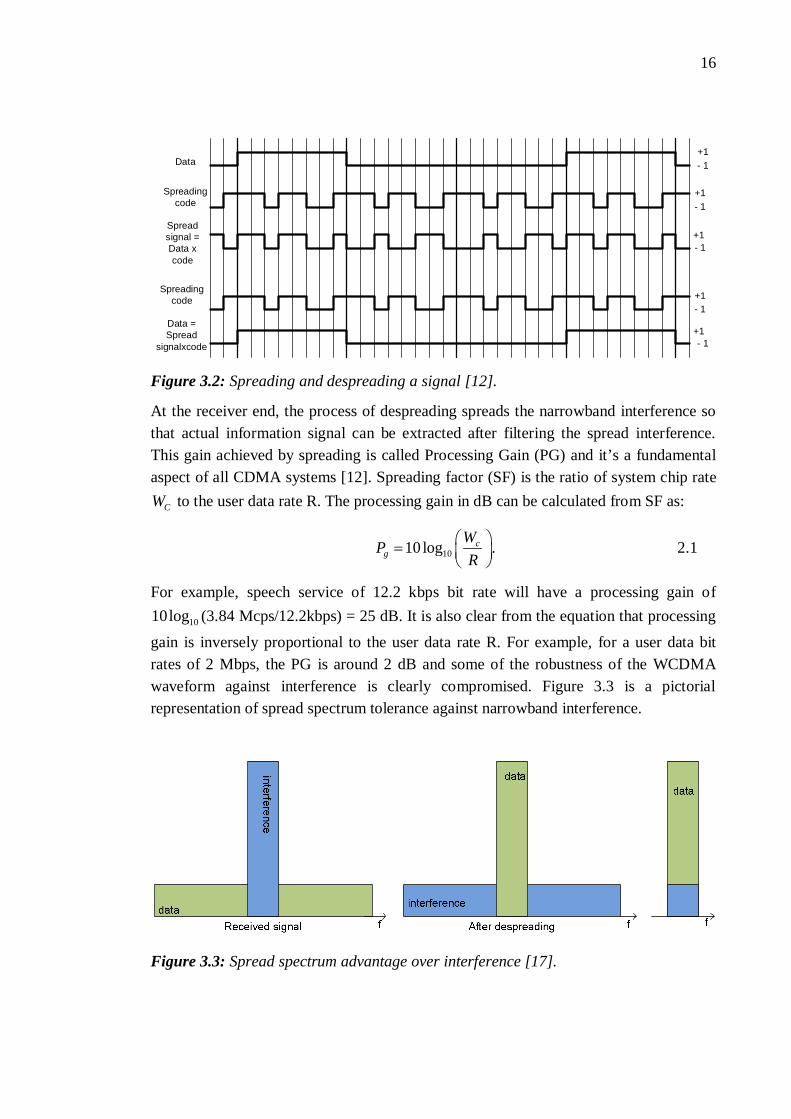
Figure 3.2: Spreading and despreading a signal [12].
At the receiver end, the process of despreading spreads the narrowband interference so that actual information signal can be extracted after filtering the spread interference. This gain achieved by spreading is called Processing Gain (PG) and it’s a fundamental aspect of all CDMA systems [12]. Spreading factor (SF) is the ratio of system chip rate
CW to the user data rate R. The processing gain in dB can be calculated from SF as:
1010 log .cg
WPR
2.1
For example, speech service of 12.2 kbps bit rate will have a processing gain of
1010log (3.84 Mcps/12.2kbps) = 25 dB. It is also clear from the equation that processing gain is inversely proportional to the user data rate R. For example, for a user data bit rates of 2 Mbps, the PG is around 2 dB and some of the robustness of the WCDMA waveform against interference is clearly compromised. Figure 3.3 is a pictorial representation of spread spectrum tolerance against narrowband interference.
Figure 3.3: Spread spectrum advantage over interference [17].

17
3.2.3 Multipath channels and RAKE receivers
Radio propagation over mobile channel is characterized by multiple reflections, diffractions and attenuation of the signal energy. This results in multipath propagation and is caused by natural obstacles like buildings, hills and other objects in the path. The two main effects of multipath propagation are described here.
The signal energy may arrive at the receiver over clearly distinguishable time instants. The arriving energy can be represented as multipath delay profile and it may extend typically from 1 to 2 s in urban and suburban areas. The chip duration for a chip rate of 3.84 Mcps being 0.26 s , a basic WCDMA receiver can separate multipath components arriving with a time difference of at least 0.26 s . Then, the received components can be combined coherently to obtain multipath diversity.
The second effect is about fast fading. For a given time delay position, there may be many paths nearly equal in length along which the radio signal travels. This result in signal cancellation at the receiver as the receiver moves across for even short distances. The distance can be as short as half the wavelength of the signal, which is around 7 cm for a 2 GHz signal.
RAKE receiver combines the energy from multipath component and thus achieves more efficient reception. Figure 3.4 shows a block diagram of a Rake receiver with three fingers. Code generators and correlator perform despreading on received I and Q input samples and integrate to user data symbols. Channel estimator estimates the channel state using pilot symbols. The delay is compensated for the difference in the arrival times of the symbols in each finger. Rake combiner sums the channel compensated symbols, thus providing multipath diversity against fading [12]. The amount of fingers represents the maximum amount of multipath components that can be separated in the receiver. Rake receiver in NodeB and in UE operates with similar Rake receiver principles.
Figure 3.4: Block diagram of a CDMA Rake receiver [17].

18
3.2.4 Power control
In WCDMA, as users share a common frequency band, a single over powered mobile could block a whole cell. This phenomenon is called near-far effect of CDMA. A tight and fast power control can deal with this and hence, is one of the most important aspects of a WCDMA system. A proper power control mechanism maintains the capacity and coverage of the system as good as possible and avoids excessive interference caused by other users on the network.
Open loop power control attempts to make a rough estimate of path loss by means of a pilot signal. This provides a coarse initial power setting of the mobile station at the beginning of connection. However, this method would be far too inaccurate at later stages, as fast fading is essentially uncorrelated between uplink and downlink. This is due to large frequency separation of the uplink and downlink bands in WCDMA FDD mode.
In fast closed loop power control in the uplink, the base station carry out frequent estimation of the received Signal to Interference Ratio (SIR) and compares it to a target SIR. If the measured SIR is less than the target SIR, the base station commands the mobile to increase its power; if it’s higher than the target SIR, it commands the mobile station to lower the power. This estimate – command – react cycle is executed 1500 times per second (1500 Hz) for each mobile station. The same is employed in downlink to provide a marginal amount of additional power to mobile stations at the cell edge.
Outer loop power control defines SIR target for every connection. It resides in RNC and is performed after a possible soft handover combining. This mechanism is based on evaluation of received signal quality, bit error rate (BER) or block error rate (BLER) in the UE and in NodeB. The algorithm is usually vendor specific.
3.2.5 Soft and softer Handover
Handovers in mobile communications maintain continuous connectivity of moving mobile stations. A handover happens when the mobile has to switch the serving cell or has the service of several cells. In UMTS system, handovers are classified as soft handover (SHO), softer handover (SfHO) and hard handover (HHO). The algorithm for handover control in RNC determines how and when a handover is made and is based on the measurements from the UE.
A soft handover occurs when a mobile station is under overlapping cell coverage area of two sectors of different base stations. Here, the communications between base station and mobile station takes place simultaneously over two air interface channels from each base station separately. Signals are received at the mobile station by maximal ratio combining Rake processing. During soft handover, both base stations will have

19
their own power control loops for the mobile and thus, two loops are active at the mobile. This kind of handover occurs in 20–40% of the connections and they need additional resources that have to be considered during planning phase. The resources to be planned are the number of Rake receiver channels in base station, Rake fingers at the mobile and additional transmission links between base station and RNC [12].
During softer handover, a mobile station is controlled by at least two adjacent cells of a base station. As in soft handover, the communication between base station and mobile station takes place simultaneously over two air interface channels from each sector separately. Softer handover occurs in about 5 – 15% of the connections and only one power control loop per connection is active here.
From mobile station point of view, there are very few differences between soft and softer handover. However, there are significant variations in the uplink direction. In soft handover, the received signal at the base station is routed to RNC for combining so that the same frame reliability indicator is maintained for outer loop power control. In softer handover, the code channel of mobile station is received at each sector and is routed to the same baseband Rake receiver.
20
4. HIGH–SPEED PACKET ACCESS SYSTEM
The evolution of the mobile standards carried out by 3GPP aims to improve the system functionality and performance in every aspect. R99, the first release of 3rd Generation specifications was basically a consolidation of GSM specification and the development of a new radio access network. Remarkable additions were made to the UMTS system in Release 5 or High–Speed Downlink Packet Access (HSDPA) and Release 6 or High–Speed Uplink Packet Access (HSUPA). While HSDPA includes major improvements in downlink data rates and capacity, HSUPA introduced similar changes in the uplink. These two technologies are together called HSPA.
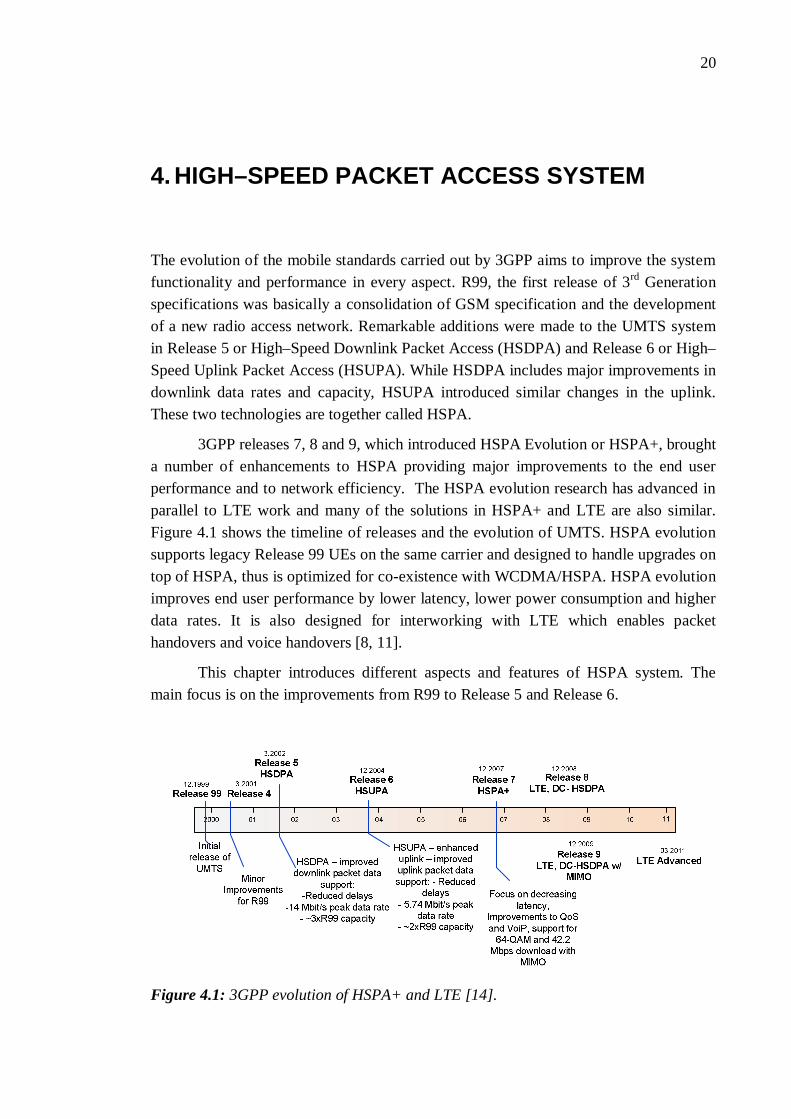
3GPP releases 7, 8 and 9, which introduced HSPA Evolution or HSPA+, brought a number of enhancements to HSPA providing major improvements to the end user performance and to network efficiency. The HSPA evolution research has advanced in parallel to LTE work and many of the solutions in HSPA+ and LTE are also similar. Figure 4.1 shows the timeline of releases and the evolution of UMTS. HSPA evolution supports legacy Release 99 UEs on the same carrier and designed to handle upgrades on top of HSPA, thus is optimized for co-existence with WCDMA/HSPA. HSPA evolution improves end user performance by lower latency, lower power consumption and higher data rates. It is also designed for interworking with LTE which enables packet handovers and voice handovers [8, 11].
This chapter introduces different aspects and features of HSPA system. The main focus is on the improvements from R99 to Release 5 and Release 6.
Figure 4.1: 3GPP evolution of HSPA+ and LTE [14].

21
4.1 HSPA Architecture
In Release 99 architecture, radio network controller (RNC) was responsible for most of the radio resource management (RRM) functionalities like scheduling control, while at the base station (NodeB) there was mainly fast closed loop power control functionality. In Release 99, scheduling was distributed as there were two RNCs involved. The serving RNC (SRNC) was connected to the core network and was responsible for handling dedicated channel (DCHs) and the drift RNC (DRNC) connected to the BTS was responsible for common channel (like FACH).
As scheduling was moved to the NodeB, the overall RRM architecture changed in HSPA. SRNC retained the control of handovers and responsible for suitable mapping of quality of service (QoS) parameters. These changes made a typical HSDPA scenario to be presented by just a single RNC. Figure 4.2 shows HSDPA and HSUPA RRM architecture in Release 6.
Figure 4.2: HSDPA and HSUPA RRM architecture in Release 6 [13].
The interoperability between different network elements can be better understood if the layer structure of UMTS protocol stack is studied. Figure 4.3 shows the architecture of UMTS protocol. The architecture can be divided into three main protocol layers: Physical layer (L1), data link layer (L2) and network layer (L3). Medium access control (MAC), radio link control (RLC), packet data convergence protocol (PDCP) and broadcast/multicast (BMC) form L2. RLC handles the segmentation, reassembly and retransmission for both user and control plane. RLC also performs logical channel mapping for lower layers. MAC layer tasks include data rate selection, prioritization, transport channel mapping and transport format selection.

22
PDCP and BMC are utilized by user plane radio bearers. PDCPs main function is header compression and BMC conveys messages from Cell Broadcast center.
RRC performs functions that are needed to establish and maintain the connections for applications such as signaling, channel configuration, mobility and resource management.
Physical layer
MAC layer
RLCRLC
RLCRLC
RLCRLC
RLCRLC
RRCPDCP
PDCP BMC
Transport channels
Logical channels
L1
L2/MAC
L2/RLC
L2/PDLC
L2/BMC
User plane informationControl plane information
L3
Control channels
Figure 4.3: Radio interface protocol architecture [13].
4.2 HSDPA
Release 5 has been designed to improve downlink packet data throughput through fast physical layer (L1) retransmission and transmission combining, as well as fast link adaptation control by NodeB. A new channel concept along with a higher order modulation and fast scheduling are other new concepts that enhanced the performance in HSDPA.
4.2.1 Shared-channel concept HSPA employs a shared channel data transmission concept which is its main advantage in data transmission compared to R99. This approach shares the radio resources within a cell based on priority levels and QoS requirements of users. The use of shared channel

23
transmission enables rapid allocation of downlink resources to a specific user and is implemented in WCDMA through the High-Speed Downlink Shared Channel (HS-DSCH) [16].
The basic time and code domain structure for HS-DSCH is shown in Figure 4.4. The HS-DSCH code resource has a set of channelization codes of spreading factor 16 in which the codes available for transmission can be from 1 to 15. Codes not reserved for transmission are used for other purposes like control signaling.
HS-DSCH code resource for transmission is dynamically allocated to a specific user on 2ms TTI basis as shown in Figure 4.4. Using short TTI for HSDPA reduces overall delay and improves the tracking of fast channel variations due to channel dependent scheduling and rate control. HS-DSCH is rate controlled and not power controlled and this enables efficient exploitation of overall available power resource.
Time
HS-DSCH TTI 2ms
User 1 User 2 User 3 Figure 4.4: Time- and code-domain structure of HS-DSCH.
Downlink signaling for HS-DSCH in each TTI is carried on the downlink control signaling channel called High-Speed Shared Control Channel (HS-SCCH). HS-SCCH is transmitted in parallel to the HS-DSCH using a separate channelization code. There are two parts in HS-SCCH of which the first part carries time-critical information on transport format and allocated codes required before the HS-DSCH channel being used. The second part contains information on retransmissions.
The uplink information about received data in HSDPA is carried by High-Speed dedicated physical control channel (HS-DPCCH). UE feedback to Node B contains packet acknowledgements and information on downlink signal quality. Channel Quality Indicator (CQI) value has the estimate on channel quality level which is used by Node B scheduler to determine the data rate expected by a mobile. The response from the UE about the received packet is sent in feedback as an Acknowledgement (ACK) or Negative Acknowledgement (NACK) [16].

24
4.2.2 Channel-dependent scheduling In HSDPA, scheduling scheme controls which user gets the shared channel transmission for a given instant of time. Scheduler decides, in each TTI, which user(s) get the HS-DSCH transmission. In coordination with rate control mechanism scheduler also decides the data rate for any user.
Scheduling decisions based on radio-channel conditions gives significant increase in capacity and is called channel-dependent scheduling. The radio conditions of UEs within a cell typically vary independently and there is always an UE with radio link whose channel quality is near its peak. This is illustrated in Figure 4.5. This radio link with good channel quality allows a high data rate for the link and this leads to high system capacity. The gain obtained by dynamic transmission with favorable radio conditions is known as multi-user diversity.
Algorithms for the scheduler have a significant effect on fairness and throughput of the cell and the user, and are usually vendor-specific. Scheduling optimization also has a considerable effect on performance of a network especially when the network is loaded [16].
Figure 4.5: Channel-dependent scheduling [16].
4.2.3 Hybrid ARQ with soft combining Virtually, all wireless communication systems employ Forward Error Correction (FEC) in some form. FEC enables the receiver to correct errors without asking the sender for additional data. The principle behind FEC is to introduce redundancy in the transmitted signal by adding parity bits ahead of the information bits. A similar approach to handle transmission errors is Automatic Repeat Request (ARQ) which uses cyclic redundancy check to determine whether the received packet is error free.

25
HSDPA employs hybrid ARQ with soft combining, a combination of FEC and ARQ with features that can store and reuse the erroneous received packets to combine with retransmitted packets. Incremental Redundancy, IR, is the basis for soft combining in HSDPA. In IR, retransmission may include parity bits which are not part of original transmission. IR provides significant gains when the initial transmission attempt code rate is high and later the additional parity bits in the retransmission results in a lower overall code rate.
Hybrid-ARQ retransmissions are significantly faster than RLC-based retransmissions. The functionality resides both in MAC-hs layer and the physical layer. The MAC-hs layer located in the Node-B handles rapid retransmission of erroneous blocks. Thus the retransmissions are faster compared to RLC for two main reasons.
No signaling between Node-B and RNC for hybrid-ARQ retransmission and
HSDPA hybrid-ARQ protocol allows for frequent status reports (happens once per TTI), thus reducing the roundtrip time [16].
4.2.4 Rate control and modulation scheme Variations in the instantaneous channel conditions were compensated by dynamic transmit-power control schemes in R99. This is desirable for circuit switched voice networks as the data rate is kept constant, increasing the transmit power when the radio link conditions are poor. Instead of power control, HSDPA employs link adaptation by means of dynamic rate control schemes. Rate control exploits the fact that data rate need not be kept constant in packet switched services and users are happy as far as they are kept ‘as high as possible’. Instantaneous variations in data rate are not an issue even in ‘constant-rate’ services like voice and video, until they don’t cross an acceptable minimum level.
Rate control mechanisms adjust the data rate by changing the modulation scheme and channel-coding rate. When the radio-link conditions are favorable, b oE /N value at the receiver is high and the data rate was mainly limited by the bandwidth. In such conditions, HSDPA employs higher order modulation like 16-QAM, along with high code rate. For poor radio-link conditions, QPSK and low-rate coding is used. This mechanism link adaptation by means of rate control is also referred to as Adaptive Modulation and Coding (AMC).
The transport format and channelization-code are selected by the rate-control mechanism in the scheduler. This decision is taken for the scheduled user every TTI. The transport-block size and the modulation scheme (QPSK or 16-QAM) constitute the transport format. The number of information bits prior to coding is set based on transport-block size. The number of coded bits, post rate matching, is decided by the
26
number of channelization codes and the modulation scheme. Thus, the overall code rate is adjusted by playing with some or all of these parameters.
Since HS-DSCH TTI is made up of relatively short intervals 2 ms, compared to 10 ms of R99 TTIs, rate control can track rapid variations in the instantaneous channel quality. MAC-hs also sets the transport format independently for each TTI. For retransmissions, code rate can be greater than 1 as the transport block size is not signaled for retransmission and the value from the original transmission is used. This gives the advantage of additional scheduling flexibility [16].
4.2.5 Mobility Mobility for HSDPA, unlike in R99, does not involve soft handover for HS-DSCH and is handled through RRC signaling using similar procedures as for dedicated channels. Mobility decisions are based on the measurement reports from UE to RNC. RNC reconfigures the UE and involved NodeBs, thus changing the serving cell.
Cell reselection or HS-DSCH cell change happens when the mobile station detects a potentially better cell. In this process, UE evaluates cells on the same frequency or on different frequencies, in same layer or in different layers, or cells from different radio access technology. The UE must have the measurement results of the probable cell reselection candidates before it makes any decision on cell reselection.
When the common pilot signal strength from a neighboring cell is greater than the current best cell, UE signals RNC by means of a ‘change of best cell’ report or a ‘Measurement Event 1D’. These events determine when to change the HS-DSCH serving cell. Once the measurement event 1D is received from UE, RNC decides on changing the serving cell from original source NodeB to target NodeB. RNC setup the target NodeB with reconfiguration messages either asynchronously or synchronously. However, synchronous reconfigurations are typically used for HS-DSCH mobility as there are chances of data loss in asynchronous reconfigurations. MAC-hs buffer is also reset when making the change and thus the hybrid-ARQ protocol is not transferred between the two NodeBs.
Flow control, related to mobility, handles the amount of data buffered in the MAC-hs at NodeB. It has to ensure the buffer is not too big to avoid large amount of packets that need to be resent to a target NodeB in case of handover. Flow control also ensures, at the same time, buffer is large enough to hold sufficient amount of data to exploit advantageous physical channel conditions [13, 16].
4.2.6 HSUPA High Speed Uplink Packet Access or Enhanced Uplink was part of WCDMA 3GPP Release 6. A new uplink transport channel – E-DCH was introduced in HSUPA that

27
brought in some of the same features as HSDPA’s HS-DSCH. E-DCH supports fast NodeB based scheduling, fast physical layer HARQ with incremental redundancy and, optionally, a shorter 2-ms transmission time interval (TTI). Unlike HSDPA, E-DCH is a dedicated channel and by structure is more like DCH of Release 99 but with fast scheduling and HARQ.
Fast L1 HARQ for HSUPA works on the same principle as that of HSDPA HARQ. The HSUPA HARQ employs either chase combining in which each retransmission is an exact copy of the initial transmission, or incremental redundancy (IR) where retransmissions contain additional redundancy bits for the initial transmitted bits. The difference between HSUPA HARQ and HSDPA HARQ is that HARQ with HSUPA is fully synchronous and uses incremental redundancy; it can also operate in soft handover.
HSUPA moved the scheduling to NodeB from the RNC to make scheduling decisions with minimum latency. Since HSUPA is a one-to-many scheduling, the uplink transmission power resources of a cell are evenly distributed to the users. This fact leads to a need to have a dedicated channel approach, unlike the shared channel approach of HSDPA. In dedicated channel approach, there is a possibility of received uplink interference power increasing beyond certain allowed limits. After this point, all users experience so much interference from other users and they again increase their transmission power to be heard and thus contributing further interference to the cell. The uplink scheduler task is to avoid such overload scenario and at the same time, to use as much of the uplink capacity as possible without making the cell overloaded.
Similar to R99 DCH, there can be different active sets in use in E-DCH. Scheduling and HARQ functionalities of HSUPA can operate with lesser number of base stations than DCH. 3GPP specifications require HSUPA terminals to handle a maximum of four cells whereas it is six in case of DCH [27]. The procedures for change in serving E-DCH cell can be based on same criteria as that of HSDPA.

28
5. RADIO NETWORK PLANNING FOR UMTS
While GSM systems are voice based networks, data based services play an important role in post-2G systems. In GSM planning process, it was enough to specify speech coverage and blocking probability [17]. UMTS, which supports data services is based on WCDMA technology and needs modification in the traditional GSM planning process. The radio network planning problem in UMTS is multi-dimensional. The QoS targets have to be set separately for different services and the planning process must meet all the targets.
The planning guidelines discussed in this chapter are mainly for macrocellular networks and can be applied to indoor networks to some extent. Section 5.2 discusses more details on indoor radio network planning. Performance indicators for network evaluation are discussed under section 5.4.
5.1 Macrocellular radio network planning process
The UMTS radio network planning process has three major phases, namely, pre-planning (dimensioning), detailed planning and post-planning (optimization) and is depicted in Figure 5.1 [7]. Though the dimensioning phase is similar to 2G network planning, the detailed planning phase and their contents are modified to suit UMTS. In the optimization phase, the designed network is optimized for quality, capacity and coverage and it is a continuous process.
Figure 5.1: WCDMA planning process [7].

29
5.1.1 Preplanning – dimensioning The purpose of the preplanning phase is to initially draft the radio network configuration and deployment strategy for long term. A rough estimate of the network layout and elements is needed. One important parameter for the detailed planning phase is the base station antenna height. It helps to define the characteristics of the propagation channel and optimized planning guidelines (like antenna tilting) for that environment. The output of the dimensioning phase is a list of required network elements and the average antenna height.
The traffic requirement analysis for coverage and capacity estimation in this phase has to be done keeping long term requirements in mind. As otherwise, the network may need frequent reconfigurations later due to over capacity or load.
5.1.2 Detailed planning Configuration planning, topology planning and parameter fine tuning constitute the detailed planning phase. The assumptions and the requirements from the preplanning phase are specified with a more practical approach in detailed planning.
In configuration planning, base station and base station antenna line equipment is defined. A detailed UMTS power budget for different service profiles is the main tool in configuration planning. The outcome of configuration planning is a detailed base station configuration, list of antenna line elements and the maximum uplink and downlink path loss information for coverage predictions [7].
Topology planning in UMTS starts with coverage prediction and uses coverage thresholds to estimate coverage overlapping and dominance areas. System level simulations, like Monte Carlo simulation, help to estimate maximum load of the network in different cells. The results of the simulations include coverage, capacity and interference related information for the network. The final purpose of the simulation is to get a good estimate on whether base station sites are located correctly and total capacity of the network for a particular area. Figure 5.2 illustrates the flow of topology planning in UMTS.
Code and parameter planning takes care of scrambling code allocation and optimizing radio interface functionality. There are enough codes (512 primary codes) in 3GPP specifications and therefore code planning process is straightforward. In parameter planning, default values are set for different categories of parameters involved in three different modes of mobile operation: idle, connection establishment and connected modes. Based on tasks assigned, parameters are categorized into signaling, identifier, RRM, measurement, handover and power control groups.

30
Figure 5.2: WCDMA topology planning [7].
5.1.3 Post planning – optimization The final planning phase constitutes verification, monitoring and optimization when the network is implemented. In the verification phase, call establishments, soft and inter-system handovers, coverage and dominance areas are tested. Network monitoring is necessary to meet capacity demand variations and contains Key Performance Indicator (KPI) values related to call success rates and drop call rates. Finally optimization is about continuous problem solving based on radio interface field measurement and QoS measurement [7].
5.2 Indoor radio network planning
In most cases, even a tight grid of traditional macro cells is insufficient to give service to the indoor users, especially higher data rate HSPA users. The technical motivations for providing sufficient indoor coverage are typical; lack of coverage, improvement of service quality, need for more capacity, need for higher data rates and to offload the macro network [4].
In addition, serving indoor users with macro base station degrades the radio channel orthogonality which is a major factor influencing the UMTS/HSPA system performance. Radio signals propagating indoor will also have an impaired constellation of the modulated signal, low SIR, and increased chances of transmission error. Indoor users are also a source of high capacity drain for a macrocell.
Thus for high performing indoor coverage, there are different set of network design guidelines. These guidelines differ from the macrocellular radio network planning in many aspects, though the basics remain similar.
31
5.2.1 Indoor planning principles The initial step in indoor network planning is to define target parameters like number of users, type of users and type of service requirements during busy hours. In addition to these inputs, a proper documentation of the building is needed. The documentation should include floor plan, coverage requirements in different grades and areas, and information on different environment types like dense and open office corridors.
Isolation is a very important factor for a successful indoor solution. Office buildings where users sit often close to windows, and in some high rise buildings with normal windows, very high interference level from outside macro cell is possible. Network planners must ensure dominance of the indoor system throughout the building. It has to be noted that the performance of radio link is not related to the absolute signal level but to the quality of signal. Hence, a good radio design is not to leave areas in indoor to macro coverage, as this will result in large areas of soft handover and degraded HSPA performance [4].
A draft design for the indoor network plan should include inputs mentioned above, the list of required RF hardware and planned equipment locations. The power budget for indoor systems needs accurate information about the cable, divider, splitter and tapper losses on the way to antenna. This is to maintain antenna EIRP (Equivalent isotropic radiated power) at the target level. Also careful and accurate topology planning is important for indoor networks as it helps to prevent power leakage to outdoors and ensures evenly distributed indoor coverage [18].
Correct antenna placement is a major factor for a successful indoor solution as it helps to optimize handover zones, proper isolation and uniform coverage. Typical antenna patterns for indoor systems are 65 to 90 beam width directional antennas, bidirectional antennas for long indoor corridors and omni directional for open offices [7].
5.2.2 Indoor network solutions The basic approach to improve indoor coverage in UMTS is to implement a dedicated indoor system or an outdoor-to-indoor repeater. The indoor base station configuration is planned similar to an outdoor base station and can have a single cell for one building or multiple cells. However the antenna system configuration is different from outdoor sites and can be made of single antenna at a cell, or a distributed antenna system [2]. This subsection gives a brief idea about pico cells, a dedicated indoor base station with single antenna, and WCDMA repeaters.
5.2.2.1 Pico cell
Pico base stations are considered a very effective solution for deploying in-building coverage at low cost on a standalone basis [4]. It is typically designed for wall mounting in an office environment and is handy with an integrated antenna. Pico cells are used for

32
relatively low cell ranges, up to 40 m, and thus a reasonable choice for indoors. Most pico base stations use internet protocol for transmission backhaul, making it also a very fast solution to implement. The typical requirement for a pico cell is to provide service to a small to medium sized office building. If several picocells are implemented, which is the most likely case in medium sized office; the isolation of the cells is crucial to avoid soft handover zones or degraded HSDPA capacity.
Femtocells are smaller version of picocells and are still in a nascent stage of commercial deployment. Femtocells have autotuning features and radiate low RF power. Thus they are best suited for typical residential use and also have very limited capacity. However, the noise load by femtocells to macro and their advantages over other solutions are still under study.
5.2.2.2 WCDMA Repeater
Analogue repeaters are simple devices which amplify the signal received from a base station and transmit it further using its own antenna configuration to fill coverage gaps. They can be added to the network anytime on need basis. This flexibility makes it an attractive choice for temporary increase in coverage or capacity. In indoor locations, a single user can reserve a lot of macrocell capacity due to building penetration loss. A repeater in such case enables the base station to transmit with lower power releasing the capacity for other users. They also help to reduce the interference in the neighboring cell in the uplink direction. Thus, repeaters provide a fast and cost-effective solution to fill coverage holes and gaps.
A repeater system is made up of a donor antenna, amplifier and serving antenna and is illustrated in Figure 5.3. A donor antenna offers a link to the macro base station and it is directional with high gain, narrow beamwidth and high front-to-back ratio. A proper alignment and line-of-sight condition towards the donor base station antenna is critical, especially when several other base stations have equivalent link performance with the repeater. To ensure this the strongest signal should be at least 8-10 dB better than the others.
Figure 5.3: A typical repeater system [7].

33
Repeater parameters: Coupling loss BS – RPT = coupling loss between base station and repeater; Coupling loss RPT – UE = coupling loss between repeater and mobile; Isolation = Isolation between donor antenna and service antenna; Gain = repeater gain;
The serving antenna is like any normal indoor or outdoor base station antenna, depending on the nature of the coverage gap. Between the donor antenna and serving antenna, isolation of 15 dB higher than the repeater gain is a must. This is the most dominating factor in planning the implementation of the repeater. The nature of the coverage antenna, innovative utilization of buildings and towers and sometimes, installation of attenuating structures between the antennas are considered during planning phase to meet the isolation criterion.
The signal can be boosted by up to 90 dB in the amplifier part of the repeater system. Gain can be set independently in uplink and downlink directions. The planning phase of repeater site locations must consider the maximum allowed path delay of 20 s between signal paths [7].
WCDMA repeaters considered in this thesis are analogue, air-to-air, bidirectional linear amplifiers.
5.3 Multi-layer topology
In WCDMA network, there are variety of services, and different cell layers with different capacity. The operator may have to plan in advance for the deployment of a multi-layer cell structure. Microcells, a solution for hotspots and higher bit rates in indoor, may have to coexist under existing macro cell coverage area. The method of defining cell structure that belongs to different layers is called Hierarchical Cell Structure (HCS). The easier way to operate different cell layers is to have them on different frequency carriers.
In most UMTS frequency allocation, two or more Frequency Division Duplex (FDD) carriers are allocated to operators. However, a full hierarchical cell structure needs three carriers, where each layer operates on its own carrier. If an operator is limited to two frequencies, he needs to reuse a carrier that has already been used in another network layer. This scenario of network evolution for an operator with just two carriers is depicted in Figure 5.4. In the initial stage, a continuous macro-cellular coverage is provided. A second carrier can be added later as a micro-layer or to the macrocell for additional capacity. In further stages, both layers provide continuous

34
coverage in a specific area. At this stage, to add more capacity the operator has to introduce additional carriers or he has to reuse the available carrier.
Figure 5.4: Example of WCDMA network evolution [19].
5.3.1 Interference In capacity limited systems like GSM1800, due to large number of available frequency spectrums, interference is lower. The ultimate capacity is limited by the number of channel elements [28]. In WCDMA, capacity limits can be reached even before all channel elements of all cells are in use. The limit in WCDMA is defined by minimum acceptable level of the QoS that depends on the interference level in the system. In uplink, the source of interference is other mobiles in the network, while in downlink; interference comes from adjacent base stations. Thus in uplink direction, there is a maximum interference level tolerable at the base station receiver. In downlink direction, the total transmitted power is shared between all users.
Improvement in the performance of some link will result in reduced power levels and interference, in both uplink and downlink direction. Hence cells with clear dominance and sufficient degree of cell isolation are important factors in WCDMA.
5.3.2 Handover and mobility The more the number of layers is present in topology; the more frequent are the handovers in the network. Since HSDPA network cannot exploit signals in soft or softer handover to their advantage, frequent cell changes only leads to performance gap and cell degradation.

35
While large coverage areas from macro base station are not sufficient to attain the best performance from a HSDPA network, care has to be taken in defining the handover parameters. The threshold level of radio signal strength and the time for which the mobile maintains the handover conditions are the key parameters that decide the handover [20]. Optimizing these conditions can offer enhanced performance for roaming mobiles in HSDPA networks.
5.4 Performance indicators
3GPP has defined a uniform set of measurements that can be collected from the network elements of any vendor [21]. During optimization phase, field measurements are used to verify, monitor and optimize the performance of the implemented radio network. This subsection describes some basic performance indicators that will define capacity, coverage and quality of the network.
RSCP (Received Signal Code Power) is the measure of downlink P-CPICH (Primary Common Pilot Channel) power. RSCP is the general metric for signal strength and is used, in path loss calculation, downlink power control and as a handover criterion.
RSSI (Received Signal Strength Indicator) is the measurement of power received over wideband radio signal. This includes RSCP, signaling channels, interference among others.
0/cE N (Energy per chip to Noise ratio) is the ratio between RSCP and RSSI. It is the measure of quality of the signal that links the absolute coverage with the interference in the downlink channel.
c
o
E RSCPN RSSI
Physical layer throughput is the number of bits transmitted per second. It includes all signaling traffic, upper layer overheads and retransmissions.
MAC layer throughput is a more appropriate data rate indicator from a network engineer’s point of view as it accounts for the performance degradation caused by retransmissions.
BLER (Block Error Rate) is the measure of percentage of erroneously received packets at the physical layer of downlink and uplink channel. Large transport block sizes results in higher BLER whereas lower error rate indicates under utilization of resources.
CQI (Channel Quality Indicator) is an important measure of instantaneous downlink channel quality. It is determined by UE and is vendor specific. It can determine the transport block size based on specifications.

36
6. MEASUREMENT CAMPAIGN
The purpose of the measurement campaign is to do mobility measurements using WCDMA repeater and a pico cell, both with HSDPA capabilities, emphasizing the handover functionality at the border between indoor and outdoor environment. This chapter describes the measurement setup, location and configurations for different measurement scenarios.
6.1 Measurement locations
The measurements were carried out in a university building (first floor of Tietotalo building, Tampere University of Technology, Tampere, Finland), along different routes with LOS and NLOS paths to macrocell, across an open corridor and an open area. The approximate room’s height of the open area and open corridor is around 6 meters. All measurements were performed during weekends and late nights in an empty test network. Thus, the possibility of other users in the network can be ruled out. Figure 6.1 shows the aerial view of the antenna location and their direction. Figure 6.2 and Figure 6.3 shows the measurement routes with markers and indoor antenna locations.
Figure 6.1: Location of macrocell antenna and repeater donor antenna [31].

37
Figure 6.2: Floor plan of Tietotalo building with measurement route A and B.
0th marker
1st8th
MarkerMeasurement
route
Antenna
Route C
2nd 3rd 4th 5th 6th7th
Figure 6.3: Measurement route C with markers on Tietotalo corridor.

38
6.2 Measurement setup
6.2.1 Measurement environment Measurements were performed in a HSDPA capable UMTS system with three different systems: a dedicated indoor system, an outdoor-to-indoor repeater with a LOS condition from donor antenna to mother cell antenna, and an outdoor macrocell. All the systems have a fully functional RNC connected to core network. These scenarios are referred in plots of result in Chapter 7 as Pico, Repeater and Macro respectively.
Specific configuration of outdoor macrocell is not known, but it has a directional antenna pointed towards the measuring location as shown in Figure 6.1. Dedicated indoor system and the repeater system were connected to an omnidirectional antenna, with 2 dBi gain, either directly to the indoor base station or to the macrocell through a combination of a donor antenna and a WCDMA repeater. The dedicated indoor system was configured using 1/2 inch feeder cables while the repeater system was configured using a combination of 7/8 inch and 1/2 inch cables. Relevant parameters of an indoor system are listed in Table 6.1. The antenna line configuration for the pico cell is illustrated in Figure 6.2.
In the repeater configuration, the mother cell was a macrocellular base station connected to a directional antenna fixed at the height of rooftops. The mother cell antenna and the repeater donor antenna were separated by a distance of around 450 meters, in optical LOS condition but with obstacles in Fresnel zone. Repeater parameters are listed in Table 6.1. The antenna line configuration for the repeater is shown in Figure 6.3. The choice of components and the measurement setup is such that the EIRP (effective isotropic radiated power) for both the indoor scenarios was almost the same. The donor antenna in the repeater setup was pointed towards the mother cell antenna main beam direction, based on the RSCP measurements measured at the output end of the directional antenna. The scrambling code of the macro cell under study is 314 while 313 is the scrambling code of the active neighbor cell. Other cells in the test network declared as neighbors to 314 are not active during the measurements.
Table 6.2 presents the RSCP and 0/cE N levels of various cells present at the donor antenna location. It has to be noted that the values are from a mobile’s omnidirectional antenna and the same measurement with donor directional antenna may have different values. The macro cell of interest with scrambling code 314 is only the third best at the measuring location. It is probable that the interference from other cells is more than expected at the donor antenna direction and this could make the location not so ideal for repeater donor antenna implementation. With high interference amplified along with the signal, the SIR and consequently the CQI value of the channel are expected to degrade. However, earlier studies by Radio Network Group at TUT, done with the same donor antenna location have given better SIR and throughput values [2, 22, 25, 30].

39
Figure 6.2: Antenna configuration for indoor pico cell.
Figure 6.3: Antenna configuration for outdoor-to-indoor WCDMA repeater.
Table 6.1: Table showing system parameters.
Indoor System parameters Max. total DL power 43 dBm
Common pilot channel power 29 dBm Power allocated for HSDPA 5 W
Repeater parameters Repeater DL power (max.) 35 dBm Repeater UL power (max.) 20 dBm
Repeater noise figure 3 dB Repeater gain 65 dB
Repeater donor antenna gain 17.1 dB Donor antenna beamwidth 65 deg

40
Table 6.2: Macrocells and their coverage level at donor antenna location, measured with mobile’s omnidirectional antenna.
UMTS FDD 2100 macrocell information Channel Scrambling code RSCP (dBm) Ec/N0 (dB)
f1 313 -80 ( -8) -5 f1 168 -55( +20) -5.2 f1 314 -72( ) -6.1 f1 450 -79 -7.2 f1 183 -83 -9.5 f1 160 -95 -11 f1 366 -51( +21) -12
The measurements were performed at walking speed by establishing an HSDPA data download over File Transfer Protocol (FTP) from a test server. Each measurement was repeated several times for all measurement routes. The measuring UE was requesting full throughput (TP) over the measuring time. Before commencing the measurements, 0/cE N was measured close to the indoor antenna to confirm the no load situation in the network.
6.2.2 Measurement equipment Measurement equipment was a Release 7 capable category 14 mobile with a theoretical maximum physical layer throughput of 21.1 Mbps downlink and 5.76 Mbps uplink. Category 14 mobiles can use a maximum of 15 HS-DSCH channelization codes and are 64-QAM modulation enabled. However, both the indoor and repeater networks are Release 5/6 limited. Without 64-QAM, the mobile can give a maximum downlink data rate of 14.4 Mbps. Along with category 14 mobiles, category 8/5 data card with theoretical maximum physical layer throughput of 7.2/2 Mbps was also used for measurements in loaded scenario. Category 8/5 data cards can utilize a maximum of 10 channelization codes and can reach the maximum throughput with lower CQI values compared to category 14 data cards. The measuring mobile was attached to a laptop equipped with Nemo Outdoor field measurement software [23] and was carried with the hands at a height of 1.5 meters.
6.3 Measurement routes
Three different measurement routes were chosen; an open area route with LOS conditions to macrocell (Route A), an open area route (Route B) and a long corridor route (Route C) both with NLOS conditions to macrocell. The routes are illustrated in Figure 6.1. Same set of measurements were carried out for both repeater and pico cell

41
configuration. All the measurements were also performed for macro cell scenario without any indoor cells to make a comparison study of macrocell coverage with indoors. To understand the effect of load in the network, measurements were additionally carried out for one of the measurement routes with two stationary mobiles as load. One of the mobiles used as load was placed under the macro coverage while the other one was placed under the indoor coverage. The loading terminals were also downloading data over FTP from a test server, like the measuring mobile. Separate measurement rounds with category 8/5 data card, downloading data over FTP without other loads in the network, was carried out for Tietotalo main door route (Route A) for all the three configurations.
6.4 Preliminary measurements
Preliminary measurement rounds were carried out to determine the ideal location for the antenna placement and the coverage level of macro cell in the building. The repeater gain is set to an optimal value based on an earlier thesis done by Ali Mazhar and a simple measurement round was performed to confirm these values for the present scenario.
A separate round of trial measurements were carried out without any indoor network to determine the coverage level of the macrocell in the measurement location. The antenna placement of an indoor system needs proper planning, as discussed in Chapter 5, to provide uniform coverage and dominance in indoors. The location is also important here as it decides the handover location between the macro cell and indoor pico cell. For both the repeater and picocell scenario, the doors in the Tietotalo building are chosen as the boundary between indoor cell and outdoor macro cell. While outside the doors, the macro cell has a good coverage, the indoor system’s EIRP and the antenna location are chosen so that the handover happens between the doors of the building.
Earlier studies by Ali Mazhar about WCDMA repeaters for the same measurement location, with one omnidirectional antenna, category 5/6 HSDPA data card with five channelization codes, found the optimal value for the repeater gain [25]. The results of those studies are presented in Table 6.4.
Table 6.4: Results from earlier studies on repeaters by Ali Mazhar [25].
Repeater gain dB
RSCP dBm
Ec/No dBm
Throughput kbps
Mean CQI
UL int. dBm
Macro-cellular -103.5 -13.3 1626 15.5 -105 55 dB -87.8 -11.5 2162 16.0 -105 65 dB -79.5 -10.9 2659 17.0 -104 75 dB -70.2 -10.8 2893 17.6 -100
42
These results were also verified with another set of preliminary measurement rounds with the same system configuration. As in the previous studies, the optimal value for the repeater gain was concluded as 65 dB, which increased the uplink interference by a maximum of 1 dB.

43
7. RESULTS
The measurement results presented in this chapter are based on data collected from a moving mobile at walking speed, downloading data over HSDPA, without other load in the network. The user started at different macro cell coverage locations of Routes A, B and C and walked towards the indoor serving antenna. The measuring software has a reporting interval of 200 ms and thus the data provided is an average over 100 samples of HSDPA TTIs (100*2 ms). The graphical results presented here are from Matlab after passing the raw data through built-in polynomial smoothing filter of order 2, to smooth the random variations. Furthermore, the plots here show the average values of several measurement rounds. The graphs have vertical lines as markers that are reference points for better understanding and analysis of the results. Exceptions to the measuring conditions, if any, are mentioned under the subsections.
Some example figures with samples as such from the measurement software and without applying the Matlab smoothing filter can be found in the Appendix.
7.1 Line of sight measurements: Route A
The results of the measurement route A with LOS condition to macrocell, starting in the LOS coverage region of macro cell, passing through the Tietotalo main door and towards the serving indoor antenna, are presented in this section. Macrocell coverage results without any indoor network over the same route are also presented in the plots for comparison.
Figure 7.1 shows the P-CPICH RSCP values along the measurement route for the three scenarios. The values for indoor configurations increase gradually in indoors, as the UE move towards the antenna. This shows the pico cell is working normally and repeater is clearly operating, amplifying the macro cell signal. The signal levels in outdoor for all the three scenarios remain the same, around -85 dBm, showing the macro cell is dominant in outdoors. Once the user enters the indoor, macro cell signal level shows a steady decline. The section between the 3rd and 4th marker, in between the doors of the building, is the handover location of the measurement route.
Figure 7.2 shows the trend of signal to interference ratio over the measurement route for a mobile downloading data over HSDPA, without any other load in the network. In outdoors, the SIR of pico cell scenario is the same as that of macro cell, indicating the signal from indoor is weak at outdoor locations and do not contribute much to the interference. At indoors, SIR of the pico cell increases along with RSCP

44
level. For macro cell, the values remain the same all along the route. However, the repeater scenario shows unexpected behavior compared to macro cell. The value is always lower than the macro cell even in outdoors. SIR for repeater scenario is not increasing in indoor either. The exact reason for this behavior is not known. As discussed in section 6.2.1, one possible reason could be the strong signal coverage of other cells present in the donor antenna location on the roof of the Tietotalo building, as presented in Table 6.3.
Figure 7.1: RSCP comparison plot for Repeater, Macro and Pico cell scenario.
Figure 7.2: SIR comparison plot for Repeater, Macro and Pico cell from the downloading mobile.
45
Assuming interference from other cells as the reason, it can be said that the other cell signals were also amplified by the repeater along with the required signal, which contribute to interference in the SIR measurements.
The HSDPA MAC-hs throughput for the three scenarios is shown in Figure 7.3. The pico cell scenario throughput reaches close to the maximum level, around 12.5 Mbps, once the UE enters the indoor. Before the cell change, the pico cell scenario throughput is the same as that of macro cell case. There is a clear drop in the throughput during the HS-DSCH cell change, between the two main doors of the building. During the cell change, throughput is null for around 500 ms. However, the throughput values regained the normal range very fast. As the figures are average of several rounds, the zero throughput values in picocell scenario appear as deep drop between 50th and 55th second of time scale. This drop also indicates the cell change from outdoor macrocell to picocell.
An example plot of a sample measurement round as recorded by the measurement software without Matlab smoothing filter is shown in Figure 7.4. The cell change happens around the 55th second and it is shown by a clear drop in throughput, after which the user is under indoor picocell coverage and throughput values reach 12 Mbps. The rapid variations in the throughput could be because of fast fading. Further measurements made on HS-DSCH cell change are presented under section 7.3. For the repeater and macrocell scenario, the transition is smooth and no such sudden drop or zero throughputs is observed at the cell change location.
Repeater scenario throughput reaches a value around 7 Mbps in indoors and remains more or less constant in the repeater coverage region. While the throughput for the repeater scenario is clearly lower than for the picocell scenario, it does not show considerable difference with macrocell throughput as expected. As discussed for SIR plot, this behavior is unexpected and could be because of the interference present in the repeater scenario, though the exact reason is not known. However, measurement from earlier studies show that repeater installation in indoors clearly improve the performance [2, 22, 25]. For the same donor antenna location and direction, for a similar antenna configuration with 65 dB repeater gain, the improvement in throughput was around 1000 kbps compared with macrocell. This improvement in throughput was achieved for a category 8/5 mobile [25]. If the measurements were performed with a category 14 mobile with a similar repeater configuration, the improvement in throughput is expected to be better than the difference achieved in earlier studies. Assuming better channel conditions and based on the results from the previous studies it is clear that HSDPA operation has benefited from the presence of repeaters with improved coverage and smooth transition from outdoor to indoors.

46
Figure 7.3: Throughput comparison plot for line of sight route for Repeater, Macro and Pico cell scenario.
Figure 7.4: Throughput plot showing HS-DSCH cell change for a sample round taken from pico cell scenario without averaging and smoothing.
Plot for 0/cE N in connected mode is presented in Figure 7.5. 0/cE N values presented here are from a mobile downloading data over HSDPA and hence includes the interference from HS channel. Once the user enters indoor, 0/cE N in pico cell scenario increases with RSCP, while it reaches a constant value around -10 dB for repeater scenario. The 0/cE N in repeater scenario is worse than the pico cell and

47
macrocell case in outdoors. In indoors, 0/cE N value for repeater is better than the macrocell as the measured RSCP is much better than the macrocell situation while the interference remain the same.
In Figure 7.6, CQI for repeater network is consistently lower compared to pico cell and macrocell. As expected, the repeater CQI plot reflects the repeater SIR plot shown in Figure 7.2. The same explanation given for SIR degradation for repeater scenario applies here. This further proves that the channel conditions are not at its best for repeater scenario. Although the CQI for macro cell in indoors is better in the figure compared to repeaters, the macro cell values is expected to get worse as the user moves further inside the building. However, the repeater CQI value reaches a constant value of 16 in indoors as the signal strength is better.
Furthermore, in Figure 7.6, a look at the pico cell scenario CQI reveals the nature of interference in outdoors and the HO area. Before the second marker, the CQI value for pico cell remains almost the same as that of macro cell. This indicates that the interference from the indoor cell is not considerably high at outdoors. After the second marker, close to HO area, CQI for pico cell is getting worse compared to macro cell which indicates high interference from indoor to outdoors. HO area is noticeable by drop in CQI value between the 3rd and 4th marker. Overlapping coverage and hence high interference, as prevalent in any HO area, causes the situation. CQI value reaches its maximum limit of 30 once the user enters indoors for pico cell, which is also reflected in the MAC-hs throughput realization.
Figure 7.5: 0/cE N comparison plot for the three scenarios.

48
Figure 7.6: Channel quality indicator comparison.
Comparison of Figures 7.6 and 7.3 reveal that, although the average CQI value for repeater scenario is always lower than the macrocell scenario, throughput for repeater scenario is slightly better in indoors compared to macrocell. This behavior cannot be explained as the calculation of CQI and the response of scheduling algorithms to the CQI values is vendor specific and is specific to both the network element and the mobile.
Furthermore, it is clear from Figure 7.1 that the RSCP value in repeater scenario closely follows the RSCP value in other cases at outdoors. This shows the macro cell coverage is dominant at outdoors. However, from Figures 7.2, 7.3, 7.5 and 7.6, it is clear that SIR, throughput, 0/cE N and CQI for repeater scenario are comparatively poor at outdoors. This could be because of the repeater signal with high interference present in outdoors. Although macrocell is dominant in outdoor area, the repeater signal is still available for the RAKE fingers as the separation between the macrocell signal and repeater signal will be always greater than 0.26 s . It is possible that the mobile receiver chose the best RSCP value from the output of available RAKE fingers, while the contribution of interference from repeater is accounted for other parameters. This cannot be verified by current measurement equipment as it is not possible to get the power delay spread of the environment. In addition, from RNC logs it was confirmed that the uplink interference value remained the same throughout the measurement. To explain the throughput behavior of repeater scenario in outdoors, deeper analysis should be done on the WCDMA repeaters, as it may help to study the effect of interference through repeaters, especially for an area in indoor under good macro cell coverage.

49
7.2 Non line of sight measurements: Routes B and C
Similar to LOS measurements, measurements were also performed for NLOS conditions with respect to macro coverage, in an open area and a long open corridor. The routes are shown as Route B and Route C in Figure 6.1. The user started from NLOS location of macro cell and walked towards the indoor antenna. The MAC-hs throughput and CQI results are presented in this section. RSCP and SIR results can be found in the Appendix.
The difference in performance between the three scenarios of Routes B and C remain similar to that of Route A. For example, CQI reached a value of 16 and 30 in indoors for repeater and pico cell respectively. Similarly throughput values are around 12 Mbps for pico cell scenario and 7 Mbps for repeater scenario in indoors. Hence the assumption on interference in repeaters could be applied for Routes B and C.
The throughput for route B is shown in Figure 7.7. This route had a NLOS condition to macro cell throughout the route. For pico cell scenario, like in Route A, HS-DSCH cell change is noticeable with a clear drop in throughput value, between 35th and 38th second. Throughput reaches values around 12 Mbps for pico cell in indoors. For the repeater scenario, until the user enters the indoor, the throughput values for repeater scenario are only slightly lower than the other two cases. The difference is lower in Route B than in Route A. The macro cell throughput gets better as the coverage conditions are getting better in the indoor location of the Route B.
Figure 7.7: Throughput comparison for Route B for the three scenarios.

50
Figure 7.8 shows the CQI for the three scenarios of Route B. For the pico cell scenario, there is a drop in CQI at the HO region because of interference. After the HS-DSCH cell change, CQI for the pico cell gets better and reaches the maximum value of 30 in indoors. As in Route A, the repeater CQI is lower compared to macro cell scenario in the area under macrocell coverage. This area is between 1st and 2nd markers of the Figure 7.8. This drop in outdoors is unexpected and could be explained based on the same assumptions made in Route A.
Figure 7.8: CQI comparison for Route B for the three scenarios.
For Route C, the throughput and CQI plots are shown in Figures 7.9 and 7.10 respectively. The CQI value of the macro cell scenario degrades as the user enters indoor. The peaks around 4th and 6th marker of the CQI plot for macro cell scenario could be because of the glass windows present in the building at these locations. The CQI value of the repeater is consistently less compared to the macro cell situation, while the throughput is better. Though the throughput value is supposed to be the reflection of CQI, here it is not. As discussed earlier, this behavior cannot be explained as the CQI value is mobile vendor specific and the response to CQI from the scheduling algorithms is specific to the network element vendor. As expected, the CQI for the pico cell scenario reaches the best possible level as the user moves closer to the antenna.
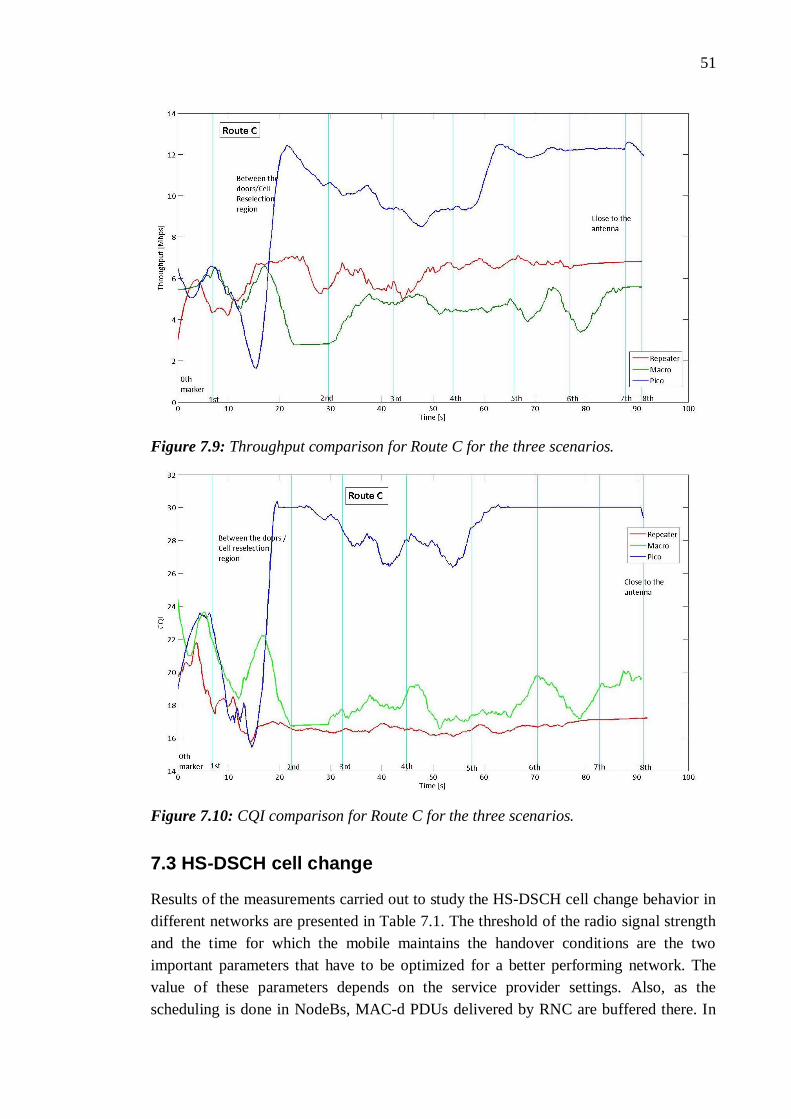
51
Figure 7.9: Throughput comparison for Route C for the three scenarios.
Figure 7.10: CQI comparison for Route C for the three scenarios.
7.3 HS-DSCH cell change
Results of the measurements carried out to study the HS-DSCH cell change behavior in different networks are presented in Table 7.1. The threshold of the radio signal strength and the time for which the mobile maintains the handover conditions are the two important parameters that have to be optimized for a better performing network. The value of these parameters depends on the service provider settings. Also, as the scheduling is done in NodeBs, MAC-d PDUs delivered by RNC are buffered there. In

52
case of inter-NodeB handovers, all buffered packets are simply discarded, including those which were already sent and not acknowledged. RLC layer handles the situation by initiating retransmission of PDUs to the new serving NodeB. This leads to higher delays and inactivity period for the mobile. In Table 7.1, cells with number 1, 2 and 3 belong to the indoor test network, while 4 is from outdoor test network. Similarly cells 4, 6, 7, 8 and 9 are commercial networks available close to the university.
The time taken for cell change as presented in Table 7.1 includes zero throughput values along with some inactive periods during cell change. Cell change in commercial network did not involve zero throughputs and it took 230 ms of inactivity for the cell change. This value is in the expected time limits for an inter NodeB HS-DSCH handover [13]. The scenario of cell change from outdoor to indoor network, as in the pico cell scenario, took around 400 ms. This inter NodeB handover delay could be because of the procedures involved in RLC protocol employed in mobile and RNC and the number of buffered PDUs in NodeB. Thus, the parameters in indoor network can be further optimized to reduce the HS-DSCH cell change time.
Table 7.1: Cell change time in different networks.
Network From
HS-DSCH cell #
To HS-DSCH cell #
Time for cell change (approx.)
Indoor Network
1 2 430 ms 2 1 500 ms 1 3 180 ms 3 1 180 ms
Outdoor to Indoor
4 1 400 ms 1 4 400 ms
Commercial Network
5 6 230 ms 6 7 230 ms 9 8 230 ms 8 9 230 ms
The conclusion is that the indoor network performance in case of dedicated indoor cells is affected by inactivity period and the momentary drop in throughput during handovers, while repeaters do not have such a situation. This shows that frequent handover regions in case of dedicated indoor solution should be avoided during planning phase, as more number of HS-DSCH cell changes may bring down the cell throughput and prevents the efficient use of available resources. This further proves the claim that repeaters are more flexible in case of network planning compared to dedicated indoor solutions.

53
7.4 Loaded scenario
To understand the network behavior in loaded scenario, separate measurement rounds were carried out for repeater and pico cell scenario over Route A. The results are tabulated in Table 7.2 and the values in the table represent the average of several measurement rounds taken over the whole measurement route. The measuring mobile belongs to category 14 and was moving over Route A as shown in Figure 6.2. The loads were static. One of the loading mobile (category 8) was placed under macro cell coverage area in outdoors while the other mobile (category 14) was placed under indoor coverage area. The location of loads is depicted in Figure 6.2. Furthermore, to understand the results of loaded scenario better and for comparison, the average values for a category 14 mobile in no load scenario is presented in Table 7.3. This is also measured over Route A and represents the average value in numbers for the results under section 7.1.
Considering the repeater scenario, the throughput difference between the loaded scenario and no load case is around 3.4 Mbps. The no load case is around 2.8 times better than the loaded case, while the CQI values did not differ much. However, the transport block (TB) size of no load case is around 1.85 times that of the loaded case. Similarly the TB size of pico cell no load case is around 1.6 times that of loaded case while the throughput differs by 2.1 times. This could be because of the scheduling when more than one mobile is present in the network.
Figure 7.11 depicts the throughput for the repeater and pico cell scenarios in loaded case. In indoors, for the loaded case, the repeater scenario throughput is around 2.5 Mbps while pico cell scenario throughput is around 6 Mbps. Again in indoors, for the no load case, repeater throughput is around 7 Mbps while it is 12.5 Mbps for pico cell. Thus the difference in indoor throughput between the no load case and loaded case is around 4.5 Mbps for repeaters while it is 6.5 Mbps for pico cell. This could be explained based on the fact that all users in repeater scenario, both in indoor and outdoor, are effectively under the coverage of macro cell. For pico cell scenario, indoor users are under pico cell coverage while outdoor user is under macro cell coverage. Considering a highly loaded indoor situation, it can be concluded that pico cell scenario offers a better solution compared to repeaters, as they provide higher capacity given more load in the network.
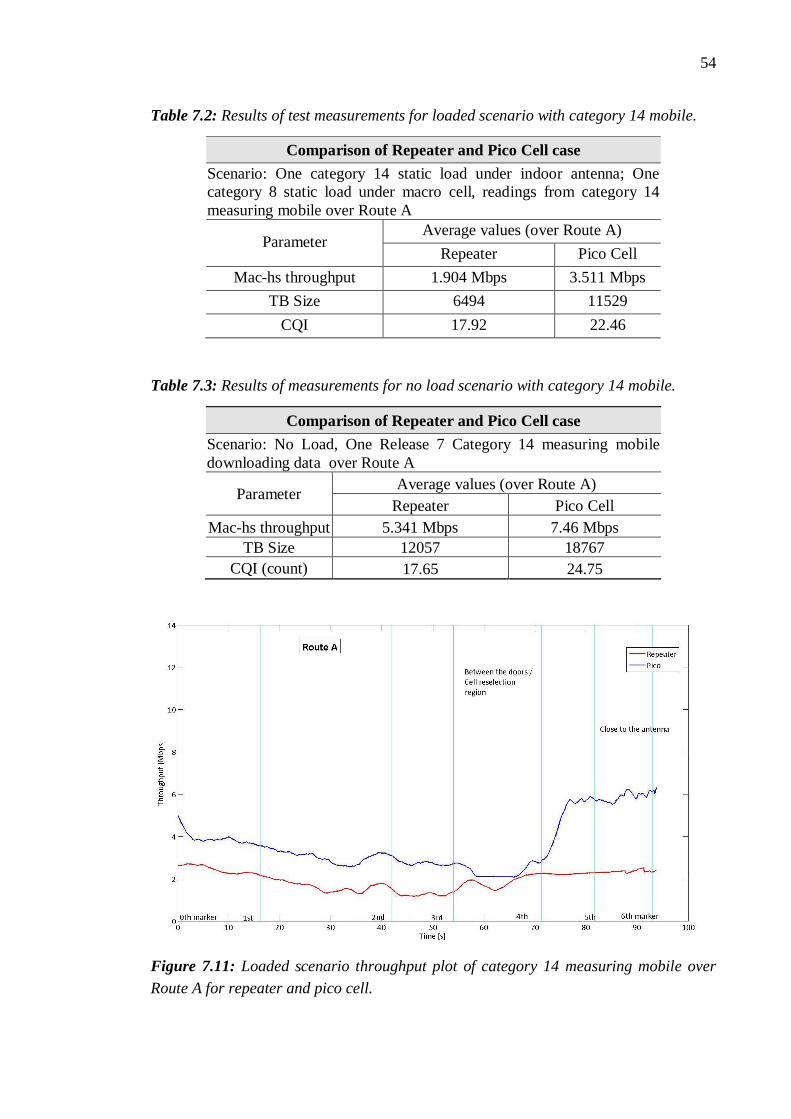
54
Table 7.2: Results of test measurements for loaded scenario with category 14 mobile.
Comparison of Repeater and Pico Cell case Scenario: One category 14 static load under indoor antenna; One category 8 static load under macro cell, readings from category 14 measuring mobile over Route A
Parameter Average values (over Route A)
Repeater Pico Cell Mac-hs throughput 1.904 Mbps 3.511 Mbps
TB Size 6494 11529 CQI 17.92 22.46
Table 7.3: Results of measurements for no load scenario with category 14 mobile.
Comparison of Repeater and Pico Cell case Scenario: No Load, One Release 7 Category 14 measuring mobile downloading data over Route A
Parameter Average values (over Route A) Repeater Pico Cell
Mac-hs throughput 5.341 Mbps 7.46 Mbps TB Size 12057 18767
CQI (count) 17.65 24.75
Figure 7.11: Loaded scenario throughput plot of category 14 measuring mobile over Route A for repeater and pico cell.

55
Figure 7.12: Loaded scenario CQI plot of category 14 measuring mobile over Route A for repeater and pico cell.
There is no noticeable difference in behavior between the plots of loaded scenario and no load case. Plots for throughput and CQI for loaded scenario is shown in Figure 7.11 and 7.12. The throughput for repeater case is nearly constant (2.5 Mbps) throughout the route, while the throughput for pico cell changes considerably after entering indoors. The CQI plot for loaded case shows the same behavior as in no load case. For the repeater scenario CQI, the peaks around 2nd marker and in HO area could be considered as measurement errors or as unexpected changes in channel conditions on the measurement day.
7.5 Error analysis
Measurement results presented in this thesis are subject to errors caused by the measurement process, the measurement equipment and the analysis phase. The measurements were carried out manually by walking along the measurement route. Hence the radio conditions and speed of the mobile for different measurement rounds were never exactly identical with each other. This can be observed as differences between the position of markers, in the total time taken for each measurement round and in the instantaneous values on the graphs. Furthermore, antennas are situated in the university corridor subject to people movement once in a while during the weekends and night time. In order to avoid these kinds of error, several measurement rounds were taken and the average is presented.
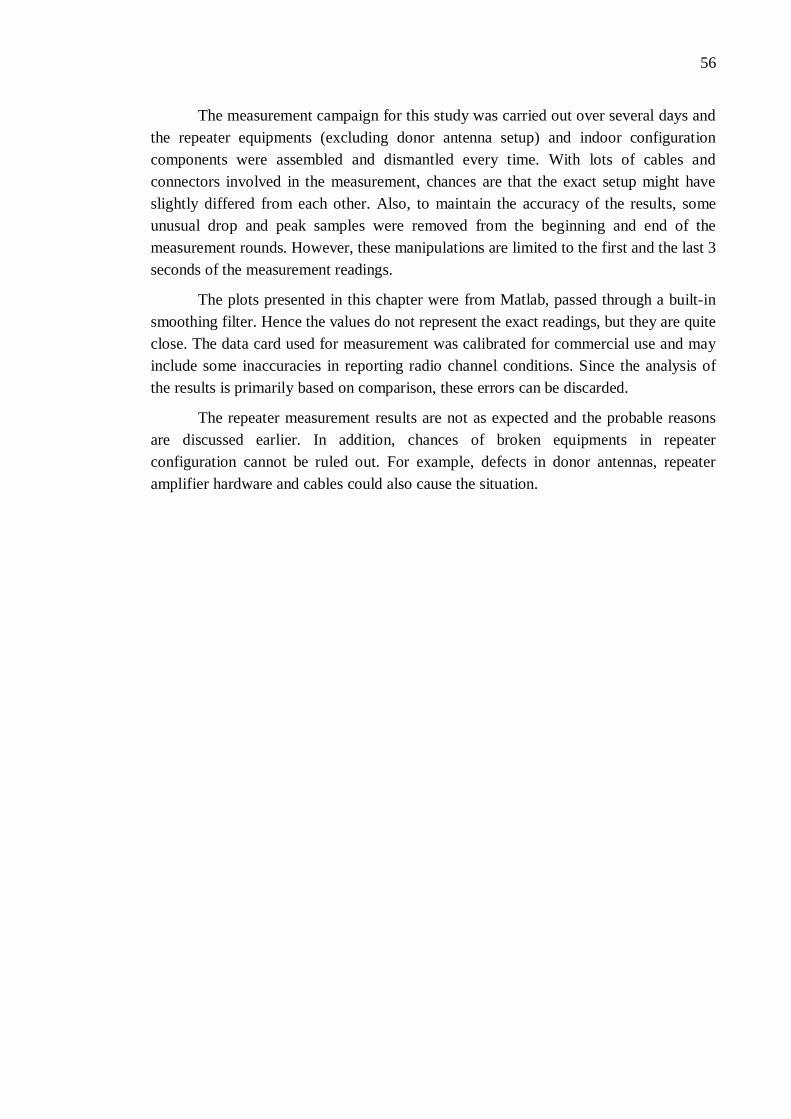
56
The measurement campaign for this study was carried out over several days and the repeater equipments (excluding donor antenna setup) and indoor configuration components were assembled and dismantled every time. With lots of cables and connectors involved in the measurement, chances are that the exact setup might have slightly differed from each other. Also, to maintain the accuracy of the results, some unusual drop and peak samples were removed from the beginning and end of the measurement rounds. However, these manipulations are limited to the first and the last 3 seconds of the measurement readings.
The plots presented in this chapter were from Matlab, passed through a built-in smoothing filter. Hence the values do not represent the exact readings, but they are quite close. The data card used for measurement was calibrated for commercial use and may include some inaccuracies in reporting radio channel conditions. Since the analysis of the results is primarily based on comparison, these errors can be discarded.
The repeater measurement results are not as expected and the probable reasons are discussed earlier. In addition, chances of broken equipments in repeater configuration cannot be ruled out. For example, defects in donor antennas, repeater amplifier hardware and cables could also cause the situation.

57
8. CONCLUSIONS AND DISCUSSION
In this Thesis, the macro-to-indoor mobility measurements for a dedicated indoor solution implemented using picocell were compared with a WCDMA analog repeater. Performance comparison between the two systems was also made at cell change location by field measurements. The measurements were made in three different routes: open area with LOS condition to macro cell, open area with NLOS condition to macrocell and a long corridor with NLOS condition to macrocell.
From the results, it is understandable that HSDPA operation has benefited from the presence of repeaters with improved coverage and smooth transition from outdoor to indoor. In the picocell system, a momentary drop in the throughput during HS-DSCH cell change was observed. However, the cell change procedure for indoor cell change did not take more than 500 ms in any of the measurement scenarios and the channel conditions reached the best possible level thereafter. Also, the cell change time can be improved further and brought down close to 200 ms as it was observed in commercial networks.
HSDPA mobiles that are capable of using 15 channelization codes need better channel conditions and CQI values above 25 for efficient operation. While picocell easily provided the required conditions and CQI value was at 30 most of the time in indoors, the repeater signal in this Thesis was limited to a maximum CQI value of 18. As discussed, this degradation in channel condition could be attributed to the presence of interference in the repeater signal.
The study also shows that the quality of repeater signal could impact the channel conditions at macrocell dominant outdoor locations that are close to repeater coverage area. Though the RSCP values at these outdoor locations are same as that of macrocell scenario with and without repeaters, a bad quality repeater signal could adversely impact SIR and in turn the CQI of the channel. This behavior should be studied further as it may help to study the effect of interference through repeaters, especially for an area in indoor under good macrocell coverage. Earlier studies on WCDMA repeaters with the same configuration and donor antenna location produced better channel conditions. Considering this fact and the results presented in this Thesis, it can be concluded that outdoor-to-indoor WCDMA repeaters are as good an option compared to dedicated indoor solutions. This conclusion also agrees with similar studies carried out with repeaters and dedicated indoors.
In high load conditions, repeaters are limited by the capacity of macro cell. Every additional user in indoor under repeater coverage add up to the load of macro

58
network. In pico cell implementations these users are served by the pico cell itself, thus effectively reducing the load on macro cell. It is clear from the study that pico cell offer the best solution in high load situation compared to repeaters.
This Thesis also recommends further studies on the implementation of repeaters for HSPA+ systems which uses 64QAM modulation and requires best channel conditions. This Thesis also suggests further investigation on the importance of proper donor antenna implementation and the definition of threshold values to help radio network planners. It is possible that HSPA+ systems could be more sensitive to faulty donor antenna implementations than HSDPA and earlier releases.

59
REFERENCES
[1] M. Heath, A. Brydon. Wireless network traffic 2008-2015: forecast and analysis, Analysys Mason, Cambridge, 2008.
[2] T. Isotalo, P. Lähdekorpi, J. Lempiäinen, Improving HSDPA Indoor Coverage and Throughput by Repeater and Dedicated Indoor System, in EURASIP Journal on Wireless Communications and Networking, 2008.
[3] T. Isotalo, J. Lempiäinen, HSDPA Measurements for Indoor DAS, in 65th IEEE Vehicular Technology Conference, (VTC 2005), 2005.
[4] M. Tolstrup. Indoor Radio Planning: A Practical Guide for GSM, DCS, UMTS and HSPA. John Wiley & Sons, Ltd, 2008.
[5] T. S. Rappaport. Wireless Communications: Principles and Practice. 2nd ed. Prentice-Hall, 2002.
[6] J. Lempiäinen, M. Manninen. Radio Interface System Planning for GSM/GPRS/UMTS. Kluwer Academic Publishers, 2001.
[7] J. Lempiäinen, M. Manninen. UMTS Radio Network Planning, Optimization and QoS Management, Kluwer Academic Publishers, 2003.
[8] S. R. Saunders. Antennas and Propagation for Wireless Communication Systems. John Wiley & Sons, Ltd, 1999.
[9] W. C. Y. Lee. Mobile Communications Design Fundamentals. 2nd ed. John Wiley & Sons, Ltd, 1993.
[10] H. Hashemi. The Indoor Radio Propagation Channel. IEEE Transactions on Vehicular Technology Conference, Vol. 81, Issue 7, pp.943-968, July 1993.
[11] 3GPP, website, http://www.3gpp.org/About-3GPP.
[12] H. Holma, A. Toskala. WCDMA for UMTS: Radio Access for Third Generation Mobile Communication, Revised ed. John Wiley & Sons, Ltd, 2007.
[13] Harri Holma and Antti Toskala. HSDPA/HSUPA for UMTS: High Speed Radio Access for Mobile Communications, John Wiley & Sons, Ltd, 2006.
[14] H. Holma, A. Toskala. LTE for UMTS – OFDM and SC-FDMA Based Radio Access, John Wiley & Sons, Ltd, 2009.
[15] 3GPP TS 25.301 V6.6.0, Release 6, Radio interface protocol architecture.

60
[16] 3G Evolution: HSPA and LTE for mobile broadband; E Dahlman, S. Parkvall, J. Skold and P. Beming, Academic Press, 2008.
[17] J. Laiho, A. Wacker, T. Novosad. Radio network planning and optimization for UMTS. John Wiley & Sons, Ltd, 2002.
[18] Janne Palttala, Indoor Network impact on macro cell HSPA performance; Master of Science Thesis, Tampere University of Technology, 2010.
[19] J. Laiho, A. Wacker, T. Novosad. Radio network planning and optimization for UMTS. John Wiley & Sons, Ltd, 2002.
[20] S. Lee, D. Kim, Y. Kim, M. Kim, M. Kim, S. Shin, S. Ha, J. Ihm. Optimization of the HSDPA Network in the Cell-Overlaid Area. IEEE Transactions on 10th IEEE Singapore International Conference, pp. 1-5, 2006.
[21] 3GPP, TS 32.403 v5.8.0 (2004-09), Telecommunication Management; Performance Management (PM); Performance Measurements – UMTS and Combined UMTS/GSM (Release 5).
[22] P. Lähdekorpi, T. Isotalo, A. Mazhar, J. Lempiäinen, Improving HSDPA Indoor Performance Using Outdoor Repeater, in Proceedings of 11th Int. Symposium on Wireless Personal Multimedia Communications (WPMC’08), 2008.
[23] Anite Nemo Outdoor, Product Description, [www]: http://www.anite.com/nemo.
[24] 3GPP, TS 25.308, Version 5.7.0, Release 5, High Speed Downlink Packet Access (HSDPA); Overall description; Stage 2.
[25] Ali Mazhar, Optimization of HSDPA in indoor environment with repeater and distributed antenna systems; Master of Science Thesis, Tampere University of Technology, 2010.
[26] ETSI, TR 101 115 V6.0.2 (1998-07), Digital cellular telecommunications system (Phase 2+); Background for Radio Frequency (RF) requirements (GSM 05.50 version 6.0.2 Release 1997)
[27] 3GPP, TS 25.309; Technical Specification Group Radio Access Network; FDD Enhanced Uplink; Overall Description; Stage 2.
[28] B. Walke, P. Seidenberg, M. P. Althoff. UMTS: The Fundamentals. John Wiley and Sons Ltd, 2003.
[29] Sierra Wireless, website, http://www.sierrawireless.com/productsandservices /AirCard/USBModems/aircard_usb308_AirCard310u.aspx.

61
[30] J. Borkowski, J. Niemelä, T. Isotalo, P. Lähdekorpi, J. Lempiäinen, Utilization of an Indoor DAS for Repeater Deployment in WCDMA, in 63rd IEEE Vehicular Technology Conference, (VTC 2006), 2006.
[31] Aerial view, [www]: http://maps.live.com/.

62
APPENDIX
Figure 1: Sample plot showing CQI for pico cell over Route A without averaging and smoothing.
Figure 2: RSCP for pico cell for a sample round over Route A without averaging and smoothing.

63
Figure 3: SIR plot of a sample round for repeater without averaging and smoothing.
Figure 4: Throughput plot of a sample round for repeater without averaging and smoothing.

64
Figure 5: RSCP plot for Route B for the three scenarios.
Figure 6: SIR plot for Route B.

65
Figure 7: RSCP plot for Route C.
Figure 8: SIR plot for Route C.