ramp-to-ramp toll modeling presented by jim fennessy fennessy associates michael w doherty
DESCRIPTION
Ramp-to-Ramp Toll Modeling Presented By Jim Fennessy Fennessy Associates Michael W Doherty URS Corporation For Model Task Force Meeting Orlando, Florida November 29, 2007. Ramp-to-Ramp Toll Modeling. Jim Fennessy: History and Development Michael W Doherty: - PowerPoint PPT PresentationTRANSCRIPT

1
Ramp-to-Ramp Ramp-to-Ramp
Toll ModelingToll Modeling
Presented ByPresented By
Jim FennessyJim FennessyFennessy AssociatesFennessy Associates
Michael W DohertyMichael W DohertyURS CorporationURS Corporation
ForFor
Model Task Force MeetingModel Task Force MeetingOrlando, FloridaOrlando, Florida
November 29, 2007November 29, 2007

2
Ramp-to-Ramp Ramp-to-Ramp Toll ModelingToll Modeling
Jim Fennessy: Jim Fennessy: – History and Development History and Development
Michael W Doherty: Michael W Doherty: – Application at Florida’s TurnpikeApplication at Florida’s Turnpike

3
Development History of Development History of Ramp-to-Ramp Ramp-to-Ramp Toll ModelingToll Modeling
CTOLLCTOLL UTPS -- UROADUTPS -- UROAD Toll Facilities ModelToll Facilities Model Other Miscellaneous Other Miscellaneous
Toll Modeling DevelopmentToll Modeling Development Ramp-to-Ramp Toll ModelingRamp-to-Ramp Toll Modeling

4
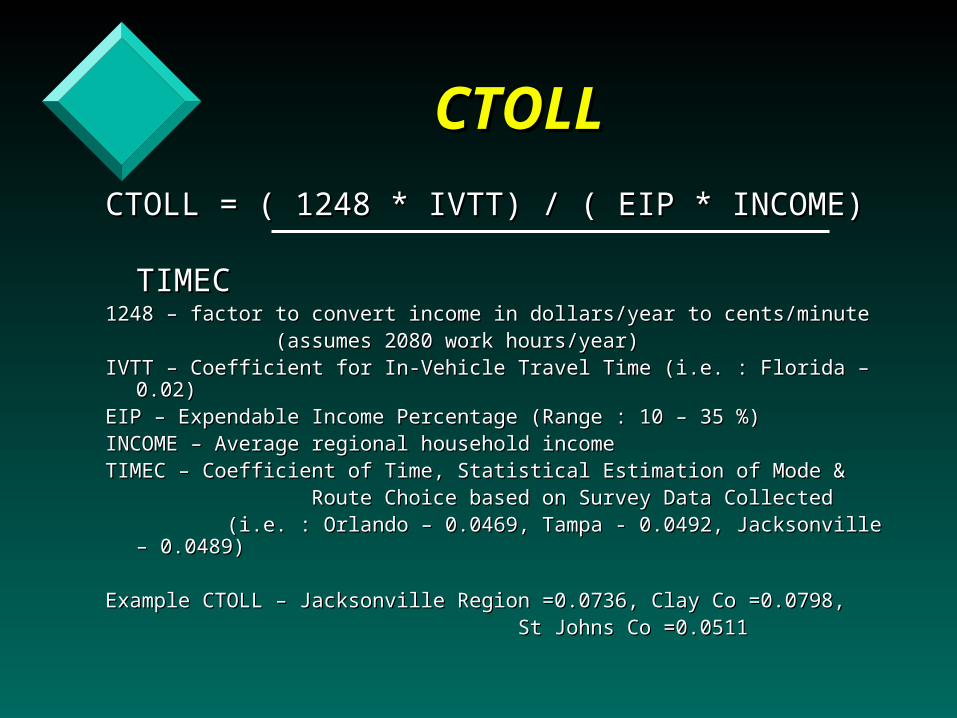
CTOLLCTOLL
Conversion of cost to time Conversion of cost to time based upon average income in based upon average income in study areastudy area
Equilibrium highway load Equilibrium highway load parameter: ranges from 0.02 parameter: ranges from 0.02 (income = $100k) to 0.10 (income = $100k) to 0.10 (income = $20k)(income = $20k)
5
CTOLLCTOLL
CTOLL = ( 1248 * IVTT) / ( EIP * INCOME)CTOLL = ( 1248 * IVTT) / ( EIP * INCOME) TIMECTIMEC1248 – factor to convert income in dollars/year to cents/minute1248 – factor to convert income in dollars/year to cents/minute (assumes 2080 work hours/year)(assumes 2080 work hours/year)IVTT – Coefficient for In-Vehicle Travel Time (i.e. : Florida – 0.02)IVTT – Coefficient for In-Vehicle Travel Time (i.e. : Florida – 0.02)EIP – Expendable Income Percentage (Range : 10 – 35 %)EIP – Expendable Income Percentage (Range : 10 – 35 %)INCOME – Average regional household incomeINCOME – Average regional household incomeTIMEC – Coefficient of Time, Statistical Estimation of Mode & TIMEC – Coefficient of Time, Statistical Estimation of Mode & Route Choice based on Survey Data CollectedRoute Choice based on Survey Data Collected (i.e. : Orlando – 0.0469, Tampa - 0.0492, Jacksonville – (i.e. : Orlando – 0.0469, Tampa - 0.0492, Jacksonville –
0.0489)0.0489)
Example CTOLL – Jacksonville Region =0.0736, Clay Co =0.0798,Example CTOLL – Jacksonville Region =0.0736, Clay Co =0.0798, St Johns Co =0.0511St Johns Co =0.0511

6
UTPS -- UROADUTPS -- UROAD
Up to 20 toll categoriesUp to 20 toll categories Coded in the TRANPLAN cost fieldCoded in the TRANPLAN cost field TOLLS – toll in dollars for each TOLLS – toll in dollars for each
category (converted to time via category (converted to time via CTOLL)CTOLL)
SERVT – service time in minutesSERVT – service time in minutes Toll links should be coded with zero Toll links should be coded with zero
distance on links to turn off distance on links to turn off capacity restraint calculationcapacity restraint calculation

7
UTPS – UROADUTPS – UROADLink RepresentationLink Representation
A
B
C
D
B-C Toll Link

8
Toll Facilities ModelToll Facilities Model
Current FSUTMS Toll ModelCurrent FSUTMS Toll Model TOLDATA fileTOLDATA file
– CTOLL (overrides any parameter)CTOLL (overrides any parameter)– A-NODE and B-NODEA-NODE and B-NODE– Toll in dollarsToll in dollars– Service time in minutes : secondsService time in minutes : seconds– Toll facility identificationToll facility identification– Number of lanesNumber of lanes– Toll type ramp (no accel/decel) or barrierToll type ramp (no accel/decel) or barrier

9
TOLL FACILITIES MODELTOLL FACILITIES MODELLink RepresentationLink Representation
D
A-B Decel Link
B-C Toll Link
C-D Accel Link
BC
A

10
Miscellaneous Toll Miscellaneous Toll Modeling DevelopmentsModeling Developments
Open Road Tolling (TOLDATA Open Road Tolling (TOLDATA file additional fields)file additional fields)
Discrete Tolls – Toll based Discrete Tolls – Toll based upon the number of toll upon the number of toll facilities crossedfacilities crossed
Toll Avoidance AreasToll Avoidance Areas– Help identify use of facility without a paying toll Help identify use of facility without a paying toll
Is the area an error in coding? Is the area an error in coding? Is the area a close up issue with the tolling scheme?Is the area a close up issue with the tolling scheme?

11
Ramp-to-Ramp Ramp-to-Ramp Toll ModelingToll Modeling
Latest Toll Collection MethodsLatest Toll Collection Methods– Ramp-to-Ramp (Card System)Ramp-to-Ramp (Card System)– BarrierBarrier– Electronic Tolling (SunPass)Electronic Tolling (SunPass)– Discount Pricing (Discrete Tolling) Discount Pricing (Discrete Tolling) – Open Road TollingOpen Road Tolling– Variable Pricing (X-Lanes)Variable Pricing (X-Lanes)
Flexible for all casesFlexible for all cases Software ModificationsSoftware Modifications

12
Ramp-to-Ramp Ramp-to-Ramp Toll ModelingToll Modeling
GA
B C E F
P D R SQ
Software Problem:
Toll Pathing : A B C D + 50D E F G + 75A B C E F G + 125

13
Ramp-to-Ramp Ramp-to-Ramp Toll ModelingToll Modeling
Network RestructureNetwork Restructure Pseudo LinksPseudo Links
– Turn Prohibitors / PenaltiesTurn Prohibitors / Penalties– Selected LinksSelected Links
Pseudo to Real LinksPseudo to Real Links Assignment by IterationAssignment by Iteration Output File – Real LinksOutput File – Real Links
Software Solutions:

14
Ramp-to-Ramp Ramp-to-Ramp Toll ModelingToll Modeling
Toll Matrices for Veterans ExpresswayToll Matrices for Veterans Expressway

15
Ramp-to-Ramp Ramp-to-Ramp Toll ModelingToll Modeling
Toll Matrices convertedinto a comma delimitedformat for input toTRANPLAN

16
Ramp-to-Ramp Ramp-to-Ramp Toll ModelingToll Modeling
Software Output :Software Output :
– Ramp-to-Ramp Detail ReportRamp-to-Ramp Detail Report VolumesVolumes Estimated RevenueEstimated Revenue Ramp ID’sRamp ID’s
– Company SummaryCompany Summary– DBF Output for Other Software DBF Output for Other Software
InterfaceInterface

17
Ramp-to-Ramp Ramp-to-Ramp Toll ModelingToll Modeling
Ramp-to-Ramp Detail ReportRamp-to-Ramp Detail Report

18
Ramp-to-Ramp Ramp-to-Ramp Toll ModelingToll Modeling
Company Summary Company Summary ReportReport

19
Florida Turnpike Florida Turnpike ApplicationApplication
Issues with :Issues with :– Supporting Survey data for Toll Supporting Survey data for Toll
Roads Roads – CTOLLCTOLL– Overstating short trips on Toll Overstating short trips on Toll
RoadsRoads– Sensitivity to Speeds and Sensitivity to Speeds and
CapacitiesCapacities
20
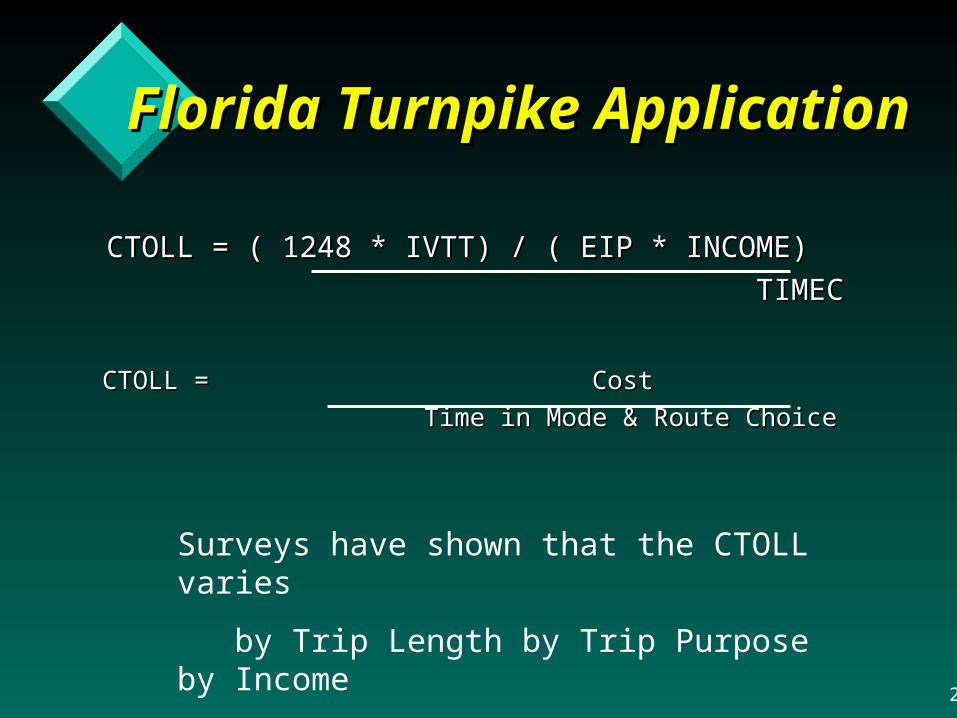
Florida Turnpike Florida Turnpike Application Application
CTOLL = ( 1248 * IVTT) / ( EIP * INCOME)CTOLL = ( 1248 * IVTT) / ( EIP * INCOME)
TIMECTIMEC
CTOLL = CostCTOLL = Cost
Time in Mode & Route ChoiceTime in Mode & Route Choice
Surveys have shown that the CTOLL varies
by Trip Length by Trip Purpose by Income

21
Florida Turnpike Florida Turnpike ApplicationApplicationCTOLL = (1/VOT) * 0.6
5
30 55 80 105 130
5,000
25,000
45,000
65,000
85,000
105,000
125,000
145,000
0.00
5.00
10.00
15.00
20.00
25.00
30.00
35.00
Value of Time ($/hr)
Distance (mi.)
Income ($)
22
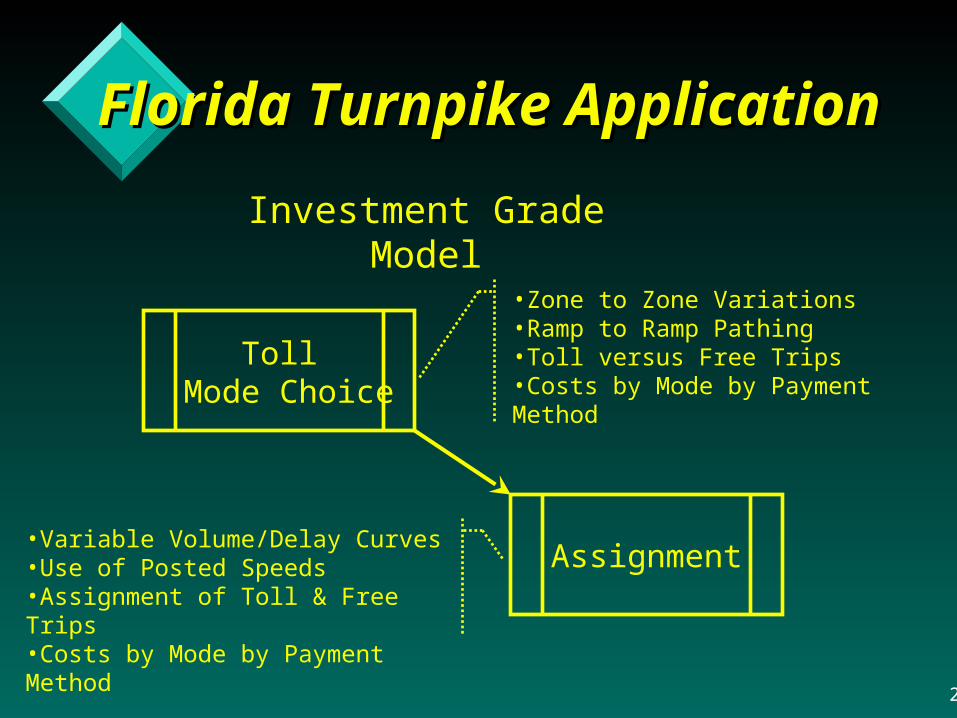
Florida Turnpike Florida Turnpike ApplicationApplication
Investment Grade Model
Toll Mode Choice
Assignment
•Zone to Zone Variations•Ramp to Ramp Pathing•Toll versus Free Trips•Costs by Mode by Payment Method
•Variable Volume/Delay Curves•Use of Posted Speeds•Assignment of Toll & Free Trips•Costs by Mode by Payment Method

23
Ramp-to-Ramp Ramp-to-Ramp
Toll ModelingToll Modeling
Presented ByPresented By
Jim FennessyJim FennessyFennessy AssociatesFennessy Associates
Michael W DohertyMichael W DohertyURS CorporationURS Corporation
ForFor
Model Task Force MeetingModel Task Force MeetingOrlando, FloridaOrlando, Florida
November 29, 2007November 29, 2007