r&d intensity and export: the case of indian
TRANSCRIPT

Review of Integrative Business and Economics Research, Vol. 10, Supplementary Issue 3 1
copyright 2021 GMP Press and Printing
R&D Intensity and Export: The Case of Indian Pharmaceutical Industry Subhashis Nandy* University of Phoenix Fiona Sussan Toyo University
ABSTRACT India is a major exporter of generic drugs in the world. In the past two decades, Indian pharmaceutical companies (IPCs) have increased their research and development (R&D) spending alongside major government reforms in patent laws and intellectual property rights to strengthen the industry’s global competitiveness. The relationship between R&D spending and export however is not clear. Filling this gap of knowledge, this paper investigates: 1) the longitudinal performance of IPCs in terms of their export and R&D spending, 2) the relationship between their R&D intensity and export, 3) R&D intensity as a function of firm size and age, 4) the comparison of innovation between IPCs and top global pharmaceutical companies, and 5) the comparison of the innovations of major IPCs. Data on export, R&D intensity, and patent filing at both the industry and firm levels from year 2000 to 2019 were collected. The results show that export revenues and R&D intensity have not increased significantly from 2012 to 2019. However, R&D intensity is positively correlated to export. The age of IPCs is inversely related to their R&D intensity. Compared to global pharmaceutical companies, IPCs show significantly lower R&D intensity. The results have nuanced implications for managers.
Keywords: Indian Pharmaceutical Companies, Drug Export, Generic Drugs, Research and Development, Global Pharmaceutical Companies.
1. INTRODUCTION
About half of India’s pharmaceutical sales are for export (IBEF 2019). India ranks tenth in the world in pharmaceutical exports (Workman, 2020) with a large percentage of its generic drugs sold to Western markets such as the United States and Europe (IBEF 2019). Despite robust growth in the past two decades, Indian pharmaceutical companies (hereafter IPCs) face many challenges. First, Indian drug brands are perceived as low brand value in general (Mahajan, 2020; Nair, 2020). Second, the rising costs of raw materials sourced from China (Mahajan, 2019, 2020; Mukherjee, 2015) and the onus of new drug discovery (Mahajan, 2020). Third, increasing competition for generics from China (Sharma, 2020), and fourth, global importers of drugs have imposed tightening safety and efficacy testing requirements on IPCs (Mahajan, 2020).
Facing these challenges, the Indian government has carried out multiple reforms to increase the competitiveness of IPCs (Chandran and Brahmachari, 2019; Mukherjee, 2015). Mainly the reforms were aimed at facilitating and encouraging R&D activities so that IPCs can develop more products and become competitive globally (Mahajan, 2020). However, the causal relationship between R&D and export is unclear, which leads to the main research

Review of Integrative Business and Economics Research, Vol. 10, Supplementary Issue 3 2
copyright 2021 GMP Press and Printing
question of this paper – what are the relationships between R&D intensity and export in the Indian pharmaceutical industry? In answering this question, this paper also examines the trend of export growth and R&D intensity of IPCs in recent years, and the comparison of R&D intensity of IPCs and global pharmaceutical companies. The rest of the paper begins with a literature review, then hypotheses, data and the methods for testing the hypotheses follow. Discussions and conclusion are presented after the results.
2. LITERATURE REVIEW
2.1 Indian Government Actions and the Indian Pharmaceutical Industry
In the past two decades, the landmark action that the Indian government took to promote and strengthen India’s pharmaceutical industry was the signing of the World Trade Organization’s (WTO) Agreement on Trade-Related Intellectual Property Rights (TRIPS) in 2005. WTO-TRIPS requires member states to adopt and enforce minimum standards adhere to intellectual property rights (Dhar & Joseph, 2019). Before this agreement, the patent protection law for pharmaceutical products was ambiguous under the process approach in which a patent only lasted for ten years (Vaidya, Garg, Singh, & Mahajan, 2018). With the WTO-TRIPS agreement, India switched to a product-based patent registration that covered products instead of the process of drug making. Subsequently, the patent term was extended from ten to twenty years.
Fast forward a decade, Prime Minister Modi and his government also took more actions to strengthen the pharmaceutical industry with initiatives such as Make in India in 2014, the National Intellectual Property Rights Policy (NIPR) in 2016, and other policies that improve foreign direct investment (FDI) inflows, and improve the ease of doing business in India. Make in India is an initiative to encourage both local and foreign companies to make India a global manufacturing hub. Within the pharmaceutical industry context, the ‘Make in India’ initiative aims to strengthen productivity and efficiency through a rigorous policy framework that encourages technology transfer through FDI inflows from abroad and properly securing intellectual property rights of foreign partners (Mukherjee, 2015). The government reported that the performance of IPCs has improved considerably after it introduced a series of policy reforms that facilitated sector-specific infrastructure development, skill development and FDI inflows, alongside improving the ease of doing business in general (Government of India (GoI, 2017). In 2016, the government launched a National Intellectual Property Rights Policy (NIPR) to promote an end-to-end ecosystem for intellectual property generation that ranges from creativity and innovation to commercialization and enforcement (Chandran and Brahmachari, 2019).
2.2 IPCs business model and their R&D
Parallel with the actions of the Indian government, private sector of IPCs small and large also engaged vigorously in the past two decades in improving their business models, spent more on R&D to foster innovations, and became more competitive in the global pharmaceutical market.
IPCs Business Model
Review of Integrative Business and Economics Research, Vol. 10, Supplementary Issue 3 3
copyright 2021 GMP Press and Printing
Exporting formulated low-cost generic drugs is the major business model of IPCs. In 2018, IPCs account for about 20 percent of global exports in generics or US$ 17 billion (IBEF, 2019). Forty percent of generic drug demand in the US and 25 percent of all medicine in UK are met by generic drugs exported from India (IBEF, 2019). Another main revenue for IPCs is from their supplying more than 50 percent of vaccines around the world (IBEF, 2019).
Although IPCs enjoy a substantial market share in several key markets, they are however facing some major challenges (Chakraborty & Banik, 2020). First, their over-dependence on raw materials such as “Active Pharmaceutical Ingredients” (APIs) from China and the volatile costs of APIs threaten the competitiveness of IPCs generic products in the global marketplace (Mahajan, 2019, 2020; Mukherjee, 2015). Second, owing to the generics market dynamics in the U.S., IPCs face regulatory sanctions resulting in incurring large sums of litigation and impairment charges (Mahajan, 2020). Third, generic drugs in general are price-sensitive and are subject to stiff competition worldwide (Mahajan, 2020).
Because of these challenges, it is proposed that IPCs need to change their business models in multiple directions. First, IPCs need to manufacture their APIs using Good Manufacturing Practices (GMP) and market these drugs in their export markets (Nair, 2020). Second, IPCs should shift their focus from generic drugs to the areas of discovery and development of new drugs (Mahajan, 2020; Nair, 2020) and gradually shifting to biopharmaceutical products (Mahajan, 2020).
However, the changes of IPCs’ business models hinge on capacity building (Chandran & Brahmachari, 2018). Capacity building via structural flexibility and organizational change is tied to growth and superior performance among IPCs (Singh and Burhan, 2015). Some of the examples of organizational changes include speeding up diversifying their current operations, augmenting their product pipeline, and considerable productivity improvements (Mahajan, 2020).
R&D
Ever since the signing of the WTO-TRIPS in 2005, the Indian pharmaceutical industry entered a rigorous Intellectual Property Appropriability Regime (Ray & Ray, 2021). With a more favorable IP policy and realizing the need to change their business models, IPCs have increased their R&D efforts. Instead of focusing on generic drugs, IPCs have increased their R&D investments through multiple routes. One route is through using state-of-the-art technologies (Kamikke, 2020). Another route is to invest significant portions of their annual sales revenues in R&D of novel drugs leading to the filing for patents in a foreign jurisdiction to increase market reach (Dhar & Joseph, 2019). An extension of this route is to increase their capabilities through overseas acquisitions and collaborations with multi-national pharmaceutical companies (Kale, 2019). An example of this route includes four IPCs - Dr. Reddy’s Lab, Cipla, Biocon, and Lupin - that made gradual transitions towards the development of sophisticated drugs with biosimilar compounds with overseas partners (Kale, 2019). To be more specific, these firms shifted their R&D away from ‘small molecule’ generic products to focus on the development of biosimilar compounds. A biosimilar compound is a large complex molecule that has been sourced from a living cell, for example, insulin. Biosimilar compounds are used to cure serious ailments like cancer, autoimmune diseases, diabetes, growth hormone deficiency, and inflammation. Biosimilar

Review of Integrative Business and Economics Research, Vol. 10, Supplementary Issue 3 4
copyright 2021 GMP Press and Printing
compounds are similar in terms of quality, safety, and efficacy to an already licensed biological product being an interchangeable generic equivalent.
The factors determining R&D intensity of IPCs are many. In their analysis of R&D activities of the top 91 publicly traded IPCs in the Indian stock market, research results showed that the factors that significantly impact the R&D intensity of a pharmaceutical company in India are: size, past year profitability, past innovative output, leverage ratio, past cash flow, and the export and import levels of the company (Tyagi, Nauriya, & Gulati, 2018). While the size of the company exhibits a non-linear relationship, cash flow, patent counts, and the size of the company’s overseas business show positive linear relationships with R&D intensity of a company (Tyagi et al., 2018). It is suggested that the growth of the pharmaceutical industry in India relies on IPCs increasing their R&D spending (Mukherjee, 2015).
However, not all R&D spending by IPCs are effective as Suri & Manerji (2016) reported that a majority of R&D budget was spent to grow low-cost generics in order to export to the highly regulated markets in the US and Europe. As a result, the R&D spending along with capital expenditure that focus on generic drugs do not improve export significantly. Furthermore, in their analysis of data from 1994 to 2012, late-comer IPCs while showed torrid activity in the IPR regime did little to form partnerships with foreign pharmaceutical companies to intensify their R&D activities (Ray & Ray, 2021).
3. HYPOTHESES
As the government has introduced pharmaceutical-related policy reforms that improved infrastructure and encouraged FDI inflows alongside with Make in India initiative, it is reasonable to propose that IPCs export has been increasing in the past decade:
H1: Ceteris Paribus, the annual export of IPCs has increased in the past decade.
Since IFCs have reportedly increased their R&D investments after signing the TRIPS Agreement in 2005, coupled with global market competitiveness that has forced IFCs to lessen their dependence on generic drug exports as income sources, there is reason to believe that IFCs have increased their R&D expenditure leading to the following hypothesis:
H2: Ceteris Paribus, IFCs annual expenditure on R & D has increased in the past decade.
Although results from prior research are mixed in terms of R&D intensity and export, given the continuous effort by the government and individual IPCs, there is reason to believe that for India, R&D intensity and export at the industry level are positively related leading to the following hypothesis:
H3: Ceteris Paribus, at the industry aggregate level, IFCs R&D intensity and their exports are positively correlated.
Furthermore, prior research suggested R&D intensity at the firm level will vary depending on the size of the firm leading to the following hypothesis:
H4a: Ceteris Paribus, firms’ size has a positive correlation to R&D intensity with the larger firms with more R& D activities than the smaller firms.

Review of Integrative Business and Economics Research, Vol. 10, Supplementary Issue 3 5
copyright 2021 GMP Press and Printing
We further propose that the tenure or the age of the firm will also impact R&D intensity with the older firms engage in lower R&D intensity when compare to the younger firms leading to the following hypothesis:
H4b: Ceteris Paribus, the age of the firm impacts R&D intensity with the younger firms with higher R&D activities than the older firms.
Another innovation in terms of patents, we have reason to believe that the number of worldwide patent applications filed will differ between Lupin, Dr. Reddy’s Laboratories, and Cipla. This is because the three companies specialize in the development of different pharmaceutical products. Lupin focuses on the development of biosimilar compounds to be used as an anti-inflammatory drug. Dr. Reddy’s Lab specializes on the development of generic medicines to fight opioid addiction. Cipla uses its resources to develop generic therapies for lung diseases. Given the competitiveness of the IPCs, their long-term strategy, business models, and their focus on innovation vary, the following hypothesis is proposed:
H5: Ceteris Paribus, the median number of worldwide patent applications filed from 2000 to 2017 would differ between Lupin, Dr. Reddy’s Laboratories, and Cipla.
Due to the increased competitiveness of the generic drug market worldwide, India has begun its path from diverting mostly generic drug manufacturing to increase R&D expenditure on non-generic drugs, it is expected that India’s IPCs are lagging in their R&D when compared to global pharmaceutical companies leading to the following hypothesis:
H6. Ceteris Paribus, expenditure on R&D among IPCs would be different from global pharmaceutical companies.
4. DATA
The following export data set in Table 1 is obtained from IBEF (2019). The range of the data is from 2012 to 2019.
Table 1: Total Pharmaceutical Exports from India
Year Export Amounts (Billions US$)
Percentage change (year over year)
2012 10.1 2013 12.6 24.8 2014 14.5 15.1 2015 14.9 2.8 2016 16.9 13.4 2017 16.8 -0.6 2018 17.3 3.0 2019 16.3 -5.8 Mean 14.9 7.5
(Source: IBEF, 2019)
It is observed that the average amount of pharmaceutical export from India from 2012 to 2019 was $14.9 billion, with an average annual growth rate of 7.5%.
Review of Integrative Business and Economics Research, Vol. 10, Supplementary Issue 3 6
copyright 2021 GMP Press and Printing
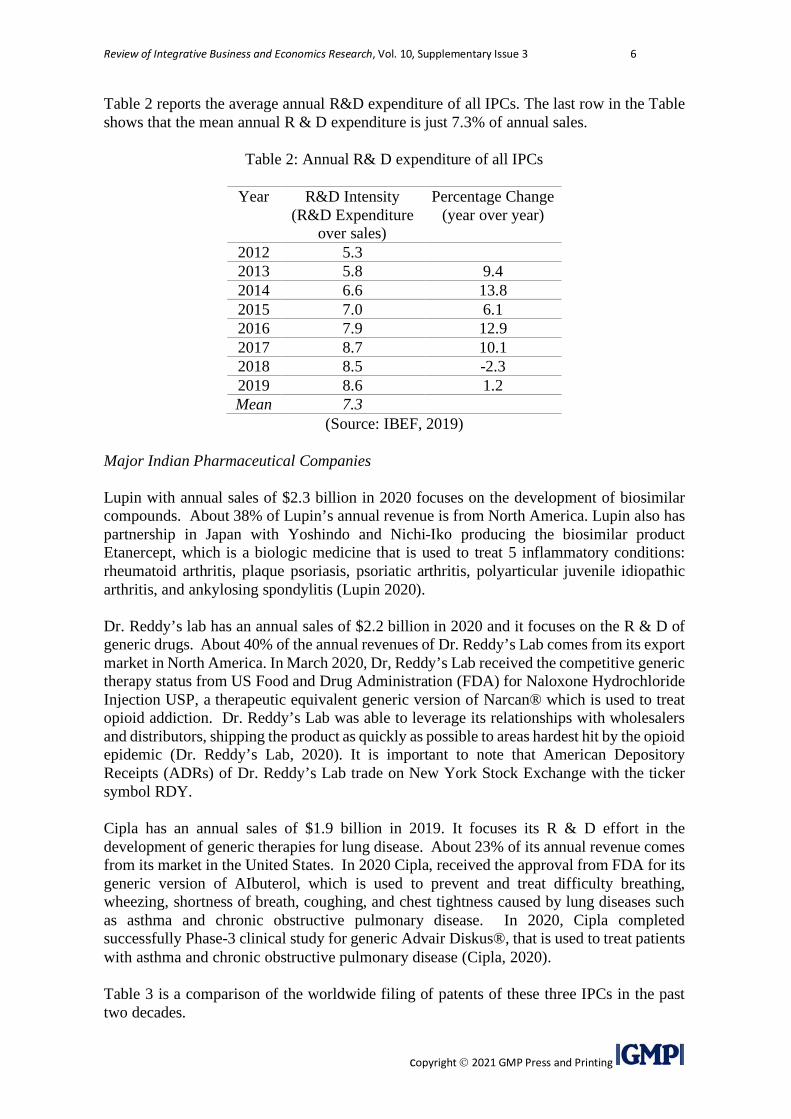
Table 2 reports the average annual R&D expenditure of all IPCs. The last row in the Table shows that the mean annual R & D expenditure is just 7.3% of annual sales.
Table 2: Annual R& D expenditure of all IPCs
Year R&D Intensity (R&D Expenditure
over sales)
Percentage Change (year over year)
2012 5.3 2013 5.8 9.4 2014 6.6 13.8 2015 7.0 6.1 2016 7.9 12.9 2017 8.7 10.1 2018 8.5 -2.3 2019 8.6 1.2 Mean 7.3
(Source: IBEF, 2019)
Major Indian Pharmaceutical Companies
Lupin with annual sales of $2.3 billion in 2020 focuses on the development of biosimilar compounds. About 38% of Lupin’s annual revenue is from North America. Lupin also has partnership in Japan with Yoshindo and Nichi-Iko producing the biosimilar product Etanercept, which is a biologic medicine that is used to treat 5 inflammatory conditions: rheumatoid arthritis, plaque psoriasis, psoriatic arthritis, polyarticular juvenile idiopathic arthritis, and ankylosing spondylitis (Lupin 2020).
Dr. Reddy’s lab has an annual sales of $2.2 billion in 2020 and it focuses on the R & D of generic drugs. About 40% of the annual revenues of Dr. Reddy’s Lab comes from its export market in North America. In March 2020, Dr, Reddy’s Lab received the competitive generic therapy status from US Food and Drug Administration (FDA) for Naloxone Hydrochloride Injection USP, a therapeutic equivalent generic version of Narcan® which is used to treat opioid addiction. Dr. Reddy’s Lab was able to leverage its relationships with wholesalers and distributors, shipping the product as quickly as possible to areas hardest hit by the opioid epidemic (Dr. Reddy’s Lab, 2020). It is important to note that American Depository Receipts (ADRs) of Dr. Reddy’s Lab trade on New York Stock Exchange with the ticker symbol RDY.
Cipla has an annual sales of $1.9 billion in 2019. It focuses its R & D effort in the development of generic therapies for lung disease. About 23% of its annual revenue comes from its market in the United States. In 2020 Cipla, received the approval from FDA for its generic version of AIbuterol, which is used to prevent and treat difficulty breathing, wheezing, shortness of breath, coughing, and chest tightness caused by lung diseases such as asthma and chronic obstructive pulmonary disease. In 2020, Cipla completed successfully Phase-3 clinical study for generic Advair Diskus®, that is used to treat patients with asthma and chronic obstructive pulmonary disease (Cipla, 2020).
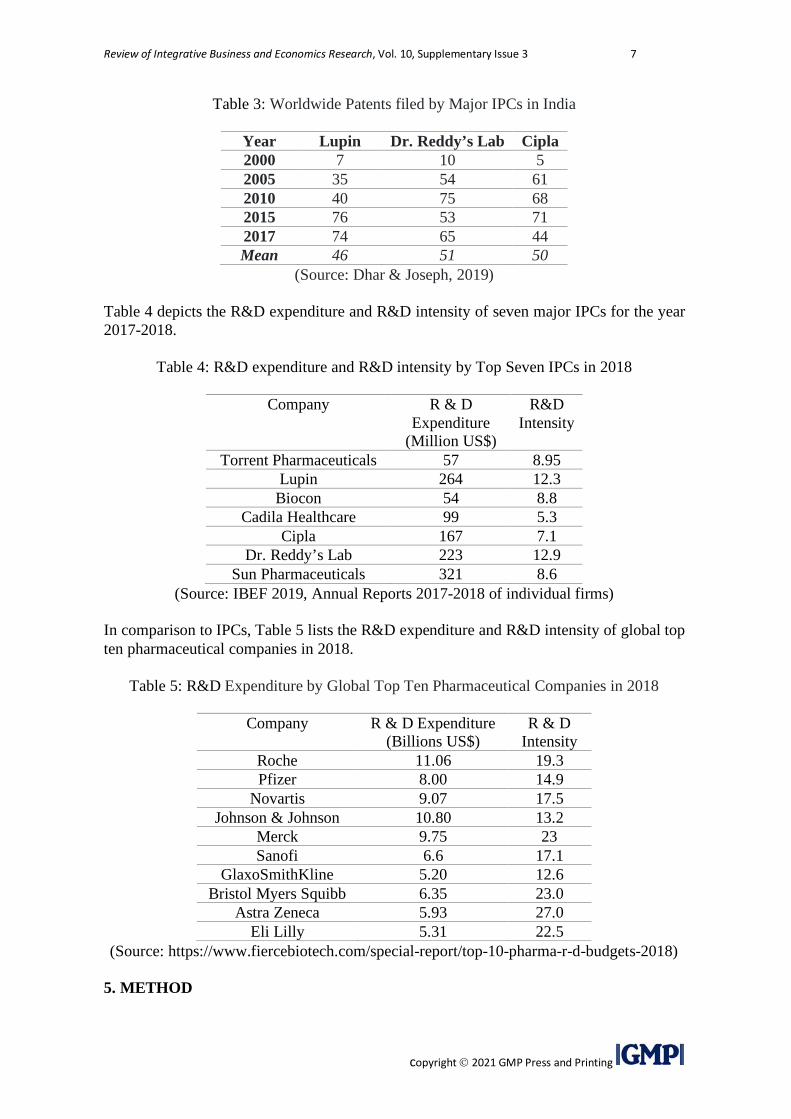
Table 3 is a comparison of the worldwide filing of patents of these three IPCs in the past two decades.
Review of Integrative Business and Economics Research, Vol. 10, Supplementary Issue 3 7
copyright 2021 GMP Press and Printing
Table 3: Worldwide Patents filed by Major IPCs in India
Year Lupin Dr. Reddy’s Lab Cipla 2000 7 10 5 2005 35 54 61 2010 40 75 68 2015 76 53 71 2017 74 65 44 Mean 46 51 50
(Source: Dhar & Joseph, 2019)
Table 4 depicts the R&D expenditure and R&D intensity of seven major IPCs for the year 2017-2018.
Table 4: R&D expenditure and R&D intensity by Top Seven IPCs in 2018
Company R & D Expenditure
(Million US$)
R&D Intensity
Torrent Pharmaceuticals 57 8.95 Lupin 264 12.3
Biocon 54 8.8 Cadila Healthcare 99 5.3
Cipla 167 7.1 Dr. Reddy’s Lab 223 12.9
Sun Pharmaceuticals 321 8.6 (Source: IBEF 2019, Annual Reports 2017-2018 of individual firms)
In comparison to IPCs, Table 5 lists the R&D expenditure and R&D intensity of global top ten pharmaceutical companies in 2018.
Table 5: R&D Expenditure by Global Top Ten Pharmaceutical Companies in 2018
Company R & D Expenditure (Billions US$)
R & D Intensity
Roche 11.06 19.3 Pfizer 8.00 14.9
Novartis 9.07 17.5 Johnson & Johnson 10.80 13.2
Merck 9.75 23 Sanofi 6.6 17.1
GlaxoSmithKline 5.20 12.6 Bristol Myers Squibb 6.35 23.0
Astra Zeneca 5.93 27.0 Eli Lilly 5.31 22.5
(Source: https://www.fiercebiotech.com/special-report/top-10-pharma-r-d-budgets-2018)
5. METHOD
Review of Integrative Business and Economics Research, Vol. 10, Supplementary Issue 3 8
copyright 2021 GMP Press and Printing
Various analysis methods are applied to conduct hypotheses testing. These include the Chi-square Goodness of Fit test, Kruskal Wallis test, Kolmogrov-Smirnov Normality test, and Pearson Correlation test.
5.1 Application of Chi Square Goodness of Fit Tests
According to Zeis, Regassa, Shah, and Ahmadian (2001) the Chi Square Goodness of Fit test is a statistical hypothesis test that is used to assess whether it is unreasonable to conclude that observations in a random sample follow a particular distribution. In this test, data are summarized into k frequency groups. The observed frequency is related to the expected frequency - from which a test statistic is calculated. If the probability of the test statistic is less than a particular significance level (assumed 0.05 in this paper), the null hypothesis is rejected. Zeiss et al. (2001) stated that this test for k-grouped categorical data uses the test statistic Chi Square:
χ2 = Σ(Oi − Ei)2/Ei, where i = 1, 2,...,k,
Oi = the observed number of sample values in group i,
and Ei = the expected number for group i when the hypothesized distribution is valid.
When the null hypothesis is true the χ2 goodness-of-fit statistic has approximated a chi-square distribution, with degrees of freedom, df = k-1, where k is the total number of categories.
This test is used to test the equality of export data between 2012 and 2019, and R&D expenditure during the same period.
5.2 Application of Kruskal-Wallis Test
Parametric hypothesis tests usually assume normal distributions and iid (independent and identically distributed random variables) of annual changes (Nandy, 2020). Harwell (1988) demonstrated that using non-parametric hypothesis tests would reduce the chances of Type I error, especially when sample sizes were small. In this paper, we chose to use Kruskal-Wallis non-parametric hypothesis test, instead of the corresponding parametric ANOVA test. Thus, we assume that the annual growth rates are independent of each other. This will reduce the chance of making Type I error when comparing growth rates. We used 5% level of significance (risk of Type I error) in conducting these hypothesis tests. The test statistic used for Kruskal-Wallis test is designated by H, where:
H= 12/n(n+1)[∑(R1) 2/n1 + ∑(R2) 2/n2+….. +∑(Rk) 2/nk]-3(n+1),
with k-1 degrees of freedom (k is the number of populations)
∑Rk= sum of the ranks of annual growth rates,
nk= size of sample k,
and n=n1+n2+… +nk
The distribution of the sample H statistic is remarkably close to that of the chi-square distribution with k-1 degrees of freedom when every sample includes at least five

Review of Integrative Business and Economics Research, Vol. 10, Supplementary Issue 3 9
copyright 2021 GMP Press and Printing
observations. This situation is true on our analysis. The p-value of H is calculated using the chi-square distribution with k-1 degrees of freedom.
This method is being used to test worldwide patent and the comparison of R&D between top ten global companies and IPCs.
5.3 Kolmogrov-Smirnov (K-S) Test
The Kolmogrov-Smirnov (K-S) test statistic is given by D which is the maximum value of the absolute difference between observed and expected cumulative frequencies (Fi-Ei)
where Fi= Observed cumulative relative frequency, and Ei = Expected cumulative relative frequency, assuming a normal distribution This test is used to determine whether the sample data of R&D investments and exports for IPCs have come from normally distributed populations following Baklizi (2006).
5.4 Pearson Correlation Test
The Pearson correlation test is used to test the hypothesis Ho: ρ = 0, versus H1, ρ ≠ 0, where ρ is the Pearson population correlation coefficient between two variables (Hutson, 2019). The Pearson population correlation coefficient (ρ) is given as:
ρ = υxy/(σxσy)
where -1 < ρ < 1, υxy is the covariance between the random variables X and Y σx is the standard deviation of X, and σy is the standard deviation of Y.
This method was used to test the correlation between export figures and R&D investments of IPCs.
6. RESULTS
6.1. Results of Total Pharmaceutical Exports from India from 2012 to 2019
The Chi Square Goodness of Fit test was used to test the equality of the export figures of drugs from India between 2012 and 2019 and the results are reported in Table 6.
Table 6: Results of Total Pharmaceutical Exports from India between 2012 and 2019
Chi Square 2.94 Degrees of freedom 7
p-value 0.89
The p-value of 0.89 indicates that the null hypothesis presented in H1 of the equality of the export values from 2012 to 2019 cannot be rejected. H1 is thus not supported suggesting that there is no statistically significant increase of export during the years 2012 to 2019.
6.2 Results of R & D Expenditure (as percentages of sales) of IPCs from 2012 to 2019
Review of Integrative Business and Economics Research, Vol. 10, Supplementary Issue 3 10
copyright 2021 GMP Press and Printing
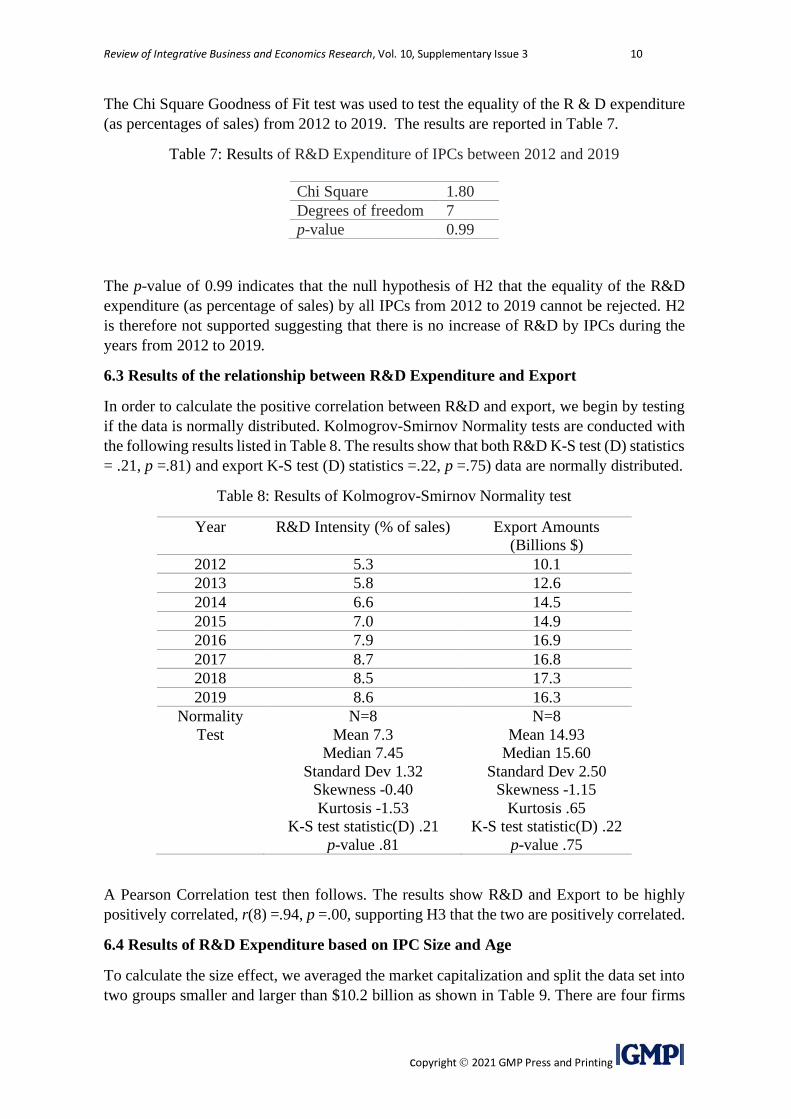
The Chi Square Goodness of Fit test was used to test the equality of the R & D expenditure (as percentages of sales) from 2012 to 2019. The results are reported in Table 7.
Table 7: Results of R&D Expenditure of IPCs between 2012 and 2019
Chi Square 1.80 Degrees of freedom 7 p-value 0.99
The p-value of 0.99 indicates that the null hypothesis of H2 that the equality of the R&D expenditure (as percentage of sales) by all IPCs from 2012 to 2019 cannot be rejected. H2 is therefore not supported suggesting that there is no increase of R&D by IPCs during the years from 2012 to 2019.
6.3 Results of the relationship between R&D Expenditure and Export
In order to calculate the positive correlation between R&D and export, we begin by testing if the data is normally distributed. Kolmogrov-Smirnov Normality tests are conducted with the following results listed in Table 8. The results show that both R&D K-S test (D) statistics = .21, p =.81) and export K-S test (D) statistics =.22, p =.75) data are normally distributed.
Table 8: Results of Kolmogrov-Smirnov Normality test
Year R&D Intensity (% of sales) Export Amounts (Billions $)
2012 5.3 10.1 2013 5.8 12.6 2014 6.6 14.5 2015 7.0 14.9 2016 7.9 16.9 2017 8.7 16.8 2018 8.5 17.3 2019 8.6 16.3
Normality Test
N=8 Mean 7.3
Median 7.45 Standard Dev 1.32
Skewness -0.40 Kurtosis -1.53
K-S test statistic(D) .21 p-value .81
N=8 Mean 14.93
Median 15.60 Standard Dev 2.50
Skewness -1.15 Kurtosis .65
K-S test statistic(D) .22 p-value .75
A Pearson Correlation test then follows. The results show R&D and Export to be highly positively correlated, r(8) =.94, p =.00, supporting H3 that the two are positively correlated.
6.4 Results of R&D Expenditure based on IPC Size and Age
To calculate the size effect, we averaged the market capitalization and split the data set into two groups smaller and larger than $10.2 billion as shown in Table 9. There are four firms

Review of Integrative Business and Economics Research, Vol. 10, Supplementary Issue 3 11
copyright 2021 GMP Press and Printing
that are smaller than market cap of $10.2 billion (Torrent, Lupin, Biocon, and Cadila), and three firms (Cipla, Dr. Reddys’ and Sun) that are capitalized more than $10.2 billion. A t-test that was conducted to compare their means and they were not statistically significantly different (Group 1 smaller cap m=8.50, Group 2 larger cap m=9.53, t-value = -0.46, p =.33), thus not supporting H4a.
Table 9: Market Capitalization, Firms Age, and R&D Expenditures of IPCs (2018)
Company Year started Market Capitalization (Billions $)
R&D Intensity (% of sales)
Torrent Pharmaceuticals 1959 (older) 6.2 (small) 8.9 Lupin 1968 7.0 (small) 12.3 Biocon 1978 7.1 (small) 8.8 Cadila Healthcare 1951 (older) 7.5 (small) 5.3 Cipla 1935 (older) 10.2 (large) 7.1 Dr. Reddy’s Lab 1984 10.8 (large) 12.9 Sun Pharmaceuticals 1983 21.9 (large) 8.6
(Source: Data collected from annual reports from IPCs – Torrent, 2018, Lupin, 2018, Biocon, 2018, Cadila, 2018, Cipla, 2018, Dr. Reddy’s Lab, 2018, Sun Pharmaceuticals, 2018)
To calculate the Age effect, we averaged the year the firms were established and split the data set into two groups before and after 1965. There are three firms that were started before year 1965 (Cipla, Cadila and Torrent), and four firms (Lupin, Biocom, Dr. Reddys’ and Sun) that were started after year 1965. A t-test is conducted to compare their means and they were significantly different (Group1 prior to 1965 m=7.10, Group 2 after 1965 m=10.65, t-value = -2.22, p = .04), thus supporting H4b.
6.5 Results of Worldwide Patent Filings by IPCs
Table 10: Results of Worldwide Patent filings by the three major IPCs (2000-2017)
Location N Mean Rank Chi-Square 0.23
df 1
p-value 0.63
Lupin 5 14 Dr. Reddy’s Lab 5 13 Cipla 5 15
The p-value of 0.63 indicates that the null hypothesis in H5 of the equal number of patents filed by Lupin, Dr. Reddy’s Lab, and Cipla between 2000 and 2017 cannot be rejected. H5 is therefore not supported.
6.6 Results of the Comparison of R&D between IPCs and Global Top 10 Pharmaceutical Companies
We first conducted a Kolmogrov-Smirnov Normality test on Global Top 10 pharmaceutical companies and the data was found to be normal. The same test for R&D intensity for IPCs were conducted earlier and reported in Table 8. After that, we conducted a t-test to compare the two set of samples and the results are reported in Table 11.

Review of Integrative Business and Economics Research, Vol. 10, Supplementary Issue 3 12
copyright 2021 GMP Press and Printing
Table 11: Result of Comparison of IPCs and Global Top 10 Pharmaceutical companies in R&D Intensity in 2018
R&D intensity from IPCs
Global Top 10 R&D intensity
t-test (both datasets normally distributed)
8.95 19.3 m (IPC) = 9.14 m (global) = 19.01 t = -4.92 p = .00
12.3 14.9 8.8 17.5 5.3 13.2 7.1 23 12.9 17.1 8.6 12.6 23.0 27.0 22.5
The p-value of 0.00 indicates that the null hypothesis of H6 that the equal R&D expenditures of IPCs and Global Pharmaceutical Companies in 2018 can be rejected. H6 is therefore supported.
7. DISCUSSIONS
The results found the correlation between R&D intensity and export highly correlated. While the results confirmed our hypothesis (H3), it nevertheless raised the question of whether R&D intensity is a knee jerk reaction to the lack of growth of export performance in the past decade (H1) despite the Indian government’s strong push in policy and legal infrastructure to promote innovation. Facing China’s competitiveness in generic drug export, and the geopolitical tension in the Covid 19 and post-Covid 19 environments, it will be important that IPCs R&D spending and export keep up their competitiveness in their Covid-19 and its vaccine-related products.
The results confirmed our hypothesis (H4b) that firms that are older engage less in R&D than firms that are younger in age. This organizational ambidexterity that addresses the tension between exploitation and exploration is well theorized (Junni, Sarala, Taras, and Tarba, 2013) and empirically demonstrated in the hi-tech manufacturing industry in South Korean (Sussan, Kim, Chinta, and Enriquez, 2017). It is therefore not surprising to find that IPCs like Cipla (started in 1935), Cadila (started in 1951), and Torrent (started in 1959) have lower R&D intensity than the other four firms – Lupin (1968), Biocon (1978), Sun Pharma (1983), and Dr. Reddys (1984) in our data set.
Surprisingly, following prior research findings to reach our hypothesis (H4a), our results were not able to find firms with larger market cap (>10 billion $) engaging in more R&D spending than the smaller market cap (< 10 billion $) firms. Perhaps a more contextual analysis will reveal that the larger market cap firms (Cipla, Dr. Reddys, Sun Pharma) may have some unique proprietary drugs that enable them to scale globally and reach a large market capitalization.

Review of Integrative Business and Economics Research, Vol. 10, Supplementary Issue 3 13
copyright 2021 GMP Press and Printing
From 2012 to 2019 the net annual export of India in pharmaceutical products were statistically similar. Thus, India’s exports had not increased significantly from 2012 to 2019. India’s export was worth $16 billion in 2019, which was 4.8% of all global pharmaceutical exports. India ranks tenth worldwide in the export of pharmaceutical products (Workman, 2020).
Also, R&D intensity of IPCs was statistically similar from 2012 to 2019. Thus, the R&D expenditures of IPCs had not increased significantly from 2012 to 2019. The mean annual R&D expenditure by the top IPCs in 2018 was only 9.14%. As a basis for comparison, the mean R&D expenditure of major global pharmaceutical companies in 2018 was 19%. The R&D expenditures of IPCs pale in comparison to the R & D expenditures of the major global pharmaceutical companies. However, it is important to note that Nandy & Sussan (2018) showed that the long-term compounded returns obtained from investing in American Depository Receipts (ADRs) of IPCs (e.g., Dr. Reddy’s Lab) and major global pharmaceutical company (e.g., Novartis of Switzerland) are not the same with Dr. Reddy’s Lab provided much higher compounded returns than those from global pharmaceuticals from 2000 to 2017.
The number of worldwide patents filed by three major IPCs – Lupin, Dr. Reddy’s Lab, and Cipla was statistically similar between 2000 and 2017 with an average of 50 patent applications by each company in that period. However, while the number of patents granted to IPCs in India has increased significantly from 2000 to 2009, it has decreased between 2010 and 2013.
8. CONCLUSION
India’s annual export of pharmaceutical products between 2012 and 2019 has remained stagnant at an average of about $15 billion. Furthermore, R&D intensity of IPCs has not changed significantly between 2012 and 2019. IPCs are currently focusing their efforts on the development of generic products. To enhance their annual sales revenues significantly, IPCs could focus their efforts on the development of blockbuster drugs to battle major ailments, such as cancer.
The major export products of IPCs are generic versions of name-brand drugs and their patents have expired. In the recent past, IPCs have been able to capture a major portion of the generic drug market in the United States and Europe. This no doubt has led to IPCs incremental growth in revenues and market shares for the past two decades. On the bright side, the Indian pharmaceutical business sector is expected to grow at the rate of 14 percent annually. It is estimated that by 2024-25, India’s biotech industry is to increase to US$ 100 billion (IBEF, 2019). Soon there will be patent expiration of many major drugs where IPCs can challenge the competition with a supply of the generic drugs from India in generic market (Mahajan, 2019).
Now is the time for IPCs to expand its market beyond just the generic drug market. Moving forward, to grow rapidly, IPCs may need to consider increasing their R & D expenditure on the development efforts of innovative drugs to battle major ailments like cancer. This approach is adopted by major global pharmaceutical companies (Lloyd, 2020). According to Kennedy (2019), US drug companies enhance growth in annual revenue by increasing R & D expenditure which in turn leads to new drug discoveries. IPCs may consider following

Review of Integrative Business and Economics Research, Vol. 10, Supplementary Issue 3 14
copyright 2021 GMP Press and Printing
the practice of US pharmaceutical companies. One possibility may be for IPCs to explore forming strategic partnerships with major global pharmaceutical companies.
The government of India has recently opened the pharmaceutical sector to allow 100% Foreign Direct Investment (Sharma, 2020). Further, the government of India has provided financial incentives to promote production of APIs in three new API parks, which will help decrease the industry’s dependence on import from China (Sharma, 2020).
REFERENCES
[1] Ahmed, A., Chakraborty, D. & Bhattacharyya, R. (2020). The Recent Coronavirus (COVID-19) Pandemic: A Review of Issues for Indian Pharmaceutical Exports. Foreign Trade Review, 55(3), 418–435.
[2] Baklizi, A. (2006). Weighted Kolmogrov-Smirnoff Type Tests for Grouped Rayleigh Data. Applied Mathematical Modelling. 30. 437-445
[3] Chakraborty, D., & Banik, N. (2020). Indian Pharma Sector’s Journey for The Innovation Panacea: Lessons From Negotiations With EU And RCEP. In J. Chaisse (Ed.), Sixty years of European integration and global power shifts: Perceptions, interactions and lessons (pp. 429–461). Hart.
[4] Chandran, N., & Brahmachari, S. K. (2018). Policy as a Driver Of Economic Growth: Historical Evidence From The Indian Pharmaceutical Industry. Current Science, 114 (6), 1181-1193.
[5] Cipla (2018). Annual Report 2017-2018. https://www.cipla.com/sites/default/files/1533309916_Cipla%20high%20res.pdf (Accessed on 8, May 2021).
[6] Cipla (2020) Annual Report 2019-2020. https://www.cipla.com/sites/default/files/2020-08/CIpla-AR-2019-20.pdf (Accessed on 21 December 2020.)
[7] Dhar, B. & Joseph, R. K. (2019). The Challenges, Opportunities and Performance of the Indian Pharmaceutical Industry Post-TRIPS In Liu, K-C. & Racherla, U.S. (Eds.). Innovation, Economic Development, and Intellectual Property in India and China. (pp. 299-323). Springer. Singapore.
[8] Dr. Reddy’s Lab (2018). Investor Presentation June 2018. https://www.drreddys.com/media/639830/dr-reddys-investor-presentation-june-2018.pdf (Accessed on 8 May 2021).
[9] Dr. Reddy’s Lab (2020). Annual Report 2019-2020. https://www.drreddys.com/media/884823/annualreport2020forwebsite.pdf. (Accessed on 22 December 2020.)
[10] Export–Import Bank of India. (2016). Indian Pharmaceutical Industry: Challenges And Prospects (Occasional Paper No. 176). https://www.eximbankindia.in/Assets/ Dynamic/PDF/Publication-Resources/ResearchPapers/55file.pdf
[11] Government of India (GoI). (2017). Pharmaceuticals Sector: Achievement Report. Department of Industrial Policy and Promotion and Department of Pharmaceuticals.
[12] Harwell, M. (1988). “Choosing Between Parametric and Non Parametric Tests.” Journal of Counseling and Development, 67(1), 35–38.

Review of Integrative Business and Economics Research, Vol. 10, Supplementary Issue 3 15
copyright 2021 GMP Press and Printing
[13] Hutson, A.D. (2019). A Robust Pearson Correlation Test for A General Point Null Using A Surrogate Bootstrap Distribution. PloS One. 14 (1). 1-14.
[14] India Brand Equity Foundation (IBEF) (2019). Indian Pharmaceutical Industry Analysis. available at: https://www.ibef.org/download/pharmaceuticals-jan-2019.pdf (Accessed on 15 December 2020.)
[15] India Brand Equity Foundation (2021). India Pharmaceutical Industry Report available at: https://www.ibef.org/industry/pharmaceutical-india/infographic (Accessed on March 26. 2021).
[16] Junni, P., R.M. Sarala, V. Taras, & S.Y. Tarba. 2013. Organizational Ambidexterity and Performance: A Meta-Analysis. The Academy of Management Perspectives 24 (4): 299–312
[17] Kale, D. (2019). From Small Molecule Generics to Biosimilars: Technological Upgrading And Patterns Of Distinctive Learning Processes In The Indian Pharmaceutical Industry. Technology Forecasting & Social Change, 145, 370-383
[18] Kamiike, A. (2020). The TRIPS Agreement and the Pharmaceutical Industry in India. Journal of Interdisciplinary Economics, 32(1), 95–113.
[19] Kennedy, J. (2019). The Link between Drug Prices and Research on Next Generation Cures. https://itif.org/publications/2019/09/09/link-between-drug-prices-and-research-next-generation-cures. (Accessed on 24 December 2020.)
[20] Lloyd, I. (2020). Pharma R & D Annual Review 2019. https://pharmaintelligence.informa.com/~/media/informa-shop-window/pharma/2019/files/whitepapers/pharma-rd-review-2019-whitepaper.pdf, (Accessed on 21 December 2020.)
[21] Lupin (2018). Annual Report 2017-2018. https://www.lupin.com/pdf/annual-report/full-annual-report/lupin-annual-report-2018.pdf (Accessed on 8 May 2021)
[22] Lupin (2020) Annual Report 2019-2020. https://www.lupin.com/pdf/annual-report/2020/lupin-annual-report-2019-20.pdf (Accessed on 24 December 2020)
[23] Mahajan, V. (2019). Structural Changes and Trade Competitiveness in The Indian Pharmaceutical Industry in Product Patent Regime. International Journal of Pharmaceutical and Healthcare Marketing, 13 (1), 21-39.
[24] Mahajan, V. (2020). Is Productivity of Indian Pharmaceutical Industry Affected with The Introduction Of Product Patent Act? Indian Growth and Development Review, 13 (1), 227-258.
[25] Mukherjee, D. (2015). TRIPS and The Balance Between Private Rights and Public Wellbeing: The Case Of The Pharmaceutical Sector. Foreign Trade Review, 50(4), 284–297.
[26] Nandy, S. & Sussan, F. (2018). Is the Grass Greener on the Other Side? A Comparison of Compounded Year-to-Year Longterm Performance of American Depository Receipts and U.S. Pharmaceuticals. Review of Integrative Business and Economics Research, 8 (2), 24-26.
[27] Nandy, S. (2020). Do the Indicators of Entrepreneurial Ecosystem Show Signs Of Improvement In India, Pakistan, And Bangladesh? Dynamic And Static Comparative Studies Among the Three Entrepreneurial Ecosystems in The Indian Subcontinent. European Scientific Journal, ESJ, 16(37), 5.
[28] Nair, M. D. (2020). Indian Pharmaceutical Industry-Opportunities and Challenges in the New Decade. Chemical Industry Digest, 31 Jan. 2020, p. NA. Gale In Context: Science, https://link.gale.com/apps/doc/A613367747/SCIC?u=uphoenix&sid=SCIC&xid=e7ef3806 (Accessed on 21 December 2020.)

Review of Integrative Business and Economics Research, Vol. 10, Supplementary Issue 3 16
copyright 2021 GMP Press and Printing
[29] Nesbitt, E. (2018). India’s Forward Momentum in Pharmaceuticals. U.S. International Trade Commission (USITC). Executive Briefings on Trade, May 2018.
[30] Parrish, M. (2020). Top 10 Pharma Companies by R&D Spend in Pharma Manufacturing. https://www.pharmamanufacturing.com/articles/2020/top-10-pharma-companies-by-r-and-d-spend/ (Accessed on 18 December 2020.)
[31] Ray, S. & Ray, P.K. (2021). Innovation Strategy of Latecomer Firms Under Tight Appropriability Regimes: The Indian Pharmaceuticals Industry. Journal of International Management, 27 (100820). 1-16.
[32] Sharma, R. (2020). Future of Pharmaceutical Industry in India. Observer Research Foundation. https://www.orfonline.org/expert-speak/future-of-pharmaceutical-industry-in-india/ (Accessed on 23 December 2020.)
[33] Singh, A.K. & Burhan, M. (2015). Factors Influencing Organizational Change And Health - Evidences From The Indian Pharmaceutical Sector. Journal of Business Chemistry, 12 (3). 69-84.
[34] Sun Pharmaceuticals Annual Report 2019-2020. https://sunpharma.com/wp-content/uploads/2020/12/Download-complete-annual-report2.94MB.pdf. (Accessed 8 May, 2021).
[35] Suri, F. K. & Banerji, A. (2016). A Study of Disaggregated R & D Expenditure on Indian Pharmaceutical Exports. The Journal of Developing Areas. 50(3). 167-190.
[36] Sussan, F., Kim, K.C., Chinta, R., & Enriquez, J.L. 2017. Trade-Off between Creativity And Productivity In Technology-Based SMEs Performance: Policy Implications In South Korea. Journal of the Asia Pacific Economy, 22(3), 510-524.
[37] Torrent Pharmaceuticals Annual Report 2017-2018. https://torrentpharma.com/pdf/investors/AR-2017-18.pdf (Accessed on 8 May, 2021)
[38] Tyagi, S., Nauriya, D. K. & Gulati, R. (2018). Firm Level R&D Intensity: Evidence from Indian Drugs and Pharmaceutical Industry. Review of Managerial Science. 12. 167-202.
[39] Vaidya, M., Garg, S., Singh, C. & Mahajan, M. M. (2018). Changing Dimensions of Drug Patents of Indian Pharmaceutical Industry. Journal of Intellectual Property Rights, 23 (March-May), 111-118.
[40] Workman, D, (2020). Drugs and Medicine Exports By Country in “World’s Top Exports”, http://www.worldstopexports.com/drugs-medicine-exports-country/ (Accessed on 21 December 2020.)
[41] World Bank Data on India (2020). Available at: https://data.worldbank.org/country/india (Accessed on 21 December 2020.)
[42] Zar, J. H. (1972). Significance and Testing of the Spearman Rank Correlation Coefficient. Journal of the American Statistical Association. 67(339). 578-580
[43] Zeis, C., Regassa, H., Shah, A., & Ahmadian A. (2001). Goodness-Of-Fit Tests for Rating Scale Data: Applying The Minimum Chi-Square Method. Journal of Economic and Social Measurement, 27, 25–39.