random graph modeling: a survey of the concepts
TRANSCRIPT
Random Graph Modeling: A survey of the concepts
MIKHAIL DROBYSHEVSKIY, Ivannikov Institute for System Programming of the Russian Academy of
Sciences and Moscow Institute of Physics and Technology, Russia
DENIS TURDAKOV, Ivannikov Institute for System Programming of the Russian Academy of Sciences
and Moscow Institute of Physics and Technology, Russia
Random graph (RG) models play a central role in the complex networks analysis. They help to understand,
control, and predict phenomena occurring, for instance, in social networks, biological networks, the Internet,
etc.
Despite a large number of RG models presented in the literature, there are few concepts underlying them.
Instead of trying to classify a wide variety of very dispersed models, we capture and describe concepts they
exploit considering preferential attachment, copying principle, hyperbolic geometry, recursively defined
structure, edge switching, Monte Carlo sampling, etc. We analyze RG models, extract their basic principles,
and build a taxonomy of concepts they are based on. We also discuss how these concepts are combined in RG
models and how they work in typical applications like benchmarks, null models, and data anonymization.
CCS Concepts: • Networks→ Topology analysis and generation;
Additional Key Words and Phrases: Random graph models, patterns
ACM Reference Format:Mikhail Drobyshevskiy and Denis Turdakov. 2019. Random Graph Modeling: A survey of the concepts . 1, 1
(July 2019), 40 pages. https://doi.org/10.1145/nnnnnnn.nnnnnnn
1 INTRODUCTIONMotivation to a network modeling. Many real-world systems can be considered as networks of a
set of connected discrete objects. Networks that demonstrate non-regular topological patterns are
referred to as complex networks which are the subject of intensive research in network science. They
are used in a wide variety of areas of human activity: technological, social, biological, information,
etc.
Analysis of different aspects of complex networks is trying to answer important questions: How
reliable the Internet is? What is the organization of social relations reflected in social networks?
How diseases are spread, how information flows are distributed, and how to govern them, etc.?
Authors’ addresses: Mikhail Drobyshevskiy, Ivannikov Institute for System Programming of the Russian Academy of
Sciences and Moscow Institute of Physics and Technology, 109004, Moscow, Alexander Solzhenitsyn st., 25. Moscow,
Russia, [email protected]; Denis Turdakov, Ivannikov Institute for System Programming of the Russian Academy of
Sciences and Moscow Institute of Physics and Technology, 109004, Moscow, Alexander Solzhenitsyn st., 25. Moscow, Russia,
Permission to make digital or hard copies of all or part of this work for personal or classroom use is granted without fee
provided that copies are not made or distributed for profit or commercial advantage and that copies bear this notice and
the full citation on the first page. Copyrights for components of this work owned by others than ACM must be honored.
Abstracting with credit is permitted. To copy otherwise, or republish, to post on servers or to redistribute to lists, requires
prior specific permission and/or a fee. Request permissions from [email protected].
© 2019 Association for Computing Machinery.
XXXX-XXXX/2019/7-ART $15.00
https://doi.org/10.1145/nnnnnnn.nnnnnnn
, Vol. 1, No. 1, Article . Publication date: July 2019.

:2 Mikhail Drobyshevskiy and Denis Turdakov
These questions motivate creating realistic models of complex networks called random graphs1,which help us to understand and control phenomena lying behind them. They attempt to find
mechanisms of a network topology formation. For example, preferential attachment principle known
as “rich get richer” was invented to explain scale-free property observed in many networks [12].
The realism of the models is an important point of interest. For instance, we want to capture
current patterns of the Internet to be able to study its evolution in the future.
At the same time, a balance between realism and randomness should be provided. For instance, if
one wants to preserve user privacy, simple relabeling of nodes in a social network does not protect
from an adversary to learn whether an edge exists between two persons [10].
Random graphs are also important from a technical point of view. Many real networks exist in
a few instances. However, we need scalable synthetic datasets for analysis. For instance, to test
the significance of a new Facebook community detection algorithm, one needs a set of random
graphs similar to the Facebook social graph. Another common scenario is to specify a null model
and use it for hypotheses testing. For example, network motifs could be identified as subgraphs
over-represented in the network compared to the null model [104].
The survey focus. The total number of RG models and generators is permanently growing. A
single review is not able to cover all of them. Many modeling approaches exploit similar principles.
Thus, they are very alike, while they may look different in some details. Literature reviews suffer
from incompleteness by limiting themselves to particular applications.
Instead of describing all RG models, we focus on the main concepts they use to achieve the
goals. We noted that almost all approaches are based on a few numbers of high-level principles or
concepts. Like building blocks, they are used in various combinations and modifications, giving
a vast number of different algorithms for modeling random graphs. We systematically collect
most known RG models, extract the basic principles they are based on, and classify them. Such a
taxonomy gives a high-level RG overview and simplifies orientation in literature. Moreover, such
concepts help researchers to design novel models and generators combining working elements in a
new way.
Network modeling in the real world often goes beyond simple graphs. The nodes could have
attributes, edges could be directed and weighted. Also, more specialiezed types of graphs are used,
e.g., bipartite or multigraphs, hypergraphs (for communication in wireless networks) [9], and
multilayer ones [20]. In this paper, we restrict ourselves on widely used directed weighted graphs
with node labels.
Contributions. Our contributions are threefold.• First, we present a summary of recent efforts on random graph modeling guiding over
monographs and notable reviews considering several topics of interest (Table 3).
• Second, we present a taxonomy of concepts of graph modeling considering the hierarchical
classification illustrated by particular models (figure 1).
• Finally, we discuss applications of random graph models discussing the role of the described
concepts.
The rest of the paper is organized as follows. In Section 2, we clarify the terminology, recall the
main graph metrics and features important for random graph modeling. In Section 3, we provide
the methodology of the literature analysis, our method for collecting relevant papers, guide of
prominent reviews, and existing models classifications. Then, in Section 4, we present our taxonomy
1Following [82] we prefer to use term “graph” to refer to a mathematical abstraction of a real object while the term “network”
corresponds to a more general sense of “a collection of interconnected things”. In fact, these two words are usually used
interchangeably in the literature.
, Vol. 1, No. 1, Article . Publication date: July 2019.

:3
Table 1. Notations and acronyms
n number of nodes RG random graph
m number of edges DD node degree distribution
i , j, u, v particular node CC clustering coefficient
di degree of node i ER Erdős-Rényi model
Pi j edge (i, j) probability PA Preferential attachment (principle)
Ai j adjacency matrix MCMC Markov chain Monte Carlo (sampling)
λk k-th eigenvalue of a matrix
of the concepts, together with all constituents description with examples. In Section 5, we discuss
the taxonomy and how the concepts work in various applications. Finally, we provide a conclusion
and future work in Section 6.
2 CONCEPTS AND DEFINITIONSWe assume that the reader knows the main concepts of network science and is familiar with simple
random graph models. Hence, we omit definitions of the basic terms and details of well-known
models. Otherwise, we provide references to graphs and probability theory backgrounds [82].
Notations and acronyms used throughout the paper are presented in Table 1.
2.1 Terminology NuancesLike in many fields, in graph related literature, the same things can be named by multiple terms.
To clarify the terminology, we assume the following equalities, which generally hold in papers:
• "graph" = "network" = "network graph"
• "node = "vertex", "edge" = "link" = "arc"
• "random graph" = "random graph model" = "graph model" = "network model"
• "graph feature" = "graph pattern"
• "graph metric" = "graph measure"
On the other hand, we explicitly discriminate several concepts by using different terms to avoid
misinterpretation.
Graph model vs. graph generator. We consider the graph model as a model in a mathematical sense.
It specifies a description and conditions for a statistical object. A graph generator is an algorithm
whose execution results in a (random) graph. Usually, the graph generator implements several RG
model. Alternatively, a specification of the generator could be given first, which implicitly defines
the RG model.
Graph metric/measure vs. graph feature/pattern. The graph metric or measure refers to a function
measuring the characteristics like diameter, degree distribution, adjacency matrix spectra. These
terms are common in a quality estimation context. Terms feature or pattern are used to speak
about distinctive attributes of a particular graph. Both in qualitative manners (heavy tail degree
distribution, high clustering) and quantitative ones (node degree sequence itself, diameter value,
etc.).
2.2 Random Graph DefinitionsWhat is called a random graph? In almost all cases it is meant by default the Erdős-Rényi (ER)
model which refers to one of two very similar classic models:G(n,m) [52] introduced by Erdős and
Rényi, and G(n,p) suggested by Edgar Gilbert [61]. G(n,m) gives equal probabilities to all graphs
, Vol. 1, No. 1, Article . Publication date: July 2019.
:4 Mikhail Drobyshevskiy and Denis Turdakov
with n nodes andm edges, while in G(n,p) each possible edge on n nodes appears independently
with constant probability p. These two models are mostly used in applications and are extensively
developed.
Actually, in literature, one can encounter diverse notions behind the term random graph. The
following four citations exemplify this:
• "A network is said to be random when the probability that an edge exists between two nodes
is completely independent of the nodes’ attributes. In other words, the only relevant function
is the degree distribution P(k)." [14]• "In full generality, by a random graph on a fixed number of vertices (n) we mean a random
variable that takes its values in the set of all undirected graphs on n vertices. [...] A random
graph model is given by a sequence of graph valued random variables, one for each possible
value of n: M = (Gn ;n ∈ N )." [57]
• "In general, a random graph is a model network in which a specific set of parameters take
fixed values, but the network is random in other respects." [109]
• "[...] to specify a random N-node graph, we must give the set G ⊆ {0, 1}N2
of allowed
graphs (the configuration space), together with a probability distribution p(A) over this set.This combination {G,p} of a graph set G with associated probabilities is called a random
graph ensemble. Equivalently, we could always take G = {0, 1}N2
and assign p(A) = 0 to all
disallowed graphs A." [38]
In general, "random graph" can refer to any model, wherein is specified a probability distribution
over a set of graphs. For instance, E. D. Kolaczyk [82] uses the notion of graph model as a collection
{Pθ (G),G ∈ G,θ ∈ Θ}, where a parameterized probability space Pθ is defined on an ensemble G
of possible graphs. There are two ways to express the complexity of a model: to incorporate it in
P(G) specification or to restrict the set G of allowed graphs in a non-trivial way. In the latter case,
P(G) is typically assumed to be uniform, i.e., a generator would randomly pick a graph from G,
making the model more analytically tractable. That is why the ER model is so popular and very
well studied theoretically.
In this paper, we use the random graph equivalently to the graph model referring to a general
case, where a mathematical construction defines a probability distribution over a set of possible
graphs.
2.3 Popular graph metrics and featuresDuring the history of network science, many graph patterns were discovered, and graph metrics
were designed to measure their characteristics. Metrics help to discover new patterns in networks,
which are analyzed to understand their nature. Most important features are in the focus of graph
models, which try to explain their emergence.
To understand the properties of subnetworks, we quantitatively analyze the clustering properties,
subgraph distribution, density distributions, and other metrics. We consider only the most notable
graph metrics in the context of RG modeling. We start with static topological properties, then, ones
describing graphs in dynamics and metrics related to the node and edge attributes. In this way, we
underline the most popular patterns.
2.3.1 Topology. We group topology metrics into four classes reflecting their main aspects: node
degrees, subgraphs, connectivity properties, and spectral features.
Node degrees. Node degree is a basis for a set of important collective graph metrics: node degree
distribution, node degree assortativity, and node degree correlations.
, Vol. 1, No. 1, Article . Publication date: July 2019.

:5
Table 2. Graph metrics and features. PL stands for power-law. α is used as PL exponent. Other notations areexplained in Section 2.3.
Metric class graph metric frequently observable features
Degree
DD PL: P(d) ∼ d−γ ,γ ⩾ 1, usually ∈ (2; 10). Sometimes DPLN
assortativity > 0 in social, < 0 in biological and technological domains
dK-distribution
Subgraphs
CC much higher than in the ER model
CC(d) PL
subgraph distribu-
tion
Connectivity
effective diameter small-world effect: def f is small, often around 6
hop-plot PL: Npairs (h) ∼ hα for h ≪ def fconnected compo-
nents
presence of a giant connected component
community struc-
ture
high modularity
Spectral
spectral radius
algebraic connectiv-
ity
singular values of
Ai j
PL: λk ∼ kα for k < n1/2, α ∈ (2; 10)
eigenvalues of
Laplacian matrix
PL: λk ∼ kα for k < n2/3, α ∈ (2; 10)
Dynamic
m(n) dependency PL: densificationm(t) ∝ n(t)α ,α ∈ (1; 2)
def f (t) shrinking over time
properties over time presence of gelling point
Community
labels
community size heavy-tailed distribution
number of member-
ships of a node
heavy-tailed distribution
mc (nc ) dependency PL: densificationmc ∼ nαc for communities c in a network
Edge weights
total weight PL:W (t) ∼m(t)w ,w > 1
node strength PL: si ∼ dwiweighted principal
eigenvalue
PL: λ1(t) ∼m(t)β , β ∈ (0.5; 1.6)
weight addition self-similarity over time
• Node degree distribution (DD). DD is one of the most famous characteristics, which counts
nodes with a given number of neighbors. An important observation is that many real networks
from various domains exhibit power-law DD [12], for instance, P(d) ∼ d−γ with various
values of exponent γ ≥ 1, commonly, between 2 and 10 [51]. Independence of the scale
parameters is called scale-free property. The same law holds for input (in-DD) and output
(out-DD) links of directed graphs [48]. For some networks, like Mobile calls, a better fit could
be a double Pareto-lognormal (DPLN) distribution [56], a kind of a middle between Pareto
and lognormal distributions.
, Vol. 1, No. 1, Article . Publication date: July 2019.

:6 Mikhail Drobyshevskiy and Denis Turdakov
• Node degree assortativity. It is computed as the correlation between the node degree and
average degree of its neighbors. The positive correlation is found in social networks: high
degree nodes tend to connect to high degree nodes, while low degree nodes tend to connect to
low degree nodes, which are referred to as assortative networks. Biological and technological
networks are often disassortative with negative correlations [111].
• dK-distribution. dK-distribution shows the node degree correlation within subgraphs of
sized for arbitrary d > 0 [96]. For d = 0, it shows the average node degree ⟨di ⟩. d = 1
corresponds to the classical DD and d = 2 corresponds to joint degree distribution P(di ,dj ).d > 2 combines joint distributions for each possible (connected) edge configuration on dnodes. Series of dK-distribution with increasing d describe more complex features of a given
graph becoming the complete one when d = n.
Subgraphs. It is very useful to count triads (a combination of three nodes) and higher order
substructures in graphs. Three characteristics are considered: clustering coefficient, clustering
coefficient as a function of node degree, and subgraphs distribution.
• Clustering coefficient (CC). CC is the ratio of the number of closed triads (triangles) to the
number of all triads. The transitivity coefficient is the clustering coefficient measured for the
whole graph. The average local clustering coefficient is measured for each node and averaged
over all nodes. It is found that in real networks, CC is significantly higher than if node pairs
are linked independently like in ER model.
• Clustering coefficient as a function of node degree. For some networks, clustering coefficient
follows a power-law, which is associated with a hierarchical structure [39].
• Subgraphs distribution. Distribution of small subgraphs of size 3 or 4 could serve in two
ways. As a feature vector, it contains enough information to categorize graphs over domains
with high precision [26]. Detecting statistically significant subgraphs for a particular graph,
called network motifs, could reveal network building principles. It is especially fruitful in a
biological domain [104].
Connectivity. Distances in graphs give a picture of their global connectivity (like the effective
diameter), reachability of nodes, connected components, and community structure.
• Effective diameter. While the diameter of the graph is the maximal distance between its
nodes, the effective diameter def f is a major fraction (typically 90 %) of node pairs connected
with at most def f edges. It has a more informative feature than the diameter. For instance,
it shows that social graphs and WWW have a low effective diameter (around 6), which is
coined as ’small-world’ effect [146].
• Hop-plot. For a given path length h, it shows how many node pairs are reachable in hhops. Hop-plot demonstrates the shortest path length distribution in the graph. This metric
aggregates two related characteristics, including average shortest path length and effective
diameter. Faloutsos et al. [55] observed that the Internet demonstrates hop-plot exponent:
number of node pairs is proportional to a power of h for h ≪ def f .• Connected components. Typically, a network is a connected graph that contains one large
connected component. Thus, an important question concerns the appearance of a giant con-
nected component in a random graph (phase transition) [53], which is related to percolation
theory.
• Community structure. The presence of tightly connected groups of nodes is observed in social
networks, where they reflect groups of interest. In biological networks, they correspond to
the functional groups. The knowledge of how well community structure is expressed in a
, Vol. 1, No. 1, Article . Publication date: July 2019.
:7
graph is given by modularity measure [114]. The communities are characterized by additional
topological metrics like conductance, separability, and cohesiveness [152].
Spectra. Graph features are tightly connected to its spectral properties, i.e., eigenvalues, eigen-
vectors of its adjacency and Laplacian matrices. The spectral analysis is used to study processes on
networks and develop algorithms on graphs. For example, Google search engine is based on the
Perron-Frobenius eigenvector of the web graph. In general, this is the subject of graph spectral
theory [28]. We consider spectral radius, algebraic connectivity, singular value distribution of
the adjacency matrix, and eigenvalue distribution of the Laplacian matrix as a keys of spectra
classification.
• Spectral radius. The maximal eigenvalue |λ1 | of the graph adjacency matrix is called its
spectral radius. |λ1 | = 0 corresponds to a disconnected graph. Thus, the spectral radius is
usually computed for its giant component. Spectral radius does not increase when nodes or
edges are removed from the graph. It serves as an alternative size metric. For instance, it is
shown that the smaller radius means the higher robustness to virus spreading [142].
• Algebraic connectivity. The second smallest nonzero eigenvalue of graph Laplacian matrix Lis called algebraic connectivity. It is also measured for a giant component. It is the larger the
better graph is connected. An eigenvector, corresponding to this eigenvalue, is called Fiedler
vector. It is useful for graph partitioning [123].
• Singular value distribution of the adjacency matrix. It was found that it follows the power
law in real networks [51]. This law often holds for n1/2 − n2/3largest singular values.
• Eigenvalue distribution of the Laplacian matrix. Top k eigenvalues follow power law distri-
bution λk ∼ kα , where k scales as n2/3and α usually varies in (2; 10) [51]. It was noted, that
the exponent of this power law is often nearly identical to the DD power law exponent, for
graphs where these power laws were statistically significant.
There are other graph metrics, helpful in their evaluation but not playing a significant role in
designing RG models, such as resilience and principal eigenvector. For a more complete survey of
graph metrics, we refer to Costa, L. D. F. et al. [39], and Hernández, J. M., and Van Mieghem, P. [74].
2.3.2 Dynamics. Many real graphs evolve in time, showing appearance and disappearance
of new nodes and edges. In practice, most networks grow, i.e., the number of nodes n increases
over time t . All known static topology metrics can be measured through time variable, as well
as their mutual dependence, which reveals new dynamical graph patterns. Further, we consider
densification power law, shrinking diameter, and gelling point.
• Densification power law. The number of edgesm grows as a power of the number of nodes:
m(t) ∼ n(t)α , where 1 < α < 2 [93].
• Shrinking diameter. Inmany cases, the effective diameter is decreasedwith network growth [93].
• Gelling point. Real graphs have a moment of stabilization (’gelling’) during their evolution,
where diameter has a spike. After that moment diameter starts to shrink and other laws
are obeyed: densification power law is satisfied well, the second and the third connected
component begin oscillating around some constant values [98].
2.3.3 Attributes. Real networks contain a lot of information besides the topology. Nodes often
have attributes: user profile data in a social network, protein properties, etc. Edges can also be
labeled with timestamps, weights, and so on. We consider only node communities and edge weights.
Community labels. Social networks are known to have an explicit community structure formed
by users’ attributes. Such ’ground-truth’ communities have common features despite they are from
very different domains [151], for instance:
, Vol. 1, No. 1, Article . Publication date: July 2019.

:8 Mikhail Drobyshevskiy and Denis Turdakov
• heavy-tailed distribution of community size;
• heavy-tailed distribution of the number of community memberships of a node;
• densification power law: in the scope of one network, the number of edges in a community cgrows as a power of its size,mc ∼ nαc .
Other properties are also important for community structuremodeling. The probability of edge Pi jis increased with increasing a number of common communities for i and j . Nodes in the community
overlaps are more densely connected than nodes in non-overlapping parts of communities; and
others.
Edge weights. Edge weights usually express the strength of connections between nodes. For
example, they correspond to the number of word co-occurrences in a text, amount of network
traffic, and indicate the presence of multiple edges, e.g., number of citations. Their properties can
be described by a Weight power law, Snapshot power law, Weighted principal eigenvalue power
law, Self-similarity, etc.
• Weight power law. A total edges weight grows as a power of the number of edges:W (t) ∼m(t)w with exponentw > 1 [98].
• Snapshot power law. Node strength si , defined as a total weight of its adjacent edges, dependson its degree di as a power law: si ∼ dwi . This holds when measured for incoming and
outgoing edges separately [98].
• Weighted principal eigenvalue power law. Largest eigenvalue of the weighted adjacency
matrix grows as a power of the number of edges: λ1(t) ∼ m(t)β , where exponent β was
observed to be 0.5 − 1.6 [98].
• Self-similar weight addition. The rate of weight addition over time shows self-similarity [98].
A summary of the described metrics and features is presented in table 2. It shows that ten power
laws are observed in real networks.
3 LITERATURE ANALYSISIn this section, we describe a method for retrieving relevant papers. Then, we analyze the most
prominent review works and give several classification schemes of RG models.
When performing a literature search, we discover a dozen of large volume studies of RG models,
which we describe in this section. Firstly, we present our method for papers collecting, summarize
various aspects of the most prominent reviews, and, finally, discuss the classifications of RG models.
3.1 Papers collecting procedureAmong a huge number of publications, we distinguish three types of papers of interest, with
decreasing priority:
(1) reviews: reviews and comparative studies of RG models;
(2) novelties: works suggesting a new approach or extending an existing one;
(3) applications: works applying an existing RG model to a particular problem.
During the search process, we found that the last class is too vast to be analyzed manually. While
there are tens of reviews and hundreds of new RG models, the amount of applications is much
larger. Therefore, we concentrate on review papers and detecting most prominent works from the
second class.
Databases querying. We consider three databases as publication sources: Google Scholar, ACM
Digital Library, and IEEE Xplore Digital Library. We start with a collection of already known to us
papers ([3, 25, 34, 37, 39, 44, 50, 62, 85, 89, 91–94, 96, 117, 119, 120, 122, 128, 132, 134, 138, 148, 154,
156] ) and iteratively extend it with results obtained by querying mentioned databases.
, Vol. 1, No. 1, Article . Publication date: July 2019.

:9
For Google Scholar, we merge the results from the follows queries (option "Sort by relevance" is
enabled):
• query "(random OR artificial OR synthetic OR model OR modeling) (graph ORgraphs OR network OR networks)". We select the first 150 papers;
• query "(random OR artificial OR synthetic OR model OR modeling OR modelling)(graph OR graphs OR network OR networks) (generation OR generating ORgenerator))". We select the first 130 papers;
• query "(random OR artificial OR synthetic OR model OR modeling OR modelling)(graph OR graphs OR network OR networks) (generation OR generating ORgenerator OR generative))". We select "since 2009", "since 2013" and "since 2016" and
take 50 relevant papers from each result.
Unfortunately, despite queries variability, the search results may still miss eligible works, but
include many irrelevant ones. The number of first papers was chosen as a trade-off.
For ACM Digital Library, we run queries:
• "any field" matches all: random graph network model generation. We sort by relevance and
select the first 50 papers;
• "abstract" matches all: random graph network model generation. We sort by relevance and
select the first 50 papers;
• "abstract" matches all: "random graphs" network model generator, and "abstract" matches any:
review survey overview comparison. We sort by relevance and select the first 30 papers;
For IEEE Xplore Digital Library, we perform searches in metadata, and select 10, 32, and 33
papers from three corresponding results:
• "random graph" AND network AND model AND generator ;• "random graph" AND network AND model AND generation;• "random graph" AND network AND model AND generating.
Google Scholar indexes most publications of the interest and returns the most relevant papers.
We extracted around 300 papers. ACM and IEEE databases additionally contributed 70 and 46
papers, respectively.
To complete the review papers class, we retrieve reviews and scan links they contain to find
other reviews. We eliminate works written earlier than 15 years ago (before 2003), except most
valuable publications like Erdős-Rényi’s and Mark Newman’s ones.
Also, we added the results of similar queries to Google Books. We completed our collection with
occasional relevant papers encountered during our analysis.
3.2 Review of reviewsIn the last 15 years, the most extensive study was presented in monographs [5, 14, 24, 29, 33, 38, 43,
46, 60, 72, 82, 95, 109, 110, 121, 124, 140]. Reviews and comparisons of random graph models were
conducted in works [6, 25, 32, 50, 57, 62, 65, 101, 112, 122, 124, 128, 138].
To make an overview of large volume issues, we analyzed how they reveal our topics of interest.
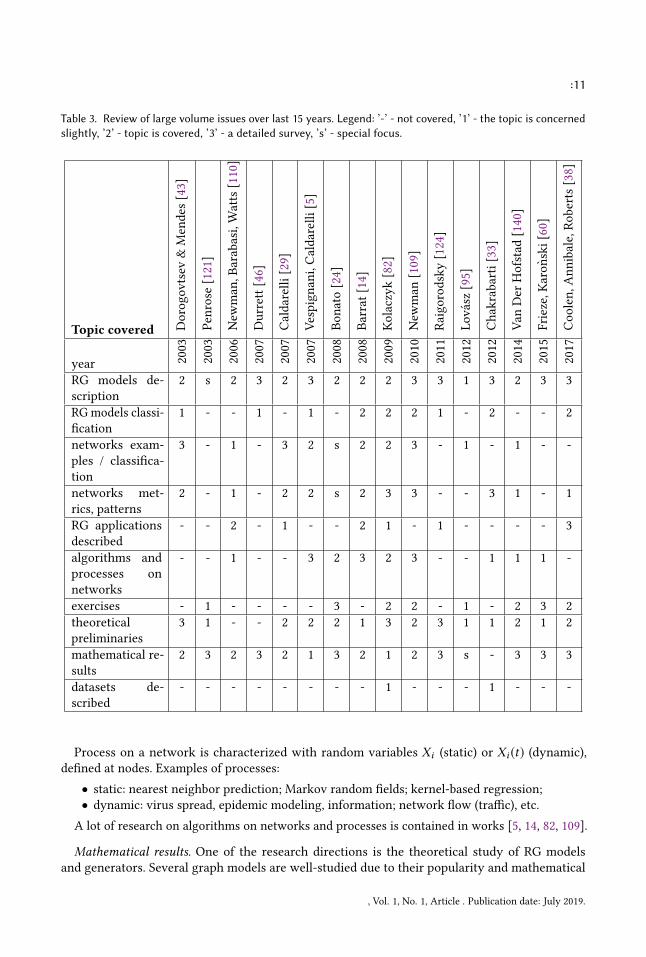
Table 3 is a quick guide of what information one can find in which books (covers only large volumeissues). Topics of interest and why they are important for RG modeling is described further.
RG models/generators description. RG models and generators are our main focus. Each of the
considered publications describes models. Much attention to various models is paid in [5, 19, 33, 38,
46, 60, 109]. Book of M. Penrose [121] is fully devoted to random geometric graphs, J. K. Harris [72]
focuses on exponential random graph models.
, Vol. 1, No. 1, Article . Publication date: July 2019.
:10 Mikhail Drobyshevskiy and Denis Turdakov
RG models/generators classification. The number of models and generators suggested is counted
in hundreds or even thousands, so we want a more general view of them. Several classifications of
existing approaches could be more informative than the details of a particular model.
We did not find an exhaustive taxonomy of RG models in the literature. Most of them are out-of-
date or suffer from incompleteness. Since there is no conventional classification of RG models, each
work suggests its state-of-art view. The most detailed classifications are provided in works [6, 19, 33,
65, 138], while D. Chakrabarti and C. Faloutsos [33] give a table with 24 RG generators compared
by several graph metrics. Alternative arrangements can be found in [5, 14, 33, 38, 57, 82, 109].
Networks examples / classification. Network data come from many sources and can be differenti-
ated by research domains (e.g., society, biology) and graph specificity, i.e., large, small, directed,
weighted, with metadata, etc. Each network domain rises its specific problems, which makes indi-
vidual requirements to RG models exploited in it. For example, a biological graph with a hundred
of nodes and a social graph with millions of nodes and billions of edges require different modeling
approaches and impose specific constraints.
Traditionally, authors distinguish from 4 up to 10 network domains, see [14, 29, 43, 109, 112].
Subdomains could also be introduced, e.g., Konect database of networks by J. Kunegis [87] contains
24 categories, but no fixed hierarchy is generally accepted.
Network metrics, patterns. A big number of real-world networks from different domains appeared
to have common patterns with similar characteristics: power law of degree distribution, small
diameter, high clustering, etc. [4]. These features are extremely represented in practice, but not
intrinsic to classical ER graphs. Therefore, we need RG models with such properties.
In the context of RG modeling, the knowledge of network patterns can serve in several ways:
• reproducing specific network patterns makes RG models more realistic;
• graph metrics allow to compare corresponding network patterns and evaluate RG models’
quality;
• better understanding of a network object, e.g., network motifs reflects behavior patterns in
biological networks.
Large observations of network properties are given in studies [33, 82, 109] and [14, 29, 43, 112];
Bonato’s book [24] is fully devoted to the Web graph.
RG applications description. Applications of networks are the main goal of RG modeling activity.
They dictate requirements, conditions, and restrictions on RG models. RG applications can be
viewed in a dual way. First, each graph domain has specific typical tasks. For example, T. Coolen et
al. [38] consider tasks arising in 5 domains: power grids, social networks, food webs, world wide
web, and protein-protein interactions.
Second, a certain type of problems can appear in multiple domains. This point of view is more
suited for works [14, 110].
We can further follow several other topics, often covered in the network literature, but less
relevant to RG modeling. They are represented in Table 3.
Algorithms and processes on networks. RG models are used to develop and test various algorithms
and processes on networks. There is no strict border between processes and algorithms. We try to
separate them by examples. Examples of algorithms:
• network topology inference: link prediction; inference of association networks; tomographic
network topology inference;
• graph mining: community detection, modularity calculation; page rank, etc.
, Vol. 1, No. 1, Article . Publication date: July 2019.
:11
Table 3. Review of large volume issues over last 15 years. Legend: ’-’ - not covered, ’1’ - the topic is concernedslightly, ’2’ - topic is covered, ’3’ - a detailed survey, ’s’ - special focus.
Topic covered Dorogovtsev&Mendes[43]
Penrose[121]
Newman,Barabasi,Watts[110]
Durrett[46]
Caldarelli[29]
Vespignani,Caldarelli[5]
Bonato[24]
Barrat[14]
Kolaczyk[82]
Newman[109]
Raigorodsky[124]
Lovász[95]
Chakrabarti[33]
VanDerHofstad[140]
Frieze,Karonski[60]
Coolen,Annibale,Roberts[38]
year
2003
2003
2006
2007
2007
2007
2008
2008
2009
2010
2011
2012
2012
2014
2015
2017
RG models de-
scription
2 s 2 3 2 3 2 2 2 3 3 1 3 2 3 3
RG models classi-
fication
1 - - 1 - 1 - 2 2 2 1 - 2 - - 2
networks exam-
ples / classifica-
tion
3 - 1 - 3 2 s 2 2 3 - 1 - 1 - -
networks met-
rics, patterns
2 - 1 - 2 2 s 2 3 3 - - 3 1 - 1
RG applications
described
- - 2 - 1 - - 2 1 - 1 - - - - 3
algorithms and
processes on
networks
- - 1 - - 3 2 3 2 3 - - 1 1 1 -
exercises - 1 - - - - 3 - 2 2 - 1 - 2 3 2
theoretical
preliminaries
3 1 - - 2 2 2 1 3 2 3 1 1 2 1 2
mathematical re-
sults
2 3 2 3 2 1 3 2 1 2 3 s - 3 3 3
datasets de-
scribed
- - - - - - - - 1 - - - 1 - - -
Process on a network is characterized with random variables Xi (static) or Xi (t) (dynamic),
defined at nodes. Examples of processes:
• static: nearest neighbor prediction; Markov random fields; kernel-based regression;
• dynamic: virus spread, epidemic modeling, information; network flow (traffic), etc.
A lot of research on algorithms on networks and processes is contained in works [5, 14, 82, 109].
Mathematical results. One of the research directions is the theoretical study of RG models
and generators. Several graph models are well-studied due to their popularity and mathematical
, Vol. 1, No. 1, Article . Publication date: July 2019.
:12 Mikhail Drobyshevskiy and Denis Turdakov
tractability, e.g., percolation theory for the ER model. Properties of Kronecker graph generators are
extensively explored, and many extensions and modifications to the original model are developed.
Richest mathematical results are presented in works [38, 46, 60, 95, 121, 140].
Theoretical preliminaries. For a non specialist in the field, it is important, whether the work gives
a detailed introduction to the field. It is a kind of "barrier to entry" for the paper.
An introduction in graph theory is presented in [5, 29, 38, 43, 109], while works [24, 82, 124, 140]
provide also mathematical preliminaries.
3.3 Existing classifications of random graph modelsA few works on RG modeling give an explicit classification of existing models. Moreover, usually,
they consider only several categories of models popular in a chosen field of interest, e.g., social
networks or biology, thus suffer from incompleteness.
Usually, RG modeling approaches consider two classes: static and dynamic. In static models the
number of nodes n is fixed and then are defined according to some rules based on nodes’ attributes
if specified. A straightforward example is the ER model. Dynamic models assume that nodes and
edges are added iteratively depending on the current state of the graph, e.g., preferential attachment
process. A separate class is constituted by Exponential Random Graph Models (ERGM), where they
are defined by sets of conditions of graph statistics.
In this section, we consider several classifications covering RG models, and discuss social graph
models since they belong to the most wide-spread domain.
3.3.1 General models. Leaving out domain-specific models, the majority of popular classification
schemes [14, 65, 82, 109] can be roughly reduced to the following:
(1) Static models (also called equilibrium):
• ER models usually referred to as "random";
• generalized DD models.
(2) Dynamic models (also called growth, evolving, and non-equilibrium):
• PA and its extensions;
• copy and duplication models;
• optimization-based models.
(3) Other models:
• ERGM;
• small-world models.
However, it is useful to look at other classifications that do not fit into this scheme. A good
approach to a taxonomy of graph generators is given by D. Chakrabarti and C. Faloutsos [33]. The
authors suggest five categories:
(1) Random Graph generators — connect nodes using random probabilities;
(2) Preferential Attachment generators — give preference to nodes with more edges;
(3) Optimization-based generators — minimizing risks under limited resources leads to power
law;
(4) Geographical models — nodes’ geography affects network growth and topology;
(5) Internet-specific generators — hybrids of concepts to fit special features of the Internet.
An alternative view on RG is developed by T. Coolen, A. Annibale, and E. Roberts [38]. They
consider graph ensembles, which are imposed by hard and soft constraints:
(1) graphs with constraints:
(a) soft constraints — graphs must have the chosen features on average (same as ERGM);
(b) hard constraints — each graph must have the chosen features.
, Vol. 1, No. 1, Article . Publication date: July 2019.
:13
(2) graphs defined by algorithms:
(a) network growth algorithms (PA and extensions);
(b) specific models: small-world, geometric, planar, and weighted.
3.3.2 Social network models. Social network models are very demanded and widely developed
branch of complex network modeling. R. Toivonen et al. [138] suggest the following taxonomy
which fits well in a generalized scheme:
(1) network evolution models — links addition depends on local network structure
• growing — nodes are added until a certain size is reached;
• dynamical — number of nodes is fixed, evolution continues until certain statistics stop to
change.
(2) nodal attribute models — link probability depends only on nodes’ attributes (homophily, like
to like, spatial model).
(3) ERGM.
F. Amblard and co-authors [6] examine social network models presented in Journal of Artificial
Societies and Social Simulation over 17 years (up to 2015) and sorted them into 9 categories:
(1) Regular lattices;
(2) Random networks — mainly ER;
(3) Small-world networks;
(4) Scale-free networks — mainly PA;
(5) Spatial networks — built from the spatial distribution of the agents using a distance;
(6) Hierarchical structures — tree-like graphs for organizational structures or familial networks;
(7) Kinship networks — bipartite graphs for the familial network;
(8) Empirical networks — empirical data on social networks are used to generate ones;
(9) Other kind of models — ad hoc models that strictly follow the modeled system.
M. Bernovskiy and N. Kuzyurin [19] suggest classification based on model complexity, although
consider a limited number of models:
(1) random graphs — ER and its extensions;
(2) simplest scale-free models — Bollobás model [22] and extensions; copying model, etc.;
(3) more flexible scale-free models — generalized DD models (Chung-Lu [2], Janson-Łuczak [76],
etc).
and on a partition of scale-free models:
(1) fixed exponent — power law DD and other properties are mathematically proved: Bollobás-
Riordan [22] and extensions;
(2) tunable exponent — power law exponent is tunable, which allows for phase transitions
research: Chung-Lu [2], Janson-Łuczak [76];
(3) unknown properties — properties are not yet proved: Forest Fire [93] and others.
An interesting focus is presented by A. Sala et al. [128], where the authors split 6 models into 3
categories based on the methodology:
(1) Feature-driven models — reproducing statistical features of a graph: Barabási-Albert [4],
ForestFire [93];
(2) Intent-driven models — emulating the creation process of the original graph: Random
Walk [143], Nearest Neighbor [143];
(3) Structure-driven models — capturing statistics from the graph structure to reproduce it:
Kronecker Graphs, dK-graphs.
, Vol. 1, No. 1, Article . Publication date: July 2019.

:14 Mikhail Drobyshevskiy and Denis Turdakov
In the screened literature, we did not find a satisfactory overview of the existing RG models. All
the attempts were out of date or far from completeness. As we see, there exist several classifications
from different perspectives: whether the graph is growing or not, algorithm complexity, used
methodology, from the application point of view, etc. However, low-level concepts working in
models are still not clear. In the current paper, we review such simple basic mechanisms detected
in the models. Further, we describe our vision of the area and give a comprehensive taxonomy of
concepts.
4 A TAXONOMY OF RANDOM GRAPH MODELING APPROACHESWe suggest a hierarchical taxonomy of RG concepts considering three upper-level classes based on
underlying motivations (Figure 1).
(1) Generative class covers all graph generating mechanisms invented to qualitatively explain
graph patterns. The relevant model development order is to construct a graph according to
specified rules and find out what features it has, then analyze whether its features correspond
to real-world graph patterns and modify the rules accordingly.
(2) Feature-driven class focuses on designing a model, which quantitatively fit the required
graph features. The development order is the opposite: given a set of desired features, one
tries to design or tune a model, satisfying these features.
(3) Domain-specific class concerns methods for generating graphs with additional network
attributes, such as community structure or edge weights.
First two classes are intended to cover all models for simple and directed graphs, while Domain-
specific class covers other types of graphs which are potentially unlimited. Each class contains
several categories reflecting distinctive directions of thought. Coarse-grained categories are divided
into subcategories.We describe and analyze them below in details and illustrate themwith particular
models. Naturally, several models appear in several categories since they employ several concepts.
Although these categories do not refer to all relevant models, our goal is to illustrate the concepts
that cover the majority of famous RG models and generators.
4.1 Generative classStarting from the simplest ER model, which is the most general and, at the same time, the least
realistic model of a random graph, designers of RG models developed many algorithms trying to
explain patterns presented in real networks. Barabási-Albert model exhibits power law degree
distribution as a result of preferential attachment principle. Wattz-Strogats model achieves low
diameter, for so-called âĂŹsmall worldâĂŹ networks, by random wiring in a regular lattice. Forest
Fire model shows densification law and shrinking diameter pattern in evolving graphs using a
recursive process, resembling forest fires, and so on. Further work in this area is an adaptation of
original concepts to directed edges, introducing new heuristics, trying to combine various features
in one model, etc. While such works do not suggest new concepts, we do not mention them.
The concepts comprised here represent the whole range of random graph generating approaches
we are aware. We group them into five categories: ‘Classic’, ‘Local rules’, ‘Recursion’, ‘Latent
attributes’, and ‘Topology from optimization’.
4.1.1 Classic. The naive interpretation of randomness is to connect each pair of nodes inde-
pendently. One of the first such models, the ER model [52], became classic: on a set of n nodes,
each edge appears with a constant probability p (Figure 2). Although the ER model has unrealistic
properties (Poissonian DD, very low clustering, etc.), it is rich with theoretical results, e.g., phase
transition theory [21].
, Vol. 1, No. 1, Article . Publication date: July 2019.

:15
Fig. 1. Taxonomy of concepts, appearing in random graph modeling approaches with short descriptions ofeach category.
Another prominent construction, named the small-world model, is aimed to achieve the low
diameter together with high clustering. Watts-Strogatz model [146] starts with a regular lattice,
where each node has k neighbors. Each edge is then replaced with a random edge with probability
p. There exist intermediate values of p between 0 (regular lattice) and 1 (ER graph) corresponding
to a "small-world" region where clustering is still high and average path length decayed (Figure 3).
Fig. 2. ER model: each edge ap-pears with equal probability.
Fig. 3. Intermediate values of the ratio p of randomly rewired edges corre-spond to a small-world region [146].
4.1.2 Local rules. Following A. Vázquez [143], by "local," we mean that the graph growth process
is guided by rules involving a nodewith its neighbors. One of such rules, motivated by an observation
very popular in the social domain, is called "triadic closure" [67]. It says that the probability of edge
(u,v) is higher given that nodes u and v have a common neighbor. This rule is expressed as a high
, Vol. 1, No. 1, Article . Publication date: July 2019.
:16 Mikhail Drobyshevskiy and Denis Turdakov
clustering coefficient in real graphs comparing to an independent connecting of nodes in the ER
model.
Preferential Attachment principle. Two factors: the growth of the graph and the idea of linking
a new node more likely to a more connected node — together lead naturally to the power law
DD. In this way, PA is employed in the Barabási-Albert model [12] to explain scale-free property
observed in many real-world networks. PA principle is vastly used in RG models, therefore a lot of
variations exist. Original formulae states edge probability to be proportional to node degree: P ∼ di ,normalized over all nodes i already presented in the graph (Figure 4). But this predetermines a
power law exponent γ = 3 [12]. Most notable evolution steps of PA include the following.
• Introduction of new parameters to PA rule, e.g., P = A+di∑i (A+di )
allows flexible power law
exponent γ = 2 + A∆m ∈ [2,∞), where ∆m is a number of new edges to be added at each step,
A is an extra parameter [43].
• Modification of PA rules. In Bollobás-Riordan model [23], a graphGn1with n nodes and 1 · n
edges is built first.Gn1is constructed fromGn−1
1by adding 1 node with 1 edge according to PA
rule. To obtain Gnk with n nodes and kn edges, one builds Gkn
1, split its kn nodes into k-node
groups, and collapse them, preserving the edges (edges within one group become self-loops).
One of the results is that the diameter is ≈lnn
ln lnn, which fits to the empirical value 6 for the
Internet in 1999.
• Nonlinear PA. One may generalize PA rule, linear from node degree, to an arbitrary function.
For instance, P ∼ (1 + di )β − λ, where parameters β , λ are to be fitted: for real networks best
β varies from 0 to 1.6 [88].
PA serves as a basis for a lot of later models, which also introduce community structure, higher
clustering [139], and so on.
Copying principle. Quite a natural mechanism of networks formation is duplicating of its parts,
possibly with mutations (Figure 5). Patterns copying takes place in various real networks. Genes
can duplicate during the evolution process. Thus their interaction edges are duplicated in protein
interaction networks. In WWW as well as in citation networks, authors could inherit most links
from one page (work) to another on a similar topic.
Original formalization by Jon M. Kleinberg et al. [81] includes the four processes acting at each
iteration: node creation/deletion and edge creation/deletion with some probabilities. The essence
of the model is the edge creation process. A node v to add edges for, and the number of edges
k to be added are sampled from predefined distributions. With probability β , node v is linked to
k randomly chosen nodes, and with probability (1 − β), edges of a randomly chosen node u are
copied. Such a copying model produces the power law DD with γ = 2−α1−α ∈ [2; 3] depending on the
growth factor α =β
1−β . It is also shown to demonstrate a large number of bipartite cliques (as in
the Web graph), creating some community effect [86].
In a Growing network model with copying [84], in addition to copying edges of a target node u,a chosen node v also connects to u itself. This provides that the number of edgesm grows faster
than the number of nodes n, which was observed in real world networks as densification law.
A kind of mutations could be introduced, like in Duplication divergence model [143]. Here, after
copying edges for each of the neighbors j, one of the two edges (u, j) or (v, j) are removed with
probability 1 − qe . Notably, the clustering coefficient as a function of node degree shows power law
decay with exponent depending on qe .Algorithm for replicating of complex networks (ReCoN) [134] copies a given graph k times and
then applies edge switching to make the replicas connected and add randomization. Although
, Vol. 1, No. 1, Article . Publication date: July 2019.

:17
simple, ReCoN is shown to preserve the Gini coefficient of the DD, relatively high clustering
coefficient2, and small diameter.
The concept of structure copying is present in many RG models often implicitly or among other
mechanisms. For instance, in the Forest Fire model [93], a new node attaches to the neighbors
of its target node (with "burning" probability) and this "burning" process continues recursively.
The GScaler algorithm [156] decomposes the input graph into separate nodes with edge stubs,
multiplies them, and rewires according to the edge correlation function.
Other local rules. In the world of graph growth models, perhaps as a further evolution of PA
principle, various local based approaches emerged. They were shown to explain other important
features like degree correlations and an inverse proportionality between the clustering coefficient
and the vertex degree [143]. Now we give examples of different local rules employed in models.
RandomWalks model [143]. A new nodev connects to a randomly chosen existing nodew . Then,
with some probability qe it connects to one of its neighborsw ′. If an edge is created, proceed to a
neighbor ofw ′and so on, thus performing a random walk. As a modification, node v could try to
connect to each ofw ’s neighbors, which resembles an exhaustive search. These random walk rules
lead to the power law in-DD and relatively high clustering.
Nearest Neighbors model [143]. A new node v also connects tow , and then with probability pit connects to one of its neighbors. Besides power law DD, this simple mechanism provides two
non-trivial patterns, observed in social networks. Clustering coefficient as a function of node degree
follows power law; average neighbor degree increases as a function of node degree.
Forest Fire model [93]. The first step is the same: a new nodev connects tow . Among its unvisited
neighbors, it selects x ones, reachable via out-links and y ones, reachable via in-links (or as much as
possible, if not enough). Nodev creates out-links to the selected nodes, marking them as visited, and
the process continues recursively. x and y are sampled from geometric distributions parameterized
with forward p and backward rp burning probabilities. Surprisingly, this model demonstrates a
set of significant features: heavy-tailed in- and out-DD, densification power law, and shrinking
diameter. According to the experiments with social networks, Forest Fire model also shows the
clustering coefficient consistency with real data [128].
The most popular local based heuristic involves creation of triadic closures. They could be formed
with some probability at each iteration of an algorithm. For example, two random neighbors of
node i are linked if are not already [40], or friend of friend of node i is linked to i [97]. Thesemodels also exploit random node deletion (with some probability at each step) [40] or random
2Due to separate edge switching within communities and between communities, CC does not fall much. Generally speaking,
edge switching breaks clustering features.
Fig. 4. PA: a new node more likely connects toa more connected node. Dashed edge thicknesscorrespond to linking probability.
Fig. 5. Copying principle: an existing part of thegraph is copied, e.g., a node with its edges.
, Vol. 1, No. 1, Article . Publication date: July 2019.
:18 Mikhail Drobyshevskiy and Denis Turdakov
edge deletion [97], therefore, a permanent growth becomes a dynamical evolution. The process
continues until stationary distributions (DD, average degree) is reached.
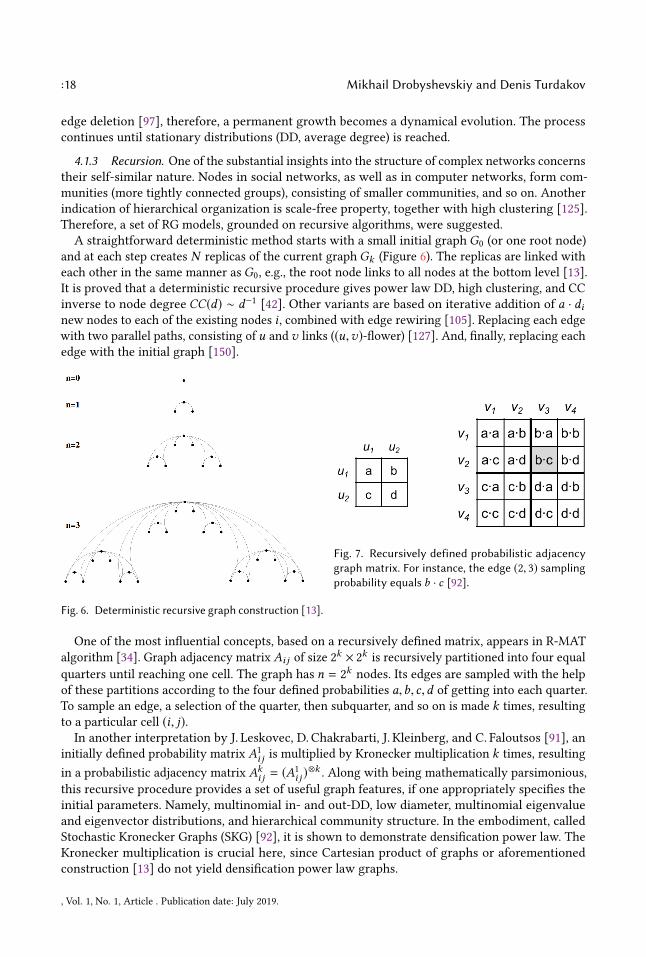
4.1.3 Recursion. One of the substantial insights into the structure of complex networks concerns
their self-similar nature. Nodes in social networks, as well as in computer networks, form com-
munities (more tightly connected groups), consisting of smaller communities, and so on. Another
indication of hierarchical organization is scale-free property, together with high clustering [125].
Therefore, a set of RG models, grounded on recursive algorithms, were suggested.
A straightforward deterministic method starts with a small initial graphG0 (or one root node)
and at each step creates N replicas of the current graph Gk (Figure 6). The replicas are linked with
each other in the same manner as G0, e.g., the root node links to all nodes at the bottom level [13].
It is proved that a deterministic recursive procedure gives power law DD, high clustering, and CC
inverse to node degree CC(d) ∼ d−1[42]. Other variants are based on iterative addition of a · di
new nodes to each of the existing nodes i , combined with edge rewiring [105]. Replacing each edge
with two parallel paths, consisting of u and v links ((u,v)-flower) [127]. And, finally, replacing eachedge with the initial graph [150].
Fig. 6. Deterministic recursive graph construction [13].
Fig. 7. Recursively defined probabilistic adjacencygraph matrix. For instance, the edge (2, 3) samplingprobability equals b · c [92].
One of the most influential concepts, based on a recursively defined matrix, appears in R-MAT
algorithm [34]. Graph adjacency matrix Ai j of size 2k × 2
kis recursively partitioned into four equal
quarters until reaching one cell. The graph has n = 2knodes. Its edges are sampled with the help
of these partitions according to the four defined probabilities a,b, c,d of getting into each quarter.
To sample an edge, a selection of the quarter, then subquarter, and so on is made k times, resulting
to a particular cell (i, j).In another interpretation by J. Leskovec, D. Chakrabarti, J. Kleinberg, and C. Faloutsos [91], an
initially defined probability matrix A1
i j is multiplied by Kronecker multiplication k times, resulting
in a probabilistic adjacency matrix Aki j = (A1
i j )⊗k. Along with being mathematically parsimonious,
this recursive procedure provides a set of useful graph features, if one appropriately specifies the
initial parameters. Namely, multinomial in- and out-DD, low diameter, multinomial eigenvalue
and eigenvector distributions, and hierarchical community structure. In the embodiment, called
Stochastic Kronecker Graphs (SKG) [92], it is shown to demonstrate densification power law. The
Kronecker multiplication is crucial here, since Cartesian product of graphs or aforementioned
construction [13] do not yield densification power law graphs.
, Vol. 1, No. 1, Article . Publication date: July 2019.

:19
The SKG model is deeply studied and rich of extensions due to its mathematical tractability, low
generation complexity, and additional procedure of parameters fitting [92]. The extensions include
adding a random noise to overcome DD oscillating [131]; introducing tied parameters to increase
graphs variability for domain imitating [106]; introducing multiple fractal structures in the model
to expand space of covered graphs [107].
A closely related concept underlies Multi-fractal network generator (MFNG) [119]. In addition to
the recursively specified edge probability (Pi j =∏k
q=1piqpjq with l probabilities piq as parameters),
nodes belong to recursively defined categories. Namely, [0, 1] interval is split into l differentsubintervals defined by extra l − 1 parameters. Each of the intervals is iteratively split again with
the same ratios k times, thus defining the categories. Graph nodes are uniformly sampled as points
in [0, 1]. This procedure gives a more flexible model which is supplied with a fitting procedure.
The concept of recursive topology construction is well consistent with the fractal structure of
real networks. It also explains a set of power laws (DD, CC vs. node degree, eigenvalues) and the
low diameter. However, recursion-based algorithms often generate graphs with n = nk0nodes,
which could be too coarse-grained for practical purposes.
4.1.4 Latent attributes. The idea is to assume that linking probability depends on some inherent
properties of the nodes expressed as their attributes. Motivation from the social domain is called
homophily, which claims that similarities attract: people of close age, interests, occupation, ge-
ographical location, etc. are more likely to be connected within the network [99]. This concept
is formalized via incorporating node attributes in the model and stating edge probability as a
function of node attributes: Pi j = f (®ai , ®aj ). Such models are also referred as "spatial" or "latent
space", meaning attributed nodes as points in a space of social attributes.
This category of concepts we divide into two directions: geometry and node labeling.
Geometry. An intuitive interpretation of nodes’ attributes as geographical coordinates is pro-
ductive in modeling ad hoc wireless networks, sensor-actuator networks, and the Internet, where
physical distance between the nodes directly influences their connectivity [118].
Common approaches follow this scheme. First, n points are distributed in 1 or 2-dimensional
area in Euclidean space, usually uniform in [0; 1]2, or a Poissonian point process is used. Then,
edges are sampled probabilistically according to the distance between nodes dist(i, j) (Figure 8).The dependency function varies across the works: exponential decay Pi j ∼ e−αdist (i, j) in Waxman
model [147]; power decay P ∼di α
dist (i, j)σ in S.-H. Yook et al. [155] with best fit α = σ = 1 to the
Internet; step function Pi j = pa , if dist(i, j) < H , else Pi j = pb [149]. Specifying a distribution of
node points as a mixture of distributions, naturally models a community structure, e.g., a sum of
Multivariate normal distributions is used [71].
Although achieving good results at CC, degree correlations, and community structure in these
models, random geometric graphs have Poissonian DD [121]. The remedy could go from static to
dynamic model employing PA principle as the BRITE generator: Pi j ∼ dj · e−αdist (i, j)
[100].
If we change the distance between nodes to a cosine similarity of their vectors, we come to
dot-product graphs. The nodes reside in a multidimensional space. The edge probability is given as
a function of a dot-product of their vector representations: Pi j = f (®ri · ®r j ) [117]. In a generative
model, vectors ®u and ®v are sampled independently for each node from probability distributionsU ,
V respectively, namely,Uα [0, 1] — α-th power of uniform distribution. Corresponding nodes are
connected with probability Pi j = ®ui · ®vj . Together with the sparse case of Pi j =®ui · ®vjnb , b ∈ (0,∞),
the model is thoroughly studied theoretically and shown to generate power-law graphs with small
diameter and high clustering coefficient [117]. Node vector could be interpreted as a list of interests
of a corresponding individual in a modeled social network (users with common interests are more
, Vol. 1, No. 1, Article . Publication date: July 2019.
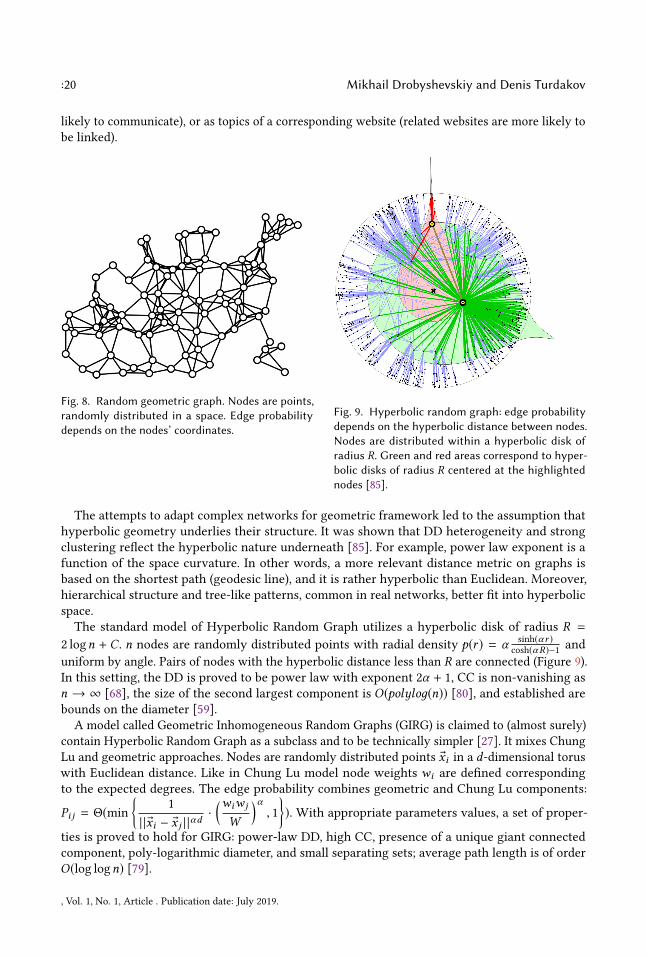
:20 Mikhail Drobyshevskiy and Denis Turdakov
likely to communicate), or as topics of a corresponding website (related websites are more likely to
be linked).
Fig. 8. Random geometric graph. Nodes are points,randomly distributed in a space. Edge probabilitydepends on the nodes’ coordinates.
Fig. 9. Hyperbolic random graph: edge probabilitydepends on the hyperbolic distance between nodes.Nodes are distributed within a hyperbolic disk ofradius R. Green and red areas correspond to hyper-bolic disks of radius R centered at the highlightednodes [85].
The attempts to adapt complex networks for geometric framework led to the assumption that
hyperbolic geometry underlies their structure. It was shown that DD heterogeneity and strong
clustering reflect the hyperbolic nature underneath [85]. For example, power law exponent is a
function of the space curvature. In other words, a more relevant distance metric on graphs is
based on the shortest path (geodesic line), and it is rather hyperbolic than Euclidean. Moreover,
hierarchical structure and tree-like patterns, common in real networks, better fit into hyperbolic
space.
The standard model of Hyperbolic Random Graph utilizes a hyperbolic disk of radius R =
2 logn + C . n nodes are randomly distributed points with radial density p(r ) = α sinh(αr )cosh(αR)−1
and
uniform by angle. Pairs of nodes with the hyperbolic distance less than R are connected (Figure 9).
In this setting, the DD is proved to be power law with exponent 2α + 1, CC is non-vanishing as
n → ∞ [68], the size of the second largest component is O(polyloд(n)) [80], and established are
bounds on the diameter [59].
A model called Geometric Inhomogeneous Random Graphs (GIRG) is claimed to (almost surely)
contain Hyperbolic Random Graph as a subclass and to be technically simpler [27]. It mixes Chung
Lu and geometric approaches. Nodes are randomly distributed points ®xi in a d-dimensional torus
with Euclidean distance. Like in Chung Lu model node weights wi are defined corresponding
to the expected degrees. The edge probability combines geometric and Chung Lu components:
Pi j = Θ(min
{1
| | ®xi − ®x j | |αd·
(wiw j
W
)α, 1
}). With appropriate parameters values, a set of proper-
ties is proved to hold for GIRG: power-law DD, high CC, presence of a unique giant connected
component, poly-logarithmic diameter, and small separating sets; average path length is of order
O(log logn) [79].
, Vol. 1, No. 1, Article . Publication date: July 2019.

:21
In Embedding based random graphmodel (ERGG) [44], each node of a directed graph is associated
with a vector ®ri being a triple ®ui , ®vi , and Zi . Link probability is based on a directed softmax model,
where the conditional probability of the edge i → j is: P(j |i) = exp(®ui · ®vj − Zi ), with Zi being a
normalization coefficient [75]. At the construction phase, edge i → j is created iff P(j |i) is above athreshold tG . Representations {®ri } and the threshold are learned to fit best to a given graph G.As a resume, we note that the selection of graph geometry could be treated as the selection
of metric in the node vectors space. The simplest geometry is Euclidean one. Dot-product based
metric reflects spherical geometry (due to cosine similarity). More sophisticated and efficient is the
hyperbolic metric.
Node labeling. Besides geometric interpretation, the concept of representing the node as a vector
of attributes takes another form. The key assumption is that edge probability defined by the
similarity of node labels.
In Random typing graphs (RTG) [3], a random typing process is used to generate character
sequences terminating with "space". Each unique word corresponds to a node. At each algorithm
step, source and destination node labels are created in parallel by one letter l , each having its own
typing probability pl . An edge is created between the nodes or edge weight is incremented if it
exists. Additionally, in order to model the homophily (and community structure), an imbalance
factor β < 1 is introduced. β diminishes generating the probability of different letters at the same
position, i.e., p(a,b) = βpapb , while p(a,a) = papa . This trick makes nodes with similar labels be
connected more often. RTG model emerges seven power law dependencies: DD; densification;
number of triangles a node participate; eigenvalues of adjacency matrix; largest eigenvalue versus
the number of edgesm; total edge weight depending onm; and node strength depending on its
degree.
In R-MAT [34], as well as in SKG [92] approaches, the initial probability matrix A1can be treated
as individual attributes similarities. Thus, each node becomes a unique sequence of k attributes,
where k is a value of Kronecker power. Edge probability equals to the product of these individual
similarities for two nodes. In this way, higher diagonal values of A1correspond to the homophily
principle, since the coincidence of attributes increases edge probability.
4.1.5 Topology from optimization. One interesting approach concerns a concept of network
topology emerging as a solution of some optimization task. One could say that organization of
many biological systems, the Internet, and communication networks were formed as a result of
adaptation to the environment under the constraints and maximization the network efficiency.
Therefore, the network structure can be derived through optimization of a fitness function.
A Heuristically Optimized Trade-offs Model [54] is aimed to explain power law DD in the Internet
graph as a result of locally made trade-offs. Nodes in the model are sampled uniformly in a unit
square. When a new node i appears, it chooses node j to connect to by minimizing two goals:
geographical distance to it dist(i, j) and a centrality hj (e.g., the average path length from j to all
other nodes in the graph), i.e., αdist(i, j)+hj →min. Intermediate values of parameter α correspond
to the emergence of power law as a trade-off between geographical and centrality constraints. This
model is generalized by N. Berger et al. [18], who show that the competition between connection
cost and routing cost causes PA behaviour.
Various simple topologies can emerge from the maximization of a survival fitness function:
αηE + (1−α)ηR −C →max [144]. Here ηE reflects the efficiency of system functioning, formalized
as an inverse of the average graph path length. ηR is robustness to potential damage (such as
node/edge removal), non-trivially expressed via sizes of strongly connected components after a
node removal. C refers to resource constraints, measuring the cost of node and edge addition. By
means of simulations, there were obtained "star", "hub", "circle" and power law topologies.
, Vol. 1, No. 1, Article . Publication date: July 2019.

:22 Mikhail Drobyshevskiy and Denis Turdakov
4.2 Feature-driven classEarly graph models were aimed to qualitatively explain the main patterns, observed in the real
networks. However, it is more useful not only to capture the important graph features, but to be
able to control them parametrically. If a model allows custom power law exponent and cluster-
ing coefficient, it becomes a much more flexible and efficient instrument for network analysis.
Unfortunately, in practice, model parameters influence on resulting graph properties in a very
complicated way. Moreover, known graph measures are not independent of each other and could
not take arbitrary values. To address this problem the RG models are often supplied with parameter
estimation procedures, aimed to fit the requirements. Model fitting algorithm is a key point of
models in the Feature-driven class.
In contrast to the Generative class, the Feature-driven class concerns approaches, which whether
take as input a list of features, desired to be reproduced in output graphs, or directly fit a given
graph, implicitly learning its features. Many modern models combine paradigms of both classes,
e.g SKG were merely a graph generator until a parameter fitting procedure Kronfit was invented.
We distinguish three categories of approaches each of which is rich of variations: ‘analytical
way’, ‘fitness optimization’, and ‘graph editing’.
4.2.1 Analytical way. Quite a straightforward approach is to design a graph generating algorithmin a way such that its parameters could be analytically found given the wished graph features. Such
a model is mathematically tractable, allows for precise control of graph features and thus useful for
analysis.
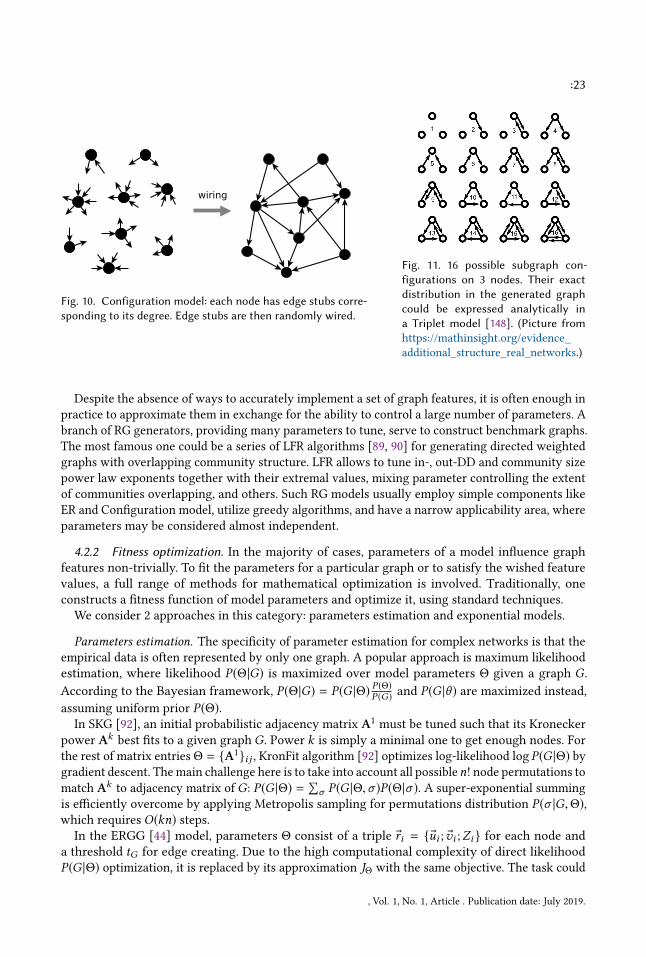
Simplest cases include the realization of prescribed degree sequence, either fully custom or sam-
pled from a family of distributions like power law or Double Pareto Log-Normal distribution [132].
Configuration model [16] implements a sequence of node degrees {di }ni=1
: each node is assigned
with di edge stubs which are then wired randomly. Plenty of models grew from this concept, refer
to D. Chakrabarti and C. Faloutsos [32] for details. In an Expected Degree model aka Chung Lu
model [35, 36] each node i is given with an expected degreewi , edge probabilities being Pi j ∼ wiw j .
Generalized Binomial Graph [83] defines a matrix of edge probabilities itself as a parameter:
P = [Pi j ].Being quite simple, these models are well studied for various power law exponents, emergence
of connected components, size of largest cliques, etc. [76]. Although being poor models for real
networks, such constructions widely serve as null-models. A class of all graphs with the same
nodes degrees is a classic null model. It is used for network motif detecting task [58].
More complex task is to reproduce the desired subgraph distribution in a graph. A Triplet model
by A.Wegner [148] considers generating one of four possible edge configurations (having from 0
to 3 edges) on each node triplet, according to the probabilities p1, ...,p4. There are 16 variants in the
case of directed edges (Figure 11). Subgraph distribution in the generated graph is expressed via four
(or 16) equations, which connect their probabilities to the probabilities of generating each subgraph
configuration on the initial node set. A Multiplet model, generalizing to d-nodes subgraphs, is alsodescribed by A.Wegner. Unfortunately, it requires significantly more equations when d increases.
Another difficulty arises when one tries to combine several features. A common method is to
iteratively modify graph, consequently satisfying needed features one by one. Implementing a
target degree sequence and CC together is already non-trivial and is not solved exactly. For instance,
L. Heath and N. Parikh [73] suggest to iteratively add triangles to realize the node triangle sequence
and then add single edges until degree sequence is reached. Here the resulting DD is exact while CC
is close to the expected but deviates for dense graphs, presumably because tuning the DD violates
CC, achieved at the first step.
, Vol. 1, No. 1, Article . Publication date: July 2019.
:23
Fig. 10. Configuration model: each node has edge stubs corre-sponding to its degree. Edge stubs are then randomly wired.
Fig. 11. 16 possible subgraph con-figurations on 3 nodes. Their exactdistribution in the generated graphcould be expressed analytically ina Triplet model [148]. (Picture fromhttps://mathinsight.org/evidence_
additional_structure_real_networks.)
Despite the absence of ways to accurately implement a set of graph features, it is often enough in
practice to approximate them in exchange for the ability to control a large number of parameters. A
branch of RG generators, providing many parameters to tune, serve to construct benchmark graphs.
The most famous one could be a series of LFR algorithms [89, 90] for generating directed weighted
graphs with overlapping community structure. LFR allows to tune in-, out-DD and community size
power law exponents together with their extremal values, mixing parameter controlling the extent
of communities overlapping, and others. Such RG models usually employ simple components like
ER and Configuration model, utilize greedy algorithms, and have a narrow applicability area, where
parameters may be considered almost independent.
4.2.2 Fitness optimization. In the majority of cases, parameters of a model influence graph
features non-trivially. To fit the parameters for a particular graph or to satisfy the wished feature
values, a full range of methods for mathematical optimization is involved. Traditionally, one
constructs a fitness function of model parameters and optimize it, using standard techniques.
We consider 2 approaches in this category: parameters estimation and exponential models.
Parameters estimation. The specificity of parameter estimation for complex networks is that the
empirical data is often represented by only one graph. A popular approach is maximum likelihood
estimation, where likelihood P(Θ|G) is maximized over model parameters Θ given a graph G.
According to the Bayesian framework, P(Θ|G) = P(G |Θ) P (Θ)P (G)and P(G |θ ) are maximized instead,
assuming uniform prior P(Θ).In SKG [92], an initial probabilistic adjacency matrix A1
must be tuned such that its Kronecker
power Akbest fits to a given graph G. Power k is simply a minimal one to get enough nodes. For
the rest of matrix entries Θ = {A1}i j , KronFit algorithm [92] optimizes log-likelihood log P(G |Θ) bygradient descent. Themain challenge here is to take into account all possiblen! node permutations to
match Akto adjacency matrix of G: P(G |Θ) =
∑σ P(G |Θ,σ )P(Θ|σ ). A super-exponential summing
is efficiently overcome by applying Metropolis sampling for permutations distribution P(σ |G,Θ),which requires O(kn) steps.
In the ERGG [44] model, parameters Θ consist of a triple ®ri = {®ui ; ®vi ;Zi } for each node and
a threshold tG for edge creating. Due to the high computational complexity of direct likelihood
P(G |Θ) optimization, it is replaced by its approximation JΘ with the same objective. The task could
, Vol. 1, No. 1, Article . Publication date: July 2019.

:24 Mikhail Drobyshevskiy and Denis Turdakov
be reduced to maximization of the score function si j = ®ui · ®vj − Zi over all edges i → j, whileminimizing it over non-edge pairs. The challenge is that the space dimensionality must be low:
d ≪ n. Threshold tG is determined to best separate the edges of G from non-edges according to
their score si j . Random graph is constructed by sampling new node vectors {®r ′i } from the same
distribution as {®ri }, and creating edges using the computed threshold: edge i → j appears iffsi j > tG .
Generally, the task of mapping nodes of graphG into low-dimensional vectors, encoding maximal
information of G, is called graph representation learning or graph embedding. This direction is
actively developing in recent years [66]. Its main benefit for RG modeling could be that it turns
the graph into a set of vectors, which is much more convenient as input for machine learning
algorithms.
An alternative for model parameters estimation could be the method of moments. MFNG [119]
models a graph recursively, like SKG, specifying l node category probabilities and l × l matrix
of category similarities, but then goes in another way. Fitting to a real graph could be done by
a method of moments as a task of minimization of the deviation of a set of target features from
their expected values [17]. Strong point of this approach is that statistics, that can be formulated
as events on a subset of the edges (number of edges, cliques, stars, and so on), can be analytically
expressed through model parameters and thus could be used for fitting.
Since SKG model also allows to express edge-based features via model parameters, the method
of moments could be applied for it [64].
Exponential random graph models. In a general case of the RG model, one would like to specify a
graph probability space P(G), such that these graphs satisfy a set of wished constraints imposed on
graph statistics F (®s(G)) = 0. Statistical framework suggests to choose the distribution with maximal
Shannon entropy S[P] = −∑G ∈G P(G) log P(G), since it gives no additional information except that
contained in the constraints. Maximizing the entropy subject to constraints
∑G ∈G P(G)®s(G) = ®s(G∗)
gives exponential solutions: P(G) = 1
Z ( ®θ )e®θ ®s(G)
, where the model parameters®θ are defined from
constraints equations and Z ( ®θ ) is a normalization coefficient. The idea of ERGM is to explain the
observed graph G∗by the statistics of its topology and node attributes. Statistics s1(G), s2(G), ...
could be any measurable variables of network structure: number of edges, triangles, k-stars, degree
sequence, or attributes: age, proximity, gender, etc.
Most ERGMs, except for trivial examples, can not be solved analytically. Exact calculation of
a partition function Z ( ®θ ) and its derivatives is impossible. Therefore, approximate solutions and
maximum likelihood or pseudo-likelihood methods for parameter estimation were developed [141].
Markov chain Monte-Carlo sampling is a widely employed technique, where one builds a Markov
chain with a target stationary distribution.
The simplest ERGM instances are the ERmodel (s(G) =m) and Configurationmodel (®s(G) = {di }).A more interesting well-known ERGM example is Stochastic Block Model (SBM). In SBM, graph
nodes belong to one of the Q groups (communities) with prior probabilities pi . Nodes are linkedaccording to an affinity matrix P of size Q ×Q , specifying inter-group probabilities. Given a real
network, the model parameters could be estimated using expectation-maximization algorithm [41].
The key advantage of ERGMs is their probabilistic rigor, whichmeans that the defined distribution
is the best choice under given constraints ®s(G) in a statistical sense. This makes them attractive
null-models, widely used to analyze social and biological networks. However, at the time serious
problems arise, when graphs become larger (n > 104) or conditions become more complicated than
linear functions of Ai j . Computational complexity and parameters sensitivity are the main issues.
A balance is needed between accuracy and speed [7].
, Vol. 1, No. 1, Article . Publication date: July 2019.
:25
4.2.3 Graph editing. An alternative to constructing a random graph with desired features from
scratch is to randomize an existing graph, preserving its features of interest. Simplest graph editing
operations include node/edge addition/removal. Many techniques are based on combinations of
them. A secondary goal of graph randomization is to introduce variability in the model.
Edge switching. The classical procedure of graph randomizing is edge switching, or edge rewiring.
It is repeatedly applied to modify a graphGC such that a set of constraintsC remains satisfied. The
most widespread operation is pairwise edge switch, since it keeps node degrees unchanged: a pair
of edges i → j,k → l is rewired into i → l ,k → j (Figure 12).An important fact, used in many approaches, is the following. Let a Markov chain start with
an initial graph G0and a pair of edges to be switched is picked randomly at each step. Then the
chain has a stationary distribution uniform over all graphs with the same node degrees. Moreover,
it is irreducible, i.e., any configuration is reachable from any other. These properties make it easy
to uniformly generate random graphs with given DD [136]. In practice, for graph generating one
waits some time, linear to the number of edgesm, while the chain converges. Empirically, 100msteps is enough [103].
Fig. 12. Edge switch operationmodifies edges configurationwhile keeps node degree un-changed.
Fig. 13. ERGG: a graph is modified at the level of its vector repre-sentation.
In a case of more elaborate constraints C , a standard Monte Carlo sampling techniques are
employed to achieve Markov chain with a wished stationary distribution corresponding to C . Forinstance, Ying Xiaowei and Wu Xintao [154] use the Metropolis-Hastings algorithm to sample
graphs with a target distribution of features д(S). Namely, at the step t , a potential edge switch is ac-
cepted with probability PGt−1→Gt = min
(1,
д(S(Gt ))
д(S(Gt−1))
f (S(Gt−1))
f (S(Gt ))
), where f (S) is the distribution
of feature S over all graphs with the same degree sequence. A particular example is the ClustRNet
algorithm [11], where, besides the DD, the only constraint is the CC and the graph connectivity.
Thus, the transition probability is simply 1, only if the CC of Gtis higher than some threshold
and Gtis connected, and 0 otherwise. Similarly, one can generate dK-random graphs, where C is
dK-distributions [96].Unfortunately, MCMC, guided by complex constraints, suffer from two problems: not all states,
satisfying the constraintsC , could be reachable from each other via allowed switches (non-ergodicity
property), and an increase of chain convergence time.
, Vol. 1, No. 1, Article . Publication date: July 2019.

:26 Mikhail Drobyshevskiy and Denis Turdakov
To make the state space more connected, L. Tabourier, C. Roth, and J.-Ph. Cointet [135] suggest
k-edge switches. They are defined for k edges {ai → bi }i=1..k , not necessarily distinct. Edges’
endpoints {bi } are randomly permuted, resulting in {ai → σ (bi )}i=1..k with σ being one of k!
possible permutations.
Pairwise edge switch is often used as an additional randomization step in RG generators. In the
ReCoN [134] model large graphs are generated by copying an original one (together with labelled
communities) k times and rewiring edges within new communities’ replicas and then between
them. Although edge switching preserves node degree properties, it breaks the other features3.
In Lancichinetti-Fortunato-Radicci benchmark (LFR) [89], edge switches are employed to adjust
topological parameters: to decrease the number of intra-community edges, leaving the node degrees
fixed.
Other editing. Instead of modifying graphG itself, one could modify its representation R(G), if itproperly reflects the graph features. The problem shifts to finding an appropriate representation
and convenient operations of transformation G to R(G) and backwards.
Multiscale Network Generation (MUSKETEER) [69] model suggests to use a series of coarsening-
uncoarsening operations on graph Laplacian matrix L, together with editing the coarsened state of
the graph. Starting with an initial graph G, a sequence of repeatedly coarsened graphs {Gi }ki=1is
obtained as Li+1 = (Pi )T LiPi . Matrix Pi encodes the connection between the nodes of Giand the
nodes of its coarsened version Gi+1. Briefly, several nodes are aggregated in one, called seed node.
The seed nodes ofGiare selected based on their degree and then whether they have a seed neighbor.
The rest nodes are aggregated with their closest seeds. Pair of aggregates becomes connected iff
any of their constituents were connected. After coarsening to Gk, the uncoarsening process begins.
At each level, the current graph Giis edited: some random edges are removed then several new
ones are inserted. The same process is performed for the nodes. A newly added node imitates one
of the existing nodes, i.e., it copies the structure aggregated within that node. A new edge (u,v) isadded by randomly picking a node u and choosing a node v , such that the distance between them
equals to d . Distance d is sampled from the empirical distribution of such distances in the graph
Gi: for each edge (u,v) the shortest path (except the edge itself) length from u to v is measured.
The number of new edges to add is chosen such that to approximately preserve DD. The edited
graph version Giis then uncoarsened to Gi−1
. The editing rates at each level are free parameters,
which control the extent of modification and, scaling factor (if the addition rate exceeds the deletion
rate). Experiments showed that MUSKETEER was able to reproduce features based on the degree
(average degree, assortativity) and distance (average eccentricity, distance, harmonic distance, and
betweenness centrality).
In ERGG [44], the editing occurs at the level of vector representation of its nodes (Figure 13). An
input graph is firstly embedded into vector space, such that a special score function s(®ri , ®r j ) is highfor edges i → j and low for non-edge pairs. The distribution of node vectors ®ri ∼ R is supposed
to encode graph features. New node vectors ®r ′i corresponding to nodes of a new graph are then
sampled from R by resampling known vectors ®ri and adding small Gaussian noise. Finally, the new
nodes are connected according to s(®r ′i , ®r′j ) values computed for their node vectors. The extent of
graph modification could be slightly controlled by the noise magnitude. Experiments show that
ERGG, besides reproducing main graph features, provides variability of graphs, that are generated
from one input graph, close to natural variability within a domain [45].
3This is the consequence of the aforementioned ergodicity property. Edge switching makes reachable all possible graphs
with the same degree sequence. Means that any other graph metrics can take arbitrary values. However, it depends on how
a fixed degree sequence determines the other graph features.
, Vol. 1, No. 1, Article . Publication date: July 2019.
:27
4.3 Domain-specific classUsually, RG models are designed for simple graphs and directed graphs. Some approaches for
simple graphs are adapted for directed edges case; one of minor interest is a support of multiple
edges, self-loops, etc. They sometimes arise as a byproduct in some models. For example, although
SKG takes a simple directed graph as input, its generating process produces multiple edges, which
are then removed. Therefore, SKG concept implicitly supports such a property. Other approaches
are not so flexible. For instance, if the edge probability is based on the geometric distance between
nodes, one needs additional mechanisms to model self-loops.
In practice, the types of graphs different from the simple one are important. Bipartite graphs
which reflect affiliation and authorship networks, attributed graphs where nodes and edges could
have labels, and so on. The domain-specific class is supposed to cover all RG modeling concepts that
aimed at producing all types of graphs except simple directed ones. Domain specificity includes:
mentioned non-standard edge types, presence of attributes on nodes or edges, special kinds of
graphs like bipartite, planar, and so on.
Despite that the defined class is very vast, we consider only two widely used categories: graphs
with communities, very popular in the social domain and graphs with weighted edges, widespread
in many domains [15].
4.3.1 Community structure. Complex networks often have groups of more densely connected
nodes, called communities. The notion of the community originates from social networks where
users unite in groups of common interests, occupation, geography, etc. But community structure
also presents in other graph domains. For instance, in protein interaction networks, communities
correspond to proteins with similar functionality, in citation networks, nodes group by research
topic. Community structure reflects a mesoscale map of network topology and demonstrates its
own specific patterns. Last decades, there is considerable interest in community detection methods
and in developing accurate models for graphs with community structures.
In this category, we focus on methods for producing explicit community structure in graphs.
The concept is to supply each graph node with a label indicating to which communities the node
belongs to. Further, we describe models exploiting this concept. Although we consider this single
concept in the category, the approaches for generating graphs with community structure based on
this concept could be divided to generative and feature-driven ones4, according with the described
classes.
Generative approaches. The first step is to define community labels for the nodes. Then, a usual
generative pipeline, where edge probability Pi j depends on node labels ci and c j , is applied.Simplest approaches are based on generating and connecting groups of ER graphs, corresponding
to separate communities, with different edge probabilities (Figure 14). Communities could be
separate (Girvan-Newman model [63]), intersecting [129], and could form a hierarchy [8]. In a
BTER model [130], a group of ER blocks is combined with custom node DD. After connecting the
nodes within the blocks according to the ER model, "excess" node degrees (equal the wished degree
di minus real degree within its block, if positive) are used for linking between the blocks using the
Expected degree (Chung Lu) model.
Amore complexmodel of assigning nodes to communities is suggested in a Community-affiliation
graph model (AGM) [151]. Its first part is a bipartite affiliation graph B(N ,C,M), whose edgesMindicate to which communitiesC the nodes N belong to (Figure 15). The second part of AGM defines
edge generation model. Probabilities {pc } are defined for each community c ∈ C and are used to
4They are not the subcategories of ‘community structure’ category, because here we consider approaches to creating a
community structure, while ‘generative’ and ‘feature-driven’ relate to modeling a graph.
, Vol. 1, No. 1, Article . Publication date: July 2019.

:28 Mikhail Drobyshevskiy and Denis Turdakov
Fig. 14. Community structure, modeledas a group of ER graphs with differ-ent edge probabilities (Girvan-Newmanmodel, SBM). (Picture from [1])
Fig. 15. Bipartite affiliation graph determines the association be-tween nodes and communities (AGM, LFR). Picture from http:
//snap.stanford.edu/agm/ .
specify the edge probability: Pi j = 1 −∏
c ∈Zi j (1 − pc ), where Zi j is a set of common communities
for nodes i and j. This model provides important properties of real communities: Pi j increases asZi j increases; the edge density is higher in the intersection of the communities; number of edges
mc in a community c grows super-linearly with its size; community hubs are more likely located in
community intersections. In practice, the affiliation graph B is constructed using a Configuration
model, once node membership sequence and community size sequence are specified.
The bipartite affiliation graph is also used in a series of LFR benchmarks [89], which provides
more flexibility in parameters tuning. A topological mixing parameter µ is introduced, which
controls relative edge density within communities. The internal node degree dini is defined as the
number of its neighbors sharing at least one community. Its expected value is dini = (1 − µ)di . Toachieve this, after forming links within communities, the edge switching procedure is applied.
Feature-driven approaches. In the feature-driven approaches, node community labels are defined
based on a given graph.
SBM [41] could be employed to fit a real network without ground-truth community structure.
It defines a number of groups Q , prior group probabilities pq , and a matrix P of inter-group edge
probabilities. The parameters could be estimated, for example, via EM algorithm within the ERGM
framework [41]. Similar fitting approach is given in the Latent position cluster (LPC) model [71],
which uses the concept of unobserved social space. Communities are represented by a mixture of
multivariate normal distributions of points in this space, edge probability depends on euclidean
distance: Pi j ∼ e−βdist (i, j). Parameters are then estimated via likelihood maximization or MCMC
sampling.
An alternative way is to find communities in an input graph using one of community detection
methods and reproduce them in a random graph. In the ReCoN [134] method, the first step is to
detect communities in a given graph. Then the graph with the detected communities is just copied.
Finally, the edges are rewired within communities and between the replicas. As a result, the number
of communities multiplies by a scaling factor.
In ERGG [44], an input graph is assumed to have community labels. Due to the mapping of
the graph nodes into vectors and sampling new node vectors from the existing ones, the new
nodes inherit community labels from the nodes in a proper way. Since labels could attribute to
, Vol. 1, No. 1, Article . Publication date: July 2019.

:29
multiple communities, overlapping community structure is supported. As a result, the number of
communities remains constant while their sizes change proportionally to a scaling factor.
4.3.2 Weighted edges. Edge weights naturally appear in complex networks: they could express
the strength of ties in a social network, flux amount in a metabolic reaction, gene co-expression
measure, etc. Multiple edges in the graph could also be interpreted as integer weights. Many metrics
and concepts generalize to weighted graphs, including shortest path length, clustering, modularity
measures. Considering of weighted graphs brings new aspects to the existing network tasks such
as community detection [113].
One way to get a weighted edge is to treat multi-edges as weighted ones. In RTG [3] model, based
on a random character sequence, each next repetition of the same pair of words increments the
corresponding edge weight. It leads to the power law of node strength dependence on its degree:
si ∼ dβi . The RTG algorithm also provides the total weight power law,W (t) ∼m(t), and self-similar
weight addition.
In the LFR [89] benchmark, the weights are assigned to the edges, such that for each node
i , the expected node strength is si ∼ dβi . Node internal strength sini (the strength computed for
community neighbors only) is controlled by a mixing parameter µ: sini = (1− µ)si . These conditionsare achieved by a greedy algorithm which iteratively modifies the edge weights wi j in order to
minimize the quadratic variance of all si , sini , and si − sini summed up over all the nodes.
5 DISCUSSIONIn this section, we discuss the taxonomy presented in the previous section and outline how it works
at various RG applications.
5.1 Taxonomy discussionRelation of concepts and models. If we tried to build a taxonomy of RG models, it would be a huge
branching tree, where similar concepts would repeat many times. Moreover, it is hard to classify
models themselves, since they often mix different approaches. This is why some models appear in
several categories of the taxonomy.
Our taxonomy presents and classifies the main concepts used in the RG models. We consider
how the models combine these concepts. For that, we compare the models, based on two or
more concepts, in a Table 4. One can see that models can exploit up to six concepts in various
combinations. ERGG [44] is an algorithm which uses parameter estimation technique to learn
the geometrical representation, then the copying and editing mechanisms to scale and randomize
graph, and produces community labels and edge weights (although just using copying again). Forest
Fire [93] model employs three generative mechanisms together: copying in- and out-links of a
chosen node, the local rules while determining the unvisited neighbors to decide where to proceed
the burning process, and the recursive principle when repeating the same procedure at each node.
Although the table is small, we computed correlations between its columns (marked cells were
treated as ones, empty cells were treated as zeros). Figure 16 represents the correlation matrix for
categories that show the highest or lowest correlations. High correlation means that concepts are
well compatible. Low correlation means the opposite. One can see that the ‘copying’ concept is
mixed well with ‘other local rules’ (0.72) and ‘other editing’ (0.57), which could correspond to the
evolutionary principle of copying with mutations. ‘Simple’ approach is popular within ‘ERGM’
framework (0.54 and for creating community structure (0.50).
Being at the opposite side of the list, low correlations may indicate that concepts are incompatible
or were not used together for some reason. ‘Community structure’ combines poorly with ‘recursive’
approaches (-0.63), which could seem strange, because it is known that recursive graph structure is
, Vol. 1, No. 1, Article . Publication date: July 2019.

:30 Mikhail Drobyshevskiy and Denis Turdakov
Table 4. Popular random graph models (rows) combining concepts (columns) from several classes — markedas ’✓’ in corresponding cells. Colors correspond to classes: blue for Generative, green for Feature-driven, redfor Domain-specific.
simple(ER)
PA
copying
otherlocalrules
recursive
geometry
nodelabeling
topologyfrom
optimization
analytical
parametersestimation
ERGM
edgeswitching
otherediting
communitystructure
weightededges
R-MAT [34] ✓ ✓SKG [92] ✓ ✓ ✓MFNG [119] ✓ ✓ ✓RTG [3] ✓ ✓ ✓Forest Fire [93] ✓ ✓ ✓GScaler [156] ✓ ✓MUSKETEER [69] ✓ ✓ ✓ ✓LPC [71] ✓ ✓ ✓ ✓Girvan-Newman [63] ✓ ✓ ✓BTER [130] ✓ ✓ ✓ ✓AGM [151] ✓ ✓ ✓LFR [89] ✓ ✓ ✓ ✓ReCoN [134] ✓ ✓ ✓SBM [41] ✓ ✓ ✓ ✓ERGG [44] ✓ ✓ ✓ ✓ ✓ ✓GIRG [27] ✓ ✓Dot-product [117] ✓ ✓BRITE [100] ✓ ✓
related to its hierarchical community structure. However, the explanation could be that current
recursive generativemechanisms (recall SKG, RTG, Forest Fire) fail to produce an explicit community
structure with the desired features. Perhaps, the bottleneck is parameters fitting, because both
graph features and community features must be fitted. SKG and MFNG already have intricate
fitting procedures, satisfying all the conditions is too complex. The next elements with the lowest
correlations are ‘node labeling’ with ‘copying’ (-0.62) and ‘other local rules’ (-0.45), — are harder to
explain. Perhaps, such combinations exist but are under-represented in our collection, or wait to be
discovered.
Choice of categories and generality of the taxonomy. The number of classes in the taxonomy is
somewhat arbitrary. While the Generative and Feature-driven classes are intended to cover all
models of simple and directed graphs, the lowest level categories still unite many approaches and
could be specified further. For instance, recursive approaches can be deterministic or stochastic,
geometric approaches may contain a subcategory ‘hyperbolic geometry’ due to a large number
, Vol. 1, No. 1, Article . Publication date: July 2019.

:31
simple
copying
other local rulesrecursiv
egeometry
node labelingERGM
other editing
community
structure
simple
copying
other local rules
recursive
geometry
node labeling
ERGM
other editing
communitystructure
-0.28
-0.20 0.72
-0.32 0.09 0.32
-0.28 -0.11 -0.28 -0.44
0.15 -0.62 -0.45 0.24 -0.12
0.54 -0.15 -0.11 -0.17 -0.15 -0.24
-0.16 0.57 0.32 0.12 0.18 -0.35 -0.09
0.50 -0.06 -0.40 -0.63 -0.06 0.00 0.27 0.040.8
0.4
0.0
0.4
0.8
Fig. 16. Correlations of several concepts co-occurrence in RG models. Computed based on table 4. Categorieswith all correlations close to 0 are excluded.
of works devoted to hyperbolic random graphs. On the other hand, the RG models often use a lot
of various heuristics that are hard to classify and potentially could form their subcategories. For
example, refer to ‘other local rules’ section, where rules of neighbor choosing or triadic formation
could be differentiated. Therefore, we chose three levels of abstraction as a kind of a compromise
for concepts granularity.
Several categories, namely ‘other local rules’, ‘other editing’, and ‘node labeling’ serve as con-
tainers for approaches not present in other categories of that class. For example, ‘node labeling’
corresponds to those methods based on node attributes that are not geometric — there are not so
many concepts, according to our knowledge.
Speaking about the taxonomy generality, we designed the three classes to cover the main
directions of RG modeling. Generative and Feature-driven classes are described in details and
well-structured. We assume that they reflect the state-of-affairs in modeling simple and directed
graphs. In the domain-specific class we include only 2 most popular cases and decided to leave the
rest out of scope. Since there exist many other specific types of graphs, the third class structure is
far from complete.
New concepts, as well as those we missed, are supposed to fall into an existing (sub)category
or form a new one in one of the classes. Regarding the emergence of new concepts, it seems that
generative class of approaches exhausts itself. Main network formation mechanisms are already
invented and described in the literature. The further progress is expected from the feature-driven
approaches. The main challenges of RG modeling concern better fitting a model to a given graph,
creating of fast and simple procedures of graph sampling. Perspective future directions could be:
graph editing based on graph representation learning; methods for generation of very large graphs
with billions of edges.
Finally, we suppose that clarifying of the concepts that proved their workability in the RG
modeling will promote the development of new models. However, a new model is not merely a mix
, Vol. 1, No. 1, Article . Publication date: July 2019.

:32 Mikhail Drobyshevskiy and Denis Turdakov
of several concept stubs, it is usually aimed at answering a practical challenge. Now we discuss
which concepts are successful at which tasks.
5.2 Applications of random graph modelingWe identify six directions, where RG models have their applications: networks understanding,
analysis, extrapolating, benchmarks, null models, and randomization. Further, we show how the
concepts, described in the previous section, are applied to solve problems occurring in these areas.
The results are generalized in table 5.
5.2.1 Understanding. Discovering new topological patterns in real networks posed a need to
explain their emergence. If a hypothesized generative mechanism produces graphs with the same
patterns, it could underlie the real processes of the network formation. Therefore, all concepts from
Generative class are potential explanations of network formation. The preferential attachment rule,
being coupled with nodes addition, generates the scale-free topology, has intuitive interpretations.
A new person joining a social network more likely makes a connection to a hub. A new web page
is more likely to link to a page with many links. The same for scientific papers citing. Another well
demonstrative example is copying principle. Copying edges of a node corresponds to inheriting
citation links in citation networks and WWW, genes duplication in biological networks, and so
on. Node attributes based linking is consistent with the homophilic attraction of similarities. A
recursive procedure is connected to self-similarity, and its workability could indicate that the same
simple laws govern networks formation at different scales. Works on obtaining topologies resulting
from optimization tasks, evidence that network structures emerge in a way to be optimal in some
sense.
Feature-driven statistical models such as ERGMs also contribute to the understanding of complex
networks by the following reasons. ERGM framework is used to test, how various graph statistics
could explain the observed structure. The model that fits best (in some sense) to the real network
indicates what features are most important to explain the network architecture [133]. The stochastic
model can capture not only regularities in a graph, but also variabilities of its properties. Being fitted
to a real graph, the model gives a picture of the distribution of possible observable outcomes [126].
Several features could have more than one explanation. For instance, the high CC could be caused
by homophily or could emerge from self-organizing structural effects. A model combining both
effects helps to estimate the contributions of both alternatives quantitatively [126].
5.2.2 Analysis. Simple models, such as ER with edge probability depending on graph size p(n),were deeply studied on their evolution behaviour, i.e., when n tends to infinity. Various kinds
of phase transitions were discovered, e.g., the emergence of a giant connected component and
triangles [124]. It motivated to study robustness of networks like the Internet, communication nets,
etc., in terms of resilience to attacks like random or intended removing of nodes or edges [30].
In order to analyze processes taking place on networks: the spread of information or epidemics
in social networks; flows in transportation networks and the Internet; economic transactions,
and so on, one needs to perform simulation studies. Since the topology of interactions is crucial
for processes dynamics, therefore a need for realistic graph models [31]. According to review of
publications in JASSS (1998 – 2015) Frédéric Amblard et al. [6], the majority of works actually use
very simple models: regular lattices, random graphs, small-world networks or scale-free network.
Authors suggest three perspectives for social network models:
• Abstract models, like Forest Fire [93], reproducing a lot of the known properties. These
correspond to our Generative class of approaches. Benchmarks like LFR [89] are promising
to employ community structure for populations modeling.
, Vol. 1, No. 1, Article . Publication date: July 2019.

:33
Table 5. How concepts (columns) from the taxonomy work in six random graph application directions (rows),described in section 5.2. If the application area involves RG models employing the concept, the correspondingcell is marked as ’✓’. Colors correspond to taxonomy classes: blue for Generative, green for Feature-driven,red for Domain-specific.
simple(ER)
PA
copying
otherlocalrules
recursive
geometry
nodelabeling
topologyfrom
optimization
analytical
parametersestimation
ERGM
edgeswitching
otherediting
communitystructure
weightededges
understanding ✓ ✓ ✓ ✓ ✓ ✓ ✓ ✓ ✓analysis ✓ ✓ ✓ ✓ ✓ ✓ ✓ ✓ ✓ ✓ ✓ ✓ ✓extrapolating ✓ ✓ ✓ ✓ ✓ ✓ ✓ ✓ ✓ ✓benchmarks ✓ ✓ ✓ ✓ ✓ ✓ ✓ ✓null models ✓ ✓ ✓ ✓ ✓ ✓randomization ✓ ✓ ✓
• Models able to fit a given network sample, e.g., ERGMs and SKG [92]. In our case, this concept
is described in the ‘fitness optimization’ category.
• Rule-based approach, where a population is generated using Bayesian rules and then a graph
is constructed by specifying nodes matching rules, for example in work of S. Thiriot and
J.-D. Kant [137]. This approach is reflected in categories ‘latent attributes’ and ‘local rules’.
5.2.3 Extrapolating. The Internet, social networks, and other graphs grow over time, which
raises questions, like ‘will the Internet protocol work over five years?’, or ‘how will Facebook look
like in future?’ To answer these questions, one needs algorithms for scaling an existing graph to a
larger size. Moreover, graphs of interest are themselves already large, billions of nodes of order,
which impose severe constraints on the algorithms complexity and memory usage. The problem is
generally addressed in two ways: a generative process capturing the needed features and producing
graphs of custom size or a method for scaling up a given graph.
From the Generative class, ‘recursive’, ‘latent attributes’ and ‘copying’ concepts have the most
success. Recursive matrix multiplication (SKG [92], MFNG [119], TrillionG [120]) is elegant but
needs a fast algorithm for graph construction, since O(n2) generation time may be impractical
in case of very large graphs. Moreover, recursion in these algorithms often implies too discrete
graph size n = nk0which needs some workaround. Copying principle is employed at different levels:
from replication of nodes with edge stubs (GScaler [156]) to copying of whole communities and
graph itself (ReCoN [134]), and copying vector representations of nodes (ERGG [44]). Imitating of
features of the graph, normally requires either model parameters fitting (SKG, MFNG, ERGG), or
special heuristics to tune construction process towards the desired properties (GScaler). However,
the other approaches from ‘latent attributes’ category like hyperbolic or dot-product graphs are
promising candidates. Perhaps, they just lack their fitting procedures.
, Vol. 1, No. 1, Article . Publication date: July 2019.
:34 Mikhail Drobyshevskiy and Denis Turdakov
A non-generative way of scaling up a graph assumes its modification, increasing the graph size.
For instance, a series of coarsening and then a longer series of uncoarsening procedure leads to a
larger version of the graph (MUSKETEER [69]). In a more naive case, a graph with communities is
multiplied and its edges are rewired (ReCoN). Note that both examples are based on copying.
5.2.4 Benchmarks. There is a wide range of network mining tools and algorithms being actively
developed in various network domains. Examples vary from metric calculators (like diameter,
modularity) to topology inference (link prediction, etc.) [5, 14, 116]. Reliable testing of these methods
is complicated or even impossible due to the lack of proper test data. For instance, significance
testing requires a representative set of graphs providing realistic variability of their features, while
for scalability testing, one needs a series of similar graphs of different sizes [44]. The answer could
be benchmark random graphs tailored for specific cases.
The representativeness of the sample is of main importance for significance testing. A per-
fect solution could be ERGMs, since they define graph probability space with theoretically any
constraints on its statistics. Unfortunately, in practice, current approaches suffer from serious
computational issues. Controllable edge switching within MCMC sampling framework can be used
to achieve graphs with desired feature ranges and feature distribution constraints [154], while the
degree sequence remains constant. Less strict in features, but providing controllable variability of
generated graphs, is a recursive SKG model with dependent edge sampling [106]. The same for
the copying based ERGG [44], where the magnitude of noise added to the learned node vectors,
encodes variability of result graphs.
Scalability testing implies a generator of graphs of controlled size. If similarity to a given graph
is required, the problem reduces to the extrapolating task, possibly with a scale factor less than 1.
If the particular topology is not important, any algorithm from the Generative class, capable of
producing features of interest, is of use. Computational and memory issues arise here when the
size of graphs become very large. Quadratic time algorithms are impractical with over a million
nodes. Acceptable complexity is O(n logn) or linear to the number of edges O(m), which means
that some techniques, such as pairwise nodes matching, are eliminated. Solutions for large graphs
could be to adapt existing algorithms (ROLL [70]: speed up of PA), approximate them, or develop
their distributed versions [101]. Distributed algorithms allow to achieve graph with billions of
nodes in CKB [37] and trillions of edges in Darwini [49].
Of special interest are random graphs with communities, especially for social networks emulating.
The analytical approach is employed to implement a rich set of parameters describing DD and com-
munity features. The Configuration model for realizing DD and edge switching for randomization
is used in the LFR benchmark [89]. Distributed algorithms are also actual here [37, 49].
5.2.5 Null models. Null models serve for accurate hypothesis testing, providing a dataset with
well controllable features. In the context of complex networks, one can learn what patterns are
specific to the given network, compared to some common distribution. The null model allow
quantifying how much the network is different from a random one (null hypothesis). For example,
to evaluate the statistical significance of the edge reciprocity or the observed number of common
neighbors of two nodes [157].
The most popular random graph null model is the Configuration model which specifies a uniform
distribution over all graphs with the same degree sequence. It is widely employed to explore network
patterns in sociology, ecology, systems biology and other domains, refer to B. K. Fosdick [58] for a
review. For example, detecting network motifs as over-represented subgraphs [102], or serving as
a null model against which the modularity is measured [115]. Uniform sampling of graphs with
fixed degree sequence is efficiently performed via MCMC sampling techniques based on the edge
switching [58].
, Vol. 1, No. 1, Article . Publication date: July 2019.
:35
An alternative null model could be Chung-Lu model which sets the expected node degrees
di instead of fixed ones, with the edge probability Pi j ∼ didj . Its use is related to a community
detection method based on SBMs [78].
5.2.6 Randomization. Sharing graph datasets can be problematic if a graph contains private
information. There is a need to randomize the graph in a way to avoid the leak of confidential
information and at the time to preserve its important topological features. It was shown that the
simple relabeling of nodes identifiers does not guarantee the safety [10]. Possible attacks include
active and passive attacks. An active attack could be the introducing of ’sybil’ nodes with a specific
distinguishable configuration into a prior graph in order to discover it after randomization. A
passive attack can occur when a user could de-anonymize himself using knowledge of near network
topology or some auxiliary information like aggregated social networks [108].
Generally, RG models can help the anonymization in two ways: generate a graph, thoroughly
repeating the patterns of the original one, or randomize the origin via graph editing methods.
Although generative algorithms face the fitting problem, they are potentially more reliable since
the mapping between original nodes and generated nodes is absent. Anonymization corresponds
to extrapolation with scaling factor of 1. Therefore, all solutions could potentially be employed.
However, a more widespread technique is randomization via graph editing. Edge switching is
relatively fast and easy to implement, although it violates all features except degree sequence.
Nevertheless, edge switching under constraints (e.g., preserving chosen spectral features), combined
with random edge addition and deletion, is claimed to protect edge privacy [153]. The dK-randomgraph model is also used to capture graph patterns. Measured dK-distributions are then perturbed
to enforce differential privacy [47] guarantees, and a new graph is generated according to the new
dK-distributions [145].Following the review of Shouling Ji et al. [77], other randomization approaches include k-
anonymity (where each node in the graph to be published has k − 1 symmetric nodes), cluster-
based anonymization (graph structure is preserved at the level of clusters ignoring their inner
configuration), Random Walk based anonymization (edge (u,v) is replaced with (u,w) wherew is
destination of random walk from u), and others.
6 SUMMARYIn the survey, we presented a novel view on random graph modeling approaches. We detected
main concepts used in RG models and organized them into a hierarchical taxonomy, consisting
of three classes: Generative, Feature-driven, and Domain-specific. We hope that the taxonomy of
concepts will help researchers to orient in an enormous amount of existing RG models and develop
their models based on the experience of previous work. Although these classes cover existing
approaches, we considered only two categories in the Domain-specific class. Due to a wide variety
of graph types, this class could be significantly extended. An interesting and promising direction
for future work is the deep neural networks for RG modeling.
REFERENCES[1] Abbe, E. Community detection and stochastic block models: recent developments. The Journal of Machine Learning
Research 18, 1 (2017), 6446–6531.[2] Aiello, W., Chung, F., and Lu, L. A random graph model for massive graphs. In Proceedings of the thirty-second
annual ACM symposium on Theory of computing (2000), Acm, pp. 171–180.
[3] Akoglu, L., and Faloutsos, C. Rtg: a recursive realistic graph generator using random typing. In Joint EuropeanConference on Machine Learning and Knowledge Discovery in Databases (2009), Springer, pp. 13–28.
[4] Albert, R., and Barabási, A.-L. Statistical mechanics of complex networks. Reviews of modern physics 74, 1 (2002),47.
, Vol. 1, No. 1, Article . Publication date: July 2019.

:36 Mikhail Drobyshevskiy and Denis Turdakov
[5] Alessandro, V., and Guido, C. Large scale structure and dynamics of complex networks: from information technologyto finance and natural science, vol. 2. World Scientific, 2007.
[6] Amblard, F., Bouadjio-Boulic, A., Gutiérrez, C. S., and Gaudou, B. Which models are used in social simulation to
generate social networks? a review of 17 years of publications in jasss. In Winter Simulation Conference (WSC), 2015(2015), IEEE, pp. 4021–4032.
[7] An, W. Fitting ergms on big networks. Social science research 59 (2016), 107–119.[8] Arenas, A., Díaz-Guilera, A., and Pérez-Vicente, C. J. Synchronization reveals topological scales in complex
networks. Physical review letters 96, 11 (2006), 114102.[9] Avin, C., Lando, Y., and Lotker, Z. Radio cover time in hyper-graphs. In Proceedings of the 6th international
workshop on foundations of mobile computing (2010), ACM, pp. 3–12.
[10] Backstrom, L., Dwork, C., and Kleinberg, J. Wherefore art thou r3579x?: anonymized social networks, hidden
patterns, and structural steganography. In Proceedings of the 16th international conference on World Wide Web (2007),ACM, pp. 181–190.
[11] Bansal, S., Khandelwal, S., and Meyers, L. A. Exploring biological network structure with clustered random
networks. BMC bioinformatics 10, 1 (2009), 405.[12] Barabási, A.-L., and Albert, R. Emergence of scaling in random networks. science 286, 5439 (1999), 509–512.[13] Barabási, A.-L., Ravasz, E., and Vicsek, T. Deterministic scale-free networks. Physica A: Statistical Mechanics and
its Applications 299, 3-4 (2001), 559–564.[14] Barrat, A., Barthèlemy, M., and Vespignani, A. Dynamical Processes on Complex Networks. Cambridge University
Press, 2008.
[15] Barthélemy, M., Barrat, A., Pastor-Satorras, R., and Vespignani, A. Characterization and modeling of weighted
networks. Physica a: Statistical mechanics and its applications 346, 1-2 (2005), 34–43.[16] Bender, E. A., and Canfield, E. R. The asymptotic number of labeled graphs with given degree sequences. Journal
of Combinatorial Theory, Series A 24, 3 (1978), 296–307.[17] Benson, A. R., Riqelme, C., and Schmit, S. Learning multifractal structure in large networks. In Proceedings of the
20th ACM SIGKDD international conference on Knowledge discovery and data mining (2014), ACM, pp. 1326–1335.
[18] Berger, N., Borgs, C., Chayes, J. T., D’Souza, R. M., and Kleinberg, R. D. Competition-induced preferential
attachment. In International Colloquium on Automata, Languages, and Programming (2004), Springer, pp. 208–221.
[19] Bernovskiy, M., and Kuzyurin, N. Random graphs, models and generators of scale-free graphs. Proceedings of theInstitute for System Programming of the RAS 22 (2012).
[20] Boccaletti, S., Bianconi, G., Criado, R., Del Genio, C. I., Gómez-Gardenes, J., Romance, M., Sendina-Nadal, I.,
Wang, Z., and Zanin, M. The structure and dynamics of multilayer networks. Physics Reports 544, 1 (2014), 1–122.[21] Bollobás, B. Random Graphs. No. 73. Cambridge University Press, 2001.
[22] Bollobás, B., Borgs, C., Chayes, J., and Riordan, O. Directed scale-free graphs. In Proceedings of the fourteenth annualACM-SIAM symposium on Discrete algorithms (2003), Society for Industrial and Applied Mathematics, pp. 132–139.
[23] Bollobás, B., and Riordan, O. M. Mathematical results on scale-free random graphs. Handbook of graphs andnetworks: from the genome to the internet (2003), 1–34.
[24] Bonato, A. A course on the web graph, vol. 89. American Mathematical Soc., 2008.
[25] Bonato, A. A survey of properties and models of on-line social networks. In Proc. of the 5th International Conferenceon Mathematical and Computational Models, ICMCM (2009), Citeseer.
[26] Bordino, I., Donato, D., Gionis, A., and Leonardi, S. Mining large networks with subgraph counting. In 2008Eighth IEEE International Conference on Data Mining (2008), IEEE, pp. 737–742.
[27] Bringmann, K., Keusch, R., and Lengler, J. Geometric inhomogeneous random graphs. arXiv preprintarXiv:1511.00576 (2016).
[28] Brouwer, A. E., and Haemers, W. H. Spectra of graphs. Springer Science & Business Media, 2011.
[29] Caldarelli, G. Scale-Free Networks: Complex Webs in Nature and Technology. Oxford University Press, 01 2007.
[30] Callaway, D. S., Newman, M. E., Strogatz, S. H., and Watts, D. J. Network robustness and fragility: Percolation
on random graphs. Physical review letters 85, 25 (2000), 5468.[31] Castellano, C., Fortunato, S., and Loreto, V. Statistical physics of social dynamics. Reviews of modern physics 81,
2 (2009), 591.
[32] Chakrabarti, D., and Faloutsos, C. Graph mining: Laws, generators, and algorithms. ACM computing surveys(CSUR) 38, 1 (2006), 2.
[33] Chakrabarti, D., and Faloutsos, C. Graph Mining: Laws, Tools, and Case Studies. Synthesis Lectures on Data
Mining and Knowledge Discovery. Morgan & Claypool Publishers, 2012.
[34] Chakrabarti, D., Zhan, Y., and Faloutsos, C. R-mat: A recursive model for graph mining. In Proceedings of the2004 SIAM International Conference on Data Mining (2004), SIAM, pp. 442–446.
[35] Chung, F., and Lu, L. The average distances in random graphs with given expected degrees. Proceedings of the
, Vol. 1, No. 1, Article . Publication date: July 2019.

:37
National Academy of Sciences 99, 25 (2002), 15879–15882.[36] Chung, F., and Lu, L. Connected components in random graphs with given expected degree sequences. Annals of
combinatorics 6, 2 (2002), 125–145.[37] Chykhradze, K., Korshunov, A., Buzun, N., Pastukhov, R., Kuzyurin, N., Turdakov, D., and Kim, H. Distributed
generation of billion-node social graphs with overlapping community structure. In Complex Networks V. Springer,2014, pp. 199–208.
[38] Coolen, T., Annibale, A., and Roberts, E. Generating random networks and graphs. Oxford University Press, 2017.
[39] Costa, L. d. F., Rodrigues, F. A., Travieso, G., and Villas Boas, P. R. Characterization of complex networks: A
survey of measurements. Advances in physics 56, 1 (2007), 167–242.[40] Davidsen, J., Ebel, H., and Bornholdt, S. Emergence of a small world from local interactions: Modeling acquaintance
networks. Physical Review Letters 88, 12 (2002), 128701.[41] Decelle, A., Krzakala, F., Moore, C., and Zdeborová, L. Asymptotic analysis of the stochastic block model for
modular networks and its algorithmic applications. Physical Review E 84, 6 (2011), 066106.[42] Dorogovtsev, S. N., Goltsev, A. V., and Mendes, J. F. F. Pseudofractal scale-free web. Physical review E 65, 6 (2002),
066122.
[43] Dorogovtsev, S. N., and Mendes, J. F. Evolution of networks: From biological nets to the Internet and WWW. OUP
Oxford, 2003.
[44] Drobyshevskiy, M., Korshunov, A., and Turdakov, D. Learning and scaling directed networks via graph embedding.
In Joint European Conference on Machine Learning and Knowledge Discovery in Databases (2017), Springer, pp. 634–650.[45] Drobyshevskiy, M., Turdakov, D., and Kuznetsov, S. Reproducing network structure: A comparative study of
random graph generators. In Ivannikov ISPRAS Open Conference (ISPRAS), 2017 (2017), IEEE, pp. 83–89.
[46] Durrett, R. Random graph dynamics, vol. 200. Cambridge university press Cambridge, 2007.
[47] Dwork, C. Differential privacy: A survey of results. In International Conference on Theory and Applications of Modelsof Computation (2008), Springer, pp. 1–19.
[48] Ebel, H., Mielsch, L.-I., and Bornholdt, S. Scale-free topology of e-mail networks. Physical review E 66, 3 (2002),035103.
[49] Edunov, S., Logothetis, D., Wang, C., Ching, A., and Kabiljo, M. Darwini: Generating realistic large-scale social
graphs. arXiv preprint arXiv:1610.00664 (2016).[50] Edward M. Lazzarin, R. J. An overview of the analysis of online social networks. ? (2011).[51] Eikmeier, N., and Gleich, D. F. Revisiting power-law distributions in spectra of real world networks. In Proceedings
of the 23rd ACM SIGKDD International Conference on Knowledge Discovery and Data Mining (2017), ACM, pp. 817–826.
[52] Erdős, P., and Rényi, A. On random graphs i. Publ. Math. Debrecen 6 (1959), 290–297.[53] Erdős, P., and Rényi, A. On the evolution of random graphs. Publ. Math. Inst. Hung. Acad. Sci 5, 1 (1960), 17–60.[54] Fabrikant, A., Koutsoupias, E., and Papadimitriou, C. H. Heuristically optimized trade-offs: A new paradigm for
power laws in the internet. In International Colloquium on Automata, Languages, and Programming (2002), Springer,
pp. 110–122.
[55] Faloutsos, M., Faloutsos, P., and Faloutsos, C. On power-law relationships of the internet topology. In ACMSIGCOMM computer communication review (1999), vol. 29, ACM, pp. 251–262.
[56] Fang, Z., Wang, J., Liu, B., and Gong, W. Double pareto lognormal distributions in complex networks. In Handbookof Optimization in Complex Networks. Springer, 2012, pp. 55–80.
[57] Faragó, A. Structural properties of random graph models. In Proceedings of the Fifteenth Australasian Symposium onComputing: The Australasian Theory-Volume 94 (2009), Australian Computer Society, Inc., pp. 131–138.
[58] Fosdick, B. K., Larremore, D. B., Nishimura, J., and Ugander, J. Configuring random graph models with fixed
degree sequences. SIAM Review 60, 2 (2018), 315–355.[59] Friedrich, T., and Krohmer, A. On the diameter of hyperbolic random graphs. SIAM Journal on Discrete Mathematics
32, 2 (2018), 1314–1334.[60] Frieze, A., and Karoński, M. Introduction to random graphs. Cambridge University Press, 2015.
[61] Gilbert, E. N. Random graphs. The Annals of Mathematical Statistics 30, 4 (1959), 1141–1144.[62] Gilbert, G., and Hamill, L. Social circles: A simple structure for agent-based social network models. Journal of
Artificial Societies and Social Simulation 12, 2 (2009).[63] Girvan, M., and Newman, M. E. Community structure in social and biological networks. Proceedings of the national
academy of sciences 99, 12 (2002), 7821–7826.[64] Gleich, D. F., and Owen, A. B. Moment-based estimation of stochastic kronecker graph parameters. Internet
Mathematics 8, 3 (2012), 232–256.[65] Goldenberg, A., Zheng, A. X., Fienberg, S. E., Airoldi, E. M., et al. A survey of statistical network models.
Foundations and Trends® in Machine Learning 2, 2 (2009), 129–233.[66] Goyal, P., and Ferrara, E. Graph embedding techniques, applications, and performance: A survey. Knowledge-Based
, Vol. 1, No. 1, Article . Publication date: July 2019.
:38 Mikhail Drobyshevskiy and Denis Turdakov
Systems 151 (2018), 78–94.[67] Granovetter, M. S. The strength of weak ties. In Social networks. Elsevier, 1977, pp. 347–367.[68] Gugelmann, L., Panagiotou, K., and Peter, U. Random hyperbolic graphs: degree sequence and clustering. In
International Colloquium on Automata, Languages, and Programming (2012), Springer, pp. 573–585.
[69] Gutfraind, A., Safro, I., and Meyers, L. A. Multiscale network generation. In Information Fusion (Fusion), 201518th International Conference on (2015), IEEE, pp. 158–165.
[70] Hadian, A., Nobari, S., Minaei-Bidgoli, B., and Qu, Q. Roll: Fast in-memory generation of gigantic scale-free
networks. In Proceedings of the 2016 International Conference on Management of Data (2016), ACM, pp. 1829–1842.
[71] Handcock, M. S., Raftery, A. E., and Tantrum, J. M. Model-based clustering for social networks. Journal of theRoyal Statistical Society: Series A (Statistics in Society) 170, 2 (2007), 301–354.
[72] Harris, J. K. An introduction to exponential random graph modeling, vol. 173. Sage Publications, 2013.[73] Heath, L. S., and Parikh, N. Generating random graphs with tunable clustering coefficients. Physica A: Statistical
Mechanics and its Applications 390, 23-24 (2011), 4577–4587.[74] Hernández, J. M., and Van Mieghem, P. Classification of graph metrics. Delft University of Technology, Tech. Rep
(2011), 1–8.
[75] Ivanov, O. U., and Bartunov, S. O. Learning representations in directed networks. In International Conference onAnalysis of Images, Social Networks and Texts (2015), Springer, pp. 196–207.
[76] Janson, S., Łuczak, T., and Norros, I. Large cliques in a power-law random graph. Journal of Applied Probability 47,4 (2010), 1124–1135.
[77] Ji, S., Li, W., Mittal, P., Hu, X., and Beyah, R. A. Secgraph: A uniform and open-source evaluation system for graph
data anonymization and de-anonymization. In USENIX Security Symposium (2015), pp. 303–318.
[78] Karrer, B., and Newman, M. E. Stochastic blockmodels and community structure in networks. Physical review E 83,1 (2011), 016107.
[79] Keusch, R. Geometric Inhomogeneous Random Graphs and Graph Coloring Games. PhD thesis, ETH Zurich, 2018.
[80] Kiwi, M., and Mitsche, D. A bound for the diameter of random hyperbolic graphs. In Proceedings of the Meeting onAnalytic Algorithmics and Combinatorics (2015), Society for Industrial and Applied Mathematics, pp. 26–39.
[81] Kleinberg, J. M., Kumar, R., Raghavan, P., Rajagopalan, S., and Tomkins, A. S. The web as a graph: measurements,
models, and methods. In International Computing and Combinatorics Conference (1999), Springer, pp. 1–17.[82] Kolaczyk, E. D. Statistical Analysis of Network Data: Methods and Models, 1st ed. Springer Publishing Company,
Incorporated, 2009.
[83] Kovalenko, I. Theory of random graphs. Cybernetics 7, 4 (1971), 575–579.[84] Krapivsky, P. L., and Redner, S. Network growth by copying. Physical Review E 71, 3 (2005), 036118.[85] Krioukov, D., Papadopoulos, F., Kitsak, M., Vahdat, A., and Boguná, M. Hyperbolic geometry of complex
networks. Physical Review E 82, 3 (2010), 036106.[86] Kumar, R., Raghavan, P., Rajagopalan, S., Sivakumar, D., Tomkins, A., and Upfal, E. Stochastic models for the
web graph. In Foundations of Computer Science, 2000. Proceedings. 41st Annual Symposium on (2000), IEEE, pp. 57–65.
[87] Kunegis, J. Konect: the koblenz network collection. In Proceedings of the 22nd International Conference on WorldWide Web (2013), ACM, pp. 1343–1350.
[88] Kunegis, J., Blattner, M., andMoser, C. Preferential attachment in online networks: Measurement and explanations.
In Proceedings of the 5th annual ACM web science conference (2013), ACM, pp. 205–214.
[89] Lancichinetti, A., and Fortunato, S. Benchmarks for testing community detection algorithms on directed and
weighted graphs with overlapping communities. Physical Review E 80, 1 (2009), 016118.[90] Lancichinetti, A., Fortunato, S., and Radicchi, F. Benchmark graphs for testing community detection algorithms.
Physical review E 78, 4 (2008), 046110.[91] Leskovec, J., Chakrabarti, D., Kleinberg, J., and Faloutsos, C. Realistic, mathematically tractable graph generation
and evolution, using kronecker multiplication. In European Conference on Principles of Data Mining and KnowledgeDiscovery (2005), Springer, pp. 133–145.
[92] Leskovec, J., Chakrabarti, D., Kleinberg, J., Faloutsos, C., and Ghahramani, Z. Kronecker graphs: An approach
to modeling networks. Journal of Machine Learning Research 11, Feb (2010), 985–1042.[93] Leskovec, J., Kleinberg, J., and Faloutsos, C. Graph evolution: Densification and shrinking diameters. ACM
Transactions on Knowledge Discovery from Data (TKDD) 1, 1 (2007), 2.[94] Leskovec, J., Lang, K. J., Dasgupta, A., and Mahoney, M. W. Statistical properties of community structure in large
social and information networks. In Proceedings of the 17th international conference on World Wide Web (2008), ACM,
pp. 695–704.
[95] Lovász, L. Large networks and graph limits, vol. 60. American Mathematical Soc., 2012.
[96] Mahadevan, P., Krioukov, D., Fall, K., and Vahdat, A. Systematic topology analysis and generation using degree
correlations. In ACM SIGCOMM Computer Communication Review (2006), vol. 36, ACM, pp. 135–146.
, Vol. 1, No. 1, Article . Publication date: July 2019.

:39
[97] Marsili, M., Vega-Redondo, F., and Slanina, F. The rise and fall of a networked society: A formal model. Proceedingsof the National Academy of Sciences 101, 6 (2004), 1439–1442.
[98] McGlohon, M., Akoglu, L., and Faloutsos, C. Weighted graphs and disconnected components: patterns and a
generator. In Proceedings of the 14th ACM SIGKDD international conference on Knowledge discovery and data mining(2008), ACM, pp. 524–532.
[99] McPherson, M., Smith-Lovin, L., and Cook, J. M. Birds of a feather: Homophily in social networks. Annual reviewof sociology 27, 1 (2001), 415–444.
[100] Medina, A., Matta, I., and Byers, J. On the origin of power laws in internet topologies. ACM SIGCOMM computercommunication review 30, 2 (2000), 18–28.
[101] Meyer, U., Penschuck, M., et al. Large-scale graph generation and big data: An overview on recent results. Bulletinof EATCS 2, 122 (2017).
[102] Milo, R., Itzkovitz, S., Kashtan, N., Levitt, R., Shen-Orr, S., Ayzenshtat, I., Sheffer, M., and Alon, U. Super-
families of evolved and designed networks. Science 303, 5663 (2004), 1538–1542.[103] Milo, R., Kashtan, N., Itzkovitz, S., Newman, M. E., and Alon, U. On the uniform generation of random graphs
with prescribed degree sequences. arXiv preprint cond-mat/0312028 (2003).[104] Milo, R., Shen-Orr, S., Itzkovitz, S., Kashtan, N., Chklovskii, D., and Alon, U. Network motifs: simple building
blocks of complex networks. Science 298, 5594 (2002), 824–827.[105] Molontay, R. Fractal Characterization of Complex Networks. PhD thesis, Department of Stochastics, Budapest
University of Technology and Economics, 2015.
[106] Moreno, S., Neville, J., Kirshner, S., and Vishwanathan, S. Modeling the variance of network populations with
mixed kronecker product graph models.
[107] Moreno, S., Robles, P., and Neville, J. Block kronecker product graph model. In Workshop on Mining and Learningfrom Graphs (2013).
[108] Narayanan, A., and Shmatikov, V. De-anonymizing social networks. In Security and Privacy, 2009 30th IEEESymposium on (2009), IEEE, pp. 173–187.
[109] Newman, M. Networks: an introduction. Oxford university press, 2010.
[110] Newman, M., Barabasi, A.-L., and Watts, D. J. The structure and dynamics of networks. Princeton University Press,
2006.
[111] Newman, M. E. Assortative mixing in networks. Physical review letters 89, 20 (2002), 208701.[112] Newman, M. E. The structure and function of complex networks. SIAM review 45, 2 (2003), 167–256.[113] Newman, M. E. Analysis of weighted networks. Physical review E 70, 5 (2004), 056131.[114] Newman, M. E. Modularity and community structure in networks. Proceedings of the national academy of sciences
103, 23 (2006), 8577–8582.[115] Newman, M. E., and Girvan, M. Finding and evaluating community structure in networks. Physical review E 69, 2
(2004), 026113.
[116] Newman, M. E., Strogatz, S. H., and Watts, D. J. Random graphs with arbitrary degree distributions and their
applications. Physical review E 64, 2 (2001), 026118.[117] Nickel, C. L. M. Random dot product graphs a model for social networks. PhD thesis, The Johns Hopkins University,
2006.
[118] Onat, F. A., Stojmenovic, I., and Yanikomeroglu, H. Generating random graphs for the simulation of wireless ad
hoc, actuator, sensor, and internet networks. Pervasive and Mobile Computing 4, 5 (2008), 597–615.[119] Palla, G., Lovász, L., and Vicsek, T. Multifractal network generator. Proceedings of the National Academy of Sciences
(2010).
[120] Park, H., and Kim, M.-S. Trilliong: A trillion-scale synthetic graph generator using a recursive vector model. In
Proceedings of the 2017 ACM International Conference on Management of Data (2017), ACM, pp. 913–928.
[121] Penrose, M. Random geometric graphs. No. 5. Oxford University Press, 2003.
[122] Pofsneck, L., Hofmann, H., and Buettner, R. Physical theories of the evolution of online social networks: a
discussion impulse. dynamical systems 22 (2012), 4.[123] Pothen, A., Simon, H. D., and Liou, K.-P. Partitioning sparse matrices with eigenvectors of graphs. SIAM journal on
matrix analysis and applications 11, 3 (1990), 430–452.[124] Raigorodsky. Models of random graphs. Litres, 2011.[125] Ravasz, E., and Barabási, A.-L. Hierarchical organization in complex networks. Physical Review E 67, 2 (2003),
026112.
[126] Robins, G., Pattison, P., Kalish, Y., and Lusher, D. An introduction to exponential random graph (p*) models for
social networks. Social networks 29, 2 (2007), 173–191.[127] Rozenfeld, H. D., Havlin, S., and Ben-Avraham, D. Fractal and transfractal recursive scale-free nets. New Journal
of Physics 9, 6 (2007), 175.
, Vol. 1, No. 1, Article . Publication date: July 2019.

:40 Mikhail Drobyshevskiy and Denis Turdakov
[128] Sala, A., Cao, L., Wilson, C., Zablit, R., Zheng, H., and Zhao, B. Y. Measurement-calibrated graph models for social
network experiments. In Proceedings of the 19th international conference on World wide web (2010), ACM, pp. 861–870.
[129] Sawardecker, E. N., Sales-Pardo, M., and Amaral, L. A. N. Detection of node group membership in networks with
group overlap. The European Physical Journal B 67, 3 (2009), 277–284.[130] Seshadhri, C., Kolda, T. G., and Pinar, A. Community structure and scale-free collections of erdős-rényi graphs.
Physical Review E 85, 5 (2012), 056109.[131] Seshadhri, C., Pinar, A., and Kolda, T. G. An in-depth study of stochastic kronecker graphs. In Data Mining
(ICDM), 2011 IEEE 11th International Conference on (2011), IEEE, pp. 587–596.
[132] Seshadri, M., Machiraju, S., Sridharan, A., Bolot, J., Faloutsos, C., and Leskove, J. Mobile call graphs: beyond
power-law and lognormal distributions. In Proceedings of the 14th ACM SIGKDD international conference on Knowledgediscovery and data mining (2008), ACM, pp. 596–604.
[133] Simpson, S. L., Hayasaka, S., and Laurienti, P. J. Exponential random graph modeling for complex brain networks.
PloS one 6, 5 (2011), e20039.[134] Staudt, C. L., Hamann, M., Safro, I., Gutfraind, A., and Meyerhenke, H. Generating scaled replicas of real-world
complex networks. In International Workshop on Complex Networks and their Applications (2016), Springer, Cham,
pp. 17–28.
[135] Tabourier, L., Roth, C., and Cointet, J.-P. Generating constrained random graphs using multiple edge switches.
Journal of Experimental Algorithmics (JEA) 16 (2011), 1–7.[136] Taylor, R. Constrained switchings in graphs. In Combinatorial Mathematics VIII. Springer, 1981, pp. 314–336.[137] Thiriot, S., and Kant, J.-D. Generate country-scale networks of interaction from scattered statistics. In The fifth
conference of the European social simulation association, Brescia, Italy (2008), vol. 240.
[138] Toivonen, R., Kovanen, L., Kivelä, M., Onnela, J.-P., Saramäki, J., and Kaski, K. A comparative study of social
network models: Network evolution models and nodal attribute models. Social Networks 31, 4 (2009), 240–254.[139] Toivonen, R., Onnela, J.-P., Saramäki, J., Hyvönen, J., and Kaski, K. A model for social networks. Physica A:
Statistical Mechanics and its Applications 371, 2 (2006), 851–860.[140] Van Der Hofstad, R. Random graphs and complex networks, 2014.
[141] Van Duijn, M. A., Gile, K. J., and Handcock, M. S. A framework for the comparison of maximum pseudo-likelihood
and maximum likelihood estimation of exponential family random graph models. Social Networks 31, 1 (2009), 52–62.[142] Van Mieghem, P., Omic, J., and Kooij, R. Virus spread in networks. IEEE/ACM Transactions on Networking (TON) 17,
1 (2009), 1–14.
[143] Vázqez, A. Growing network with local rules: Preferential attachment, clustering hierarchy, and degree correlations.
Physical Review E 67, 5 (2003), 056104.[144] Venkatasubramanian, V., Katare, S., Patkar, P. R., and Mu, F.-p. Spontaneous emergence of complex optimal
networks through evolutionary adaptation. Computers & chemical engineering 28, 9 (2004), 1789–1798.[145] Wang, Y., and Wu, X. Preserving differential privacy in degree-correlation based graph generation. Transactions on
data privacy 6, 2 (2013), 127.[146] Watts, D. J., and Strogatz, S. H. Collective dynamics of ’small-world’ networks. nature 393, 6684 (1998), 440.[147] Waxman, B. M. Routing of multipoint connections. IEEE journal on selected areas in communications 6, 9 (1988),
1617–1622.
[148] Wegner, A. Random graphs with motifs.
[149] Wong, L. H., Pattison, P., and Robins, G. A spatial model for social networks. Physica A: Statistical Mechanics andits Applications 360, 1 (2006), 99–120.
[150] Xi, L., Wang, L., Wang, S., Yu, Z., and Wang, Q. Fractality and scale-free effect of a class of self-similar networks.
Physica A: Statistical Mechanics and its Applications 478 (2017), 31–40.[151] Yang, J., and Leskovec, J. Structure and overlaps of ground-truth communities in networks. ACM Transactions on
Intelligent Systems and Technology (TIST) 5, 2 (2014), 26.[152] Yang, J., and Leskovec, J. Defining and evaluating network communities based on ground-truth. Knowledge and
Information Systems 42, 1 (2015), 181–213.[153] Ying, X., and Wu, X. Randomizing social networks: a spectrum preserving approach. In proceedings of the 2008 SIAM
International Conference on Data Mining (2008), SIAM, pp. 739–750.
[154] Ying, X., and Wu, X. Graph generation with prescribed feature constraints. In Proceedings of the 2009 SIAMInternational Conference on Data Mining (2009), SIAM, pp. 966–977.
[155] Yook, S.-H., Jeong, H., and Barabási, A.-L. Modeling the internet’s large-scale topology. Proceedings of the NationalAcademy of Sciences 99, 21 (2002), 13382–13386.
[156] Zhang, J., and Tay, Y. Gscaler: Synthetically scaling a given graph. In EDBT (2016), pp. 53–64.
[157] Zweig, K. A. Network analysis literacy: a practical approach to the analysis of networks. lecture notes in social
networks, 2016.
, Vol. 1, No. 1, Article . Publication date: July 2019.