rapid and high-specificity assay and …vq062bc0125/garcia... · animal and plant cells and play...
TRANSCRIPT

RAPID AND HIGH-SPECIFICITY ASSAY
FOR MICRO-RNA DETECTION
USING COMBINED ON-CHIP ISOTACHOPHORESIS
AND AFFINITY HYDROGEL PURIFICATION
A DISSERTATION
SUBMITTED TO THE DEPARTMENT
OF MECHANICAL ENGINEERING
AND THE COMMITTEE ON GRADUATE STUDIES
OF STANFORD UNIVERSITY
IN PARTIAL FULFILLMENT OF THE REQUIREMENTS
FOR THE DEGREE OF
DOCTOR OF PHILOSOPHY
Giancarlo Garcia
September 2013

http://creativecommons.org/licenses/by-nc/3.0/us/
This dissertation is online at: http://purl.stanford.edu/vq062bc0125
© 2013 by Giancarlo Garcia. All Rights Reserved.
Re-distributed by Stanford University under license with the author.
This work is licensed under a Creative Commons Attribution-Noncommercial 3.0 United States License.
ii

I certify that I have read this dissertation and that, in my opinion, it is fully adequatein scope and quality as a dissertation for the degree of Doctor of Philosophy.
Juan Santiago, Primary Adviser
I certify that I have read this dissertation and that, in my opinion, it is fully adequatein scope and quality as a dissertation for the degree of Doctor of Philosophy.
Ali Mani
I certify that I have read this dissertation and that, in my opinion, it is fully adequatein scope and quality as a dissertation for the degree of Doctor of Philosophy.
Beth Pruitt
Approved for the Stanford University Committee on Graduate Studies.
Patricia J. Gumport, Vice Provost for Graduate Education
This signature page was generated electronically upon submission of this dissertation in electronic format. An original signed hard copy of the signature page is on file inUniversity Archives.
iii

iv

v
Abstract microRNAs are short, non-coding RNA molecules that regulate gene expression in
animal and plant cells and play important roles in diverse cellular functions.
Dysregulation of microRNAs has been linked to diseases such as diabetes, alzheimer’s
disease, and many forms of cancer. microRNA expression signatures have therefore
emerged as important new clinical biomarkers with both diagnostic and prognostic value.
Despite growing interest, quantitative microRNAs continues to pose challenges for
traditional RNA profiling methods due to their low abundance, high degree of sequence
similarity, and complex biogenesis. In this work, we demonstrate the development of a
microfluidic microRNA detection assay which addresses these challenges by leveraging
two key technologies: on-chip isotachophoresis (ITP) and photopatterned functionalized
hydrogels.
ITP is a robust electrokinetic technique which uses a heterogeneous buffer system to
perform greater than 10,000-fold focusing. In addition to providing signal enhancement,
ITP focusing also accelerates reaction kinetics of nucleic acid hybridization. Our
microRNA detection assay first uses ITP to enhance hybridization between microRNAs
and complementary DNA reporters. Following hybridization, the ITP zone migrates into
a purification region which a hydrogel decorated with DNA capture probes. Excess
(unhybridized) reporters bind to the capture probes and become immobilized, while
reporters hybridized to microRNAs remain focused in ITP and can be detected
downstream.

vi
In the first part of the dissertation, we present a proof of concept study to assess the
feasibility of a microRNA assay and characterize assay sensitivity and dynamic range
under low stringency conditions. We demonstrate our technique performs quantitative
analysis of synthetic microRNAs with 4 orders of magnitude dynamic range, near 1 pM
(30,000 molecules) sensitivity, and assay run time of only 10 min. This constitutes a 100-
fold improvement in dynamic range and limit of detection over previous ITP-based
approaches.
In the second part of the dissertation, we present modifications to our basic assay which
allow us to detect microRNAs with single-nucleotide specificity (high stringency) and
using total RNA extracted from real tissues. Using this modified assay, we quantify
concentration of let-7a microRNA in mouse and human tissues, and validate these
measurements, and our method more generally, by comparison with qPCR. We further
develop a numerical model which demonstrates that our modified assay leverages both
thermodynamics (in the first stage) and off-rate kinetics (in the second stage) to enhance
hybridization specificity.

vii
Acknowledgments
To the people in my life who have supported and provided their love and friendship, I
wish to express my deep gratitude. From my childhood in Santo Domingo, Columbus,
and McLean, to my college years at Harvard, to the last five years at Stanford, my
friends, family, and mentors have been my companions and my guides. Thanks for the
many wonderful experiences.
Giancarlo Garcia
September 23, 2013

viii
Table of Contents ABSTRACT........................................................................................................................... V
ACKNOWLEDGMENTS.......................................................................................................VII
TABLE OF CONTENTS ..................................................................................................... VIII
LIST OF TABLES.................................................................................................................. X
LIST OF FIGURES ...............................................................................................................XI
LIST OF ABBREVIATIONS AND TERMS ......................................................................... XXVI
1 INTRODUCTION............................................................................................................. 1
1.1 On-chip isotachophoresis (ITP) fundamentals and protocols...................................... 1
1.1.1 Physics of ITP ............................................................................................................. 3 1.1.2 Device cleaning and preparation................................................................................ 7 1.1.3 Fluorophore focusing in peak mode ITP .................................................................... 8 1.1.4 Extraction and purification of nucleic acids from cultured E. coli ............................ 9 1.1.5 Separation of amino acids with cationic plateau mode ITP ..................................... 13 1.1.6 Recommendations for ITP buffer and experiment design......................................... 15 1.1.7 Equipment and reagents needed for ITP experiments .............................................. 18
1.2 High-specificity nucleic acid detection ......................................................................... 18
1.2.1 Nucleic acid hybridization models............................................................................ 19 1.2.2 Equilibrium-based specificity ................................................................................... 25 1.2.3 Reaction kinetics-based specificity ........................................................................... 33
1.3 Scope of thesis ................................................................................................................. 40
2 INTEGRATION OF ITP AND AFFINITY PURIFICATION HYDROGELS.......................... 41
2.1 Introduction .................................................................................................................... 41
2.2 Materials and methods................................................................................................... 44
2.2.1 Reagents and materials............................................................................................. 44 2.2.2 Experimental apparatus............................................................................................ 47

ix
2.2.3 Preparation of prepolymers, buffers, and surface modification reagents ................ 48 2.2.4 Chip Preparation and Patterning of Functionalized Polyacrylamide Gels ............. 49 2.2.5 Assay operation and data analysis ........................................................................... 51 2.2.6 Protocol for gel dissolution and chip regeneration.................................................. 54 2.2.7 Numerical Simulation of ITP-enhanced Hybridization Reaction ............................. 55
2.3 Results and discussion.................................................................................................... 57
3 HIGH-SPECIFICITY MICRORNA DETECTION USING ITP TWO-STAGE ASSAY........... 63
3.1 Introduction .................................................................................................................... 63
3.2 Materials and Methods .................................................................................................. 65
3.2.1 Reagents and materials............................................................................................. 65 3.2.2 Experimental apparatus............................................................................................ 66 3.2.3 Preparation of prepolymer, buffers, and surface modification reagents.................. 67 3.2.4 Microfluidic chip preparation and hydrogel patterning........................................... 68 3.2.5 Experiment protocol.................................................................................................. 69 3.2.6 Data analysis and let-7a quantification.................................................................... 71 3.2.7 Gel patterning and preventing gel degradation........................................................ 72 3.2.8 Volume-averaged model for hybridization dynamics ............................................... 75 3.2.9 Kinetic off-rate estimates .......................................................................................... 78 3.2.10 Hairpin reporters do not bind precursor microRNAs............................................. 79 3.2.11 Estimate of amount of RNA processed by ITP........................................................ 81
3.3 Results and discussion.................................................................................................... 83
4 CONCLUSIONS AND RECOMMENDATIONS .................................................................. 93
4.1 Conclusions ..................................................................................................................... 93
4.2 Contributions.................................................................................................................. 94
4.3 Recommendations for future work............................................................................... 96
BIBLIOGRAPHY ................................................................................................................. 98
APPENDIX A DESIGN NOTES FOR HIGH-SPECIFICITY EXPERIMENTS.......................... 112

x
List of Tables Table 1.1 Effective mobility magnitude (× 10-9 m2/V/s) of adjusted pure analyte zone in
anionic ITP where the LE is 100 mM HCl and 200 mM buffering counterion........ 15
Table 1.2 Effective mobility magnitude (× 10-9 m2/V/s) of adjusted pure analyte zone in
cationic ITP where the LE is 100 mM sodium and 200 mM buffering counterion.. 16
Table 1.3 Typical reagents and equipment used for basic ITP experiments.................... 17
Table 2.1 Synthetic oligonucleotide sequences with associated purification methods and
purity estimates. Purification methods included high pressure liquid
chromatography (HPLC) and polyacrylamide gel electrophoresis (PAGE)............. 45
Table 2.2 Sourcemeter current program. We applied 1 µA constant current between
ground (GND) and positive (HI) electrodes. A dash “-” under the reservoir listing
indicates a floating voltage potential. ....................................................................... 52
Table 3.1 Synthetic oligonucleotide sequences and associated purification methods.
Purification methods included high pressure liquid chromatography (HPLC) and
polyacrylamide gel electrophoresis (PAGE). ........................................................... 66
Table 3.2 Sourcemeter current program. We applied 1 µA constant current between
ground (GND) and positive (HI) electrodes. A dash “-” under the reservoir listing
indicates a floating voltage potential. ....................................................................... 70

xi
List of Figures Figure 1.1 Isotachophoresis (ITP) is an electrokinetic technique used in microfluidic
applications for sensitive detection and separation of ions. ITP offers separation,
selective focusing, and preconcentration capabilities. In addition, it is extremely
robust and insensitive to physical disturbances because of its self-sharpening nature.
Sample ions selectively focus between a leading (LE) and trailing electrolyte (TE)
and travel through the microchannel at a constant speed determined by the speed of
the leading ions in the LE zone. Sample ions focus if their effective electrophoretic
mobility is bracketed by the effective mobility of the LE and TE ions. The schematic
depicts a model ITP experiment where sample focuses continuously between the LE
and TE zones............................................................................................................... 5
Figure 1.2 Dilute sample ions focus in “peak mode” ITP. a) Two distinct dilute
(csample << cLE) species focus in peak mode at the interface formed between the LE
and TE zones. Solely the LE and TE determine the electric field, as sample species
do not significantly contribute to current. Sample ions are mixed with TE (in a semi-
infinite injection) and focus roughly together (note slight offset) in a roughly
Gaussian peak at the ITP interface. Focusing criterion (shown as inequalities)
applies to strongly ionized species. b) Experiments showing Alexa Fluor 488
(AF488) focused in peak mode for a range of applied currents. Sample peak width is
inversely proportional to current (for negligible advective dispersion due to
electroosmotic flow).14 The self-sharpening interface is resistant to dispersion due to
pressure-driven flow. .................................................................................................. 6

xii
Figure 1.3 Sample ions at a sufficiently high concentration focus in “plateau mode” and
govern local conductivity. We typically introduce sample ions in a finite injection
between the TE and LE. In this modality, sample ions separate and order according
to their effective electrophoretic mobility. For strongly ionized species, the TE and
plateau zone concentrations are determined by the Kohlrausch regulating function
(KRF, an invariant set initially by the LE zone). Dilute ions continue to focus in
peak mode between plateau zones bracketing their effective mobility. Focusing
criterion (shown as inequalities) applies to strongly ionized species. ........................ 7
Figure 1.4 Lysate preparation and nucleic acid extraction with peak mode ITP. Nucleic
acid is extracted from E. coli cell culture using lysozyme-assisted alkaline lysing
and purified by selective electrophoretic focusing via ITP. TE mixed with lysate
(brown) contains target nucleic acid (green), proteins, and potential PCR-inhibiting
chemistries. Appropriate selection of trailing and leading ions enables selective
focusing of target nucleic acid while leaving PCR inhibitors behind. Total nucleic
acid ITP peak often takes on a non-ideal shape, as shown here in the inset image. As
a demonstration of this assay, we extracted total nucleic acid from gram-negative
bacteria, Escherichia coli (lysed with sodium hydroxide solution alone), purified
nucleic acid (NA) from lysate using ITP, collected the extracted genetic material,
and performed qRT-PCR analyses to verify successful purification of 16S rRNA
(red) and 16S rDNA (green) from bacterial culture. Negative control threshold
cycles for 16S rRNA (blue) and 16S rDNA (yellow) were each above 30 cycles. We
performed qRT-PCR using Power SYBR Green RNA-to-CT 1-Step Kit from
Applied Biosystems with 150 nM forward (5’-CGGATTGGAGTCTGCAACTCG)
xiii
and reverse (5’-CACAAAGTGGTAAGCGCCCTC) primers, at the recommended
thermal cycling conditions........................................................................................ 12
Figure 1.5 Non-focusing tracer (NFT) assay for separation and detection of unlabeled
amino acids. a) Schematic of the NFT assay. A finite injection of sample ions is
introduced into the East channel. We mix the LE with a tracer cationic fluorophore
with effective mobility lower than the TE ions (µtracer < µTE). The fluorophore is said
to act as an “underspeeding tracer”. As the fluorophore electromigrates from the LE
into zones now occupied by sample plateaus and TE, it experiences a higher electric
field and thus its concentration increases. This change in concentration creates steps
in the isotachopherogram. b) Separation of two amino acids, arginine and lysine,
using the NFT assay with Rhodamine 6G as the underspeeding fluorescent tracer.
The slight peak between TE and arginine is common in ITP, is not often well
understood, and here does not interfere with detecting or quantifying the plateaus. 14
Figure 1.6 Equilibrium prediction of two-species hybridization and folding as a function
of time using the DINAMelt web server. We used the partially-complementary DNA
sequences 5’–GGC CUG AGG UAG UAG GUU GUA UAG UUG GCC–3’
(sequence A) and 5’–GGC CGA GCA ACT ATA CAA CCT ACT ACC TCA GCT
CGG CC–3’ (sequence B) with 100 mM sodium concentration (no magnesium) and
1 µM strand concentrations. Complementary portions of each sequence are
underlined and we note that both sequences are expected to exhibit strong secondary
structure, as the ends of each molecule (not underlined) are complementary. ......... 24

xiv
Figure 1.7 Scheme for detection of nucleic acids using molecular beacon probes by
Tyagi et al.34 Molecular beacons are stem-loop probes which are end-labeled with a
fluorophore at the 5’ end and a quencher at the 3’ end. In the closed conformation,
close proximity of quencher and fluorophore reduces fluorescent signal. Upon
hybridization, displacement of the fluorophore and quencher results in an overall
increase in fluorescent signal. ................................................................................... 26
Figure 1.8 Experimental measurement of molecular beacon target and mismatch
hybridization dynamics by Tyagi et al.33 The hybridization on-rate rate is largest for
the complementary target molecule (a), and much lower for molecules containing a
single substitution (b) or a single deletion (c)........................................................... 27
Figure 1.9 Design and optimization of hairpin probe design using melting curve
predictions generated by the DINAMelt web server. (A) Duplex fraction as a
function of temperature for target (5’–UGA GGU AGU AGG UUG UAU AGU U–
3’; blue line) and mismatch (5’–UGA GGU AGG AGG UUG UAU AGU U–3’; red
dashed line) sequences and for linear (0 nt) and hairpin probe designs (6, 8, and
10 nt long stem). Longer stems result in lower overall melting temperatures and
larger separation between melting curves. (B) Ratio of mismatch and target duplex
fractions from part (A) used to evaluate probe specificity. ...................................... 28
Figure 1.10 Experimental measurements of kinetic on-rate for molecular beacons with
varying loop (probe) and stem lengths by Tyagi et al.35 Data show that kinetic on-
rate decreases as stem length increases..................................................................... 29
xv
Figure 1.11 Chemical structure of sugar backbone for (A) LNA, (B) DNA, and (C) RNA.
LNAs have an added bridge between the 2’ oxygen and 4’ carbon in the sugar
backbone, which increases duplex stability (for both LNA-DNA and LNA-RNA
duplexes) and hybridization specificity. Figure taken from published review by
Mouritzen et al.36 ...................................................................................................... 30
Figure 1.12 Experimental demonstration of LNA duplex stability and specificity by You
et al.37 (A) Melting temperatures of hybridization probes with varying LNA
composition: no LNA bases (1DNA), one LNA triplet (1T), LNA in every third
position (1ET), LNA in every other position (1ES). Increasing LNA composition
increases duplex stability monotonically. The dependence of melting temperature on
salt concentration is similar for all probe types. (B) Melting curves for target and
mismatch molecules using the 1DNA (1p, 1m) and 1T (2p, 2m) probe sets. 1T
probes, which contain an LNA triplet at the mismatch site, show greater stability and
specificity compared to pure DNA probes................................................................ 31
Figure 1.13 Experimental demonstration of differences between LNA and DNA free
energies of duplex destabilization, ΔΔG = ΔG(mismatch)-ΔG(match), by
Owczarzy et al.38 For each type of mismatch, results are averaged for all possible
neighboring base pairs within the LNA triple; error bars indicate range from
minimum to maximum value in the set.38 The data demonstrate that LNA triplets
enhance specificity in most cases. However, LNAs can also reduce specificity
especially for +G-T and +C-A mismatches. ............................................................. 32
Figure 1.14 Experimental measurements of hybridization kinetics of fully-
complementary and mismatched sequences by Gotoh et al.42 Differences in

xvi
equilibrium constant between target and mismatch molecules are accompanied by
differences in kinetic association and dissociation rates........................................... 36
Figure 1.15 Predicted melting dynamics and specificity enhancement of wash step in a
two-stage assay. We evaluate equations (1.14) and (1.15) (plot A and plot B,
respectively) using dissociation rates measured by Gotoh et al.42 Sequences
correspond to 401C, 426C, and 428C in Figure 1.14. ............................................. 37
Figure 1.16 Evaluation of the wash parameter, G = koffmm / koff
T −1 , defined by equation
(1.16), as a function of temperature for hybridization of single-nucleotide mismatch
sequences. G is a measure of the tradeoff between loss of signal and gain in
specificity during the two-stage hybridization wash step. We use dissociation rate
measurements of Ikuta et al. performed at temperatures of 40, 50, and 60°C to
evaluate G.43 We observe nearly all hybrids have an optimum G at ~50°C with the
exception of the G-T wobble base pair, which is significantly more stable than the
others and therefore exhibits the lowest overall G values. ....................................... 38
Figure 2.1 Integration of on-chip ITP and affinity hydrogel enables sensitive NA
detection. (A) Schematic of ITP-based hybridization enhancement. ITP enables
rapid mixing and approximately 10,000-fold preconcentration of NAs and
fluorescent reporters in a picoliter volume. Preconcentration drives forward reaction
between target and reporter molecules, dramatically decreasing hybridization time.
(B) Experimental images demonstrating ITP hydrogel capture. The ITP-focused
fluorescent oligo migrates through the hydrogel, which is functionalized with probes
complementary to reporters. Thus, the capture gel continuously immobilizes

xvii
unreacted reporter molecules. After the ITP zone sweeps by, we observe a weak
fluorescent signal left behind in the gel, corresponding to captured unused probes. 44
Figure 2.2 Electropherogram analyses (using Agilent Bioanalyzer 2100 electrophoresis
instrument) of let-7a mature and precursor synthetic RNA oligos. Synthesized
mature sequence of microRNA results in a sharp size distribution (top), suggesting
high purity. However, difficulties in synthesizing longer RNA result in an
electropherogram peak for the precursor sequence (bottom) which is much broader,
suggesting much lower purity. The vertical dashed lines represent ±6 nt about the
length of the correct oligo sequence (22 nt for mature, 80 nt for precursor). We
estimate oligo purity by integrating this region and dividing by the overall
electropherogram integral. Using this method, we estimate the mature oligo is ~92%
pure, while the precursor oligo is only ~40% pure. We therefore attribute the high
signal in experiments with pure precursor shown in Figure 2.10 to low purity of the
precursor oligo. We hypothesize that the broad distribution contains a significant
fraction of molecules containing the mature let-7a sequence, but lacking all or a
significant portion of the critical loop sequence targeted by the immobilized probes
in the functionalized gel designed for precursor removal......................................... 46
Figure 2.3 Schematic of experimental setup. We built a custom point-confocal setup
around an inverted epifluorescent microscope which houses a high-numerical
aperture objective and Cy5 filter cube. A custom optical train with a 400 µm pinhole
attached to the microscope side port excludes out-of-plane light and re-focuses the
captured light into the PMT module. We use a 635 nm diode laser connected to the
microscope via a multimode fiber optic cable. We control the position of the

xviii
microfluidic chip using an automated XYZ stage with controller. We use a high
voltage sourcemeter to apply fixed current values to the microfluidic chip. Both the
sourcemeter and PMT power supply are controlled and monitored by computer,
using a custom MATLAB code. ............................................................................... 48
Figure 2.4 Caliper model NS260 microfluidic chip layout and indication of dispensed
solutions (green), voltage program (blue), detection stations (red), and
functionalized hydrogel layout (brown and purple). TE+S, TE, and LE were all
dispensed prior to initiation of the voltage program. We applied the voltage program
as described in Section 2.2.5 and Table 2.2. We used detection station 1 (DS1) to
monitor the peak location during injection. Once the peak passed DS1, we waited 5 s
before turning off the voltage supply and switching the ground electrode from
reservoir 1 to reservoir 6. We then commenced the detection voltage program and
moved the detector to DS2........................................................................................ 51
Figure 2.5 Integrated fluorescent intensity of injection peak for all experimental
realizations demonstrating the limit of detection of 2.8 pM target concentration
(includes three run each of the negative control, 2.8 pM and 140 pM let-7a, and
140 pM miR-15a). Symbols represent individual experiments. The solid black line
represents the mean value and the dashed lines represent one standard deviation
above and below the mean........................................................................................ 53
Figure 2.6 Raw, measured fluorescence intensity peaks together with Gaussian fits for
our ITP gel capture assay. Each plot represents a different experiment with target
concentration as given at the top right corner of the plot. For each case, we plot the
signal measurement taken at location DS2 normalized by the integral of the

xix
corresponding injection peak measured at location DS1. Note the differences in the
ordinance scales. We show experimental data as symbols and Gaussian fits as solid
lines. We extend the fit down to a signal magnitude of 50% of the maximum
intensity in the raw data. ........................................................................................... 54
Figure 2.7 Predicted hybridization curves showing fraction of reporters hybridized
versus time. The dashed vertical line at 410 s denotes the end of the sample
injection. After this time, in the model, we set target and reporter flux into the ITP
zone to zero (F = 0). The dashed vertical line at 600 s denotes the end of the
detection portion of the assay. .................................................................................. 56
Figure 2.8 Schematic of microRNA detection assay. ITP in a polyacrylamide gel
(upstream of the photopatterned capture gel) preconcentrates and mixes target and
reporter molecules, speeding up hybridization. The ITP zone then migrates into and
through the capture gel region, which removes un-hybridized reporters from the
focused ITP zone. This allows minimal-background detection of reporters which
have specifically hybridized to their complementary target microRNA. ................. 57
Figure 2.9 Experimental determination of dynamic range and sensitivity of ITP gel
capture assay for detection of HSA-let-7a microRNA. (A) Gaussian best fits to
measured fluorescence signal versus time for four example let-7a concentrations.
Signal intensity initially scales with initial target concentration, and then saturates as
predicted. (B) Titration curve spanning 1.4 pM to 140 nM concentrations of let-7a.
The assay exhibits a quantitative dynamic range of approximately four orders of
magnitude (with absolutely no changes in assay conditions). Shown with data is a
plot of results from our model with F as a single (global) fitting parameter. (C) Limit

xx
of detection study, showing mean integrated signal intensity for negative control, 2.8
pM let-7a, 140 pM let-7a, and 140 pM of mismatch species (HSA-miR-15a). Scale
bars represent 95% confidence on the mean (N = 3). ............................................... 60
Figure 2.10 Demonstration of assay selectivity for mature over precursor microRNAs.
For these experiments, the enhanced hybridization region contains an immobilized
oligo targeting the loop sequence of the let-7a precursor (pre-let-7a) not found in the
mature molecule. The plot shows mean integrated signal intensity for negative
control, 140 pM let-7a, 140 pM pre-let-7a, and 140 pM each of let-7a and pre-let-7a.
Scale bars represent 95% confidence on the mean (N = 3). The pure precursor
sample signal is somewhat higher than the negative control signal, but we attribute
this to the difficulty in synthesizing long RNA oligos of high purity. We estimate the
purity of the let-7a precursor sample is approximately 31% (see Table 2.1 and
Figure 2.2 for further details regarding synthetic oligo purity). .............................. 62
Figure 3.1 Caliper model NS260 microfluidic chip layout and indication of dispensed
solutions (black), voltage program (blue), detection stations (red), and hydrogel
patterning (green, brown, and purple). TE+S, TE, and LE were all dispensed prior to
initiation of the voltage program. We apply the voltage program shown in Table 3.2.
We first detect the ITP peak at detection station 0 (DS0). Once the peak passed DS0,
we wait 3 s before we turn off the voltage supply and switch the ground electrode
from reservoir 1 (TE+S) to reservoir 5, which contains clean TE. We then moved the
detector to DS1 and resume the voltage program. We note that this manual step can
be automated using an off chip voltage sequencer. We then detect the ITP peak at
DS1, 1.5 mm before the start of the capture gel, as an internal normalization control.

xxi
Finally, we detect the ITP peak at DS2 and DS3, respectively 0.9 mm and 1.9 mm
after the start of the capture gel. Of these post-purification measurements, we use
only the measurement at DS3 for specificity experiments (Figure 3.8) and real
sample experiments (Figure 3.9). We use both DS2 and DS3 measurements to
estimate kinetic off-rates for let-7a and mismatches (see Figure 3.4). .................... 68
Figure 3.2 Experimental observation of gel degradation caused by high concentration
long nucleic acids. We used ITP to focus 70nt and 200nt DNA in free solution, and
allowed the focused nucleic acids to migrate into a region of the channel containing
4% crosslinked polyacrylamide. We patterned the hydrogel hydrodynamically, by
applying vacuum at the side channel (shown in the top three images) to fill the left
portion with pure LE buffer and the right portion with LE buffer containing gel
precursor and photoinitiator. We then performed ITP focusing and used an
intercalating dye to visualize the DNA. (A) The 70nt DNA crosses the free solution-
gel interface without causing any disruptions (first three time-course images). We
observed at a later time that the 70nt DNA remains focused in the hydrogel region
downstream. (B) The 200nt focuses in free solution, but upon crossing the hydrogel
interface appears to concentrate near the channel center. Observation of the DNA at
a later time reveals a depleted signal in the channel center, which suggests bubble
formation. We note that the 200nt DNA does not remain focused in ITP within the
hydrogel region, as demonstrated by its increased diffusion along the channel axis.
................................................................................................................................... 74
Figure 3.3 Experimental observation of voltage fluctuations caused by gel damage and
elimination of these fluctuations by using a first-stage linear polymer injection

xxii
region. (A) Voltage traces for total RNA injection experiments performed with
4% PA (blue nad green) and an initial 2% LPA region in series with 4% PA (red).
For experiments with only 4% PA, we observed voltage fluctuations only for high
concentration total RNA injections (100 ng/µl total RNA, shown in green). For
experiments where we added a first-stage 2% LPA region, we did not observe
voltage fluctuations when injecting 100 ng/µl total RNA. These data suggest that
focused total RNAs can enter the 2% LPA withou causing degradation. (B) Later-
time voltage trace during transition of the ITP interface from 2% LPA injection
region to 4% PA. The transition occurs approximately where indicated by the arrow.
We did not observe voltage fluctuations or gel degradation at this transition,
suggesting that use of an initial-stage 2% LPA region successfully prevents gel
degradation................................................................................................................ 75
Figure 3.4 Estimate of kinetic off-rates for target and mismatch sequences. We measured
the fluorescent signal for let-7a, two 1 nt mismatches (let-7c, let-7e), and one 2 nt
mismatch (let-7d) at locations 1 cm and 2 cm along the channel measured from the
start of the capture gel (LE3). We then estimated koff using a simplified reaction rate
equation (see text). As shown here, all mismatches have higher off-rates than let-7a.
This suggests that off-rate kinetics play an important role in improving specificity of
our assay.................................................................................................................... 79
Figure 3.5 The effect of reporter secondary structure on equilibrium hybridization
fraction to the let-7a precursor (pre-let-7a). We generated melting curves
numerically for reactions between pre-let-7a and each of three reporter molecule
designs: linear, hairpin with a 6nt stem, and hairpin with an 8nt stem. The linear

xxiii
reporter is fully-complementary to let-7a, while the hairpin reporters have a loop
region which is complementary to let-7a and a stem region which is self-
complementary. We observed that a linear design achieves a relatively high
hybridized fraction. However, a hairpin design with a 6nt stem reduces this fraction
significantly and a hairpin design with an 8nt stem completely eliminates
hybridization with pre-let-7a. We use the hairpin reporter design with 8nt stem in all
of our experiments. ................................................................................................... 80
Figure 3.6 Schematic of ITP capture assay for microRNA detection. We fill the channel
with leading electrolyte (LE) buffer patterned into three regions used for total RNA
injection, preconcentration, and mixing (LE1); continued hybridization and size
selection (LE2); and purification and detection (LE3). These regions vary in
polymer and capture oligo composition. LE1 is a low polymer concentration region
(2% LPA), which is robust to handling long and high concentration nucleic acids
(see Section 3.2.7). LE2 and LE3 contain 4% PA gel. The higher gel concentration
performs some size selection and LE3 further contains immobilized capture oligos.
The ITP zone co-focuses RNAs and complementary fluorescent hairpin reporters,
allowing them to react at high concentration in LE1 and LE2. Following
hybridization, the ITP zone enters LE3 where excess reporters bind to capture
probes and become immobilized. Meanwhile, hybridized reporters remain focused
in ITP and electromigrate with the LE-TE interface at a constant velocity. The
migrating fluorescent signal is directly proportional to target microRNA
concentration. Plots show actual raw data with example electrophoretic traces of the

xxiv
ITP peak before purification (left) and after the purification step for let-7a
concentrations ranging between 0 pM to 500 pM (right). ........................................ 86
Figure 3.7 Demonstration of thermodynamic and kinetic bases for single-nucleotide
specificity. (A) We designed reporter molecules with a hairpin secondary structure,
where the “loop” region is complementary to let-7a and the ends self-hybridize to
form an 8 nt stem. We show computer-generated melting curves for linear (top) and
hairpin (middle) reporters hybridized to the target (let-7a), a 1 nt mismatche (let-7c),
and a 2 nt mismatch (let-7d). Hairpin reporters have lower melting temperatures and
larger ΔT between let-7a versus mismatch molecules. Mismatch discrimination is
optimal at elevated temperature or denaturant concentration (dashed vertical line).
This helps stringency but also lowers the affinity between standard DNA capture
probes and hairpin reporters (bottom, dashed line). To achieve high capture
efficiency and retain sensitivity and stringency, we use capture probes with 50%
locked nucleic acid (LNA) composition to increase melting temperature by ~18°C
(bottom, solid line). (B) We simulate hybridization dynamics of hairpin reporters in
our assay, including injection, hybridization, and purification stages, for let-7a, 7c,
and 7d. microRNAs and reporters are first injected (0 < t < 450 s), during which
time they accumulate at the ITP interface and begin to hybridize. We then stop
sample injection at t = 450 s and allow hybridization to continue until t = 620 s.
During these two initial injection and hybridization stages (0 < t < 620 s), the
fraction of microRNAs hybridized increases at a rate determined by kon, and toward
the equilibrium value set by the dissociation constant, KD. In the purification stage
(t ≥ 620 s), unreacted nucleic acids are removed and product signal decreases

xxv
exponentially with the off-rate, koff. The inset plot shows the mistmatch-to-let-7a
signal ratio during purification. Because mismatch-reporter hybrids have higher off-
rates than the let-7a-reporter hybrids, stringency improves exponentially during
purification, at the cost of some reduced sensitivity................................................. 87
Figure 3.8 Experimental demonstration of single-nucleotide specificity. (A) The let-7
family contains eight microRNAs, which differ by as little as 1 nt. We list all eight
sequences here and use red underlined font to indicate nucleotides which differ from
the target sequence, let-7a. (B) Experimental demonstration of assay specificity for
let-7a. We performed spike-in experiments for each let-7 family member including
the let-7a precursor (N = 5 for let-7b, N = 3 for all others). We used total RNA
extracted from K562 cells (RIN = 10) to simulate background RNA complexity. To
quantify our results, we plot fluorescent signal normalized by mean signal from let-
7a experiments. Uncertainty bars indicate 95% confidence on the mean. Inset shows
titration curve spanning 15 pM to 4.5 nM let-7a concentration and theoretical curve
based on our simple numerical hybridization model. ............................................... 89
Figure 3.9 Experimental demonstration and validation of let-7a quantification from four
total RNA samples using ITP-capture assay. We measured let-7a concentrations in
human brain (RIN = 8.2, N = 5), mouse brain (RIN = 8.4, N = 3), mouse 15-day
embryo (RIN = 9.9, N = 3), and Raji cells (RIN = 10, N = 3) using both our ITP-
capture assay and an off-the-shelf Taqman qPCR assay. Error bars represent 95%
confidence on the mean. ........................................................................................... 91

xxvi
List of Abbreviations and Terms Abbreviations
AF488 – Alexa Fluor 488
CE – capillary electrophoresis
DI – de-ionized water
DNA – deoxyribonucleic acid
ITP – isotachophoresis
KRF – Kohlrausch regulating function
LE – leading electrolyte
LNA – locked nucleic acid
LOD – limit of detection
LPA – linear polyacrylamide
mRNA – messenger RNA
NA – nucleic acid
NFT – non-focusing tracer
nt – nucleotide(s)
PA - polyacrylamide
PMT – photo-multiplier tube
PVP - polyvinylpyrrolidone
qPCR – quantitative polymerase chain reaction
qRT-PCR – quantitative reverse-transcription polymerase chain reaction
RNA – ribonucleic acid
rRNA – ribosomal
RT-PCR – reverse-transcription polymerase chain reaction
TE – trailing electrolyte
UV – ultraviolet
Terms
dynamic range: the concentration range across which assay signal response is linearly
proportional to concentration of target molecule
GC content: in genetic sequence, the percentage of bases which are either G or C
high stringency assay: in nucleic acid hybridization, a technique which can differentiate
between two molecules with similar sequences
limit of detection (LOD): the lowest detectable target concentration
low stringency assay: in nucleic acid hybridization, a technique which cannot
differentiate between two molecules with similar sequences
melting curve: plot of steady state hybridized fraction as a function of temperature

1
1 Introduction
Section 1.1 of this Chapter is based on a recent article published in Journal of Visualized
Experiments, and is reproduced here with minor modifications.*
1.1 On-chip isotachophoresis (ITP) fundamentals and protocols
Electrokinetic techniques are a staple of microscale applications because of their unique
ability to perform a variety of fluidic and electrophoretic processes in simple, compact
systems with no moving parts. Isotachophoresis (ITP) is a simple and very robust
electrokinetic technique that can achieve million-fold preconcentration1,2 and efficient
separation and extraction based on ionic mobility.3 For example, we have demonstrated
the application of ITP to separation and sensitive detection of a variety of ionic molecules
(e.g., unlabeled toxins, DNA, rRNA, miRNA) with little or no sample preparation4-8 and
to extraction and purification of nucleic acids from complex matrices including cell
culture, urine, and blood.9-12
ITP achieves focusing and separation using an applied electric field and two buffers
within a fluidic channel system. For anionic analytes, the leading electrolyte (LE) buffer
is chosen such that its anions have higher effective electrophoretic mobility than the
anions of the trailing electrolyte (TE) buffer (effective mobility describes the observable
drift velocity of an ion and takes into account the ionization state of the ion, as described
* G. Garcia-Schwarz, A. Rogacs, S.S. Bahga, and J.G. Santiago, “On-chip isotachophoresis for separation of ions and purification of nucleic acids,” Journal of Visualized Experiments, 2012, e3890.

2
in detail by Persat et al.13). After establishing an interface between the TE and LE, an
electric field is applied such that LE ions move away from the region occupied by TE
ions. Sample ions of intermediate effective mobility race ahead of TE ions but cannot
overtake LE ions, and so they focus at the LE-TE interface (hereafter called the “ITP
interface”). Further, the TE and LE form regions of respectively low and high
conductivity, which establish a steep electric field gradient at the ITP interface. This field
gradient preconcentrates sample species as they focus. Proper choice of TE and LE
results in focusing and purification of target species from other non-focused species and,
eventually, separation and segregation of sample species.
In Section 1.1.1 we review the physical principles underlying ITP and discuss two
standard modes of operation: “peak” and “plateau” modes. In peak mode, relatively dilute
sample ions focus together within overlapping narrow peaks at the ITP interface. In
plateau mode, more abundant sample ions reach a steady-state concentration and
segregate into adjoining plateau-like zones ordered by their effective mobility. Peak and
plateau modes arise out of the same underlying physics, but represent distinct regimes
differentiated by the initial analyte concentration and/or the amount of time allotted for
sample accumulation.
We then describe in detail several useful experimental protocols, including: a chip
cleaning protocol (Section 1.1.2), an ITP model peak mode experiment (Section 1.1.3),
an ITP peak mode assay for the extraction of nucleic acids from E. coli cell culture
(Section 1.1.4), and finally an ITP plateau mode assay where we use a non-focusing
tracer (NFT) species to visualize the separation and perform quantification of amino acids
(Section 1.1.5). Finally, we close this section with a discussion of recommended ITP

3
buffers intended to aid in experiment design (Section 1.1.6) and a list of equipment and
reagents (Section 0) used for the experimental protocols presented in Sections 1.1.3-1.1.5.
1.1.1 Physics of ITP
ITP forms a sharp moving boundary between ions of like charge. The technique can be
performed with anionic or cationic samples, but we tailor this introduction to anionic ITP
and note the same principles apply to cationic ITP. We choose LE and TE buffers such
that LE ions have higher magnitude effective electrophoretic mobility. The effective
electrophoretic mobility, µ = U/E, is the proportionality constant between applied electric
field, E, and ion drift velocity, U.13 We establish a diffuse interface between the LE and
TE and apply an electric field directed from the high-conductivity LE zone to the low-
conductivity TE zone. The system quickly establishes a strong gradient in electric field at
the ITP interface, due to the non-uniform conductivity profile. As per its name (from
Greek, “isos” means “equal”, “takhos” means “speed”), TE and LE ions travel at the
same, uniform velocity, as a result of the non-uniform electric field and conservation of
current (this is the so-called “ITP condition”, see Figure 1.1).
The ITP interface is self-sharpening: LE ions that diffuse into the TE zone experience a
strong restoring flux and return to the leading zone (and vice versa for TE ions in the LE
zone). Sample ions focus at this interface if their effective mobility in the TE zone is
greater than those of the TE co-ions, and if their effective mobility in the LE zone is less
than that of the LE co-ions (see Figure 1.1). The self-sharpening and focusing properties
of ITP contribute to the robustness of this technique and make ITP relatively insensitive

4
to disturbances of the interface (e.g., due to pressure-driven flow or changes in geometry,
such as contractions, expansions, and turns).
In peak mode ITP (see Figure 1.2a), sample ion concentrations are at all times
significantly lower than LE and TE ion concentrations and therefore contribute negligibly
to local conductivity. The distribution of sample ions is determined by the self-
sharpening interface between neighboring zones (here the TE and LE) and the value of
the sample effective mobility relative to these zones.14 Multiple sample ions focus within
the same narrow ITP interface region as largely overlapping peaks. The interface and
peak widths, as well as the associated preconcentration factor, scale inversely with the
applied current (see experiments in Figure 1.2b).14
For sufficiently high initial sample concentrations and/or sufficient accumulation time,
sample ions reach a threshold concentration value. For fully-ionized species, this value is
determined by the Kohlrausch regulating function (KRF).15 For weak electrolytes, it is
determined by the Alberty and Jovin functions.16,17 In plateau mode, as depicted in
Figure 1.3, sample ions separate and purify into zones of locally uniform and constant
concentration in an order determined by their effective mobility. Very dilute ions may
still focus in peak mode between plateau zones. In ITP, sample ions can be introduced in
a finite injection between the TE and LE (see Figure 1.3) or alternately mixed together
with the TE and/or LE (see Figure 1.2). We refer to mixing in the TE zone as “semi-
infinite” injection, which can be used to accumulate analyte ions continuously.
Continuous sample accumulation increases sensitivity in both peak and plateau mode
assays. However, finite injection is more appropriate for plateau mode experiments for
two reasons. First, the high initial analyte concentrations used for plateau mode

5
experiments can substantially increase TE conductivity and lower focusing rates when a
semi-infinite injection scheme is used. Second, sample analytes with similar
electrophoretic mobility can result in so-called “shared zones” where two analytes
significantly contribute to the conductivity of a single plateau zone.
Figure 1.1 Isotachophoresis (ITP) is an electrokinetic technique used in microfluidic applications for
sensitive detection and separation of ions. ITP offers separation, selective focusing, and preconcentration
capabilities. In addition, it is extremely robust and insensitive to physical disturbances because of its self-
sharpening nature. Sample ions selectively focus between a leading (LE) and trailing electrolyte (TE) and
travel through the microchannel at a constant speed determined by the speed of the leading ions in the LE
zone. Sample ions focus if their effective electrophoretic mobility is bracketed by the effective mobility of
the LE and TE ions. The schematic depicts a model ITP experiment where sample focuses continuously
between the LE and TE zones.

6
Figure 1.2 Dilute sample ions focus in “peak mode” ITP. a) Two distinct dilute (csample << cLE) species focus
in peak mode at the interface formed between the LE and TE zones. Solely the LE and TE determine the
electric field, as sample species do not significantly contribute to current. Sample ions are mixed with TE
(in a semi-infinite injection) and focus roughly together (note slight offset) in a roughly Gaussian peak at
the ITP interface. Focusing criterion (shown as inequalities) applies to strongly ionized species. b)
Experiments showing Alexa Fluor 488 (AF488) focused in peak mode for a range of applied currents.
Sample peak width is inversely proportional to current (for negligible advective dispersion due to
electroosmotic flow).14 The self-sharpening interface is resistant to dispersion due to pressure-driven flow.

7
Figure 1.3 Sample ions at a sufficiently high concentration focus in “plateau mode” and govern local
conductivity. We typically introduce sample ions in a finite injection between the TE and LE. In this
modality, sample ions separate and order according to their effective electrophoretic mobility. For strongly
ionized species, the TE and plateau zone concentrations are determined by the Kohlrausch regulating
function (KRF, an invariant set initially by the LE zone). Dilute ions continue to focus in peak mode
between plateau zones bracketing their effective mobility. Focusing criterion (shown as inequalities)
applies to strongly ionized species.
1.1.2 Device cleaning and preparation
For the assay protocols presented in the sections that follow, we use isotropically wet-
etched (roughly D-shaped cross section) glass microfluidic chips with a cross-channel
design (see Figure 1.1). The following cleaning and preparation protocol is optimized for
borosilicate and fused silica channels, but can also be used with glass/PDMS chips.
Perform this cleaning procedure prior to experiments to ensure run-to-run repeatability

8
and successful application of dynamic coatings needed to suppress electroosmotic flow
(EOF). Omission of this protocol may result in strong dispersion of the ITP interface.14
1. To decontaminate the channel, fill the North, East, and South reservoirs with 10-
20 µL of 10% bleach and apply vacuum at the West reservoir for 2 min. If using a
standard Caliper chip caddy, vacuum can be effectively applied by simply
attaching the wide end of a 200 µL pipette tip to the chip reservoir and connecting
the vacuum line to a 2 mm inner diameter tube.
2. Empty the reservoirs and rinse the channel (as in step 1) with 1 M sodium
hydroxide for 2 min. This gently etches the channel walls, yielding a clean
borosilicate surface to help establish uniform surface properties.
3. Empty the reservoirs and clean with de-ionized water (DI), then rinse the channel
with LE for ~2 min. During this period surface properties and dynamic coatings
equilibrate within the channel.
1.1.3 Fluorophore focusing in peak mode ITP
The ability to focus ionic species makes ITP an excellent technique for boosting the
sensitivity of any detection scheme. Here we use ITP to focus an anionic fluorophore,
Alexa Fluor 488 (AF488). As required by the so-called “ITP condition”, the
electrophoretic mobility of AF488 is intermediate between our chosen leading and
trailing ions, here chloride and HEPES, respectively. The protocol used to focus AF488
in peak mode ITP is as follows:
1. Prepare 1 mL LE consisting of 100 mM HCl, 200 mM tris, and 1% PVP.

9
2. Prepare 1 mL TE consisting of 100 mM HEPES and 200 mM tris. Combine 90 µl
of TE with 10 µl of 1 µM Alexa Fluor 488 (AF488).
3. After rinsing with LE as described in Section 1.1.2, empty the West reservoir and
clean a few times with DI in order to dilute any LE remaining in the reservoir. Fill
this reservoir with 20 µL TE containing AF488.
4. Place the positive electrode in the East reservoir and the ground (negative)
electrode in the West reservoir and apply 2 µA (constant current). The sample
peak will migrate at a constant velocity from the West reservoir to the East
reservoir (see Figure 1) and the voltage between these reservoirs will increase as
the lower conductivity TE fills the channel.
In peak mode experiments with a fluorescent reporter (e.g., AF488, SYBR Green II), the
overall fluorescence intensity can be integrated and compared against a calibration curve
to obtain quantitative concentration information.12 We show an isotachopherograms of
peak mode experiments in Figure 1.2b. We demonstrate experimentally the inverse
relationship between applied current and width of the ITP zone, δ ~ 1/E, where δ is the
thickness of the ITP zone and E is the electric field. This relationship was first derived by
MacInnes and Longsworth,18 but breaks down for high currents in the presence of
electroosmotic flow.14
1.1.4 Extraction and purification of nucleic acids from cultured E. coli
The ability to selectively focus ionic species makes ITP an ideal technique for biological
sample preparation. We purify nucleic acids from untreated cell lysate by selecting a
trailing anion with an effective mobility magnitude lower than the target nucleic acid but
10
higher than co-ionic PCR inhibitors (e.g., anionic detergents, proteins, and organic
solvents, even if present in high concentration). Cationic PCR inhibitors (e.g., alkali
metals and cationic proteins and detergents) migrate in the opposite direction and so are
also left behind. ITP extracts and focuses target nucleic acids from the sample reservoir,
while leaving slower PCR-inhibiting species behind (see Figure 1.4). The protocol for
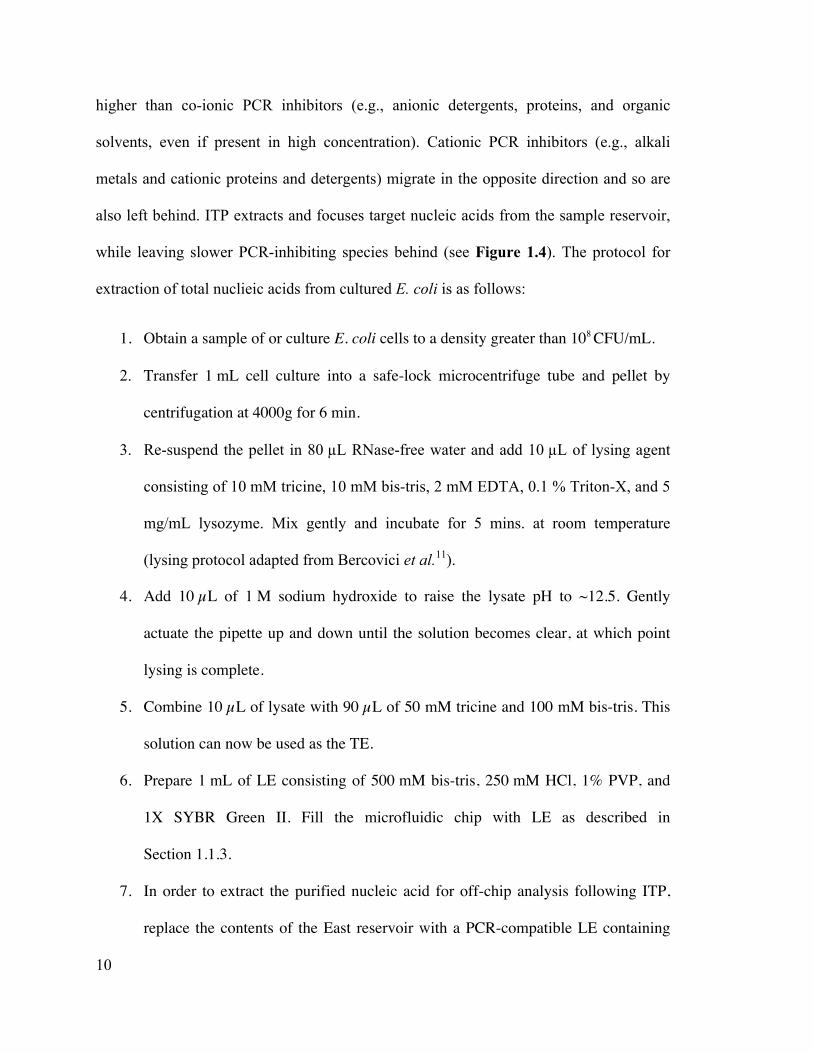
extraction of total nuclieic acids from cultured E. coli is as follows:
1. Obtain a sample of or culture E. coli cells to a density greater than 108 CFU/mL.
2. Transfer 1 mL cell culture into a safe-lock microcentrifuge tube and pellet by
centrifugation at 4000g for 6 min.
3. Re-suspend the pellet in 80 µL RNase-free water and add 10 µL of lysing agent
consisting of 10 mM tricine, 10 mM bis-tris, 2 mM EDTA, 0.1 % Triton-X, and 5
mg/mL lysozyme. Mix gently and incubate for 5 mins. at room temperature
(lysing protocol adapted from Bercovici et al.11).
4. Add 10 µL of 1 M sodium hydroxide to raise the lysate pH to ~12.5. Gently
actuate the pipette up and down until the solution becomes clear, at which point
lysing is complete.
5. Combine 10 µL of lysate with 90 µL of 50 mM tricine and 100 mM bis-tris. This
solution can now be used as the TE.
6. Prepare 1 mL of LE consisting of 500 mM bis-tris, 250 mM HCl, 1% PVP, and
1X SYBR Green II. Fill the microfluidic chip with LE as described in
Section 1.1.3.
7. In order to extract the purified nucleic acid for off-chip analysis following ITP,
replace the contents of the East reservoir with a PCR-compatible LE containing

11
50mM bis-tris, 25 mM HCl, and 0.1% PVP. Apply 1000 V between the East and
West wells to begin the experiment. The current between these reservoirs will
decrease.
8. At the end of the experiment the sample elutes into the LE reservoir. Coincident
with this elution, the current versus time for this system typically reaches a
plateau value (since resistance is now dominated by TE ions uniformly distributed
within channel). Gently mix the reservoir contents by repeated pipetting and
extract a 5 µL volume for analysis by quantitative RT-PCR.
We show an isotachopherogram and qPCR results from ITP-based nucleic acid extraction
experiments in Figure 1.4. In nucleic acid extraction experiments, sample is allowed to
elute into the LE reservoir and extracted with a pipette for analysis by quantitative RT-
PCR.10,12 As can be seen from the inset image of focused nucleic acids (here visualized
with an intercalating dye), total nucleic acid ITP peaks often take on a non-ideal shape.
To demonstrate this assay, we extracted total nucleic acid from gram-negative bacteria,
Escherichia coli. We performed qRT-PCR analyses to verify successful purification of
16S rRNA (red) and 16S rDNA (green) from bacterial culture. Negative control threshold
cycles for 16S rRNA (blue) and 16S rDNA (yellow) were each above 30 cycles.

12
Figure 1.4 Lysate preparation and nucleic acid extraction with peak mode ITP. Nucleic acid is extracted
from E. coli cell culture using lysozyme-assisted alkaline lysing and purified by selective electrophoretic
focusing via ITP. TE mixed with lysate (brown) contains target nucleic acid (green), proteins, and potential
PCR-inhibiting chemistries. Appropriate selection of trailing and leading ions enables selective focusing of
target nucleic acid while leaving PCR inhibitors behind. Total nucleic acid ITP peak often takes on a non-
ideal shape, as shown here in the inset image. As a demonstration of this assay, we extracted total nucleic
acid from gram-negative bacteria, Escherichia coli (lysed with sodium hydroxide solution alone), purified
nucleic acid (NA) from lysate using ITP, collected the extracted genetic material, and performed qRT-PCR
analyses to verify successful purification of 16S rRNA (red) and 16S rDNA (green) from bacterial culture.
Negative control threshold cycles for 16S rRNA (blue) and 16S rDNA (yellow) were each above 30 cycles.
We performed qRT-PCR using Power SYBR Green RNA-to-CT 1-Step Kit from Applied Biosystems with
150 nM forward (5’-CGGATTGGAGTCTGCAACTCG) and reverse (5’-
CACAAAGTGGTAAGCGCCCTC) primers, at the recommended thermal cycling conditions.

13
1.1.5 Separation of amino acids with cationic plateau mode ITP
ITP can be used to separate and focus small ions into adjoining and detectable plateaus
between the TE and LE. This allows detection and identification based on
physicochemical properties, such as local conductivity, UV absorbance, temperature
sensing, or index of refraction. Here we demonstrate a non-focusing tracer (NFT) assay
where a fluorescent, co-ionic species is added to the LE. This fluorescent species does not
focus, but its concentration adapts to a local electric field and thereby enables
visualization of purified plateau zones (see Figure 1.5a). The protocol for separation and
visualization of amino acids using cationic plateau mode ITP is as follows:
1. Prepare 1 mL LE consisting of 100 mM ethanolamine, 200 mM tricine, and 1%
PVP, and 100 µM of the cationic fluorophore Rhodamine 6G.
2. Prepare 1 mL TE consisting of 20 mM tris, 40 mM tricine. Prepare sample by
mixing 90 µL of TE with 10 µL each of 50 mM arginine and 50 mM lysine.
3. Dispense 20 µL LE in the West and North reservoirs and sample in the East
reservoir. Apply vacuum at South reservoir for 1 min.
4. Rinse the East well with DI and replace with TE (TE without sample).
5. Apply 500 V between the East and West reservoirs.
We show plateau mode isotachopherograms for separation of arginine and lysine in
Figure 1.5b. Fluorescence intensity (relative to LE or TE zone intensity) can be used for
zone identification, while zone widths enable quantification.
14
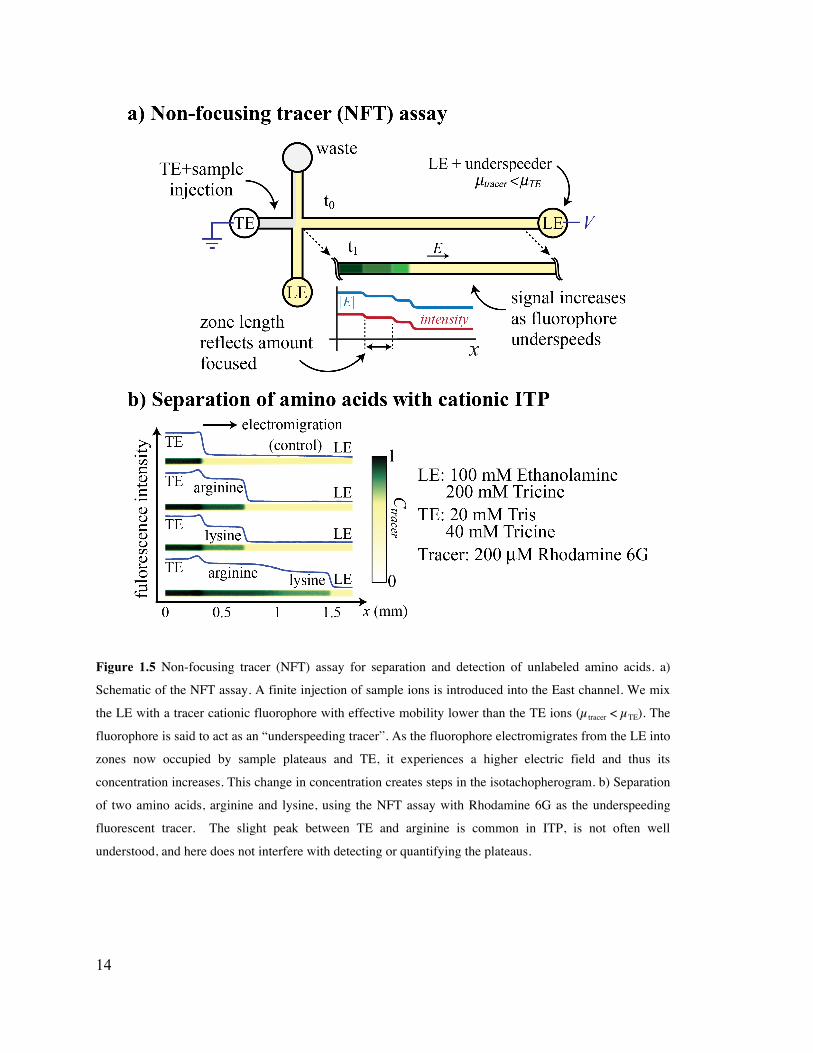
Figure 1.5 Non-focusing tracer (NFT) assay for separation and detection of unlabeled amino acids. a)
Schematic of the NFT assay. A finite injection of sample ions is introduced into the East channel. We mix
the LE with a tracer cationic fluorophore with effective mobility lower than the TE ions (µtracer < µTE). The
fluorophore is said to act as an “underspeeding tracer”. As the fluorophore electromigrates from the LE into
zones now occupied by sample plateaus and TE, it experiences a higher electric field and thus its
concentration increases. This change in concentration creates steps in the isotachopherogram. b) Separation
of two amino acids, arginine and lysine, using the NFT assay with Rhodamine 6G as the underspeeding
fluorescent tracer. The slight peak between TE and arginine is common in ITP, is not often well
understood, and here does not interfere with detecting or quantifying the plateaus.

15
1.1.6 Recommendations for ITP buffer and experiment design
The ITP methods presented here enable rapid, sensitive, and robust detection and
handling of ionic molecules. The main challenge in using ITP is typically proper choice
of LE and TE buffers. In anionic ITP, we typically choose chloride as the leading anion
because it is a strong acid with very high absolute mobility and thus has very predictable
properties. Therefore, buffer choice in anionic ITP is typically reduced to choosing a
proper TE and counterion. For selective focusing experiments, TE choice is critical to
exclusion of contaminating ions. In applications where contaminants are not present,
lower TE effective mobility leads to faster rate of focusing. We recommend using the
following, relatively well-behaved anionic TE ions: MES, MOPS, HEPES, tricine.
Choice of counterion affects both the system pH and TE effective mobility. Common
counterions are tris (pKa 8.1) and bis-tris (pKa 6.4). For assays requiring lower or higher
pH, we recommend pyridine (pKa 5.25) and ethanolamine (pKa 9.5), respectively. In
Table 1.1 and Table 1.2, for anionic and cationic ITP, respectively, we summarize
several useful buffer examples. We take HCl as the anionic LE ion and sodium as the
cationic LE ion, and we assume 100 mM ionic strength of the LE buffer. The reader will
note that buffer ionic strength in our protocols (and in
Table 1.1 and Table 1.2) is always greater than or equal to 10 mM. While in theory the
physics of ITP applies at ionic strength lower than 10 mM, natural contaminants (e.g.,
carbonic acid from reaction between water and atmospheric carbon dioxide) near the
1 mM level often limit the practical use of low ionic strength buffers.
Table 1.1 Effective mobility magnitude (× 10-9 m2/V/s) of adjusted pure analyte zone in anionic ITP where
the LE is 100 mM HCl and 200 mM buffering counterion.

16
TE anion (pKa -1) Buffering counterion (pKa +1) MES (6.10) MOPS (7.20) HEPES (7.50) tricine (8.15)
ethanolamine (9.50) 21.41 20.40 17.38 22.85 tris (8.08) 21.00 19.23 15.84 17.56 bis-tris (6.40) 18.22 10.41 7.30 5.23 pyridine (5.18) 1.01 3.72 2.42 1.48
Table 1.2 Effective mobility magnitude (× 10-9 m2/V/s) of adjusted pure analyte zone in cationic ITP where
the LE is 100 mM sodium and 200 mM buffering counterion
TE cation (pKa +1) Buffering counterion (pKa -1) ethanolamine
(9.50) tris (8.08) bis-tris (6.40) pyridine
(5.18) MES (6.10) 35.57 21.96 16.39 10.45 MOPS (7.20) 35.47 20.92 9.76 3.93 HEPES (7.50) 35.35 19.97 7.77 2.88 tricine (8.15) 34.77 16.72 4.50 1.44
We note that signal transduction mechanism is not limited to the assays presented in this
protocol. As discussed briefly in Section 1.1.5, in plateau mode purified zones can be
detected via changes in local conductivity, UV absorbance, temperature, or index of
refraction. In our own group, we have developed a method which utilizes fluorescent
carrier ampholytes for sensitive detection and identification of unknown analytes.6 In
peak mode experiments, specific probes can be used to label focused analytes. In one
example, we use molecular beacons – oligonucleotide probes that fluoresce upon
hybridization to their target sequence – to detect target DNA or RNA molecules with
high specificity.11,19
While ITP is relatively robust to dispersion caused by pressure-driven flow and EOF,
excessive EOF can lead to stagnation of the ITP interface, where the mean EOF velocity
becomes equal to the ITP velocity.14 Such strong EOF occurs especially in conditions of
high pH and low ionic strength. For this reason, we recommend the use of buffers with

17
pH 8 or lower and with ionic strength on the order of 100 mM if convenient. In our
experience, PVP is the most effective coating for EOF suppression in borosilicate chips.
However, because of its sieving properties, PVP may not be appropriate for some
applications, such as focusing genomic DNA. In experiments, we observe that addition of
PVP can greatly reduce genomic DNA absolute mobility (to the point where it does not
focus). In these cases a silanol coating such as Sigmacote (available from Sigma-Aldrich)
in conjuction with a surfactant (e.g., Triton-X 100) can also be effective in reducing
EOF.10
Table 1.3 Typical reagents and equipment used for basic ITP experiments.
REAGENTS Name Company Catalogue # Comments
Distilled water GIBCO 10977 RNase/DNase free Clorox Ultra Clorox 02489CT
sodium hydroxide (NaOH) Mallinckrodt 7708 hydrochloric acid (HCl) EMD Chemicals HX0603-4
Trizma base (tris) Sigma-Aldrich T6066 polyvinylpyrrolidone (PVP) Polysciences Inc. 06067 MW 1,000,000
HEPES Sigma-Aldrich H-4034 Alexa Fluor 488 carboxylic
acid Invitrogen A20000
tricine Sigma-Aldrich T-9784 bis-tris Sigma-Aldrich B4429 EDTA GIBCO AM9260G
Triton-X 100 Sigma-Aldrich X100 lysozyme Sigma-Aldrich L6876
SYBR Green II Invitrogen S7564 ethanolamine Sigma-Aldrich 411000
Rhodamine 6G Acros Organics (Geel, Belgium)
CAS 989-38-8
L-Amino Acids Sigma-Aldrich LAA21 Power SYBR® Green RNA-
to-CT™ 1-Step Kit Applied
Biosystems 4389986
PCR primers Integrated DNA Technologies
–

18
EQUIPMENT Name Company Catalogue # Comments
Borosilicate microfluidic chip
Caliper Life Sciences Inc.
NS12A Supplied with or without plastic caddy
Vacuum pump Gast DOA-P104-AA Sourcemeter Keithley 2410 Constant current and
constant voltage operation modes
Inverted epifluorescent
microscope
Olympus IX70 Use mercury lamp (Olympus) or LED
(Thorlabs) for illumination
Filter cube Omega XF115-2 Ex/em: blue/green Safe-lock
microcentrifuge tubes Eppendorf 022363204 1.5 mL capacity
Centrifuge Eppendorf 5417C
1.1.7 Equipment and reagents needed for ITP experiments
Here we present a list of equipment and reagents used to carry out the protocols outlined
in the previous sub-sections. This is not meant to be a comprehensive list, but rather a
starting point for labs wanting to use/study ITP, and to incorporate ITP into their current
assays and workflows.
1.2 High-specificity nucleic acid detection
For the remainder of this thesis, we will focus solely on ITP-based nucleic acid
hybridization assays. In this section, we introduce and review an important aspect of
nucleic acid detection, namely methods commonly used to achieve sequence-specificity.
Gene profiling requires the ability to discriminate between nucleic acids with a high
degree of sequence similarity. This is particularly important for detection of microRNAs,
which is the subject of Chapter 3. Here we review basic aspects of nucleic acid
hybridization (e.g., equilibrium thermodynamics and reaction kinetics), discuss a useful

19
online tool for folding and hybridization predictions, and present several methods which
make use of differential equilibrium thermodynamics and kinetic rates to detect nucleic
acids with high specificity.
1.2.1 Nucleic acid hybridization models
Modeling two-state nucleic acid hybridization
The ability to predict the interaction between two complementary or nearly-
complementary nucleic acid molecules is central to the design of hybridization assays.
The process of hybridization is described by a two-state model where molecules A and B
react to form duplex AB:
A + B AB . (1.1)
We can model this as a second-order reaction with on- and off-rate kinetics described by
kon and koff, respectively. The ordinary differential equations which describe the reaction
rates for a homogeneous reaction volume are,
dcABdt
= koncAcB − koff cAB , (1.2)
dcAdt
= −koncAcB + koff cAB , (1.3)
dcBdt
= −koncAcB + koff cAB . (1.4)
Here ci represents the molar concentration of species i. These equations accurately
describe the dynamics of hybridization reactions, particularly for short oligos at low
concentration.20,21

20
Equilibrium limit and thermodynamic description
The most widely known limit of the second order equations describing hybridization,
equations (1.2)-(1.4), is the equilibrium or steady-state limit, where the reaction reaches
completion ( t→∞ ). In this limit, the rate of duplex formation, equation (1.2), reduces:
0 = koncAcB − koff cAB . (1.5)
We rewrite this equilibrium statement in terms of the dissociation constant KD = koff / kon
as:
KD =cAcBcAB
. (1.6)
We note that the dissociation constant has units of concentration, typically expressed in
molar. A simple physical interpretation arises for reactions with equal amounts of A and
B: when cA = cB = KD, using equation (1.6) we find that cB = cAB and hence
cAB/(cA+cAB) = 1/2. KD is the concentration of free A and B at which exactly half of each
reactant exists in duplex form at equilibrium. When cA > KD more than half of reactants
will be hybridized at equilibrium and, conversely, for cA < KD less than half of reactants
will be hybridized at equilibrium. We note that KD is a function primarily of salt
concentration, sequence length, GC content (percentage of C or G nucleotides), and
temperature.
We refer to the temperature at which KD is equal to cA as the melting temperature, Tm.
This is one of the most useful parameters when designing hybridization probes. The
Van’t Hoff equation provides the critical link between KD and temperature, T, namely:
21
ΔG = −RT ln KD / c0( ) . (1.7)
Here ΔG = ΔH − TΔS is the change in Gibbs free energy between random coil
(unhybridized) and duplex (hybridized) states, R is the gas constant, and c0 is a reference
concentration chosen as c0 = 1 M. Rearranging this equation and evaluating KD at the
melting point, we find:
Tm =ΔH
ΔS − R ln 12cinitc0
⎛⎝⎜
⎞⎠⎟
. (1.8)
Here we have expressed melting temperature in terms of enthalpy (ΔH), entropy (ΔS),
and initial reactant concentration (cinit). We note that the reference concentration, c0, is
typically omitted from equations (1.7) and (1.8) for convenience, and it is assumed that
KD is expressed as a molar fraction.13,22 Equation (1.8) allows us to predict Tm by
estimating the thermodynamic parameters ΔH and ΔS. The next section discusses the
widely-accepted “nearest-neighbor” model, which can be used to easily and accurately
predict these thermodynamic parameters.
Nearest-neighbor model
The nearest-neighbor (NN) model for prediction of entropic and enthalpic contributions
to binding energy in nucleic acid hybridization was pioneered by Zimm23,24 and
Tinoco.25,26 This model recognizes that duplex stability is not simply a function of
sequence content (e.g., GC content), but also depends to a great extent on stacking
interactions determined by the local sequence of bases. This model assigns energetic
contributions to local pairs of adjacent bases rather than to single bases. For example, the

22
short sequence 5’-ACGTC-3’ is composed of the NN pairs AC, CG, GT, and TC. The
NN model postulates that the overall energy can be decomposed as the sum of energies
contributed by each NN pair. There is an additional contribution from terminal bases at
the ends of the molecule. For the sample sequence, there is an A-T base pair at the 5’ end
and a C-G base pair at the 3’ end. Hence, we can use the following formulas to
approximately predict changes in enthalpy and entropy:
ΔH = niΔHii∑ + nterm
A−TΔHtermA−T + nterm
G−CΔHtermG−C , (1.9)
ΔS = niΔSii∑ + nterm
A−TΔStermA−T + nterm
G−CΔStermG−C . (1.10)
Here the index i stands for the 10 different NN pairs (there are 10 distinct combinations
of the four NA bases), ni is the number of times NN pair i appears, and ntermA−T and nterm
G−C
are the number of terminal A-T and G-C base-pairs (where ntermA−T + nterm
G−C = 2 since each
duplex has only two ends). In addition, the subscripted and superscripted ΔH and ΔS
parameters are the corresponding contributions to enthalpy and entropy, respectively, for
each NN pair and terminal base-pair.
The NN parameters are measured based on hybridization experiments, typically
performed using short oligonucleotides approximately 10 nucleotides (nt) in length.27-30
We note that NN parameters differ between DNA and RNA. NN parameter sets have
been tabulated for DNA/DNA,27 RNA/RNA,28,29 and DNA/RNA (hybrid) duplexes.30 NN
parameters have also been evaluated for hybridization between slightly mismatched
molecules (e.g., containing 1-2 mismatched bases).31 The tabulated NN parameters can
then be used in conjunction with equations (1.8)–(1.10) to determine Tm.

23
Online tools that predict hybridization equilibrium parameters
Michael Zuker’s group at Rensselaer Polytechnic Institute has developed a
comprehensive nucleic acid equilibrium analysis tool which uses statistical mechanics
calculations to predict concentrations of all reactant species as a function of
temperature.32 These calculations predict concentrations of two reactants (A and B) in
seven forms: folded and unfolded (Au, Af, Bu, Bf), dimers (AA, BB), and duplex species
(AB). At its core, this simulation tool uses the NN parameters tabulated by other
researchers and discussed in the previous section. In addition, this tool is available online
(DINAMelt web server, found at http://mfold.rna.albany.edu) with a user-friendly
interface.33
We recommend using the “Hybridization of two different strands” tool when designing
DNA and RNA hybridization probes. This tool requires the user to input the following
parameters (with restrictions as noted here):
• Sequence 1: sequence of first strand (e.g., target molecule); sequence length
limited to 50 nt.
• Sequence 2: sequence of second strand (e.g., hybridization probe); sequence
length limited to 50 nt.
• Temperature range: typically 0 to 100°C in 1°C increments
• Nucleic acid type: choose between DNA and RNA hybridization; for DNA/RNA
hybrid helix we recommend choosing DNA (see sugimoto et al.30,31)
• Initial concentrations: initial concentration of strands 1 and 2
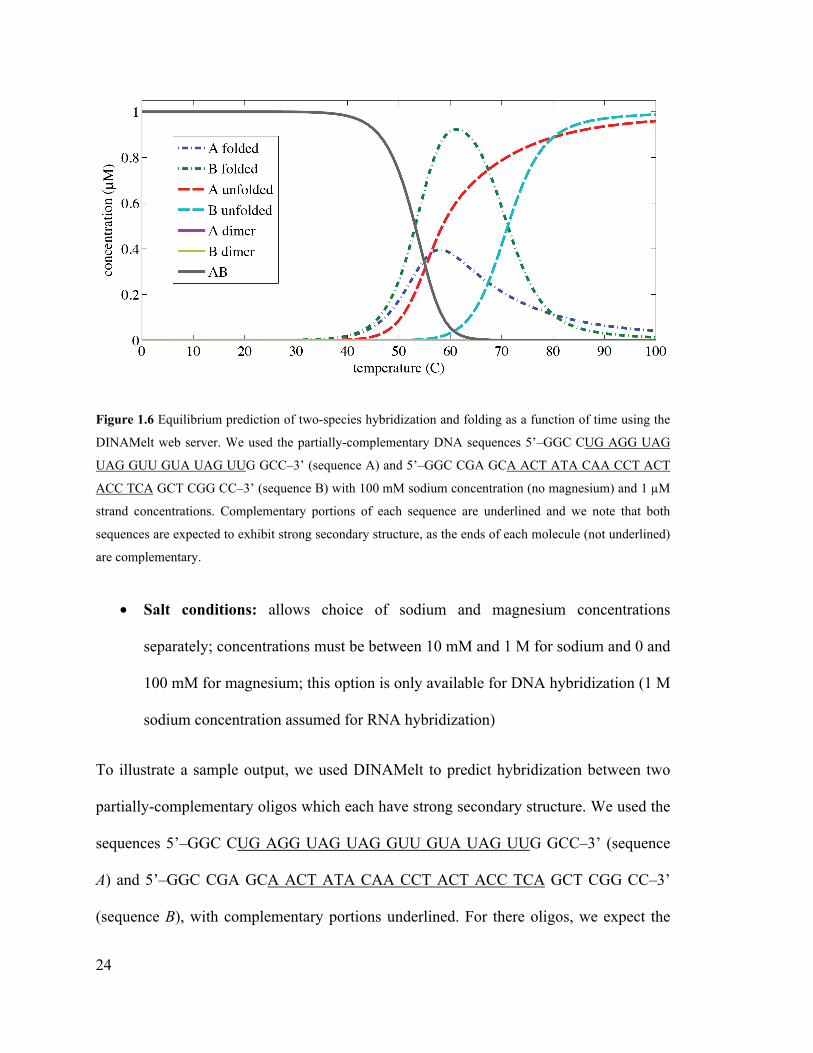
24
Figure 1.6 Equilibrium prediction of two-species hybridization and folding as a function of time using the
DINAMelt web server. We used the partially-complementary DNA sequences 5’–GGC CUG AGG UAG
UAG GUU GUA UAG UUG GCC–3’ (sequence A) and 5’–GGC CGA GCA ACT ATA CAA CCT ACT
ACC TCA GCT CGG CC–3’ (sequence B) with 100 mM sodium concentration (no magnesium) and 1 µM
strand concentrations. Complementary portions of each sequence are underlined and we note that both
sequences are expected to exhibit strong secondary structure, as the ends of each molecule (not underlined)
are complementary.
• Salt conditions: allows choice of sodium and magnesium concentrations
separately; concentrations must be between 10 mM and 1 M for sodium and 0 and
100 mM for magnesium; this option is only available for DNA hybridization (1 M
sodium concentration assumed for RNA hybridization)
To illustrate a sample output, we used DINAMelt to predict hybridization between two
partially-complementary oligos which each have strong secondary structure. We used the
sequences 5’–GGC CUG AGG UAG UAG GUU GUA UAG UUG GCC–3’ (sequence
A) and 5’–GGC CGA GCA ACT ATA CAA CCT ACT ACC TCA GCT CGG CC–3’
(sequence B), with complementary portions underlined. For there oligos, we expect the

25
balance between duplex formation and folding to shift as temperature increases Figure
1.6 shows species concentrations as a function of temperature as predicted by DINAMelt.
We see that AB duplex formation dominates for temperatures below 40°C and reduces in
the range of 40–70°C as folding becomes more favorable. Above ~80°C only the random
coil conformations remain.
1.2.2 Equilibrium-based specificity
Hybridization probe design is typically directed by equilibrium-based considerations, in
part because thermodynamic parameters–and hence melting temperatures–can be
predicted with a high degree of accuracy. Such considerations are aimed at maximizing
the difference in melting temperatures, ΔT, between target and mismatch sequences.
Probes which are linear and strictly complementary to their targets typically exhibit a
small ΔT, especially for single-nucleotide mismatches. Here we discuss two approaches
which can be used to increase ΔT: hybridization probes with secondary structure and
modified nucleic acids.
Secondary structure
Probes with inherent secondary structure can be used to enhance hybridization
specificity. Secondary structure introduces competition between probe folding (self-
hybridization) and duplex formation. Figure 1.7 illustrates this scheme for molecular
beacon probes, which were developed by Tyagi and Kramer.34,35 Molecular beacons are
hybridization probes with a hairpin-shaped secondary structure, which have a fluorophore
end-label at the 5’ end and a quencher end-label at the 3’ end. Typically, the internal loop
region of the probe is complementary to the target molecule and the stem region is short

26
(4-10 nt) and self-complementary. In the closed conformation, the proximity of the
quencher to the fluorophore inhibits fluorescence; hybridization to a target molecule
displaces the quencher and increases overall fluorescent signal.
Figure 1.7 Scheme for detection of nucleic acids using molecular beacon probes by Tyagi et al.35
Molecular beacons are stem-loop probes which are end-labeled with a fluorophore at the 5’ end and a
quencher at the 3’ end. In the closed conformation, close proximity of quencher and fluorophore reduces
fluorescent signal. Upon hybridization, displacement of the fluorophore and quencher results in an overall
increase in fluorescent signal.
Figure 1.8 shows experiments by Tyagi et al. which experimentally demonstrate
specificity and hybridization dynamics of molecular beacons with target and mismatch
molecules.34 For these experiments, molecular beacons were mixed in separate reactions
with: target, single-nucleotide mismatch, and single-nucleotide deletion. Time-course
fluorescence measurements demonstrate a large increase in fluorescence for only the
correct target molecule (a), while the single-mismatch and deletion molecules exhibit
only a minimal increase in fluorescence. These experiments demonstrate the specificity
of molecular beacons both in their initial hybridization kinetics as well as their long-term
equilibrium behavior.

27
Figure 1.8 Experimental measurement of molecular beacon target and mismatch hybridization dynamics
by Tyagi et al.34 The hybridization on-rate rate is largest for the complementary target molecule (a), and
much lower for molecules containing a single substitution (b) or a single deletion (c).
We recommend using the DINAMelt web server to optimize the design of hairpin-shaped
hybridization probes. As an example, we used DINAMelt to optimize stem length in
order to improve specificity between a target sequence (5’–
UGAGGUAGUAGGUUGUAUAGUU–3’) and a single-nucleotide mismatch sequence
(5’-UGAGGUAGGAGGUUGUAUAGUU-3’). In Figure 1.9a, we plot the predicted
equilibrium duplex fractions for probe-target and probe-mismatch reactions as a function
of temperature for a linear probe (0 nt stem) and hairpin probes with 6, 8, and 10 nt long
stems. Increasing stem length lowers overall melting temperatures and increases the
difference in melting temperature, ΔT, between target and mismatch molecule reactions.

28
In particular, predicted ΔT is approximately 2°C for linear probes and increases to 3, 6,
and 9.5°C for the 6, 8, and 10 nt stem designs, respectively.
To demonstrate that longer stems increase specificity, we further plot the ratio of
mismatch and target duplex fractions in Figure 1.9b. This quantity predicts the assay
signal generated by mismatch molecules as a percentage of signal generated by target
molecules (at equal concentrations). We see that specificity improves with increasing
stem lengths, with minimum signal ratio dropping from 39% for linear probes to 9% for
hairping probes with a 10 nt stem.
Figure 1.9 Design and optimization of hairpin probe design using melting curve predictions generated by
the DINAMelt web server. (A) Duplex fraction as a function of temperature for target (5’–UGA GGU
AGU AGG UUG UAU AGU U–3’; blue line) and mismatch (5’–UGA GGU AGG AGG UUG UAU AGU
U–3’; red dashed line) sequences and for linear (0 nt) and hairpin probe designs (6, 8, and 10 nt long stem).
Longer stems result in lower overall melting temperatures and larger separation between melting curves.
(B) Ratio of mismatch and target duplex fractions from part (A) used to evaluate probe specificity.

29
While longer or stronger (higher GC content) stems do result in greater specificity, this
specificity comes at a cost in hybridization rate. Figure 1.10 is reproduced from a study
by Tsourkas et al.,36 and shows experimentally-measured kinetic on-rates for molecular
beacons with stem lengths between 0 and 6 nt. These on-rates were measured using a
spectrofluorometer outfitted with a stopped-flow accessory. This instrument enables
automated and fast mixing of reactants followed by timed fluorescence measurements.
The measured kinetic on-rates range between 104 M-1s-1 for linear probes (0 nt stem)
down to ~40 M-1s-1 for a 6 nt stem. This dramatic reduction results in much longer
analysis, as the kinetic on-rate directly affects hybridization time. We therefore
recommend keeping stem lengths as short as possible for required stringency or using
additives (e.g., magnesium) to enhance hybridization kinetics.
Figure 1.10 Experimental measurements of kinetic on-rate for molecular beacons with varying loop
(probe) and stem lengths by Tyagi et al.36 Data show that kinetic on-rate decreases as stem length increases.

30
Modified nucleic acids
Another equilibrium-based approach for specificity enhancement is the use of
chemically-modified nucleic acid bases. These modifications generally do not occur
naturally and have to be synthesized chemically. Here we focus on locked nucleic acids
(LNA), one such modification which has gained popularity in recent years. LNAs are
similar to RNAs, but have an added bridge in the sugar between the 2’ oxygen and 4’
carbon, as illustrated in Figure 1.11. Due to the similarity between LNA, DNA, and
RNA backbones, oligos with hybrid LNA/DNA or LNA/RNA composition can be easily
synthesized.
Figure 1.11 Chemical structure of sugar backbone for (A) LNA, (B) DNA, and (C) RNA. LNAs have an
added bridge between the 2’ oxygen and 4’ carbon in the sugar backbone, which increases duplex stability
(for both LNA-DNA and LNA-RNA duplexes) and hybridization specificity. Figure taken from published
review by Mouritzen et al.37
LNAs increase stability of nucleic acid duplexes. Figure 1.12a shows experiments by
You et al.38 which measure duplex stability as a function of salt concentration for probes
with varying LNA composition. In these experiments the target molecule is purely DNA.
Measured melting temperatures increase dramatically with LNA composition. For
example, probes with 50% LNA composition have ~20°C higher melting temperature
than pure DNA probes. Melting curves shown in Figure 1.12b additionally demonstrate

31
specificity enhancement using LNAs. Including three LNA bases (referred to as an “LNA
triplet”) around the site of a mismatch increases ΔT approximately 3-fold, from ~5°C to
~15°C.
You et al. explored a variety of LNA probe designs and determined that an LNA triplet
generally provides the largest boost in specificity. In a recent study, Owczarzy et al.
characterize the NN thermodynamic parameters for LNA triplets. In the experiments,
they used several short oligo designs, 10-12 nt in length, with a single mismatch in the
middle position of the LNA triplet.39 Figure 1.13 shows measured differences between
LNA and DNA free energy of duplex destabilization, ΔΔG = ΔG(mismatch)-ΔG(match),
averaged for all possible neighboring base pairs. These data demonstrate that LNA
triplets generally increase specificity, with the exception for +G-T and +C-A interactions.
For these latter cases, the authors advise finding other means of mismatch discrimination,
as LNAs tend to reduce specificity.
Figure 1.12 Experimental demonstration of LNA duplex stability and specificity by You et al.38 (A)
Melting temperatures of hybridization probes with varying LNA composition: no LNA bases (1DNA), one
LNA triplet (1T), LNA in every third position (1ET), LNA in every other position (1ES). Increasing LNA
composition increases duplex stability monotonically. The dependence of melting temperature on salt
concentration is similar for all probe types. (B) Melting curves for target and mismatch molecules using the
1DNA (1p, 1m) and 1T (2p, 2m) probe sets. 1T probes, which contain an LNA triplet at the mismatch site,
show greater stability and specificity compared to pure DNA probes.

32
Figure 1.13 Experimental demonstration of differences between LNA and DNA free energies of duplex
destabilization, ΔΔG = ΔG(mismatch)-ΔG(match), by Owczarzy et al.39 For each type of mismatch, results
are averaged for all possible neighboring base pairs within the LNA triple; error bars indicate range from
minimum to maximum value in the set.39 The data demonstrate that LNA triplets enhance specificity in
most cases. However, LNAs can also reduce specificity especially for +G-T and +C-A mismatches.
Exiqon and Integrated DNA Technologies each provide online tools to predict properties
(e.g., melting temperature) of perfectly-matched LNA-DNA and LNA-RNA duplexes.
The respective web sites can be found at http://www.exiqon.com/oligo-tools and
http://www.idtdna.com/analyzer/Applications/OligoAnalyzer/, respectively. The Exiqon
tool additionally predicts secondary structure and dimer formation. It is important to
remember that the enhanced stability of LNAs can easily result in extremely stable
dimers and probe secondary structure. These unwanted artifacts are difficult to predict
using modeling tools and can significantly affect probe performance (e.g., reduce extent
of hybridization and kinetic on-rates). For this reason, we recommend using LNA bases
only sparsely.

33
1.2.3 Reaction kinetics-based specificity
In this section we discuss hybridization assays which use differences in dissociation
kinetics to enhance hybridization specificity.
Two-stage assays
The most common method used to enhance specificity through differences in kinetic rates
is two-stage hybridization. We refer to assays which use an equilibrium hybridization
step followed by a wash step as “two-stage” assays. In these assays, one reactant must be
contained (e.g., immobilized on a surface or inside a volume-filling matrix) while the
other reactant is typically free to flow and diffuse. In the hybridization step, probes and
sample molecules are incubated for a long time, until they reach equilibrium; the free
reactant, A, becomes trapped in the matrix when it binds to the immobilized reactant, B.
In the “wash” step, all excess A molecules (which have not bound) are removed through a
rinsing process. Washing is typically accomplished by rinsing the reaction
surface/volume with fresh buffer for an extended period of time.
Two important molecular biology techniques which use two-stage hybridization are
northern blotting and DNA microarrays. Northern blotting is an RNA analysis technique
used to detect and identify RNA molecules by both size and sequence.40 RNA molecules
are first separated using slab gel electrophoresis and then transferred and immobilized
onto a nitrocellulose membrane. Two-stage hybridization is then performed using this
membrane by first incubating in a solution of hybridization probes and then rinsing with
clean buffer. DNA microarrays are used to perform highly-multiplexed nucleic acid
quantification.40,41 This technique uses a glass slide onto which as many as ten thousand
or more hybridization probes are immobilized in separate locations. Sample DNA is first

34
end-labeled with a fluorophore and then two-stage hybridization is performed by
incubating sample solution with the microarray slide. Following hybridization, the glass
slide is rinsed with clean buffer solution.
A significant advantage of two-step assays is that they do not require complicated signal
transduction mechanisms, which can adversely affect assay performance (e.g., sensitivity
of molecular beacon assays is limited by large background signal due to imperfect
quenching). In addition, we will show that two-stage assays leverage differences in
dissociation rates between target and mismatch molecules to enhance assay specificity.
Melting dynamics of the “wash” step
In the wash step, species A (the free reactant) is rinsed away for an extended period of
time. We model the active removal of species A by letting cA = 0 for t ≥ t0, where t0 is the
duration of the initial hybridization step. This assumes that the time scale at which free A
molecules are rinsed away is much shorter than the characteristic hybridization time
scales. Under this assumption, the rate of duplex formation, equation (1.4), reduces to,
dcABdt
= −koff cAB . (1.13)
We can easily integrate this equation and arrive at an analytical result,
fAB t ≥ t0( ) = e−koff t− t0( ) . (1.14)
Here t0 is the time at the end of wash step, and fAB(t) = cAB(t)/cAB(t0) represents the fraction
of duplexes which remain hybridized, for t ≥ t0. In this limit, equation (1.14) predicts
duplex concentration decays exponentially with koff.

35
The relative amount of signal generated by non-specific hybridization to a mismatch
molecule is simply the mismatch-to-target ratio of duplex fractions,
Swash =exp −koff
mmt( )exp −koff
T t( ) = exp − koffmm − koff
T( ) t − t0( )⎡⎣ ⎤⎦ . (1.15)
Here superscripts denote dissociation rates for target (T) and mismatch (mm) molecules.
Here S is in some sense a measure of specificity: lower values of S correspond to higher
specificity. We note that equation (1.15) represents the specificity enhancement in
addition to the equilibrium-based specificity gained during the initial hybridization stage.
Equation (1.15) promises perfect discrimination between target and mismatch molecules
(Swash ≈ 0) at long times (t ∞). However, at long times the assay signal, proportional to
equation (1.14), also tends to zero. We characterize the tradeoff between signal loss,
equation (1.14), and specificity gain, equation (1.15), using the ratio of timescales
corresponding to each process,
G =τ specτ sig
=koffmm − koff
T
koffT =
koffmm
koffT −1 . (1.16)
We here define a wash parameter, G, which is typically positive (assuming mismatches
reduce duplex stability). G can be interpreted as the rate of specificity enhancement
relative to signal loss. For large G, specificity enhancement comes at a lesser cost to
sensitivity. We note that the dissociation constants, and therefore G, can be optimized by
tuning temperature, denaturants, and salt concentration. Due to the close relationship
between kinetic rates and the equilibrium constant, improvements in equilibrium-based
specificity (discussed in Section 1.2.2) will likely also increase G.

36
Figure 1.14 Experimental measurements of hybridization kinetics of fully-complementary and mismatched
sequences by Gotoh et al.41 Differences in equilibrium constant between target and mismatch molecules are
accompanied by differences in kinetic association and dissociation rates.
Effect of mismatches on hybridization kinetics and specificity enhancement
Figure 1.14 shows measurements of kinetic rates performed by Gotoh et al. for target
and mismatch molecules under low-stringency conditions (e.g., 1 M sodium buffer at
37°C).41 With the exception of mismatches located near molecule ends (i.e., near the 5’ or
3’ end), mismatched molecules generally exhibit lower association rates and higher
dissociation rates. In particular, internal mismatches can increase dissociation rates nearly
10-fold (e.g., compare dissociation rates for 401C and 428C in Figure 1.14).
We here demonstrate how a wash step can leverage these differences in dissociation
kinetics to enhance specificity. In Figure 1.15 we evaluate equations (1.14) and (1.15)
using koff values in the range measured by Gotoh et al.41 As expected, duplex dissociation
causes both target and mismatch duplex fractions to decrease with time, thereby reducing
assay sensitivity (Figure 1.15a). However, specificity improves with wash time since
dissociation rates are generally larger for mismatch molecules, koffmm > koff
T (Figure 1.15b).
For these mismatch cases, we see that a larger value of the wash parameter, G, indicates
faster specificity enhancement at a lesser cost to sensitivity.

37
Figure 1.15 Predicted melting dynamics and specificity enhancement of wash step in a two-stage assay.
We evaluate equations (1.14) and (1.15) (plot A and plot B, respectively) using dissociation rates measured
by Gotoh et al.41 Sequences correspond to 401C, 426C, and 428C in Figure 1.14.
A study by Ikuta et al., conducted using a similar apparatus as Gotoh et al., additionally
examined the effect of temperature on dissociation rates.42 They measured dissociation
rates of short oligos (19 nt long) with single-nucleotide mismatches located at an internal
position. They found that koff generally increases with temperature at a rate which
depends on the type of mismatch. We use their measurements (not shown) to predict the
dependence of the wash parameter G on temperature using equation (1.16) in Figure
1.16. For these oligos, the data show that most mismatch types have an optimum G at an
operating temperature of approximately 50°C. The sole exception is the G-T mismatch,
which is largest at 60°C. The G-T base pair is known to form the most stable non-
Watson-Crick interaction.31 This explains why the G-T mismatch type has the lowest
overall wash parameter values.

38
Figure 1.16 Evaluation of the wash parameter, G = koffmm / koff
T −1 , defined by equation (1.16), as a
function of temperature for hybridization of single-nucleotide mismatch sequences. G is a measure of the
tradeoff between loss of signal and gain in specificity during the two-stage hybridization wash step. We use
dissociation rate measurements of Ikuta et al. performed at temperatures of 40, 50, and 60°C to evaluate
G.42 We observe nearly all hybrids have an optimum G at ~50°C with the exception of the G-T wobble base
pair, which is significantly more stable than the others and therefore exhibits the lowest overall G values.
In contrast to the cases above, mismatches near molecule ends typically have a smaller
effect on melting temperature. For example, the data of Ikuta et al. reproduced in Figure
1.14 shows that a sequence with a single mismatch at both ends (sequence 425C) has
nearly identical kon, koff, and KD as the target sequence (sequence 401C). Interestingly,
mismatches near a molecule’s 5’ or 3’ ends have a strong effect on activity of ligase
enzymes. Ligase enzymes (e.g., T4 DNA ligase) catalyze joining of two NA strands
hybridized to a third NA strand in adjacent positions (i.e., such that the 5’ end of one
strand touches the 3’ end of the other). Pritchard and Southern showed that T4 DNA
ligase activity decreases dramatically in the presence of a single mismatch within 8 nt of
the ligation site.43 This has led researchers to develop ligase-based signal transduction

39
methods which enhance specificity. For example, Patrick Doyle’s group at MIT
developed a microRNA profiling in which T4 DNA ligase attaches a fluorescent reporter
oligo to captured microRNA molecules.44 Using this approach, they demonstrate that the
target sequence (let-7a) generates higher signal than other closely-related sequences with
mismatches near the 3’ end. However, they do not demonstrate the effectiveness of this
approach for mismatches which are not located within 8 nt of the 3’ end.
Optimization of wash conditions
As noted above, factors which enhance differences in KD between target and mismatch
molecules also tend to enhance differences in kon and koff. Wash conditions can therefore
be optimized through buffer ionic strength (salt concentration), denaturants, and
temperature. Recent studies by Válóczi45 et al. and Korkola et al.46 provide two examples
of wash optimization performed by changing buffer ionic strength (salt concentration)
and temperature. The study by Válóczi et al. describes a modified northern blot assay
which uses LNA hybridization probes and compares two wash conditions: 1) 300 mM
salt concentration at 35-45°C (low stringency), and 2) 15 mM salt concentration at 65°C
(high stringency).45 Their data demonstrate enhanced sensitivity over traditional northern
blots, which typically use linear DNA probes. They also observed improved single-
nucleotide specificity, especially for high stringency conditions.
In their DNA microarray experiments, Korkola et al. varied temperature to optimize
accuracy of their bacterial cDNA measurements.46 As a metric, they monitored the
standard deviation of their test results (expected to increase as specificity improves) and
also compared their results with qPCR quantification. They observed that washing at
higher temperature reduced overall signal significantly, but generally increased standard

40
deviation up to an optimal temperature of ~55°C. At this optimal temperature, they also
demonstrate better agreement between microarray and qPCR measurements.
1.3 Scope of thesis
The objective of this thesis is to improve the state of the art in nucleic acid hybridization,
with a particular focus on analysis of non-coding RNA molecules called microRNAs. We
achieve this by using a microfluidic platform, electrokinetic focusing to enhance
hybridization, and photopatterned hydrogels to perform affinity purification. The thesis is
composed of two main chapters. In Chapter 2 we present our two-stage method for
nucleic acid hybridization and purification of reaction products and demonstrate its limit
of detection and dynamic range under low-stringency conditions. In Chapter 3 we present
modifications to this assay, including changes to buffer composition and hybridization
probes, which enable detection of let-7a microRNA with single-nucleotide differences.
We also present a numerical model which elucidates the thermodynamic and kinetic
contributions to specificity. Finally, we validate our method by comparison with an
established method for microRNA detection (Taqman qRT-PCR). In Chapter 4 we
summarize our work, describe our main achievements, and present recommendations for
future directions in ITP-based microRNA detection.

41
2 Integration of ITP and Affinity Purification Hydrogels
Several sections of this Chapter are based on a recent article published in Analytical
Chemistry, and are reproduced here with minor modifications.†
2.1 Introduction
We present an electrokinetic assay which integrates isotachohporesis (ITP) and a
photopatterned DNA-functionalized hydrogel for rapid and sensitive nucleic acid (NA)
detection. ITP preconcentrates NAs to enhance the hybridization reaction between target
molecules and fluorescently-labeled complementary oligonucleotides, which we term
“reporters”. After this reaction, ITP drives products into a DNA-functionalized hydrogel
which removes excess unreacted reporters from the focused ITP zone, drastically
reducing background signal. Our approach is generally applicable to detection of any NA
(e.g., DNA, mRNA, etc.).
We here present detection of synthetic microRNAs as one example quantitative
demonstration of our assay. microRNAs are short (~22nt) non-coding molecules which
play an important role in gene silencing within the cell.47 Dysregulation of microRNA
expression has been linked to multiple forms of cancer, and is considered an important
diagnostic and prognostic signature.48-51 Absolute quantification of microRNA species
† G. Garcia-Schwarz and J.G. Santiago, “Integration of on-chip isotachophoresis and functionalized hydrogels for enhanced-sensitivity nucleic acid detection,” Analytical Chemistry, vol. 84, 2012, pp. 6366–6369.

42
presents four main challenges: (1) microRNAs are low in abundance, together making up
only about 0.1% (w/w) of a cell’s total RNA content,52 (2) concentrations of a single
microRNA species can vary by over three orders of magnitude,53 (3) microRNA species
can differ by as little as a single nucleotide,50,51 and (4) so-called “mature” microRNA
species must be distinguished from “precursors” sharing the full mature sequence.50,51
Given these constraints, a clinically-viable microRNA detection assay will require
picomolar or better sensitivity (e.g., assuming 10,000 cells, or approximately 100 ng total
RNA, as starting sample), greater than 3 orders of magnitude dynamic range, and single-
nucleotide specificity. In addition, the assay should perform absolute quantification and
deliver an answer in a relatively short amount of time. Currently, sensitive microRNA
detection is typically performed with qPCR, which boasts near-single-molecule
sensitivity, high selectivity, and 107-fold dynamic range.53 However, PCR amplification
also has well-known drawbacks: it is sensitive to contamination, offers inaccurate
quantification (limited to 2- to 4-fold changes in expression), requires validated internal
reference genes, and is not easily automated for use in clinical settings.50,51,54-56 In
contrast, traditional northern blotting is highly-quantitative yet takes days to complete
and requires large amounts of sample (~10 µg of total RNA, or approximately
106 cells).50 Microarrays are capable of a large degree of multiplexing, absolute
quantification, and high sensitivity (in the 1 fg range), but require incubation for hours or
days to achieve these limits.57-59 Sequencing is emerging as a unique platform for small
RNA discovery, but is ill-suited to diagnostics because it is sample-hungry, requires
expensive equipment and reagents, and can take up to two weeks to complete.51 We
previously employed molecular beacons and ITP for NA detection and demonstrated

43
rapid (~2 min), accurate assays capable of absolute quantification.11,19 However, the
molecular beacons-based assays are limited to about 2 orders dynamic range and 100 pM
sensitivity due to significant background signal associated with quenching
inefficiencies.50
We here present an assay that integrates ITP-aided hybridization with a functionalized
hydrogel matrix to overcome these drawbacks. ITP is an electrokinetic focusing
technique that utilizes a heterogeneous buffer system, composed of a leading (LE) and
trailing electrolyte (TE), to achieve up to million-fold preconcentration in about 2 min.1
We use ITP preconcentration to enhance hybridization of target microRNA molecules
with fluorescently-labeled oligos we term a “reporters” (Figure 2.1a).60 We then migrate
the ITP zone through a DNA-functionalized hydrogel where unreacted reporters are
removed through affinity interactions (Figure 2.1b). Following the functional gel region,
the concentration of unreacted fluorescent probes is minimized, significantly reducing
background signal.
Our technique addresses three out of the four main challenges posed by microRNA
detection. Namely, our assay exhibits 4 orders of magnitude dynamic range, limit of
detection (LOD) on the order of 1 pM, and selectivity for mature microRNAs, all
achieved in less than 10 min. Additionally, our assay performs accurate absolute
quantification of microRNA expression. We will address assay specificity as part of the
work presented in Chapter 3.

44
Figure 2.1 Integration of on-chip ITP and affinity hydrogel enables sensitive NA detection. (A) Schematic
of ITP-based hybridization enhancement. ITP enables rapid mixing and approximately 10,000-fold
preconcentration of NAs and fluorescent reporters in a picoliter volume. Preconcentration drives forward
reaction between target and reporter molecules, dramatically decreasing hybridization time.
(B) Experimental images demonstrating ITP hydrogel capture. The ITP-focused fluorescent oligo migrates
through the hydrogel, which is functionalized with probes complementary to reporters. Thus, the capture
gel continuously immobilizes unreacted reporter molecules. After the ITP zone sweeps by, we observe a
weak fluorescent signal left behind in the gel, corresponding to captured unused probes.
2.2 Materials and methods
2.2.1 Reagents and materials
We purchased trizma base, 4-(2-Hydroxyethyl)piperazine-1-ethanesulfonic (HEPES), 3-
(trimethoxysilyl)-propyl methacrylate, 40% acrylamide/bisacrylamide (29:1), and 70%
perchloric acid from Sigma-Aldrich (St. Louis, MO). We purchased the photoinitiator
2,2-azobis[2-methyl-N-(2-hydroxyethyl) propionamide] (VA-086) from Wako Chemicals
(Richmond, VA). We also purchased hydrochloric acid from J.T. Baker (Avantor
Performance Materials, Center Valley, PA); and Tris-EDTA buffer, magnesium chloride,

45
and 30% hydrogen peroxide from EMD biosciences (Gibbstown, NJ). We purchased
glacial acetic acid and sodium hydroxide from Mallinckrodt Chemicals (Avantor
Performance Materials, Center Valley, PA). The DNase/RNase-Free distilled water and
pre-mixed 1M Tris-HCl pH 8 was purchased from GIBCO (Carlsbad, CA). We
purchased formamide from Invitrogen (Carlsbad, CA). We purchased the synthetic DNA
and RNA oligonucleotides listed in Table 2.1 Synthetic oligonucleotide sequences with
associated purification methods and purity estimates. Purification methods included high
pressure liquid chromatography (HPLC) and polyacrylamide gel electrophoresis (PAGE).
from Genelink (Hawthorne, NY) and Integrated DNA Technologies (Coralville, IA). We
stored reconstituted oligos in either Tris-EDTA buffer (let-7a precursor) or 10 mM Tris-
HCl (all others), and stored these oligo stock solutions at either -20°C or -80°C in 5–
20 µl aliquots.
Table 2.1 Synthetic oligonucleotide sequences with associated purification methods and purity estimates.
Purification methods included high pressure liquid chromatography (HPLC) and polyacrylamide gel
electrophoresis (PAGE).
Name Type Sequence Purification method
Purity*
let-7a RNA 5-UGA GGU AGU AGG UUG UAU AGU U-3 HPLC ~92% miR-15a RNA 5-UAG CAG CAC AUA AUG GUU UGU G-3 HPLC ~90% let-7a precursor
RNA 5-UGG GAU GAG GUA GUA GGU UGU AUA GUU UUA GGG UCA CAC CCA CCA CUG GGA GAU AAC UAU ACA AUC UAC UGU CUU UCC UA-3
PAGE ~40%**
acr-7a DNA 5-/Acr/ ATG AGG TAG TAG GTT GTA TAG TT-3
HPLC ~97%
acr-loop-pre7a
DNA 5-/Acr/ AAT CTC CCA GTG GTG GGT GTG ACC CTA A-3
HPLC ~96%
rep-7a DNA 5-/Cy5/ AAA CTA TAC AAC CTA CTA CCT CA-3
PAGE ~99.9%
*Purity estimates based on estimates provided by suppliers (IDT/Genelink) or as measured with the Agilent Bioanalyzer 2100. **See Figure 2.2 for purity estimate of synthetic let-7a precursor

46
Figure 2.2 Electropherogram analyses (using Agilent Bioanalyzer 2100 electrophoresis instrument) of let-
7a mature and precursor synthetic RNA oligos. Synthesized mature sequence of microRNA results in a
sharp size distribution (top), suggesting high purity. However, difficulties in synthesizing longer RNA
result in an electropherogram peak for the precursor sequence (bottom) which is much broader, suggesting
much lower purity. The vertical dashed lines represent ±6 nt about the length of the correct oligo sequence
(22 nt for mature, 80 nt for precursor). We estimate oligo purity by integrating this region and dividing by
the overall electropherogram integral. Using this method, we estimate the mature oligo is ~92% pure, while
the precursor oligo is only ~40% pure. We therefore attribute the high signal in experiments with pure
precursor shown in Figure 2.10 to low purity of the precursor oligo. We hypothesize that the broad
distribution contains a significant fraction of molecules containing the mature let-7a sequence, but lacking
all or a significant portion of the critical loop sequence targeted by the immobilized probes in the
functionalized gel designed for precursor removal.
We purchased borosilicate glass microfluidic chips (model NS260) and separate plastic
chip caddies from Caliper Life Sciences (Mountain View, CA). We attached chip caddies
using ultra-violet (UV)-curing optical adhesive (NOA-68) purchased from Norland
Products Inc. (Cranbury, NJ) and a UV lamp purchased from Zilla Products (Franklin,
WI).

47
We performed UV-initiated polymerization of polyacrylamide hydrogels by filling chips
with prepolymer solution, as described in Section 2.2.4, and placing chips atop a 365 nm
collimated LED lightsource (M365L2-C3) from Thorlabs (M365L2, Newton, NJ). We
measured UV lightsource intensity (approximately 5 mW/cm2 at the chip plane) using a
digital UV light meter (UV513AB, General Tools, New York, NY).
2.2.2 Experimental apparatus
All data were taken with a custom epifluorescent point-confocal microscopy setup
described by Bercovici et al.11,60 Figure 2.3 shows a schematic of the experimental setup.
Briefly, the setup consists of an inverted epifluorescent microscope (IX70, Olympus,
Hauppauge, NY) with 60x water-immersion objective (LUMPlanFL, Olympus,
Hauppauge, NY) and Cy5 filter cube (Cy5-4040A, Semrock, Rochester, NY). The
microscope was outfitted with an XYZ automated stage (ASI, Eugene, OR). A 642 nm
diode laser (Stradus-642, Vortran Laser Technologies, Sacramento, CA) was used for
illumination and a photomultiplier tube (PMT) module (H6780-20, Hamamatsu
Photonics, Japan) with data acquisition unit (C8908, Hamamatsu Photonics, Japan) for
detection. The PMT was powered by a function generator (E3631A, Agilent
Technologies, Santa Clara, CA) and operated at a rate of 66.7 Hz (15 ms sampling period
with 10 ms integration time). We used a high-voltage sourcemeter (2410, Keithley
Instruments, Cleveland, OH) to apply constant current to the microfluidic chip. We used
a custom MATLAB (R2007b, Mathworks, Natick, MA) program to control the high
voltage supply and PMT and to record data from both instruments.

48
Figure 2.3 Schematic of experimental setup. We built a custom point-confocal setup around an inverted
epifluorescent microscope which houses a high-numerical aperture objective and Cy5 filter cube. A custom
optical train with a 400 µm pinhole attached to the microscope side port excludes out-of-plane light and re-
focuses the captured light into the PMT module. We use a 635 nm diode laser connected to the microscope
via a multimode fiber optic cable. We control the position of the microfluidic chip using an automated
XYZ stage with controller. We use a high voltage sourcemeter to apply fixed current values to the
microfluidic chip. Both the sourcemeter and PMT power supply are controlled and monitored by computer,
using a custom MATLAB code.
2.2.3 Preparation of prepolymers, buffers, and surface modification reagents
Composition of our prepolymer is similar to that used by He et al.61 We prepared a
prepolymer mastermix in order to minimize variation in composition. We prepared this
mastermix by combining 1 M HCl (5.11 g), 1 M tris (10.3 g),
40% acrylamide/bisacrylamide (5.04 g), water (26.2 g), and magnesium chloride
(500 µl). We prepared the photoinitiator, VA-086, daily at a concentration of 2% (w/v).
Using these components and acrydite-modified oligos we prepared (daily) three distinct
leading electrolyte (LE) prepolymer mixtures:

49
LE0: 187 µl mastermix + 13 µl VA-086
LE1: 69 µl LE0 + 1 µl acr-loop-pre7a
LE2: 19 µl LE0 + 1 µl acr-7a
We found that fresh preparation of the photoinitiator VA-086 before each use was
important, as this reagent is unstable under exposure to light and in aqueous solution.62
The TE consisted of 10 mM HEPES, 20 mM Tris, and 90% formamide. Before each
experiment, we combined 90 µl TE, 7 µl water, and 1–2 µl target microRNA. We then
heated this mixture in a water bath at 60°C for 5 min to disrupt secondary structure and
then immediately placed on ice. Finally, we added 2 µl of 100 nM rep-7a to this mixture
(for a final volume of 100 µl) before using in the experiment. We refer to this mixture as
TE+S in the following sections and figures.
We prepared a surface modification mixture and used it to modify channel surface
properties and promote covalent attachment of hydrogel to the glass surface (see
Section 2.2.4 for details). This mixture consisted of 5:3:2 (v/v) DI water, acetic acid, and
3-(trimethoxysilyl)-propyl methacrylate.
2.2.4 Chip Preparation and Patterning of Functionalized Polyacrylamide Gels
To create mechanically-stable hydrogels within the microfluidic channels, we used the
surface-modifier 3-(trimethoxysilyl)-propyl methacrylate to covalently attach the
polyacrylamide gel to the glass channel surface. This method has been applied with great
success by the groups of Fréchet, Svec, and coworkers63 and Singh, Hatch, and
coworkers.64,65 For our work, we adapted the protocol reported by Hatch et al.64 We refer
50
to channel “rinsing” as filling all reservoirs and applying vacuum at reservoirs 3 and 7
using a single split vacuum line (see Figure 2.4 for chip layout). Our protocol can be
described as follows:
1. Rinse with 1 M sodium hydroxide for 10-20 min 2. Rinse with DI water for 1 min 3. Empty reservoirs and apply vacuum to dry for 1 min 4. Rinse with surface modification mixture for 5 min 5. Rinse with 30% acetic acid for 1 min 6. Rinse with DI water 1 min 7. Empty reservoirs and apply vacuum to dry for 1 min
Following this surface coating procedure, we filled the chip with prepolymer solution.
Figure 2.4 shows the chip layout. We filled reservoirs 1 through 6 with 10 µl LE0 (for
the limit of detection experiments, Figure 2.8) or LE1 (for the precursor experiments,
Figure 2.9) each and reservoirs 7 and 8 with 10 µl LE2 each. We then applied vacuum to
the microfluidic chip (at reservoirs 3 and 7) for approximately 1.5 min. We then carefully
removed both vacuum lines simultaneously and quickly transferred the chip to our UV
LED light source. Finally, we then exposed the entire chip with UV light (with
~5 mW/cm2 intensity) for 10 min.
Following UV exposure, we flushed away unattached oligos from the channel by
applying 3 µA current between reservoirs 8 and 1 for 5 min. For the precursor removal
experiments (c.f., Figure 2.9), we first replaced the contents of reservoirs 1 and 6 with
buffer consisting of 100 mM HCl, 200 mM Tris, and 2.5 mM MgCl2, and then applied
3 µA current between reservoirs 8 and 1 for 5 min and between reservoirs 8 and 6 for
1 min to flush away unattached oligos.

51
Figure 2.4 Caliper model NS260 microfluidic chip layout and indication of dispensed solutions (green),
voltage program (blue), detection stations (red), and functionalized hydrogel layout (brown and purple).
TE+S, TE, and LE were all dispensed prior to initiation of the voltage program. We applied the voltage
program as described in Section 2.2.5 and Table 2.2. We used detection station 1 (DS1) to monitor the
peak location during injection. Once the peak passed DS1, we waited 5 s before turning off the voltage
supply and switching the ground electrode from reservoir 1 to reservoir 6. We then commenced the
detection voltage program and moved the detector to DS2.
2.2.5 Assay operation and data analysis
We performed our assay immediately following chip preparation, as described in the
previous section. In future work, we hope to explore methods of preparing and storing
our hydrogel devices. Our assay operation consisted of two stages: sample injection and
signal detection. In the first stage, we injected target molecules and reporters
continuously through a semi-infinite injection. In the second stage, we switched the
source of TE anions to a secondary TE reservoir containing only TE (without target or
reporter molecules). We used this two-stage, “finite injection” strategy in order to
eliminate increase in background signal during the capture phase of the experiment. We
found that this injection mode provided larger enhancement ratios and therefore

52
improved sensitivity and dynamic range (compared to a semi-infinite injection scheme
where we continuously draw target from the same TE reservoir).
We first cleaned the contents of reservoirs 1 and 6 by filling repeatedly with water and
then replaced their contents with TE+S and TE, respectively. We then carried out the
sample injection and detection sourcemeter protocols summarized in Table 2.2. Sample
injection ended when the ITP zone reached detection station 1 (DS1), as shown in the
chip schematic of Figure 2.4. Sample injection lasted ~410 s. For sample injection we set
the laser to 1 mW power output. We then switched the ground electrode to reservoir 6
and performed the detection portion of the protocol, which lasted ~190 s and ended with
detection of the focused hybridized reporters at DS2 (see Figure 2.4). For sample
detection we set the laser to 1 or 4 mW power output.
Table 2.2 Sourcemeter current program. We applied 1 µA constant current between ground (GND) and
positive (HI) electrodes. A dash “-” under the reservoir listing indicates a floating voltage potential.
Reservoir # Name Duration (approx.)
[s]
Laser power [mW]
1 2 3 4 5 6 7 8
Injection 410 1 GND - - - - - - HI Detection 190 1–4 - - - - - GND - HI
Data analysis consisted of fitting a Gaussian to both injection and detection peaks, then
integrating these fitted Gaussian curves to quantify signal intensity. The repeatability of
the injection signal is demonstrated in Figure 2.5, where we plot the integral of the fitted
Gaussian for multiple injections corresponding to limit of detection experiments
(including negative controls, 2.8 pM and 140 pM let-7a concentrations, and 140 pM miR-
15a concentration). The standard deviation is 10.2% of the mean. We attribute this

53
variation to chip-to-chip variability as well as variability in the polymerization process. In
analyzing our data, we used the DS1 integral value as an internal control. The key signal
in our assay is the integrated signal peak at DS2 (downstream of the start of the capture
gel) normalized by the integrated signal peak at DS1. This normalization helps normalize
against chip-to-chip and experiment-to-experiment variations in the ITP pre-focusing and
mixing processes. Figure 2.6 shows typical signals and Gaussian fits for titration
experiment data (used for Figure 2.9b).
Figure 2.5 Integrated fluorescent intensity of injection peak for all experimental realizations demonstrating
the limit of detection of 2.8 pM target concentration (includes three run each of the negative control,
2.8 pM and 140 pM let-7a, and 140 pM miR-15a). Symbols represent individual experiments. The solid
black line represents the mean value and the dashed lines represent one standard deviation above and below
the mean.
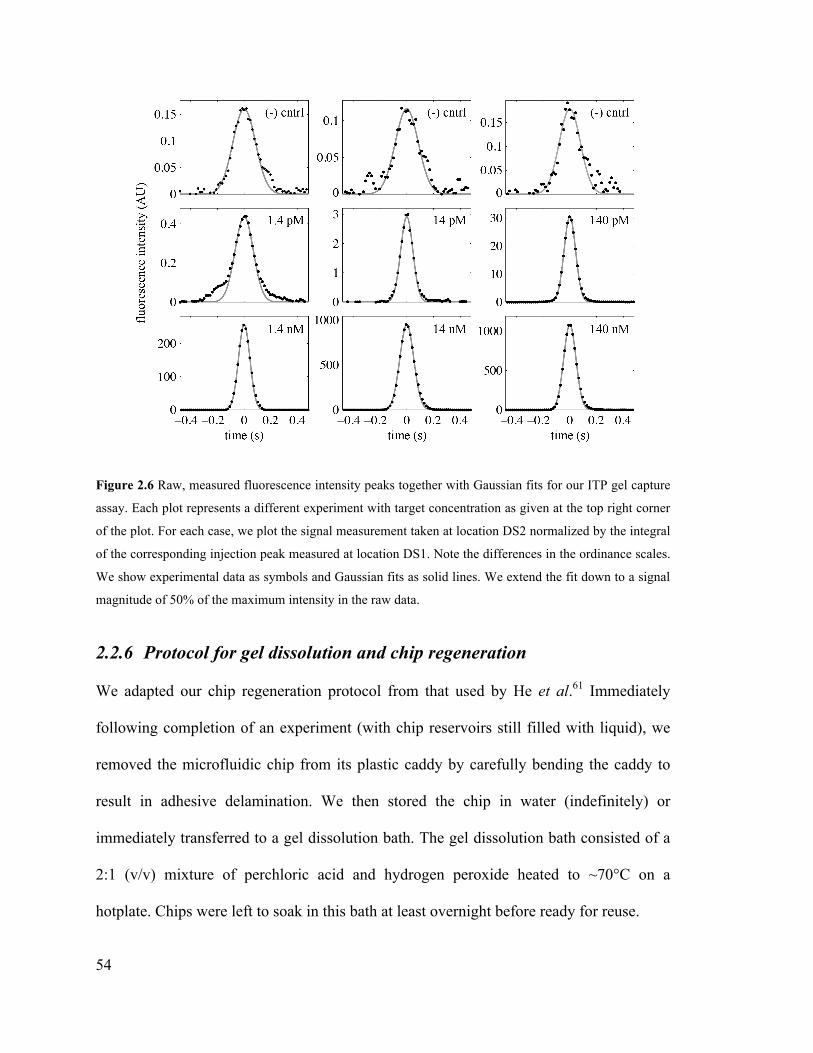
54
Figure 2.6 Raw, measured fluorescence intensity peaks together with Gaussian fits for our ITP gel capture
assay. Each plot represents a different experiment with target concentration as given at the top right corner
of the plot. For each case, we plot the signal measurement taken at location DS2 normalized by the integral
of the corresponding injection peak measured at location DS1. Note the differences in the ordinance scales.
We show experimental data as symbols and Gaussian fits as solid lines. We extend the fit down to a signal
magnitude of 50% of the maximum intensity in the raw data.
2.2.6 Protocol for gel dissolution and chip regeneration
We adapted our chip regeneration protocol from that used by He et al.61 Immediately
following completion of an experiment (with chip reservoirs still filled with liquid), we
removed the microfluidic chip from its plastic caddy by carefully bending the caddy to
result in adhesive delamination. We then stored the chip in water (indefinitely) or
immediately transferred to a gel dissolution bath. The gel dissolution bath consisted of a
2:1 (v/v) mixture of perchloric acid and hydrogen peroxide heated to ~70°C on a
hotplate. Chips were left to soak in this bath at least overnight before ready for reuse.

55
2.2.7 Numerical Simulation of ITP-enhanced Hybridization Reaction
We model ITP-enhanced hybridization with a three-species bulk reaction model. Each
species is represented by a bulk concentration, ci, where the index i stands for target (T),
reporter (R), or hybrid (H) molecules. In experiments, target and reporter molecules were
initially mixed together in the TE reservoir and focused in the ITP zone continuously
through a semi-infinite injection.66 After 410 s, we switched ground voltage to a “clean”
TE reservoir containing solution with no target or reporter molecules for approximately
190 s. The rate of change of species concentrations therefore depends on both
hybridization kinetics as well as ITP focusing rate of reaction species as follows:
dcHdt
= koncRcT − koff cH , (2.1)
dcTdt
= −koncRcT + koff cH + FcT ,0 , (2.2)
dcRdt
= −koncRcT + koff cH + FcR,0 . (2.3)
Here t is time and kon and koff are the kinetic on- and off-rates, respectively. The
concentrations of target and reporter molecules in the TE are cT,0 and cR,0, respectively.
The species concentrations cH, cT, and cR may be interpreted as concentrations of hybrid,
target, and reporter molecules volume-averaged over the ITP zone. For all numerical
simulations, we take kon = 106 M-1 s-1 and koff = 10-15 s-1. These values are in agreement
with existing on-rate measurements for short (~23 nt) oligos67 and equilibrium constants
calculated using the DINAMelt web server.33 We solved these coupled ordinary
differential equations using MATLAB’s ode45. The single fitting parameter, F,

56
represents the flux (per concentration) of molecules (with units of s-1) from the TE into
the focused sample zone during the injection period. We find that taking F = 0.0024 s–1
results in the best model fit to titration curve data shown in Figure 2.9b.
Our numerical model determines the fraction of hybridized reporters over time given an
influx rate (F) of target and reporter molecules. This process is depicted in Figure 2.7,
where we plot the fraction of hybridized reporters over time for a range of initial target
concentrations. The vertical dashed lines represent the end of the injection cycle (at
410 s) and detection (at 600 s) portions of the voltage control program. At the end of the
injection portion, we set F = 0 (no influx of target and reporter molecules into the ITP
zone) in the unsteady simulation.
Figure 2.7 Predicted hybridization curves showing fraction of reporters hybridized versus time. The dashed
vertical line at 410 s denotes the end of the sample injection. After this time, in the model, we set target and
reporter flux into the ITP zone to zero (F = 0). The dashed vertical line at 600 s denotes the end of the
detection portion of the assay.

57
2.3 Results and discussion
In the first stage of our assay, ITP focusing simultaneously mixes and preconcentrates
molecules to promote fast hybridization kinetics between target microRNAs and reporters
(Figure 2.8c). We use only the simplest reporter molecule design: fully-complementary,
terminal-labeled synthetic oligos. This simplicity in reporter design enables easy tuning
of probe sequence, assay temperature, and denaturant conditions to control specificitiy.
ITP increases the concentration of both target and reporter, thereby significantly
enhancing forward reaction rates.60 Additionally, we use a relatively high initial reporter
concentration (2 nM in the TE reservoir) to further promote fast kinetics. We note that
sample and reporter injection is robust and repeatable (see Section 2.2.5 for details on
repeatability of sample injection signal).
Figure 2.8 Schematic of microRNA detection assay. ITP in a polyacrylamide gel (upstream of the
photopatterned capture gel) preconcentrates and mixes target and reporter molecules, speeding up
hybridization. The ITP zone then migrates into and through the capture gel region, which removes un-
hybridized reporters from the focused ITP zone. This allows minimal-background detection of reporters
which have specifically hybridized to their complementary target microRNA.

58
Following the enhanced hybridization region, the ITP zone enters a photopatterned
hydrogel region decorated with a high concentration (order 25 µM) of immobilized DNA
molecules. These immobilized oligos are complementary to the focused fluorescent
reporters, and therefore remove excess reporters from the focused ITP zone. Since off-
rates are typically negligible, reporters which are already hybridized to a target
microRNA continue to migrate in the sharp ITP zone. Unhybridized reporters can interact
with the immobilized probes and readily become immobilized in the hydrogel matrix
(Figure 2.1b, Figure 2.8c). Reporters remaining focused in ITP are then detected using a
light source and sensitive photodetector (see Section 2.2.2 for details of experimental
setup). We observed that signal intensity scales directly with concentration of target
molecules (Figure 2.9a).
We constructed a titration curve to quantify dynamic range. We used synthetic
microRNA HSA-let-7a (let-7a) to demonstrate our assay, as this is a well-studied
microRNA with diverse research and clinical applications. Members of the let-7 family,
including let-7a, are implicated in cell developmental processes, have prognostic value
for post-operative lung cancer patents, and are known to play a role in cancers associated
with differentiation stages.68-70 We varied let-7a concentration over five orders of
magnitude, from 1.4 pM to 140 nM (Figure 2.9b), and used the signal enhancement
ratio, ε = I − I0( ) / I0 , as a metric to quantify our results. Here I is integrated fluorescence
intensity (above noise floor) of the experiment peak and I0 is mean integrated intensity
(above noise floor) of the negative control peak (i.e., background signal). We note this
enhancement ratio is directly proportional to the concentration of hybridized molecules
present in the ITP zone.11,19

59
We found our assay dynamic range spans approximately 4 orders of magnitude. Using
our two-step, react-then-capture-background approach, we achieved signal enhancement
ratios of approximately 4500. This constitutes a dynamic range approximately 100-fold
greater than previous ITP-based hybridization assays.11,19 In addition, we determined the
assay LOD to be approximately 2.8 pM (P = 0.0005), for a minimum acceptable
enhancement ratio of ε ≈ 1.23 (Figure 2.9c). As mentioned earlier, we do not here
optimize our assay for high stringency (e.g., required to differentiate let-7 family
members). However, we here include data showing our assay signal is insensitive to a
mistmatched target microRNA (HSA-miR-15a) which forms only four base-pairs with
the let-7a reporter. As shown in Figure 2C, a 140 pM concentration of let-7a yielded
enhancement ratio ε ≈ 76.7, while the same concentration of miR-15a yielded an
enhancement ratio ε ≈ 0.2, a value not statistically distinguishable from the negative
control. Higher stringency can be achieved through use of denaturants,57 elevated
temperature,44 and/or low salt concentrations.44 We have shown compatibility of ITP with
common denaturants,19,52 and higher stringency can also be achieved through use of
modified probes such as locked nucleic acid (LNA) bases, which we discussed in
Section 1.2.2.
We model ITP-enhanced hybridization with a three-species bulk reaction model. Each
species is represented by its mean concentration, ci, where the index i is stands for target
(T), reporter (R), or hybrid (H) molecules. Our model is similar to the volume-averaged
model proposed by Bercovici et al.,60 for DNA reactions driven by ITP mixing and
focusing. Once again, the reaction equations for all three species may be written in the
following form:

60
Figure 2.9 Experimental determination of dynamic range and sensitivity of ITP gel capture assay for
detection of HSA-let-7a microRNA. (A) Gaussian best fits to measured fluorescence signal versus time for
four example let-7a concentrations. Signal intensity initially scales with initial target concentration, and
then saturates as predicted. (B) Titration curve spanning 1.4 pM to 140 nM concentrations of let-7a. The
assay exhibits a quantitative dynamic range of approximately four orders of magnitude (with absolutely no
changes in assay conditions). Shown with data is a plot of results from our model with F as a single
(global) fitting parameter. (C) Limit of detection study, showing mean integrated signal intensity for
negative control, 2.8 pM let-7a, 140 pM let-7a, and 140 pM of mismatch species (HSA-miR-15a). Scale
bars represent 95% confidence on the mean (N = 3).
dcHdt
= koncRcT − koff cH , (2.4)
dcTdt
= −koncRcT + koff cH + FcT ,0 , (2.5)
dcRdt
= −koncRcT + koff cH + FcR,0 . (2.6)
Here t is time and kon and koff are the kinetic on- and off- rates, respectively. The
concentrations of target and reporter molecules in the TE are cT,0 and cR,0, respectively.
The species concentrations cH, cT, and cR may be interpreted as concentrations of hybrid,
target, and reporter molecules volume-averaged over the ITP zone. Similarly, the product
cR cT is volume-averaged over the ITP zone (see Bercovici et al.60). The single fitting

61
parameter, F, represents the flux (per concentration) of molecules from the TE into the
focused sample zone. Here we account for a semi-infinite injection mode, wherein both
target and reporter molecules are mixed homogenously with the TE buffer and
continuously focus into ITP zone.66 Experiment results are in good agreement with our
numerical model (Figure 2.9b; see Section 2.2.7 for a detailed description of numerical
simulations).
We can make our assay selective for mature microRNAs by adding a second
functionalized hydrogel (in series with the first) used to remove precursors from the
focused zone. Precursor microRNAs contain the full mature sequence (~22 nt) within the
stem of a longer (~80 nt) hairpin-shaped molecule. We functionalize this second region
with DNA oligos targeting the loop sequence of precursor microRNAs, as this sequence
is not present in the mature microRNA molecule. As precursor molecules enter the
channel, their affinity for these immobilized probes causes them to become immobile in
the hydrogel and therefore fall out of the focused ITP zone. Figure 2.10 summarizes
experiments demonstrating the selectivity of our assay for mature microRNAs. In the
presence of 140 pM precursor microRNA, our assay yields a minimal signal, which we
attribute to impurities in the synthesis of the precursor molecule (resulting in some
unwanted mature microRNA content in our synthesized precursor microRNA reagent;
see Table 2.1 and Figure 2.2 for further details regarding oligo purity). Further, we
quantified similar signals from experiments containing 140 pM of only mature
microRNA versus mixtures of 140 pM of both mature and precursor microRNA. This
shows that the presence of precursor let-7a in the sample does not affect quantification of
mature let-7a.

62
Figure 2.10 Demonstration of assay selectivity for mature over precursor microRNAs. For these
experiments, the enhanced hybridization region contains an immobilized oligo targeting the loop sequence
of the let-7a precursor (pre-let-7a) not found in the mature molecule. The plot shows mean integrated signal
intensity for negative control, 140 pM let-7a, 140 pM pre-let-7a, and 140 pM each of let-7a and pre-let-7a.
Scale bars represent 95% confidence on the mean (N = 3). The pure precursor sample signal is somewhat
higher than the negative control signal, but we attribute this to the difficulty in synthesizing long RNA
oligos of high purity. We estimate the purity of the let-7a precursor sample is approximately 31% (see
Table 2.1 and Figure 2.2 for further details regarding synthetic oligo purity).
We have introduced an ITP-based hybridization assay which is rapid (~10 min), sensitive
(LOD of 2.8 pM), spans 4 orders of magnitude dynamic range, and is selective for the
active (mature) form of microRNA molecules. For our lower limit of detection, we
dispensed only 300 fg of microRNA into our sample reservoir (in a 15 µl volume) and
used a small fraction of this (approximately 0.1%, or about 30,000 copies) to perform our
analysis. The assay achieves this by integrating ITP and photopatterned, DNA-
functionalized hydrogels in a single microfluidic channel. The use of stationary phase
hydrogel capture elements allows for high-concentration hybridization reactions followed
by efficient removal of excess reactants. Hydrogel capture also enables removal of

63
unwanted precursor microRNAs, therefore allowing for selective detection of mature
microRNA molecules. We note that our multi-stage technique does not impose
limitations on probe design nor use of denaturants or temperature control. This is in
contrast to one-stage techniques (e.g., molecular beacons-based assays), which rely on
inherent probe secondary structure for signal quenching at the cost of decreased kinetic
on-rates and lower dynamic range. Our technique is generally applicable to detection of
many biomolecules or reactants. For example, we hypothesize that similar strategies can
be adapted for detection of proteins (e.g., using immobilized aptamers or streptavidin-
acrylamide to immobilize antibodies) and other NAs. Further reduction in assay time can
easily be achieved by increasing applied voltage, as microfluidic systems (especially
microchannels etched in glass) efficiently dissipate energy generated by Joule heating.
3 High-specificity microRNA detection using ITP two-stage assay
Several sections of this Chapter are based on a recent article published in Angewandte
Chemie International Edition, and are reproduced here with minor modifications.‡
3.1 Introduction
microRNAs are short, non-coding RNA molecules that regulate gene expression in
human, animal, and plant cells.50 They play important roles in diverse cellular functions
including development,71,72 apoptosis,73 and signaling.74 In addition, clinical research has
‡ G. Garcia-Schwarz and J.G. Santiago, “Rapid high-specificity microRNA detection using isotachophoresis two-stage assay,” Angewandte Chemie International Edition, 2013.

64
linked microRNA dysregulation to diseases such as diabetes, alzheimer’s disease, and
many forms of cancer.48-50,75 microRNA signatures have emerged as important new
clinical biomarkers with both diagnostic and prognostic value.48,69,76
microRNAs pose unique challenges for traditional RNA profiling methods.51 Their low
abundance and high degree of sequence similarity require methods with both high
sensitivity and specificity. Analysis by northern blotting is highly quantitative and was
long considered the “gold standard” in microRNA profiling, but it is too sample hungry
(requiring ~10 µg total RNA) and has been replaced by RT-PCR and microarrays.50 RT-
PCR can detect as few as 10 molecules,53 while microarrays require more sample
(~100 ng total RNA, or ~104 cells) but can analyze thousands of microRNAs at a time.58
Despite these advantages, enzymatic steps used in both methods (e.g., reverse
transcription, ligation) exhibit sequence-dependent activity and can introduce significant
bias.77-79 Moreover, analysis time for these methods ranges from hours (PCR) to days
(microarray), which makes them impractical for use as clinical diagnostics. There is a
need for a clinically-viable microRNA detection assay that is at once quantitative,
sensitive, specific, and rapid.
In this chapter we place particular emphasis on the let-7 family of microRNAs, one of the
first to be identified.80 Genetic studies in C. elegans, human tissues, and cell lines
uncovered the role of let-7 as a master regulator of cell proliferation pathways.81 There is
a negative correlation between let-7 and expression of RAS genes,82 which are known
oncogenes that encode small GTPases involved in cellular signal transduction.83 let-7
negatively regulates RAS expression in C. elegans and humans by binding several
locations in the 3’-untranslated region (3’-UTR) of RAS mRNA transcripts.81,82 In a

65
recent clinical study, reduced let-7 expression was identified as a predictor of shortened
survival in post-operative lung cancer patients.69 We therefore believe that the let-7
family of microRNAs is a good test case of general interest to both academic and clinical
communities.
We present a novel two-stage hybridization assay which performs detection of the let-7a
microRNA in 15 min with single-nucleotide specificity while processing only 5 ng of
total RNA extracted from tissue or cell culture. Our assay uses isotachophoresis (ITP) to
speed up hybridization kinetics between the target molecule and a fluorescent reporter,
and a photopatterned functionalized hydrogel to purify reaction products following
hybridization. We previously demonstrated a proof of concept study where we
characterized sensitivity and dynamic range of this technique under low stringency
conditions.84 Here we present an ITP capture assay which for the first time enables
microRNA profiling from real total RNA samples and leverages both thermodynamics
and off-rate kinetics to achieve single-nucleotide specificity.
3.2 Materials and Methods
3.2.1 Reagents and materials
We refer the reader to Section 2.2.1 for chemicals and materials used in this chapter. In addition, we
purchased the synthetic DNA and RNA oligonucleotides listed in
Table 3.1 from Genelink (Hawthorne, NY) and Integrated DNA Technologies
(Coralville, IA). We stored reconstituted oligos in 10 mM Tris-HCl, and stored these
oligo stock solutions at either -20°C or -80°C in 2–6 µl aliquots.

66
Table 3.1 Synthetic oligonucleotide sequences and associated purification methods. Purification methods
included high pressure liquid chromatography (HPLC) and polyacrylamide gel electrophoresis (PAGE).
Name Type Sequence Purification method
let-7a RNA 5-UGA GGU AGU AGG UUG UAU AGU U PAGE pre-let-7a RNA 5-UGG GAU GAG GUA GUA GGU UGU AUA GUU
UUA GGG UCA CAC CCA CCA CUG GGA GAU AAC UAU ACA AUC UAC UGU CUU UCC UA
PAGE
let-7b RNA 5-UGA GGU AGU AGG UUG UGU GGU U PAGE let-7c RNA 5-UGA GGU AGU AGG UUG UAU GGU U PAGE let-7d RNA 5-CGA GGU AGU AGG UUG CAU AGU U PAGE let-7e RNA 5-UGA GGU AGG AGG UUG UAU AGU U PAGE let-7f RNA 5-UGA GGU AGU AGA UUG UAU AGU U PAGE let-7g RNA 5-UGA GGU AGU AGU UUG UAC AGU U PAGE let-7i RNA 5-UGA GGU AGU AGU UUG UGC UGU U PAGE capture probe
DNA/LNA
5-/Acr/ +TG+A G+GT +AG+T A+GG +TT+G T+AT +AG+T T
HPLC
hairpin reporter
DNA 5-/Cy5/ CGC CGA GCA ACT ATA CAA CCT ACT ACC TCA GCT CGG CG
PAGE
*In the capture probe sequence, bases with an LNA sugar are preceded by “+”. **In the hairpin reporter sequence, we underline the portion complementary to let-7a and capture probe.
The TaqMan MicroRNA Reverse Transcription Kit, Universal PCR Master Mix II (with
UNG), and MicroRNA Assay were purchased from Life Technologies (Grand Island,
NY). We performed quantitative RT-PCR with a MiniOpticon Real-Time PCR Detection
System from Bio-Rad (Hercules, CA).
3.2.2 Experimental apparatus
All data were taken using the custom epifluorescent point-confocal microscopy setup
described in Section 2.2.2 and illustrated in Figure 2.3. We used a 40x water-immersion
objective (LUMPlanFL, Olympus, Hauppauge, NY) for the experiments presented in this
chapter.

67
3.2.3 Preparation of prepolymer, buffers, and surface modification reagents
We prepared two prepolymers, PP1 and PP2, to perform our assay. We prepared PP1 by
combining urea (165 mg), water (115 µl), 1 M tris (100 µl), 1 M hydrochloric acid
(50 µl), and 40% acrylamide/bisacrylamide (50 µl). We prepared PP2 by combining urea
(165 mg), water (130 µl), 1 M tris (100 µl), 1 M hydrochloric acid (50 µl),
40% acrylamide (25 µl), and 5% w/w PVP (10 µl). We prepared the photoinitiator, VA-
086, at a concentration of 2% (w/v), diluted in water. Using these components and
acrydite-modified oligos (capture probes) we prepared three distinct leading electrolyte
(LE) prepolymer mixtures:
LE1: 135 µl PP1 + 15 µl VA-086
LE2: 135 µl PP2 + 15 µl VA-086
LE3: 38 µl LE1 + 2 µl capture probe
We found that fresh preparation of the prepolymers and photoinitiator before each use
was important to assay repeatability. The photoinitiator (VA-086) is unstable under
exposure to light and when dissolved in aqueous solution, and urea degrades significantly
in aqueous solution at room temperature over the span of about one day.61,85 The TE
consisted of 10 mM HEPES, 20 mM Tris, and 50% formamide. Before each experiment,
we combined 9 µl TE and 1 µl total RNA solution for a final RNA concentration of
100 ng/µl. We then heated this mixture in a thermal cycler 60°C for 10 min to disrupt
secondary structure, and then immediately placed on ice. Finally, we added 1 µl of 5 nM
hairpin reporter to this mixture (which we call TE+S) before using in our experiment.

68
Figure 3.1 Caliper model NS260 microfluidic chip layout and indication of dispensed solutions (black),
voltage program (blue), detection stations (red), and hydrogel patterning (green, brown, and purple). TE+S,
TE, and LE were all dispensed prior to initiation of the voltage program. We apply the voltage program
shown in Table 3.2. We first detect the ITP peak at detection station 0 (DS0). Once the peak passed DS0,
we wait 3 s before we turn off the voltage supply and switch the ground electrode from reservoir 1 (TE+S)
to reservoir 5, which contains clean TE. We then moved the detector to DS1 and resume the voltage
program. We note that this manual step can be automated using an off chip voltage sequencer. We then
detect the ITP peak at DS1, 1.5 mm before the start of the capture gel, as an internal normalization control.
Finally, we detect the ITP peak at DS2 and DS3, respectively 0.9 mm and 1.9 mm after the start of the
capture gel. Of these post-purification measurements, we use only the measurement at DS3 for specificity
experiments (Figure 3.8) and real sample experiments (Figure 3.9). We use both DS2 and DS3
measurements to estimate kinetic off-rates for let-7a and mismatches (see Figure 3.4).
3.2.4 Microfluidic chip preparation and hydrogel patterning
We prepared a surface modification mixture consisting of 5:3:2 (v/v) DI water, acetic
acid, and 3-(trimethoxysilyl)-propyl methacrylate, used to modify channel surface
properties and promote covalent attachment of hydrogel to the glass surface. We
followed the same chip preparation protocol as reported previously,84 with minor
modifications:

69
1. Rinse with DI water for 5 min
2. Rinse with 1 M sodium hydroxide for 5 min
3. Rinse with DI water for 1 min
4. Empty reservoirs and apply vacuum to dry for 1 min
5. Rinse with surface modification mixture for 5 min
6. Rinse with 30% acetic acid for 1 min
7. Rinse with DI water 5 min
8. Empty reservoirs and apply vacuum to dry for 1 min
We then filled the chip with the three prepolymer solutions, as shown in the chip layout
schematic of Figure 3.1. We filled reservoirs 1 through 4 with 10 µl LE1 each, reservoirs
5 and 6 with 10 µl LE2 each, and reservoirs 7 and 8 with 10 µl LE3 each. We then
applied vacuum to the microfluidic chip at reservoirs 4 and 6 for approximately 1.5 min.
We then carefully removed both vacuum lines simultaneously and transferred the chip to
our UV LED light source (with ~5 mW/cm2 intensity) for 10 min to form the LPA and
PA polymers. Following UV exposure, we flushed away unattached oligos from the LE3
region channel by applying 2 µA current between reservoirs 5 and 8 for 5 min.
3.2.5 Experiment protocol
We performed our assay immediately following chip preparation (described in the
previous section). Our assay operation consisted of three stages: semi-infinite sample
injection, hybridization, and detection. We carried out these stages according to the
sourcemeter protocol summarized in Table 3.2. This procedure resulted in a type of
“finite sample injection” strategy, which we used to avoid any increase in background

70
signal during the capture phase of the experiment. In previous work, we found that this
injection mode resulted in larger enhancement ratios and therefore improved sensitivity
and dynamic range (compared to a semi-infinite injection scheme where we continuously
draw target from the same TE reservoir).84
In the injection stage, we performed a semi-infinite injection from the TE+S reservoir
(reservoir 1 in Figure 3.1), where sample was continuously injected from the input
reservoir. We stopped the combined sample and reporter injection process at
approximately t = 450 s when the ITP zone reached detection station 0 (DS0), as shown
in the chip schematic of Figure 3.1 (depicted by the first dashed vertical line in Figure
3.7 in the discussion section, Section 3.3). For the hybridization stage, we switched the
source of TE anions to a secondary TE reservoir (reservoir 5 in Figure 3.1) containing
only TE (without target or reporter molecules). We performed our first critical
fluorescence measurement at DS1, just before the start of the purification region (LE3),
as an internal normalization control. Finally, we allowed the ITP zone to enter the
purification region, where we performed two additional fluorescence measurements at
locations DS2 and DS3, respectively 0.9 cm and 1.9 cm after the start of the capture gel.
Table 3.2 Sourcemeter current program. We applied 1 µA constant current between ground (GND) and
positive (HI) electrodes. A dash “-” under the reservoir listing indicates a floating voltage potential.
Reservoir # Name Duration (approx.)
[s]
Laser power [mW]
1 2 3 4 5 6 7 8
Injection 450 1 GND - - - - - - HI Detection 300 1 to 5 - - - - GND - - HI

71
3.2.6 Data analysis and let-7a quantification
The key signals (integral of PMT signal vs. time) measured in each experiment were:
• Normalization peak (N): integrated peak measured at location DS1, downstream
of the capture gel
• Signal peaks (D): integrated peak measured at locations DS2 and DS3, upstream
of the capture gel
Peak integration consisted of fitting a Gaussian to the PMT signal vs. time, and then
integrating the fitted Gaussian curve to quantify signal intensity, as described
previously.84 For this analysis we assumed that the velocity of the ITP zone is the same
for each experiment. This assumption is reasonable when chip-to-chip variations in
geometry are minimal, and assuming we apply the same constant current conditions in
each experiment, as the ITP velocity scales with the electric field.
We then calculated the final measured signal for each experiment using the following
equation:
Si =Di − BNi − B
. (3.1)
Here Si is the measured signal for experiment i, and B is the background signal, defined
as the integrated peak intensity at location DS3 for a negative control experiment. We
found that B did not vary with changes in the normalization peak for negative control
experiments.

72
For let-7a quantification experiments shown in Figure 3.9 in Section 3.3, we constructed
a four-point calibration curve. We performed spike-in experiments for let-7a
concentrations of 0, 50, 150, and 500 pM, which spanned the concentrations of let-7a in
100 ng/µl total RNA of the samples measured. We obtained three measurements for the
negative control (0 pM let-7a), which we averaged, and one measurement each for the
other concentrations. For these experiments we included total RNA from K562 cells
(which does not contain let-7a, as verified by qPCR) to increase background RNA
complexity. We performed a linear least squares fit to calibration curve data with zero
intercept, which we then used to determine absolute concentrations of let-7a from
experiments with total RNA purified from tissues and cell culture.
3.2.7 Gel patterning and preventing gel degradation
We observed bubble formation and severe and observable degradation of the gel in our
experiments when injecting long DNA or RNA directly from free solution into LE2
(4% PA). As an example of this phenomenon, Figure 3.2 shows the effect of focusing 70
nt and 200 nt DNA with ITP and electromigrating from free solution into a 4% PA gel.
These experiments focused initial concentrations of approximately 1 µM. While 70 nt
DNA enters the gel without any visible disruption, 200nt DNA appears to immediately
deflect the gel boundary and eventually causes bubbles to form along the center axis of
the channel (i.e., visible signal depletion along the channel centerline). The gel appears to
“tear” along a region near the center of the channel when injecting high concentrations of
long nucleic acids. We did not observe this effect at significantly lower concentrations of
200 nt DNA (data not shown). We observed similar behavior when injecting total RNA.

73
Above a threshold concentration of ~20 ng/µl, injecting total RNA caused bubble
formation which resulted in voltage fluctuations in our experiments (see Figure 3.3a).
A similar type of severe gel degradation was also reported by the group of Norman
Dovichi in their work on Sanger sequencing capillary electrophoresis separations.86,87
They observed bubble formation and large voltage fluctuations in their experiments, and
identified high NA concentration as one of several common causes of gel degradation. In
their experiments, increases in NA length and/or concentration were also associated with
greater likelihood of gel degradation. We therefore hypothesized that sieving high
concentration large RNAs (e.g., mRNA and rRNA molecules) out of the ITP zone prior
to entering LE2 would eliminate gel degradation. We previously used a linear polymer to
exclude long RNAs from the focused ITP zone;19,52 here we used a low concentration
linear polymer (LE1, composed of 2% linear polyacrylamide). We found that this matrix
did not degrade even at a total RNA concentration of 100 ng/µl, as shown in Figure 3.3a
(red dash-dotted). Importantly, the use of LE1 for RNA injection prevented downstream
degradation at the transition from LE1 to LE2 (see Figure 3.3b).
We note that it is possible to use 2% LPA in all assay regions (injection, hybridization,
and purification) rather than switch between 2% LPA and 4% PA. However, we opted to
use 4% PA in the purification region (LE3) because studies by Rubina et al.88 and Chan
and Krull89 suggest that incorporation of Acrydite-labeled oligos into the hydrogel matrix
depends strongly on polymer precursor concentration. By using a higher concentration
polymer, we aimed to enhance capture efficiency and therefore improve sensitivity and
dynamic range of our assay. We used 4% PA in the hybridization region (LE2) primarily
for consistency between the normalization and final detection signals (measured at

74
locations DS0 and DS2, respectively, in Figure 3.1). In addition, we note that 4% PA
performs some size-selection. As shown in Figure 3.2, DNA of length ~200 nt and above
will not focus in regions with 4% PA. Size selection greatly reduces sample complexity
and can also improve specificity.51
Figure 3.2 Experimental observation of gel degradation caused by high concentration long nucleic acids.
We used ITP to focus 70nt and 200nt DNA in free solution, and allowed the focused nucleic acids to
migrate into a region of the channel containing 4% crosslinked polyacrylamide. We patterned the hydrogel
hydrodynamically, by applying vacuum at the side channel (shown in the top three images) to fill the left
portion with pure LE buffer and the right portion with LE buffer containing gel precursor and
photoinitiator. We then performed ITP focusing and used an intercalating dye to visualize the DNA. (A)
The 70nt DNA crosses the free solution-gel interface without causing any disruptions (first three time-
course images). We observed at a later time that the 70nt DNA remains focused in the hydrogel region
downstream. (B) The 200nt focuses in free solution, but upon crossing the hydrogel interface appears to
concentrate near the channel center. Observation of the DNA at a later time reveals a depleted signal in the
channel center, which suggests bubble formation. We note that the 200nt DNA does not remain focused in
ITP within the hydrogel region, as demonstrated by its increased diffusion along the channel axis.

75
Figure 3.3 Experimental observation of voltage fluctuations caused by gel damage and elimination of these
fluctuations by using a first-stage linear polymer injection region. (A) Voltage traces for total RNA
injection experiments performed with 4% PA (blue nad green) and an initial 2% LPA region in series with
4% PA (red). For experiments with only 4% PA, we observed voltage fluctuations only for high
concentration total RNA injections (100 ng/µl total RNA, shown in green). For experiments where we
added a first-stage 2% LPA region, we did not observe voltage fluctuations when injecting 100 ng/µl total
RNA. These data suggest that focused total RNAs can enter the 2% LPA withou causing degradation. (B)
Later-time voltage trace during transition of the ITP interface from 2% LPA injection region to 4% PA.
The transition occurs approximately where indicated by the arrow. We did not observe voltage fluctuations
or gel degradation at this transition, suggesting that use of an initial-stage 2% LPA region successfully
prevents gel degradation.
3.2.8 Volume-averaged model for hybridization dynamics
We simulated hybridization dynamics of our assay using a volume-averaged model
adapted from Bercovici et al.60 The second-order reaction dybnamics in terms of volume-
averaged concentration values are described by:
dcTdt
= −3πkoncT cR + koff cH + F t( )cT0 , (3.2)

76
dcRdt
= −3πkoncT cR + koff cH + F t( )cR0 , (3.3)
dcHdt
=3πkoncT cR − koff cH . (3.4)
Here cT, cR, and cH are the volume-averaged target, reporter, and hybrid concentrations,
cT0 and cR
0 are the target and reporter concentrations in the TE, and kon and koff are the on-
and off-rate constants, respectively. The 3 / π pre-factor (in the association term) is a
result of volume-averaging the reaction equations assuming all concentration profiles (cT,
cR, and cH) can be approximated as overlapping Gaussians. For further details on the
derivation of the volume-averaged equations, we refer the reader to the Supplementary
Material of Bercovici et al., PNAS 2012.60 The function F(t) represents the accumulation
rate during sample and reporter injection, defined as:
F t( ) =F0 t < tinj0 t ≥ tinj
⎧⎨⎪
⎩⎪, (3.5)
where tinj is the total injection time.
We use these equations to model sample injection and hybridization during the first stage
of the assay, for t < tinj + thyb, where thyb is the post-injection hybridization time (see
Section 3.2.5 for assay protocol). In the second stage, the ITP zone migrates through a gel
decorated with capture probes which removes reporters from the ITP reaction volume.
We assume that binding between reporters and capture probes occurs on a much faster
timescale than melting of reporters from target molecules, i.e., kon,PcP koff where kon,P

77
is the on-rate for the reporter-capture probe reaction and cP is the effective concentration
of capture probes. We believe this is a good assumption because capture probes contain
50% LNA composition, which significantly increases their affinity for reporters. In
addition, we estimate the concentration of capture probes is on the same order as
reporters focused in the ITP zone, i.e., cP ≥ cR,84 which suggests the capture gel has
sufficient capacity to remove excess reporters immediately upon entry of the ITP zone.
Based on these estimates and assumptions, we set cR = 0 in the purification stage (for
t ≥ tinj + thyb).
We use a combination of experimental measurements and simulations to determine
kinetic rate constants. For all sequences, we determined koff experimentally (see
Section 3.2.9, below). For let-7a, we used KD as a fitting parameter to determine a best fit
to our titration data (see Figure 3.8b inset in Section 3.3). We then used the equilibrium
relation, KD = koff/kon, to determine kon. Additionally, we used the DINAMelt web server
to calculate KD as a function of temperature for let-7a and all mismatches using the
relation KD(T) = cT(T)cR(T)/cH(T).33 This allowed us to compare KD across all sequences
for any fixed value of T. Because we used denaturant and not temperature to optimize
assay stringency, we determined an “effective temperature”, Teff, by evaluating the
relation above for KD(T) using the fitted KD for let-7a. We found Teff = 51°C. We then
used this Teff to evaluate the appropriate values of KD for each reporter-mismatch reaction
(using the respective KD(T) curve for each reporter-mismatch pair).
Importantly, we consider these estimates and this model as only a semi-quantitative
estimate of the dynamics of the respective species concentrations. The main utility of this
model is estimating the trade-off between signal strength and stringency. For example,

78
placing the detector further downstream of the start of the capture gel results in increase
in stringency but lower signal. This tradeoff is well-demonstrated in Figure 3.7b in the
main text. We note this model is not required to create a calibration curve, which we use
to establish a quantitative relationship between measured raw signals and target molecule
concentration.
3.2.9 Kinetic off-rate estimates
In the purification stage of our assay, the absence of free reporters (assuming they are
removed rapidly by the capture gel, as described in Section 3.2.8) results in the following
reaction equation:
dcHdt
= −koff cH . (3.6)
Given this approximate relation, we can estimate the off-rate for a given sequence by
simply measuring peak signal at two locations (c1 and c2) in the purification region. We
use these measurements and the time elapsed between them, Δt, to estimate:
koff = −1cH
dcHdt
≈2Δt
c1 − c2c2 + c1
⎛⎝⎜
⎞⎠⎟
. (3.7)
We perform these two measurements in our assay at locations DS2 and DS3 as described
in Section 3.2.5 and shown in Figure 3.1. In Figure 3.4 we plot the koff values for let-7a,
7c, 7d, and 7e. We note that all mismatch koff values are greater than that of let-7a. This
demonstrates that the combined effect of thermodynamics and kinetics results in the
excellent stringency demonstrated here. Our two-step approach therefore takes advantage
of off-rate kinetics to improve specificity. This is in contrast to one-step assays, which do
not perform reaction purification (e.g., molecular beacons).

79
Figure 3.4 Estimate of kinetic off-rates for target and mismatch sequences. We measured the fluorescent
signal for let-7a, two 1 nt mismatches (let-7c, let-7e), and one 2 nt mismatch (let-7d) at locations 1 cm and
2 cm along the channel measured from the start of the capture gel (LE3). We then estimated koff using a
simplified reaction rate equation (see text). As shown here, all mismatches have higher off-rates than let-7a.
This suggests that off-rate kinetics play an important role in improving specificity of our assay.
3.2.10 Hairpin reporters do not bind precursor microRNAs
Precursor microRNAs are ~80nt long molecules that share the mature microRNA
sequence, but are inactive and hence typically must be excluded from the quantitative
measurement of the mature microRNA of interest.50 This poses a challenge for
hybridization methods which rely on complementary hybridization probes that can bind
to both mature and precursor microRNAs. For experiments presented in Chapter 2, we
used linear reporter molecules and demonstrated selectivity for let-7a over the let-7a
precursor (pre-let-7a) by using a secondary affinity capture gel to remove precursors.84
We achieved this by designing capture probes complementary to the pre-let-7a “loop”
region, which is not present in the mature form.

80
In this work, we found that simply using hairpin-shaped reporters conferred this
selectivity without the need for a secondary capture region (see Figure 3.7c in
Section 3.3). We note that both the hairpin reporter and pre-let-7a have strong secondary
structures which introduce competition between folding and hybridization. To
demonstrate the effect of this competition on hybridization, we numerically generated
melting curves for pre-let-7a and three reporter designs using the DINAMelt web
server,33 as shown in Figure 3.5.
Figure 3.5 The effect of reporter secondary structure on equilibrium hybridization fraction to the let-7a
precursor (pre-let-7a). We generated melting curves numerically for reactions between pre-let-7a and each
of three reporter molecule designs: linear, hairpin with a 6nt stem, and hairpin with an 8nt stem. The linear
reporter is fully-complementary to let-7a, while the hairpin reporters have a loop region which is
complementary to let-7a and a stem region which is self-complementary. We observed that a linear design
achieves a relatively high hybridized fraction. However, a hairpin design with a 6nt stem reduces this
fraction significantly and a hairpin design with an 8nt stem completely eliminates hybridization with pre-
let-7a. We use the hairpin reporter design with 8nt stem in all of our experiments.

81
Whereas typical melting curves range from a value of 1 at low temperatures to a value of
0 at high temperatures, we note that the melting curves shown in Figure 3.5 do not
follow this pattern. This is a result of the strong secondary structure of pre-let-7a. When
folded, pre-let-7a assumes a stable hairpin conformation with a stem which forms
approximately 24 base pairs. This folded structure is favored at low temperatures, while
at high temperatures the random coil conformation is favored; both of these cases result
in 0 hybridized fraction. At intermrediate temperatures, the data show that a linear
reporter will hybridize to pre-let-7a (with maximum hybridized fraction of 0.6).
However, a hairpin reporter design with 6 nt stem reduces the equilibrium fraction
dramatically, and a hairpin design with 8 nt stem (used in our experiments) completely
eliminates hybridization to pre-let-7a. We hypothesize that this approach is generally
applicable, as all precursor microRNAs have a distinct hairpin structure.
When designing a hairpin reporter against a new microRNA, we recommend first
optimizing stem length and GC content numerically (using DINAMelt simulations) until
ΔT ≈ 5°C between target and mismatches. We then recommend optimizing stem length
and GC content further, if needed and again using DINAMelt simulations, to ensure the
hairpin reporter will not hybridize to the precursor molecule corresponding to the target
microRNA. In both optimizations, increasing stem length or GC content will improve
discrimination between target, precursor, and mismatches.
3.2.11 Estimate of amount of RNA processed by ITP
We here preset an estimate of the amount of RNA which we process using our off-the-
shelf chip and simple injection protocol. The amount of RNA processed by our ITP assay

82
is influenced by three factors: analyte mobility relative to the TE ion mobility, adjusted
TE ion concentration (i.e., the concentration of TE ions in the regions formerly occupied
by the LE), and time allowed for RNA injection. The analyte travels at velocity UA
through a channel with cross-sectional area A, for total injection time T. The flux of
analyte of concentration, cA, in the frame of reference of the moving ITP interface, UITP,
is
QA = cA UA −UITP( )A . (3.8)
Expressed in terms of ion electrophoretic mobilities we find
QA = cAµA
µTE
−1⎛⎝⎜
⎞⎠⎟UITPA . (3.9)
To find the total mass accumulated, we simply multiply by the total time over which the
analyte injection occurs,
Minj = cAµA
µTE
−1⎛⎝⎜
⎞⎠⎟UITPAT . (3.10)
We note that the ITP velocity multiplied by the injection time is equal to the channel
length over which the ITP interface travels, L, which is fixed by the detection point
location (DS0 in Figure 3.1) in our experiments, therefore
Minj = cAµA
µTE
−1⎛⎝⎜
⎞⎠⎟AL . (3.11)
In addition, the Jovin and Alberty regulating functions set by the LE buffer which
initially fills the channel causes the TE ions (and all analytes mixed in the TE) to adjust

83
to a new concentration as it enters the channel.1,16,17 For our experiments, we estimate a
5-fold change in concentration between the analyte concentration dispensed in the
reservoir and that enters the channel, cA ≈ 5cA,res . We also estimate an analyte-to-TE ion
mobility ratio of µA/µTE≈1.5. With these estimates, we find:
Minj = 2.5cA,resAL . (3.12)
The fraction analyte injected from the TE reservoir is then simply the ratio of mass
accumulated in the ITP zone (Minj) to that dispensed in the TE reservoir (Mres):
f =Minj
Mres
≈2.5cA,resALcA,resV
=2.5ALV
. (3.13)
So we find that the fraction injected is proportional to the volume swept by the ITP
interface, AL, divided by the volume dispensed in the reservoir, V.
For the dimensions of the microfluidic chips used in our experiments, we find f ≈ 0.5% .
Therefore, while we typically dispense 1 µg of total RNA in the chip reservoir, only
~5 ng of this enters the channel and focuses at the ITP interface. We note that this
fraction of processed sample can be drastically increased with alternate chip
configurations and injection protocols currently under development.
3.3 Results and discussion
ITP is an electrokinetic technique which uses a heterogeneous buffer system, composed
of leading (LE) and trailing (TE) electrolytes, to perform >10,000-fold focusing.90 We
choose LE and TE ions whose mobility brackets that of microRNA molecules and
complementary fluorescent reporters. ITP preconcentrates microRNAs and reporters at

84
the interface between LE and TE buffers, and this interface migrates throughout the
microfluidic channel at a constant velocity. Figure 3.6 shows a schematic representation
of our assay. The microfluidic chip accepts loading of total RNA (e.g., extracted from a
tissue sample), which is mixed with reporter molecules in the TE reservoir. We use ITP
to extract, mix, and preconcentrate RNAs and reporters from the TE reservoir and into
the focused ITP zone (LE-TE interface), where they hybridize at high concentration.60
Following hybridization, the ITP zone migrates into a purification region which contains
a hydrogel decorated with capture oligos complementary to reporters. Excess
(unhybridized) reporters bind to the capture probes and become immobilized, while
reporters hybridized to microRNAs remain focused in ITP and can be detected
downstream.
We pattern three regions into the channel as follows: A first LE1 region enables rapid
initial sample extraction, preconcentration, and mixing, and yet is robust to loading of a
wide distribution of RNA sizes and concentrations (see Section 3.2.7); a second region,
LE2, allows more optimized hybridization conditions while performing some size
selection (see Figure 3.2) and a third region, LE3, performs affinity purification of
reaction products. All three regions contain the same LE buffer, but vary in gel
composition and/or presence of capture probes. LE1 contains 2% linear polyacrylamide
(LPA) and LE2 and LE3 each contain 4% cross-linked polyacrylamide (PA). LE3 further
contains Acrydite-labeled capture probes which we use to immobilize excess reporters.
To achieve single-nucleotide specificity, we designed reporter molecules with a hairpin
secondary structure. This hairpin design enhances specificity thermodynamically, by
introducing competition between self-hybridization (closed state) and hybridization with

85
other molecules (open state).91 In this report, we focus on the let-7 family of microRNAs
due to their important role in cell development, as well as their prognostic value for
postoperative lung cancer patients.69 We designed hairpin reporters for let-7a with the aid
of an online simulation tool which predicts approximate melting curves.33 Figure 3.7a
shows predicted melting curves for both linear (top) and hairpin (bottom) reporters. As
seen in the first two plots of Figure 3.7a, the hairpin reporter exhibits a significantly
larger difference in melting temperature between let-7a and mismatch sequences (here
let-7c and let-7d). For example, the predicted difference in melting temperature between
let-7a and let-7c, which differ by 1 nt, is only ~1.5°C with a linear design, but increases
to ~5°C with a hairpin design.
At approximately 51°C (see dashed vertical line in Figure 3.7a), we can therefore expect
to observe much lower signal from let-7c than from let-7a when using hairpin reporters.
However, in this temperature range the hybridization reaction between reporters and
capture probes also suffers (Figure 3.7a, dashed curve of the bottom plot). This reduces
efficiency in the capture/purification process, and thereby lowers assay sensitivity and
dynamic range.84 To mitigate this adverse consequence of high stringency conditions, we
synthesized capture probes with 50% composition of locked nucleic acid (LNA) bases.
LNA bases are similar to RNA, but have a modified sugar which results in higher-affinity
interactions with other nucleic acids.92 An online tool provided by Exiqon predicts a
~18°C increase in melting temperature for this modified probe (Figure 3.7a, solid curve
of the bottom plot).

86
Figure 3.6 Schematic of ITP capture assay for microRNA detection. We fill the channel with leading
electrolyte (LE) buffer patterned into three regions used for total RNA injection, preconcentration, and
mixing (LE1); continued hybridization and size selection (LE2); and purification and detection (LE3).
These regions vary in polymer and capture oligo composition. LE1 is a low polymer concentration region
(2% LPA), which is robust to handling long and high concentration nucleic acids (see Section 3.2.7). LE2
and LE3 contain 4% PA gel. The higher gel concentration performs some size selection and LE3 further
contains immobilized capture oligos. The ITP zone co-focuses RNAs and complementary fluorescent
hairpin reporters, allowing them to react at high concentration in LE1 and LE2. Following hybridization,
the ITP zone enters LE3 where excess reporters bind to capture probes and become immobilized.
Meanwhile, hybridized reporters remain focused in ITP and electromigrate with the LE-TE interface at a
constant velocity. The migrating fluorescent signal is directly proportional to target microRNA
concentration. Plots show actual raw data with example electrophoretic traces of the ITP peak before
purification (left) and after the purification step for let-7a concentrations ranging between 0 pM to 500 pM
(right).
We numerically simulate hybridization dynamics of our assay using a volume-averaged
model developed by Bercovici et al.60 We analyze the reaction using classic second order
reaction theory and the ITP-enhanced reactant concentrations. The equation governing
the rate of target-reporter hybrid formation is:
dcHdt
=3πkoncT cR − koff cH . (3.14)

87
Figure 3.7 Demonstration of thermodynamic and kinetic bases for single-nucleotide specificity. (A) We
designed reporter molecules with a hairpin secondary structure, where the “loop” region is complementary
to let-7a and the ends self-hybridize to form an 8 nt stem. We show computer-generated melting curves for
linear (top) and hairpin (middle) reporters hybridized to the target (let-7a), a 1 nt mismatche (let-7c), and a
2 nt mismatch (let-7d). Hairpin reporters have lower melting temperatures and larger ΔT between let-7a
versus mismatch molecules. Mismatch discrimination is optimal at elevated temperature or denaturant
concentration (dashed vertical line). This helps stringency but also lowers the affinity between standard
DNA capture probes and hairpin reporters (bottom, dashed line). To achieve high capture efficiency and
retain sensitivity and stringency, we use capture probes with 50% locked nucleic acid (LNA) composition
to increase melting temperature by ~18°C (bottom, solid line). (B) We simulate hybridization dynamics of
hairpin reporters in our assay, including injection, hybridization, and purification stages, for let-7a, 7c, and
7d. microRNAs and reporters are first injected (0 < t < 450 s), during which time they accumulate at the
ITP interface and begin to hybridize. We then stop sample injection at t = 450 s and allow hybridization to
continue until t = 620 s. During these two initial injection and hybridization stages (0 < t < 620 s), the
fraction of microRNAs hybridized increases at a rate determined by kon, and toward the equilibrium value
set by the dissociation constant, KD. In the purification stage (t ≥ 620 s), unreacted nucleic acids are
removed and product signal decreases exponentially with the off-rate, koff. The inset plot shows the
mistmatch-to-let-7a signal ratio during purification. Because mismatch-reporter hybrids have higher off-
rates than the let-7a-reporter hybrids, stringency improves exponentially during purification, at the cost of
some reduced sensitivity.

88
Here cT, cR, and cH are volume-averaged concentrations of target (match or mismatch
microRNA), reporter, and hybrid molecules, respectively, in the ITP zone, and kon and koff
are kinetic on- and off-rates. This model captures all stages of our assay, including
microRNA and reporter injection, hybridization, and purification. We determined the
kinetic off-rate, koff, through experiments (see Section 3.2.9). We further used the
dissociation constant, KD, determined from a fit to our titration curve data (see Figure
3.8b) to infer the on-rate, kon = koff/KD. Further model and simulation details were
discussed in the Section 3.2.8. Our model is only semi-quantitative, but serves to design
the assay and demonstrate the use of kinetic off-rate to effect higher stringency.
In Figure 3.7b we show the predicted time-evolution reporters hybridized to let-7a, let-
7c, and let-7d. During the injection and hybridization stages (t < 630 s), the hybridized
fraction increases steadily, but differences in KD result in a lower fraction for mismatch
sequences. In the purification region (t > 630 s), our relatively rapid removal of excess
reporters (cR = 0), drives the first term on the right-hand side of equation (1) to zero
(assuming fast reaction between capture probes and reporters). Off-rate kinetics therefore
play an important role in the subsequent decrease in fluorescent signal, described by
cH ~ exp(-kofft), as koff is larger for mismatches than for let-7a (see Figure 3.4). The inset
figure shows plots of mismatch-to-let-7a concentration ratio, cH,mm/cH,A ~ exp[(koff,A-
koff,mm)t], as a measure of stringency in the purification region. We observe improvement
in specificity in the purification region for both mismatch sequences plotted. In particular,
the relative signal for let-7c decreases from 40% to 11% at the end of the purification
region and that for let-7d decreases from 4.4% to approximately 1.8%. We conclude that
our two-stage assay is able to leverage both thermodynamics and kinetics for specificity.

89
Figure 3.8 Experimental demonstration of single-nucleotide specificity. (A) The let-7 family contains eight
microRNAs, which differ by as little as 1 nt. We list all eight sequences here and use red underlined font to
indicate nucleotides which differ from the target sequence, let-7a. (B) Experimental demonstration of assay
specificity for let-7a. We performed spike-in experiments for each let-7 family member including the let-7a
precursor (N = 5 for let-7b, N = 3 for all others). We used total RNA extracted from K562 cells (RIN = 10)
to simulate background RNA complexity. To quantify our results, we plot fluorescent signal normalized by
mean signal from let-7a experiments. Uncertainty bars indicate 95% confidence on the mean. Inset shows
titration curve spanning 15 pM to 4.5 nM let-7a concentration and theoretical curve based on our simple
numerical hybridization model.
With this understanding, we experimentally optimized denaturant (urea) concentration in
order to demonstrate that our assay can discriminate between let-7a and all other
members of the let-7 family. Figure 3.8 shows results from spike-in experiments for each
of the let-7 family microRNAs. We included total RNA from K562 cells in all
experiments to simulate background complexity (K562 cells do not contain let-7a, as
verified by our preliminary qPCR experiments, not shown). Results demonstrate a
mismatch-to-match signal ratio of ~0.1 for let-7b and let-7c and ~0.0 for all other let-7

90
microRNAs (including the let-7a precursor, which does not hybridize to reporters, see
Section 3.2.10). We note that let-7b and let-7c form rG-dT mismatched base pairs with
the reporter. This particular non-Watson-Crick interaction is known to be especially
problematic for hybridization methods, and depending on local sequence can be as
energetically favorable as the correct rA-dT base pair.93 Despite this difficulty, our
technique generates ~10x lower signal even for these very challenging cases.
We validated our technique by performing quantification of let-7a concentration from
four total RNA extracts using our assay, and benchmarked these data relative to a
carefully-calibrated Taqman qPCR assay. Our technique and the Taqman qPCR
technique each process only approximately 1 ng of total RNA (see Section 3.2.11 for
estimate of total RNA processed using ITP). Figure 3.9 shows side-by-side experimental
comparison of let-7a using both ITP and qPCR. We observe excellent agreement between
ITP and qPCR. We note that the standard deviation for the Human Brain sample is higher
for both methods and this is likely due to the relatively low integrity of this sample
(RIN = 8.2, measured using Agilent Bioanalyzer). Our ITP method provides a much
simpler and streamlined operating protocol and greatly reduced analysis time of ~15 min
(for the full assay including sample dispensing and detection) as compared to ~2.5 hours
for qPCR.

91
Figure 3.9 Experimental demonstration and validation of let-7a quantification from four total RNA
samples using ITP-capture assay. We measured let-7a concentrations in human brain (RIN = 8.2, N = 5),
mouse brain (RIN = 8.4, N = 3), mouse 15-day embryo (RIN = 9.9, N = 3), and Raji cells (RIN = 10,
N = 3) using both our ITP-capture assay and an off-the-shelf Taqman qPCR assay. Error bars represent
95% confidence on the mean.
In summary, we developed an elecrokinetic method for rapid, specific, and sensitive
microRNA detection. Our method uses electrokinetic focusing via ITP to enhance
hybridization and an in-line affinity gel to purify reaction products. As demonstrated by
our numerical model, our assay leverages both thermodynamics and off-rate kinetics to
enhance specificity. We demonstrated new reporter and buffer designs, which we used to
detect let-7a with single-nucleotide specificity, even for mismatch microRNAs containing
the very challenging rG-dT base-pairing. Finally, we quantified concentration of let-7a in
four total RNA extracts, derived from three tissues and one cell line. We validated these
measurements, and our method more generally, by comparison with qPCR quantification.
Our microRNA analysis takes 15 min to complete and processes only ~5 ng of total RNA
(only a small fraction of the 1 µg of total RNA dispensed onto the chip, approximately

92
0.5%, is injected and processed by ITP; see Section 3.2.11 for further discussion). This
represents over 1,000-fold improvement in sensitivity and 200-fold improvement in
analysis time over the Northern Blotting, and 10-fold improvement in analysis time over
qPCR. We therefore believe that our technique is well-suited to microRNA detection, as
it addresses a currently unmet need for analysis that is at once sufficiently rapid, specific,
and sensitive.

93
4 Conclusions and recommendations
In this chapter, we summarize the main conclusion and major achievements of the work
presented in this dissertation. We also present recommendations for future work which
we hope will provide current and future researchers with inspiration and ideas for ways in
which to apply our work.
4.1 Conclusions
Integration of ITP and Affinity Purification Hydrogels
1. Negative control experiments show ~4500-fold reduction in fluorescent signal
after focused linear reporters enter the affinity purification hydrogel. This
demonstrates that use of an affinity purification gel is an effective strategy for
background signal reduction.
2. Titration experiments show a linear dynamic response over approximately 4
orders of magnitude and ~1 pM sensitivity. This demonstrates the utility of our
assay as well as improvement over previous single-step ITP-based assays.
3. Successful use of a secondary affinity gel for targeted removal of precursors
suggests, more generally, that secondary gels can be used to remove any
unwanted species.
High-specificity microRNA detection using ITP two-stage assay
1. Focusing experiments with 200nt and 70nt synthetic DNA resulting in
degradation and no degradation, respectively, suggest that NA length plays
important role in gel degradation.

94
2. Use of a low concentration polyacrylamide gel for sample injection prevents gel
degradation. This result also suggests that gel degradation is a result of high
concentration, long RNAs.
3. Comparison of hairpin and linear reporter designs using melting curve prediction
tools shows that hairpin reporters exhibit enhanced equilibrium-based specificity.
4. Modeling of the off-rate processes of matched vs. mismatch and its dependence
on koff rates demonstrates that leveraging a off-rate kinetics-dominated regime is a
useful strategy for increasing assay specificity.
5. The use of kinetics to enhance specificity comes at the price of lower signal. This
trade-off can be evaluated with the help of what we term the wash parameter, G.
Here G is defined as the ratio of timescales associated with specificity increase
and signal decay.
4.2 Contributions
Integration of ITP and Affinity Purification Hydrogels
1. We developed a two-stage hybridization assay which combines ITP for
hybridization kinetics enhancement and photopatterned functionalized hydrogels
for affinity purification of reaction products.
2. Using the two-stage ITP technique we demonstrated detection of synthetic
microRNAs under low stringency conditions.
3. We characterized the sensitivity and limit of detection of the two-stage ITP
technique using synthetic microRNAs.

95
4. We developed a strategy to remove inactive precursor microRNAs from the ITP
zone by using a secondary functionalized hydrogel to target the precursor loop
which is not present in the mature microRNA molecule.
5. Using the precursor removal strategy, we demonstrated unbiased measurement of
mature microRNA concentration in the presence equally abundante precursor
microRNA.
6. We designed simple, easily-automated assay protocols with internal normalization
controls to improve assay accuracy and repeatability.
High-specificity microRNA detection using ITP two-stage assay
1. We developed a low concentration polymer injection region which prevents
degradation of hybridization and capture gels due to overloading with high
concentration long DNA and RNA.
2. We developed a numerical code based on a volume-averaged model which
simulates hybridization of reporters to target and mismatch microRNA molecules.
3. We developed a method of estimating kinetic off-rates of hybridization reactions
between reporters and target/mismatch molecules based on experiments using our
two-stage ITP technique.
4. We used our volume-averaged simulations, experimental off-rate measurements,
and dissociation rate predictions to demonstrate our two-stage assay leverages
both equilibrium thermodynamics and off-rate kinetics to enhance specificity.
5. We used online simulation tools to design a reporter probe for let-7a with a
hairpin secondary-structure which improves equilibrium-based hybridization
specificity.

96
6. We optimized buffer composition and denaturant concentration to achieve single-
nucleotide specificity.
7. We demonstrated specificity for let-7a over all other let-7 family microRNAs,
which differ by 1–4 nt, even for the most challenging rG-dT wobble base pairs.
8. We used our two-stage ITP technique with modified reporters and buffer
conditions to quantify let-7a concentration in total RNA extracted from mouse
tissue, human tissue, and a cell line.
9. We experimentally validated our ITP measurements by comparison to qRT-PCR
measurements.
4.3 Recommendations for future work
1. We believe our two-stage ITP technique is general and can be extended beyond
detection of microRNAs. For example, longer nucleic acids (mRNA, rRNA,
genomic DNA) could be used if the hydrogel is replaced with a functionalized
macro-porous polymer. We believe this strategy can be extended to protein assays
by replacing DNA capture probes with aptamers or antibodies.
2. Our microRNA assay would benefit greatly from a finite sample injection scheme
which would allow sample processing with ~100% yield. This would allow
microRNA profiling from as few as 10–100 cells.
3. Coupling our microRNA assay with on-chip RNA purification would allow on-
chip analysis starting from a raw sample (e.g., urine, blood). Our group has
demonstrated purification from complex samples such as urine and blood using
ITP.10,11 These purification schemes can be coupled upstream of our assay.

97
4. Currently chip preparation and hydrogel polymerization can take more time than
running the assay itself. A simple remedy is to prepare chips in batch. A more
elegant and practical approach is to replace the current cross-linked gel with a
replaceable gel such as linear polyacrylamide, which can polymerized off-chip
and loaded into the chip quickly.
5. We demonstrated our two-stage ITP assay only for let-7a. New hybridization
probes and assay conditions must be designed and optimized for analysis of other
microRNA species.
6. Buffer and denaturant optimization remains a largely manual, trial-and-error-
based process. General guidelines or rules-of-thumb would be immensely useful
in optimizing our assay for new microRNA species. We recommend, for example,
finding a relationship between denaturant concentration and effective
temperature. Coupled with DINAMelt simulations, this would allow quick
estimates of denaturant concentration which optimizes assay specificity.
7. While our current numerical hybridization model is useful in assay design, it is
limited by the lack of a simulation tool for DNA/RNA hybrid helix formation and
melting. We presently rely on DINAMelt, which uses NN parameter values for
DNA/DNA or RNA/RNA base-pairing.
8. Sensitivity of our two-stage ITP assay would benefit from improved capture
efficiency in the purification region. This may be achieved by further increasing
the LNA content of capture probes (presently we use capture probes with 50%
LNA composition).

98
Bibliography
[1] B. Jung, R. Bharadwaj, & J.G. Santiago, "On-Chip Millionfold Sample Stacking
Using Transient Isotachophoresis," Analytical Chemistry 78 (7), 2319 (2006).
[2] B. Jung, Y. Zhu, & J.G. Santiago, "Detection of 100 aM fluorophores using a
high-sensitivity on-chip CE system and transient isotachophoresis," Analytical
Chemistry 79 (1), 345 (2007).
[3] F.M. Everaerts, J.L. Beckers, & T.P.E.M. Verheggen, Isotachophoresis: theory,
instrumentation, and applications. Elsevier Science & Technology, 1976.
[4] T.K. Khurana & J.G. Santiago, "Preconcentration, separation, and indirect
detection of nonfluorescent analytes using fluorescent mobility markers,"
Analytical Chemistry 80 (1), 279 (2008).
[5] M. Bercovici, G.V. Kaigala, C.J. Backhouse, & J.G. Santiago, "Fluorescent
Carrier Ampholytes Assay for Portable, Label-Free Detection of Chemical Toxins
in Tap Water," Analytical Chemistry 82 (5), 1858 (2010).
[6] M. Bercovici, G.V. Kaigala, & J.G. Santiago, "Method for Analyte Identification
Using Isotachophoresis and a Fluorescent Carrier Ampholyte Assay," Analytical
Chemistry 82 (5), 2134 (2010).
[7] G.V. Kaigala, M. Bercovici, M. Behnam, D. Elliott, J.G. Santiago, & C.J.
Backhouse, "Miniaturized system for isotachophoresis assays," Lab on a Chip 10
(17), 2242 (2010).

99
[8] R.D. Chambers & J.G. Santiago, "Imaging and quantification of isotachophoresis
zones using nonfocusing fluorescent tracers," Analytical Chemistry 81 (8), 3022
(2009).
[9] R.B. Schoch, M. Ronaghi, & J.G. Santiago, "Rapid and selective extraction,
isolation, preconcentration, and quantitation of small RNAs from cell lysate using
on-chip isotachophoresis," Lab on a Chip 9 (15), 2145 (2009).
[10] A. Persat, L.A. Marshall, & J.G. Santiago, "Purification of nucleic acids from
whole blood using isotachophoresis," Analytical Chemistry 81 (22), 9507 (2009).
[11] M. Bercovici, G.V. Kaigala, K.E. Mach, C.M. Han, J.C. Liao, & J.G. Santiago,
"Rapid Detection of Urinary Tract Infections Using Isotachophoresis and
Molecular Beacons," Analytical Chemistry 83, 4110 (2011).
[12] L.A. Marshall, C.M. Han, & J.G. Santiago, "Extraction of DNA from malaria-
infected erythrocytes using isotachophoresis," Analytical Chemistry 83 (24), 9715
(2011).
[13] A. Persat, R.D. Chambers, & J.G. Santiago, "Basic principles of electrolyte
chemistry for microfluidic electrokinetics. Part I: Acid–base equilibria and pH
buffers," Lab on a Chip 9 (17), 2437 (2009).
[14] G. Garcia-Schwarz, M. Bercovici, L.A. Marshall, & J.G. Santiago, "Sample
dispersion in isotachophoresis," Journal of Fluid Mechanics 679, 455 (2011).

100
[15] F. Kohlrausch, "Ueber Concentrations-Verschiebungen durch Electrolyse im
Inneren von L\ösungen und L\ösungsgemischen," Annalen der Physik 298 (10),
209 (1897).
[16] R.A. Alberty, "Moving boundary systems formed by weak electrolytes. Theory of
simple systems formed by weak acids and bases," J. Am. Chem. Soc. 72 (6), 2361
(1950).
[17] T.M. Jovin, "Multiphasic zone electrophoresis. I. Steady-state moving-boundary
systems formed by different electrolyte combinations," Biochemistry 12 (5), 871
(1973).
[18] D.A. MacInnes & L.G. Longsworth, "Transference Numbers by the Method of
Moving Boundaries," Chemical Reviews 11 (2), 171 (1932).
[19] A. Persat & J.G. Santiago, "MicroRNA Profiling by Simultaneous Selective
Isotachophoresis and Hybridization with Molecular Beacons," Analytical
Chemistry 83 (6), 2310 (2011).
[20] J.A. Subirana & P. Doty, "Kinetics of renaturation of denatured DNA. I.
Spectrophotometric results," Biopolymers 4 (2), 171 (1966).
[21] J.G. Wetmur & N. Davidson, "Kinetics of renaturation of DNA," Journal of
Molecular Biology 31 (3), 349 (1968).
[22] I.N. Levine, Physical Chemistry. McGraw-Hill, London, 2003.

101
[23] D.M. Crothers & B.H. Zimm, "Theory of the melting transition of synthetic
polynucleotides: evaluation of the stacking free energy," Journal of Molecular
Biology 9 (1), 1 (1964).
[24] D.M. Crothers, N.R. Kallenbach, & B.H. Zimm, "The melting transition of low-
molecular-weight DNA: Theory and experiment," Journal of Molecular Biology
11 (4), 802 (1965).
[25] H. DeVoe & I. Tinoco Jr, "The stability of helical polynucleotides: base
contributions," Journal of Molecular Biology 4 (6), 500 (1962).
[26] I. Tinoco, P.N. Borer, B. Dengler, M.D. Levine, O.C. Uhlenbeck, D.M. Crothers,
& J. Gralla, "Improved Estimation of Secondary Structure in Ribonucleic Acids,"
Nature 246 (150), 40 (1973).
[27] J. SantaLucia, "A unified view of polymer, dumbbell, and oligonucleotide DNA
nearest-neighbor thermodynamics," Proceedings of the National Academy of
Sciences 95 (4), 1460 (1998).
[28] S.M. Freier, R. Kierzek, J.A. Jaeger, N. Sugimoto, M.H. Caruthers, T. Neilson, &
D.H. Turner, "Improved free-energy parameters for predictions of RNA duplex
stability," Proceedings of the National Academy of Sciences 83 (24), 9373 (1986).
[29] T. Xia, J. SantaLucia, M.E. Burkard, R. Kierzek, S.J. Schroeder, X. Jiao, C. Cox,
& D.H. Turner, "Thermodynamic parameters for an expanded nearest-neighbor
model for formation of RNA duplexes with Watson-Crick base pairs,"
Biochemistry 37 (42), 14719 (1998).
102
[30] N. Sugimoto, S.-i. Nakano, M. Katoh, A. Matsumura, H. Nakamuta, T. Ohmichi,
M. Yoneyama, & M. Sasaki, "Thermodynamic parameters to predict stability of
RNA/DNA hybrid duplexes," Biochemistry 34 (35), 11211 (1995).
[31] N. Sugimoto, M. Nakano, & S.-i. Nakano, "Thermodynamics-structure
relationship of single mismatches in RNA/DNA duplexes," Biochemistry 39 (37),
11270 (2000).
[32] R.A. Dimitrov & M. Zuker, "Prediction of hybridization and melting for double-
stranded nucleic acids," Biophysical Journal 87 (1), 215 (2004).
[33] N.R. Markham & M. Zuker, "DINAMelt web server for nucleic acid melting
prediction," Nucleic Acids Research 33 (suppl 2), W577 (2005).
[34] S. Tyagi & F.R. Kramer, "Molecular beacons: probes that fluoresce upon
hybridization," Nature Biotechnology 14 (3), 303 (1996).
[35] S. Tyagi, D.P. Bratu, & F.R. Kramer, "Multicolor molecular beacons for allele
discrimination," Nature Biotechnology 16 (1), 49 (1998).
[36] A. Tsourkas, M.A. Behlke, S.D. Rose, & G. Bao, "Hybridization kinetics and
thermodynamics of molecular beacons," Nucleic Acids Research 31 (4), 1319
(2003).
[37] P. Mouritzen, A.T. Nielsen, H.M. Pfundheller, Y. Choleva, L. Kongsbak, & S.
Møller, "Single nucleotide polymorphism genotyping using locked nucleic acid
(LNA™)," Expert Review of Molecular Diagnostics 3 (1), 27 (2003).

103
[38] Y. You, B.G. Moreira, M.A. Behlke, & R. Owczarzy, "Design of LNA probes
that improve mismatch discrimination," Nucleic Acids Research 34 (8), e60
(2006).
[39] R. Owczarzy, Y. You, C.L. Groth, & A.V. Tataurov, "Stability and Mismatch
Discrimination of Locked Nucleic Acid–DNA Duplexes," Biochemistry 50 (43),
9352 (2011).
[40] J.C. Alwine, D.J. Kemp, & G.R. Stark, "Method for detection of specific RNAs in
agarose gels by transfer to diazobenzyloxymethyl-paper and hybridization with
DNA probes," Proceedings of the National Academy of Sciences 74 (12), 5350
(1977).
[41] M. Gotoh, Y. Hasegawa, Y. Shinohara, M. Shimizu, & M. Tosu, "A new
approach to determine the effect of mismatches on kinetic parameters in DNA
hybridization using an optical biosensor," DNA Research 2 (6), 285 (1995).
[42] S. Ikuta, K. Takagi, R.B. Wallace, & K. Itakura, "Dissociation kinetics of 19 base
paired oligonucleotide-DNA duplexes containing different single mismatched
base pairs," Nucleic Acids Research 15 (2), 797 (1987).
[43] C.C. Pritchard, "Effect of base mismatches on joining of short
oligodeoxynucleotides by DNA ligases," Nucleic Acids Res 25 (17), 3403 (1997).
[44] S.C. Chapin, D.C. Appleyard, D.C. Pregibon, & P.S. Doyle, "Rapid microRNA
profiling on encoded gel microparticles," Angewandte Chemie 123 (10), 2337
(2011).

104
[45] A. Válóczi, C. Hornyik, N. Varga, J. Burgyán, S. Kauppinen, & Z. Havelda,
"Sensitive and specific detection of microRNAs by northern blot analysis using
LNA-modified oligonucleotide probes," Nucleic Acids Research 32 (22), e175
(2004).
[46] J.E. Korkola, A.L.H. Estep, S. Pejavar, S. De Vries, R. Jensen, & F.M. Waldman,
"Optimizing stringency for expression microarrays," Biotechniques 35 (4), 828
(2003).
[47] E.A. Bayer & M. Wilchek, "Application of avidin–biotin technology to affinity-
based separations," Journal of Chromatography A 510, 3 (1990).
[48] J. Lu, G. Getz, E.A. Miska, E. Alvarez-Saavedra, J. Lamb, D. Peck, A. Sweet-
Cordero, B.L. Ebert, R.H. Mak, A.A. Ferrando, & others, "MicroRNA expression
profiles classify human cancers," Nature 435 (7043), 834 (2005).
[49] J.V. Tricoli & J.W. Jacobson, "MicroRNA: potential for cancer detection,
diagnosis, and prognosis," Cancer Research 67 (10), 4553 (2007).
[50] K.A. Cissell, S. Shrestha, & S.K. Deo, "MicroRNA detection: challenges for the
analytical chemist," Analytical Chemistry 79 (13), 4754 (2007).
[51] M. Baker, "MicroRNA profiling: separating signal from noise," Nature Methods 7
(9), 687 (2010).

105
[52] A. Persat, R.R. Chivukula, J.T. Mendell, & J.G. Santiago, "Quantification of
global microRNA abundance by selective isotachophoresis," Analytical
Chemistry 82 (23), 9631 (2010).
[53] C. Chen, D.A. Ridzon, A.J. Broomer, Z. Zhou, D.H. Lee, J.T. Nguyen, M.
Barbisin, N.L. Xu, V.R. Mahuvakar, M.R. Andersen, K.Q. Lao, K.J. Livak, &
K.J. Guegler, "Real-time quantification of microRNAs by stem-loop RT-PCR,"
Nucleic Acids Research 33 (20), e179 (2005).
[54] C.E. Corless, M. Guiver, R. Borrow, V. Edwards-Jones, E.B. Kaczmarski, & A.J.
Fox, "Contamination and sensitivity issues with a real-time universal 16S rRNA
PCR," Journal of Clinical Microbiology 38 (5), 1747 (2000).
[55] S.A. Bustin & T. Nolan, "Pitfalls of quantitative real-time reverse-transcription
polymerase chain reaction," Journal of Biomolecular Techniques 15 (3) (2004).
[56] V. Benes & M. Castoldi, "Expression profiling of microRNA using real-time
quantitative PCR, how to use it and what is available," Methods 50 (4), 244
(2010).
[57] T. Babak, W.E.N. Zhang, Q. Morris, B.J. Blencowe, & T.R. Hughes, "Probing
microRNAs with microarrays: tissue specificity and functional inference," RNA
10 (11), 1813 (2004).
[58] H. Wang, R.A. Ach, & B. Curry, "Direct and sensitive miRNA profiling from
low-input total RNA," RNA 13 (1), 151 (2007).
106
[59] U. Bissels, S. Wild, S. Tomiuk, A. Holste, M. Hafner, T. Tuschl, & A. Bosio,
"Absolute quantification of microRNAs by using a universal reference," RNA 15
(12), 2375 (2009).
[60] M. Bercovici, C.M. Han, J.C. Liao, & J.G. Santiago, "Rapid hybridization of
nucleic acids using isotachophoresis," Proceedings of the National Academy of
Sciences 109 (28), 11127 (2012).
[61] M. He & A.E. Herr, "Automated microfluidic protein immunoblotting," Nature
Protocols 5 (11), 1844 (2010).
[62] L. He & G.J. Hannon, "MicroRNAs: small RNAs with a big role in gene
regulation," Nature Reviews Genetics 5 (7), 522 (2004).
[63] T. Rohr, C. Yu, M.H. Davey, F. Svec, & J.M. Frechet, "Porous polymer
monoliths: simple and efficient mixers prepared by direct polymerization in the
channels of microfluidic chips," Electrophoresis 22 (18), 3959 (2001).
[64] A.V. Hatch, A.E. Herr, D.J. Throckmorton, J.S. Brennan, & A.K. Singh,
"Integrated preconcentration SDS-PAGE of proteins in microchips using
photopatterned cross-linked polyacrylamide gels," Analytical Chemistry 78 (14),
4976 (2006).
[65] G.J. Sommer, A.K. Singh, & A.V. Hatch, "Enrichment and fractionation of
proteins via microscale pore limit electrophoresis," Lab on a Chip 9 (18), 2729
(2009).

107
[66] T.K. Khurana & J.G. Santiago, "Sample Zone Dynamics in Peak Mode
Isotachophoresis," Analytical Chemistry 80 (16), 6300 (2008).
[67] Y. Gao, L.K. Wolf, & R.M. Georgiadis, "Secondary structure effects on DNA
hybridization kinetics: a solution versus surface comparison," Nucleic Acids
Research 34 (11), 3370 (2006).
[68] W.P. Kloosterman & R.H.A. Plasterk, "The diverse functions of microRNAs in
animal development and disease," Developmental Cell 11 (4), 441 (2006).
[69] J. Takamizawa, H. Konishi, K. Yanagisawa, S. Tomida, H. Osada, H. Endoh, T.
Harano, Y. Yatabe, M. Nagino, Y. Nimura, & others, "Reduced expression of the
let-7 microRNAs in human lung cancers in association with shortened
postoperative survival," Cancer Research 64 (11) (2004).
[70] S. Shell, S.M. Park, A.R. Radjabi, R. Schickel, E.O. Kistner, D.A. Jewell, C. Feig,
E. Lengyel, & M.E. Peter, "Let-7 expression defines two differentiation stages of
cancer," Proceedings of the National Academy of Sciences 104 (27), 11400
(2007).
[71] R.C. Lee, R.L. Feinbaum, & V. Ambros, "The C. elegans heterochronic gene lin-4
encodes small RNAs with antisense complementarity to lin-14," Cell 75 (5), 843
(1993).
[72] H.B. Houbaviy, M.F. Murray, & P.A. Sharp, "Embryonic stem cell-specific
MicroRNAs," Developmental Cell 5 (2), 351 (2003).

108
[73] J. Brennecke, D.R. Hipfner, A. Stark, R.B. Russell, & S.M. Cohen, "bantam
Encodes a Developmentally Regulated microRNA that Controls Cell Proliferation
and Regulates the Proapoptotic Gene hid in Drosophila," Cell 113 (1), 25 (2003).
[74] X. Li & R.W. Carthew, "A microRNA Mediates EGF Receptor Signaling and
Promotes Photoreceptor Differentiation in the Drosophila Eye," Cell 123 (7),
1267 (2005).
[75] X. Chen, Y. Ba, L. Ma, X. Cai, Y. Yin, K. Wang, J. Guo, Y. Zhang, J. Chen, & X.
Guo, "Characterization of microRNAs in serum: a novel class of biomarkers for
diagnosis of cancer and other diseases," Cell Research 18 (10), 997 (2008).
[76] S. Volinia, G.A. Calin, C.-G. Liu, S. Ambs, A. Cimmino, F. Petrocca, R. Visone,
M. Iorio, C. Roldo, & M. Ferracin, "A microRNA expression signature of human
solid tumors defines cancer gene targets," Proceedings of the National Academy
of Sciences 103 (7), 2257 (2006).
[77] C.C. Pritchard, H.H. Cheng, & M. Tewari, "MicroRNA profiling: approaches and
considerations," Nature Reviews Genetics 13 (5), 358 (2012).
[78] D. Leshkowitz, S. Horn-Saban, Y. Parmet, & E. Feldmesser, "Differences in
microRNA detection levels are technology and sequence dependent," RNA
(2013).
[79] P. Chugh & D.P. Dittmer, "Potential pitfalls in microRNA profiling," Wiley
Interdisciplinary Reviews: RNA 3 (5), 601 (2012).

109
[80] B.J. Reinhart, F.J. Slack, M. Basson, A.E. Pasquinelli, J.C. Bettinger, A.E.
Rougvie, H.R. Horvitz, & G. Ruvkun, "The 21-nucleotide let-7 RNA regulates
developmental timing in Caenorhabditis elegans," Nature 403 (6772), 901 (2000).
[81] C.D. Johnson, A. Esquela-Kerscher, G. Stefani, M. Byrom, K. Kelnar, D.
Ovcharenko, M. Wilson, X. Wang, J. Shelton, & J. Shingara, "The let-7
microRNA represses cell proliferation pathways in human cells," Cancer
Research 67 (16), 7713 (2007).
[82] S.M. Johnson, H. Grosshans, J. Shingara, M. Byrom, R. Jarvis, A. Cheng, E.
Labourier, K.L. Reinert, D. Brown, & F.J. Slack, "RAS Is Regulated by the let-7
MicroRNA Family," Cell 120 (5), 635 (2005).
[83] M. Malumbres & M. Barbacid, "RAS oncogenes: the first 30 years," Nature
Reviews Cancer 3 (6), 459 (2003).
[84] G. Garcia-Schwarz & J.G. Santiago, "Integration of On-Chip Isotachophoresis
and Functionalized Hydrogels for Enhanced-Sensitivity Nucleic Acid Detection,"
Analytical Chemistry 84 (15), 6366 (2012).
[85] H.L. Welles, A.R. Giaquinto, & R.E. Lindstrom, "Degradation of urea in
concentrated aqueous solution," Journal of Pharmaceutical Sciences 60 (8), 1212
(1971).
[86] D. Figeys & N.J. Dovichi, "Mobility of single-stranded DNA as a function of
cross-linker concentration in polyacrylamide capillary gel electrophoresis,"
Journal of Chromatography A 645 (2), 311 (1993).

110
[87] H. Swerdlow, K.E. Dew-Jager, K. Brady, R. Grey, N.J. Dovichi, & R. Gesteland,
"Stability of capillary gels for automated sequencing of DNA," Electrophoresis
13 (1), 475 (1992).
[88] A.Y. Rubina, S.V. Pan'kov, E.I. Dementieva, D.N. Pen'kov, A.V. Butygin, V.A.
Vasiliskov, A.V. Chudinov, A.L. Mikheikin, V.M. Mikhailovich, & A.D.
Mirzabekov, "Hydrogel drop microchips with immobilized DNA: properties and
methods for large-scale production," Analytical Biochemistry 325 (1), 92 (2004).
[89] A. Chan & U.J. Krull, "Capillary electrophoresis for capture and concentrating of
target nucleic acids by affinity gels modified to contain single-stranded nucleic
acid probes," Analytica Chimica Acta 578 (1), 31 (2006).
[90] G. Garcia-Schwarz, A. Rogacs, S.S. Bahga, & J.G. Santiago, "On-chip
Isotachophoresis for Separation of Ions and Purification of Nucleic Acids,"
Journal of Visualized Experiments (61) (2012).
[91] G. Bonnet, S. Tyagi, A. Libchaber, & F.R. Kramer, "Thermodynamic basis of the
enhanced specificity of structured DNA probes," Proceedings of the National
Academy of Sciences 96 (11), 6171 (1999).
[92] H. Kaur, A. Arora, J. Wengel, & S. Maiti, "Thermodynamic, Counterion, and
Hydration Effects for the Incorporation of Locked Nucleic Acid Nucleotides into
DNA Duplexes†," Biochemistry 45 (23), 7347 (2006).

111
[93] N. Sugimoto, M. Nakano, & S. Nakano, "Thermodynamics−Structure
Relationship of Single Mismatches in RNA/DNA Duplexes," Biochemistry 39
(37), 11270 (2000).

112
A Design notes for high-specificity experiments
In this appendix we elaborate on points 5 and 6 of Section 4.3 (recommended future
work). Both points are reproduced here for clarity:
5. We demonstrated our two-stage ITP assay only for let-7a. New hybridization
probes and assay conditions must be designed and optimized for analysis of
other microRNA species.
6. Buffer and denaturant optimization remains a largely manual, trial-and-error-
based process. General guidelines or rules-of-thumb would be immensely
useful in optimizing our assay for new microRNA species. We recommend, for
example, finding a relationship between denaturant concentration and effective
temperature. Coupled with DINAMelt simulations, this would allow quick
estimates of denaturant concentration which optimizes assay specificity.
Here we list and discuss briefly the 5 primary assay parameters which can be used to
optimize assay specificity.
• Reporter secondary structure: In our assay, we used reporters with strong
secondary structure to enhance specificity. In designing these modified probes, we
used the approach laid out in Section 1.2.2 and demonstrated in Figure 1.9. In our
experience, the computational tool DINAMelt proved to yield very accurate
melting curve predictions. We emphasize here the primary tradeoff between
specificity and association kinetics when designing the stem structure of the

113
hairpin reporter. A stronger stem structure (e.g., longer, higher GC content) will
always improve specificity, but typically also reduces kon.
• Salt concentration: Increased salt concentration can be used in hybridization
reactions to enhance kon. Divalent cations such as magnesium are especially
effective at shielding the repulsive negative electrostatic charge of the DNA
backbone, thereby increasing kon. However, high salt concentration also typically
results in decreased specificity. For assays in which single-nucleotide specificity
is required, we recommend limitng ionic strength to100 mM or less. We also note
that increasing salt concentration also increases melting temperatures, and this
depdence is included in the DINAMelt computational model.
• Denaturant concentration/temperature: In our assay, we use denaturants to
globally lower all melting temperatures and maximize the difference in
dissociation constant, KD, between target and mismatch sequences. This allows us
to operate the assay at room temperature, which in turn reduces the complexity of
the experimental setup. Presently, denaturant concentration needs to be optimized
manually for new targets. However, we believe that it is possible to
experimentally determine a general relationship between denaturant concentration
and change in melting temperature. In combination with DINAMelt melting curve
predictions, we believe this would greatly simplify the choice of optimal
denaturant concentration.
• Hybridization time (length of hybridization channel): Due to the constant
speed migration of the ITP interface, the length of the hybridization channel
together with the speed of ITP migration sets the duration of the hybridization

114
stage. In order to maximize sensitivity, sufficient time should be allowed for the
reaction to reach completion. We recommend using the numerical model
discussed in Section 3.2.8 to optimize hybridization channel length.
• Purification time (length of purification channel): Due to the constant speed
migration of the ITP interface, the length of the purification channel together with
the speed of ITP migration sets the duration of the purification stage. When
working under high stringency conditions with finite dissociation kinetics, the
time allowed for purification affects both assay sensitivity and specificity. As
discussed in Section 1.2.3, longer purification times improve specificity but
reduce sensitivity. Our numerical model (Section 3.2.8) can again be used to
choose the length of the purification channel.