raquel alcala borao - hammarby sjöstadsverk -...
TRANSCRIPT

TRITA-LWR Degree Project ISSN 1651-064X LWR - EX - 2015:16
OXIDATION OF PHARMACEUTICALS BY
CHLORINE DIOXIDE IN WASTEWATER
EFFLUENT
Raquel Alcala Borao
June 2015
Raquel Alcala Borao LWR – EX 2015:16
ii
© Raquel Alcala Borao 2015
Degree Project for the master program Environmental Engineering and Sustainable Infrastructure
Division of Land and Water Resources Engineering
Royal Institute of Technology (KTH)
SE-100 44 STOCKHOLM, Sweden
Reference should be written as: Alcala, R (2015) “Oxidation of pharmaceuticals by chlorine dioxide in wastewater effluent” TRITA-LWR Degree Project 2015:16
Oxidation of pharmaceuticals by chlorine dioxide in wastewater effluent
iii
SUMMARY
The presence of pharmaceuticals in the environment has raised an emerging
interest due to the fact that they pose negative environmental impact and health
hazards related to long-term toxicity effects. Its removal from wastewater and
from important drinking water sources is a big challenge to be faced by wastewater
treatment plants (WWTPs) and environmental engineers due to the low
concentration that is usually present in the water in addition to its high diversity
(chemical structure, mode of action, Kow). Pharmaceuticals end up into the influent
of WWTPs mainly through the sewage system that transports excreted faeces and
urine from households but they do not have yet maximum discharge guidelines
and standards. Conventional treatments used nowadays in WWTPs are not able to
totally remove pharmaceuticals from wastewater and therefore it is necessary to
seek for alternative advanced technologies such as oxidation with chlorine dioxide
(ClO2). ClO2 needs to be manufactured at the point of use and it is a highly
selective oxidant for several functional groups that are usually present in the
chemical structure of pharmaceuticals. The capital cost for a ClO2 generator is
lower than other oxidative technologies such as ozone and therefore it could be a
good option for small scale WWTPs (<2000 pe).
Previous studies with ClO2 have mainly tested the disinfection effect of ClO2 in
both drinking water and wastewater, although during the last years, more research
has been conducted in ClO2 as oxidant for pharmaceuticals focused on how
(kinetics) and which pharmaceuticals can be removed. However, the objective of
this master thesis was to find the most optimal dose – reaction time of ClO2 for
the maximum removal of selected environmentally relevant pharmaceuticals. This
was made as a bench-scale study where factorial design and subsequent
optimization with MODDE was selected as the best approach to find the optimal
dose – time. Batch oxidation tests were conducted on 100 mL aliquots treated with
ClO2 using wastewater effluent from Henriksdal WWTP. Solid phase extraction
and quantification of pharmaceuticals was carried out on a high performance liquid
chromatography- triple quadrupole mass spectrometry (HPLC-MS/MS).
At the beginning of the investigation, a priority list of pharmaceuticals was created
based on the risk ratio between the concentration at the effluent and the
concentration that has no predicted effect in the environment retrieved from
Pharmaceutical Specialties in Sweden (FASS) drug portal data base. 3 of the 23
studied pharmaceuticals (oxazepam, metropolol and diclofenac) were classified as
high risk, 5 as moderate risk and the remaining as low risk. Results from the bench
scale study states that an optimal dose of 5 g ClO2/m3 and a reaction time of 10
minutes can totally remove more than a half of the studied pharmaceuticals.
Furthermore six of the eight pharmaceuticals that posed moderate and high
environmental risk before ClO2 treatment, would pose a low environmental risk
after treatment with ClO2. Results indicate also that variations in wastewater
composition (e.g. COD) would affect the oxidant demand and therefore ClO2 –
sensitive absorbance at 254nm and pharmaceuticals dose-response decay curves
were measured as possible strategy for ClO2 dosage control in full scale WWTPs.
Before a pilot or full scale implementation of this technology can be performed,
supplementary and deeper ecotoxicologial studies needs to be done regarding the
formation of byproducts after oxidation with ClO2 that can be more toxic than the
parent compound.

Raquel Alcala Borao LWR – EX – 2015:16
iv

Oxidation of pharmaceuticals by chlorine dioxide in wastewater effluent
v
SAMMANFATTNING
Läkemedel i miljön har rönt ett växande intresse på grund av att de har negativ miljöpåverkan och utgör en hälsorisk till följd av toxiska effekter på lång sikt. Deras avlägsnande från avloppsvatten och från viktiga dricksvattenkällor är en stor utmaning för reningsverk och miljöingenjörer. Anledningen till detta är de låga koncentrationerna som vanligtvis finns i vattnet samt likheten mellan läkemedlen (olika kemisk struktur, verkningsmekanism, KOW). Läkemedelsubstanser hamnar i inflödet till reningsverk främst genom avloppssystem som transporterar urin och fekalier från hushåll. I dagsläget finns det dock inga riktlinjer och standarder för maximalt utsläpp.
Konventionella behandlingar som används i reningsverk idag kan inte avlägsna läkemedelsubstanser helt från avloppsvatten och därför är det nödvändigt att identifiera avancerade tekniker för uppgradering såsom oxidation med klordioxid (ClO2). ClO2 tillverkas vid användningsstället och det är en mycket selektiv oxidant för olika funktionella grupper som vanligtvis förekommer i den kemiska strukturen av läkemedelsubstanser (fenoler, tertiära/sekundära aminer, organiska svavelgrupper). Kapitalkostnaden för ClO2 är lägre jämfört med andra oxidativa tekniker som ozon och skulle därför vara ett bra alternativ för mindre reningsverk (<2000 pe). Tidigare studier med ClO2 har främst testat desinfektion effekten i både dricksvatten och avloppsvatten, men under de senaste åren har mer forskning fokuserat på ClO2 som oxidationsmedel om hur (kinetik) och vilka läkemedelsubstanser som kan tas bort. Syftet med detta examensarbete var dock att hitta den mest optimala dos – reaktionstid av ClO2 för maximalt avlägsnande av utvalda miljörelevanta läkemedel. Detta utfördes med försök i laboratorieskala studie med faktor försök. För den efterföljande optimering utsågs MODDE som det bästa sättet att hitta den optimala dosen – tid. Oxidations tester genomfördes på 100 mL prover med avloppsvatten från Henriksdal reningsverk som behandlades med ClO2. Därefter genomfördes fastfasextraktion och kvantifiering av läkemedelsubstanser på en högupplösande vätskekromatografi – trippelkvadrupolmasspektrometeri (HPLC-MS/MS).
I början av studien skapades en prioriteringslista över läkemedel baserad på riskkvot mellan koncentration vid utflödet och koncentration som inte har någon förutspådde effekt i miljön (PNEC). Dessa data hämtades från Pharmaceutical Specialities in Sweden (FASS) databas. 3 av de 23 studerade läkemedel (oxazepam, metoprolol och diklofenak) klassificerades som hög risk ämnen, 5 att utgöra måttlig risk och resterande som låg risk ämnen. Resultat från laboratorieförsöken visade på att en optimal dos av 5 g ClO2/m3 och reaktionstid av 10 minuter kan ta bort mer än hälften av de studerade läkemedel. Sex av de åtta läkemedelsubstanser som hade måttlig och hög miljörisk innan ClO2 behandling skulle medföra en låg miljörisk efter behandling med optimal ClO2 dos -tid. Resultat visar också att variationer i avloppsvattensammansättning (t.ex. COD) påverkar efterfrågan av oxidationsmedel och därför mättes ClO2 – känslig absorbans vid 254nm och läkemedels dos-respons kurvor som möjlig strategi för ClO2 doseringskontroll i fullskala på reningsverk.
Innan ett fullskaligt genomförande av denna teknik kan utföras behövs dock vidare och fördjupade toxikologiska tester om biprodukter eller mellanliggande substanser som kan vara mer toxiska än moderföreningarna.

Raquel Alcala Borao LWR – EX – 2015:16
vi

Oxidation of pharmaceuticals by chlorine dioxide in wastewater effluent
vii
ACKNOWLEDGEMENTS
First of all I would like to thank both my adviser at KTH, Maritha Hörsing, and my supervisor at IVL Swedish Environmental Institute, Jörgen Magnér, for their supervision, advices and inspiration during the project. I would also like to thank Christian Baresel for his support and people from Hammarby Sjöstadsverk and IVL for helping me in the laboratory and making these months more enjoyable. Finally, I would like to thank the company Xinix AB for providing their product AquaCare to perform all the experiments.
Last but not least I would like to thank my parents, friends and boyfriend for all their support throughout these two years as master student at KTH and during the work of this master thesis.
Stockholm, June 2015
Raquel Alcala Borao

Raquel Alcala Borao LWR – EX – 2015:16
viii

Oxidation of pharmaceuticals by chlorine dioxide in wastewater effluent
ix
TABLE OF CONTENTS
Summary ................................................................................................................................... iii
Sammanfattning ...................................................................................................................... v
Acknowledgements .............................................................................................................. vii
Table of contents .................................................................................................................... ix
Abbreviations .......................................................................................................................... xi
Abstract ...................................................................................................................................... 1
1. Introduction .......................................................................................................................... 1
1.1. Pharmaceuticals in the environment ......................................................................... 1
1.2.Pharmaceuticals and legislation ................................................................................... 3
1.3.Removal of pharmaceuticals in wastewater treatment plants ................................. 4
1.3.1.Conventional treatments .................................................................................. 4
1.3.2.Advanced treatment alternatives for pharmaceutical removal ................... 6
2. Aim of the study .................................................................................................................. 8
3. Background .......................................................................................................................... 8
3.1.Chemical aspects of chlorine dioxide ......................................................................... 8
3.2.By-products formation with ClO2 as oxidative agent .............................................. 9
3.3.Previous studies with ClO2 ........................................................................................ 10
3.4.Motivation and possibilities for ClO2 treatment in WWTPs ................................ 11
4.Materials and methods ..................................................................................................... 13
4.1.Chemicals ...................................................................................................................... 13
4.2.Analytical methods ...................................................................................................... 13
4.2.1.Chlorine dioxide analysis ................................................................................ 13
4.2.2.Ultraviolet absorbance measurement ........................................................... 13
4.2.3.Microtox test .................................................................................................... 13
4.2.4.Pharmaceuticals analysis ................................................................................. 13
4.3.Experimental setup ...................................................................................................... 16
4.3.1.Wastewater effluent ......................................................................................... 16
4.3.2.Methodology to find optimal ClO2 dose- reaction time ........................... 16
4.3.3.Relation between pharmaceuticals removal and ultraviolet absorbance (UVA254nm) ............................................................................................................. 19
4.4.Ranking of pharmaceuticals according to their environmental impact indicator19
5.Results ................................................................................................................................... 20
5.1.Priority list of pharmaceuticals .................................................................................. 20
5.2.Optimal ClO2 dose- reaction time ............................................................................ 21
5.2.1.First factorial experiment ............................................................................... 22
5.2.2.Second factorial experiment .......................................................................... 24
5.2.3.Optimum for most relevant pharmaceuticals ............................................. 26
5.2.4. Verification of pharmaceutical removal after treatment with common optimal ClO2 dose-time .......................................................................................... .26
Raquel Alcala Borao LWR – EX – 2015:16
x
5.3.Residual ClO2 after oxidation treatment .................................................................. 28
5.3.1.Influence of reaction time .............................................................................. 28
5.3.2.Influence of COD ........................................................................................... 28
5.4.Relationship between ClO2 sensitive-UVA 254 nm and pharmaceuticals……29
6.Discussion ............................................................................................................................ 31
6.1.Methodology and analytical errors ............................................................................ 31
6.1.1.Factorial experiment and MODDE ............................................................. 31
6.1.2.Matrix effects in the quantification of pharmaceuticals ............................ 31
6.2.Priority list of pharmaceuticals .................................................................................. 32
6.3.Optimal ClO2 dose – time –response ...................................................................... 33
6.4.ClO2 dosage control .................................................................................................... 34
6.5.Final evaluation ............................................................................................................ 34
6.5.1.Efficiency of ClO2 treatment ......................................................................... 34
6.5.2.Cost .................................................................................................................... 35
6.5.3.Ecotoxicological by-products ........................................................................ 35
7.Future studies ..................................................................................................................... 37
8.Conclusion ........................................................................................................................... 37
9.References ............................................................................................................................ 38
Appendix I - Characteristics of 23 analyzed pharmaceuticals .......................................... 42
Appendix II - Results from analysis of pharmaceuticals ................................................... 47
Appendix III - Optimal ClO2 dose –time-response for each pharmaceutical ............... 52
Oxidation of pharmaceuticals by chlorine dioxide in wastewater effluent
xi
ABBREVIATIONS
API = Atmospheric pressure ionization
CCF = face centered central composite design
COD = Chemical Oxygen demand
ClO2 =Chlorine dioxide
DBPs = Disinfection by-products
DOC = Dissolved organic matter
E2 = 17 beta-estradiol
EC = Environmental concentration
EC50 = Half maximal effective concentration
EDTA = Ethylenediaminetetraacetic acid
EE2 = 17 alpha-ethinylestradiol
FASS = Pharmaceutical Specialties in Sweden drug portal
GAC = granular activated carbon
HAAs = haloacetic acids
HPLC-MS/MS = High performance liquid chromatography coupled to tandem mass spectrometry
IS = Internal Standard
KOw = octanol/water partition coefficient
LOD = Limit of detection
LOQ = Limit of quantification
NOEC = No observed effect level
NSAIDs = nonsteroidal anti-inflammatory drugs
PAC = powdered activated carbon
PE = population equivalent
PNEC = Predicted no effect concentration
RMS = Response surface modeling
RO = Reverse osmosis
SAC = Spectral absorption coefficient
SPE = Solid phase extraction
THM = Trihalomethane
UVA254nm = Ultraviolet absorbance at 254nm
WWTPs = Wastewater treatment plants

Raquel Alcala Borao LWR – EX – 2015:16
xii
Oxidation of pharmaceuticals by chlorine dioxide in wastewater effluent
1
ABSTRACT
The presence of pharmaceuticals in the environment has raised an emerging interest due to the fact that they pose negative environmental impact and health hazards related to long-term toxicity effects. As conventional treatments are not able to totally remove these substances it is necessary to seek for alternative advanced technologies such as oxidation with chlorine dioxide (ClO2). The objective of this master thesis is thus to find the most optimal dose – reaction time of ClO2 for the oxidation and maximum removal of selected environmentally relevant pharmaceuticals. Factorial design and subsequent optimization with MODDE was selected as the best approach to find the optimal dose – time. Batch oxidation tests were conducted on 100mL aliquots treated with ClO2 using wastewater effluent from Henriksdal WWTP. Thereafter solid phase extraction and final determination of pharmaceuticals was carried out on a high performance liquid chromatography- triple quadrupole mass spectrometry (HPLC-MS/MS). Results showed that applying a dose of 5 mg ClO2/L and a reaction time of 10 minutes, it is possible to remove more than a half of the 17 analyzed substances. Besides most of the pharmaceuticals with high and moderate environmental risk, would pose a low risk for the environment after treatment with the optimal ClO2 dose – reaction time. Despite the fact that ClO2 could successfully degrade most environmentally relevant pharmaceuticals, deeper research concerning the formation of toxic by-products after oxidative treatment needs to be done before upscaling this technology to pilot or full scale as a suitable end of pipe technology for pharmaceuticals removal.
Key words: pharmaceuticals; chlorine dioxide; wastewater effluent; environmental risk; factorial design; MODDE
1. INTRODUCTION
In recent years, the existence of micropollutants in the aquatic environment has become an emerging issue because of their recognized negative environmental and human health effects. These micropollutans, also called emerging pollutants, integrate a broad range of both anthropogenic and natural substances such as pharmaceuticals, pesticides, biocides, flame retardants, etc. (Luo et al., 2014). The term “emerging” does not mean that the presence of these substances in the environment is new but it refers to the emerging interest by the scientific community in the presence of these contaminants in the environment as well as the analytical procedures required to their detection (Aga, 2008). Another issue that have raised the interest in these substances is that even though they are usually present in trace concentrations (few ng/l to several µg/l) they may cause negative environmental impact and health hazards related to short-term and long-term toxicity, endocrine disrupting effects and rise of antibiotic-resistant genes in bacteria (Klavarioti et al., 2009). This last fact is very relevant since the increase in antibiotic resistance is a serious threat to our availability to face infection diseases.
1.1. Pharmaceuticals in the environment The removal of pharmaceuticals from wastewater and from important drinking water sources, such as rivers, lakes or groundwater is a big challenge to be faced by wastewater treatment plants (WWTPs) and environmental engineers due to the low concentration that is usually present in the water in addition to its high diversity. There are several

Raquel Alcala Borao
groups of pharmaceuticals that have been found in the water such as antibiotics, antidepressants, analgesics, antianticoagulants, stimulants and antihypertensives among others (Utrilla et al.low levels in our microbial degradation. concentrationsadvanced analytconcentration (e.g liquid chromatography spectrometry [LC
The most relevant characteristics of and chemically complex structures with high and molecular weight; ii) certain degree ofpartition coefficient (Log KKOW higher than 3and those with Log Kbe attached to sludge and suspended particles in water; iii) pharmaceuticals are on the pH of the medium; iv) differs depending on the pharmaceuticalparacetamolmeanwhile others (Rivera-values higher than 3
According to previous studies about tpharmaceuticals the influent of excretedpharmaceuticals come into the aquatic environment through the dischargeto contaminate soil and groundwater without previous treatment when liquid manure is utilized as top soil cover. WWTPs, which may contain pharmaceuticals, may be used agricultural land leading to a high risk for soil risk of runet al. 2010).
Fig. 1. (adapted from Ternes, 1998)
LWR
2
groups of pharmaceuticals that have been found in the water such as antibiotics, antidepressants, analgesics, anti-inflammatories, anticoagulants, stimulants and antihypertensives among others (
et al., 2013). These drugs are designed in order to be effective at low levels in our bodies and to be resistant against e.g. stomach acid and microbial degradation. The fact that these substances are found in trace concentrations requires the development of more sophisticated and advanced analytical tools in order to accurately determine its concentration (e.g liquid chromatography coupled to tandemspectrometry [LC-MS/MS]).
The most relevant characteristics of these pharmaceuticalsand chemically complex structures with high diversity in shape, structure and molecular weight; ii) some of them are lipophilic and certain degree of hydrophilicity. This depends on their octanol/water partition coefficient (Log KOW) since those pharmaceuticals with Log
higher than 3 (e.g. diclofenac) tend to be attached to fat matrices and those with Log KOW lower than 3 (e.g. metoprolol) have tendency to be attached to sludge and suspended particles in water (Ejhed et al. 2012)
pharmaceuticals are polar molecules whose ionization level depends on the pH of the medium; iv) their persistence in the environment differs depending on the pharmaceutical. Some substances paracetamol) are degraded through the wastewater treatmentmeanwhile others (e.g. naproxen) can persist for more than one year
-Utrilla et al., 2013). Actually, those pharmaceuticals with Log Khigher than 3 have tendency to bioaccumulate (Ejhed et al. 2012
According to previous studies about the fate and transport of pharmaceuticals in the environment (Fig.1), pharmaceuticalsthe influent of WWTPs through the sewage system that excreted faeces and urine from households. Therefore, pharmaceuticals come into the aquatic environment through the discharges from WWTPs. Veterinary drugs pose also a considerably risk to contaminate soil and groundwater without previous treatment when liquid manure is utilized as top soil cover. Furthermore the sludge from WWTPs, which may contain pharmaceuticals, may be used agricultural land leading to a high risk for soil contamination as well as risk of run-off polluting both surface and groundwater resources (Santos et al. 2010).
Fate and transport of pharmaceuticals in the environment (adapted from Ternes, 1998).
LWR – EX – 2015:16
groups of pharmaceuticals that have been found in the water such as inflammatories,
anticoagulants, stimulants and antihypertensives among others (Rivera-n order to be effective at
against e.g. stomach acid and The fact that these substances are found in trace
requires the development of more sophisticated and ical tools in order to accurately determine its
coupled to tandem mass
pharmaceuticals are: i) large diversity in shape, structure
are lipophilic and others have . This depends on their octanol/water
) since those pharmaceuticals with Log tend to be attached to fat matrices
have tendency to (Ejhed et al. 2012) tion level depends
their persistence in the environment Some substances (e.g.
are degraded through the wastewater treatment process, sist for more than one year
hose pharmaceuticals with Log Kow (Ejhed et al. 2012).
he fate and transport of harmaceuticals end up into
through the sewage system that transport Therefore, most of the
pharmaceuticals come into the aquatic environment through the a considerably risk
to contaminate soil and groundwater without previous treatment when Furthermore the sludge from
WWTPs, which may contain pharmaceuticals, may be used as fertilizer in contamination as well as
off polluting both surface and groundwater resources (Santos
he environment

Oxidation of pharmaceuticals by chlorine dioxide in wastewater effluent
3
Luo et al. (2014) presents in his study a review of average influent and effluent concentrations of pharmaceuticals from different WWTPs around the world where the influent concentration of most of the pharmaceuticals is between 0.1 µg/L and 10 µg/L. The highest concentrations, above 10 µg/L, belong to nonsteroidal anti-inflammatory drugs (NSAIDs) such as diclofenac, ibuprofen and naproxen. For instance, concentration levels up to 603 µg/L of ibuprofen were detected in the influent of four WWTPs in Spain (Santos et al. 2010). These NSAIDs can be classified as one of the most relevant group of pharmaceuticals since daily load of these pharmaceuticals to the WWTPs is in the order of grams (Coelho et al. 2010). This is due to the fact that to their application level worldwide is very high, probably because they can be bought without medical prescription.
In Sweden, a large study performed by Stockholm Water, regarding pharmaceuticals in Stockholm´s water environment (Wahlberg et al., 2010) states that NSAIDs such as paracetamol, ibuprofen, naxopren and ketoprofen have the highest concentration in the incoming water of Henriksdal and Bromma wastewater treatment facilities. The highest concentration in incoming wastewater was reached by paracetamol with a value of 85 µg/L.
1.2. Pharmaceuticals and legislation Discharge of pharmaceuticals is not yet regulated and thus they do not have maximum discharge guidelines and standards. Even though increasing concentrations of pharmaceuticals are entering the environment every day, there is a gap in legislation regarding the environmental contamination produced by them (Luo et al. 2014; Bel et al., 2011; Oller et al. 2011; Santos et al.,2010). This gap in legislation may be due to the absence of consensus and good understanding of which substances should be regulated and to which level. Currently, the World Health Organization says that it is very unlikely that trace concentrations of pharmaceuticals found in drinking water are a risk for human health. This is because the margin of safety between detected concentrations in drinking water and those that can lead to toxic effects is quite substantial (WHO, 2012). However, this current gap in legislation could change if more data concerning long-term exposure is collected and if more knowledge about how a continuous exposure during several generations may affect a whole population is acquired. Besides, information related to the combined or simultaneous exposure to pharmaceuticals is not known yet (Santos et al., 2010).
Recently, the European Parliament has decided for the first time, to include three pharmaceuticals in a ‘watch list’ of priority substances (Directives 2000/60/EC and 2008/105/EC) in the field of EU Water Framework Directive (European Parliament, 2013). One of these three pharmaceuticals is diclofenac, a commonly-used generic painkiller that belongs to NSAIDs group and that has shown alterations of the kidney and gills of fishes. In some countries such as India, Nepal and Pakistan the manufacture and veterinary use of diclofenac is banned due to imminent extinction of local vultures. The other two substances are sex hormones 17 alpha-ethinylestradiol (EE2) and 17 beta-estradiol (E2), which are suspected to disrupt the endocrine system in humans and harm fish reproduction. By including these substances in the “watch list”, monitoring data will be gathered to establish appropriate measures to determine the risk posed by those substances (European Parliament, 2013). Nowadays, the Swedish government together with Swedish Association of Local Authorities has developed a National

Raquel Alcala Borao
Pharmaceutical Strategy that presents seven different action plans of which one of them focus on reducing the impact oenvironment (Lä
As there are no specific guidelines for maximum discharge of pharmaceuticals in the environment, the efficiency of WWTPs is usually given as percentage removal between inlet and outlet. However, taking into account possiblebe more interesting to focus on final concentrations at the effluent of WWTPs. One approach would consist on comparing Predicted No Effect Concentration (PNEC) with the environmental concentrations (EC) at the recipiecompare PNEC with EC and if the ratio EC/PNEC is below 1 then long-term negative effects would not be expected.
1.3. Removal of Current municipal as P and N as well as reducingsecondary and optional tertiary treatment processmeant yet to eliminate micropollutantsthe fate of micropollutants in the conventional systems removal efficiency.
1.3.1.
The main goal of primary treatment is to remove suspended solids from the water through aerated grit chamber followed by sedimentation tank. A study performed by Behera et al. (2011) shows that the maximum
removal efficiency estriol) meanwhile other pharmaceuticals such as ibuprofen and naproxen due to the fact that dissociated in water and not boundstudy performed by Hörsing et al. (2011) indicates that studied pharmaceuticalswater phase.
In secondary treatment, where substances are transformed by biological degradation through activated sludge and secondary sedimentation, NSAIDs(ibuprofen, ketoprofen75% (Salgado et al., 2012
The study for 44 different pharmaceuticals performed at Henriksdal how they we
Fig. 2.(adapted from Wahlberg et al.
LWR
4
Pharmaceutical Strategy that presents seven different action plans of which one of them focus on reducing the impact of medicines on the environment (Läkemedelsverket, 2014).
As there are no specific guidelines for maximum discharge of pharmaceuticals in the environment, the efficiency of WWTPs is usually given as percentage removal between inlet and outlet. However, taking into account possible-ecotoxicological effects in the ecosystem, it would be more interesting to focus on final concentrations at the effluent of WWTPs. One approach would consist on comparing Predicted No Effect Concentration (PNEC) with the environmental concentrations (EC) at the recipient. A dilution factor needs to be considered compare PNEC with EC and if the ratio EC/PNEC is below 1 then
term negative effects would not be expected.
Removal of pharmaceuticals in wastewater treatment plantsCurrent municipal WWTPs can control and eliminate paras P and N as well as reducing the organic load through primary, secondary and optional tertiary treatment process. However they are not meant yet to eliminate micropollutants. Therefore is important to follow
fate of micropollutants in the conventional systems removal efficiency.
Conventional treatments
The main goal of primary treatment is to remove suspended solids from the water through aerated grit chamber followed by sedimentation tank.
study performed by Behera et al. (2011) shows that the maximum
removal efficiency was generally quite low (~ 28% for diclofenac and estriol) meanwhile other pharmaceuticals such as ibuprofen and naproxen were not removed at all in this primary treatmentdue to the fact that most of the substances have moredissociated in water and not bounded to the sludge particlesstudy performed by Hörsing et al. (2011) indicates that studied pharmaceuticals presented a high affinity to bewater phase.
In secondary treatment, where substances are transformed by biological degradation through activated sludge and secondary sedimentation, NSAIDs diclofenac presented low removal (<25%) meanwhile other(ibuprofen, ketoprofen, acetaminphen) presented higher removal above 75% (Salgado et al., 2012; Falås et al., 2012).
The study carried out by Wahlberg et al. (2010) presents a mass balance for 44 different pharmaceuticals performed at Henriksdal how they were reduced during the different treatment stages
2. Mass flow for pharmaceuticals at Henriksdal´s WWT(adapted from Wahlberg et al., 2010).
LWR – EX – 2015:16
Pharmaceutical Strategy that presents seven different action plans of medicines on the
As there are no specific guidelines for maximum discharge of pharmaceuticals in the environment, the efficiency of WWTPs is usually given as percentage removal between inlet and outlet. However, taking
cal effects in the ecosystem, it would be more interesting to focus on final concentrations at the effluent of WWTPs. One approach would consist on comparing Predicted No Effect Concentration (PNEC) with the environmental concentrations
considered in order to compare PNEC with EC and if the ratio EC/PNEC is below 1 then
in wastewater treatment plants eliminate particles, nutrients
through primary, . However they are not
. Therefore is important to follow fate of micropollutants in the conventional systems to evaluate the
The main goal of primary treatment is to remove suspended solids from the water through aerated grit chamber followed by sedimentation tank.
study performed by Behera et al. (2011) shows that the maximum
28% for diclofenac and estriol) meanwhile other pharmaceuticals such as ibuprofen and
in this primary treatment. This can be have more affinity to be
particles. Actually a study performed by Hörsing et al. (2011) indicates that 61 of the 75
be dissociated in
In secondary treatment, where substances are transformed by biological degradation through activated sludge and secondary sedimentation, the
diclofenac presented low removal (<25%) meanwhile others ) presented higher removal above
al. (2010) presents a mass balance for 44 different pharmaceuticals performed at Henriksdal WWTP and
treatment stages (Fig 2).
Mass flow for pharmaceuticals at Henriksdal´s WWTP

Oxidation of pharmaceuticals by chlorine dioxide in waste
The average removal for the 44 pharmaceuticals was around 50%the highest removal took place in the biological degradation step. al. (2012) studied activated sludge plants with nitrogen removalsuch as ibuprofen and paracetamol 3). On the other hand, some pharmaceuticals such as metropolol or hydrochlorothiazideconcentration was3.). The reason of this effeexplanation is that during biological transformed back to parent compounds. In addition to this, some pharmaceuticals may be enclosed in faeces and thus released during biological compared to the influent (Luo et al., 2014).
Consequentlycompletely remove complete barrier for Utrilla et al.be totally removed after secondneed additional methods to be removed removal during the process
Some effectively removed by biodegradation alone are: i) the low concentration of these substances compared to other pollutants in wastewater be enough to active enzymes that are able to ii) some that can remainthey can inhibit growthquite improbable that they can microorganisms; iii) the degree of removal will depend on the chemical nature (structure and molecular weight)on the operational conditions of the WWTP 2008). needed to increase the removal of pharmaceuticals and decrease the potential impact of the WWTPs effluents in the environment
Fig. 3. plants with nitrogen removal. First number in parentheses indicates the number of facilities where removal was calculated and the second number indicates the were studied. (
Oxidation of pharmaceuticals by chlorine dioxide in wastewater effluent
5
average removal for the 44 pharmaceuticals was around 50%the highest removal took place in the biological degradation step. al. (2012) studied the average removal of some pharmaceuticals in activated sludge plants with nitrogen removal where some substances such as ibuprofen and paracetamol where removed by almost
On the other hand, some pharmaceuticals such as metropolol or ydrochlorothiazide had a negative removal what means tha
concentration was higher at the effluent compared to the The reason of this effect is not totally clear but one possible
explanation is that during biological treatment, these substances can be transformed back to parent compounds. In addition to this, some pharmaceuticals may be enclosed in faeces and thus released during biological treatment increasing the effluent concentration levels compared to the influent (Luo et al., 2014).
Consequently, it can be stated that conventional WWTPs are not able to completely remove pharmaceuticals and therefore they complete barrier for them (Vona et al., 2015; Luo et al. 2014;
et al., 2013). Actually only 25% of these persistent substances can be totally removed after secondary treatment, 50% of the substances need additional methods to be removed and 25% shows a negative removal during the process (Hörsing et al., 2014).
of the reasons that can explain why pharmaceuticals cannot be effectively removed by biodegradation alone are: i) the low concentration of these substances compared to other pollutants in wastewater be enough to active enzymes that are able to eliminate pharmaceuticals;
some pharmaceuticals have stable and complex chemical structurethat can remain for long time. Besides, many of them are bioactive so they can inhibit growth or metabolism of microorganism and therefore is quite improbable that they can be used as energy or carbon source for microorganisms; iii) the degree of removal will depend on the chemical
(structure and molecular weight) of the pharmaceutical operational conditions of the WWTP (Klavarioti et al., 2009
Thus more advanced and specific treatment techniques are needed to increase the removal of pharmaceuticals and decrease the potential impact of the WWTPs effluents in the environment
. Average removal and standard deviation in activated sludge plants with nitrogen removal. First number in parentheses indicates the number of facilities where removal was calculated and the second number indicates the total number of facilities that
studied. (Falås et al., 2012).
water effluent
average removal for the 44 pharmaceuticals was around 50% and the highest removal took place in the biological degradation step. Falås et
the average removal of some pharmaceuticals in some substances
emoved by almost 100% (Fig. On the other hand, some pharmaceuticals such as metropolol or
had a negative removal what means that the higher at the effluent compared to the influent (Fig
ct is not totally clear but one possible these substances can be
transformed back to parent compounds. In addition to this, some pharmaceuticals may be enclosed in faeces and thus released during
treatment increasing the effluent concentration levels
that conventional WWTPs are not able to and therefore they are not a
(Vona et al., 2015; Luo et al. 2014; Rivera-Actually only 25% of these persistent substances can
of the substances and 25% shows a negative
why pharmaceuticals cannot be effectively removed by biodegradation alone are: i) the low concentration of these substances compared to other pollutants in wastewater may not
pharmaceuticals; chemical structures
Besides, many of them are bioactive so m of microorganism and therefore is
as energy or carbon source for microorganisms; iii) the degree of removal will depend on the chemical
of the pharmaceutical as well as Klavarioti et al., 2009; Aga,
Thus more advanced and specific treatment techniques are needed to increase the removal of pharmaceuticals and decrease the potential impact of the WWTPs effluents in the environment.
Average removal and standard deviation in activated sludge
plants with nitrogen removal. First number in parentheses indicates the number of facilities where removal was calculated
total number of facilities that
Raquel Alcala Borao
1.3.2. Advanced
The three main options of additionalfor pharmaceuticaltreatment; ii) oxidation processes.
Improved biological removalincreasing the sludge retention time. the performoving bed biofilmcarriers moves freely inside the bioreactor and at the same time they provide sites for adsorption and growth microorganismsshows that moving bed biofilm carriers can enhance the capacity to remove some compounds such as diclofenac and ketoprofen compared to conventional activated sludge process. been tested for pharmaceuticals removal is membranthat combines activated sludge biological treatment and membrane filtration. et al., 2010treatment with MBR and it gavethough cost it seems that this is not a very efficient techniquehigh level of pharmaceuticals removal.
Physical removal is abthem. Membrane techniques such as microfiltration (MF), ultrafiltration (UF), nanofiltration (NF) and reverse osmosis membrane and high differential pressures to remove these substances. However water, pharmaceuticals are poorly removed because the pores of these membranes are higher than the molecular size of pharmaceuticals. the other hand, pharmaceuticals. A study performed by Yangalishows that RO membranes are able to achieveand 99%.membrane technique there are some important drawbackrelated to high elof the rejectconcentration of
Fig.
LWR
6
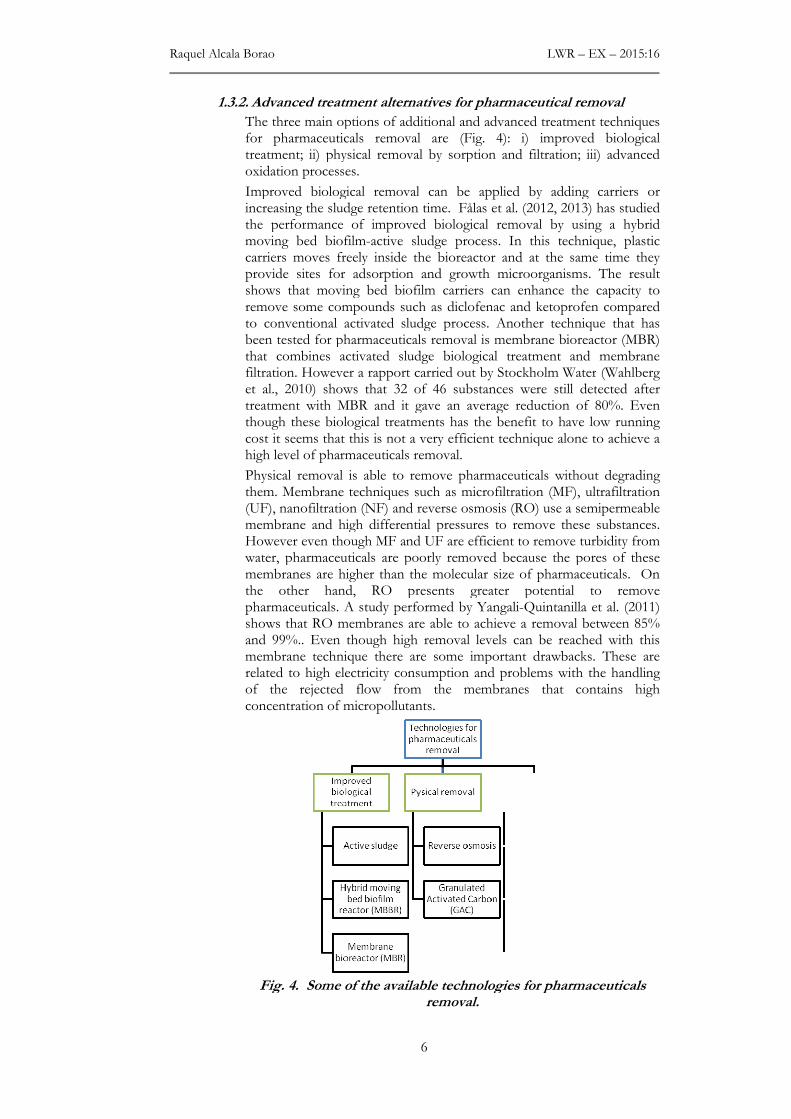
Advanced treatment alternatives for pharmaceutical removal
The three main options of additional and advanced treatmenfor pharmaceuticals removal are (Fig. 4): i) improved biotreatment; ii) physical removal by sorption and filtration; iii) advanced oxidation processes.
Improved biological removal can be applied by adding carriers or increasing the sludge retention time. Fålas et al. (2012, 2013)the performance of improved biological removal by usimoving bed biofilm-active sludge process. In this technique,carriers moves freely inside the bioreactor and at the same time they provide sites for adsorption and growth microorganismsshows that moving bed biofilm carriers can enhance the capacity to remove some compounds such as diclofenac and ketoprofen compared to conventional activated sludge process. Another technique that has been tested for pharmaceuticals removal is membrane bioreactor (MBR) that combines activated sludge biological treatment and membrane filtration. However a rapport carried out by Stockholm Wateret al., 2010) shows that 32 of 46 substances were still dettreatment with MBR and it gave an average reduction of 80%. Even though these biological treatments has the benefit to have low running cost it seems that this is not a very efficient technique alone
evel of pharmaceuticals removal.
Physical removal is able to remove pharmaceuticals without them. Membrane techniques such as microfiltration (MF), ultrafiltration (UF), nanofiltration (NF) and reverse osmosis (RO) use a semipermeable membrane and high differential pressures to remove these substances. However even though MF and UF are efficient to remove turbidity from water, pharmaceuticals are poorly removed because the pores of these membranes are higher than the molecular size of pharmaceuticals. the other hand, RO presents greater potential to remove
harmaceuticals. A study performed by Yangali-Quintanilla et al. (2011) shows that RO membranes are able to achieve a removal
%.. Even though high removal levels can be reached with this membrane technique there are some important drawbackrelated to high electricity consumption and problems with the handling of the rejected flow from the membranes that oncentration of micropollutants.
Fig. 4. Some of the available technologies for pharmaremoval.
LWR – EX – 2015:16
pharmaceutical removal
treatment techniques i) improved biological
physical removal by sorption and filtration; iii) advanced
by adding carriers or , 2013) has studied
using a hybrid technique, plastic
carriers moves freely inside the bioreactor and at the same time they provide sites for adsorption and growth microorganisms. The result shows that moving bed biofilm carriers can enhance the capacity to remove some compounds such as diclofenac and ketoprofen compared
Another technique that has e bioreactor (MBR)
that combines activated sludge biological treatment and membrane Water (Wahlberg
shows that 32 of 46 substances were still detected after an average reduction of 80%. Even has the benefit to have low running
alone to achieve a
without degrading them. Membrane techniques such as microfiltration (MF), ultrafiltration
RO) use a semipermeable membrane and high differential pressures to remove these substances.
even though MF and UF are efficient to remove turbidity from water, pharmaceuticals are poorly removed because the pores of these membranes are higher than the molecular size of pharmaceuticals. On
presents greater potential to remove Quintanilla et al. (2011) a removal between 85%
Even though high removal levels can be reached with this membrane technique there are some important drawbacks. These are
ectricity consumption and problems with the handling contains high
Some of the available technologies for pharmaceuticals

Oxidation of pharmaceuticals by chlorine dioxide in wastewater effluent
7
In order to solve the disadvantages presented by membrane technology, activated carbon adsorption is a technique that can be used to remove persistent/non-biodegradable organic compounds by adsorption processes in the activated carbon pores both with powdered activated carbon (PAC) and granular activated carbon (GAC). In general, efficient removal levels can be achieved with this technology, especially for substances with non-polar characteristics (KOW >2) (Luo et al., 2014). However its efficacy can be affected by the presence of natural organic matter (NOM) that can compete for binding sites, thus leading to blocked pores. One disadvantage for this technology is that large volumes of activated carbon are needed in order to achieve good removal and that there is no disinfecting effect.
To overcome the problems and limitations presented by physical and biological treatment methods, advance oxidation processes are considered. These technologies are based on redox reactions and on the intermediate action of hydroxyl and other radicals that are able to oxidize non-biodegradable substances to several by-products and in some cases to inert end-products (Klavarioti et al.,2008). Besides, chemical oxidants are advantageous because they have disinfecting effect in water. On the other hand, the main disadvantage for oxidation, regardless which oxidizing agent is used, is the formation of new ecotoxicological active compounds that can have undesirable biological effects. These compounds can be either transformation products and/or by-products. Transformation products are those substances that are partially degraded, although the complete mineralization to carbon dioxide and water is not achieved and they can also be substances that are larger than the parent substance after the treatment. These can be less or more toxic substances in comparison to the parent substance (Hörsing et al., 2014). By-products are new substances that are formed during oxidation for instance organo-halogen by-products such as trihalomethanes (THMs) and chlorophenols that are carcinogenic substances formed after treatment with chlorine (WHO, 2004).
The efficiency of these methods will depend on the characteristics of the wastewater (pH, DOC, alkalinity, inorganic substances) as well as how reactive the oxidant is for the target pollutants. The best treatment efficiencies are reached when these oxidation technologies are combined with other physicochemical and biological processes (Klavarioti et al.,2008). For example, if an effluent with biodegradable substances is treated then biological treatment followed by post-chemical oxidation would be the best option. Thus easily biodegradable compounds are first removed and competition for the chemical oxidant is avoided. On the other hand, it may be interesting to have a biological post-treatment after the chemical oxidation in order to remove by biological degradation those by-products that arise from the incomplete mineralization of pharmaceuticals.
There are several oxidizing agents that can be used for this chemical oxidation. A big emphasis has been set on ozone as a promising chemical oxidation technology to remove pharmaceuticals and other organic micropollutants as well as on chlorine dioxide (ClO2) which is a weaker oxidizing agent compared to ozone but easier to handle. Other advanced oxidation processes such as the combination of ozone with hydrogen peroxide or UV light, Fenton (Fe2+/H2O2) or combinations between them have not show results that justify its utilization due to the fact that they are more expensive and complicated to use than ozone or ClO2 alone (Hörsing et al., 2014)

Raquel Alcala Borao LWR – EX – 2015:16
8
2. AIM OF THE STUDY
Despite the fact that there are several advanced treatment technologies that can be utilized for pharmaceuticals removal, this study has the objective to investigate and evaluate the effectiveness of ClO2 as chemical oxidation technology in a tertiary step for the removal of pharmaceuticals in biologically treated wastewater effluent. A bench-scale test study was designed to be able to determine the optimal ClO2 dose-reaction time relationship based on the maximum level of selected environmentally relevant pharmaceuticals that is possible to remove with this oxidation treatment. Concentration of the oxidant remaining in solution after removal of the pharmaceuticals wants also be investigated and evaluated. Furthermore the possibility of ClO2 dosage control strategy for future upscaling wants to be studied by evaluating the relationship between ultraviolet absorption at 254nm and pharmaceuticals removal.
3. BACKGROUND
As the current investigation is focused on the application of ClO2 as oxidative agent to remove pharmaceuticals from biologically treated wastewater, some chemical aspects and previous studies with ClO2 are described.
3.1. Chemical aspects of chlorine dioxide ClO2 is an oxidant that has been widely used as disinfectant of high quality water such as groundwater, treated water and drinking water as well as for wastewater disinfection (Huber et al. 2005). ClO2 is a neutral compound of chlorine in the +IV oxidation state. When there are not oxidizable substances and in basic medium, it dissolves in water and discomposes into the formation of chlorite and chlorate:
2ClO2 + H2O → ClO2- + ClO3
- + 2H+ (Eq.1)
ClO2 is a relatively small, volatile, highly energetic molecule considered as a free radical. Another important physical property is its high solubility in water, especially in chilled water. Actually ClO2 is 10 times more soluble than chlorine (above 11 ºC) (EPA, 1999)
Concentrated ClO2 vapor is potentially explosive so it cannot be stored commercially as gas. Therefore it must be manufactured at the point of use. Dilute solutions of ClO2 must be kept in closed recipient in absence of light since ClO2 discomposes with sunlight. However an aqueous solution containing >8 g/l of ClO2 at temperature above 30 ºC is explosive (Hoigné and Bader, 1994). A common reaction to produce aqueous solution of ClO2 at the point of use is by mixing hydrochloric acid (HCl) and sodium chlorite (NaClO2):
5NaClO2 + 4HCl → 4ClO2 + 5NaCl + 2H2O (Eq. 2)
ClO2 is usually preferred to chlorine for disinfection of water. The first reason is because ClO2 does not produce halogen-substituted disinfection byproducts (DBPs) compounds (e.g. organochlorine and THMs) as chlorine does. This is because ClO2 reacts as an electron acceptor and H atoms in activated organic C-H or N-H structures are thus not substituted by Cl (Hoigné and Bader, 1994). Besides, chlorine reacts via both oxidation and electrophilic substitution meanwhile ClO2
reacts only by oxidation. Secondly, ClO2 is an efficient disinfectant in a broad range of pH between 5 and 10 and it is not affected by the presence of ammonia. Actually ClO2 is not consumed by ammonia so it is considered a virucide when ammonia is presented in water. Thirdly, ClO2 does not oxidize bromide. This means that bromide is not
Oxidation of pharmaceuticals by chlorine dioxide in wastewater effluent
9
transformed into hypobromite and consequently neither bromoform nor bromated are generated in the water solution (Hoigné and Bader, 1994). Fourthly ClO2 is more selective in water compared to chlorine and therefore lower disinfectant doses are needed (WHO, 2004).
Accordingly to the study of reaction kinetics of ClO2 in water performed by Hoigné and Bader (1994), ClO2 is a highly selective oxidant with several functional groups of organic substances such as phenolic compounds, tertiary/secondary amines as well as organosulfur groups. It is known that many pharmaceuticals have phenolic and/or amino functional groups in their structure therefore it is expected that ClO2 will oxidize rather high number of pharmaceuticals despite its lower oxidation potential compared to ozone (Huber et al., 2005).
3.2. By-products formation with ClO2 as oxidative agent Formation of DBPs is an issue of major concern due to the fact that these DBPs are potentially hazardous substances for health. When ClO2 is used as disinfectant, the major risk is posed on the formation of inorganic by-products including chlorite (ClO2
-) and chlorate (ClO3-)
(WHO, 2004). These are formed due to the reduction of ClO2 to chlorite when it reacts with organic matter. ClO3
- is formed in much lower concentration than ClO2
-; approximately 50%-70% and 30% of consumed ClO2 is transformed to ClO2
- and ClO3- respectively (EPA,
1999). These inorganic by-products can lead to hemolytic anemia at low levels of exposure and higher levels can result in an increase in methemoglobin. Additional studies have shown that chlorite can produce effects on the nervous systems in infants and young children (Veschetti et al., 2004). There are several post- treatment techniques that can remove chlorite and ClO2 residuals from treated water. However, these post-treatments are not valid for chlorate since once it is formed, it is stable in water and thus it cannot be removed. These post-treatment techniques are i) addition of reduced-sulfur compounds (e.g. sulfur dioxide and sodium sulfite); ii) Granular activated carbon (GAC) or powdered activated carbon (PAC); iii) adding reduced iron salts (e.g. ferrous chloride and ferrous sulfate) (EPA, 1999). However, the most convenient method is to use reduced iron salts since it has already been proved to be an effective method to remove chlorite with chloride as expected byproduct (Sorlini & Collivignarelli, 2005; Katz & Narkis, 2001). The reduction of iron salts to chloride is governed by the following equation:
4Fe2+ + ClO2- + 10H2O→4 Fe(OH)3(s) + Cl- + 8H+ (Eq. 3)
According to Sorlini & Collivignarelli (2005), complete removal of chlorite can be achieved with a stochometric dose of ferrous ion 3,31 mg Fe2+/mg ClO2
- (Katz & Narkis, 2001) at neutral pH (6.5-8.0). This reaction is kinetically fast with complete ClO2
- reduction applying reaction times of 5 – 15 seconds. It is also possible to remove ClO2 left in solution by the following ClO2/ Fe(aq)2+ reaction:
4H+ + ClO2 + 5Fe2+ → Cl- + 5Fe3+ + 2H2O (Eq. 4)
Therefore the theoretical Fe2+ for the complete reduction of 1mg ClO2 is 4.14 mg of Fe2+.
Formation of significant concentrations of organo-halogen and non-halogenated DBPs has not been extensively reported in previous studies. However, a study performed by Richardson et al. (2010) detected organic DPBs after the treatment of drinking water with ClO2. From all the 27 detected organic DPBs only two of them were chlorinated DPBs, meanwhile the others were non-halogenated DPBs (ketones, carboxylic
Raquel Alcala Borao LWR – EX – 2015:16
10
acids and maleic acids). Another study performed by Serrano et al. (2015) states that four brominated HAAs (haloacetic acids) were formed after disinfection of drinking water with ClO2 due mainly to the reaction of organic matter with bromide present in the water but any THMs were detected.
3.3. Previous studies with ClO2
There are several studies that show promising results using ClO2 to treat drinking water, surface water and wastewater.
Huber et al. (2005) studied the performance of ClO2 during the oxidation with pharmaceuticals in water treatment. The oxidation experiments were performed in “natural waters”, surface water and groundwater, where the samples were spiked with pharmaceuticals with concentrations up to 1µg L-1. Results for this study show that diclofenac, one of the pharmaceuticals that have been recently included in the “watch list” of the Water Framework Directive and that has a low removal level by conventional methods, was completely removed by oxidation with ClO2. According to this study, diclofenac was oxidized in surface water samples by more than 90% within 1 minute at the lowest tested concentration of 0.5 mg ClO2 L-1. Lee et al. (2010) studied the kinetics of different oxidants in wastewater samples from effluent of secondary treatment spiked with different pharmaceuticals. The consumption kinetics and decay pattern of ClO2 was similar to chlorine; they showed an initial phase with a rapid consumption of oxidant within the first 2 minutes and then a slow decrease over 60 minutes of reaction time. On the other hand, ozone was totally depleted in less than 2 minutes. Andersen (2010) studied the oxidation of ClO2 in wastewater effluent spiked with three steroid estrogens (E1, E2 and EE2) to a concentration of 0.4 µg L-1. This study demonstrates that the three tested steroid estrogens (E2 and EE2 belongs to the recent “watch list” of emerging pollutants) were removed within the first 30 seconds with 2.5 mg/L and
3.75 mg/L of ClO2 for low COD (~ 15 mg/L) and high COD (~ 40 mg/L) effluents respectively without leaving ClO2 residuals. This may be due to the fact that steroid substances contain phenolic groups to which ClO2 is a highly selective oxidant. Another study performed by Hey et al. (2012) examined the removal of 56 different pharmaceuticals spiked in biologically treated wastewater effluents after 18 hours of reaction. In the effluent with low COD (35 mg/L) more than a half of the studied pharmaceuticals were removed by more than 90%, meanwhile one third of the pharmaceuticals resisted degradation even at the higher tested ClO2 concentration (20 mg/L). This group of pharmaceuticals characterized by being less sensitive to be oxidized by ClO2 included β-blockers such as metropolol and bisoprolol which have a secondary amine functional group. The most easily oxidized pharmaceuticals (ClO2 concentration between 0.5mg/L and 1.25 mg/L) were diclofenac, hormones containing phenolic structures (estriol, estrone, ethinyl) and antibiotics like ciprofloxacin.
It can be said that most of the previous studies (Table 1) have mainly tested the disinfection effect of ClO2 in both drinking water and wastewater. During the last years, more research has been conducted in ClO2 as oxidant for pharmaceuticals but this has been focused on how (kinetics) and which pharmaceuticals can be removed according to different oxidant concentration as well as the formation of inorganic by products. None of them has however studied how to optimize this technique in order to upscale it and achieve the maximum removal of pharmaceuticals.

Oxidation of pharmaceuticals by chlorine dioxide in wastewater effluent
11
Table 1. Previous studies in ClO2 treatment.
Appl ication Size Reference
ClO2 k inet ics in drinking water Batch test Hoigné and Bader, 1994
Drinking water treatment Batch test Korn, 2002
Inorganic DBPs in wastewater Pilot plant Veschett i et al . 2004
Oxidat ion of pharmaceuticals in natural waters Batch test Huber et al. 2005
Organic DBPs in drinking water Ful l /pi lot scale
Richardson et al. 2010
Oxidat ion of micropol lutants in wastewater (k inet ic transformations)
Batch test Lee et al. 2010
Oxidat ion in spiked (steroid estrogens) wastewater
Batch test Andersen 2010
Oxidat ion pharmaceuticals in spiked wastewater Batch test Hey et al. 2012, 2013
Organic DBPs in drinking water Ful l scale Serrano et al. 2015
3.4. Motivation and possibilities for ClO2 treatment in WWTPs Even though chlorine and ClO2 approximately react with the same compounds (Huber et al. 2005), ClO2 is much preferred due to the toxicity of DBPs generated by the use of chlorine; actually more than 300 DBPs have been addressed due to disinfection with chlorine (Richardson et al., 2000). Besides ClO2 is more selective than chlorine in water and thus less doses are needed to have the same effect (WHO, 2004).
When comparing ClO2 and ozone, both chemical oxidants react with electron-rich groups of organic molecules such as phenolic- and aminogroups. However it has been seen that ozone reacts faster with the same reactive functional group (Huber et al. 2005, Hey, 2013). Regarding the formation of by-products and their toxicity, it is known that inorganic by-products are formed during the treatment with ClO2 (e.g chlorite). The formation of other significant disinfection byproducts such as organo-halogen and non-halogenated by-products is not very well known yet. In the case of ozonation, there is a risk for the formation of both organohalogen by-products (e.g bromoform with presence of bromide ion) and non-halogenated by-products (e.g aldehydes, ketoacids), as well as inorganic by-products (e.g bromated, iodate) (WHO, 2004).
Regarding the cost of these technologies, treatment with ozone has a large capital cost of 100-300 k€ for a medium size WWTP. This high cost may not be reasonable and profitable for smaller WWTPs although it could be acceptable for larger WWTPs. On the other hand, ClO2
generators are simpler and cheaper (its cost is around 10-30 k€) for both the preparation system and the reaction chamber (Andersen, 2010). However the cost of producing ClO2 can be the same or double compared to ozone depending on the chemicals that are used to produce the ClO2 solution and the scale of production. Therefore the best approach could be to use ClO2-treatment for upgrading small scale WWTPs (<2000 pe) since the capital cost for ClO2 technology is lower than for ozone and the running costs would not be so high considering treatment for limited period of time and lower scale of consumption.
Raquel Alcala Borao
Previous studies in optimization of this treatment focused on pharmaceuticals treatment for upscalingtest not only the influence pharmaceuticals removalfor the design of reactor (e.g continuous stirredallows calculaknown.
One additionalupscalingcomposition and inflow of control is important in order to avoid high cost and achieve good resource
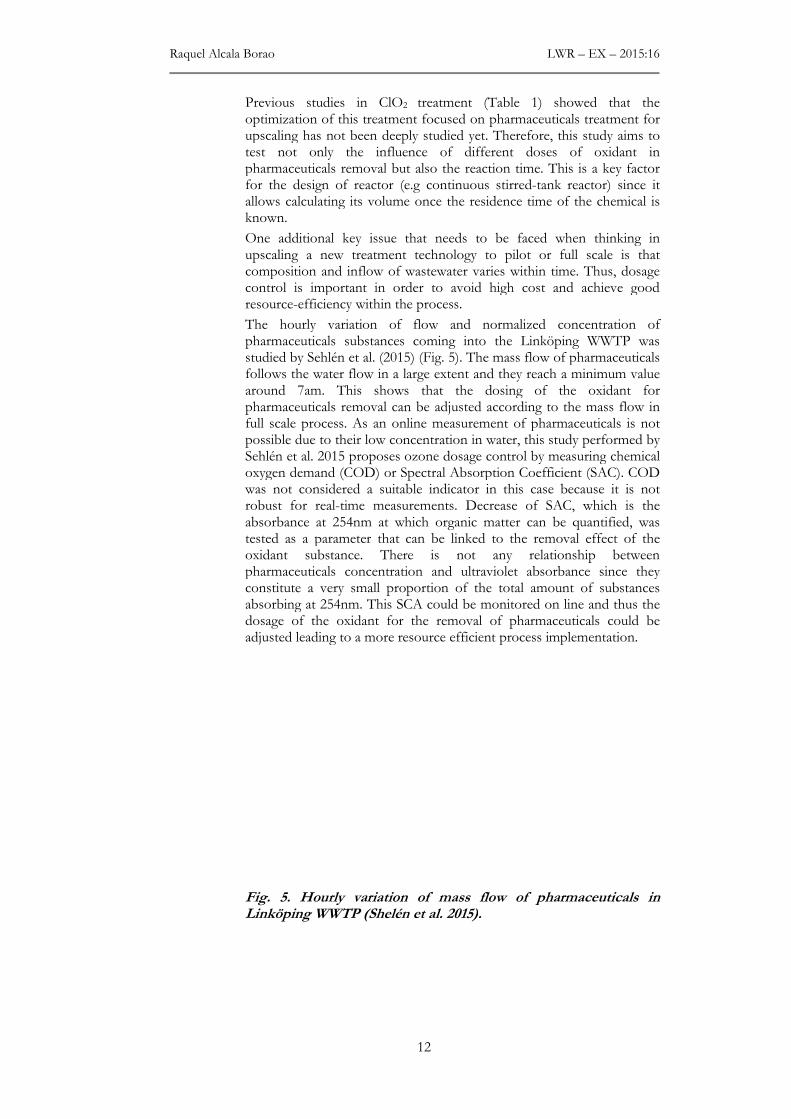
The hourlypharmaceuticalstudied by follows the water flow in a large extent and they reach a minimum value around 7am. This shows that the dosing of the oxidant for pharmaceuticals full scale processpossible due to their low concentration in water, tSehlén oxygen demandwas notrobust for realabsorbance tested as a parameteroxidant substance. pharmaceuticals concentration and ultraviolet absorbance since they constitute a very small absorbing at dosage of the oxidantadjusted leading to a more resource efficient process implementation.
Fig. 5Linköping WWTP (Shelén et al. 2015)
LWR
12
revious studies in ClO2 treatment (Table 1) showed thatoptimization of this treatment focused on pharmaceuticals treatment for upscaling has not been deeply studied yet. Therefore, this study aims to test not only the influence of different doses of oxidantpharmaceuticals removal but also the reaction time. This is
the design of reactor (e.g continuous stirred-tank reactor) since it allows calculating its volume once the residence time of the chemical is known.
One additional key issue that needs to be faced when thinkingupscaling a new treatment technology to pilot or full composition and inflow of wastewater varies within time. control is important in order to avoid high cost and achieve good resource-efficiency within the process.
hourly variation of flow and normalized concentration of pharmaceuticals substances coming into the Linköping WWTP studied by Sehlén et al. (2015) (Fig. 5). The mass flow of pharmaceuticals follows the water flow in a large extent and they reach a minimum value around 7am. This shows that the dosing of the oxidant for pharmaceuticals removal can be adjusted according to the mass flfull scale process. As an online measurement of pharmaceuticals is not possible due to their low concentration in water, this study performed by
et al. 2015 proposes ozone dosage control by measuringoxygen demand (COD) or Spectral Absorption Coefficient (SAC)was not considered a suitable indicator in this case because it is not robust for real-time measurements. Decrease of SAC,absorbance at 254nm at which organic matter can be quantified
as a parameter that can be linked to the removal effect of the oxidant substance. There is not any relationship between pharmaceuticals concentration and ultraviolet absorbance since they constitute a very small proportion of the total amount of substances absorbing at 254nm. This SCA could be monitored on line and thus the dosage of the oxidant for the removal of pharmaceuticals could be adjusted leading to a more resource efficient process implementation.
5. Hourly variation of mass flow of pharmaceuticals in Linköping WWTP (Shelén et al. 2015).
LWR – EX – 2015:16
showed that the optimization of this treatment focused on pharmaceuticals treatment for
his study aims to of oxidant in
. This is a key factor tank reactor) since it
ting its volume once the residence time of the chemical is
key issue that needs to be faced when thinking in technology to pilot or full scale is that
wastewater varies within time. Thus, dosage control is important in order to avoid high cost and achieve good
concentration of substances coming into the Linköping WWTP was
mass flow of pharmaceuticals follows the water flow in a large extent and they reach a minimum value around 7am. This shows that the dosing of the oxidant for
be adjusted according to the mass flow in online measurement of pharmaceuticals is not
his study performed by control by measuring chemical
sorption Coefficient (SAC). COD indicator in this case because it is not
ecrease of SAC, which is the at which organic matter can be quantified, was that can be linked to the removal effect of the
here is not any relationship between pharmaceuticals concentration and ultraviolet absorbance since they
proportion of the total amount of substances could be monitored on line and thus the
for the removal of pharmaceuticals could be adjusted leading to a more resource efficient process implementation.
of pharmaceuticals in
Oxidation of pharmaceuticals by chlorine dioxide in wastewater effluent
13
4. MATERIALS AND METHODS
This section aims to present the chemicals, analytical methods and experimental setup defined for the current study.
4.1. Chemicals ClO2 stock solution of 500mL (AquaCare®) was provided by Xinix AB and stored in an amber bottle glass at 4ºC. This product is currently used as a safe protection against pathogenic microorganisms (bacteria, viruses) in water. It can be also used for personal hygiene and disinfection of food. This solution was obtained from a reaction between 8,2%NaClO2 and 9,8%HCl to achieve a ClO2 concentration of approximately 1500ppm.
A stock solution of NasSO3 was synthesized by adding 10 g of NasSO3
(Sigma–Aldrich, Steinheim, Germany) to 100 mL of deionized water to get a concentration of 100g/L. This stock solution is used to quench the oxidation reaction.
4.2. Analytical methods
4.2.1. Chlorine dioxide analysis
The concentration of residual ClO2 is measured by standardized 100608 Spectroquant® ClO2 test that quantifies ClO2 concentration by reaction with DPD (N-diethyl-p-phenylenediamine) and later on using a WTW photolab 6600 UV-VIS spectrophotometer. This method allows measuring in a range of concentrations from 0.02 to 10 mg/L ClO2 in rectangular cells (10, 20 and 50mm).
4.2.2. Ultraviolet absorbance measurement
Ultraviolet absorbance at 254nm was measured in 10mm rectangular cells using WTW photolab 6600 UV-VIS spectrophotometer. This was done in order to be able to detect organic matter in water. Water samples were filtered through glass microfiber disc (Munktell®) before measuring in order to avoid colloidal solids scattering UV light.
4.2.3. Microtox test
Microtox tests were done using 90% Basic Text method which is designed for use with samples of low to medium toxicity (e.g. wastewater effluent) where the response of toxicity is measured as a change in luminescence of bacteria. Microtox Acute Reagent with bacteria was added to 9 different vials containing water and NaCl solution to achieve a final salinity of 2% and thus diluted in 9 different concentrations. Initial measurements with only bacteria were carried out in order to have toxicity blank values. Then, the sample was added to the vials resulting in 9 different sample concentrations. Finally, the measured light was correlated with the toxicity of the samples and data was generated for the calculation of EC50 values both after 5min and 15min.
4.2.4. Pharmaceuticals analysis
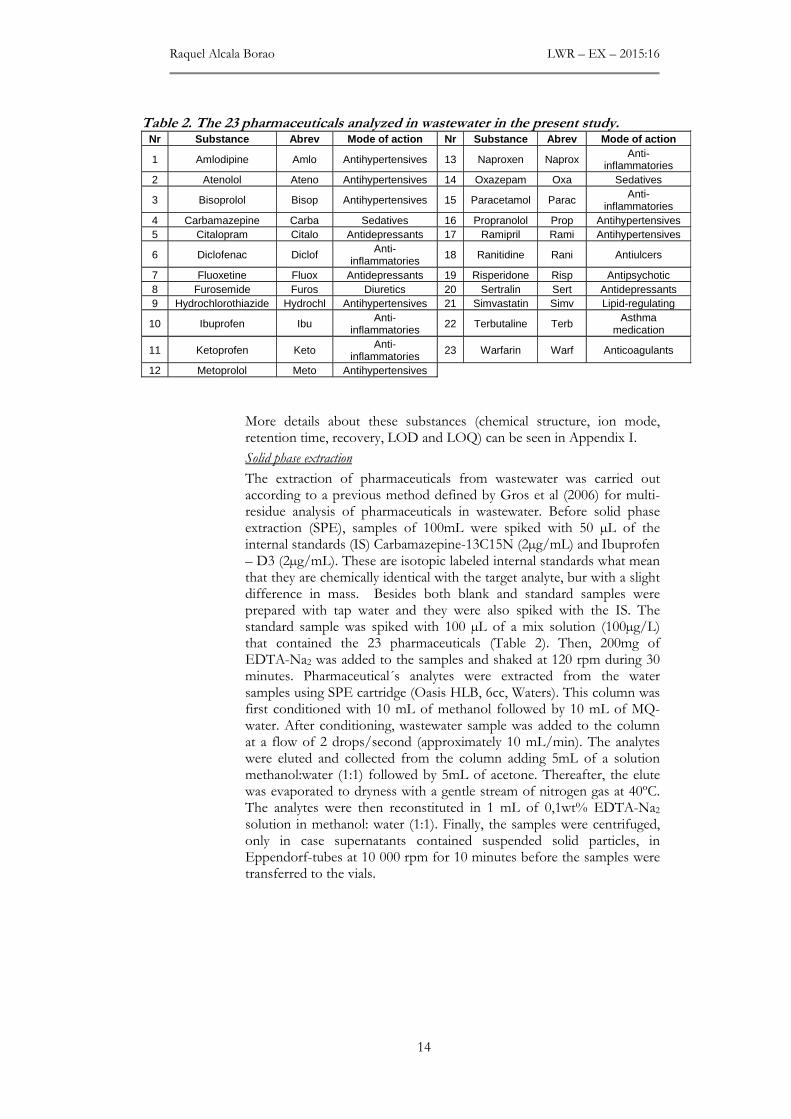
The concentration of pharmaceuticals in the wastewater samples was analyzed at IVL Swedish Environmental Institute according to a defined calibrated method that includes 23 different pharmaceuticals (Table 2). These pharmaceuticals have frequently been found wastewater effluents in Sweden and they cover a broad range of pharmaceuticals concerning different mode of actions (NSAIDs, antidepressants, antihypertensives, sedatives), different functional groups (phenol, tertiary and secondary amine, aniline, fluoro, keto, organosulfur) and different LogKOW values.
Raquel Alcala Borao LWR – EX – 2015:16
14
Table 2. The 23 pharmaceuticals analyzed in wastewater in the present study. Nr Substance Abrev Mode of action Nr Substance Abre v Mode of action
1 Amlodipine Amlo Antihypertensives 13 Naproxen Naprox Anti-inflammatories
2 Atenolol Ateno Antihypertensives 14 Oxazepam Oxa Sedatives
3 Bisoprolol Bisop Antihypertensives 15 Paracetamol Parac Anti-inflammatories
4 Carbamazepine Carba Sedatives 16 Propranolol Prop Antihypertensives 5 Citalopram Citalo Antidepressants 17 Ramipril Rami Antihypertensives
6 Diclofenac Diclof Anti-inflammatories
18 Ranitidine Rani Antiulcers
7 Fluoxetine Fluox Antidepressants 19 Risperidone Risp Antipsychotic 8 Furosemide Furos Diuretics 20 Sertralin Sert Antidepressants 9 Hydrochlorothiazide Hydrochl Antihypertensives 21 Simvastatin Simv Lipid-regulating
10 Ibuprofen Ibu Anti-inflammatories
22 Terbutaline Terb Asthma medication
11 Ketoprofen Keto Anti-inflammatories
23 Warfarin Warf Anticoagulants
12 Metoprolol Meto Antihypertensives
More details about these substances (chemical structure, ion mode, retention time, recovery, LOD and LOQ) can be seen in Appendix I.
Solid phase extraction
The extraction of pharmaceuticals from wastewater was carried out according to a previous method defined by Gros et al (2006) for multi-residue analysis of pharmaceuticals in wastewater. Before solid phase extraction (SPE), samples of 100mL were spiked with 50 µL of the internal standards (IS) Carbamazepine-13C15N (2µg/mL) and Ibuprofen – D3 (2µg/mL). These are isotopic labeled internal standards what mean that they are chemically identical with the target analyte, bur with a slight difference in mass. Besides both blank and standard samples were prepared with tap water and they were also spiked with the IS. The standard sample was spiked with 100 µL of a mix solution (100µg/L) that contained the 23 pharmaceuticals (Table 2). Then, 200mg of EDTA-Na2 was added to the samples and shaked at 120 rpm during 30 minutes. Pharmaceutical´s analytes were extracted from the water samples using SPE cartridge (Oasis HLB, 6cc, Waters). This column was first conditioned with 10 mL of methanol followed by 10 mL of MQ-water. After conditioning, wastewater sample was added to the column at a flow of 2 drops/second (approximately 10 mL/min). The analytes were eluted and collected from the column adding 5mL of a solution methanol:water (1:1) followed by 5mL of acetone. Thereafter, the elute was evaporated to dryness with a gentle stream of nitrogen gas at 40ºC. The analytes were then reconstituted in 1 mL of 0,1wt% EDTA-Na2 solution in methanol: water (1:1). Finally, the samples were centrifuged, only in case supernatants contained suspended solid particles, in Eppendorf-tubes at 10 000 rpm for 10 minutes before the samples were transferred to the vials.
Oxidation of pharmaceuticals by chlorine dioxide in wastewater effluent
15
High performance liquid chromatography- triple quadrupole mass spectrometry (HPLC-MS/MS)
Determination of the amount of pharmaceuticals in the wastewater samples was carried out on a high performance liquid chromatography- triple quadrupole mass spectrometry (HPLC-MS/MS). The first step was to insert the vials into a binary liquid chromatography (UFLC) system equipped with a C18 reversed phase-column with a dimension of 50 x 3 mm and a particle size of 2.5 µm (Xbridge, Waters Corporation Milford, USA) to perform the chromatographic separation. The process was run isothermically at a temperature of 35ºC and at flow rate of 0,3 mL/min. The mobile phase consisted of 10mM acetic acid in water (mobile phase A) and methanol (mobile phase B). At the beginning of the sample injection, the gradient started with 100% of mobile phase A and 0% of mobile phase B. Then the percentage of mobile phase B increased linearly to 95% for 11 minutes and kept 95% for 5 minutes. After that, mobile phase B was decreased till 0% during 1 minute and kept for 3 minutes before another sample was injected. The total time for one analysis was 20 minutes. This binary liquid chromatographer was then linked to atmospheric pressure ionization (API) 400 triple quadrupole (MS/MS) (Applied Biosystems, foster City, USA) with an electrospay ionization interface that worked in both positive and negative mode. By using both positive and negative mode for ionization the sensitivity increases for the analytes since they can be either positively or negatively charged. Two fragments were measured for each pharmaceutical and eight points for calibration corresponding to a concentration range between 0 and 500 ng/L were included.
Data analysis
Once the samples were analyzed by the HPLC/MS/MS, analyte peaks were quantified according to the retention time for each pharmaceutical (Appendix I). Analyst Software version 1.6, which is a platform that enables data processing for Mass Spectrometry Systems, was used in order to obtain the area under the peak for each analyte and its two fragments. Then, the concentration of pharmaceuticals in each sample was calculated by external calibration using the concentrations provided by the eight points of calibration. The calculated concentration was based on the recovery of the analyzed substances; this means that the concentration for each pharmaceutical was divided by a percentage of recovery that was calculated according to the amount of standard solution that had been recovered after the solid phase extraction.
In order to take into account limits in the analytical method concerning accuracy, precision and sensitivity to the analyzed substances, two different analytical limits have been calculated for each pharmaceutical (Appendix I). Limit of detection (LOD) is the lowest analyte concentration in a sample that can be reliably found. LOD has been calculated as:
LOD = 3x meanblank (Eq. 5)
The second analytical limit is LOQ or limit of quantification. It refers to the lowest concentration of analyte that can be quantified in a sample, while meeting some predefined goals for bias and imprecision. This analytical limit has been calculated as:
LOQ = 3,33xLOD (Eq.6)

Raquel Alcala Borao
4.3. Experimental setup
4.3.1. Wastewater effluent
Effluent wHammarby Sjöstadsverk R&D Henriksdal STPwastewatefacility is treated mechanically bby chemical prebiologically treated by an active sludge predenitriffollowed by a secondary precipitation with ferrous sulphate to act as flocculant before going through the sand filters which is the last treatment of the process.
20 L of wastewater were collected at one time inorder to have the same characteristics within the wastewater (pH, COD, N, etc.) and same concentration of pharmaceuticals during the performance of the batch tests.
Wastewater with a higher COD compared to the treated wastewater from Henriksdal deammonification process comprising two moving bed biofilm reactors at Hammarby Sjöstadsverk. This wastewater was filtered microfiber disc (Munktell
To characterize twere measured spectrophot14540 and WTW
Table 3
Eff luent Henriksdal
Inf luent deammonif icat ion
4.3.2. Methodology to
As mentioned before, one of the main goals of the study optimal pharmaceuticals as possible. this study can be summarized in 6 different steps
Fig. 6.
Step 1
Define factorial experiment
Step 6
Check %removal for each pharmaceutical with the optimum ClO2 dose-time
LWR
16
Experimental setup
Wastewater effluent
Effluent wastewater from Henriksdal WWTP was collected Hammarby Sjöstadsverk R&D facility to perform the
nriksdal STP is one of the largest WWTPs in Sweden and it treats wastewater from approximately 720 000 people. Wastewater in this facility is treated mechanically by screening and grit chambers, followed by chemical pre-precipitation with ferrous sulphate. Then, wastewater is biologically treated by an active sludge predenitrification process followed by a secondary precipitation with ferrous sulphate to act as flocculant before going through the sand filters which is the last treatment of the process.
of wastewater were collected at one time in 1 L plastic bottles in r to have the same characteristics within the wastewater (pH, COD,
N, etc.) and same concentration of pharmaceuticals during the performance of the batch tests.
Wastewater with a higher COD compared to the treated wastewater from Henriksdal was collected at the influent of the pilotdeammonification process comprising two moving bed biofilm reactors at Hammarby Sjöstadsverk. This wastewater was filtered microfiber disc (Munktell®) before measuring its characteristics.
To characterize the wastewater, pH, COD and total nitrogenmeasured spectrophotometrically by standardized test kits WTWand WTW 14537 respectively.
3. Characteristics of analyzed wastewater.
pH COD (mg/L) N-tot (mg/L)
Eff luent Henriksdal 7.0 21 8.8
Inf luent deammonif icat ion 7.7 60 46
Methodology to find optimal ClO2 dose- reaction time
As mentioned before, one of the main goals of the study optimal ClO2 dose/reaction time in order to achieve as high removal of pharmaceuticals as possible. The methodology that has beethis study can be summarized in 6 different steps (Fig. 6).
Methodology to find optimal ClO2 dose – reaction
Define factorial experiment
Step 2
Oxidation experiments with
ClO2 and wastewater
Step 5
Combine and find the best common optimum for all pharmaceuticals
Check %removal for each pharmaceutical with the optimum
time
LWR – EX – 2015:16
was collected at the to perform the experiments.
in Sweden and it treats r from approximately 720 000 people. Wastewater in this
y screening and grit chambers, followed Then, wastewater is
ication process followed by a secondary precipitation with ferrous sulphate to act as flocculant before going through the sand filters which is the last
plastic bottles in r to have the same characteristics within the wastewater (pH, COD,
N, etc.) and same concentration of pharmaceuticals during the
Wastewater with a higher COD compared to the treated wastewater f the pilot-scale
deammonification process comprising two moving bed biofilm reactors at Hammarby Sjöstadsverk. This wastewater was filtered through glass
before measuring its characteristics.
nitrogen (Table 3) metrically by standardized test kits WTW
tot (mg/L)
reaction time
As mentioned before, one of the main goals of the study was to find the dose/reaction time in order to achieve as high removal of
The methodology that has been followed in
reaction.
Step 3
SPE and analysis of pharmaceuticals with
LC/MS/MS
Step 4
Find optimal ClO2 dose - reaction time
for each pharmaceuticals
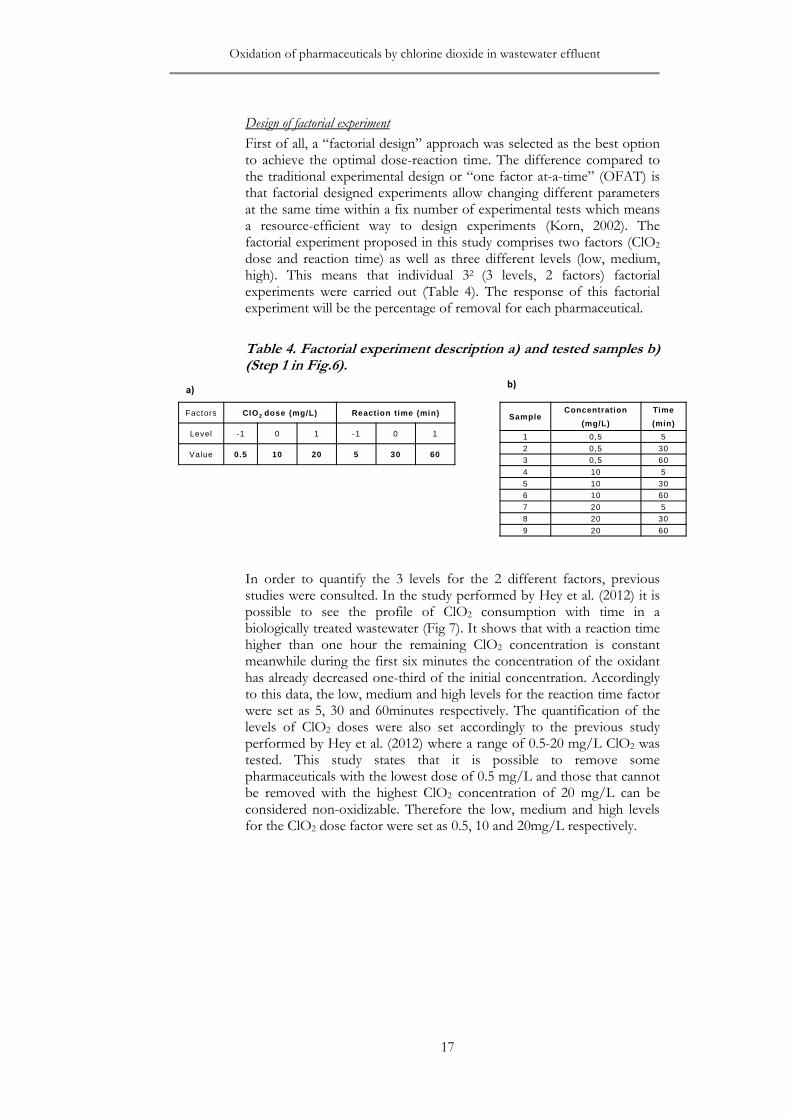
Oxidation of pharmaceuticals by chlorine dioxide in wastewater effluent
17
Design of factorial experiment
First of all, a “factorial design” approach was selected as the best option to achieve the optimal dose-reaction time. The difference compared to the traditional experimental design or “one factor at-a-time” (OFAT) is that factorial designed experiments allow changing different parameters at the same time within a fix number of experimental tests which means a resource-efficient way to design experiments (Korn, 2002). The factorial experiment proposed in this study comprises two factors (ClO2 dose and reaction time) as well as three different levels (low, medium, high). This means that individual 32 (3 levels, 2 factors) factorial experiments were carried out (Table 4). The response of this factorial experiment will be the percentage of removal for each pharmaceutical.
Table 4. Factorial experiment description a) and tested samples b) (Step 1 in Fig.6).
In order to quantify the 3 levels for the 2 different factors, previous studies were consulted. In the study performed by Hey et al. (2012) it is possible to see the profile of ClO2 consumption with time in a biologically treated wastewater (Fig 7). It shows that with a reaction time higher than one hour the remaining ClO2 concentration is constant meanwhile during the first six minutes the concentration of the oxidant has already decreased one-third of the initial concentration. Accordingly to this data, the low, medium and high levels for the reaction time factor were set as 5, 30 and 60minutes respectively. The quantification of the levels of ClO2 doses were also set accordingly to the previous study performed by Hey et al. (2012) where a range of 0.5-20 mg/L ClO2 was tested. This study states that it is possible to remove some pharmaceuticals with the lowest dose of 0.5 mg/L and those that cannot be removed with the highest ClO2 concentration of 20 mg/L can be considered non-oxidizable. Therefore the low, medium and high levels for the ClO2 dose factor were set as 0.5, 10 and 20mg/L respectively.
Factors ClO 2 dose (mg/L) Reaction t ime (min)
Level -1 0 1 -1 0 1
Value 0.5 10 20 5 30 60
SampleConcentration
(mg/L)
Time
(min)
1 0,5 5
2 0,5 30
3 0,5 60
4 10 5
5 10 30
6 10 60
7 20 5
8 20 30
9 20 60
a)b)
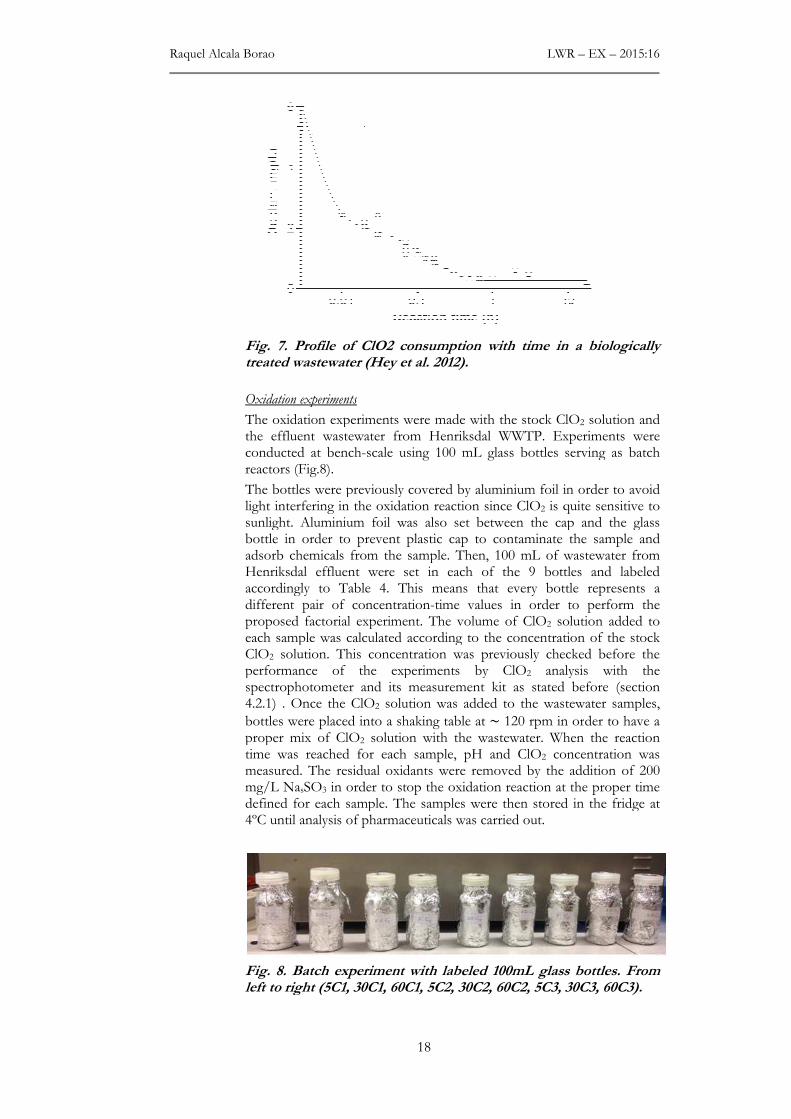
Raquel Alcala Borao
Fig. 7.treated wast
Oxidation experiments
The oxidation experiments the effluent wastewater from Henriksdal WWTP. conducted at benchreactors
The bottles were previously covered light interfering in the oxidation reaction since sunlight. Aluminium foil was also set between the cap and the glass bottle in order to prevent adsorb chemicals from the sample. Henriksdal effluent were set in each of the 9 bottles and labeled accordingly different pair oproposed factorial experiment. The volume of each sample was calculated according to the concentration of the ClO2 solution. This concentration was previously checked before tperformance of the experiments by spectrophotometer and its measurement kit4.2.1) . Once the
bottles proper mixtime wasmeasured. The residual oxidants mg/L Nadefined for each sample. The samples 4ºC until analysis of pharmaceuticals
Fig. 8.left to rig
LWR
18
. Profile of ClO2 consumption with time in a biologically treated wastewater (Hey et al. 2012).
Oxidation experiments
oxidation experiments were made with the stock ClOthe effluent wastewater from Henriksdal WWTP. Experiments were conducted at bench-scale using 100 mL glass bottles serving as batch
rs (Fig.8).
The bottles were previously covered by aluminium foil in order to avoid light interfering in the oxidation reaction since ClO2 is quite sensitive to sunlight. Aluminium foil was also set between the cap and the glass bottle in order to prevent plastic cap to contaminate the sample and adsorb chemicals from the sample. Then, 100 mL of wastewater from Henriksdal effluent were set in each of the 9 bottles and labeled accordingly to Table 4. This means that every bottle represents a different pair of concentration-time values in order to perform the proposed factorial experiment. The volume of ClO2 solution added to each sample was calculated according to the concentration of the
solution. This concentration was previously checked before tperformance of the experiments by ClO2 analysis with the spectrophotometer and its measurement kit as stated before
. Once the ClO2 solution was added to the wastewater samples,
were placed into a shaking table at ~ 120 rpm in orproper mix of ClO2 solution with the wastewater. When the reaction
was reached for each sample, pH and ClO2 concentration measured. The residual oxidants were removed by the addition of 200 mg/L NasSO3 in order to stop the oxidation reaction at the proper time defined for each sample. The samples were then stored in the fridge at 4ºC until analysis of pharmaceuticals was carried out.
. Batch experiment with labeled 100mL glass bottles. From left to right (5C1, 30C1, 60C1, 5C2, 30C2, 60C2, 5C3, 30C3, 60C3)
LWR – EX – 2015:16
Profile of ClO2 consumption with time in a biologically
ClO2 solution and Experiments were
ttles serving as batch
by aluminium foil in order to avoid is quite sensitive to
sunlight. Aluminium foil was also set between the cap and the glass plastic cap to contaminate the sample and
mL of wastewater from Henriksdal effluent were set in each of the 9 bottles and labeled
means that every bottle represents a time values in order to perform the
solution added to each sample was calculated according to the concentration of the stock
solution. This concentration was previously checked before the analysis with the
before (section added to the wastewater samples,
120 rpm in order to have a When the reaction concentration was
removed by the addition of 200 at the proper time
stored in the fridge at
Batch experiment with labeled 100mL glass bottles. From
ht (5C1, 30C1, 60C1, 5C2, 30C2, 60C2, 5C3, 30C3, 60C3).
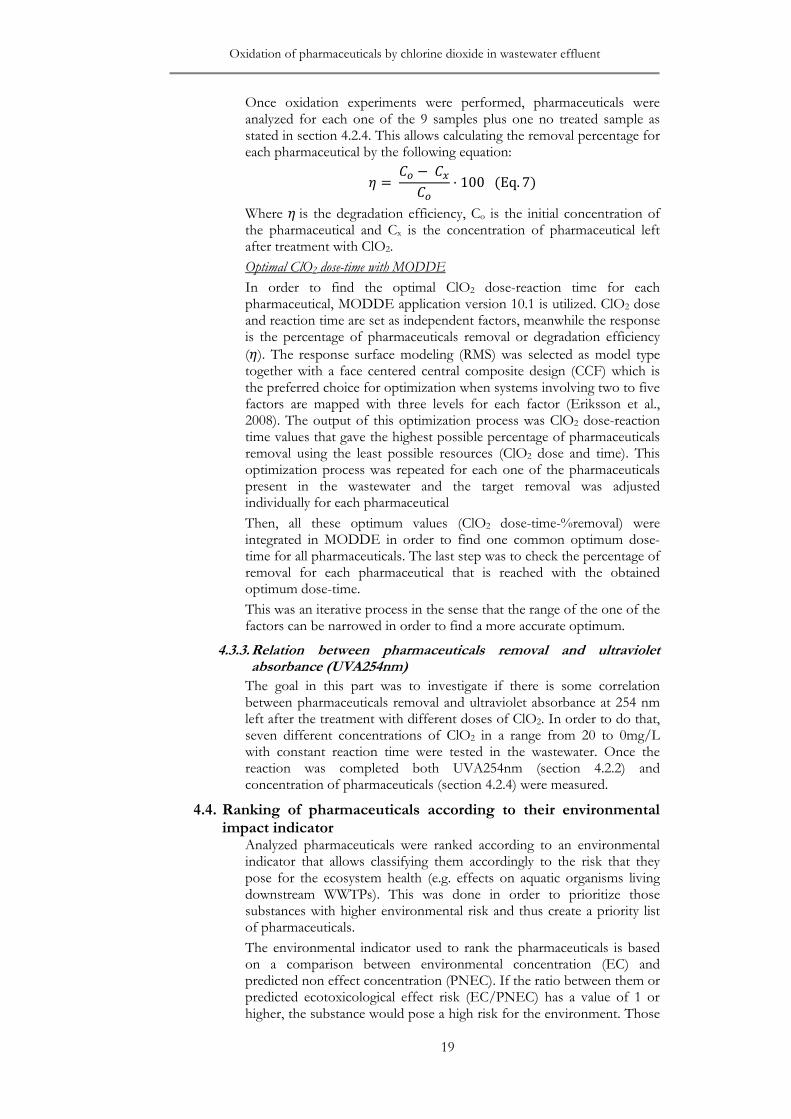
Oxidation of pharmaceuticals by chlorine dioxide in wastewater effluent
19
Once oxidation experiments were performed, pharmaceuticals were analyzed for each one of the 9 samples plus one no treated sample as stated in section 4.2.4. This allows calculating the removal percentage for each pharmaceutical by the following equation:
� = �� − �
��
· 100 (Eq. 7)
Where � is the degradation efficiency, Co is the initial concentration of the pharmaceutical and Cx is the concentration of pharmaceutical left after treatment with ClO2.
Optimal ClO2 dose-time with MODDE
In order to find the optimal ClO2 dose-reaction time for each pharmaceutical, MODDE application version 10.1 is utilized. ClO2 dose and reaction time are set as independent factors, meanwhile the response is the percentage of pharmaceuticals removal or degradation efficiency
(�). The response surface modeling (RMS) was selected as model type together with a face centered central composite design (CCF) which is the preferred choice for optimization when systems involving two to five factors are mapped with three levels for each factor (Eriksson et al., 2008). The output of this optimization process was ClO2 dose-reaction time values that gave the highest possible percentage of pharmaceuticals removal using the least possible resources (ClO2 dose and time). This optimization process was repeated for each one of the pharmaceuticals present in the wastewater and the target removal was adjusted individually for each pharmaceutical
Then, all these optimum values (ClO2 dose-time-%removal) were integrated in MODDE in order to find one common optimum dose-time for all pharmaceuticals. The last step was to check the percentage of removal for each pharmaceutical that is reached with the obtained optimum dose-time.
This was an iterative process in the sense that the range of the one of the factors can be narrowed in order to find a more accurate optimum.
4.3.3. Relation between pharmaceuticals removal and ultraviolet absorbance (UVA254nm)
The goal in this part was to investigate if there is some correlation between pharmaceuticals removal and ultraviolet absorbance at 254 nm left after the treatment with different doses of ClO2. In order to do that, seven different concentrations of ClO2 in a range from 20 to 0mg/L with constant reaction time were tested in the wastewater. Once the reaction was completed both UVA254nm (section 4.2.2) and concentration of pharmaceuticals (section 4.2.4) were measured.
4.4. Ranking of pharmaceuticals according to their environmental impact indicator
Analyzed pharmaceuticals were ranked according to an environmental indicator that allows classifying them accordingly to the risk that they pose for the ecosystem health (e.g. effects on aquatic organisms living downstream WWTPs). This was done in order to prioritize those substances with higher environmental risk and thus create a priority list of pharmaceuticals.
The environmental indicator used to rank the pharmaceuticals is based on a comparison between environmental concentration (EC) and predicted non effect concentration (PNEC). If the ratio between them or predicted ecotoxicological effect risk (EC/PNEC) has a value of 1 or higher, the substance would pose a high risk for the environment. Those
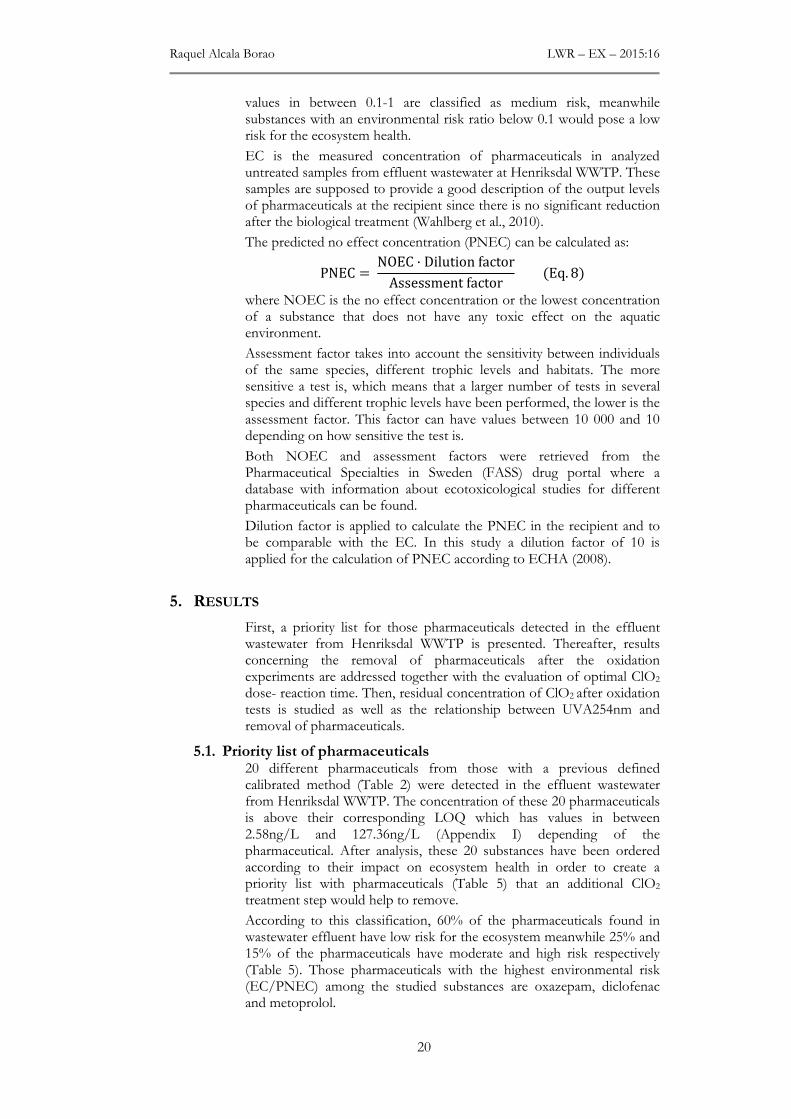
Raquel Alcala Borao LWR – EX – 2015:16
20
values in between 0.1-1 are classified as medium risk, meanwhile substances with an environmental risk ratio below 0.1 would pose a low risk for the ecosystem health.
EC is the measured concentration of pharmaceuticals in analyzed untreated samples from effluent wastewater at Henriksdal WWTP. These samples are supposed to provide a good description of the output levels of pharmaceuticals at the recipient since there is no significant reduction after the biological treatment (Wahlberg et al., 2010).
The predicted no effect concentration (PNEC) can be calculated as:
PNEC = NOEC · Dilution factor
Assessment factor (Eq. 8)
where NOEC is the no effect concentration or the lowest concentration of a substance that does not have any toxic effect on the aquatic environment.
Assessment factor takes into account the sensitivity between individuals of the same species, different trophic levels and habitats. The more sensitive a test is, which means that a larger number of tests in several species and different trophic levels have been performed, the lower is the assessment factor. This factor can have values between 10 000 and 10 depending on how sensitive the test is.
Both NOEC and assessment factors were retrieved from the Pharmaceutical Specialties in Sweden (FASS) drug portal where a database with information about ecotoxicological studies for different pharmaceuticals can be found.
Dilution factor is applied to calculate the PNEC in the recipient and to be comparable with the EC. In this study a dilution factor of 10 is applied for the calculation of PNEC according to ECHA (2008).
5. RESULTS
First, a priority list for those pharmaceuticals detected in the effluent wastewater from Henriksdal WWTP is presented. Thereafter, results concerning the removal of pharmaceuticals after the oxidation experiments are addressed together with the evaluation of optimal ClO2
dose- reaction time. Then, residual concentration of ClO2 after oxidation tests is studied as well as the relationship between UVA254nm and removal of pharmaceuticals.
5.1. Priority list of pharmaceuticals 20 different pharmaceuticals from those with a previous defined calibrated method (Table 2) were detected in the effluent wastewater from Henriksdal WWTP. The concentration of these 20 pharmaceuticals is above their corresponding LOQ which has values in between 2.58ng/L and 127.36ng/L (Appendix I) depending of the pharmaceutical. After analysis, these 20 substances have been ordered according to their impact on ecosystem health in order to create a priority list with pharmaceuticals (Table 5) that an additional ClO2
treatment step would help to remove.
According to this classification, 60% of the pharmaceuticals found in wastewater effluent have low risk for the ecosystem meanwhile 25% and 15% of the pharmaceuticals have moderate and high risk respectively (Table 5). Those pharmaceuticals with the highest environmental risk (EC/PNEC) among the studied substances are oxazepam, diclofenac and metoprolol.
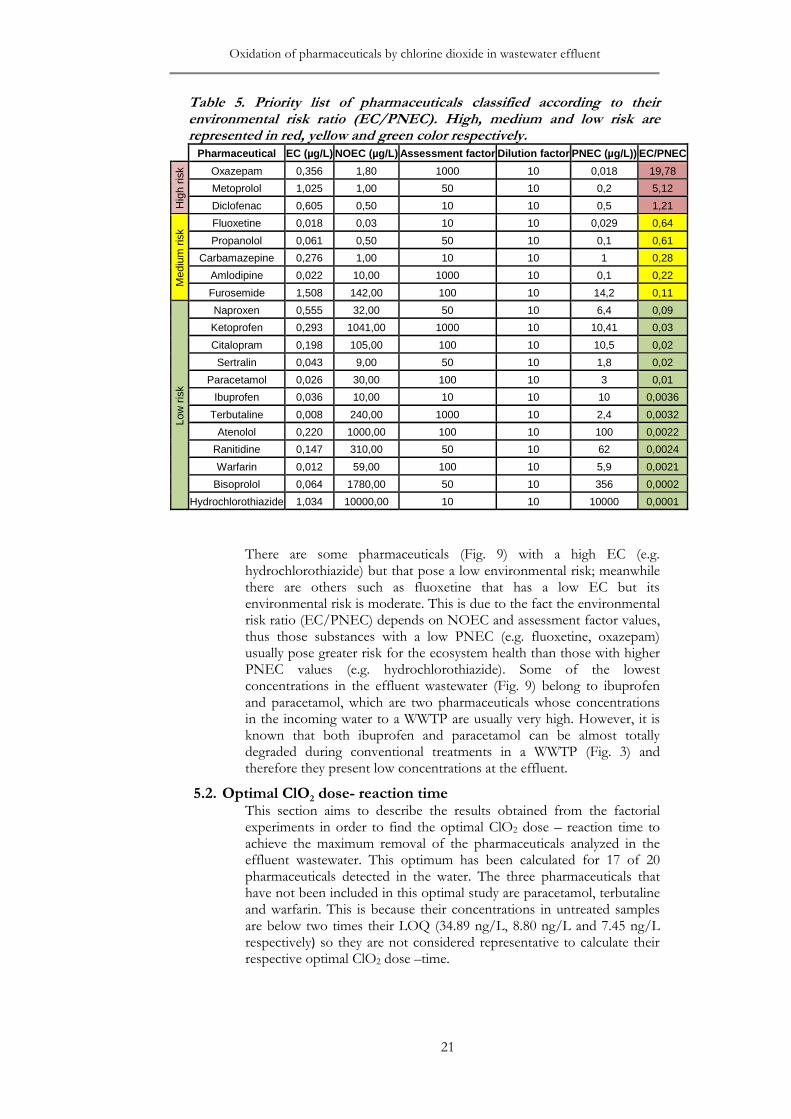
Oxidation of pharmaceuticals by chlorine dioxide in wastewater effluent
21
Table 5. Priority list of pharmaceuticals classified according to their environmental risk ratio (EC/PNEC). High, medium and low risk are represented in red, yellow and green color respectively.
Pharmaceutical EC (µg/L) NOEC (µg/L) Assessment factor Dilution factor PNEC (µg/L)) EC/PNEC
Hig
h ris
k Oxazepam 0,356 1,80 1000 10 0,018 19,78
Metoprolol 1,025 1,00 50 10 0,2 5,12
Diclofenac 0,605 0,50 10 10 0,5 1,21
Med
ium
ris
k
Fluoxetine 0,018 0,03 10 10 0,029 0,64
Propanolol 0,061 0,50 50 10 0,1 0,61
Carbamazepine 0,276 1,00 10 10 1 0,28
Amlodipine 0,022 10,00 1000 10 0,1 0,22
Furosemide 1,508 142,00 100 10 14,2 0,11
Low
ris
k
Naproxen 0,555 32,00 50 10 6,4 0,09
Ketoprofen 0,293 1041,00 1000 10 10,41 0,03
Citalopram 0,198 105,00 100 10 10,5 0,02
Sertralin 0,043 9,00 50 10 1,8 0,02
Paracetamol 0,026 30,00 100 10 3 0,01
Ibuprofen 0,036 10,00 10 10 10 0,0036
Terbutaline 0,008 240,00 1000 10 2,4 0,0032
Atenolol 0,220 1000,00 100 10 100 0,0022
Ranitidine 0,147 310,00 50 10 62 0,0024
Warfarin 0,012 59,00 100 10 5,9 0,0021
Bisoprolol 0,064 1780,00 50 10 356 0,0002
Hydrochlorothiazide 1,034 10000,00 10 10 10000 0,0001
There are some pharmaceuticals (Fig. 9) with a high EC (e.g. hydrochlorothiazide) but that pose a low environmental risk; meanwhile there are others such as fluoxetine that has a low EC but its environmental risk is moderate. This is due to the fact the environmental risk ratio (EC/PNEC) depends on NOEC and assessment factor values, thus those substances with a low PNEC (e.g. fluoxetine, oxazepam) usually pose greater risk for the ecosystem health than those with higher PNEC values (e.g. hydrochlorothiazide). Some of the lowest concentrations in the effluent wastewater (Fig. 9) belong to ibuprofen and paracetamol, which are two pharmaceuticals whose concentrations in the incoming water to a WWTP are usually very high. However, it is known that both ibuprofen and paracetamol can be almost totally degraded during conventional treatments in a WWTP (Fig. 3) and therefore they present low concentrations at the effluent.
5.2. Optimal ClO2 dose- reaction time This section aims to describe the results obtained from the factorial experiments in order to find the optimal ClO2 dose – reaction time to achieve the maximum removal of the pharmaceuticals analyzed in the effluent wastewater. This optimum has been calculated for 17 of 20 pharmaceuticals detected in the water. The three pharmaceuticals that have not been included in this optimal study are paracetamol, terbutaline and warfarin. This is because their concentrations in untreated samples are below two times their LOQ (34.89 ng/L, 8.80 ng/L and 7.45 ng/L respectively) so they are not considered representative to calculate their respective optimal ClO2 dose –time.

Raquel Alcala Borao LWR – EX – 2015:16
22
Fig. 9. Pharmaceuticals analyzed at the effluent of Henriksdal WWTP and classification according to their impact in ecosystem health; high, medium and low risk are represented in red, yellow and green colors respectively. Average and standard deviation calculated with 5 samples.
5.2.1. First factorial experiment
This section presents the results from the first factorial experiment where three different ClO2 doses and reaction times (Table 4) were tested.
Optimal dose-time for each pharmaceutical
Once the oxidation experiments were carried out and removal percentages calculated for each sample and pharmaceutical (Appendix II-Table 1), optimal ClO2 dose-reaction times were calculated with MODDE for each of the analyzed substances. The 3D scatter plot (Fig. 10) shows that optimal dose – time - removal is strongly dependent on the type of pharmaceutical; those substances located at the top of the diagram can almost be totally removed (>90%) with their respective optimal ClO2 dose –time, meanwhile those located at the bottom of the diagram have poor removal with ClO2 (e.g. carbamazepine, ketoprofen, oxazepam). Focusing on those pharmaceuticals that pose a relevant environmental risk for the ecosystem health, only oxazepam with high environmental risk and carbamazepine with moderate risk are not possible to be completely oxidized with 30% and 10% of removal respectively (Appendix III).
High risk (EC/PNEC > 1) Medium risk (0,1 < EC/PNEC < 1) Low risk (EC/PNEC <0,1)
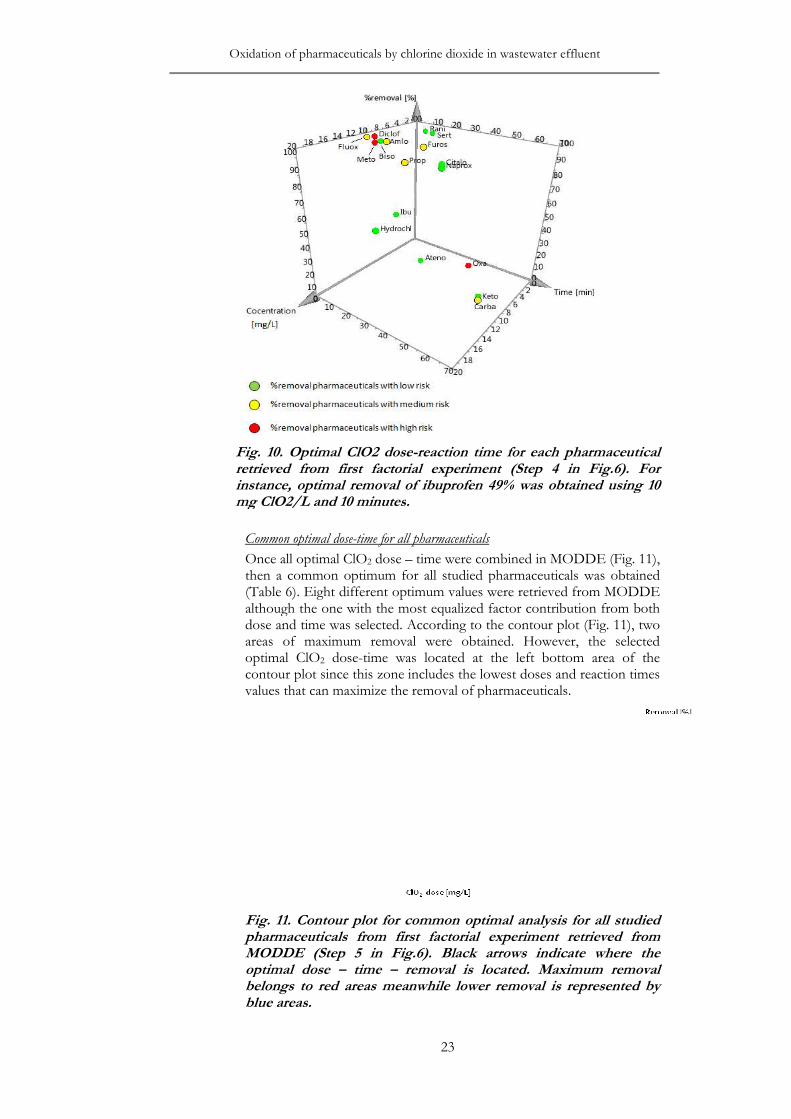
Oxidation of pharmaceuticals by chlorine dioxide in waste
Fig. 10. retrieved from first factorial experiment (Step 4 in Fig.6). For instance, optimal removal of ibuprofen 49% was obtmg ClO2/L and 10 minutes
Common optimal dose
Once all then a common optimum for all (Table 6although the one with the most equalized factor contribution from both dose and timeareas of maximum remooptimal ClOcontour plot values that can maximize the removal of pharmaceuticals.
Fig. 11pharmaceuticals from first factorial experiment retrieved from MODDE (Step 5 in Fig.6). Black arrows indicate where the optimal dose belongs to red blue areas
Oxidation of pharmaceuticals by chlorine dioxide in wastewater effluent
23
Optimal ClO2 dose-reaction time for each pharmaceutical retrieved from first factorial experiment (Step 4 in Fig.6). For instance, optimal removal of ibuprofen 49% was obtained using 10 mg ClO2/L and 10 minutes.
Common optimal dose-time for all pharmaceuticals
all optimal ClO2 dose – time were combined in MODDE (a common optimum for all studied pharmaceuticals
(Table 6). Eight different optimum values were retrieved from MODDEalthough the one with the most equalized factor contribution from both dose and time was selected. According to the contour plot (areas of maximum removal were obtained. However, optimal ClO2 dose-time was located at the left bottom area contour plot since this zone includes the lowest doses and reaction timevalues that can maximize the removal of pharmaceuticals.
11. Contour plot for common optimal analysis for all studied pharmaceuticals from first factorial experiment retrieved from MODDE (Step 5 in Fig.6). Black arrows indicate where the optimal dose – time – removal is located. Maximum removal belongs to red areas meanwhile lower removal is representedblue areas.
water effluent
reaction time for each pharmaceutical retrieved from first factorial experiment (Step 4 in Fig.6). For
ained using 10
MODDE (Fig. 11), pharmaceuticals was obtained
retrieved from MODDE although the one with the most equalized factor contribution from both
was selected. According to the contour plot (Fig. 11), two val were obtained. However, the selected
bottom area of the and reaction times
values that can maximize the removal of pharmaceuticals.
is for all studied
pharmaceuticals from first factorial experiment retrieved from MODDE (Step 5 in Fig.6). Black arrows indicate where the
removal is located. Maximum removal areas meanwhile lower removal is represented by
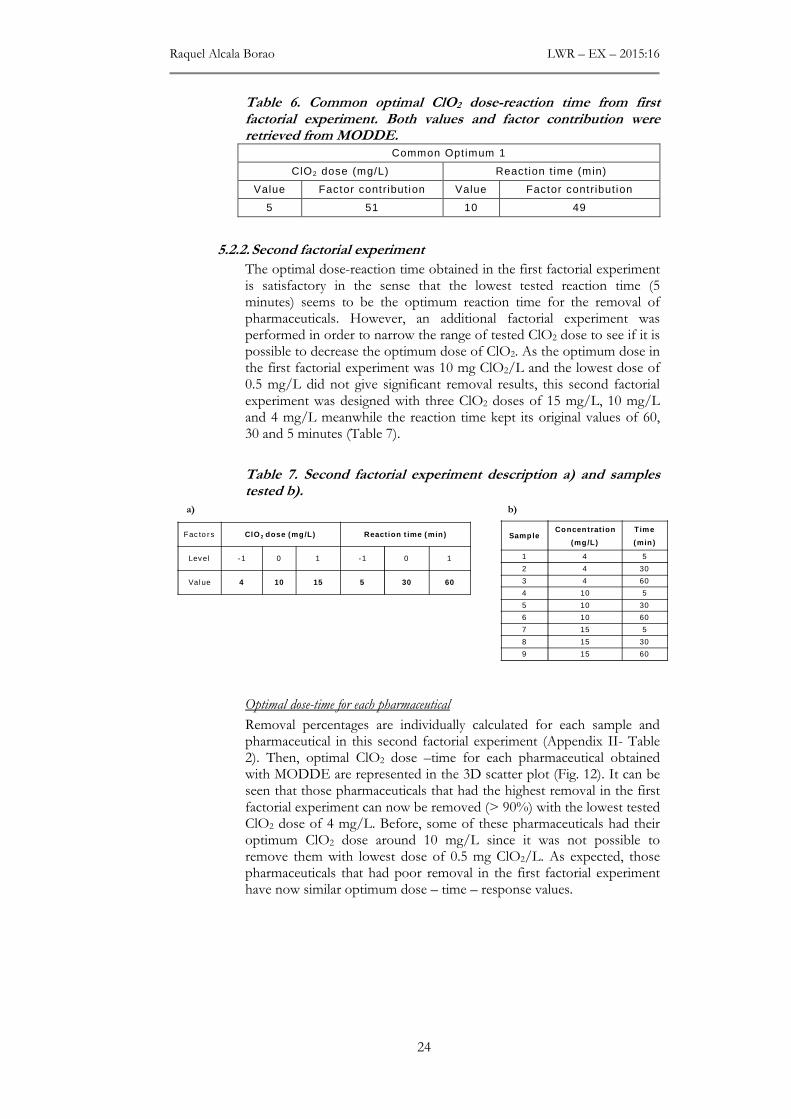
Raquel Alcala Borao LWR – EX – 2015:16
24
Table 6. Common optimal ClO2 dose-reaction time from first factorial experiment. Both values and factor contribution were retrieved from MODDE.
Common Optimum 1
ClO2 dose (mg/L) React ion t ime (min)
Value Factor contribut ion Value Factor contribut ion
5 51 10 49
5.2.2. Second factorial experiment
The optimal dose-reaction time obtained in the first factorial experiment is satisfactory in the sense that the lowest tested reaction time (5 minutes) seems to be the optimum reaction time for the removal of pharmaceuticals. However, an additional factorial experiment was performed in order to narrow the range of tested ClO2 dose to see if it is possible to decrease the optimum dose of ClO2. As the optimum dose in the first factorial experiment was 10 mg ClO2/L and the lowest dose of 0.5 mg/L did not give significant removal results, this second factorial experiment was designed with three ClO2 doses of 15 mg/L, 10 mg/L and 4 mg/L meanwhile the reaction time kept its original values of 60, 30 and 5 minutes (Table 7).
Table 7. Second factorial experiment description a) and samples tested b).
Optimal dose-time for each pharmaceutical
Removal percentages are individually calculated for each sample and pharmaceutical in this second factorial experiment (Appendix II- Table 2). Then, optimal ClO2 dose –time for each pharmaceutical obtained with MODDE are represented in the 3D scatter plot (Fig. 12). It can be seen that those pharmaceuticals that had the highest removal in the first factorial experiment can now be removed (> 90%) with the lowest tested ClO2 dose of 4 mg/L. Before, some of these pharmaceuticals had their optimum ClO2 dose around 10 mg/L since it was not possible to remove them with lowest dose of 0.5 mg ClO2/L. As expected, those pharmaceuticals that had poor removal in the first factorial experiment have now similar optimum dose – time – response values.
Fac to rs ClO 2 dose (mg /L) React ion t ime (min )
Level -1 0 1 -1 0 1
Value 4 10 15 5 30 60
Samp leConcen trat ion
(mg/L)
Time
(min )
1 4 5
2 4 30
3 4 60
4 10 5
5 10 30
6 10 60
7 15 5
8 15 30
9 15 60
a) b)
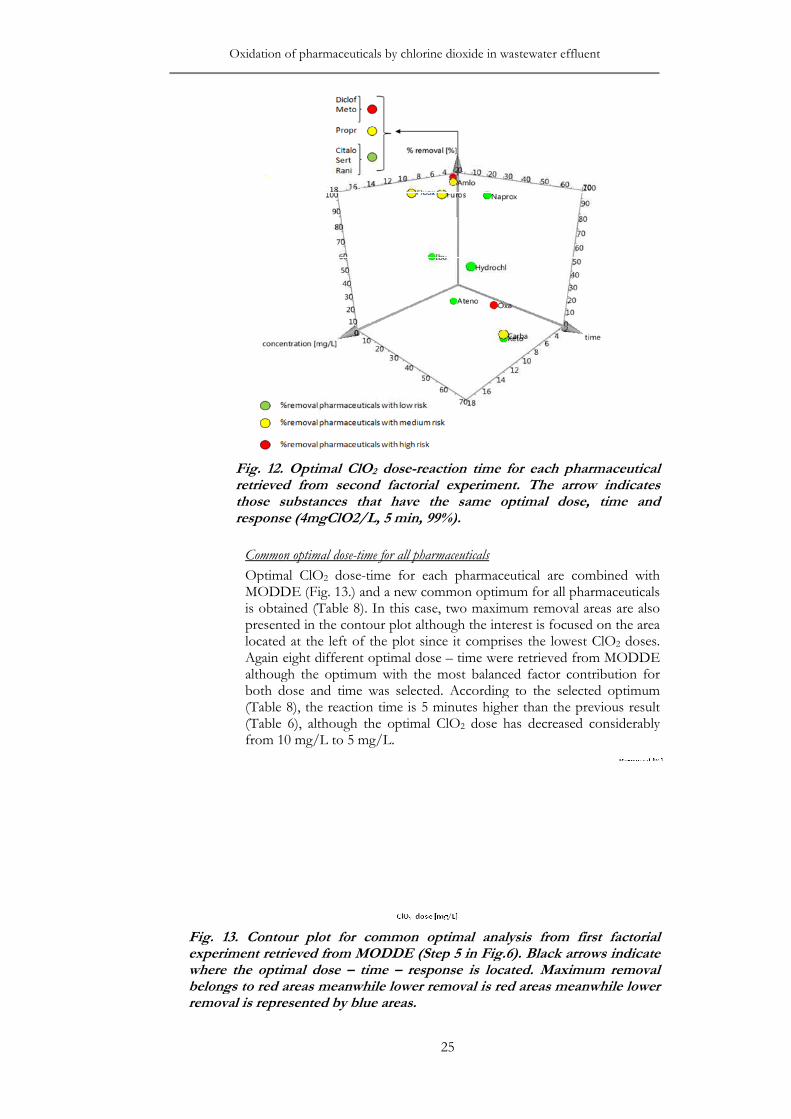
Oxidation of pharmaceuticals by chlorine dioxide in waste
Fig. 12. retrieved from second factorial experiment. The arrow indicates those substances that have the same optimal dose, time and response (4mgClO2/L, 5 min, 99%)
Common optimal dose
Optimal ClOMODDE (is obtained (presented in the contour plot althoughlocated at the left of the plot Again eight different optimal dose although tboth dose and time(Table (Table 6from 10
Fig. 13. Contour plot for common optimal analysis from first factorial experiment retrieved from MODDE (Step 5 in Fig.6). Black arrows indicate where the optimal dose belongs to red areas meanwhile lower removal is red areas meanwhile lower removal is represented by blue areas
Oxidation of pharmaceuticals by chlorine dioxide in wastewater effluent
25
Optimal ClO2 dose-reaction time for each pharmaceutical ved from second factorial experiment. The arrow indicates
those substances that have the same optimal dose, time and response (4mgClO2/L, 5 min, 99%).
Common optimal dose-time for all pharmaceuticals
Optimal ClO2 dose-time for each pharmaceutical are combiMODDE (Fig. 13.) and a new common optimum for all pharmaceuticals
obtained (Table 8). In this case, two maximum removal areas are alspresented in the contour plot although the interest is focused on the area located at the left of the plot since it comprises the lowest ClOAgain eight different optimal dose – time were retrieved from MODDE although the optimum with the most balanced factor contributionboth dose and time was selected. According to the selected
8), the reaction time is 5 minutes higher than the previous (Table 6), although the optimal ClO2 dose has decreased considerably from 10 mg/L to 5 mg/L.
Contour plot for common optimal analysis from first factorial iment retrieved from MODDE (Step 5 in Fig.6). Black arrows indicate
where the optimal dose – time – response is located. Maximum removal belongs to red areas meanwhile lower removal is red areas meanwhile lower removal is represented by blue areas.
water effluent
reaction time for each pharmaceutical ved from second factorial experiment. The arrow indicates
those substances that have the same optimal dose, time and
are combined with a new common optimum for all pharmaceuticals
, two maximum removal areas are also the interest is focused on the area
nce it comprises the lowest ClO2 doses. time were retrieved from MODDE
he optimum with the most balanced factor contribution for According to the selected optimum
higher than the previous result dose has decreased considerably
Contour plot for common optimal analysis from first factorial
iment retrieved from MODDE (Step 5 in Fig.6). Black arrows indicate response is located. Maximum removal
belongs to red areas meanwhile lower removal is red areas meanwhile lower
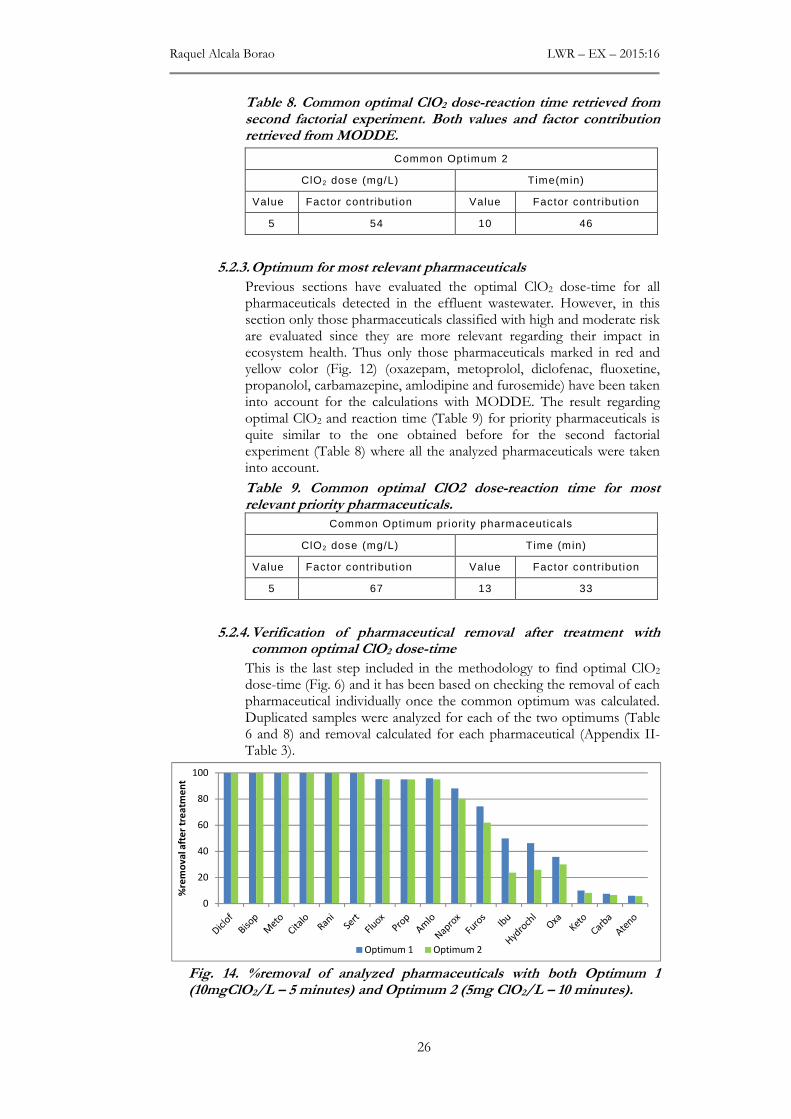
Raquel Alcala Borao LWR – EX – 2015:16
26
Table 8. Common optimal ClO2 dose-reaction time retrieved from second factorial experiment. Both values and factor contribution retrieved from MODDE.
Common Optimum 2
ClO2 dose (mg/L) Time(min)
Value Factor contribut ion Value Factor contribut ion
5 54 10 46
5.2.3. Optimum for most relevant pharmaceuticals
Previous sections have evaluated the optimal ClO2 dose-time for all pharmaceuticals detected in the effluent wastewater. However, in this section only those pharmaceuticals classified with high and moderate risk are evaluated since they are more relevant regarding their impact in ecosystem health. Thus only those pharmaceuticals marked in red and yellow color (Fig. 12) (oxazepam, metoprolol, diclofenac, fluoxetine, propanolol, carbamazepine, amlodipine and furosemide) have been taken into account for the calculations with MODDE. The result regarding optimal ClO2 and reaction time (Table 9) for priority pharmaceuticals is quite similar to the one obtained before for the second factorial experiment (Table 8) where all the analyzed pharmaceuticals were taken into account.
Table 9. Common optimal ClO2 dose-reaction time for most relevant priority pharmaceuticals.
Common Optimum priori ty pharmaceuticals
ClO2 dose (mg/L) Time (min)
Value Factor contribut ion Value Factor contribut ion
5 67 13 33
5.2.4. Verification of pharmaceutical removal after treatment with common optimal ClO2 dose-time
This is the last step included in the methodology to find optimal ClO2 dose-time (Fig. 6) and it has been based on checking the removal of each pharmaceutical individually once the common optimum was calculated. Duplicated samples were analyzed for each of the two optimums (Table 6 and 8) and removal calculated for each pharmaceutical (Appendix II- Table 3).
Fig. 14. %removal of analyzed pharmaceuticals with both Optimum 1 (10mgClO2/L – 5 minutes) and Optimum 2 (5mg ClO2/L – 10 minutes).
0
20
40
60
80
100
%re
mo
va
l aft
er
tre
atm
en
t
Optimum 1 Optimum 2

Oxidation of pharmaceuticals by chlorine dioxide in wastewater effluent
27
9 of 17 studied pharmaceuticals can be removed more than 90% when applying both optimal ClO2 dose-time values (Fig. 14). This result implies that choosing Optimum 2 (5 mg ClO2/L – 10min) is the best option since it is able to reach similar removal values than Optimum 1 (10 mg ClO2 /L) but using less ClO2 dose, thus leading to a more resource effective option.
The highest differences regarding removal efficiencies between the two optimums can be seen for ibuprofen and hydrochlorothiazide but this is not so relevant since both substances pose a low risk for the ecosystem health. The other substances have almost the same removal with both optimal ClO2 dose – time values.
Environmental risk ratios (EC/PNEC) were calculated for each pharmaceutical after treatment with optimal ClO2 dose – reaction time (5mg/L – 10min). Besides, final concentrations after treatment are compared with initial concentrations before treatment (Fig. 15). According to these results, oxazepam would still pose a high environmental risk after treatment with ClO2 since this pharmaceutical cannot be totally removed with this treatment; approximately 30% of this substance could be removed from wastewater. Cabamazepine, which has one of the lowest removals (<10%), still has moderate environmental risk after the ClO2 treatment. Other pharmaceuticals that had high risk before treatment (diclofenac and metoprolol) and moderate risk (fluoxetine, amlodipine, furosemide and propanolol) (Fig. 15) would pose now a low environmental risk after treatment with 5mg ClO2/L-10min. Those pharmaceuticals that had a low environmental risk before treatment, still pose a low risk after treatment.
Fig. 15. Comparison of concentrations of pharmaceuticals before treatment (bar at the top of each substance) and after treatment (bar at the bottom of each substance). Dark red, yellow and green bars refer to high, medium and low environmental risk respectively before treatment, meanwhile light red, yellow and green bars refer to high, medium and low environmental risk respectively after treatment. For instance, furosemide had a medium risk (dark yellow) before treatment and low risk (light green) after treatment.
0 200 400 600 800 1000 1200 1400 1600
Hydrochlorothiazide
Bisoprolol
Ranitidine
Atenolol
Ibuprofen
Sertralin
Citalopram
Ketoprofen
Naproxen
Furosemide
Amlodipine
Carbamazepine
Propranolol
Fluoxetine
Diclofenac
Metoprolol
Oxazepam
Concentration (ng/L)
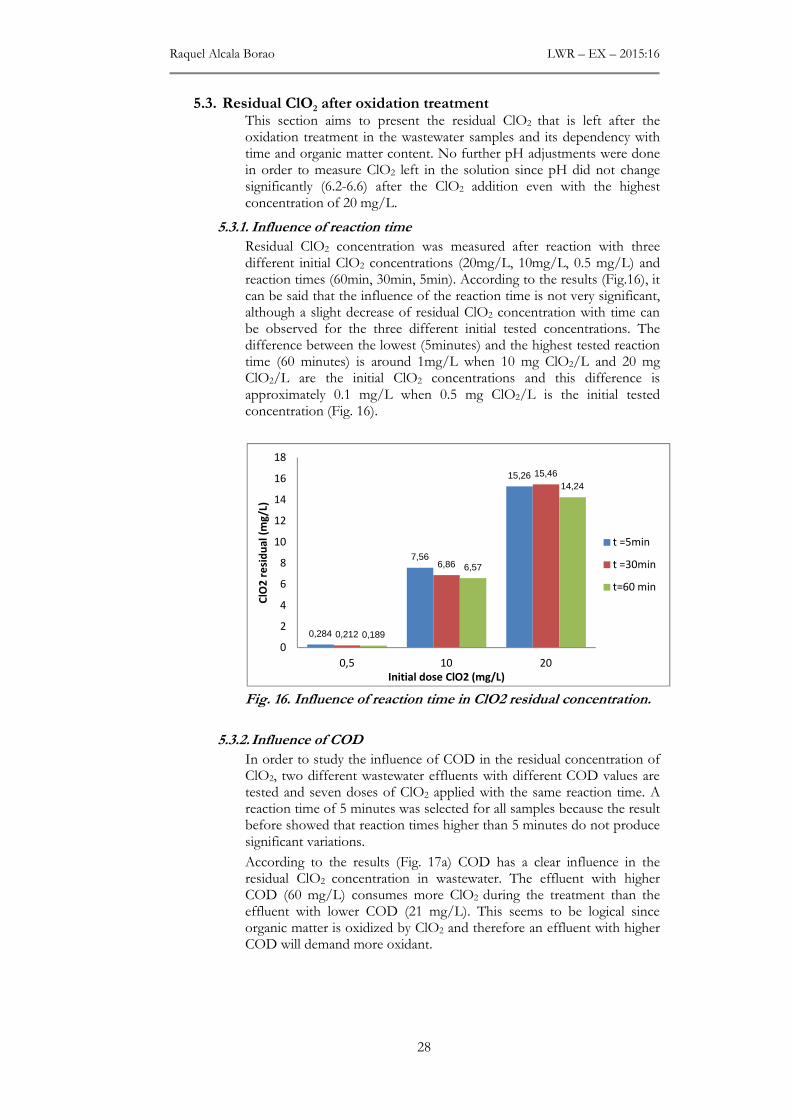
Raquel Alcala Borao LWR – EX – 2015:16
28
5.3. Residual ClO2 after oxidation treatment This section aims to present the residual ClO2 that is left after the oxidation treatment in the wastewater samples and its dependency with time and organic matter content. No further pH adjustments were done in order to measure ClO2 left in the solution since pH did not change significantly (6.2-6.6) after the ClO2 addition even with the highest concentration of 20 mg/L.
5.3.1. Influence of reaction time
Residual ClO2 concentration was measured after reaction with three different initial ClO2 concentrations (20mg/L, 10mg/L, 0.5 mg/L) and reaction times (60min, 30min, 5min). According to the results (Fig.16), it can be said that the influence of the reaction time is not very significant, although a slight decrease of residual ClO2 concentration with time can be observed for the three different initial tested concentrations. The difference between the lowest (5minutes) and the highest tested reaction time (60 minutes) is around 1mg/L when 10 mg ClO2/L and 20 mg ClO2/L are the initial ClO2 concentrations and this difference is approximately 0.1 mg/L when 0.5 mg ClO2/L is the initial tested concentration (Fig. 16).
Fig. 16. Influence of reaction time in ClO2 residual concentration.
5.3.2. Influence of COD
In order to study the influence of COD in the residual concentration of ClO2, two different wastewater effluents with different COD values are tested and seven doses of ClO2 applied with the same reaction time. A reaction time of 5 minutes was selected for all samples because the result before showed that reaction times higher than 5 minutes do not produce significant variations.
According to the results (Fig. 17a) COD has a clear influence in the residual ClO2 concentration in wastewater. The effluent with higher COD (60 mg/L) consumes more ClO2 during the treatment than the effluent with lower COD (21 mg/L). This seems to be logical since organic matter is oxidized by ClO2 and therefore an effluent with higher COD will demand more oxidant.
0,284
7,56
15,26
0,212
6,86
15,46
0,189
6,57
14,24
0
2
4
6
8
10
12
14
16
18
0,5 10 20
ClO
2 r
esi
du
al
(mg
/L)
Initial dose ClO2 (mg/L)
t =5min
t =30min
t=60 min
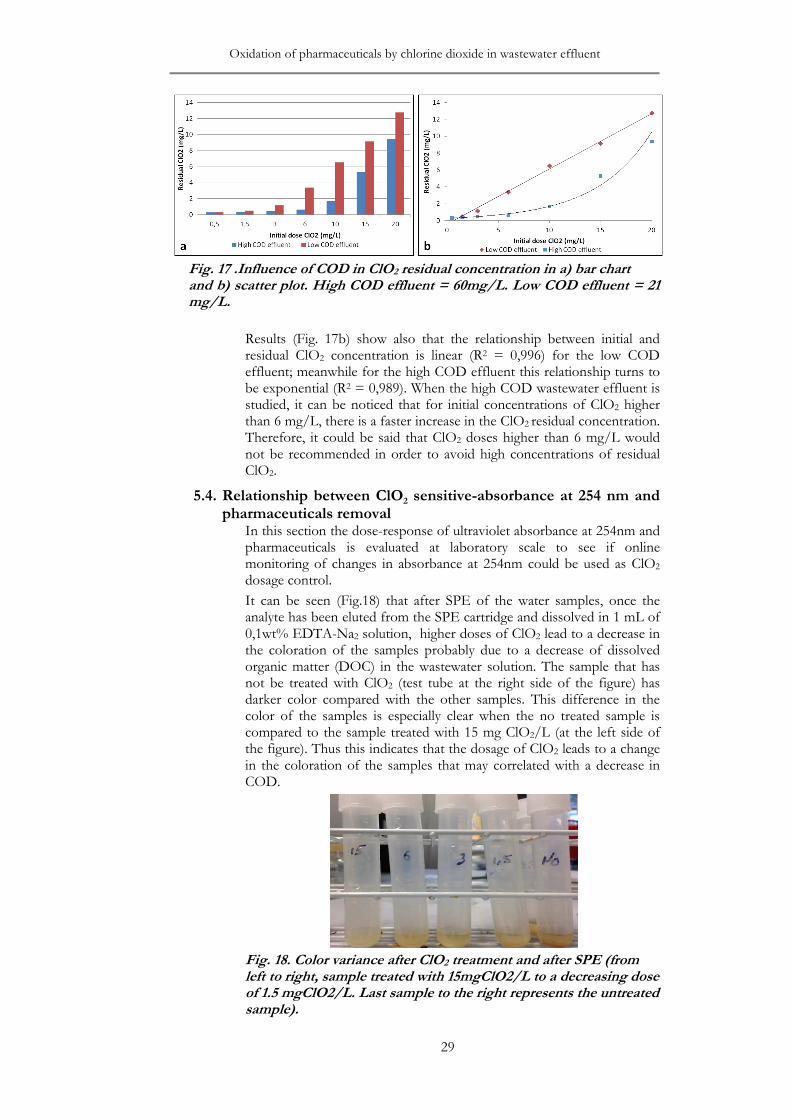
Oxidation of pharmaceuticals by chlorine dioxide in wastewater effluent
29
Fig. 17 .Influence of COD in ClO2 residual concentration in a) bar chart and b) scatter plot. High COD effluent = 60mg/L. Low COD effluent = 21 mg/L.
Results (Fig. 17b) show also that the relationship between initial and residual ClO2 concentration is linear (R2 = 0,996) for the low COD effluent; meanwhile for the high COD effluent this relationship turns to be exponential (R2 = 0,989). When the high COD wastewater effluent is studied, it can be noticed that for initial concentrations of ClO2 higher than 6 mg/L, there is a faster increase in the ClO2 residual concentration. Therefore, it could be said that ClO2 doses higher than 6 mg/L would not be recommended in order to avoid high concentrations of residual ClO2.
5.4. Relationship between ClO2 sensitive-absorbance at 254 nm and pharmaceuticals removal
In this section the dose-response of ultraviolet absorbance at 254nm and pharmaceuticals is evaluated at laboratory scale to see if online monitoring of changes in absorbance at 254nm could be used as ClO2 dosage control.
It can be seen (Fig.18) that after SPE of the water samples, once the analyte has been eluted from the SPE cartridge and dissolved in 1 mL of 0,1wt% EDTA-Na2 solution, higher doses of ClO2 lead to a decrease in the coloration of the samples probably due to a decrease of dissolved organic matter (DOC) in the wastewater solution. The sample that has not be treated with ClO2 (test tube at the right side of the figure) has darker color compared with the other samples. This difference in the color of the samples is especially clear when the no treated sample is compared to the sample treated with 15 mg ClO2/L (at the left side of the figure). Thus this indicates that the dosage of ClO2 leads to a change in the coloration of the samples that may correlated with a decrease in COD.
Fig. 18. Color variance after ClO2 treatment and after SPE (from left to right, sample treated with 15mgClO2/L to a decreasing dose of 1.5 mgClO2/L. Last sample to the right represents the untreated sample).
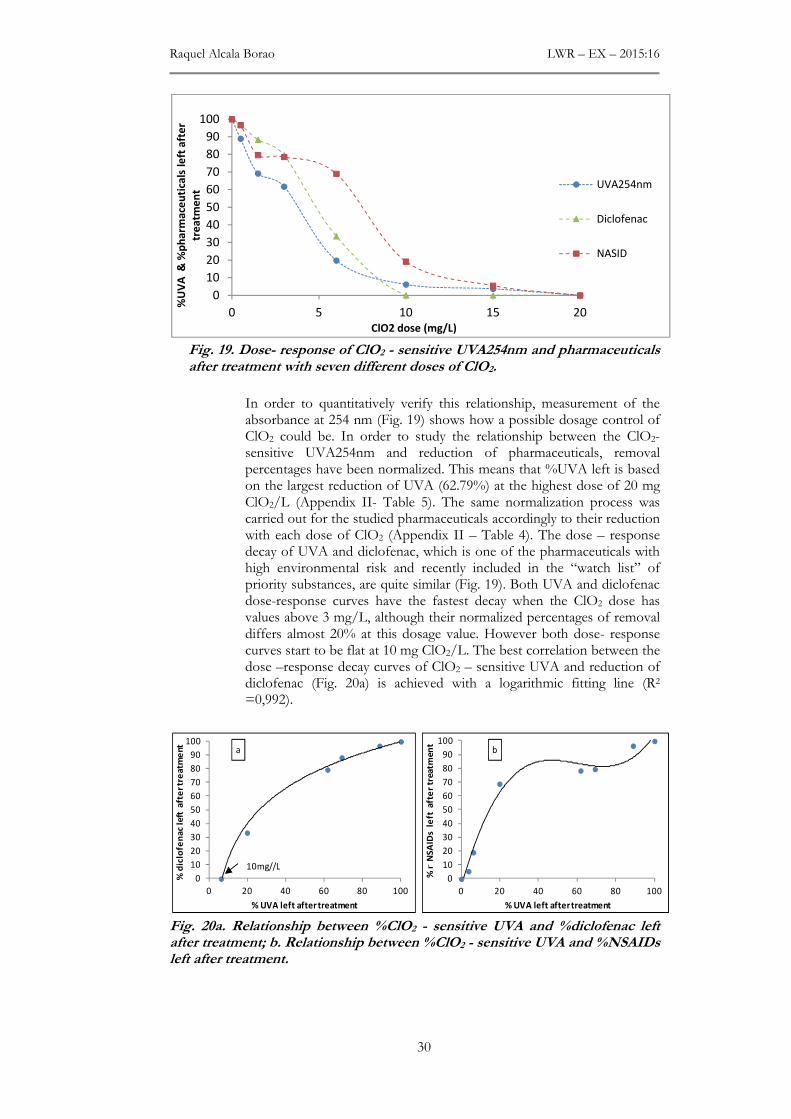
Raquel Alcala Borao LWR – EX – 2015:16
30
Fig. 19. Dose- response of ClO2 - sensitive UVA254nm and pharmaceuticals after treatment with seven different doses of ClO2.
In order to quantitatively verify this relationship, measurement of the absorbance at 254 nm (Fig. 19) shows how a possible dosage control of ClO2 could be. In order to study the relationship between the ClO2-sensitive UVA254nm and reduction of pharmaceuticals, removal percentages have been normalized. This means that %UVA left is based on the largest reduction of UVA (62.79%) at the highest dose of 20 mg ClO2/L (Appendix II- Table 5). The same normalization process was carried out for the studied pharmaceuticals accordingly to their reduction with each dose of ClO2 (Appendix II – Table 4). The dose – response decay of UVA and diclofenac, which is one of the pharmaceuticals with high environmental risk and recently included in the “watch list” of priority substances, are quite similar (Fig. 19). Both UVA and diclofenac dose-response curves have the fastest decay when the ClO2 dose has values above 3 mg/L, although their normalized percentages of removal differs almost 20% at this dosage value. However both dose- response curves start to be flat at 10 mg ClO2/L. The best correlation between the dose –response decay curves of ClO2 – sensitive UVA and reduction of diclofenac (Fig. 20a) is achieved with a logarithmic fitting line (R2 =0,992).
Fig. 20a. Relationship between %ClO2 - sensitive UVA and %diclofenac left after treatment; b. Relationship between %ClO2 - sensitive UVA and %NSAIDs left after treatment.
0
10
20
30
40
50
60
70
80
90
100
0 5 10 15 20
%U
VA
& %
ph
arm
ace
uti
cals
le
ft a
fte
r
tre
atm
en
t
ClO2 dose (mg/L)
UVA254nm
Diclofenac
NASID
0
10
20
30
40
50
60
70
80
90
100
0 20 40 60 80 100
% n
NS
AID
s l
eft
aft
er
trea
tmen
t
% UVA left after treatment
0
10
20
30
40
50
60
70
80
90
100
0 20 40 60 80 100
% d
iclo
fen
ac le
ft a
fte
r tr
ea
tme
nt
% UVA left after treatment
10mg//L
a b
Oxidation of pharmaceuticals by chlorine dioxide in wastewater effluent
31
The dose – response decay curve of nonsteroidal anti-inflammatory drugs (NSAIDs), which is an important group of pharmaceuticals due to their high application level worldwide, is calculated as an average normalized value for the removal of diclofenac, ketoprofen, ibuprofen and naproxen (Appendix II- Table 5). The fastest decrease of the NSAIDs decay curve starts in 6 mg ClO2/L, meanwhile this value was lower (3 mg ClO2/L) for the ClO2 sensitive-UVA decay curve. This difference can probably be due to the fact that there are two substances in the NSAIDs group, ibuprofen and ketoprofen, which cannot be completely oxidized by ClO2. The correlation between ClO2 sensitive-UVA and reduction of NSAIDs (Fig. 20b) is not logarithmic as for diclofenac but it can be adjusted to a cubic polynomial (R2= 0,979).
6. DISCUSSION
In this section different aspects of the study are discussed starting by the methodology and possible analytical errors, followed by the optimal ClO2 dose – time and control strategy retrieved from this study. This section is concluded with a final evaluation of ClO2 treatment.
6.1. Methodology and analytical errors The method chosen to get the optimal ClO2 dose – time as well as possible analytical errors during quantification of pharmaceuticals are addressed in this section.
6.1.1. Factorial experiment and MODDE
The factorial experiment designed in order to find the most optimal ClO2 dose – reaction time –response has successfully being applied in this study since it has considerably decreased the number of samples to cover a broad range of doses and reaction times. Besides, the combination of the factorial design for oxidation tests together with the utilization of the software tool MODDE has allowed finding the optimal dose – time values in a methodical way to solve a complex optimization. The optimization process in this study has been a big challenge due to the fact that high diversity pharmaceuticals (mode of action, chemical structure, KOW) have been analyzed. Maximum removals for each pharmaceutical were achieved with different ClO2 dose and reaction time values and therefore MODDE has helped to integrate them and calculate a common theoretical optimal dose-time choosing that result with the most equal factor contribution from both ClO2 dose and time. In this case an equilibrated contribution of time and ClO2 consumption has been sought since both can equally contribute for a resource efficient process.
6.1.2. Matrix effects in the quantification of pharmaceuticals
Analytical errors during quantification of pharmaceuticals can occur due to matrix effects caused by the co-elution of sample impurities. These matrix effects such as ion suppression or ion enhancement of the analyte of interest may mask the true concentration of the target analyte in the sample. Thus in order to compensate for the background interferences, blank and standards solutions were utilized. Another approach that has been used for the standardization and calibration of the chromatographic method is the use of internal standards. Isotopic labeled standards, Carbamazepine-13C15N (2µg/mL) and Ibuprofen – D3 (2µg/mL), were used in this study because they are able to compensate for matrix effects and recovery losses of the target analyte in complex matrixes as wastewater is. However, due to the limit availability of proper isotopic

Raquel Alcala Borao LWR – EX – 2015:16
32
labeled standards, external calibration instead of internal calibration is applied in this study in order to perform the quantification of pharmaceuticals.
Another issue that can affect the analytical method is that despite of the fact that a high diversity of pharmaceuticals with different polarity, molecular shape and size, log KOW, etc. were analyzed, same SPE cartridge and extraction method is utilized. Thus, it is expected that the method and SPE cartridge will work better for some pharmaceuticals and worse for others and therefore different recoveries values varying from 30% to 100% (Appendix I) were obtained for the studied group of pharmaceuticals.
The fact that the same wastewater has been used and frozen until its usage for the experiments has ensured keeping constant background characteristics of the wastewater matrix during all the experiments. This allows eliminating uncertainties when comparing different batches of experiments. Another strategy to avoid background interferences and matrix effects (ion suppression, ion enhancement) from other compounds in wastewater is to study the pharmaceuticals oxidation by ClO2 in spiked tap water.
6.2. Priority list of pharmaceuticals The list of prioritized pharmaceuticals was created in order to know which of the analyzed substances in the water are more relevant according to their impact in the ecosystem health downstream of the wastewater treatment plant. This is quite advantageous in the sense that allows focusing on those substances that pose a higher risk for the environment against those that pose lower environmental risk.
When the priority list of pharmaceuticals retrieved from this study (Table 5) is compared with the investigation performed by Sehlén et al. (2015) in Linköping WWTP, oxazepam and metoprolol were also classified as substances with high environmental risk. On the other hand, Shelén et al. (2015) classified diclofenac as a substance with moderate environmental risk and not with a high environmental risk as this study does. The reason for this could be due to the fact that in the investigation carried out by Sehlén et al. (2015) the dilution factor was almost three times higher (27) compared to this study (10) and thus higher PNEC values were considered for the environmental risk ration (EC/PNEC).
The fact that there are not yet any specific guidelines for maximum discharges of these substances to the environment, makes difficult to predict which concentrations levels are acceptable or not. This seems the reason why most of previous studies have focused on removal percentages instead of final concentrations at the effluent of WWTPs. However, this study has given a step forward by taking into account the impact in the receiving water (PNEC) as well as clustering the analyzed substances in different environmental risk groups by comparing EC and PNEC values.
There are different NOEC and assessment factor values that can be applied to calculate PNEC and this fact would then influence the calculated environmental risk ratio (EC/PNEC). However in this study the most sensitive tests, retrieved from FASS, have been selected.
This approach of comparing EC with PNEC, called single substance ecotoxicology effect study, has the disadvantage of assessing effects of the substances individually so it does not take into account combined effects of a mixture of substances whose toxic effect can be larger than
Oxidation of pharmaceuticals by chlorine dioxide in wastewater effluent
33
the substance alone. However, this method is still used as a simple way to assess the risk of toxicological effects in the ecosystem.
6.3. Optimal ClO2 dose – time –response The final obtained optimal dose – time –response of 5 mg ClO2/L and 10 minutes can successfully remove (> 90%) more than a half of the analyzed pharmaceuticals which are the most common pharmaceuticals that can be found nowadays at effluent wastewaters.
When the removal efficiencies of each pharmaceutical retrieved from this study (Fig. 14) are compared with previous studies, it can be seen that effectively those substances with electron rich functional groups such as anline (e.g. diclofenac), tertiary amine (e.g. citalopram and ranitidine), secondary amine (e.g. propanolol) or sulfonamide (e.g. furosemide) can be oxidized by ClO2. On the other hand, those pharmaceuticals with non-electron rich functional groups such as carbamazepine, ketoprofen and the β- blocker atenolol have poor removal with ClO2 as stated by Hey et al. (2012) and Lee and von Gunten (2010).
However, some disagreements have been found in the removal of β- blockers metoprolol, bisoprolol and the anti depressant fluoxetine when comparing this study with Hey et al. (2012). In this study these three pharmaceuticals have maximum removal with the optimal ClO2 dose – reaction time, meanwhile Hey et al. (2012) states that these substances cannot be completely oxidized even with the highest dose of 20 mg ClO2/L. In order to study the disagreement between this study and Hey et al. (2012), oxidation tests were carried out in spiked tap water in order to avoid possible interferences produced by the wastewater matrix such as ion suppression. After this test, metoprolol, bisoprolol and fluoxetine still had a maximum removal with the optimal ClO2 dose – reaction time what should indicate that they can be successfully degraded by ClO2.
Accordingly to the priority list of pharmaceuticals, six of eight pharmaceuticals that had high and moderate environmental risk before treatment, can be classified as substances that pose a low risk for the environment after treatment with optimal ClO2 dose – reaction time. However, the main concern lies on oxazepam which is a common sedative that pose a high risk for the ecosystem health even after treatment with ClO2 since it can only be removed around 30% with ClO2. Other oxidation technologies such as ozone can neither completely remove oxazepam although its removal (80% removal with 7 g O3/m3) is much higher than with ClO2. However, oxazepam can be almost totally removed (>99%) with activated carbon (Baresel et al. 2014).
It could be said that the optimal ClO2 dose –time (5 g ClO2/m3 - 10 minutes) retrieved from this study is coherent and could be applied in future upscaling. This is because when this optimal dose–time is compared with previous experiments with ozone, similar dose (7 g O3/m3) and retention time (10 minutes) were obtained giving a high removal (>94%) for all studied pharmaceuticals except oxazepam (Baresel et al., 2014).
Two factorial experiments have been carried out in this study in order to constrain the dose and time ranges and get an optimal ClO3 dose-time as accurate as possible. Even though the optimal dose-time value seems quite reasonable, both for ClO2 dose and reaction time, one more factorial experiment could be done in order to narrow the ClO2 dose range and see if it is feasible to obtain even lower optimal ClO2 dose.
Raquel Alcala Borao LWR – EX – 2015:16
34
6.4. ClO2 dosage control To find a proper optimal dose – time for pharmaceuticals removal using ClO2 can be considered as the first step in order to see if it is possible to apply this technology in a resource – efficient way oxidizing most relevant pharmaceuticals. However, for future full scale implementation of this technology, it is important to take into account that composition of wastewater varies over time, especially in small scale wastewater treatments (< 2000 pe) where incoming flows and loads changes widely in comparison to major treatment plants (Rivera, 2006). In this case, it is not so relevant to have one optimum dose-time but to adapt the dosage according to the load variations in order to avoid overdose and an increase risk of formation of eco-toxic byproducts. Results clearly showed that variations in COD affect the residual ClO2 concentration. For instance, for the optimal dose of 5 mg ClO2/L the residual ClO2 is about 13% and 50% of the initial oxidant concentration for the high COD and low COD wastewater effluents respectively after 5 minutes of reaction. Furthermore, pharmaceuticals removal would differ in wastewaters with different COD values since pharmaceuticals would compete against the oxidant demand of aromatic compounds. Therefore, measuring the decrease of ultraviolet absorbance at 254 nm, which is a rough measure of aromatic rings in the water, can be a promising control strategy and easy to implement on high quality effluents free of suspended particles.
Results showed a clear dose-response relationship, especially between UVA254nm and diclofenac. However, further research should be performed since different wastewater matrices will have specific absorbance profiles. Also real online monitoring of absorbance at 254 nm could be performed at the effluent and water samples taken at specific times to measure pharmaceuticals concentration in order to correlate it with the absorbance at 254 nm.
6.5. Final evaluation Three different factors can be discussed to evaluate the usefulness of ClO2 as end of pipe treatment for the effluent of WWTPs: efficiency of the treatment, cost and risk of formation of ecotoxicological byproducts.
6.5.1. Efficiency of ClO2 treatment
According to the efficiency of the treatment, ClO2 could be considered a suitable technology to remove pharmaceuticals from wastewater since more than a half of the 17 studied pharmaceuticals can be removed (>90%) and six of eight pharmaceuticals which had a significant environmental risk have a low risk after treatment with the optimal ClO2 dose – time (5g ClO2/m3 – 10minutes).
However, the fact that other technologies (e.g. ozone, activate carbon) have higher removal efficiencies for those substances that cannot be completely removed by ClO2 (e.g. oxazepam, carbamazepine) and that ozone reacts faster with the same functional group resulting in shorter half-lives than ClO2 (Huber et al. 2005), can relegate the use of ClO2 as end of pipe treatment for the effluent of WWTPs.
One approach could be based on combining ClO2 treatment with activate carbon as post-treatment so the deficiencies of one technology can be solved by the other. Other studies have already tested combined systems at pilot scale (ozone + activate carbon) obtaining quite satisfactory results (Baresel et al. 2015). However, this combined systems could be only feasible in conventional WWTPs but not is small scale

Oxidation of pharmaceuticals by chlorine dioxide in wastewater effluent
35
WWTPs (<2000 pe) since they do not usually apply advanced treatment technologies in their wastewater facilities.
6.5.2. Cost
According to the cost, it is known that the capital cost of other oxidation technologies such as ozone (100-300 k€) is much higher than a ClO2
generator (10-30 k€). On the other hand, ozone has a very competitive running cost of about 0,6 SEK/ m3 (Baresel et al., 2015) meanwhile running cost for the generation of ClO2 are usually higher since it needs to be produced on site from NaClO2 solution. However, new studies have tested the possibility to produce ClO2 by electrocatalytical process with both NaCl and NaClO2 that would reduce production cost (Tsai et al., 2014). Furthermore, the fact that the optimal ClO2 dose – reaction time (5 g ClO2/m3 – 10 minutes) retrieved from this study and the dose – retention time tested with ozone (7 g O3/m3 – 10 minutes) are quite similar, could mean that ClO2 treatment could be economically competent against other technologies.
If the efficiency of the treatment and cost are evaluated together it can be said that ClO2 could definitely be satisfactorily applied as end of pipe treatment is small scale WWTP where the application of the optimal ClO2 dose – time would eliminate a high diversity of pharmaceuticals with a lower initial cost compared to ozone.
However one factor that would definitively support the choice of an oxidation technology as the most suitable end of pipe treatment for pharmaceuticals removal is to discard the risk of formation of transformation byproducts than can be more toxic than the parent compound.
6.5.3. Ecotoxicological by-products
It is known that the main drawback of oxidation technologies is the possibility of formation of unwanted substances that can be even more toxic than the parent compounds. According to previous studies about disinfection of drinking water with ClO2, the main risk belongs to the formation of inorganic by-products although some organic by-products have also been reported. However, formation of by-products after pharmaceuticals removal has not been extensively reported.
In this study the toxicity of few samples was retrieved from microtox test. After this test the treated sample with ClO2 had a EC50,15min value (11.37%) much higher compared to an untreated wastewater sample that turned to be no toxic (EC50,15min > 100%). In order to try to decrease this toxicity, a post treatment step (theoretical dose of 4.14 mg Fe2+/mg ClO2) followed by sand filter) was applied at laboratory scale after ClO2 dosage in order to remove inorganic byproducts and residual ClO2 since previous studies (Sorlini & Collivignarelli, 2005; Katz & Narkis, 2001) have stated that it is possible to remove them by this technique. However, the microtox test performed with this sample still gave an EC50, 15min toxicity value (15.8%) higher than the untreated sample and a similar value compared to the treated sample with ClO2. This could be due to the fact that ClO2 and inorganic byproducts were still left in solution after treatment with the iron salt or due to the presence of organic compounds that cannot be reduced by the iron salt. The presence of organic byproducts after ClO2 treatment could be feasible since a recent investigation performed by Wang et al. (2014), that studied the major disinfection by-products after oxidation of diclofenac by ClO2, reported that during degradation process intermediate substances such as
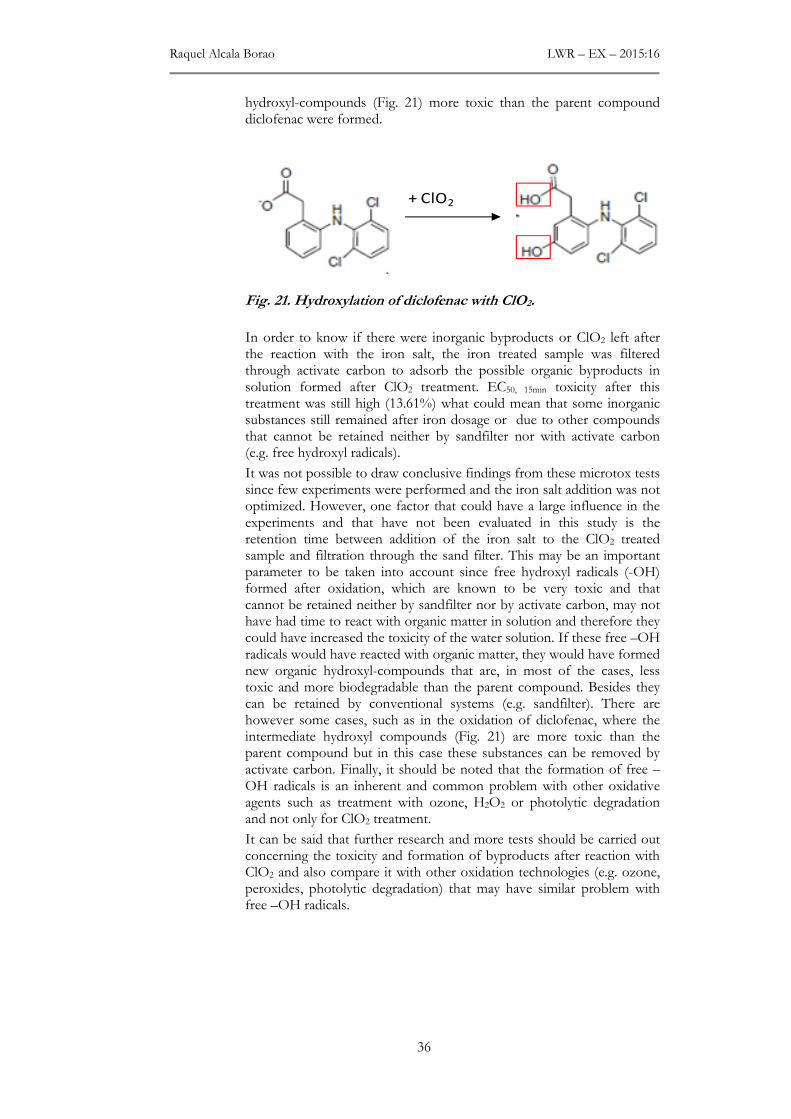
Raquel Alcala Borao LWR – EX – 2015:16
36
hydroxyl-compounds (Fig. 21) more toxic than the parent compound diclofenac were formed.
Fig. 21. Hydroxylation of diclofenac with ClO2.
In order to know if there were inorganic byproducts or ClO2 left after the reaction with the iron salt, the iron treated sample was filtered through activate carbon to adsorb the possible organic byproducts in solution formed after ClO2 treatment. EC50, 15min toxicity after this treatment was still high (13.61%) what could mean that some inorganic substances still remained after iron dosage or due to other compounds that cannot be retained neither by sandfilter nor with activate carbon (e.g. free hydroxyl radicals).
It was not possible to draw conclusive findings from these microtox tests since few experiments were performed and the iron salt addition was not optimized. However, one factor that could have a large influence in the experiments and that have not been evaluated in this study is the retention time between addition of the iron salt to the ClO2 treated sample and filtration through the sand filter. This may be an important parameter to be taken into account since free hydroxyl radicals (-OH) formed after oxidation, which are known to be very toxic and that cannot be retained neither by sandfilter nor by activate carbon, may not have had time to react with organic matter in solution and therefore they could have increased the toxicity of the water solution. If these free –OH radicals would have reacted with organic matter, they would have formed new organic hydroxyl-compounds that are, in most of the cases, less toxic and more biodegradable than the parent compound. Besides they can be retained by conventional systems (e.g. sandfilter). There are however some cases, such as in the oxidation of diclofenac, where the intermediate hydroxyl compounds (Fig. 21) are more toxic than the parent compound but in this case these substances can be removed by activate carbon. Finally, it should be noted that the formation of free –OH radicals is an inherent and common problem with other oxidative agents such as treatment with ozone, H2O2 or photolytic degradation and not only for ClO2 treatment.
It can be said that further research and more tests should be carried out concerning the toxicity and formation of byproducts after reaction with ClO2 and also compare it with other oxidation technologies (e.g. ozone, peroxides, photolytic degradation) that may have similar problem with free –OH radicals.
+ ClO2

Oxidation of pharmaceuticals by chlorine dioxide in wastewater effluent
37
7. FUTURE STUDIES
The result of the bench-scale study shows that ClO2 is effective removing most of the studied pharmaceuticals when the optimal dose - time (5g ClO2/m3 – 10 minutes) is applied. However, further work should be done in the following areas:
Deeper research needs to be done in the study of ecotoxicological byproducts generated after the treatment with ClO2 before upscaling this technology to pilot or full scale WWTPs. More tests with the post treatment step (ferrous salt followed by sand filter) to remove inorganic byproducts and subsequent evaluation of toxicity with microtox tests should be performed. However retention time between addition of the ferrous salt and sand filtration should be evaluated in order to determine if intermediate products such as free –OH radicals, more toxic than the parent compounds, can be degraded over time by reaction with organic matter before going through the sand filter. It would also be of great value to identify degradation products after ClO2 treatment by analyzing the peaks from HPLC –MS/MS chromatogram.
As the optimal ClO2 dose – time for maximum pharmaceuticals removal has already been tested and retrieved from this study, the next step should be more focus on optimizing the control dosage strategy of ClO2 accordingly to hourly variations in the load and composition of the wastewater matrix. This would be valuable in order to achieve a resource efficient process and to avoid overdosing of the oxidant for a future upscale application.
The list of prioritized substances presented in this study has only included the most relevant pharmaceuticals that can be found nowadays at WWTPs effluents. However this is a dynamic list that can be modified if other micropollutants, which have been reported in wastewater effluents, were included. Some relevant micropollutants whose sensitivity to be oxidized by ClO2 could be evaluated are: i) phthalates esters which are commonly used as plasticizers in different applications such as wall covering or medical applications; ii) flame retardants such as polybrominated diphenyl ethers (PBDEs) and phosphorous flame retardants (PFRs); iii) per- and polyfluoroalkyl substances (PFAS); iv) phenolic substances such as BPA and v) multi resistance bacteria formed by the increased use of antibiotics.
8. CONCLUSION
The results from this bench scale study shows that an optimal dose of 5 g ClO2/m3 and a reaction time of 10 minutes can totally remove more than a half of the studied pharmaceuticals. Furthermore six of the eight pharmaceuticals that posed moderate and high environmental risk before ClO2 treatment, had a low environmental risk after treatment with ClO2. Only oxazepam and carbamazepine keep high and moderate environmental risk respectively after ClO2 treatment. Results indicate also that variations in wastewater composition (e.g. COD) would affect the oxidant demand and therefore ClO2 – sensitive absorbance at 254nm and pharmaceuticals dose-response decay curves were measured as possible strategy for ClO2 dosage control.
However, before stating if ClO2 could be a suitable end of pipe treatment for WWTPs, deeper research and evaluation of ecotoxicological byproducts needs to be performed.
Raquel Alcala Borao LWR – EX – 2015:16
38
9. REFERENCES
Aga I., Diana S. Fate of pharmaceuticals in the environment and in water treatments systems. 2008. New York: Taylor & Francis Group.
Andersen H.R. 2010. Use of ClO2 for removal of estrogenic substances in wastewater, WIPO Pub. No. WO/2010/023311, World Intellectual Property Organization
Baresel C., Palm Cousins A., Hörsing M., Ek M., Ejhed H., Allard A-S, Magnér J., Westling K., Wahlberg C., Fortkamp U., Söhr S.2015. Pharmaceuticals residues and other emerging substances in the effluent of sewage treatment plants. IVL Swedish Environmental Research Institute, report B2226
Baresel, C., Dahlgren, L., Nikolic, A., de Kerchove, A., Almemark, M., Ek, M., Harding, M., Ottosson, E., Karlsson, J., Yang, J. 2015. Reuse of treated wastewater for non-potable use (ReUse) - Final Report. IVL Swedish Environmental Research Institute, report B2219.
Baresel C., Ek M., Harding M., Bergström R. 2014. Behandling av biologiskt renat avloppsvatten med ozon eller aktivt kol. . IVL Svenska Miljöinstitutet, Rapport B2203
Behera SH, Kim HW, Oh J-E, Park H-S. 2011. Occurrence and removal of antibiotics, hormones and several other pharmaceuticals in wastewater treatment plants of the largest industrial city of Korea. Science of The Total Environment. 409(20):4351-4360
Bell KY, Wells M, Traexlera KA, Pellegrin M-L, Morse A, Bandy J. 2011. Emerging pollutants. Water Environment Research. 83(1):1906-1984
Calza P., Sakkas V.A, Medana C., Baiocchi C., Dimou A., Pelizzetti E., Albanis T. 2006. Photocatalytic degradation study of diclofenac over aqueous TiO2 suspensions, Applied Catalysis B: Environmental, 67(3–4): 197-205
Coelho Alessandra D., Sans C., Esplugas S. & Dezotti M. 2010. Ozonation of NSAID: A Biodegradability and Toxicity Study, Ozone: Science & Engineering: The Journal of the International Ozone Association, 32(2): 91-98
ECHA, 2008. Guidance on information requirements and chemical safety assessment http://echa.europa.eu/support/guidance
Ejhed H., Magnér J., Olshammar M., Remberger M., Norström K., Lilja K., Bibi Momina. 2012. Enskilda avlopp som källa till läkemedelsrester och andra kemikalier. IVL Svenska Miljöinstitutet, Rapport B20170.
EMEA, 2006. Guideline on the Environmental Risk Assessment of Medicinal Products for Human Use, The European Agency for the Evaluation of Medicinal Products: Committee for Medicinal Products for Human Use, EMEA/CHMP/SWP/4447/00.
EPA 1999. Alternative Disinfectants and Oxidants. Guidance Manual
Eriksson L., Johansson E., Kettaneh-Wold N., Wikström C., Wold S., 2008. Design of Experiments: Principles and Applications. MKS Umetrics AB. Sweden
Oxidation of pharmaceuticals by chlorine dioxide in wastewater effluent
39
European Parliament 2013. Surface waters: 12 new controlled chemicals, three pharmaceuticals on watch list. PLENARY SESSION, Environment/Public health–02–07–2013, http://www.europarl.europa.eu/news/en/pressroom/content/20130701IPR14760/.
Falås, P., Baillon-Dhumez A., Andersen H. R., Ledin A. & la Cour Jansen, J. 2012. Suspended biofilm carrier and activated sludge removal of acidic pharmaceuticals. Water Research. 46: 1167–1175.
Falås P., Longrée P., la Cour Jansen J., Siegrist H., Hollender J., Joss A. 2013. Micropollutant removal by attached and suspended growth in a hybrid biofilm-activated sludge process. Water Research. 47(13): 4498-4506
Gros M, Petrović M, Barceló D. 2006. Development of a multi-residue analytical methodology based on liquid chromatography-tandem mass spectrometry (LC-MS/MS) for screening and trace level determination of pharmaceuticals in surface and wastewaters. Talanta. 70:678-690.
Hey G. 2013. Application of chemical oxidation processes for the removal of pharmaceuticals in biologically treated wastewater. PhD thesis, University of Lund.
Hey G. , Ledin A. , J. la Cour Jansen, Andersen H.R. 2012. Removal of pharmaceuticals in biologically treated wastewater by chlorine dioxide or peracetic acid. Environmental Technology. 33(9): 1041-1047
Hey G, Grabic R, Ledin A, J. la Cour Jansen, Andersen H.R. 2012. Oxidation of pharmaceuticals by chlorine dioxide in biologically treated wastewater, Chemical Engineering Journal. 185–186: 236-242
Hoigne J., Bader H. 1994. Kinetics of reactions of chlorine dioxide (OClO) in water—I Rate constants for inorganic and organic compounds. Water Res. 28(1): 45–55.
Hörsing M., Ledin A., Grabic R., Fick J., Tysklind M., Jansen J., Andersen H. 2011. Determination of sorption of seventy-five pharmaceuticals in sewage sludge. Water Research. 45(15): 4470-4482
Hörsing M., Whalbeg C., Falås P., Hey G., Ledin A., Jansen J. 2014. Reduktion av läkemedel i svenska avloppsreningsverk- kunskapssammanställning. (Report nr: 2014-16). Stockholm. Svenskt Vatten Utveckling.
Katz A, Narkis N. 2001. Removal of chlorine dioxide disinfection by-products by ferrous salts. Water Research. 35(1):101-108
Klavarioti M, Mantzavinos D, Kassinos D. 2009. Removal of residual pharmaceuticals from aqueous systems by advanced oxidation processes. Environment International. 35(2):402-417
Korn C, Andrews RC, Escobar MD. 2002. Development of chlorine dioxide-related by-product models for drinking water treatment. Water Research. 36(1):330-342
Läkemedelsverket 2014. Nationell läkemedelsstrategi - Handlingsplan 2014. Stockholm: Regeringskansliet.
Lee Y, Gunten U. 2010. Oxidative transformation of micropollutants during municipal wastewater treatment: Comparison of kinetic aspects of selective (chlorine, chlorine dioxide, ferrateVI, and ozone)
Raquel Alcala Borao LWR – EX – 2015:16
40
and non-selective oxidants (hydroxyl radical). Water Research. 44(2):555-566
Luo Y, Guo W, Ngo HH, Nghiem LC, Hai FI, Zhang J, Liang S, Xiaochang CW. 2014. A review on the occurrence of micropollutants in the aquatic environment and their fate and removal during wastewater treatment. Science of The Total Environment. 473–474:619-641.
Oller I, Malato S, Sánchez-Pérez JA. 2011. Combination of Advanced Oxidation Processes and biological treatments for wastewater decontamination—A review. Science of The Total Environment. 409(20): 4141-4166
Richardson S. D., Thruston Jr A. D.., Caughran T.V., Chen P.H., Collette T.W., Schenck K.M., Lykins Jr B.W.. Rav-Acha C., Glezer V. 2000. Identification of new drinking water disinfection by - products from ozone, chlorine dioxide, chloramine, and chlorine. Water, Air and Soil Pollution. 123 (1-4): 95 - 102
Rivera Palmér M. 2006. Avloppsanläggningar för 25-2000 pe – En nationell översikt. VA-Forsk, Rapport 2006-21
Rivera-Utrilla J, Sánchez-Polo M, Ferro-García MA, Prados-Joya G, Ocampo-Pérez R. 2013. Pharmaceuticals as emerging contaminants and their removal from water. A review. Chemosphere. 93(7):1268-1287
Salgado R, Marques R, Noronha JP, Carvalho G, Oehmen A, Reis MAM. 2012. Assessing the removal of pharmaceuticals and personal care products in a full-scale activated sludge plant. Environ Sci Pollut Res. 19: 1818–1827.
Santos L, Araújo AF, Pena A, Delerue-Matos C, Montenegro M.C.B.S.M. 2010. Ecotoxicological aspects related to the presence of pharmaceuticals in the aquatic environment. Journal of Hazardous Materials. 175(1-3):45-95
Sehlén, R., Malmborg, J., Baresel, C., Ek, M. Magnér, J., Allard,A-S., Yang, J. 2015. Pilotanläggning för ozonoxidation av läkemedelsrester i avloppsvatten. IVL Svenska Miljöinstitutet, Rapport B2218.
Serrano M., Montesinos I., Cardador M.J., Silva M., Gallego M. 2015. Seasonal evaluation of the presence of 46 disinfection by-products throughout a drinking water treatment plant. Science of the Total Environment. 517: 246 - 258
Sorlini S, Collivignarelli C. 2005. Chlorite removal with ferrous ions. Desalination. 176 (1-3): 267-271
Ternes T. 1998. Ocurrence of drugs in german sewage treatment plants and rivers. Wat. Res. 32 (11): 3245-3260
Tsai Y-T, Chang J-H , Chang C-Y, Hsieh Y-H, Shen S-Y. 2014. Efficiency and mechanisms of chlorine dioxide generation by electrocatalytical process. Journal of the Taiwan Institute of Chemical Engineers 45: 404–410
Veschetti E, Cittadini ., Maresca D, Citti ., Ottaviani M. 2004. Inorganic by-products in waters disinfected with chlorine dioxide. Microchemical Journal 79:165– 170
Vona A, Martino F, Garcia-Ivars J, Picó Y, Mendoza-Roca J-A, Iborra-Clar M-I.. 2015. Comparison of different removal techniques for selected pharmaceuticals. Journal of Water Process Engineering. 5:48-57
Oxidation of pharmaceuticals by chlorine dioxide in wastewater effluent
41
Wahlberg, C., Björlenius, B., Paxéus, N. 2010. Läkemedelsrester i Stockholms vattenmiljö - Förekomst, förebyggande åtgärder och rening av avloppsvatten. (Report nr: 2010-16). Stockholm: Stockholm Vatten.
Wang Y., Liu H., Liu G., Xie Y. 2014. Oxidation of diclofenac by aqueous chlorine dioxide: Identification of major disinfection byproducts and toxicity evaluation. Science of The Total Environment. 473–474: 437-445
World Health Organization (WHO), 2012. Pharmaceuticals in drinking-water.
World Health Organization (WHO). 2004. Environmental Health Criteria 216: Disinfectants and Disinfectant By-products. Geneva.
Yangali-Quintanilla V, Maeng SK, Fujioka T, Kennedy M, Li Z, Amy G. 2011. Nanofiltration vs.reverse osmosis for the removal of emerging organic contaminants in water reuse. Desalin Water Treat .34:50–6.
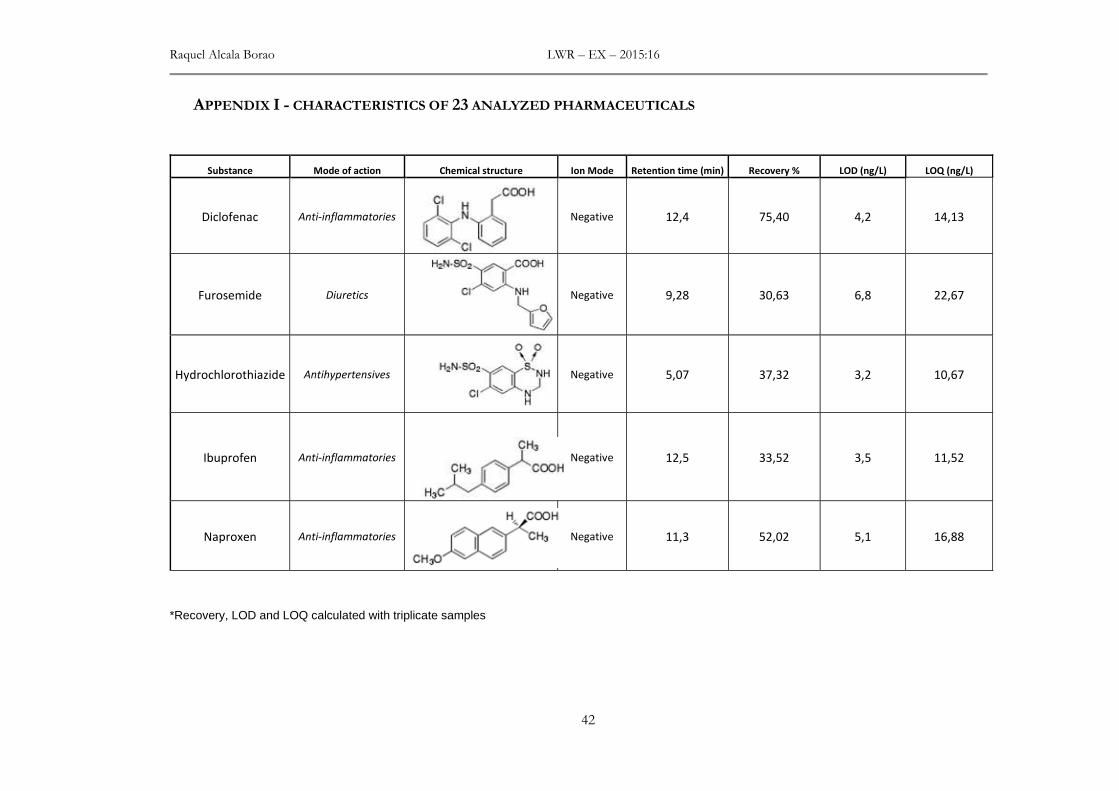
Raquel Alcala Borao LWR – EX – 2015:16
42
APPENDIX I - CHARACTERISTICS OF 23 ANALYZED PHARMACEUTICALS
Substance Mode of action Chemical structure Ion Mode Retention time (min) Recovery % LOD (ng/L) LOQ (ng/L)
Diclofenac Anti-inflammatories
Negative 12,4 75,40 4,2 14,13
Furosemide Diuretics
Negative 9,28 30,63 6,8 22,67
Hydrochlorothiazide Antihypertensives
Negative 5,07 37,32 3,2 10,67
Ibuprofen Anti-inflammatories
Negative 12,5 33,52 3,5 11,52
Naproxen Anti-inflammatories
Negative 11,3 52,02 5,1 16,88
*Recovery, LOD and LOQ calculated with triplicate samples

Oxidation of pharmaceuticals by chlorine dioxide in wastewater effluent
43
Substance Mode of action Chemical structure Ion Mode Retention time (min) Recovery % LOD (ng/L) LOQ (ng/L)
Ramipril Antihypertensives
Negative 10,8 85,24 2,6 8,82
Warfarin Anticoagulants
Negative 11,4 146,67 2,2 7,45
Atenolol Antihypertensives
Positive 4,56 81,70 4,5 15,03
Amlodipine Antihypertensives
Positive 8,91 29,01 1,8 6,03
Bisoprolol Antihypertensives
Positive 7,51 114,64 1,3 4,25
*Recovery, LOD and LOQ calculated with triplicate samples
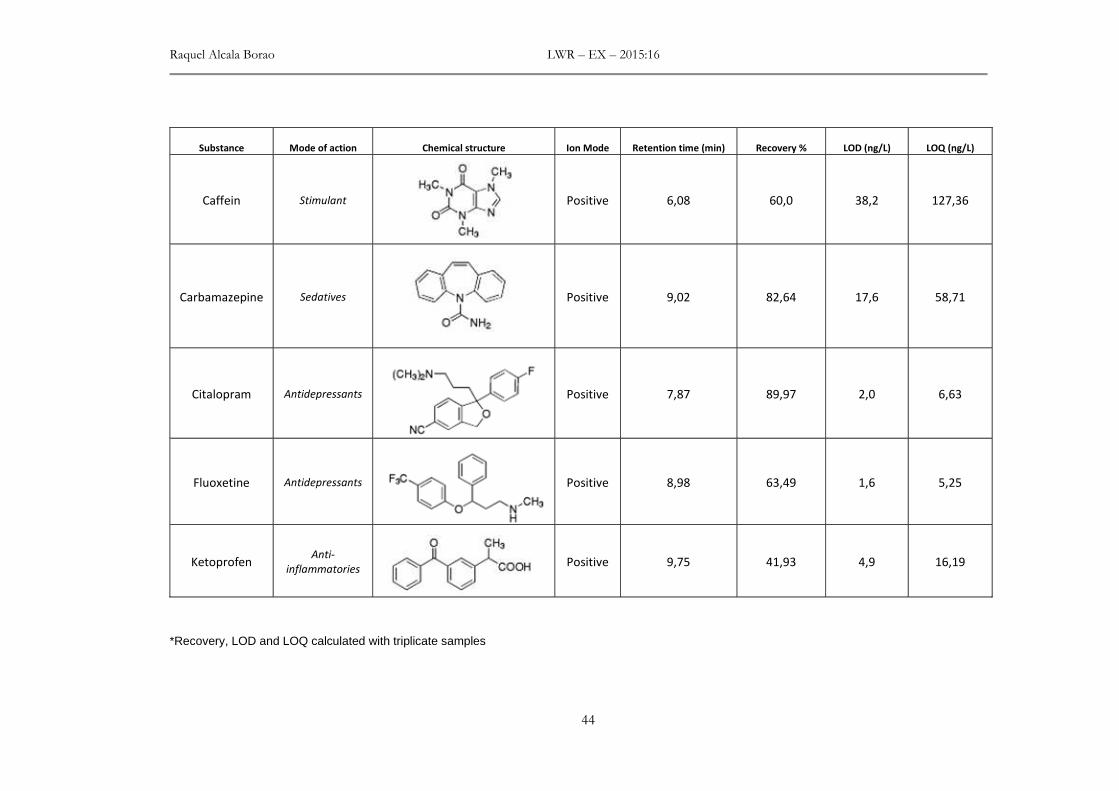
Raquel Alcala Borao LWR – EX – 2015:16
44
Substance Mode of action Chemical structure Ion Mode Retention time (min) Recovery % LOD (ng/L) LOQ (ng/L)
Caffein
Stimulant
Positive 6,08 60,0 38,2 127,36
Carbamazepine Sedatives
Positive 9,02 82,64 17,6 58,71
Citalopram Antidepressants
Positive 7,87 89,97 2,0 6,63
Fluoxetine Antidepressants
Positive 8,98 63,49 1,6 5,25
Ketoprofen Anti-
inflammatories
Positive 9,75 41,93 4,9 16,19
*Recovery, LOD and LOQ calculated with triplicate samples
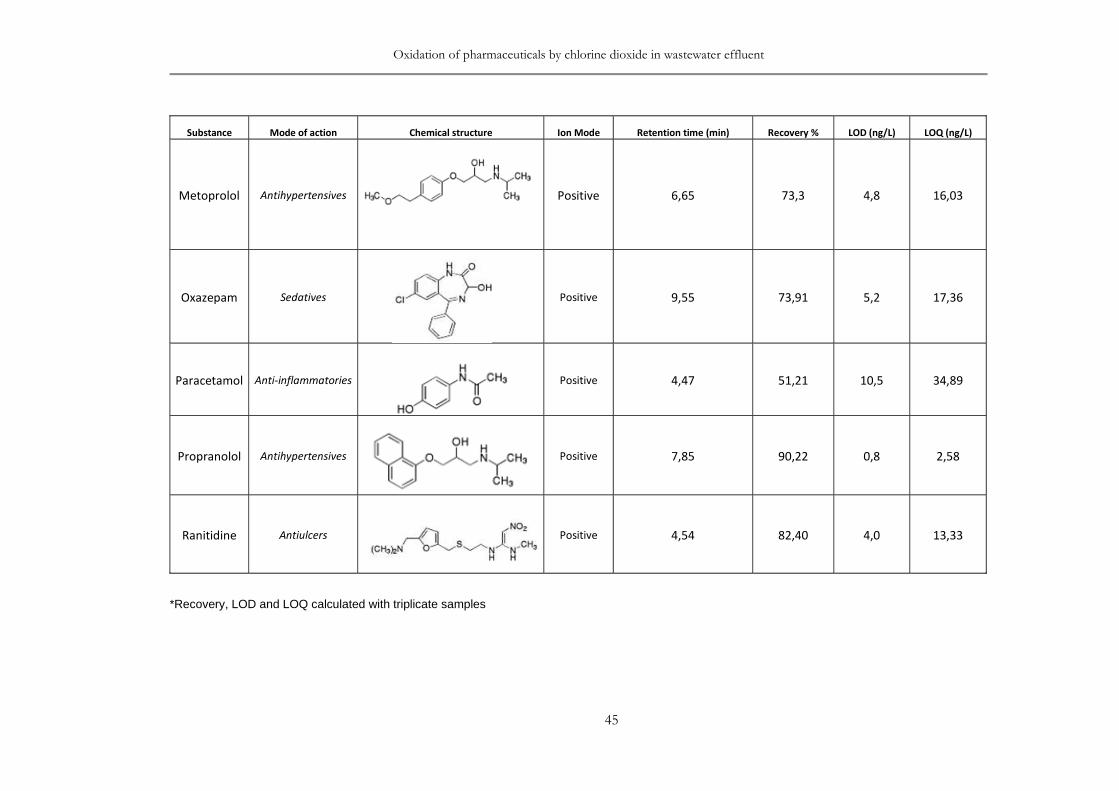
Oxidation of pharmaceuticals by chlorine dioxide in wastewater effluent
45
Substance Mode of action Chemical structure Ion Mode Retention time (min) Recovery % LOD (ng/L) LOQ (ng/L)
Metoprolol Antihypertensives
Positive 6,65 73,3 4,8 16,03
Oxazepam Sedatives
Positive 9,55 73,91 5,2 17,36
Paracetamol Anti-inflammatories
Positive 4,47 51,21 10,5 34,89
Propranolol Antihypertensives
Positive 7,85 90,22 0,8 2,58
Ranitidine Antiulcers
Positive 4,54 82,40 4,0 13,33
*Recovery, LOD and LOQ calculated with triplicate samples

Raquel Alcala Borao LWR – EX – 2015:16
46
Substance Mode of action Chemical structure Ion Mode Retention time (min) Recovery % LOD (ng/L) LOQ (ng/L)
Risperidone Antipsychotic
Positive 7,36 133,86 2,2 7,37
Sertralin Antidepressants
Positive 9,19 51,81 2,0 6,65
Simvastatin Lipid-regulating
Positive 11,6 47,46 1,99 6,66
Terbutaline Asthma
medication
Positive 4,44 53,56 2,6 8,80
*Recovery, LOD and LOQ calculated with triplicate samples
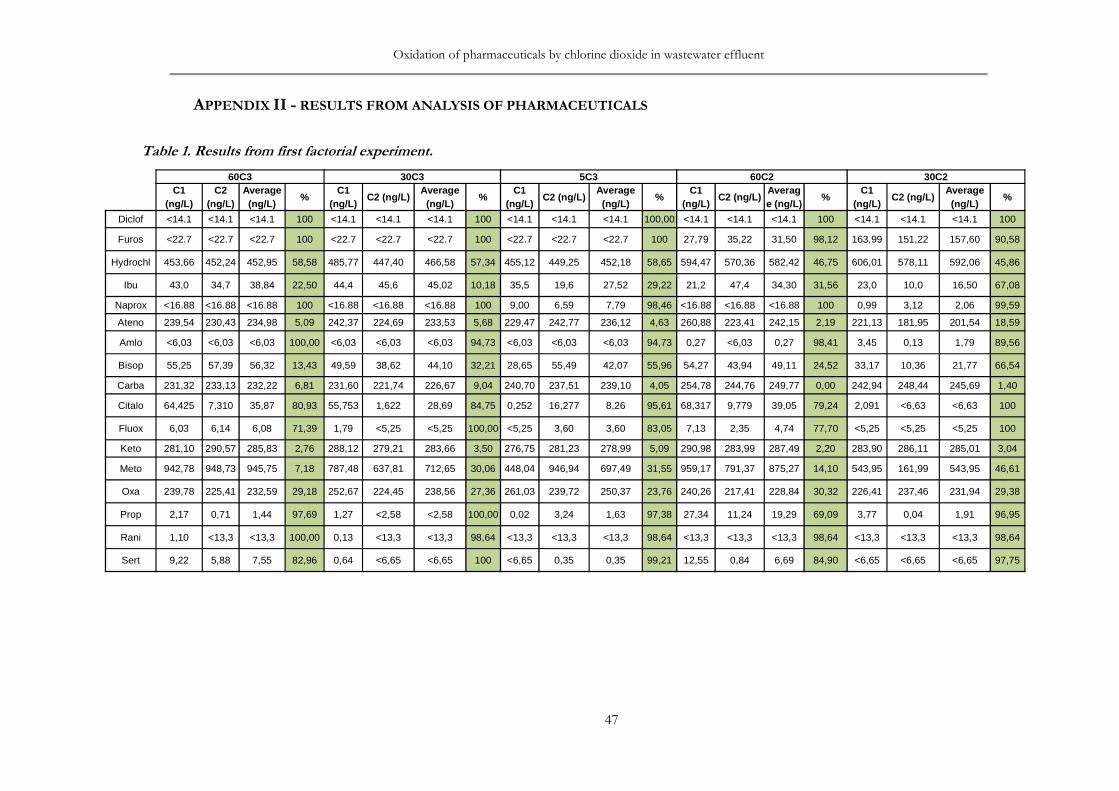
Oxidation of pharmaceuticals by chlorine dioxide in wastewater effluent
47
APPENDIX II - RESULTS FROM ANALYSIS OF PHARMACEUTICALS
Table 1. Results from first factorial experiment.
60C3 30C3 5C3 60C2 30C2C1
(ng/L)C2
(ng/L)Average (ng/L)
%C1
(ng/L)C2 (ng/L)
Average (ng/L)
%C1
(ng/L)C2 (ng/L)
Average (ng/L)
%C1
(ng/L)C2 (ng/L)
Average (ng/L)
%C1
(ng/L)C2 (ng/L)
Average (ng/L)
%
Diclof <14.1 <14.1 <14.1 100 <14.1 <14.1 <14.1 100 <14.1 <14.1 <14.1 100,00 <14.1 <14.1 <14.1 100 <14.1 <14.1 <14.1 100
Furos <22.7 <22.7 <22.7 100 <22.7 <22.7 <22.7 100 <22.7 <22.7 <22.7 100 27,79 35,22 31,50 98,12 163,99 151,22 157,60 90,58
Hydrochl 453,66 452,24 452,95 58,58 485,77 447,40 466,58 57,34 455,12 449,25 452,18 58,65 594,47 570,36 582,42 46,75 606,01 578,11 592,06 45,86
Ibu 43,0 34,7 38,84 22,50 44,4 45,6 45,02 10,18 35,5 19,6 27,52 29,22 21,2 47,4 34,30 31,56 23,0 10,0 16,50 67,08
Naprox <16.88 <16.88 <16.88 100 <16.88 <16.88 <16.88 100 9,00 6,59 7,79 98,46 <16.88 <16.88 <16.88 100 0,99 3,12 2,06 99,59
Ateno 239,54 230,43 234,98 5,09 242,37 224,69 233,53 5,68 229,47 242,77 236,12 4,63 260,88 223,41 242,15 2,19 221,13 181,95 201,54 18,59
Amlo <6,03 <6,03 <6,03 100,00 <6,03 <6,03 <6,03 94,73 <6,03 <6,03 <6,03 94,73 0,27 <6,03 0,27 98,41 3,45 0,13 1,79 89,56
Bisop 55,25 57,39 56,32 13,43 49,59 38,62 44,10 32,21 28,65 55,49 42,07 55,96 54,27 43,94 49,11 24,52 33,17 10,36 21,77 66,54
Carba 231,32 233,13 232,22 6,81 231,60 221,74 226,67 9,04 240,70 237,51 239,10 4,05 254,78 244,76 249,77 0,00 242,94 248,44 245,69 1,40
Citalo 64,425 7,310 35,87 80,93 55,753 1,622 28,69 84,75 0,252 16,277 8,26 95,61 68,317 9,779 39,05 79,24 2,091 <6,63 <6,63 100
Fluox 6,03 6,14 6,08 71,39 1,79 <5,25 <5,25 100,00 <5,25 3,60 3,60 83,05 7,13 2,35 4,74 77,70 <5,25 <5,25 <5,25 100
Keto 281,10 290,57 285,83 2,76 288,12 279,21 283,66 3,50 276,75 281,23 278,99 5,09 290,98 283,99 287,49 2,20 283,90 286,11 285,01 3,04
Meto 942,78 948,73 945,75 7,18 787,48 637,81 712,65 30,06 448,04 946,94 697,49 31,55 959,17 791,37 875,27 14,10 543,95 161,99 543,95 46,61
Oxa 239,78 225,41 232,59 29,18 252,67 224,45 238,56 27,36 261,03 239,72 250,37 23,76 240,26 217,41 228,84 30,32 226,41 237,46 231,94 29,38
Prop 2,17 0,71 1,44 97,69 1,27 <2,58 <2,58 100,00 0,02 3,24 1,63 97,38 27,34 11,24 19,29 69,09 3,77 0,04 1,91 96,95
Rani 1,10 <13,3 <13,3 100,00 0,13 <13,3 <13,3 98,64 <13,3 <13,3 <13,3 98,64 <13,3 <13,3 <13,3 98,64 <13,3 <13,3 <13,3 98,64
Sert 9,22 5,88 7,55 82,96 0,64 <6,65 <6,65 100 <6,65 0,35 0,35 99,21 12,55 0,84 6,69 84,90 <6,65 <6,65 <6,65 97,75

Raquel Alcala Borao LWR – EX – 2015:16
48
Table 1 (cont.). Results from first factorial experiment.
5C2 60C1 30C1 5C1 No treatment1
(ng/L)2
(ng/L)Final (ng/L)
%1
(ng/L)2
(ng/L)Final (ng/L)
%1
(ng/L)2
(ng/L)Final (ng/L)
%1
(ng/L)2
(ng/L)Final (ng/L)
%1
(ng/L)2
(ng/L)3
(ng/L)Average (ng/L)
Diclof <14.1 <14.1 <14.1 100 430,98 329,27 380,13 29,40 329,18 385,75 357,47 33,61 284,79 340,21 312,50 41,96 450,97 576,86 587,44 538,42
Furos 502,01 356,58 429,30 74,34 964,05 897,73 930,89 44,361017,1
31168,3
11092,7
234,69
1017,89
1294,83
1156,36
30,891408,9
01812,3
81798,3
31673,20
Hydrochl
589,32 584,27 586,79 46,351404,3
71616,0
51510,2
10,00
1581,32
1416,81
1499,06
0,001296,4
31505,6
71401,0
50,00 931,64
1199,59
1149,71
1093,65
Ibu 11,6 29,4 20,53 59,04 40,1 29,3 34,69 30,78 42,3 29,6 35,92 28,34 29,6 37,6 33,58 33,00 24,26 32,89 50,12 50,12
Naprox 76,53 43,64 60,09 88,14 342,85 343,12 342,98 32,30 363,73 378,94 371,33 26,71 318,44 377,05 347,74 31,36 387,22 561,70 571,04 506,65
Ateno 226,35 243,40 234,88 5,13 259,31 237,83 248,57 0,00 148,87 249,57 199,22 19,53 109,62 73,06 109,62 55,72 181,78 247,58 234,95 247,58
Amlo 0,71 <6,03 0,71 95,84 28,69 4,99 16,84 1,96 13,10 0,17 6,64 61,36 5,32 6,84 6,08 64,62 15,38 18,14 18,01 17,18
Bisop 40,27 21,74 31,01 52,34 52,89 35,97 44,43 31,70 10,12 55,46 32,79 49,60 6,86 0,14 3,50 94,62 59,91 68,42 66,84 65,06
Carba 244,91 236,79 240,85 3,34 258,97 254,74 256,86 0,00 263,62 266,58 265,10 0 199,18 267,00 233,09 6,46 212,54 259,83 275,19 249,19
Citalo 4,292 <6,63 4,29 97,72 34,361 14,390 24,38 87,04 0,295 71,181 35,74 81,00 0,160 <6,63 0,16 99,91 175,08 194,05 195,25 188,13
Fluox 1,01 <5,25 1,01 95,22 14,07 7,73 10,90 48,73 5,73 15,12 10,43 50,95 5,38 7,73 6,55 69,17 20,40 22,39 20,97 21,26
Keto 273,78 268,86 271,32 7,70 285,41 304,14 294,77 0,00 304,75 296,68 300,72 0 246,86 308,09 277,48 5,60 228,41 322,45 331,00 293,95
Meto 645,07 355,10 500,09 50,92 888,06 571,38 729,72 28,38 147,76 913,53 530,64 47,92 107,28 107,28 89,47 903,791089,0
91063,8
91018,92
Oxa 244,18 234,60 239,39 27,11 294,22 303,02 298,62 9,07 309,28 314,81 312,04 4,99 234,35 321,17 277,76 15,43 292,59 348,24 344,43 328,42
Prop 5,61 <2,58 5,61 91,01 25,87 7,14 16,51 73,55 0,43 29,26 14,85 76,21 0,26 <2,58 0,26 99,58 58,01 66,19 63,03 62,41
Rani <13,3 <13,3 <13,3 98,64 0,87 1,93 1,40 99,05 <13,3 3,07 3,07 97,91 <13,3 <13,3 <13,3 98,64 128,09 183,15 129,75 147,00
Sert <6,65 <6,65 <6,65 97,75 2,75 0,04 1,40 96,85 <6,65 6,53 6,53 85,27 <6,65 <6,65 <6,65 97,75 42,02 43,93 46,98 44,31

Oxidation of pharmaceuticals by chlorine dioxide in wastewater effluent
49
Table 2. Results from second factorial experiment.
60C3 30C3 5C3 60C2 30C2 5C2 60C1 30C1 5C1 No treated
(ng/L)
C
(ng/L) % C
(ng/L) % C
(ng/L) % C
(ng/L) % C
(ng/L) % C
(ng/L) % C
(ng/L) % C
(ng/L) % C
(ng/L) %
Diclof <13.01 100 <13.01 100 <13.01 100 <13.01 100,0
0 <13.01 100 <13.01 100 <13.01 100,0
0 <13.01 100,00 <13.01 100,00 772,90
Furos <10,61 100 5,52 99,38 29,88 96,64 <10,61 100,00
75,42 91,51 178,38 79,93 291,10 67,24 340,24 61,71 173,58 80,47 888,7
Hydrochl 251,68 71,46 438,45 50,28 384,07 56,44 335,20 61,99 490,60 44,36 476,19 46,00 915,01 0,00 834,94 5,31
1964,51 0,00 881,77
Naprox <11,36 100,0
0 <11,36 100,0
0 <11,36 100,0
0 <11,36 100,0
0 <11,36 100 31,68 95,08 57,32 91,10 134,45 79,14 37,96 94,11 644,41
Ateno 154,21 28,39 242,73 0,00 198,10 8,01 132,60 38,43 187,11 13,11 192,32 10,69 222,82 0,00 171,35 20,43 261,46 0,00 215,34
Amlo <7,48 100,00
<7,48 100,00
<7,48 100,00
<7,48 100,00
<7,48 100,00
<7,48 100,00
<7,48 100,00
<7,48 100,00 <7,48 100,00 18,40
Bisop <2,07 100,0
0 0,67 98,94 0,80 98,73 <2,07 100,0
0 <2,07 100 0,00 100,0
0 0,21 99,66 <2,07 100,00 3,24 94,85 62,91
Carba 243,32 24,13 354,91 0,00 227,89 28,94 56,26 82,46 253,23 21,04 195,01 39,19 387,37 0,00 361,14 0 272,76 14,95 320,71
Citalo <3,89 100,00
<3,89 100,00
0,08 99,96 <3,89 100,00
<3,89 100 <3,89 100,00
<3,89 100,00
<3,89 100,00 <3,89 100,00 214,76
Fluox <7,12 100,0
0 <7,12 100,0
0 <7,12 100,0
0 <7,12 100,0
0 <7,12 100,0
0 <7,12 100,0
0 <7,12 100,0
0 <7,12 100,00 <7,12 100,00 15,10
Keto 332,41 0,00 351,74 0,00 218,36 30,98 61,39 80,60 221,16 30,10 162,75 48,56 361,43 0,00 324,03 0 343,22 0,00 316,38
Meto <12,3 100,0
0 22,85 97,70 25,20 97,46 1,17 99,88 0,36 99,96 4,34 99,56 7,50 99,24 <12,3 100,00 21,54 97,83 993,07
Oxa 253,29 33,11 379,21 0,00 122,46 67,66 38,84 89,74 187,28 50,54 148,65 60,74 422,17 0,00 387,44 0 327,45 13,52 378,65
Prop <3,01 100,00
<3,01 100,00
<3,01 100,00
<3,01 100,00
<3,01 100 <3,01 100 <3,01 100,00
<3,01 100 2,34 95,98 58,02
Sert <3,37 100,0
0 <3,37 100,0
0 <3,37 100,0
0 <3,37 100,0
0 <3,37 100 <3,37 100 <3,37 100,0
0 <3,37 100 5,85 84,97 38,88
**C3 = 15mg/L ClO2; C2 = 10 mg/L ClO2; C1 = 4 mg/L ClO2
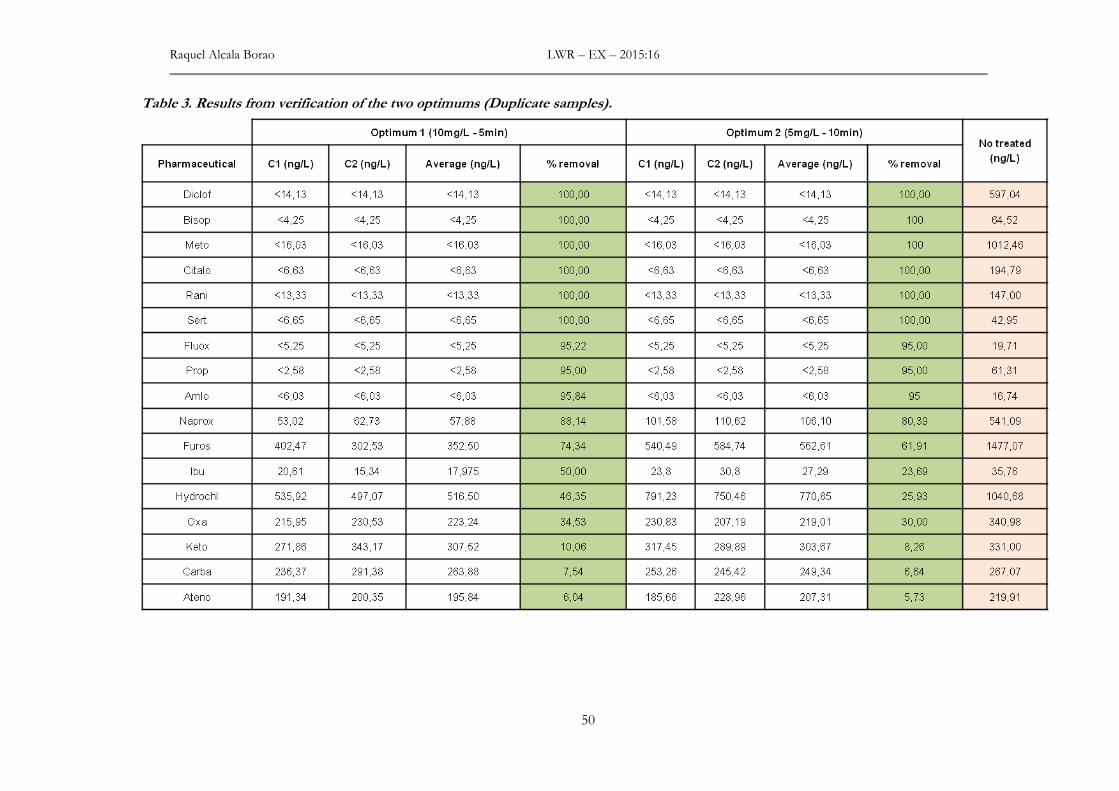
Raquel Alcala Borao LWR – EX – 2015:16
50
Table 3. Results from verification of the two optimums (Duplicate samples).
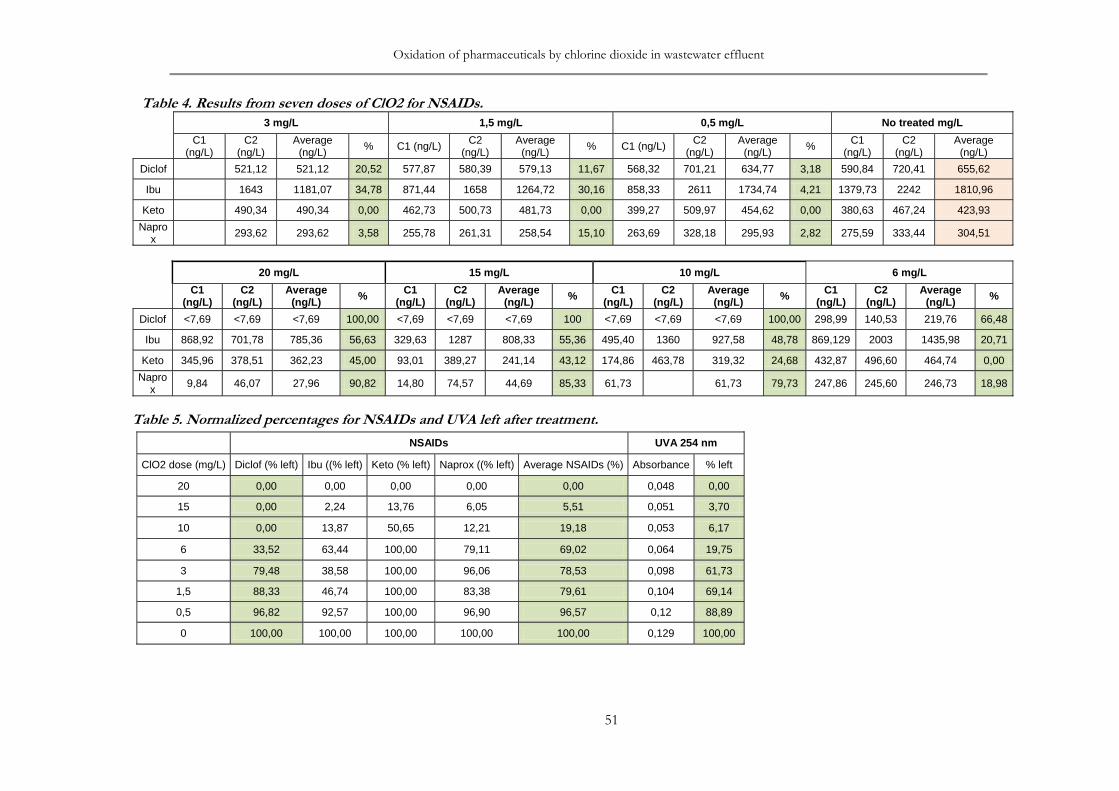
Oxidation of pharmaceuticals by chlorine dioxide in wastewater effluent
51
Table 4. Results from seven doses of ClO2 for NSAIDs.
3 mg/L 1,5 mg/L 0,5 mg/L No treated mg/L
C1 (ng/L)
C2 (ng/L)
Average (ng/L)
% C1 (ng/L) C2 (ng/L)
Average (ng/L)
% C1 (ng/L) C2 (ng/L)
Average (ng/L)
% C1 (ng/L)
C2 (ng/L)
Average (ng/L)
Diclof 521,12 521,12 20,52 577,87 580,39 579,13 11,67 568,32 701,21 634,77 3,18 590,84 720,41 655,62
Ibu 1643 1181,07 34,78 871,44 1658 1264,72 30,16 858,33 2611 1734,74 4,21 1379,73 2242 1810,96
Keto 490,34 490,34 0,00 462,73 500,73 481,73 0,00 399,27 509,97 454,62 0,00 380,63 467,24 423,93
Naprox
293,62 293,62 3,58 255,78 261,31 258,54 15,10 263,69 328,18 295,93 2,82 275,59 333,44 304,51
20 mg/L 15 mg/L 10 mg/L 6 mg/L
C1
(ng/L) C2
(ng/L) Average
(ng/L) % C1 (ng/L)
C2 (ng/L)
Average (ng/L) % C1
(ng/L) C2
(ng/L) Average
(ng/L) % C1 (ng/L)
C2 (ng/L)
Average (ng/L) %
Diclof <7,69 <7,69 <7,69 100,00 <7,69 <7,69 <7,69 100 <7,69 <7,69 <7,69 100,00 298,99 140,53 219,76 66,48
Ibu 868,92 701,78 785,36 56,63 329,63 1287 808,33 55,36 495,40 1360 927,58 48,78 869,129 2003 1435,98 20,71
Keto 345,96 378,51 362,23 45,00 93,01 389,27 241,14 43,12 174,86 463,78 319,32 24,68 432,87 496,60 464,74 0,00
Naprox
9,84 46,07 27,96 90,82 14,80 74,57 44,69 85,33 61,73
61,73 79,73 247,86 245,60 246,73 18,98
Table 5. Normalized percentages for NSAIDs and UVA left after treatment.
NSAIDs UVA 254 nm
ClO2 dose (mg/L) Diclof (% left) Ibu ((% left) Keto (% left) Naprox ((% left) Average NSAIDs (%) Absorbance % left
20 0,00 0,00 0,00 0,00 0,00 0,048 0,00
15 0,00 2,24 13,76 6,05 5,51 0,051 3,70
10 0,00 13,87 50,65 12,21 19,18 0,053 6,17
6 33,52 63,44 100,00 79,11 69,02 0,064 19,75
3 79,48 38,58 100,00 96,06 78,53 0,098 61,73
1,5 88,33 46,74 100,00 83,38 79,61 0,104 69,14
0,5 96,82 92,57 100,00 96,90 96,57 0,12 88,89
0 100,00 100,00 100,00 100,00 100,00 0,129 100,00
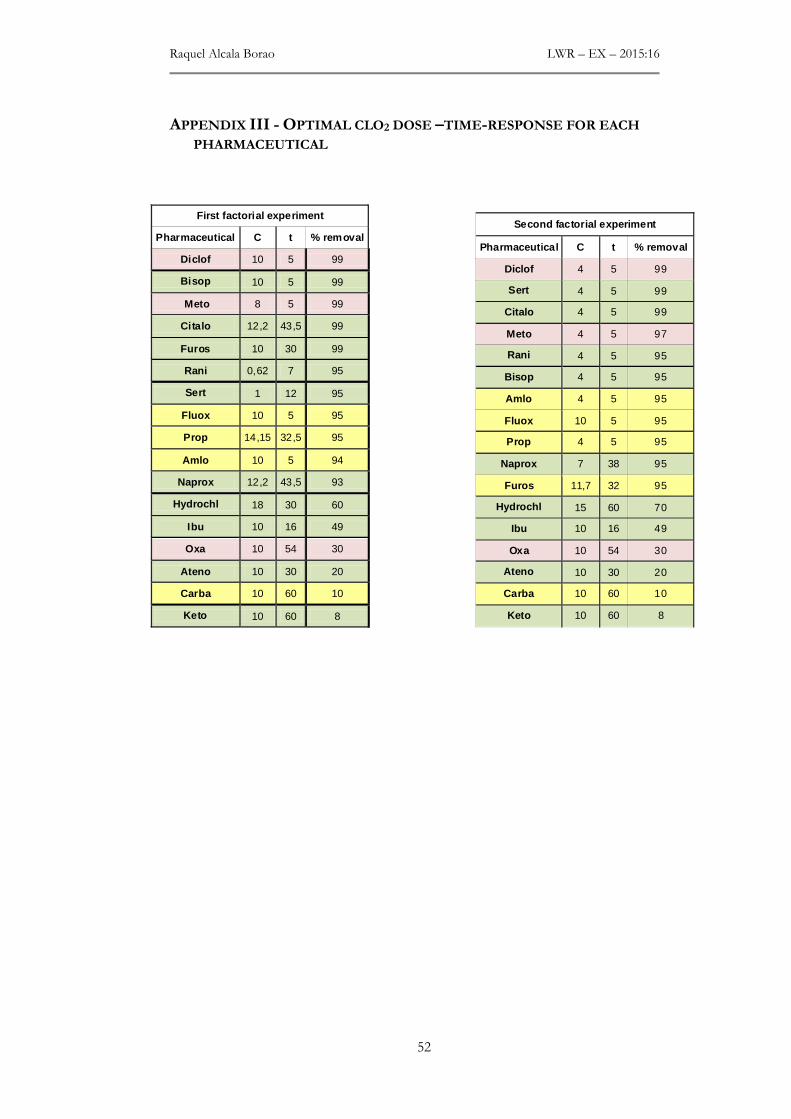
Raquel Alcala Borao LWR – EX – 2015:16
52
APPENDIX III - OPTIMAL CLO2 DOSE –TIME-RESPONSE FOR EACH
PHARMACEUTICAL
First factorial experiment
Pharmaceutical C t % removal
Diclof 10 5 99
Bisop 10 5 99
Meto 8 5 99
Citalo 12,2 43,5 99
Furos 10 30 99
Rani 0,62 7 95
Sert 1 12 95
Fluox 10 5 95
Prop 14,15 32,5 95
Amlo 10 5 94
Naprox 12,2 43,5 93
Hydrochl 18 30 60
Ibu 10 16 49
Oxa 10 54 30
Ateno 10 30 20
Carba 10 60 10
Keto 10 60 8
Second factorial experiment
Pharmaceutical C t % removal
Diclof 4 5 99
Sert 4 5 99
Citalo 4 5 99
Meto 4 5 97
Rani 4 5 95
Bisop 4 5 95
Amlo 4 5 95
Fluox 10 5 95
Prop 4 5 95
Naprox 7 38 95
Furos 11,7 32 95
Hydrochl 15 60 70
Ibu 10 16 49
Oxa 10 54 30
Ateno 10 30 20
Carba 10 60 10
Keto 10 60 8