rascal version 2.1 workbook
TRANSCRIPT
NUREG/CR-5247 Vol. 2, Rev. 2
RASCAL Version 2.1 Workbook
Manuscript Completed: December 1994 Date Published: December 1994
Prepared by G. F. Athey, A. L. Sjoreen,1 T. J. McKenna2
Athey Consulting P.O. Box 178 Charlestown, WV 25414
Prepared for Incident Response Division Office for Analysis and Evaluation of Operational Data U.S. Nuclear Regulatory Commission Washington, DC 20555-0001 NRC Job Code E8211
!Oak Ridge National Laboratory, Oak Ridge, TN 37831-6285 'BBffHu 2 S l°*M I 2U.S. Nuclear Regulatory Commission, Washington, D.C. 20555-0001 a " # Q f j Lq
nmmm\m or vm DOCUMENT IS mmm

DISCLAIMER
This report was prepared as an account of work sponsored by an agency of the United States Government. Neither the United States Government nor any agency thereof, nor any of their employees, make any warranty, express or implied, or assumes any legal liability or responsibility for the accuracy, completeness, or usefulness of any information, apparatus, product, or process disclosed, or represents that its use would not infringe privately owned rights. Reference herein to any specific commercial product, process, or service by trade name, trademark, manufacturer, or otherwise does not necessarily constitute or imply its endorsement, recommendation, or favoring by the United States Government or any agency thereof. The views and opinions of authors expressed herein do not necessarily state or reflect those of the United States Government or any agency thereof.

DISCLAIMER
Portions of this document may be illegible in electronic image products. Images are produced from the best available original document.
///
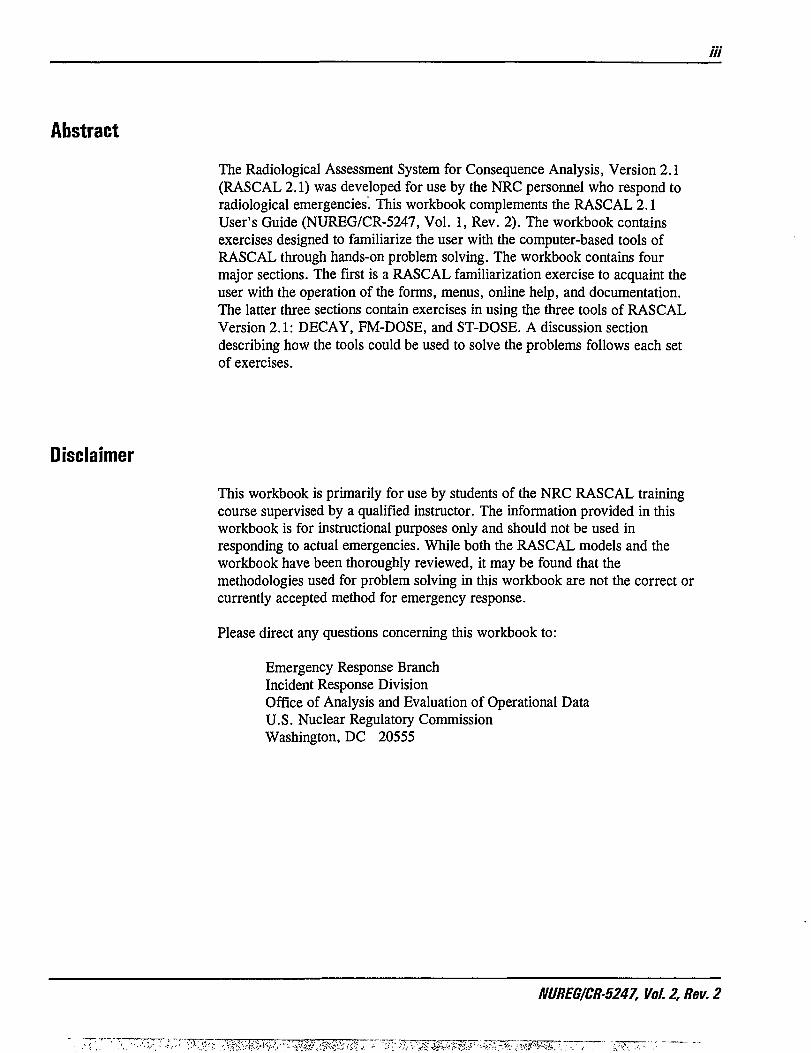
Abstract
The Radiological Assessment System for Consequence Analysis, Version 2.1 (RASCAL 2.1) was developed for use by the NRC personnel who respond to radiological emergencies. This workbook complements the RASCAL 2.1 User's Guide (NUREG/CR-5247, Vol. 1, Rev. 2). The workbook contains exercises designed to familiarize the user with the computer-based tools of RASCAL through hands-on problem solving. The workbook contains four major sections. The first is a RASCAL familiarization exercise to acquaint the user with the operation of the forms, menus, online help, and documentation. The latter three sections contain exercises in using the three tools of RASCAL Version 2.1: DECAY, FM-DOSE, and ST-DOSE. A discussion section describing how the tools could be used to solve the problems follows each set of exercises.
Disclaimer
This workbook is primarily for use by students of the NRC RASCAL training course supervised by a qualified instructor. The information provided in this workbook is for instructional purposes only and should not be used in responding to actual emergencies. While both the RASCAL models and the workbook have been thoroughly reviewed, it may be found that the methodologies used for problem solving in this workbook are not the correct or currently accepted method for emergency response.
Please direct any questions concerning this workbook to:
Emergency Response Branch Incident Response Division Office of Analysis and Evaluation of Operational Data U.S. Nuclear Regulatory Commission Washington, DC 20555
NUREG/CR-5247, Vol. 2, Rev. 2
iv RASCAL 2.1 Workbook
This Page Intentionally Left Blank
NUREG/CR-5247, Vol. 2, Rev. 2

V
Table of Contents
Abstract iii
Acknowledgements vi
Introduction 1
Exercise Title Reference Tables 2
Dose Consequences and Protective Actions 5
RASCAL Familiarization Questions 9
Answers to RASCAL Familiarization Questions 11
DECAY Exercises 13
DECAY Exercise Discussions 14
FM-DOSE Exercises 17
FM-DOSE Exercise Discussions 20
ST-DOSE Exercises 39
ST-DOSE Exercise Discussions 50
Things To Think About 137
References 138
NUREG/CR-5247, Vol. 2, Rev. 2
vi RASCAL 2.1 Workbook
Acknowledgements
The authors would like to acknowledge all the students who used the various draft versions of the workbook during its development. Your comments and suggestions were very helpful.
NUREG/CR-5247, Vol. 2, Rev. 2

Introduction 1
Introduction
The RASCAL Version 2.1 Workbook complements the NRC's Response Computer System (RCS) Procedures Manual and the RASCAL 2.1 User's Guide. The workbook contains exercises designed to familiarize the user with the computer based tools of RASCAL through hands-on problem solving. The exercises described within were developed using the September 1994 revision of the RASCAL Version 2.1 software. The workbook may be used with other revisions of the software. However, the results from working the exercises may appear different from those in the workbook.
This workbook contains four major sections. The first part is a RASCAL familiarization exercise to acquaint you with the operation of the forms, menus, on-line help, and documentation. The familiarization questions begin on page 9. The latter three parts contain exercises in using the three tools of RASCAL Version 2.1: DECAY, FM-DOSE, and ST-DOSE. The table on the following page lists the topics addressed by the problems and references the page numbers of the problem statements and discussions.
The problem statements for each separate tool are grouped together. Problems are always numbered sequentially within the section. A section of problems is always followed by the section of discussion.
Attempt to do each exercise using the computer and answer all the associated questions. A description of how the problem may be solved and a discussion of the results are found at the end of the sections. Some of the problems may require access to other NRC Response Computer System software. Non-NRC persons may have to skip those exercises.
When working the problems, the following references will be helpful:
1. the action priority list and the dose/consequence table on pages 5 and 6 2. RTM-93, Response Technical Manual, NUREG/BR-1050, Vol. 1,
Rev. 3 3. EPA Manual of Protective Action Guides and Protective Actions for
Nuclear Incidents (EPA 400-R-92-001, 1992) 4. RASCAL Version 2.1 User's Guide, NUREG/CR-5247, Vol. 1,
Rev. 2
NUREG/CR-5247, Vol. 2, Rev. 2
'^'•r'-Wm-7W^^B

2 RASCAL 2.1Workbook
Exercise Title Reference Tables
DECAY Exercises Page Numbers
No. Title Exercise Discussion
1 Decay of 1 3 7Cs 13 15
2 Decay of 1 3 2I 13 15
3 Decay of 8 8Kr 13 16
FM-DOSE Exercises Page Numbers
No. Title Exercise Discussion
1 Dose from Ground Concentration 17 20
2 Increased Ground Surface Correction Factor 17 24
3 Resuspension Dose 17 27
4 Doses from Tritium Release 18 32
5 Doses from Polonium Release 18 34
6 First Year Dose from Meter Reading 18 36
7 Re-entry Delay 19 38
ST-DOSE Exercises Page Numbers
No. Title Exercise Discussion
1 End of Exposure (calculation time) 39 50
2 Shutdown Time 39 54
3 Holdup Time 40 58
4 Core Damage 40 62
5 Containment Break Size 41 66
6 Reduction Mechanisms (sprays) 41 70
NUREG/CR-5247, Vol. 2, Rev. 2

Introduction 3
ST-DOSE Exercises continued Page Numbers
No. Title Exercise Discussion
7 Wind Speed and Inhalation Dose 42 73
8 Calm Winds 42 75
9 Precipitation 42 78
10 Rain Created Hot Spot 43 81
11 Stability Class 43 84
12 Elevated Release 44 89
13 Release Above Mixed Layer 44 92
14 Wind Shift 45 95
15 SGTR Coolant 45 99
16 Plutonium Release 46 101
17 Noble Gas Only Release 46 104
18 Analyst Specified Mix 46 106
19 Dry Well / Wet Well 46 109
20 Three Mile Island 47 111
21 Isotopic Release 47 116
22 Containment Sample vs. Rad Monitor 48 121
23 Wet Well Rad Monitor 48 125
24 Spent Fuel Accident - Closed Plant 48 127
25 Spent Fuel Accident During Refueling 48 130
26 Laboratory Explosion 49 132
27 Actual Meteorological Conditions 49 136
28 Save Results to RCS Network 49 136
NUREG/CR-5247, Vol. 2, Rev. 2

4 RASCAL 2.1 Workbook
This Page Intentionally Left Blank
NUREG/CR-5247, Vol. 2, Rev. 2
Introduction 5
Dose Consequences and Protective Actions
The table on the following page summarizes the consequences and recommended protective actions for the various dose calculations available in the RASCAL ST-DOSE and FM-DOSE models. The priorities for taking protective action are:
1. Take action to avoid doses that can result in early health effects. These actions are based on core conditions. See the figure on page 1-4 of RTM-93.
2. Implement action in accordance with EPA early-phase PAGs. These actions are based on dose projections and field monitoring.
3. Implement EPA intermediate-phase and ingestion PAGs. These actions are typically based on environmental measurements.
When possible, steps 1 and 2 should be taken simultaneously.
This workbook focuses on assessing protective action based on dose projections (RASCAL models) to address priority 2 above. For comparison with EPA early-phase PAGs the projected dose is based on exposure during the first four days following the start of the release. As stated in the PAG Manual (EPA, 1992), "The objective is to encompass the entire period of exposure to the plume and to deposited material..." However, as indicated in Section I of the RTM, whenever severe core damage (gap release or greater) exists or is projected, protective actions should be taken based on an assessment of core condition alone. A dose projection is not required. This addresses priority 1 above. In addition, be sure you understand the uncertainties of dose models as discussed in Section 1.2 of Volume 1 (NUREG/CR-5247, 1993).
NUREG/CR-5247, Vol. 2, Rev. 2

6 RASCAL 2.1 Workbook
EPA PROTECTIVE ACTION GUIDES AND LONG TERM OBJECTIVES
EARLY-PHASE PAGS
Doses (rem) Normal Environmental , Conditions _
Hazardous Environmental Conditions2
TEDE1 Thyroid (adult)
General Population.
High Risk Groups3
General Population
High Risk Groups3
1 5 Evacuate Shelter Shelter Shelter
5 25 Evacuate Evacuate Evacuate Shelter
10 50 Evacuate Evacuate Evacuate Evacuate
^ota l effective dose equivalent is the sum of cloud shine, 4-day ground shine and CEDE (inhalation including resuspension)
Environmental conditions that impose a substantially higher risk than an individual would normally be expected to take.
3Groups which present a higher than average risk from evacuation (e.g. persons not readily moved)
INTERMEDIATE-PHASE PAGS
Dose in 1st year Value Action
Ground Shine with resuspension, decay, and
weathering
z. 2 rem relocate population
Beta dose to skin > 100 rem relocate population
INTERMEDIATE-PHASE LONG TERM OBJECTIVES
Dose Objective
2nd year ground shine with resuspension, decay, and weathering
not to exceed 0.5 rem
50 year ground shine with resuspension, decay, and weathering
not to exceed 5 rem
NUREG/CR-5247, Vol. 2, Rev. 2

Introduction 7
EARLY HEALTH EFFECTS INSIGHTS
FOR REACTOR ACCIDENTS
Dose Threshold Consequences
Acute Bone Marrow > 50 rem vomiting and diarrhea possible
Acute Bone Marrow
> 220 rem death possible
Acute Bone Marrow
> 440 rem 50% deaths for minimal treatment
Thyroid Inhalation > 3000 rem hypothyroidism
FOR INHALATION CRITICAL ACCIDENTS
Dose Threshold Consequences
Acute Lung > 2000 rem Death possible
NUREG/CR-5247, Vol. 2, Rev. 2
8 RASCAL 2.1 Workbook
This Page Intentionally Left Blank
NUREG/CR-5247, Vol. 2, Rev. 2

Introduction 9
RASCAL Familiarization Questions (answers on page 11)
The answers to the following questions can be found in the online help and online documentation of RASCAL. Find the answers to the questions by moving through the three tools (DECAY, FM-DOSE, and ST-DOSE) as needed. Use the [Pp (Help) key or the right mouse button to view the help text when on a menu item or data field. Also, use the View Assumptions menu option on the FM-DOSE and ST-DOSE case menus.
DECAY
1. What is the longest possible decay period that can be specified?
2. In what units of activity are values for individual radionuclides entered?
FM-DOSE
3. What is the resuspension rate used by the EPA in intermediate-phase dose calculations?
4. What is the maximum allowed exposure time to air or ground concentrations for early-phase dose calculations?
5. What is the source (document reference) of the external dose factors used in the FM-DOSE calculations?
ST-DOSE
6. What precipitation type would you enter for meteorological conditions if an Accu-Weather observation contained the ZL+ symbol for obstructions to visibility (WX)?
7. What stability class would you use if given a wind direction fluctuation measurement (sigma-theta) of 15°?
8. The straight-line Gaussian plume model will always try to calculate doses out to what distance?
9. What event times and meteorological conditions are automatically defined when creating a new case?
10. What source term is automatically defined when creating a new case?
11. What are the release fractions for iodine and cesium for an in-vessel severe core damage accident?
NUREG/CR-5247, Vol. 2, Rev. 2

10 RASCAL 2.1 Workbook
12. What reduction factor would be used for a sub-cooled suppression pool?
13. TEDE is described as the sum of what three doses?
14. When should the building wake calculation be turned off?
15. What ground surface correction factor is used when calculating the 4-day ground shine dose?
16. What is the maximum number of spent fuel batches allowed in the pool?
NUREG/CR-5247, Vol. 2, Rev. 2

Introduction 11
Answers to RASCAL Familiarization Questions (problems on page 9)
DECAY
1. The longest decay period is 999 years. From the help message available on the Decay time field.
2. Any activity units are allowed as long as they are used consistently throughout. From the help text on any of the nuclide amounts fields.
FM-DOSE
3. 1 .OE-06 From the help text of the Resuspension Rate field of the ground concentrations form.
4. Maximum early-phase dose exposure time is 99 hours. From the help on the Exposure Time field.
5. External dose factors are from Federal Guidance Report No. 12. From the View Assumptions menu item on the case menu.
ST-DOSE
6. Precipitation type to use is LIGHT RAIN. From the help message on the Precipitation Type field of the meteorology data input screen.
7. Stability class is C based on the table in the help message for the Stability Class field of the meteorology data input screen.
8. Straight-line plume will always attempt to calculate doses to 25 miles. However, if the winds and event times are such that no material would reach 25 miles, doses are not reported. From the help text on the Plume/Puff check boxes on the main data entry screen.
9. Shutdown, release to containment, and release to environment all occur at midnight on the current date. Release to environment and end of exposure are at 4 a.m. Meteorology conditions are: 4 mph, 90 degrees, D stability, 500 meter mixing height, and no precipitation. From examining the data on main data entry screen after creating a new case.
10. There is no predefined source term. It must always be defined by the user. The source term summary portion of the main data entry screen displays "Undefined" after creating a new case.
NUREG/CR-5247, Vol. 2, Rev. 2

12 RASCAL 2.1 Workbook
11. 35 % I and 25 % Cs — from the help message on the Core Condition choice on plant conditions input screens.
12. The reduction factor is 0.01. From the Release Rates and Reduction Factors table available from the View Assumptions menu item on the case menu.
13. TEDE is the sum of 4-day ground shine, immersion (cloud shine), and CEDE inhalation. From the notes at the end of the maximum values output text or the help text associated with the TEDE graphics check box on the results screen.
14. Only for releases from isolated stacks or vents. From the help text associated with the Building wake ON/OFF check boxes..
15. The ground surface correction factor is 0.7. From the help available on the 4-Day Ground Shine Dose check box of the result screen.
16. The maximum is 15 batches in the pool. From the help text associated with the number of batches field of the Spent Fuel source-term option.
NUREG/CR-5247, Vol. 2, Rev. 2
DECAY Exercises 13
DECAY Exercises
The following three exercises are designed to illustrate the workings of the DECAY program. This is the simplest to use of the three tools included in RASCAL. All data input is done from a single screen. Work the three problems and then refer to the discussion section.
Decay Of Cs (discussion on page 15)
When starting with 1000 Ci of 137Cs, what isotopes are found after 1 hour of decay? What is significant about the results?
Decay Of 1 3 2 I (discussion on page 15)
Evaluate the decay of 1000 Ci of 1 3 2I. What amount remains after 24 hours?
Now, calculate the amount of 1 3 2I remaining after 24 hours when starting with 1000 Ci of 1 3 2I and 500 Ci of I 3 2Te. This ratio of I to Te is consistent with the ratio expected from a major release following core damage (see Tables C-1 and C-2 in RTM-93 pages C-83 and C-84). What is significant about the results?
Decay Of 8 8 K r (discussion on page 16)
There is an airborne release of 1000 Ci of 88Kr. What would be in the atmosphere 2 hours later? Why is this important?
NUREG/CR-5247, Vol. 2, Rev. 2
14 RASCAL 2.1 Workbook
DECAY Exercise Discussions
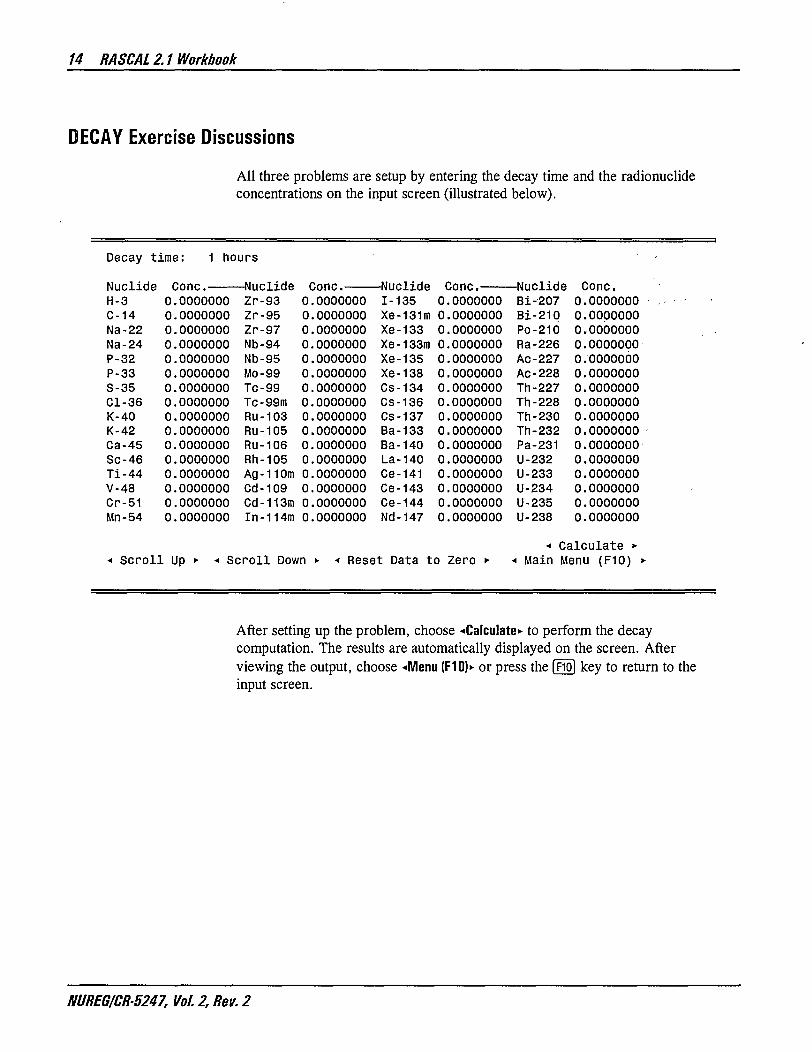
All three problems are setup by entering the decay time and the radionuclide concentrations on the input screen (illustrated below).
Decay time: 1 hours
Nuclide H-3
Pnnr Mnr*l i rip Cone. 0.0000000
-Nuclide 1-135
Cone. 0.0000000
-Nuclide Bi-207
Cone. 0.0000000
Nuclide H-3 \J\J\ 1*0 •
0.0000000 ItUulXUC Zr-93
Cone. 0.0000000
-Nuclide 1-135
Cone. 0.0000000
-Nuclide Bi-207
Cone. 0.0000000
C-14 0.0000000 Zr-95 0.0000000 Xe-I31m 0.0000000 Bi-210 0.0000000 Na-22 0.0000000 Zr-97 0.0000000 Xe-133 0.0000000 Po-210 0.0000000 Na-24 0.0000000 Nb-94 0.0000000 Xe-133m 0.0000000 Ra-226 0.0000000 P-32 0.0000000 Nb-95 0.0000000 Xe-135 0.0000000 Ac-227 0.0000000 P-33 0.0000000 Mo-99 0.0000000 Xe-138 0.0000000 Ac-228 0.0000000 S-35 0.0000000 Tc-99 0.0000000 Cs-134 0.0000000 Th-227 0.0000000 Cl-36 0.0000000 Tc-99m 0.0000000 Cs-136 0.0000000 Th-228 0.0000000 K-40 0.0000000 Ru-103 0.0000000 Cs-137 0.0000000 Th-230 0.0000000 K-42 0.0000000 Ru-105 0.0000000 Ba-133 0.0000000 Th-232 0.0000000 Ca-45 0.0000000 Ru-106 0.0000000 Ba-140 0.0000000 Pa-231 0.0000000 Sc-46 0.0000000 Rh-105 0.0000000 La-140 0.0000000 U-232 0.0000000 Ti-44 0.0000000 Ag-110m 0.0000000 Ce-141 0.0000000 U-233 0.0000000 V-48 0.0000000 Cd-109 0.0000000 Ce-143 0.0000000 U-234 0.0000000 Cr-51 0.0000000 Cd-113m 0.0000000 Ce-144 0.0000000 U-235 0.0000000 Mn-54 0.0000000 In-114m 0.0000000 Nd-147 0.0000000 U-238 0.0000000
•« Calculate *• « Scroll Up • •* Scroll Down • + Reset Data to Zero >• * Main Menu (F10) •
After setting up the problem, choose -(Calculate* to perform the decay computation. The results are automatically displayed on the screen. After viewing the output, choose -<Menu (F10> or press the (fio) key to return to the input screen.
NUREG/CR-5247, Vol. 2, Rev. 2
DECA Y Exercise Discussions 15
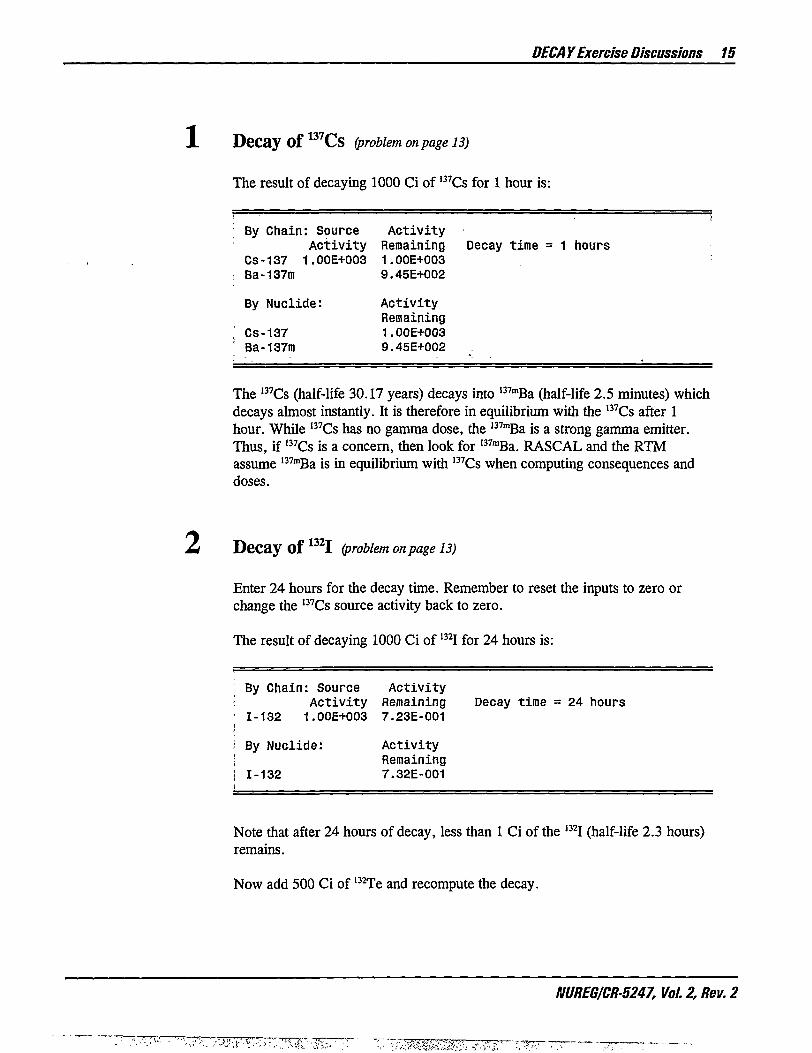
1 Decay Of 1 3 7 CS (problem on page 13)
The result of decaying 1000 Ci of I 3 7Cs for 1 hour is:
By Chain: Source Activity Activity Remaining Decay time = 1 hours
Cs-137 1.00E+003 1.00E+003 Ba-137m 9.45E+002
By Nuclide: Activity Remaining
Cs-137 1.00E+003 Ba-137m 9.45E+002
The 137Cs (half-life 30.17 years) decays into I 3 7 mBa (half-life 2.5 minutes) which decays almost instantly. It is therefore in equilibrium with the 137Cs after 1 hour. While 137Cs has no gamma dose, the 137mBa is a strong gamma emitter. Thus, if 137Cs is a concern, then look for I 3 7 mBa. RASCAL and the RTM assume I 3 7 mBa is in equilibrium with 137Cs when computing consequences and doses.
Decay Of I (problem on page 13)
Enter 24 hours for the decay time. Remember to reset the inputs to zero or change the 137Cs source activity back to zero.
The result of decaying 1000 Ci of 1 3 2I for 24 hours is:
By Chain: Source A c t i v i t y A c t i v i t y Remaining Decay time = 24 hours
1-132 1.00E+003 7.23E-001
By Nuclide: A c t i v i t y Remaining
1-132 7.32E-001
Note that after 24 hours of decay, less than 1 Ci of the ) 3 2I (half-life 2.3 hours) remains.
Now add 500 Ci of 132Te and recompute the decay.
MJREG/CR-5247, Vol. 2, Rev. 2
16 RASCAL 2.1 Workbook
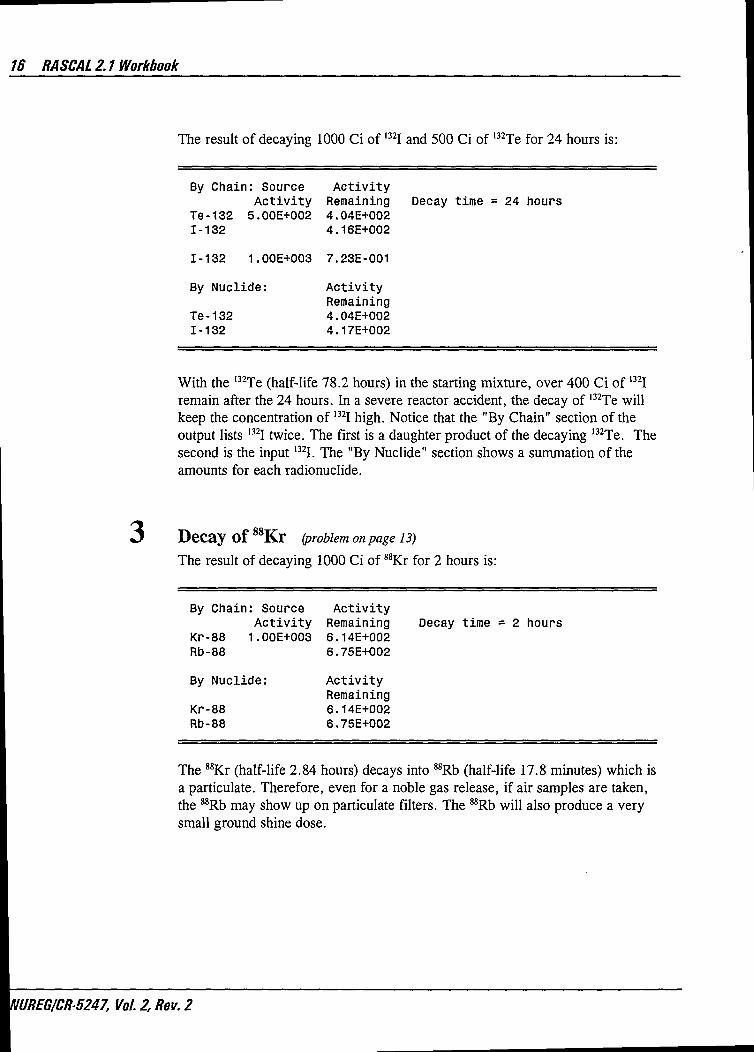
The result of decaying 1000 Ci of 1 3 2I and 500 Ci of 1 3 2Te for 24 hours is
By Chain : Source A c t i v i t y A c t i v i t y Remaining Decay t ime = 24 hours
Te-132 5.00E+002 4.04E+002 1-132 4.16E+002
1-132 1.00E+003 7.23E-001
By Nuc l i de : A c t i v i t y Remaining
Te-132 4.04E+002 1-132 4.17E+002
With the I 3 2Te (half-life 78.2 hours) in the starting mixture, over 400 Ci of 1 3 2I remain after the 24 hours. In a severe reactor accident, the decay of l 3 2Te will keep the concentration of 1 3 2I high. Notice that the "By Chain" section of the output lists l 3 2 I twice. The first is a daughter product of the decaying 1 3 2Te. The second is the input 1 3 2I. The "By Nuclide" section shows a summation of the amounts for each radionuclide.
3 Decay of 8 8Kr (problem on page 13) The result of decaying 1000 Ci of 8 8Kr for 2 hours is:
By Chain: Source Activity Activity Remaining
Kr-88 1.00E+003 6.14E+002 Rb-88 6.75E+002
By Nuclide: Activity Remaining
Kr-88 6.14E+002 Rb-88 6.75E+002
Decay time = 2 hours
The 8 8Kr (half-life 2.84 hours) decays into 8 8Rb (half-life 17.8 minutes) which is a particulate. Therefore, even for a noble gas release, if air samples are taken, the 8 8Rb may show up on particulate filters. The 8 8Rb will also produce a very small ground shine dose.
NUREG/CR-5247, Vol. 2, Rev. 2

FMDOSE Exercises 17
FM-DOSE Exercises
The following seven exercises are designed to illustrate the use of the Field Measurement to Dose (FM-DOSE) model. Useful documents for this section include:
EPA Protective Action Guides Manual NRC Response Technical Manual (RTM)
1 Dose from Ground Concentration (discussion on page 20)
A lab calls in the results of a soil sample analysis. They report an isotopic concentration of 1.0 pico-Ci/m2 of 103Ru. What is the dose in milli-rem from a one hour exposure? Are any protective actions called for?
Save this case and return to the main RASCAL menu before proceeding with the next problem.
Increased Ground Surface Correction Factor (discussion on page 24)
Load the case saved in problem 1. Change the ground surface correction factor to 1.0 (as used by EPA) and read the help screen when setting the value. Recompute the doses. How does increasing the GSCF affect the results?
Compare the intermediate-phase doses with the values in Table 7.1, page 7-9 of the EPA PAG manual.
ReSUSpension Dose (discussion on page 27)
Measurements from a dusty road somewhere outside Las Vegas, Nevada show a ground concentration of 25 /uCi/m2 of 238Pu. Compute doses for comparison with EPA PAGs and then again using a better representation of actual conditions. Read the help messages for resuspension rate to determine the appropriate value for each case.
NUREG/CR-5247, Vol. 2, Rev. 2
18 RASCAL 2.1 Workbook
4 Doses from Tritium Release (discussion on page 32)
A lab calls in the result of an air sample. They report 1 Ci/m3 of tritium. What is the dose in rem for a 1-hour exposure? Compare the numbers with the adult dose factor (rem/hr per Ci/m3) for acute bone marrow dose in Table H-5, page H-32 of RTM-93. What is the highest contribution to the TEDE dose?
Doses from Polonium Release (discussion on page 34)
An electrostatic eliminator in a large industrial operation has failed. The eliminator contains 2 1 0Po. A field team has measured airborne concentrations to be 0.1 ju.Ci/m3 in the facility. Old EPA plume-phase PAG levels were 1 rem for cloud shine dose and 5 rem for child thyroid dose. Would this release exceed the old plume-phase PAGs? Would it exceed the new EPA PAGs? (see the tables in the Introduction section of the workbook)
First Year Dose from Meter Reading (discussion on page 36)
During an intense thunderstorm with high winds and heavy rain, a lightning strike causes the explosion of a storage tank. The blast results in the near instantaneous release of 105 Ci of radioactive material. The only information regarding the tank contents available at this time is that it contained iodine.
The following gross gamma dose rates were measured 1 meter above the ground:
0.010 R/hr at 0.5 mile 0.004 R/hr at 1.0 mile
What are the 1st year doses from this release? Do they exceed the EPA intermediate-phase PAGs? Use the help messages as needed. What actions should be recommended?
Further information becomes available that the tank contained equal amounts of I 2 9I and l 3 7Cs. Recalculate the 1st year doses based on this new information. How do your recommendations for action change?
NUREG/CR-5247, Vol. 2, Rev. 2

FMDOSE Exercises 19
Re-entry Delay (discussion on page 38)
Following a reactor release, ground concentration measurements made at a location 5 miles from the plant show 150 //Ci/ft2 of 1 3 1I and 6 ^Ci/ft2 of 137Cs. (Note that these are the two most important isotopes resulting from a power reactor release and that they are in the ratio (25:1) expected from such a release). Determine the number of weeks of evacuation required to bring the first year dose within EPA PAGs. Will EPA long term objectives be met with that re-entry delay?
NUREG/CR-5247, Vol. 2, Rev. 2

20 RASCAL 2.1 Workbook
l:M-DOSE Exercise Discussions
Dose from Ground Concentration {problem on page n)
Choose Create New Case from the FM-DOSE case menu. This will display the main input menu. Press the {W} key to clear the title and then enter a new one. Set the ground concentration units to pico-Ci|m**2 and the dose units to milli-rem. Since there are only ground measurements, select only ground concentrations to be used in the calculations.
Note that the area to the right of the Results label at the bottom of the screen is blank. Since no results are available yet, the pushbuttons for viewing results have not been activated and are hidden.
Case T i t l e : FM-DOSE Workbook Problem 1
Enter the date and time that the sample was co l lec ted, i f known: Date: 07/13/94 Time: 11:00
Enter the uni ts in which the Ground A i r concentrations were reported: pico- Ci/m**2 Ci/m**3
Enter the concentrations by choosing these buttons: - Enter Ground Cone • < Enter A i r Cone •
Select the concentrations to be used i n the calculat ions and the dose un i t s :
[X] Ground Concentrations Dose uni ts [ ] A i r Concentrations milli-rem < Calculate •
Results:
•< Case Menu (F10) *-
Choose the *Enter Ground Cono button. Check that the ground surface correction factor (GSCF) is set to 0.7 and the exposure time to 1 hour. Enter the 103Ru activity on the ground surface concentration screen. Leave the resuspension rate and the re-entry delay at the default values.
NUREG/CR-5247, Vol. 2, Rev. 2

FM-DOSE Exercise Discussions 21
Title: FM-DOSE Workbook Problem 1
Ground Surface Correction Factor: 0. 70 Resuspension Rate: 1E-6 Exposure time: 1 hr Re-entry Delay: 0 days
Nuclide Cone. -Nuclide Cone. -Nuclide Cone. -Nuclide Cone. C-14 0.0000000 Zr-97 0.0000000 1-134 0.0000000 Bi-210 0.0000000 Na-22 0.0000000 Nb-94 0.0000000 1-135 0.0000000 Po-210 0.0000000 Na-24 0.0000000 Nb-95 0.0000000 Cs-134 0.0000000 Ra-226 0.0000000 P-32 0.0000000 MO-99 0.0000000 Cs-136 0.0000000 Ac-227 0.0000000 P-33 0.0000000 Tc-99 0.0000000 Cs-137 0.0000000 Ac-228 0.0000000 S-35 0.0000000 Tc-99m 0.0000000 Ba-133 0.0000000 Th-227 0.0000000 Cl-36 0.0000000 Ru-103 1.0000000 Ba-140 0.0000000 Th-228 0.0000000 K-40 0.0000000 RU-105 0.0000000 La-140 0.0000000 Th-230 0.0000000 K-42 0.0000000 RU-106 0.0000000 Ce-141 0.0000000 Th-232 0.0000000 Ca-45 0.0000000 Rh-105 0.0000000 Ce-143 0.0000000 Pa-231 0.0000000 SC-46 0.0000000 Ag-110m 0.0000000 Ce-144 0.0000000 U-232 0.0000000 Ti-44 0.0000000 Cd-109 0.0000000 Nd-147 0.0000000 U-233 0.0000000 V-48 0.0000000 Cd-113m 0.0000000 Pm-145 0.0000000 U-234 0.0000000 Cr-51 0.0000000 ln-114m 0.0000000 Pm-147 0.0000000 U-235 0.0000000 Mn-54 0.0000000 Sn-113 0.0000000 Sm-151 0.0000000 U-238 0.0000000 Mn-56 0.0000000 Sn-123 0.0000000 EU-152 0.0000000 Np-237 0.0000000
< Scroll Up >• < i Scroll Down >• « Reset Data to Zero • •* Main Menu (F10) •
Choose the «Main Menu (F10> button to return to the main screen and then choose the -(Calculate*- button to compute the doses. Notice that when the calculations are complete three pushbuttons appear to the right of the result label at the bottom of the screen. The three buttons are shown below:
Results: •« View Inputs • •« View Early Phase Doses • •< View Intermediate Phase Doses • •* Case Menu (F10) »•
Choose the -»View Early Phase Doses*- button. The resulting early-phase doses in milli-rem are displayed in a table.
NUREG/CR-5247, Vol. 2, Rev. 2

22 RASCAL 2.1 Workbook
Field Measurements to Dose Output Title: FM-DOSE Workbook Problem 1 Sample date and time: 07/13/94 01:00 <
EARLY-PHASE Doses TEDE Components: 4-day Ground Shine Cloud Submersion 50-yr Inhalation
4.00E-007 milli-rem 2.99E-013 milli-rem 1.07E-011 milli-rem
TEDE 4.00E-007 milli-rem
Acute Bone Marrow Components: Ground Shine 4.32E-009 milli-rem Cloud Submersion 2.99E-013 milli-rem 30-day Inhalation 1.77E-012 milli-rem
Acute Bone Marrow 4.32E-009 milli-rem
Thyroid Inhalation 2.65E-012 milli-rem Acute Lung Inrialtn 3.05E-011 milli-rem
NOTES: 1. * denotes value exceeding EPA EARLY-PHASE PAG 2. NC = Not Calculated 3. Resuspension doses ARE computed; Re-entry delay is not 4. TEDE threshold for evacuation = 1 rem 5. Thyroid threshold for evacuation = 5 rem 6. Ground shine excludes noble gas daughters
The notes section at the bottom of the screen provides a reminder of what goes into the doses, the assumptions used, and the PAG levels.
Choose the «Main (F10> button to close the display and return to the main form.
NUREG/CR-5247, Vol. 2, Rev. 2
FMDOSEExercise Discussions 23
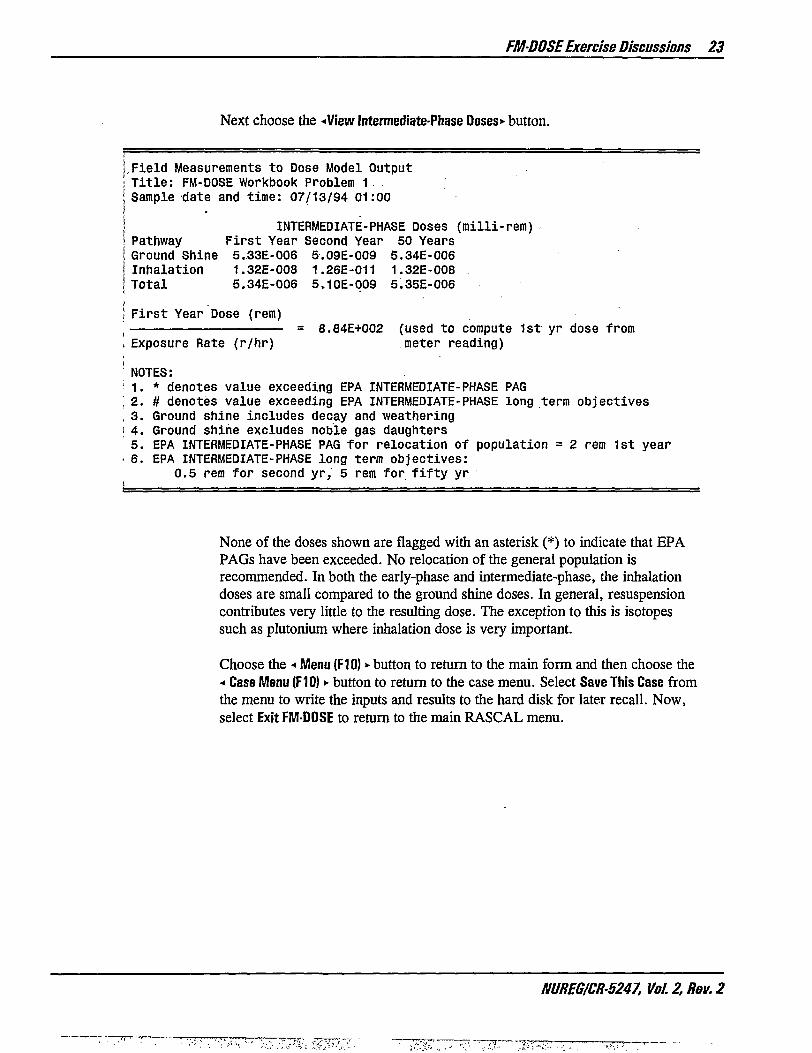
Next choose the -«View Intermediate-Phase Doses • button.
Field Measurements to Dose Model Output Title: FM-DOSE Workbook Problem 1. Sample date and time: 07/13/94 01:00
INTERMEDIATE-PHASE Doses (milli-rem) Pathway First Year Second Year 50 Years Ground Shine 5.33E-006 5.09E-009 5.34E-006 Inhalation 1.32E-008 1.26E-011 1.32E-008 Total 5.34E-006 5.10E-009 5.35E-006
i First Year Dose (rem) \ = 8.84E+002 (used to compute 1st yr dose from , Exposure Rate (r/hr) meter reading) ! NOTES: M . * denotes value exceeding EPA INTERMEDIATE-PHASE PAG ; 2. # denotes value exceeding EPA INTERMEDIATE-PHASE long term objectives , 3. Ground shine includes decay and weathering j 4. Ground shine excludes noble gas daughters 5. EPA INTERMEDIATE-PHASE PAG for relocation of population = 2 rem 1st year 6. EPA INTERMEDIATE-PHASE long term objectives:
0.5 rem for second yr, 5 rem for fifty yr
None of the doses shown are flagged with an asterisk (*) to indicate that EPA PAGs have been exceeded. No relocation of the general population is recommended. In both the early-phase and intermediate-phase, the inhalation doses are small compared to the ground shine doses. In general, resuspension contributes very little to the resulting dose. The exception to this is isotopes such as plutonium where inhalation dose is very important.
Choose the < Menu (F10) • button to return to the main form and then choose the « Case Menu (F10) >• button to return to the case menu. Select Save This Case from the menu to write the inputs and results to the hard disk for later recall. Now, select Exit FM-DOSE to return to the main RASCAL menu.
NUREG/CR5247, Vol.2,Rev.2

24 RASCAL 2.1 Workbook
Increased Ground Surface Correction Factor (problem on page 17)
Choose Field Measurements to Dose (FM-DOSE) from the main RASCAL menu. Then choose Load Old Case from the FM-DOSE case menu. A list of saved case titles will be displayed. Select the name given to the case in problem 1. The input and output files will be loaded and the main input screen displayed.
Edit the case title to uniquely identify this second workbook problem. Choose -•Edit Ground Cono to display the ground concentration screen. While the ground surface correction factor field is selected, press the {W} key or click the right mouse button. This will open the help text display. The help text for the GSCF reads:
The ground surface correct ion factor i s the f rac t i on by which the ground surface dose i s reduced to account fo r geometric considerations. The ST-DOSE model uses 0.5 which i s considered a reasonable estimate fo r normal condit ions and a c t i v i t i e s . The EPA PAG's use 1.0.
Exit the help screen by clicking the left mouse button with the cursor inside the help window or pressing the |Enter-*—'I key.
Change the GSCF to 1.0 then choose the ••Main (F10> button to return to the main screen. Choose -"Calculate*- to recompute the doses using the new GSCF. The early-phase doses are shown below:
Field Measurements to Dose Output Title: FM-DOSE Workbook Problem 2 Sample date and time: 07/13/94 01:00
EARLY-PHASE Doses TEDE Components: 4-day Ground Shine 5.71E-007 milli-rem Cloud Submersion 2.99E-013 milli-rem TEDE 5.71E-007 milli-rem 50-yr Inhalation 1.07E-011 milli-rem
Acute Bone Marrow Components: Ground Shine 6.17E-009 milli-rem Acute Cloud Submersion 2.99E-013 milli-rem Bone Marrow 6.17E-009 milli-rem 30-day Inhalation 1.77E-012 milli-rem
Thyroid Inhalation 2.65E-012 milli-rem Acute Lung Inhaltn 3.05E-011 milli-rem
Compare the doses with the results from problem #1. Note that the ground shine dose has changed while inhalation and cloud submersion doses remained
NUREG/CR-5247, Vol. 2, Rev. 2

FM-DOSE Exercise Discussions 25
the same. As expected the ground shine doses are higher than those in the first problem. The calculated ground shine doses are simply multiplied by the GSCF (see Appendix H of the RASCAL Version 2.1 User's Guide).
The intermediate-phase doses show the same differences in ground shine doses.
Field Measurements to Dose Model Output T i t l e : FM-DOSE Workbook Problem 2 Sample date and time: 07/13/94 01:00
INTERMEDIATE-PHASE Doses ( m i l l i - r e m ) Pathway First Year Second Year 50 Years Ground Shine 7.62E-006 7.27E-009 7.62E-006 I n h a l a t i o n 1.32E-008 1.26E-011 1.32E-008 T o t a l 7.63E-006 7.28E-009 7.64E-006
First Year Dose (rem) = 8.83E+002 (used to compute 1st yr dose from
Exposure Rate (R/hr) meter reading)
Most models and dose factors assume that deposition is onto an infinitely smooth plane. The ground surface correction factor allows the dose to be adjusted to represent more realistic conditions by accounting for shielding due to ground roughness. The EPA assumes a ground surface correction factor of 1.0 - obviously unrealistic. Thus, the tables in the PAG manual probably overestimate the dose. A value of 0.7 has been traditionally used when projecting severe accident consequences to account for ground roughness. The numbers are incredibly uncertain but the 0.7 value should give a more realistic estimate for the contribution of ground shine dose. These factors are typical of those used by the Russians in their analysis of the Chernobyl accident1. Unless you have conducted field studies, you have no basis to change the ground surface correction factor.
The 1st year and 50 year numbers are very close to those in Table 7-1 of the EPA PAG manual.
Year 1 Year 2 0-50 years
EPA 7.1E-6 0.0 7.1E-6 FM-DOSE 7.63E-6 7.28E-9 7.64E-6
The International Chernobyl Project - Technical Report, Assessment of Radiological Consequences and Evaluation of Protective Measures, Report by an International Advisory Committee.
NUREG/CR-5247, Vol. 2, Rev. 2

26 RASCAL 2.1 Workbook
FM-DOSE uses the same calculation methods as the EPA. However, the dose factors used in the PAG manual were from Federal Guidance Report No. 11. EPA has since issued Federal Guidance Report No. 12 with revised dose factors for external exposure. RASCAL has incorporated the new dose factors for ground shine and cloud shine into both FM-DOSE and ST-DOSE. As a result, many doses are now higher than before although by not more than 20% and a few are lower.
NUREG/CR-5247, Vol. 2, Rev. 2

FMDOSEExercise Discussions 27
ReSUSpension Dose (problem on page 17)
Work the problem first using EPA assumptions for GSCF and resuspension. Update the title and reset the ground concentration units to micro-Ci/m2 and the dose units to rem. As before, there are no air measurements and only ground concentrations should be included in the calculations.
Case Title: FM-OOSE Workbook Problem 3 - EPA
Enter the date and time that the sample was collected, if known: Date: 07/13/94 Time: 13:45
; Enter the units in which the — Ground Air '( concentrations were reported: micro-Ci/m**2 Ci/m**3 ; Enter the concentrations by choosing these buttons: < Enter Ground Cone »• •« Enter Air Cone •
Select the concentrations to be used in the calculations and the dose units:
[X] Ground Concentrations Dose units [ ] Air Concentrations rem •* Calculate •
Choose the -"Enter Ground Conc>- button and then select the resuspension rate field. Press the (TT) key or click the right mouse button to display the help text.
This is the resuspension rate used in computing the intermediate-phase inhalation dose. FOR COMPARISON WITH EPA PAG'S IT MUST BE 1E-6. This provides a conservative estimate and should not be changed unless based on field measurements.
Other agencies, departments, foreign governments, etc. may use other values.- The possible rates are 1E-9, 1E-8, 1E-7, 1E-6, 1E-5, and 1E-4. For example, an arid, desert area or a dusty road would have a resuspension rate of 1E-4. A 'well-weathered' resuspension rate (after several rainfalls or 6 to 12 months) would be 1E-9. Measurements at Chernobyl were in the range of 1E-8 to 1E-9.
For EPA comparison the resuspension rate should be 106. As before, the GSCF should be 1.0. Use the •« Scroll Down • button to locate ^Pu and enter the concentration.
NUREG/CR-5247, Vol. 2, Rev. 2
28 RASCAL 2.1 Workbook
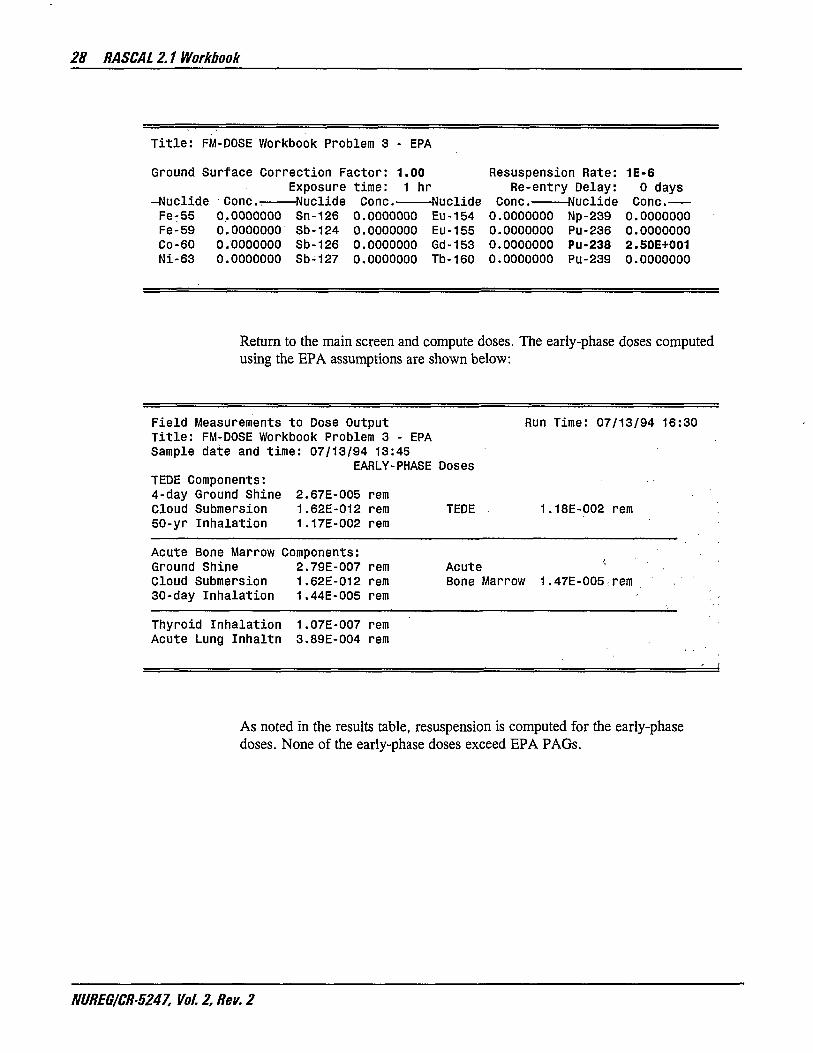
Title: FM-DOSE Workbook Problem 3 - EPA
Ground Surface Correction Factor: 1.00 Exposure time: 1 hr
-Nuclide Cone. •. Nuclide Cone— Fe-55 0.0000000 Sn-126 0.0000000 Eu-154 Fe-59 0.0000000 Sb-124 0.0000000 Eu-155 Co-60 0.0000000 Sb-126 0.0000000 Gd-153 Ni-63 0.0000000 Sb-127 0.0000000 Tb-160
Resuspension Rate: 1E-6 Re-entry Delay: 0 days
Nuclide Cone. Nuclide Cone. 0.0000000 Np-239 0.0000000 0.0000000 Pu-236 0.0000000 0.0000000 Pu-238 2.50E+001 0.0000000 Pu-239 0.0000000
Return to the main screen and compute doses. The early-phase doses computed using the EPA assumptions are shown below:
Field Measurements to Dose Output Title: FM-DOSE Workbook Problem 3 - EPA Sample date and time: 07/13/94 13:45
EARLY-PHASE Doses TEDE Components: 4-day Ground Shine Cloud Submersion 50-yr Inhalation
Run Time: 07/13/94 16:30
2.67E-005 rem 1.62E-012 rem 1.17E-002 rem
TEDE 1.18E-002 rem
Acute Bone Marrow Components: Ground Shine 2.79E-007 rem Cloud Submersion 1.62E-012 rem 30-day Inhalation 1.44E-005 rem
Acute Bone Marrow 1 47E-005rem
Thyroid Inhalation Acute Lung Inhaltn
1.07E-007 rem 3.89E-004 rem
As noted in the results table, resuspension is computed for the early-phase doses. None of the early-phase doses exceed EPA PAGs.
NUREG/CR-5247, Vol. 2, Rev. 2

FM-DOSE Exercise Discussions 29
Now examine the intermediate-phase doses. PAGs have been exceeded for the first year dose and the long-term objectives have not been met for the 2nd year and 50 year doses.
Field Measurements to Dose Model Output Run Time: 07/13/94 16:30 T i t l e : FM-DOSE Workbook Problem 3 - EPA Sample date and t ime: 07/13/94 13:45
INTERMEDIATE-PHASE Doses (rem) Pathway F i r s t Year Second Year 50 Years Ground Shine 1.82E-003 1.18E-003 3.30E-002 Inhalat ion 7.66E+001 4.97E+001 1.39E+003 Tota l *7.66E+001 #4.97E+001 #1.39E+003
F i r s t Year Dose (rem) = 1.96E+008 (used to compute 1st yr dose from
Exposure Rate (R/hr) meter reading)
Now revise the problem to use more realistic assumptions. Return to the main form and then bring up the ground concentration screen. Change the resuspension rate to l.OE-4 to represent the conditions of the dusty road and set the GSCF to 0.7 to be more realistic.
T i t l e : FM-DOSE Workbook Problem 3 - Actual Ground Surface Correction Factor: 0.70 Resuspension Rate: 1E-4
Exposure t ime: 1 hr Re-entry Delay: 0 days ' -Nucl ide Cone. Nuclide Cone. Nuclide Cone. Nuclide Cone. : Fe-55 0.0000000 Sn-126 0.0000000 EU-154 0.0000000 Np-239 0.0000000 , Fe-59 0.0000000 Sb-124 0.0000000 EU-155 0.0000000 PU-236 0.0000000
CO-60 0.0000000 Sb-126 0.0000000 Gd-153 0.0000000 Pu-238 2.50E+001 . Ni-63 0.0000000 Sb-127 0.0000000 Tb-160 0.0000000 Pu-239 0.0000000
Recompute the doses.
NUREG/CR5247, Vol. 2, Rev. 2

30 RASCAL 2.1 Workbook
The early-phase and intermediate-phase doses are shown below:
Field Measurements to Dose Output Run Time: 07/13/94 16:32 Title: FM-DOSE Workbook Problem 3 - Actual Sample date and time: 07/13/94 13:45
EARLY-PHASE Doses TEDE Components: 4-day Ground Shine 1.87E-005 rem Gloud Submersion 1.62E-010 rem TEDE *l.17E+000 rem 50-yr Inhalation 1.17E+000 rem
Acute Bone Marrow Components: Ground Shine 1.95E-007 rem Acute Cloud Submersion 1.62E-010 rem Bone Marrow 1.44E-003 rem 30-day Inhalation 1.44E-003 rem
Thyroid Inhalation 1.07E-005 rem Acute Lung Inhaltn 3.89E-002 rem
The 50-year inhalation dose has increased by a factor of 100 and the TEDE now exceeds the EPA PAGs. Similar increases are seen in the intermediate-phase doses.
Field Measurements to Dose Model Output Title: FM-DOSE Workbook Problem 3 - Actual Sample date and time: 07/13/94 13:45
INTERMEDIATE-PHASE Doses (rem) Pathway First Year Second Year 50 Years Ground Shine 1.27E-003 8.26E-004 2.31E-002 Inhalation 7.66E+003 4.97E+003 1.39E+005 Total *7.66E+003 #4.97E+003 #1.39E+005
First Year Dose (rem) = 2.80E+010 (used to compute 1st yr dose from
Exposure Rate (R/hr) meter reading)
A common error in working this type of problem is to include air concentrations (i.e. check the box) when no air measurements are available. To correctly work this problem, air concentrations must not be included in the calculations. In other words, the check box for Air Concentrations must be blank. If air concentrations are used when no actual measurements have been entered, the model assumes that measurements indicate zero concentrations of material in the air.
NUREG/CR-5247, Vol. 2, Rev. 2

FMDOSEExercise Discussions 31
To illustrate the problem, modify the existing case to include air concentrations in the calculations. Recompute the doses and examine the intermediate phase numbers.
F ie ld Measurements t o Dose Output ! T i t l e : FM-DOSE Workbook Problem 3 - with Air '< Sample da te and t ime : 07/13/94 13:45 | EARLY-PHASE Doses , TEDE Components:
4-day Ground Shine 1.87E-005 rem , Cloud Submersion 0.00E+000 rem TEDE 1.87E-005 rem
50-yr I n h a l a t i o n 0.00E+000 rem
Acute Bone Marrow Components: ; Ground Shine 1.95E-007 rem Acute '. Cloud Submersion O.OOE+000 rem Bone Marrow 1.95E-007 rem [ 30-day I n h a l a t i o n o.OOE+OOO rem
; Thyroid I n h a l a t i o n O.OOE+OOO rem I Acute Lung Inha l tn O.OOE+OOO rem
'' NOTES: ! 1. * denotes value exceeding EPA EARLY-PHASE PAG | 2. NC = Not Calculated , 3. Resuspension doses and re-entry delay and not computed
All the inhalation doses are zero and note #3 states that resuspension was not computed. By including the air concentrations, the model was instructed to not compute resuspension of material on the ground because there were actual measurements of the material in the air.
NUREG/CR-5247, Vol. 2, Rev. 2

32 RASCAL 2.1 Workbook
D o s e s f r o m T r i t i u m (problem on page 18)
Edit the case title to reflect workbook problem number 4 and set the air concentrations units to Cijm3. Since only an air sample is available, select air concentrations only to use in the calculations.
Case Title: FM-DOSE Workbook Problem 4
Enter the date and time that the sample was collected, if known: Date: 07/13/94 Time: 13:45
Enter the units in which the Ground Air concentrations were reported: Ci/m**2 Ci/m**3 Enter the concentrations by choosing these buttons: « Enter Ground Cone • < Enter Air Cone •
Select the concentrations to be used in the calculations and the dose units:
[ ] Ground Concentrations Dose units jrxj Air Concentrations rem « Calculate •
Now choose the «Enter Air Cono button and enter the measured concentration of tritium.
Title: FM-DOSE Workbook Problem 4 Exposure time: 1 hr
-Nuclide Cone. Nuclide Cone. Nuclide Cone. Nuclide Cone. H-3 1.0000000 Zr-93 0.0000000 1-135 0.0000000 Bi-207 0.0000000 C-14 0.0000000 Zr-95 0.0000000 Xe-131m 0.0000000 Bi-210 0.0000000 Na-22 0.0000000 Zr-97 0.0000000 Xe-133 0.0000000 PO-210 0.0000000
Return to the main screen and compute doses.
NUREG/CR-5247, Vol. 2, Rev. 2
FM-DOSE Exercise Discussions 33
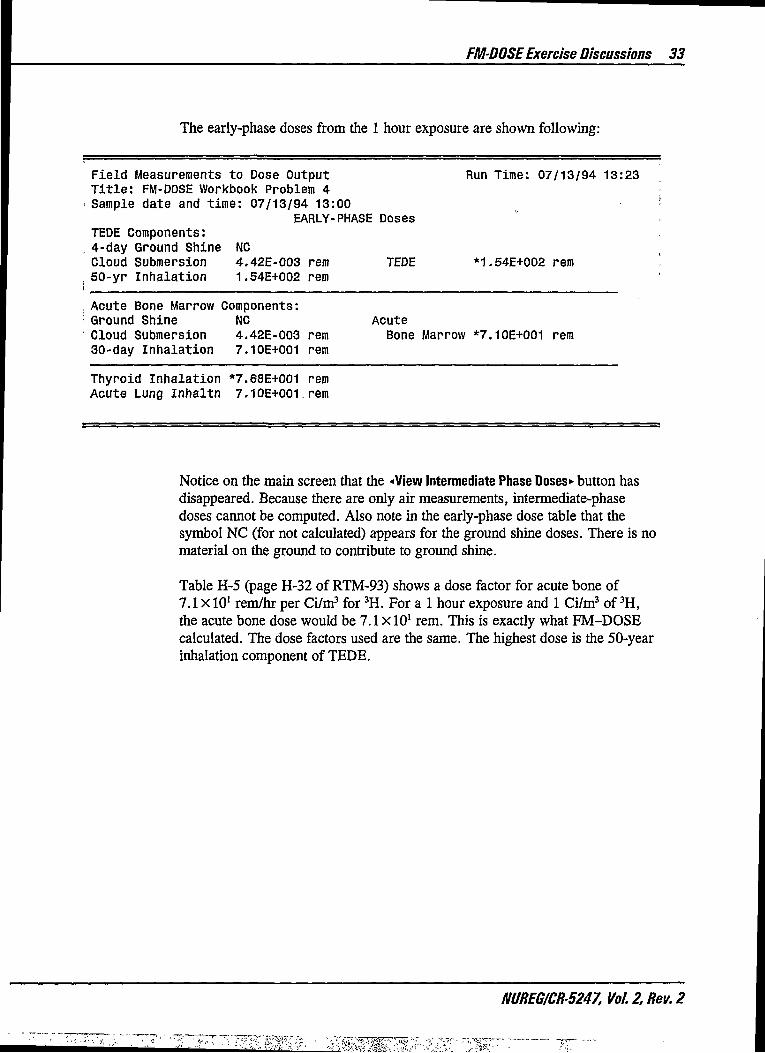
The early-phase doses from the 1 hour exposure are shown following:
F ie ld Measurements to Dose Output Run Time: 07/13/94 13:23 T i t l e : FM-DOSE Workbook Problem 4 Sample date and t ime: 07/13/94 13:00
EARLY-PHASE Doses TEDE Components: 4-day Ground Shine NC Cloud Submersion 4.42E-003 rem TEDE *1.54E+002 rem 50-yr Inha la t ion 1.54E+002 rem
Acute Bone Marrow Components: Ground Shine NC Acute C loud Submersion 4 .42E-003 rem Bone Marrow *7.10E+001 rem 30-day Inhalation 7.10E+001 rem
Thyroid Inhalation *7.68E+001 rem Acute Lung Inhaltn 7.10E+001 rem
Notice on the main screen that the «View Intermediate Phase Doses* button has disappeared. Because there are only air measurements, intermediate-phase doses cannot be computed. Also note in the early-phase dose table that the symbol NC (for not calculated) appears for the ground shine doses. There is no material on the ground to contribute to ground shine.
Table H-5 (page H-32 of RTM-93) shows a dose factor for acute bone of 7.1 x 10' rem/hr per Ci/m3 for 3H. For a 1 hour exposure and 1 Ci/m3 of 3H, the acute bone dose would be 7.1 x 10' rem. This is exactly what FM-DOSE calculated. The dose factors used are the same. The highest dose is the 50-year inhalation component of TEDE.
NUREG/CR5247, Vol. 2, Rev. 2

34 RASCAL 2.1 Workbook
Doses from Polonium (problem on page 18)
Set up the problem to use air concentrations only with input units of /xCi/m3
and output units of rem. Enter the measured concentration of the 2 1 0Po. Assume an exposure time of 1 hour. Remember to reset the tritium concentration to zero.
Case Title: FM-DOSE Workbook Problem 5
Enter the date and time that the sample was collected, if known: Date: 07/13/94 Time: 13:45
Enter the units in which the concentrations were reported:
Ground — Ci/m**2
Air micro-Ci/m**3 .
Enter the concentrations by choosing these buttons: •* Enter Ground Cone »• < Enter Air Cone •
Select the concentrations to be used in the calculations and the dose units:
[ ] Ground Concentrations Dose units [X] Air Concentrations rem •« Calculate •
Title: FM-DOSE Workbook Problem 5 Exposure time: 1 hr
-Nuclide Cone. -Nuclide Cone. H-3 0.0000000 Zr-93 0.0000000 C-14 0.0000000 Zr-95 0.0000000 Na-22 0.0000000 Zr-97 0.0000000 Na-24 0.0000000 Nb-94 0.0000000
-Nuclide Cone. Bi-207 0.0000000 Bi-210 0.0000000
Xe-133 0.0000000 Po-210 0.1000000 Xe-133m 0.0000000 Ra-226 0.0000000
-Nuclide Cone. 1-135 0.0000000 Xe-I3im o.ooooooo
Compute the doses.
NUREG/CR-5247, Vol. 2, Rev. 2

FM-DOSE Exercise Discussions 35
The early-phase doses from the 1 hour exposure are shown below:
! Field Measurements to Dose Output "Run Time: 07/13/94 13:28 Title: FM-DOSE Workbook Problem 5 .Sample date and time: 07/13/94 13:00 i EARLY-PHASE Doses jTEDE Components: 4-day Ground Shine NC • Cloud Submersion 5.54E-010 rem TEDE *1.13E+00Q rem •50-yr Inhalation 1.13E+000 rem •Acute Bone Marrow Components: ,Ground Shine NC Acute • Cloud Submersion 5.54E-010 rem Bone Marrow 3.78E-002 rem •30-day Inhalation 3.78E-002 rem ;Thyroid Inhalation 1.79E-001 rem jAcute Lung Inhaltn 1.20E+000 rem
The old EPA plume-phase PAGs used cloud shine and thyroid doses to determine protective actions with levels of 1 rem and 5 rem respectively. Under the old guidance, no protective actions should be taken. Both cloud shine (5.54X10¹⁰ rem) and thyroid dose (1.79 x 10"1 rem) are below the PAGs.
However, the new EPA PAGs base actions on TEDE and thyroid doses. In this case, evacuation should be recommend based on the calculated TEDE dose of 1.13 rem. The TEDE PAG of 1 rem is exceeded because of the large contribution from the 50-year inhalation (CEDE) component of the dose.
This illustrates that the old PAGs were not applicable to all types of radiological releases. This is the fundamental reason that EPA went to using TEDE for PAGs.
NUREG/CR5247, Vol.2,Rev.2

36 RASCAL 2.1 Workbook
6 First Year Dose from Meter Reading (problem on page 18)
The problem presents meter readings of gamma dose rate instead of measured concentrations as in earlier problems.
Since the only thing known about the contents of the tank is iodine, assume 1 3 1I (common and a potential dose contributor). Since there was heavy rain, assume that all the material is deposited on the ground. On the ground concentration screen enter 1 Ci of l 3 I I . The actual amount does not matter. The calculation of the first year dose to exposure rate ratio depends only on the types of isotopes on the ground not on their amounts.
Case Title: FM-DOSE Workbook Problem 6
Enter the date and time that the sample was collected, if known: Date: 07/13/94 Time: 13:45
Enter the units in which the Ground Air concentrations were reported: Ci/m**2 Ci/m**3 Enter the concentrations by choosing these buttons: •« Enter Ground Cone »• < Enter Air Cone >•
Select the concentrations to be used in the calculations and the dose Units:
[X] Ground Concentrations Dose units [ ] Air Concentrations rem •* Calculate •
Choose -<Calculate>- and then examine the intermediate-phase doses.
Field Measurements to Dose Model Output Run Time: 07/13/94 13:52 Title: FM-DOSE Workbook Problem 6 Sample date and time: 07/13/94 13:45
INTERMEDIATE-PHASE Doses (rem) Pathway First Year Second Year 50 Years Ground Shine 9.53E+002 0.00E+000 9.53E+002 Inhalation 1.07E+001 0.00E+000 1.07E+001 Total *9.64E+002 0.00E+000 #9.64E+002
First Year Dose (rem) = 1.97E+002 (used to compute 1st yr dose from
Exposure Rate (R/hr) meter reading)
NUREG/CR-5247, Vol. 2, Rev. 2

FMDOSEExercise Discussions 37
The ratio of the first year dose to the exposure rate is 1.97xl02. Multiply this ratio by the meter readings in R/hr to estimate the dose in rem. The scenario so far assumes only 1 3 II in the release.
197 x 0.01 = 1.97 rem and 197 x 0.004 = 0.79 rem
These dose estimates are below the EPA PAGs for first year intermediate-phase dose.
Based on the additional information, change the concentrations to 1 Ci of 1 2 9I and 1 Ci of 1 3 7Cs. Be sure to zero out the 1 3 1I. Recalculate the doses and examine the intermediate-phase results to obtain the ratio.
Field Measurements to Dose Model Output Run Time: 07/13/94 13:54 T i t l e : FM-DOSE Workbook Problem 6 (I129/Cs137) Sample date and time: 07/13/94 13:45
INTERMEDIATE-PHASE Doses (rem) Pathway First Year Second Year 50 Years Ground Shine 3.51E+004 2.25E+004 4.90E+005 Inhalation 1.61E+003 1.05E+003 3.26E+004 Total *3.67E+004 #2.35E+004 #5.23E+005
First Year Dose (rem) = 5.14E+003 (used to compute 1st yr dose from
Exposure Rate (R/hr) meter reading)
Again multiply the ratio by the meter readings. The doses have changed significantly.
5140 X 0.01 =51.4 rem and 5140 X 0.004 = 20.56 rem
The new estimated first year doses based on measurements at 0.5 and 1.0 miles exceed the EPA PAGs.
NUREG/CR-5247, Vol. 2, Rev. 2

38 RASCAL 2.1 Workbook
Re-entry Delay (problem on page 19)
Set up the problem with the ground concentration measurements given. Calculate doses and examine the intermediate-phase doses.
Case T i t l e : FM-DOSE Workbook Problem 7
Enter the date and time that the sample was co l lec ted, i f known: Date: 07/13/94 fime :: 13:45
Enter the uni ts i n which the Ground A i r concentrations were reported: micro-Ci / f t * *2 Ci/m**3
Enter the concentrations by choosing these buttons: •« Enter Ground Cone • -* Enter A i r Cone •
Select the concentrations to be used i n the calculat ions and the dose un i t s :
[X] Ground Concentrations Dose uni ts [ ] A i r Concentrations rem •* Calculate >
Begin increasing the re-entry delay time and recalculating. Examine the intermediate-phase doses to see if the delay has reduced the doses below the EPA PAG level.
About 9 weeks (63 days) of re-entry delay brings the first year dose below 2 rem. The EPA long term objectives are still not met for the 2nd year dose and cannot be met with the 999 day maximum re-entry delay in FM-DOSE.
Field Measurements to Dose Model Output Run Time: 07/13/94 14:00 Title: FM-DOSE Workbook Problem 7 Sample date and time: 07/13/94 13:45
INTERMEDIATE-PHASE Doses (rem) With Delay -----
Pathway First Year Second Year 50 Years First Year Second Year Ground Shine 3.70E+000 1.38E+000 3.10E+001 1.97E+000 1.32E+000 Inhalation 3.33E-002 1.02E-002 2.35E-001 1.46E-002 9.72E-003 Total *3.74E+000 #1.39E+000 #3.12E+001 1.99E+000 #1.33E+000
First Year Dose (rem) = 4.48E+002 (used to compute 1st yr dose from
Exposure Rate (r/hr) meter reading)
NUREG/CR-5247, Vol. 2, Rev. 2

STDOSE Exercises 39
ST DOSE Exercises The following 28 problems are designed to illustrate the use of the Source Term to Dose (ST-DOSE) model. The early problems each focus on a specific element of ST-DOSE operation. To make it easy to see the effects of changing one variable other variables may be held constant. As a result, some scenarios may be unrealistic. Later problems incorporate changes to multiple inputs and thus better represent the use of ST-DOSE in an actual emergency.
End of Exposure (calculation time) (discussion on page 50)
A plant has a gross release at 1000 Ci/sec for one hour of the following isotope mix:
80% Kr/Xe 10% I 5% Cs 5% Te/Sb
Assume all other ST-DOSE conditions are the default values (ground level release, 4 mph, D stability, 1 hour release, etc.). What are the cloud and initial ground shine doses from an exposure duration of 3 hours? Remember that exposure duration is the period from the start of the release to the environment to the specified end of exposure.
Repeat the calculations for an 18 hour exposure. Explain the differences in the shine doses between 3 and 18 hour exposures.
Shutdown Time (discussion on page 54)
A PWR plant with a large, dry containment (1000 MW(e)) has just shut down. The plant is experiencing a problem leading to a gap release. The sprays are off and the containment is leaking at 100%/day. Assuming default meteorology, no holdup, a 1 hour release, and 4 hours of exposure, what is the thyroid dose at 1 mile? What is the total amount of radioactive material released to the environment?
Now assume that the plant had been shut down for 30 days. The core is uncovered and as a result of decay heat the fuel cladding fails releasing the gap. What is the projected thyroid dose at 1 mile now? What is different about the amount and composition of the released material? Compare the ratio of the thyroid doses with the Shutdown Reactor Correction Factors in RTM-93, pages C-91 through C-93.
NUREG/CR-5247, Vol. 2, Rev. 2
40 RASCAL 2.1 Workbook
Holdup Time (discussion on page 58)
Assume that South Texas Unit 1 has been operating at 80% of full power for the past year. Unexplained vibration problems have been occurring and an administrative limit was imposed to try and reduce the occurrence of reactor trips. The plant has just shutdown with problems leading to the core being uncovered for 20 minutes. The core has since been recovered. The sprays are inoperative. It is postulated that the containment will reach design pressure and begin to leak at 100%/day within the next 24 hours. What would be the effect on the TEDE and thyroid doses if the containment were to begin leaking immediately versus 24 hours from now. Assume a 3 hour release duration, 12 hours of exposure, and default meteorological conditions. The 12 hours of exposure are needed to assure that the plume has sufficient time to fully clear 25 miles at 4 mph.
Compare the dose at 2, 10 and 25 miles for TEDE and thyroid and relate to the EPA PAGs. What does the comparison tell you about accidents?
Core Damage (discussion on page 62)
For a PWR plant with large, dry containment and operating at full power, ST-DOSE will estimate source terms for 3 core conditions: gap release, in-vessel severe core damage release, and vessel melt through release. Use the model to calculate the TEDE and thyroid doses for each core condition. Assume the following conditions:
• Sprays are off • Release pathway is unfiltered >• Containment leak rate is 0.004%/hr (typical design rate) • Holdup time in containment is 2 hours • 1 hour release at ground level • 4 hours of total exposure (allow plume to clear 10 miles) • Default meteorology (4 mph, D stability, no rain, etc.).
For each case, to what distance would the EPA PAGs be exceeded and what protective action should be recommended?
Provide a description of the gap, in-vessel, and ex-vessel core damage states.
NUREG/CR-5247, Vol. 2, Rev. 2

STDOSE Exercises 41
Containment Break Size (leak rate) (discussion on page 66)
A PWR with ice condenser containment and operating at full power has shut down and the core was uncovered for 15 to 20 minutes with a direct release path (e.g. PORV) to the containment. The containment is at present fully intact and is leaking at the design rate. However, there may be an increase in the containment leak rate within the next 15 minutes. Bound the problem consequences by considering three leak rate scenarios:
1. design leak rate 2. 4%/hour (100%/day) - failure to isolate 3. 100%/hour - catastrophic failure
Assume the following conditions:
>• Sprays and recirculation fans are off •• Ice has not been exhausted •• Release pathway is unfiltered • No holdup in containment >• 1 hour release at ground level >• 4 hours of total exposure - Default meteorological conditions (4 mph, D stability, no rain, etc.)
Examine the doses and compare with EPA PAGs and the acute health effects thresholds out to 10 miles. What is the impact on protective actions and health problems of the increases in containment leak rate?
Additional questions:
a. Why might you lose the recirculation fans? b. How would you use the model to account for a leak rate that exceeded
design but was still less than 100% per day? c. How would the exhaustion of the ice bed before the release affect the
resultant doses? d. How could you have core damage and no ice? e. Does it make sense to have a 1 hour release at design leak rate?
Reduction Mechanisms (sprays) (discussion on page 70)
A Large, Dry or Subatmospheric PWR plant has experienced problems leading to uncovering of the core for 15 to 20 minutes (gap release) with a direct release pathway to the containment. Assume the following conditions:
NUREG/CR-5247, Vol. 2, Rev. 2
42 RASCAL 2.1 Workbook
8
•• Sprays are off •• Release pathway is unfiltered • Containment leak rate is 4%/hour (100% / day) •• No holdup in containment • 1 hour release at ground level • 4 hours of total exposure • Default meteorological conditions (4 mph, D stability, no rain, etc.)
What are the TEDE and thyroid doses out to 10 miles? What protective actions do you recommend?
What would be the effect on TEDE and thyroid doses if the sprays were operational. Compare the results for TEDE and thyroid to EPA PAGs. What reduction factors are used for sprays?
Wind Speed and Inhalation Dose (discussion on page 73)
A plant releases 5000 Ci/sec of 1 3 1I for 1 hour. The current wind speed is 6 mph. The stability class is D with 500 m mixing height and no rain. Determine the acute lung dose at 5 miles for a 4 hour exposure. What would be the effect on the dose at 5 miles if the wind speed were 18 mph?
Calm Winds (discussion on page 75)
It is early morning at the Clinton Power Station in east central Illinois. Unit 1 has experienced a dry well problem leading to a gap release and leakage from the dry well that bypasses the wet well. Sprays are not functioning and the release pathway is unfiltered. The leak rate is 4%/hour (100%/day). The winds at the time of the release are calm and the skies are partly cloudy. What doses could be expected for a 1 hour release and 4 hours of exposure? What area is effected? Run the puff model so that the better graphics can be used to illustrate the effects.
" Precipitation (discussion on page 78)
A PWR plant (1000 MW(e) with large, dry containment) has experienced severe core damage but the vessel is intact. The containment has been leaking at a rate of 100% per day. The sprays are inoperative. The current weather conditions are winds 10 mph from south, stability class D, and mixing level 300 meters. At the present time it is not raining. However, rain is in the forecast and could start at any time. For a 1 hour release with 6 hours of
NUREG/CRS247, Vol. 2, Rev. 2

ST-DOSE Exercises 43
exposure, assess the differences in shine doses between no rain and a moderate rain.
Plot your results in two graphs:
1. cloud shine versus distance for rain and no rain 2. initial ground shine versus distance for rain and no rain
ST-DOSE assumes rain uniformly over the entire model domain. What would happen if the precipitation is very localized? How might it effect the dose patterns?
Rain Created Hot Spot (discussion on page 8i)
It is a spring afternoon at the Washington Nuclear Power plant. The weather is somewhat unsettled and rain showers are moving through the area. The plant has experienced a problem leading to failure of the dry well that bypasses the wet well. The core was uncovered for 35 minutes. The sprays are on. The plant is leaking at a rate of 100%/day but the release is being filtered.
Assume that the release starts at noon and continues until 12:30 p.m. At 2 p.m. a rain shower swept through the area. The shower lasted only about 15 minutes. What would doses be at 6 p.m.?
Use the following meteorological conditions in your assessment:
12:00 4 mph from 270 B s t a b i l i t y 500 m mix ing l a y e r No Rain 14:00 12 mph from 240 D s t a b i l i t y 500 m mix ing l a y e r Heavy Rain 14:15 4 mph from 270 B s t a b i l i t y 500 m mix ing l a y e r No Rain
Because the meteorological conditions change with time, only the puff model will properly model the problem. Examine the maximum value report and look at the graphics. Were EPA PAGs exceeded? What protective actions are required? Would you recommend any further actions?
Stability Class (discussion on page 84)
It is midnight on July 9th. Under the beautiful, star-studded sky, things are starting to go wrong at the Wolf Creek power plant. The plant has just shut down and you have been asked to provide a dose assessment based on two possible release times:
NUREGJCR-5247, Vol. 2, Rev. 2
44 RASCAL 2.1 Workbook
1. very early morning, well before sunrise (assume 4 a.m.)
2. mid-afternoon (assume 2 p.m.)
The winds are projected to be 6 mph for the next 24 hours. Use the help screens with the meteorological data input screens to determine the appropriate stability class and mixing levels for the two release times.
Assume the following source term conditions:
• Large, Dry, or Subatmospheric Containment • In-Vessel Severe Core Damage • 3411MW(t) • Sprays OFF • Release pathway is unfiltered • Leak Rate: 4%/hr (100%/day)
Further assume a release duration of 1 hour and 4 hours of exposure. Using the puff model, calculate doses resulting from the two release times. How are the maximum values for thyroid and TEDE different at 0.5 miles and 10 miles? How are the shapes of the plumes different?
Elevated Release (discussion on page 89)
A plant releases 1 3 II for 15 minutes at a rate of 67 Ci/minute from an isolated 150 meter high stack. Compute the thyroid dose to someone standing on the ground at 0.5, 1, and 2 miles from the release point for a four hour exposure. Assume default meteorological conditions.
How many total curies of 131I were released? How do the doses compare to EPA thyroid PAGs?
Now assume that same release occurred from a vent at the top of the turbine building (70 meters). How are the doses different?
Release Above Mixed Layer (discussion on page 92)
It is a clear night at the Davis Besse plant. The mixing layer is very shallow -100 meters or less. The plant has experienced problems leading to in-vessel severe damage and the sprays are inoperative. At 5 a.m. the containment failed catastrophically releasing the hot, pressurized containment atmosphere. Winds are light (1-2 mph) from the southwest. The stability class is G. An observer outside when the containment fails, reports seeing the plume rise quickly. It is
NUREG/CR-5247, Vol. 2, Rev. 2
STDOSE Exercises 45
estimated that the plume stopped rising at about 200 meters. What doses can be expected downwind of the plant for a 4 hour exposure?
Now, assume that the reactor problems and the release did not occur until mid-morning. The sun is out and the mixed layer depth has already grown to over 600 meters and the stability class is B. Assume that the release is still hot and under pressure. Would the different mixing layer depth change the downwind dose projections?
Wind Shift (discussion on page 95)
A plant has had it's core uncovered for more than 30 minutes. Material is being released continuously via an unfiltered pathway through an auxiliary building (Containment Bypass) at a rate of 100%/day. The plant meteorological tower is currently reporting winds from the SE at 12 mph with a sigma-theta of 9°. The forecast is for the winds to shift after 3 hours to 190 degrees and to drop in speed to 2 m/sec and sigma-theta to become around 21°. Assume a mixing layer height of 500 meters. Run both the plume and puff models to obtain doses for an exposure time of 6 hours from the start of the release.
Compare the graphics pictures and doses resulting from each model. How do the protective active recommendations differ based on the results from the two models? Why is the plume model not good to use in this case? Why is it important to also examine the graphics in addition to the maximum value table?
SGTR Coolant (discussion on page 99)
A coolant sample taken yesterday showed normal concentrations of non-noble fission products. The reactor has just shut down abruptly with a once-through steam generator tube rupture (assume 1 tube at full pressure). The operators are keeping the pressure high in the primary system for 1 hour. Assume that the release is through the safety valve. Use default meteorology, 1 hour release, and 4 hours of exposure.
What is the maximum dose that could be expected? What does this tell you about steam generator tube ruptures if there is no core damage? How would your assumptions change if it were a "U" tube steam generator?
NUREG/CR-5247, Vol. 2, Rev. 2

46 RASCAL 2.1 Workbook
16 P l u t o n i u m Re lease (discussion on page 101)
A facility releases 360,000 Ci of 2 3 9Pu to the air over a 1 hour period. What would be the consequences of such a release? What is the primary source of health effects versus a reactor accident? What is the threshold for deaths for acute bone marrow dose?
17 Noble Gas Only Release (discussion on page 104)
A licensee has reported releasing 1000 Ci/sec out a roof vent at the 50 meter level for 1 hour. It was a highly filtered, monitored release. The vent monitor indicated only noble gases. Assuming default meteorology, what would be the doses for a three hour exposure?
18 Analyst Specified Mix (discussion on page 106)
Make an ST-DOSE run using the source term defined by the Mix Specified by Analyst option. Assume a release of 1000 Ci/sec for 1 hour of the default mix of 2% I and 98% noble gas. Assume a 4 hour exposure and leave all the other model parameters as defaults. Examine the resulting doses and the isotopic mix generated by the model.
There is no reason to believe that the ratio is correct. If you knew that material had been held up for 4 hours and was being released from the wet well, that the sprays were ON, and that the release was being filtered, what percentage iodine would you use? (see RTM-93 Table C-3, page C-85). Rerun the case based on your new estimate of iodine percentage. How does that effect the results?
1 9 Dry Well / Wet Well (discussion on page 109)
The Enrico Fermi plant is experiencing an in-vessel severe core damage release. Assume a leak rate of 100%/day and no filters. There is a leak in the dry well that allows a release bypassing the wet well. (Note: this could be the case if the dry well fails before severe core damage.) The sprays are inoperative. Which is better: to vent off the wet well or allow dry well leakage? For illustration assume that the dry well case represents a failure of the dry well while the wet well could represent venting through the suppression pool (assume a venting rate of 100% per day). As in most cases the suppression pool is subcooled.
NUREG/CR-5247, Vol. 2, Rev. 2
STDOSE Exercises 47
After you have given your briefing you are told that the Canadians are very interested in your analysis and would very much like a copy of your doses and computed source terms, in Sv and Bq, respectively. Prepare these tables for faxing.
Three Mile Island (discussion on page ni)
Use the puff model to work the TMI-2 scenario. While conditions associated with the catastrophic containment failure are consistent with those encountered at TMI, the assumption of design leak rate were chosen for illustration (containment allowed to reach design pressure for several hours). Since TMI Unit 2 is not in the plant list, use Unit 1.
At TMI the containment was well below design pressure, therefore the leak rate was very low. Assume the following conditions:
•• Large, dry containment >• In-vessel, severe core damage (core uncovered more than 1 hour) •• Sprays are on • Ground level release >• Default meteorology (4 mph, D stability, no rain, etc.) • Core damage occurred 2.5 hours after shutdown
What are the consequences of the above conditions assuming that the containment is leaking at the design rate? Assume for this case that there is a 3.5 hour release and that the exposure ends 3 hours after the end of the release.
Now, assume that the hydrogen burn which occurred 10 hours after shutdown causes catastrophic failure of the containment. Assume 3 hours of exposure after the end of the release. How do the consequences change?
Isotopic Release (discussion on page 116)
There is a fire in a facility that stores 1 3 1I. One month ago 13,000 Ci of I 3 1I were stored in the tank. Assuming all the iodine was released in 1 hour, what would the thyroid dose be? What actions would you advise based on these doses? Assume default meteorology. This problem can be worked using the Isotopic Release Rate or the Isotopic Concentrations source-term options. Are the results the same from both?
NUREG/CR-5247, Vol. 2, Rev. 2

48 RASCAL 2.1 Workbook
22
23
Containment Sample vs. Rad Monitor (discussion on page ni)
A PWR containment monitor reads 104 R/hr. Analysis of a containment sample taken 24 hours ago shows the following isotopic concentrations (all in Ci/cc):
131J 1.2X10"6 1 3 4 Cs 1.0 x l O 6
133J 3.8 X10"6 1 3 6 Cs 6.0 xlO"7
135J 3.2 xlO" 6
What would be the doses if there was a release one day from now? Assume that the containment volume is 2x 106 ft3; that the sprays aren't used; there is no plate-out; and that the entire volume is released in 1 hour.
How do the doses change if plate-out and/or the sprays are included?
Wet Well Rad Monitor (discussion on page 125)
The wet well monitor at Browns Ferry Unit 1 reads 50,000 R/hr. What would the doses be from a 1 hour release at design pressure? Assume no filters or sprays.
24 Spent Fuel Accident - Closed Plant (discussion on page 127)
The plant staff are calling you from a cellular phone in the parking lot of the Trojan visitors' center because there has been an earthquake in the vicinity. They inform you that the spent fuel pool is draining rapidly. There is no assurance that the containment building is intact. The meteorology tower has fallen down. The plant started operation in 1976 and shutdown in 1993 so you assume that there are 15 batches in the pool. The last batch was placed in the pool one year ago today. Estimate the possible off-site effects? Where does the thyroid dose come from?
25 Spent Fuel Accident During Refueling (discussion on page 130)
It has been a bad year for earthquakes. You receive a call via CB radio from the Pilgrim plant. The earthquake occurred during refueling just after a new batch was placed in the spent fuel pool. The head is off the vessel and the pool is draining. There were 12 batches already in the pool. Refer to the help messages to determine the accident scenario. What are the possible health effects?
NUREG/CR-5247, Vol. 2, Rev. 2
ST DOSE Exercises 49
26 Laboratory Explosion (discussion on page 132)
27
It's July 4th and you receive a call from a graduate student at Wassamatta University. She says that there has been an explosion in a research laboratory trailer. There was a cylinder containing 103 Ci of 1 3 1I in a cabinet next to the explosion. There was another cylinder in the cabinet but she has no idea what is in it and is trying to find out. What are the potential doses from the iodine? Assume all the material is released over a five minute release duration and use the default meteorology.
The professor in charge of the lab has finally been contacted. He seems to recall putting a cylinder containing 102 Ci of 2 4 2Cm in that cabinet about 6 months ago. How does this change your analysis? If you didn't know the age of the cylinders, would it change your results significantly?
Actual Meteorological Data (discussion on page 136)
Login to the Accu-Weather computer and gather current and forecast meteorological data for the site of your choice. Fill in a ST-DOSE Weather Data Worksheet, then make an ST-DOSE run using the actual current and forecast data.
What protective action recommendations would you make based on the current plant conditions and the current meteorology? If the event continues, how will the weather conditions forecast for later in the day effect your recommendations?
28 S a v e Resu l t s tO R C S N e t w o r k (discussion on page 136)
For any given set of ST-DOSE results perform the following tasks on the Response Computer System:
1. While in RASCAL, save graphics in PCX format to the workstation for TEDE and Thyroid doses.
2. Exit RASCAL and view and print these pictures using the RASCAL | FILES option of the RCS.
3. Copy the pictures and the text information from the workstation to the network.
NUREG/CR-5247, Vol. 2, Rev. 2
T,-:\< T'.Tryrs-j^s ^mmx..w&hm*-;. ^mmtmmm^wm
50 RASCAL 2.1 Workbook
ST-DOSE Exercise Discussions
JL End of Exposure (calculation time) (problem on page 39)
Set up the problem as stated. Make sure to enter a meaningful case title that will uniquely identify the modeling run. Since no actual event times are given by the problem, use the default times. Enter the specified radionuclide mix as percentages using the Mix Specified By Analyst source term option. This is the type of source-term input used by some nuclear power plants for actual releases. The operator will know the total Ci/sec being released and will estimate the percentages for the isotope mix. The input summary screen will look similar to the following.
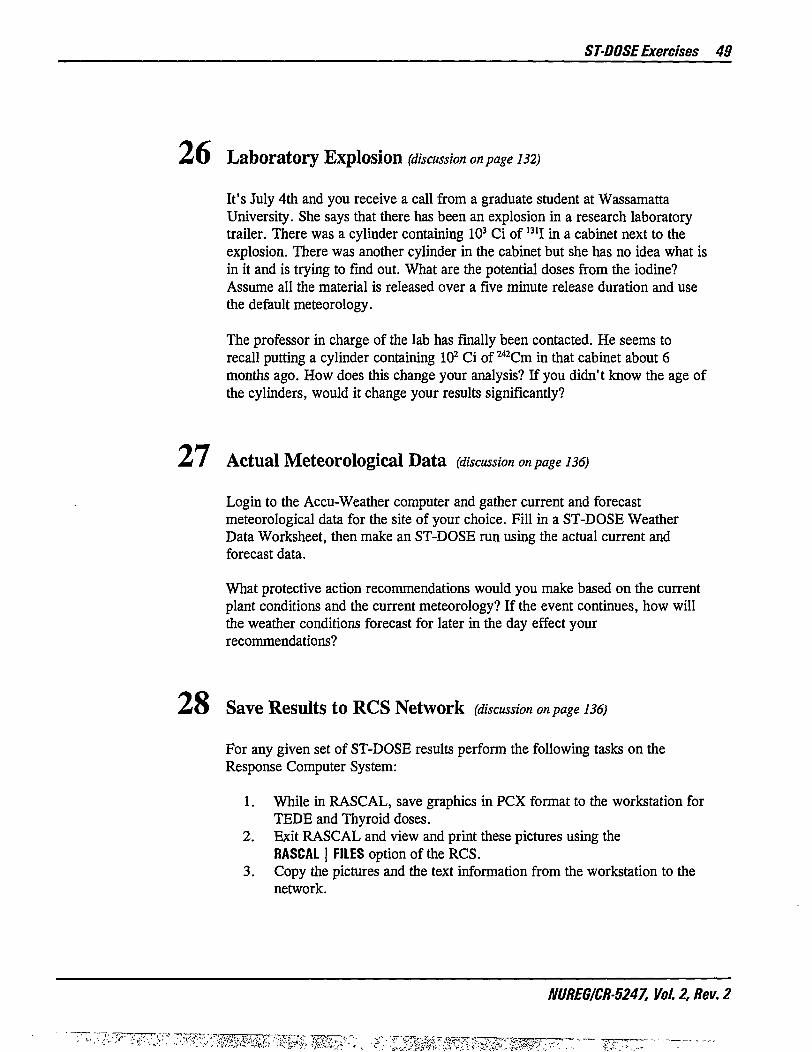
Case Title: ST-DOSE Workbook Problem 1a < Site Name >• NO PLANT SELECTED UNIT 1 E f f . Release He igh t : 0 m De fau l t ( • ) C i Data ( • ) P ro jec ted < Source Term >• U n i t s : ( ) Bq Source: ( ) A c t u a l Gross Reactor Release w i t h Mix Spec i f i ed by Ana lys t
Release Rate: 1.00E+003 C i /sec F r a c t i o n s : Kr , Xe: 80.0000 Te, Sb: 5.0000
I : 10.0000 Ba, Sr : 0.0000 Cs: 5.0000 Ru, Mo: 0.0000
La, Y, Ce, Np: 0.0000 -« Events • < Me teo ro log i ca l Data •
date t ime winds s t b mix p rec ip 1 09/19/94 00:00 4 mph 90 D 500 m NONE 2 < undefined > 3 < undef ined > 4 < undef ined >
Shut Down 09/19/94 00:00 Rel->Cont < NA > Re l ->Env i 09/19/94 00:00 Rel End 09/19/94 01:00 Expos End 09/19/94 03:00
C a l c u l a t i o n Op t ions : Model: ( ) Plume B u i l d i n g (©) On C a l c u l a t i o n ( • ) 10 -mi le (16 km)
( • ) Puf f wake: ( ) Of f r a d i u s : ( ) 25 -m i le (40 km)
When all the inputs are completed, choose the < Calculate >• button.
For a quick look at the results, select the Maximum Values result type on the main output screen and then choose the •« View / Print • button. This displays a table of the maximum doses at various distances from the release point. Select entries under the graphics section and then choose - View / Print • to see the distribution of the material relative to the site.
NUREG/CR-5247, Vol. 2, Rev. 2

ST-DOSE Exercise Discussions 51
The maximum early-phase doses based on 3 hours of exposure are shown below:
ST-DOSE Workbook Problem 1a i
NO PLANT SELECTED UNIT 1 Projected Data I Distance Maximum EARLY-PHASE Doses (rem) Puff Model from Site, mi(km) .5( .8) 1.0(1.6) 2.0(3.2) 5.0(8.0) 10.(16.) j
Total EDE (EPA) *5.1E+01 *3.1E+01 *2.1E+01 *8.4E+00 *2.1E+00 : Thyroid (EPA) *3.4E+02 *2.1E+02 *1.4E+02 *5.4E+01 *1.4E+01 Acute Lung 1.3E+01 7.8E+00 5.2E+00 2.0E+00 5.1E-01 | Acute Bone Total 7.9E+00 5.1E+00 3.4E+00 1.5E+00 3.7E-01 >
Acute Bone Inhalatn 5.1E+00 3.1E+00 2.1E+00 8.2E-01 2.0E-01 Cloud Shine 2.0E+00 1.5E+00 1.1E+00 6.0E-01 1.6E-01 Inital Ground Shine 7.8E-01 4.5E-01 2.7E-01 7.4E-02 4.5E-03 4-Day Ground Shine 1.6E+01 9.8E+00 6.5E+00 2.5E+00 6.2E-01 CEDE Inhalation 3.3E+01 2.0E+01 1.3E+01 5.3E+00 1.3E+00
NOTES: 1 . A l l values below 1.0E-03 have been set to zero 2. * marks values exceeding EARLY-PHASE PAGs 3. Tota l EDE = Cloud Shine + 4-Day Ground Shine + CEDE Inhalat ion 4. Acute Bone Tota l = Acute Bone Inh. + Cloud Shine + I n i t . Ground Shine 5. TEDE EARLY-PHASE PAG = 1.0E+00 rem, normally evacuate 6. Thyroid EARLY-PHASE PAG = 5.0E+00 rem, evacuate
Now revise the inputs to specify an end-of-calculation that is 18 hours after the start of the release. The maximum doses resulting from this change to the inputs are:
ST-DOSE Workbook Problem 1b NO PLANT SELECTED UNIT 1 Distance Maximum EARLY-PHASE Doses (rem)
i f rom S i t e , mi(km) .5 ( .8) 1 .0(1 .6) 2 . 0 ( 3 . 2 ) 5 . 0 (8 .0 )
Projected Data Puff Model
10.(16.)
Tota l EDE (EPA) Thyroid (EPA) Acute Lung Acute Bone Tota l
*5.4E+01 *3.4E+02 1.3E+01 1.3E+01
*3.3E+01 *2.1E+02 7.8E+00 8.0E+00
*2.2E+01 *1.4E+02 5.2E+00 5.3E+00
*8.8E+00 *5.4E+01 2.0E+00 2.3E+00
*3.8E+00 *2.3E+01
8.8E-01 9.6E-01
Acute Bone I n h a l a t n 5.1E+00 3.1E+00 2.1E+00 8.2E-01 3.5E-01 Cloud Shine 2.0E+00 1.5E+00 1.1E+00 6.0E-01 2.8E-01 I n i t a l Ground Shine 5.6E+00 3.4E+00 2.2E+00 8.4E-01 3.3E-01 4-Day Ground Shine 1.9E+01 1.2E+01 7.6E+00 3.0E+00 1.3E+00 CEDE I n h a l a t i o n 3.3E+01 2.0E+01 1.3E+01 5.3E+00 2.3E+00
Note that the resulting cloud shine and thyroid doses are the same in both scenarios out to five miles. Once the plume has passed a given point, the
NUREG/CR-5247, Vol. 2, Rev. 2
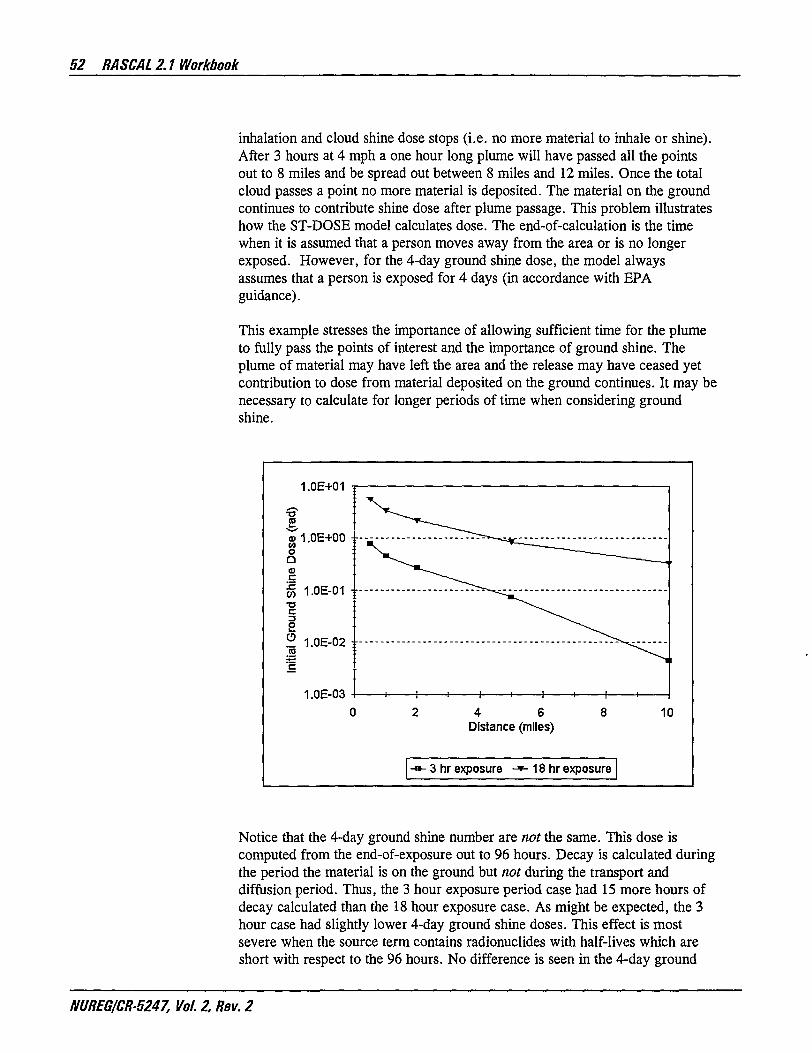
52 RASCAL 2.1 Workbook
inhalation and cloud shine dose stops (i.e. no more material to inhale or shine). After 3 hours at 4 mph a one hour long plume will have passed all the points out to 8 miles and be spread out between 8 miles and 12 miles. Once the total cloud passes a point no more material is deposited. The material on the ground continues to contribute shine dose after plume passage. This problem illustrates how the ST-DOSE model calculates dose. The end-of-calculation is the time when it is assumed that a person moves away from the area or is no longer exposed. However, for the 4-day ground shine dose, the model always assumes that a person is exposed for 4 days (in accordance with EPA guidance).
This example stresses the importance of allowing sufficient time for the plume to fully pass the points of interest and the importance of ground shine. The plume of material may have left the area and the release may have ceased yet contribution to dose from material deposited on the ground continues. It may be necessary to calculate for longer periods of time when considering ground shine.
1.0E+01
<o i~ V 1 .OE+00 w o Q o c I 1.0E-01 c 3 O !£ 1.0E-02 •:
1.0E-03 4 6
Distance (miles) 10
-»- 3 hr exposure -*-18 hr exposure
Notice that the 4-day ground shine number are not the same. This dose is computed from the end-of-exposure out to 96 hours. Decay is calculated during the period the material is on the ground but not during the transport and diffusion period. Thus, the 3 hour exposure period case had 15 more hours of decay calculated than the 18 hour exposure case. As might be expected, the 3 hour case had slightly lower 4-day ground shine doses. This effect is most severe when the source term contains radionuclides with half-lives which are short with respect to the 96 hours. No difference is seen in the 4-day ground
NUREG/CR-5247, Vol. 2, Rev. 2
ST-DOSE Exercise Discussions 53
shine if only long-lived radionuclides are in the source term. ST-DOSE does not compute decay during transport in order to speed up the calculations.
NUREG/CR-5247, Vol. 2, Rev. 2
:^:,^^m^

54 RASCAL 2.1 Workbook
Shutdown Time (problem on page 39)
Set up the problem as described. Remember that plant power in MW(e) must be converted to MW(t) for input to the ST-DOSE source term. The assumed conversion is 1 MW(e) = 3 MW(t).
For the case when shutdown occurred at the release time, the inputs were:
Case T i t l e : ST-DOSE Workbook Problem 2a •• S i t e Name • NO PLANT SELECTED UNIT 1 Eff . Release Height: 0 m Default ( • ) Ci •> Source Term >• Units: ( ) Bq Reactor Accident Based On Plant Conditions
Release Pathway: Large Dry or Subatmospheric Containment Leakage/Failure Gap Release (uncovered 15-30 min) 3000 Mw(t)
Data Source:
(•) Projected ( ) Actual
Core Condition Reactor Power
Sprays Leak Rate
< Events • Shut Down Rel->Cont Rel->Envi Rel End Expos End
09/19/94 00:00 09/19/94 00:00 09/19/94 00:00 09/19/94 01:00 09/19/94 04:00
Off Release Path: Unfiltered 4%/hr = 100%/day
•* Meteorological Data • date time winds stb mix
1 09/19/94 00:00 4 mph 90 D 500 m 2 < undefined > 3 < undefined > 4 < undefined >
precip NONE
Calculat ion Options: Model: ( ) Plume
(• ) Puff Bui lding (•) On
wake: ( ) Off Calculation (•) 10-mile (16 km)
radius: ( ) 25-mile (40 km)
The computed source term for the simultaneous shutdown and release case can be viewed from the main output menu.
ST-DOSE Workbook Problem 2a NO PLANT SELECTED UNIT 1
Computed Source Term Projected Data
A total of 2.3E+06 Ci were released. Release R( jlease Release
Nuclide (Ci) Fract. Nuclide (Ci) Fract. Nuclide (Ci) Fract. Kr-85 1.1E+03 2.0E-03 Kr-85m 4 8E+04 2.0E-03 Kr-87 9.6E+04 2.0E-03 Kr-88 1.4E+05 2.0E-03 1-131 1 3E+05 1.5E-03 1-132 1.8E+05 1.5E-03 1-133 2.6E+05 1.5E-03 1-134 2 8E+05 1.5E-03 1-135 2.3E+05 1.5E-03 Xe-131m 2.0E+03 2.0E-03 Xe-133 3 4E+05 2.0E-03 Xe-133m 1.2E+04 2.0E-03 Xe-135 6.6E+04 2.0E-03 Xe-138 3 4E+05 2.0E-03 Cs-134 1.1E+04 1.5E-03 Cs-136 4.5E+03 1.5E-03 Cs-137 7 2E+03 1.5E-03 Rb-88 1.4E+05 2.0E-03 Xe-135m 3.6E+04 1.5E-03 Ba-137m 7 2E+03 1.5E-03
NUREG/CR5247, Vol.2,Rev.2

STDOSEExercise Discussions 55
The resulting early-phase doses for the immediate release case are:
ST-DOSE Workbook Problem 2a NO PLANT SELECTED UNIT 1 Projected Data Distance Maximum EARLY-PHASE Doses (rem) Puff Model from Site, mi(km) .5( .8) 1.0(1.6) 2.0(3.2) 5.0(8.0) 10.(16.) Total EDE (EPA) *3.5E+01 *2.2E+01 *1.4E+01 *5.8E+00 *2.5E+00 Thyroid (EPA) *7.4E+02 *4.5E+02 *3.0E+02. M.2E+02 *5.0E+01 Acute Lung 7.6E+00 4.6E+00 3.1E+00 1.2E+00 5.2E-01 Acute Bone Total 4.7E+00 3.1E+00 2.1E+00 9.1E-01 3.5E-01 Acute Bone Inhalatn 9.4E-01 5.7E-01 3.8E-01 1.5E-01 6.4E-02 Cloud Shine 1.8E+00 1.4E+00 1.0E+00 5.4E-01 2.4E-01 Inital Ground Shine 1.9E+00 1.1E+00 7.1E-01 2.2E-01 4.4E-02 4-Day Ground Shine 7.4E+00 4.4E+00 2.9E+00 1.1E+00 4.1E-01 CEDE Inhalation 2.6E+01 1.6E+01 1.1E+01 4.2E+00 1.8E+00
EPA plume-phase PAGs are exceeded for TEDE and thyroid to at least 10 miles. If you were asked to make a protective action recommendation at this point it would be important to first rerun the model to project doses at greater distances. The total exposure time should be increased to at least 8 hours to allow complete plume passage at 25 miles.
Now revise the inputs to include a shutdown time 30 days before the release to containment (Rel->Cont). Leave all other input set the same. The resulting input screen is shown below.
Data Source:
(•) Projected ( ) Actual
Case Title: ST-DOSE Workbook Problem 2b < Site Name - NO PLANT SELECTED UNIT 1 Eff. Release Height: 0 m Default (•) Ci < Source Term • Units: ( ) Bq Reactor Accident Based On Plant Conditions Release Pathway: Large Dry or Subatmospheric Containment Leakage/Failure Core Condition: Gap Release (uncovered 15-30 min) Reactor Power: 3000 Mw(t)
Sprays: Off Release Path: Unfiltered Leak Rate: 4%/hr = 100%/day
•* Meteorological Data • date time winds stb mix precip
1 09/19/94 00:00 4 mph 90 D 500 2 < undefined > 3 < undefined > 4 < undefined >
•« Events *• Shut Down Rel->Cont Rel->Envi Rel End Expos End
08/20/94 00:00 09/19/94 00:00 09/19/94 00:00 09/19/94 01:00 09/19/94 04:00
m NONE
Calculation Options: Model: ( ) Plume Building (•) On Calculation
(•) Puff wake: ( ) Off radius: (•) 10-mile (16 km) ( ) 25-mile (40 km)
NUREG/CR-5247, Vol. 2, Rev. 2

56 RASCAL 2.1 Workbook
The resulting source term for the 30-day shutdown case is:
ST-DOSE Workbook Problem 2b NO PLANT SELECTED UNIT 1
Computed Source Term
A total of 4.6E+04 Ci were released. Release Release
Projected Data
Release Nuclide (Ci) Fract. Nuclide (Ci) Fract. Nuclide (Ci) Fract. Kr-85 1.1E+03 2.0E-03 1-133 9.8E-06 1.5E-03 Xe-133m 1.4E+00 2.0E-03 Cs-137 7.2E+03 1.5E-03 Cs-135 9.6E-05 1.5E-03
1-131 9.7E+03 1.5E-03 1-132 Xe-131m 7.3E+02 2.0E-03 Xe-133 Cs-134 1.1E+04 1.5E-03 Cs-136 Rb-87 2.2E-10 1.5E-03 1-129 Ba-137m 7.2E+03 1.6E-03
3.1E+02 1.5E-03 8.0E+03 2.0E-03 9.3E+02 1.5E-03 2.3E-05 1.5E-03
NOTES: 1. The fraction printed is the fraction of the core inventory released
to the environment.
The list of radionuclides released is shorter and the total amount of material released is smaller. The shorter lived isotopes such as 1 3 3I have decayed away. Why doesn't the source term contain any Te?
The resulting doses from the 30-day shutdown case are:
ST-DOSE Workbook Problem 2b NO PLANT SELECTED UNIT 1 Projected Data Distance Maximum EARLY-PHASE Doses (rem) Puff Model from Site, mi(km) .5( .8) 1.0(1.6) 2.0(3.2) 5.0(8.0) 10.(16.)
Total EDE (EPA) *4.9E+00 *3.0E+00 *2.0E+00 7.8E-01 3.3E-01 Thyroid (EPA) *4.3E+01 *2.6E+01 *1.7E+01 *6.9E+00 2.9E+00 Acute Lung 7.8E-01 4.7E-01 3.1E-01 1.2E-01 5.3E-02 Acute Bone Total 5.8E-01 3.5E-01 2.3E-01 9.4E-02 3.9E-02
Acute Bone Inhalatn 5.3E-01 3.2E-01 2.1E-01 8.4E-02 3.6E-02 Cloud Shine 2.1E-02 1.6E-02 1.1E-02 6.0E-03 2.6E-03 Inital Ground Shine 3.0E-02 1.8E-02 1.1E-02 3.4E-03 0.0E+00 4-Day Ground Shine 7.9E-01 4.8E-01 3.2E-01 1.2E-01 5.3E-02 CEDE Inhalation 4.1E+00 2.5E+00 1.6E+00 6.5E-01 2.8E-01 ;
The ratio of the thyroid doses at 1 mile for 0 versus 30 day shutdown periods is 26 rem / 450 rem or 0.06. This agrees closely with the chart on page C-93 of RTM-93 which shows the correction factor for thyroid doses with 30 day shutdown to be about 0.05.
NUREG/CR-5247, Vol. 2, Rev. 2

ST-DOSE Exercise Discussions 57
The dose versus distance curve of the two shutdown cases illustrates how important the duration of shutdown can be in determining the severity of an accident.
1.0E+03
1.0E+00 4 6
Distance (miles) 10
-«- 0 days 30 days
NUREG/CR-5247, Vol. 2, Rev. 2

58 RASCAL 2.1 Workbook
5 Holdup Time (problem on page 40)
Specify South Texas Unit 1 as the plant. Since the plant has operated at 80% of full power for the past year reduce the default power of 3800 Mw(t) to 3040 Mw(t). The duration the core was uncovered translates into a gap release as indicated on the core condition choice list. As specified, the sprays are OFF and the containment is leaking at 100%/day. Assume the default meteorology. Set the calculation radius to 25 miles.
The "Hold Up Time" is the difference between the release to the containment (Rel->Cont) and the release to the environment (Rel->Envi). As you will see, hold up time is important because the longer the non-noble gases remain in the containment before the release the greater the amount of fission products that will have plated out or otherwise been removed and not be available for release.
Make two assessments: a) no holdup - release to containment and release to environment occur simultaneously; b) 24 hour holdup -release to environment occurs 24 hours after release to containment.
For the no holdup case, the first three event times were left unchanged from the default of midnight. Release end and exposure end were set as specified. The calculation radius is set to 25 miles.
Case Title: ST-DOSE Workbook Problem 3a < Site Name • SOUTH TEXAS UNIT 1 Eff. Release Height: 0 m Default (•) Ci Data (•) Projected < Source Term •• Units: ( ) Bq Source: ( ) Actual Reactor Accident Based On Plant Conditions
Release Pathway: Large Dry or Subatmospheric Containment Leakage/Failure Core Condition: Gap Release (uncovered 15-30 min) Reactor Power: 3040 Mw(t)
Sprays: Off Release Path: Unfiltered Leak Rate: 4%/hr = 100%/day
-« Events • * Meteorological Data • Shut Down 09/19/94 00:00 date time winds stb mix precip Rel->Cont 09/19/94 00:00 1 09/19/94 00:00 4 mph 90 D 500 m NONE Rel->Envi 09/19/94 00:00 2 < undefined > Rel End 09/19/94 03:00 3 < undefined > Expos End 09/19/94 12:00 4 < undefined >
Calculation Options: Model: ( ) Plume Building (o) on Calculation ( ) 10-mile (16 km)
(•) Puff wake: ( ) Off radius: (•) 25-mile (40 km)
NUREG/CR-5247, Vol. 2, Rev. 2

ST-DOSE Exercise Discussions 59
The resulting doses for the no holdup case are:
ST-DOSE Workbook Problem 3a I SOUTH TEXAS UNIT 1 Projected Data I Distance Maximum EARLY-PHASE Doses (rem) Puff Model i from Site, mi(km) .5( .8) 1.0(1.6) 2.0(3.2) 10.(16.) 25.(40.) i Total EDE (EPA) *1.2E+02 *7.3E+01 *4.9E+01 *8.3E+00 *1.8E+00 Thyroid (EPA) *2.2E+03 *1.4E+03 *9.0E+02 *1.5E+02 *3.6E+01 | Acute Lung 2.3E+01 1.4E+01 9.3E+00 1.6E+00 3.7E-01 Acute Bone Total 2.6E+01 1.7E+01 1.1E+01 1.9E+00 3.2E-01 • Acute Bone Inhalatn 2.9E+00 1.7E+00 1.2E+00 2.0E-01 4.6E-02 « Cloud Shine 5.5E+00 4.2E+00 3.0E+00 7.4E-01 1.6E-01 ' Inital Ground Shine 1.8E+01 1.1E+01 7.0E+00 9.6E-01 1.2E-01 4-Day Ground Shine 3.4E+01 2.0E+01 1.3E+01 2.1E+00 3.8E-01 CEDE Inhalation 8.0E+01 4.8E+01 3.2E+01 5.5E+00 1.3E+00
The PAG for TEDE is 1 rem. The TEDE PAG has been exceeded at 25 miles. The PAG for thyroid dose is 5 rem. The thyroid PAG has been exceeded at 25 miles. Doses suggest that evacuation to at least 25 miles would be appropriate. No early health effects are indicated.
For the 24 hour holdup case, the last three event times and the meteorological data record time were set 1 day ahead.
Data Source:
(•) Projected ( ) Actual
Case Title: ST-DOSE Workbook Problem 3b < Site Name • SOUTH TEXAS UNIT 1 Eff. Release Height: 0 m Default (•) Ci < Source Term • Units: ( ) Bq Reactor Accident Based On Plant Conditions Release Pathway: Large Dry or Subatmospheric Containment Leakage/Failure
Gap Release (uncovered 15-30 min) 3040 Mw(t) Off Release Path: Unfiltered 4%/hr = 100%/day
< Meteorological Data • date time winds stb mix precip
1 09/20/94 00:00 4 mph 90 D 500 m NONE 2 < undefined > 3 < undefined > 4 < undefined >
Core Condition Reactor Power
Sprays Leak Rate
^ Events • Shut Down Rel->Cont Rel->Envi Rel End Expos End
09/19/94 00:00 09/19/94 00:00 09/20/94 00:00 09/20/94 03:00 09/20/94 12:00
Calculation Options: Model: ( ) Plume Building (•) On Calculation
(•) Puff wake: ( ) Off radius: ( ) 10-mile (16 km) (•) 25-mile (40 km)
NUREG/CR-5247, Vol. 2, Rev. 2
"¥<• ̂ -wr^mif 7m- vtms ,^X*^j>\.V; ,.<-ss£r.;v ~T~

60 RASCAL 2.1 Workbook
You may have discovered that ST-DOSE will not accept a time of 24:00. To enter a 24 hour holdup which begins and ends at midnight, it is necessary to change the date.
The resulting early-phase doses for the 24-hour holdup case are:
ST-DOSE Workbook Problem 3b 09/19/94 09:57 SOUTH TEXAS UNIT 1 Projected Data Distance Maximum EARLY-PHASE Doses (rem) Puff Model from Site, mi(km) .5;( .8) 1.0(1.6) 2.0(3.2) 10.(16.) 25.(40.)
Total EDE (EPA) *3.2E+00 *2.0E+00 *1.3E+00 2.2E-01 5.0E-02 Thyroid (EPA) *7.0E+01 *4.2E+01 *2.8E+01 4.8E+00 1.1E+00 Acute Lung 4.8E-01 2.9E-01 1.9E-01 3.3E-02 7.7E-03 Acute Bone Total 4.2E-01 2.7E-01 1.8E-01 3.2E^02 5.1E-03
Acute Bone Inhalatn 1.0E-01 6.2E-02 4.1E-02 7.1E-03 1.7E-03 Cloud Shine 1.2E-01 8.7E-02 6.0E-02 1.4E-02 2.0E-03 Inital Ground Shine 2.1E-01 1.2E-01 8.1E-02 1.1E-02 1.4E-03 4-Day Ground Shine 5.6E-01 3.4E-01 2.2E-01 3.5E-02 7.1E-03 CEDE Inhalation 2.5E+00 1.5E+00 1.0E+00 1.7E-01 4.1E-02
The TEDE and thyroid dose numbers are significantly lower. The TEDE exceeds the PAG at 2 miles. However, since the puff model was run with a calculation radius of 25 miles, the maximum value table does not report doses at 5 miles. Based on these new numbers, the model should be rerun with a calculation radius of 10 miles. An easy alternative is to examine the graphics output and estimate where the doses exceed PAGs.
Plotting the results shows that the 24 hours of holdup reduces both TEDE and thyroid doses by about 30 times.
NUREG/CR-5247, Vol. 2, Rev. 2

STDOSEExercise Discussions 61
1.0E+03 T
1.0E+02
1.0E-01 -;•
1.0E-02 H 1 1 1 *-
10 15 Distance (miles)
20 25
•*-0hr holdup -*- 24 hr holdup
1.0E+04
.1.0E+03 <D
Q1.0E+02
S l - 1.0E+01 "
1.0E+00 10 15 Distance (miles)
20 25
-»- 0 hr holdup -*- 24 hr holdup
Even if there are no sprays, if the release can be held up to allow natural processes to reduce the airborne (available for release) amounts of the non-noble gases (e.g. I, Cs), the consequences of the release will be greatly reduced. This is clearly seen in the latest consequences study (NUREG-1150, 1987) where virtually no offsite deaths are predicted for late containment failure.
NUREG/CR5247, Vol.2,Rev.2
y^-wc::^: '-- •;;m:s^rM^~m>'-i
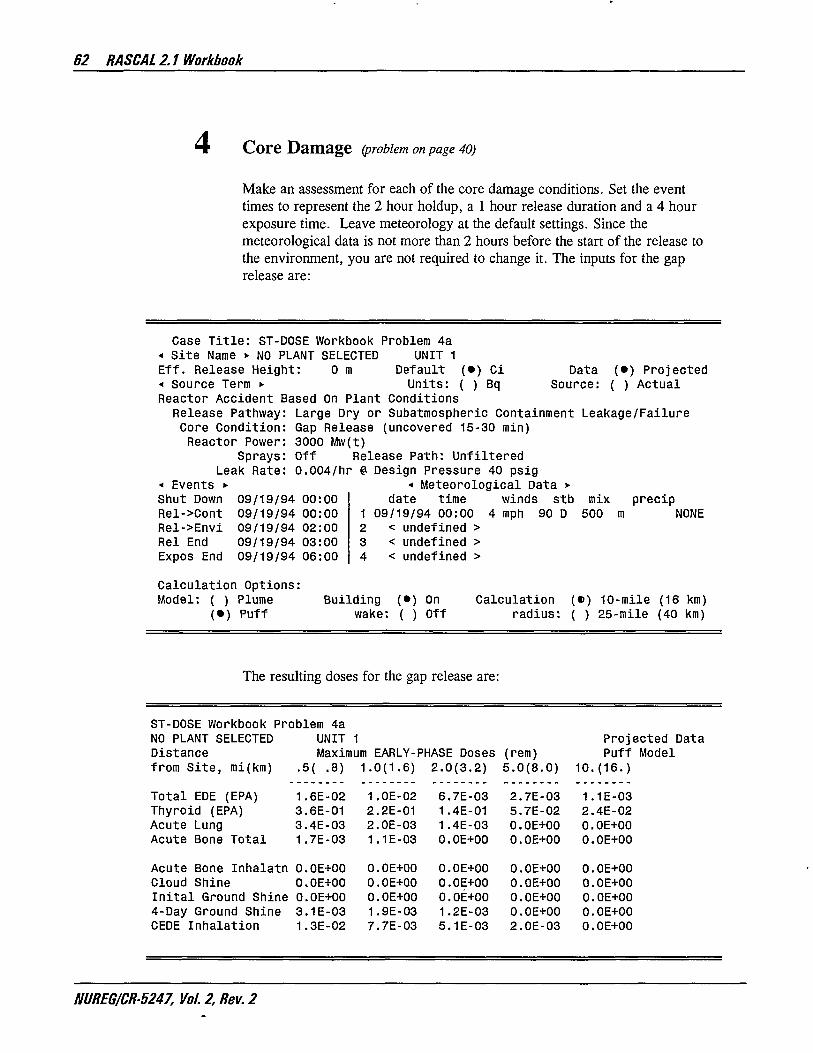
62 RASCAL 2.1 Workbook
C o r e D a m a g e (problem on page 40)
Make an assessment for each of the core damage conditions. Set the event times to represent the 2 hour holdup, a 1 hour release duration and a 4 hour exposure time. Leave meteorology at the default settings. Since the meteorological data is not more than 2 hours before the start of the release to the environment, you are not required to change it. The inputs for the gap release are:
ST-DOSE Workbook Problem 4a UNIT 1
Case Title: < Site Name >• NO PLANT SELECTED Eff. Release Height: 0 m - Source Term »•
Default (•) Ci Data (•) Projected Units: ( ) Bq Source: ( ) Actual
Reactor Accident Based On Plant Conditions Release Pathway: Large Dry or Subatmospheric Containment Leakage/Failure Core Condition: Gap Release (uncovered 15-30 min) Reactor Power: 3000 Mw(t)
Sprays: Off Release Path: Unfiltered Leak Rate: 0.004/hr @ Design Pressure 40 psig
< Events >• Shut Down Rel->Cont Rel->Envi Rel End Expos End
09/19/94 00:00 09/19/94 00:00 09/19/94 02:00 09/19/94 03:00 09/19/94 06:00
< Meteorological Data •• date time
1 09/19/94 00:00 2 < undefined > 3 < undefined > 4 < undefined >
winds stb mix 4 mph 90 D 500
precip NONE
Calculat ion Options: Model: ( ) Plume
(• ) Puff Building (•) On
wake: ( ) Off Calculation
radius: (•) 10-mile (16 km) ( ) 25-mile (40 km)
The resulting doses for the gap release are:
ST-DOSE Workbook Problem 4a NO PLANT SELECTED UNIT 1 Projected Data Distance Maximum EARLY-PHASE Doses (rem) Puff Model from Site, mi(km) .5( .8) 1.0(1.6) 2.0(3.2) 5.0(8.0) 10.(16.)
Total EDE (EPA) 1.6E-02 1.0E-02 6.7E-03 2.7E-03 1.1E-03 Thyroid (EPA) 3.6E-01 2.2E-01 1.4E-01 5.7E-02 2.4E-02 Acute Lung 3.4E-03 2.0E-03 1.4E-03 O.OE+00 0.0E+00 Acute Bone Total 1.7E-03 1.1E-03 O.OE+00 O.OE+00 0.0E+00
Acute Bone Inhalatn 0.0E+00 O.OE+00 O.OE+00 O.OE+00 O.OE+00 Cloud Shine 0.0E+00 O.OE+00 O.OE+00 O.OE+00 O.OE+00 Inital Ground Shine O.OE+00 O.OE+00 O.OE+00 O.OE+00 O.OE+00 4-Day Ground Shine 3.1E-03 1.9E-03 1.2E-03 O.OE+00 O.OE+00 CEDE Inhalation 1.3E-02 7.7E-03 5.1E-03 2.0E-03 O.OE+00
NUREG/CR-5247, Vol. 2, Rev. 2
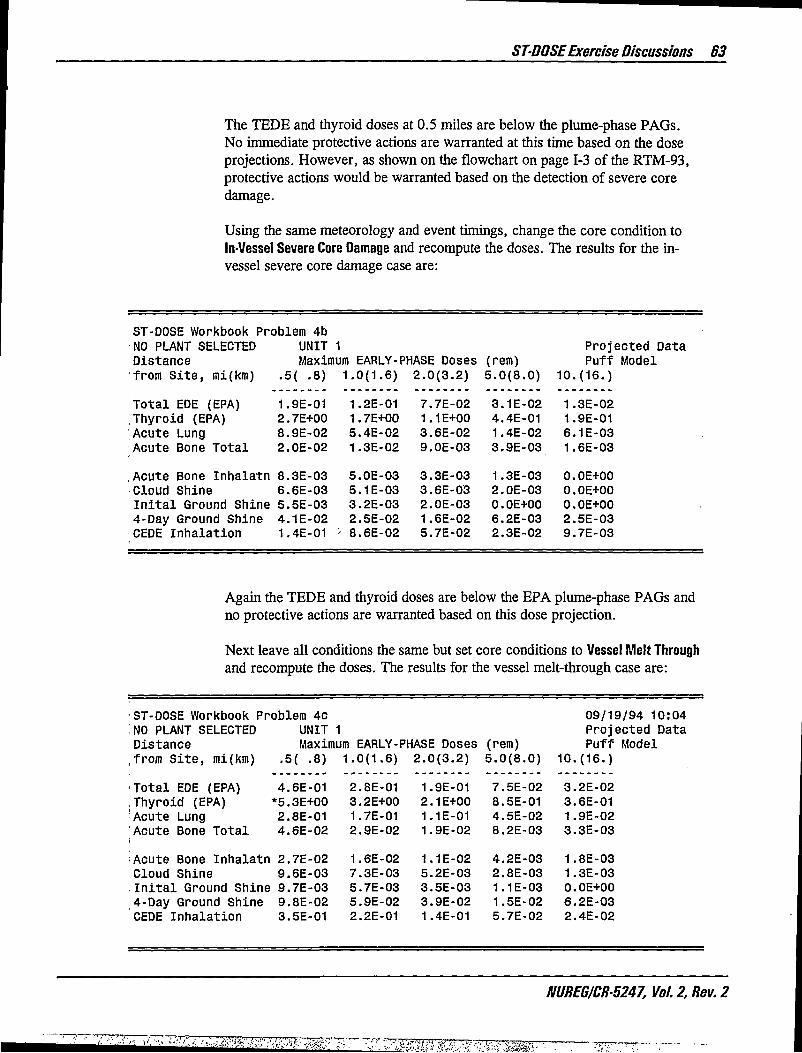
STDOSEExercise Discussions 63
The TEDE and thyroid doses at 0.5 miles are below the plume-phase PAGs. No immediate protective actions are warranted at this time based on the dose projections. However, as shown on the flowchart on page 1-3 of the RTM-93, protective actions would be warranted based on the detection of severe core damage.
Using the same meteorology and event timings, change the core condition to In-Vessel Severe Core Damage and recompute the doses. The results for the in-vessel severe core damage case are:
ST-DOSE Workbook Problem 4b NO PLANT SELECTED UNIT 1 Projected Data Distance Maximum EARLY-PHASE Doses (rem) Puff Model from Site, mi(km) .5( .8) 1.0(1.6) 2.0(3.2) 5.0(8.0) 10.(16.)
Total EDE (EPA) 1.9E-01 1.2E-01 7.7E-02 3.1E-02 1.3E-02 Thyroid (EPA) 2.7E+00 1.7E+00 1.1E+00 4.4E-01 1.9E-01 Acute Lung 8.9E-02 5.4E-02 3.6E-02 1.4E-02 6.1E-03 Acute Bone Total 2.0E-02 1.3E-02 9.0E-03 3.9E-03 1.6E-03
Acute Bone Inhalatn 8.3E-03 5.0E-03 3.3E-03 1.3E-03 O.OE+OO Cloud Shine 6.6E-03 5.1E-03 3.6E-03 2.0E-03 O.OE+OO Inital Ground Shine 5.5E-03 3.2E-03 2.0E-03 0.0E+00 0.0E+00 4-Day Ground Shine 4.1E-02 2.5E-02 1.6E-02 6.2E-03 2.5E-03 CEDE Inhalation 1.4E-01 - 8.6E-02 5.7E-02 2.3E-02 9.7E-03
Again the TEDE and thyroid doses are below the EPA plume-phase PAGs and no protective actions are warranted based on this dose projection.
Next leave all conditions the same but set core conditions to Vessel Melt Through and recompute the doses. The results for the vessel melt-through case are:
•ST-DOSE Workbook Problem 4c 09/19/94 10:04 iNO PLANT SELECTED UNIT 1 Projected Data Distance Maximum EARLY-PHASE Doses (rem) Puff Model ,from Site, mi(km) .5( .8) 1.0(1.6) 2.0(3.2) 5.0(8.0) 10.(16.)
Total EDE (EPA) 4.6E-01 2.8E-01 1.9E-01 7.5E-02 3.2E-02 .Thyroid (EPA) *5.3E+00 3.2E+00 2.1E+00 8.5E-01 3.6E-01 •Acute Lung 2.8E-01 1.7E-01 1.1E-01 4.5E-02 1.9E-02 Acute Bone Total 4.6E-02 2.9E-02 1.9E-02 8.2E-03 3.3E-03
Acute Bone Inhalatn 2.7E-02 1.6E-02 1.1E-02 4.2E-03 1.8E-03 Cloud Shine 9.6E-03 7.3E-03 5.2E-03 2.8E-03 1.3E-03 Inital Ground Shine 9.7E-03 5.7E-03 3.5E-03 1.1E-03 O.OE+OO 4-Day Ground Shine 9.8E-02 5.9E-02 3.9E-02 1.5E-02 6.2E-03 CEDE Inhalation 3.5E-01 2.2E-01 1.4E-01 5.7E-02 2.4E-02
NUREG/CR-5247, Vol. 2, Rev. 2
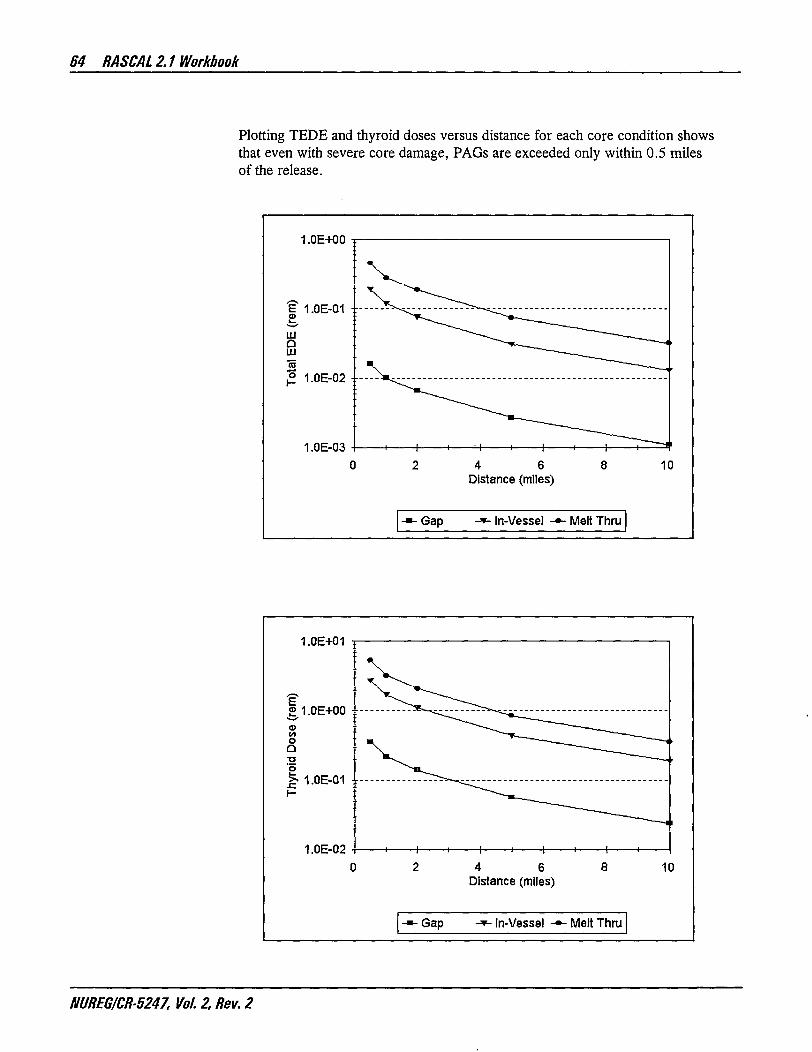
64 RASCAL 2.1 Workbook
Plotting TEDE and thyroid doses versus distance for each core condition shows that even with severe core damage, PAGs are exceeded only within 0.5 miles of the release.
1.0E+00
S 1.0E-01 d>
111 Q LLI
,2 1.0E-02
1.0E-03 -I 1 1 y t 1 1 1 H-
4 6 Distance (miles)
10
-•-Gap In-Vessel - • - Melt Thru
1.0E+01 T
E £ 1.0E+00
o Q
>> 1.0E-01 i
1.0E-02 -I > 1 1- H 1 (-
4 6 Distance (miles)
10
-•-Gap In-Vessel -*- Melt Thru
NUREG/CR-5247, Vol. 2, Rev. 2

ST-DOSE Exercise Discussions 65
TEDE doses never exceeded EPA plume-phase PAGs. The thyroid dose was below EPA PAGs for the gap and in-vessel releases. Thyroid dose exceeded the PAG for the vessel melt through case.
If the containment holds (i.e. design leakage rates), EPA PAGs cannot be exceeded with only a gap or in-vessel release. Severe core damage is required and then EPA PAGs would be exceeded only within a few miles of the release.
CAUTION: Protective actions are taken initially based on plant conditions and not dose projections. As indicated in Section I of RTM-93, the population close to the plant (e.g. 2 miles) should be evacuated for severe core damage. All three of the core damage states evaluated in this problem are considered severe core damage and protective action should be taken.
Descriptions of the core damage states are found in the on-line help of ST-DOSE. While in the source term definition screen, press the (TT) key when the cursor is on a core condition choice box.
NUREGW-5247, Vol. 2, Rev. 2

66 RASCAL 2.1 Workbook
C o n t a i n m e n t B r e a k Size (leak rate) (problem on page 41)
Set up the problem using the Ice Condenser Containment Leakage/Failure source-term option with the gap release and the design leakage rate as shown below. Event timing and meteorology use default settings.
(•) Projected ( ) Actual
Case T i t l e : ST-DOSE Workbook Problem 5a < Si te Name • NO PLANT SELECTED UNIT 1 Ef f . Release Height: 0 m Default ( • ) Ci Data •* Source Term »• Units: ( ) Bq Source: Reactor Accident Based On Plant Conditions
Release Pathway: Ice Condenser Containment Leakage/Failure Gap Release (uncovered 15-30 min) 3000 Mw(t) Sprays: Off Fans: Off Not Exhausted Release Path: Unf i l te red 0.004/hr @ Design Pressure 40 psig
•» Meteorological Data • date time winds stb mix
1 09/19/94 00:00 4 mph 90 D 500 2 < undefined > 3 < undefined > 4 < undefined >
Core Condition Reactor Power
Ice bed Leak Rate
•* Events • Shut Down Rel->Cont Rel->Envi Rel End Expos End
09/19/94 00:00 09/19/94 00:00 09/19/94 00:00 09/19/94 01:00 09/19/94 04:00
precip NONE
Calculat ion Options: Model: ( ) Plume Bui lding (•) On
(• ) Puff wake: ( ) Off Calculation (•) 10-mile (16 km)
radius: { ) 25-mile (40 km)
The doses resulting from the design leak rate are:
ST-DOSE Workbook Problem 5a NO PLANT SELECTED UNIT 1 Projected Data Distance Maximum EARLY-PHASE Doses (rem) Puff Model from Site, mi(km) .5( .8) 1.0(1.6) 2.0(3.2) 5.0(8.0) 10.(16.)
Total EDE (EPA) 1.9E-02 1.2E-02 7.8E-03 3.1E-03 1.3E-03 Thyroid (EPA) 3.8E-01 2.3E-01 1.5E-01 6.1E-02 2.6E-02 Acute Lung 4.0E-03 2.4E-03 1.6E-03 O.OE+00 O.OE+00 Acute Bone Total 2.8E-03 1.9E-03 1.3E-03 O.OE+00 O.OE+00
Acute Bone Inhalatn 0.0E+00 0.0E+00 0.0E+00 O.OE+00 O.OE+00 Cloud Shine 1.2E-03 0.0E+00 O.OE+00 O.OE+00 O.OE+OO Inital Ground Shine 1.1E-03 0.0E+00 0.0E+00 O.OE+00 O.OE+00 4-Day Ground Shine 4.0E-03 2.4E-03 1.6E-03 O.OE+00 O.OE+00 CEDE Inhalation 1.4E-02 8.3E-03 5.5E-03 2.2E-03 O.OE+00
The TEDE and thyroid doses are below EPA PAG levels at 0.5 mile. The acute bone doses are below the early health effects thresholds at 0.5 mile.
NUREG/CR-5247, Vol. 2, Rev. 2
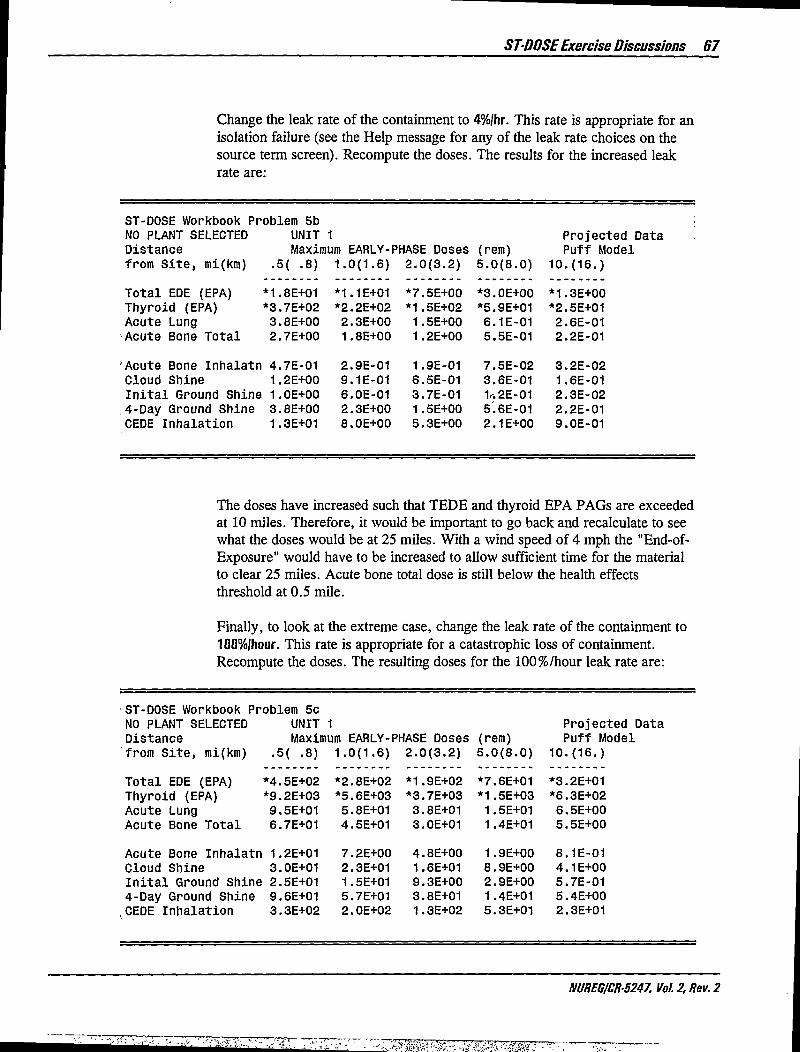
STDOSEExercise Discussions 67
Change the leak rate of the containment to 4%/hr. This rate is appropriate for an isolation failure (see the Help message for any of the leak rate choices on the source term screen). Recompute the doses. The results for the increased leak rate are:
ST-DOSE Workbook Problem 5b NO PLANT SELECTED UNIT 1 Projected Data Distance Maximum EARLY-PHASE Doses (rem) Puff Model from Site, mi(km) .5( .8) 1.0(1.6) 2.0(3.2) 5.0(8.0) 10.(16.)
Total EDE (EPA) *1.8E+01 *1.1E+01 *7.5E+00 *3.0E+00 *1.3E+00 Thyroid (EPA) *3.7E+02 *2.2E+02 *1.5E+02 *5.9E+01 *2.5E+01 Acute Lung 3.8E+00 2.3E+00 1.5E+00 6.1E-01 2.6E-01 Acute Bone Total 2.7E+00 1.8E+00 1.2E+00 5.5E-01 2.2E-01
Acute Bone Inhalatn 4.7E-01 2.9E-01 1.9E-01 7.5E-02 3.2E-02 Cloud Shine 1.2E+00 9.1E-01 6.5E-01 3.6E-01 1.6E-01 Inital Ground Shine 1.0E+00 6.0E-01 3.7E-01 1r.2E-01 2.3E-02 ,4-Day Ground Shine 3.8E+00 2.3E+00 1.5E+00 5.6E-01 2.2E-01 CEDE Inhalation 1.3E+01 8.0E+00 5.3E+00 2.1E+00 9.0E-01
The doses have increased such that TEDE and thyroid EPA PAGs are exceeded at 10 miles. Therefore, it would be important to go back and recalculate to see what the doses would be at 25 miles. With a wind speed of 4 mph the "End-of-Exposure" would have to be increased to allow sufficient time for the material to clear 25 miles. Acute bone total dose is still below the health effects threshold at 0.5 mile.
Finally, to look at the extreme case, change the leak rate of the containment to 100%/hour. This rate is appropriate for a catastrophic loss of containment. Recompute the doses. The resulting doses for the 100%/hour leak rate are:
•ST-DOSE Workbook Problem 5c NO PLANT SELECTED UNIT 1 Projected Data Distance Maximum EARLY-PHASE Doses (rem) Puff Model from Site, mi(km) .5( .8) 1.0(1.6) 2.0(3.2) 5.0(8.0) 10.(16.)
Total EDE (EPA) *4.5E+02 *2.8E+02 *1.9E+02 *7.6E+01 *3.2E+01 Thyroid (EPA) *9.2E+03 *5.6E+03 *3.7E+03 *1.5E+03 *6.3E+02 Acute Lung 9.5E+01 5.8E+01 3.8E+01 1.5E+01 6.5E+00 Acute Bone Total 6.7E+01 4.5E+01 3.0E+01 1.4E+01 5.5E+00
Acute Bone Inhalatn 1.2E+01 7.2E+00 4.8E+00 1.9E+00 8.1E-01 Cloud Shine 3.0E+01 2.3E+01 1.6E+01 8.9E+00 4.1E+00 Inital Ground Shine 2.5E+01 1.5E+01 9.3E+00 2.9E+00 5.7E-01 4-Day Ground Shine 9.6E+01 5.7E+01 3.8E+01 1.4E+01 5.4E+00 CEDE Inhalation 3.3E+02 2.0E+02 1.3E+02 5.3E+01 2.3E+01
NUREG/CR-5247, Vol. 2, Rev. 2

68 RASCAL 2.1 Workbook
The doses have again increased. TEDE and thyroid both greatly exceed EPA PAGs at 10 miles. Again, the model run should be repeated with a longer exposure time to allow the material to clear 25 miles. There are now early health effects close to the release for both acute bone and thyroid.
Answers to additional questions:
a. Loss of AC power would result in loss of the recirculation fans.
b. Ratio the results up or down to adjust to the desired leak rate.
c. See the help text on the ICE BED field for the reduction factors.
Ice and No Fans No Ice
RDF = 0.5 RDF = 1.0 (no reduction)
The core is uncovered after the ice has been exhausted while trying to remove decay heat. The recirculation system may have failed.
Yes, if the containment pressure is near design pressure for about one hour. Also, by assuming a one hour release, the cloud shine dose could be used to estimate the dose rate (R/hr) as measured by an instrument.
The plots of dose versus distance show clearly the increasing consequences as leak rates increase.
1.0E+02 ¥
| 1.0E+01
1.0E-03 4 6
Distance (miles) 10
-"-Design -*-4%/hr -*- 100%/hr
NUREG/CR-5247, Vol. 2, Rev. 2

ST-DOSE Exercise Discussions 69
1.0E+04 T
1.0E+03 -•
£ 1.0E+02 -:•
Q L O E + 0 1
>>1.0E+00 i
1.0E-01
1.0E-02 4 6
Distance (miles) 10
-•-Design -*-4%/hr 100%/hr
Appendix C of the RASCAL v2.1 User's Guide discusses the ST-DOSE source term methodology. Releases based on plant conditions are estimated by taking the product of a number of factors times an estimated core inventory. One of the factors in the source term equation which reduces the amount available is the efficiency factor or leak rate. Table C.l of the User's Guide or the on-line text available under View Assumptions | Release Rates and Reduction Factors lists the factors used for the leak rates in ST-DOSE.
In this problem, the total number of curies released (available in the computed source term text output) is directly related to the efficiency factor associated with the leak rates.
Leak Rate Efficiency Factor Total Ci released
100%/hour 1.0 4.4 x 10⁷
4%/hour 0.04 1.8 xlO 6
Design (0.004%/hour) 0.00004 1.8 xlO 3
NUREG/CR-5247, Vol. 2, Rev. 2
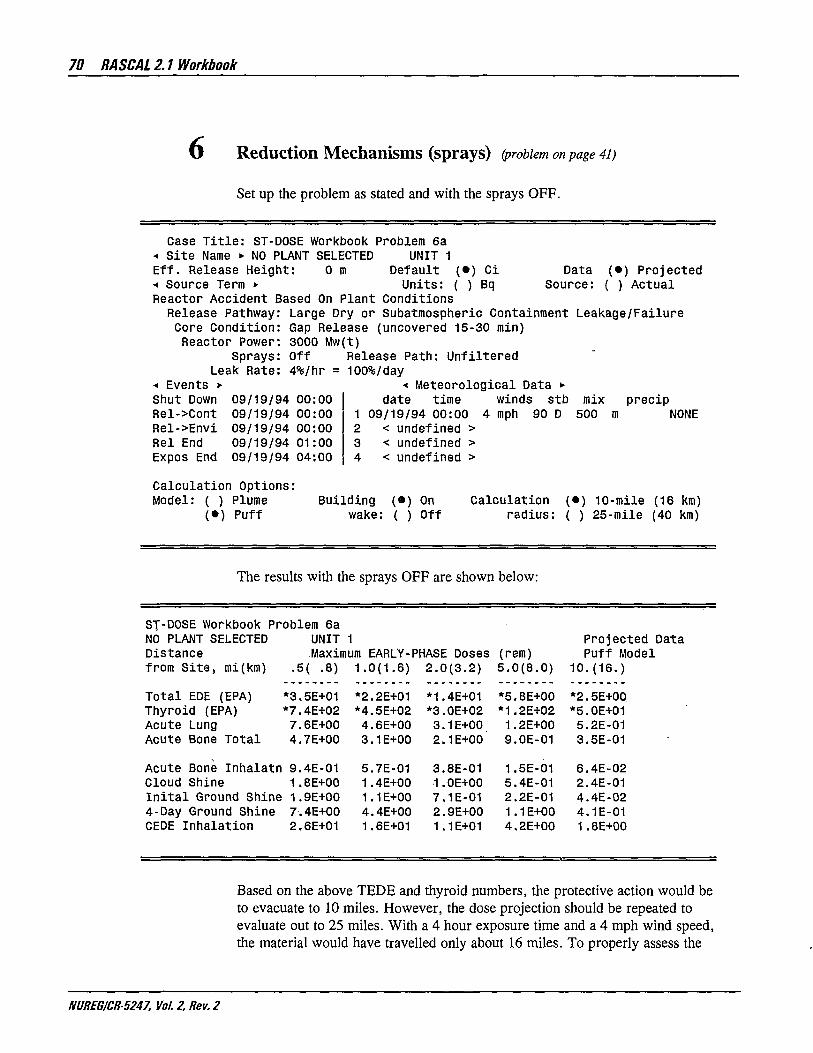
70 RASCAL 2.1 Workbook
Reduction Mechanisms (sprays) (problem on page 4i)
Set up the problem as stated and with the sprays OFF.
Data (•) Projected Source: ( ) Actual
Case Title: ST-DOSE Workbook Problem 6a < Site Name • NO PUNT SELECTED UNIT 1 Eff. Release Height: 0 m Default (•) Ci -« Source Term • Units: ( ) Bq Reactor Accident Based On Plant Conditions Release Pathway: Large Dry or Subatmospheric Gontainment Leakage/Failure
Gap Release (uncovered 15-30 min) 3000 Mw(t) Off Release Path: Unfiltered 4%/hr = 100%/day
< Meteorological Data *• date time winds stb mix precip
1 09/19/94 00:00 4 mph 90 D 500 m NONE 2 < undef ined > 3 < undef ined > 4 < undef ined >
Core Cond i t i on Reactor Power
Sprays Leak Rate
t Events • Shut Down Rel->Cont Re l ->Env i Rel End Expos End
09/19/94 00:00 09/19/94 00:00 09/19/94 00:00 09/19/94 01:00 09/19/94 04:00
C a l c u l a t i o n Op t ions : Model: ( ) Plume
( • ) Puf f B u i l d i n g ( • ) On
wake: ( ) Of f Calculation
radius: (•) 10-mile (16 km) ( ) 25-mile (40 km)
The results with the sprays OFF are shown below:
ST-DOSE Workbook Problem 6a NO PLANT SELECTED UNIT 1 Projected Data Distance Maximum EARLY-PHASE Doses (rem) Puff Model from Site, mi(km) .5( .8) 1.0(1.6) 2.0(3.2) 5.0(8.0) 10.(16.)
Total EDE (EPA) *3.5E+01 *2.2E+01 *1.4E+01 *5.8E+00 *2.5E+00 Thyroid (EPA) *7.4E+02 *4.5E+02 *3.0E+02 *1.2E+02 *5.0E+01 Acute Lung 7.6E+00 4.6E+00 3.1E+00 1.2E+00 5.2E-01 Acute Bone Total 4.7E+00 3.1E+00 2.1E+00 9.0E-01 3.5E-01
Acute Bone Inhalatn 9.4E-01 5.7E-01 3.8E-01 1.5E-01 6.4E-02 Cloud Shine 1.8E+00 1.4E+00 1.0E+00 5.4E-01 2.4E-01 Inital Ground Shine 1.9E+00 1.1E+00 7.1E-01 2.2E-01 4.4E-02 4-Day Ground Shine 7.4E+00 4.4E+00 2.9E+00 1.1E+00 4.1E-01 CEDE Inhalation 2.6E+01 1.6E+01 1.1E+01 4.2E+00 1.8E+00
Based on the above TEDE and thyroid numbers, the protective action would be to evacuate to 10 miles. However, the dose projection should be repeated to evaluate out to 25 miles. With a 4 hour exposure time and a 4 mph wind speed, the material would have travelled only about 16 miles. To properly assess the
NUREG/CR-5247, Vol. 2, Rev. 2
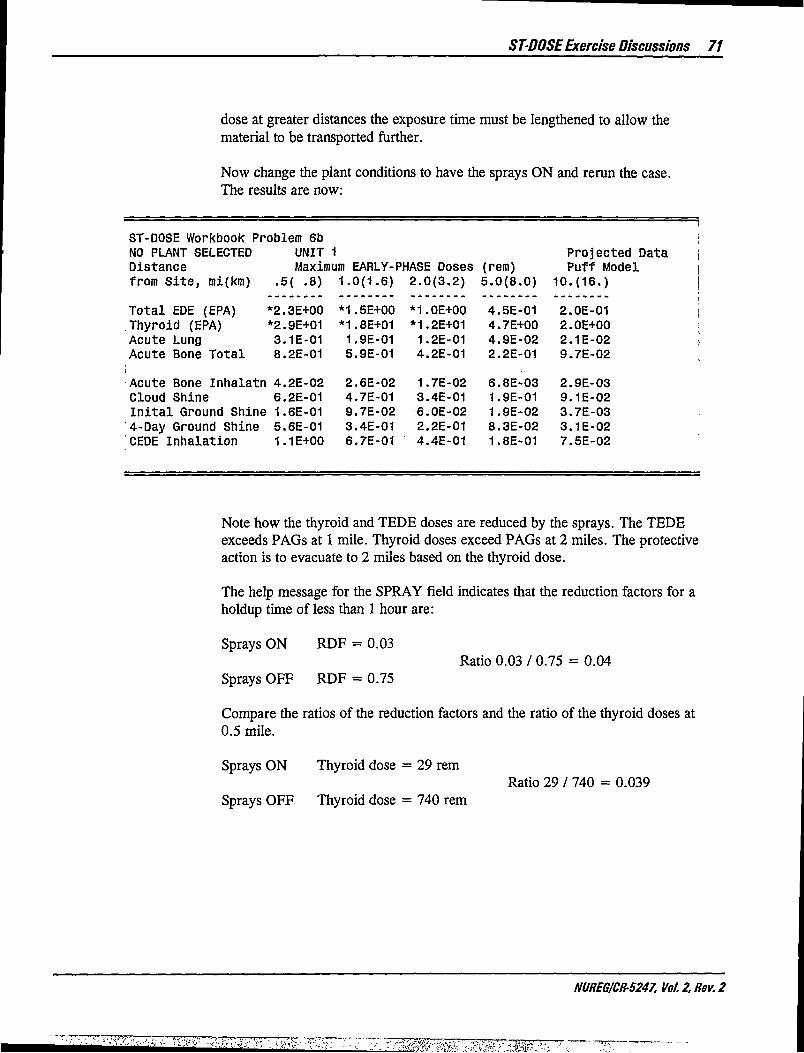
ST-DOSE Exercise Discussions 71
dose at greater distances the exposure time must be lengthened to allow the material to be transported further.
Now change the plant conditions to have the sprays ON and rerun the case. The results are now:
ST-DOSE Workbook Problem 6b !
NO PLANT SELECTED UNIT 1 Projected Data j Distance Maximum EARLY-PHASE Doses (rem) Puff Model j from Site, mi(km) .5( .8) 1.0(1.6) 2.0(3.2) 5.0(8.0) 10.(16.) J Total EDE (EPA) *2.3E+00 *1.5E+00 *1.0E+00 4.5E-01 2.0E-01 i Thyroid (EPA) *2.9E+01 *1.8E+01 *1.2E+01 4.7E+00 2.0E+00 Acute Lung 3.1E-01 1.9E-01 1.2E-01 4.9E-02 2.1E-02 i Acute Bone Total 8.2E-01 5.9E-01 4.2E-01 2.2E-01 9.7E-02
Acute Bone Inhalatn 4.2E-02 2.6E-02 1.7E-02 6.8E-03 2.9E-03 Cloud Shine 6.2E-01 4.7E-01 3.4E-01 1.9E-01 9.1E-02 Inital Ground Shine 1.6E-01 9.7E-02 6.0E-02 1.9E-02 3.7E-03 4-Day Ground Shine 5.6E-01 3.4E-01 2.2E-01 8.3E-02 3.1E-02 CEDE Inhalation 1.1E+00 6.7E-01 4.4E-01 1.8E-01 7.5E-02
Note how the thyroid and TEDE doses are reduced by the sprays. The TEDE exceeds PAGs at 1 mile. Thyroid doses exceed PAGs at 2 miles. The protective action is to evacuate to 2 miles based on the thyroid dose.
The help message for the SPRAY field indicates that the reduction factors for a holdup time of less than 1 hour are:
Sprays ON RDF = 0.03 Ratio 0.03 / 0.75 = 0.04
Sprays OFF RDF = 0.75
Compare the ratios of the reduction factors and the ratio of the thyroid doses at 0.5 mile.
Sprays ON Thyroid dose = 29 rem Ratio 29 / 740 = 0.039
Sprays OFF Thyroid dose = 740 rem
NUREG/CR-5247, Vol. 2, Rev. 2

72 RASCAL 2.1 Workbook
1.0E+02
S1.0E+01 o
IU Q LU
£ 1.0E+00
1.0E-01 -* 1 1 1 1 1 1 f -
4 6 Distance (miles)
10
-»- Sprays OFF -*- Sprays ON
1.0E+03
2M.0E+02 a> to o Q •a 'o >>1.0E+01 -•
1.0E+00 -t h H h
4 6 Distance (miles)
10
-*- Sprays OFF -*- Sprays ON
NUREG/CR-5247, Vol. 2, Rev. 2

ST-DOSE Exercise Discussions 73
Wind Speed and Inhalation Dose (problem on page 42)
Set up the problem using the isotopic source term option and with a wind speed of 6 mph. All other conditions are default.
Case T i t l e : ST-DOSE Workbook Problem 7a < S i te Name • NO PLANT SELECTED UNIT 1 Ef f . Release Height: 0 m Default (•) Ci •* Source Term • Uni ts: ( ) Bq User Specif ied Isotopic Release Rates Uni ts : Ci/sec
1-131 5.00E+003
Data {•) Projected Source: ( ) Actual
•< Events • Decy S t r t Rel->Cont Rel->Envi Rel End
< NA > < NA >
09/19/94 00:00 09/19/94 01:00
Expos End 09/19/94 04:00 4 < undefined >
•« Meteorological Data • date time winds stb mix
1 09/19/94 00:00 6 mph 90 D 500 m 2 < undefined > 3 < undefined >
precip NONE
Calculat ion Options: Model: ( ) Plume Bui lding (•) On
( • ) Puff wake: ( ) Off Calculation {•) 10-mile (16 km)
radius: ( ) 25-mile (40 km)
Note that when working with an isotopic source term no times are entered for shutdown or release to containment. The isotopic source-term option assumes you know the composition of the release and the rate of release to the environment. There is no decay from shutdown and no reduction in the containment. The resulting doses for the 6 mph case are:
ST-DOSE Workbook Problem 7a NO PLANT SELECTED UNIT 1 Projected Data Distance Maximum EARLY-PHASE Doses (rem) Puff Model from Site, mi(km) .5( .8) 1.0(1.6) 2.0(3.2) 5.0(8.0) 10.(16.)
;Total EDE (EPA) *3.1E+03 *1.7E+03 *9.7E+02 *3.6E+02 *1.3E+02 .Thyroid (EPA) *9.4E+04 *5.2E+04 *3.0E+04 *1.1E+04 *3.9E+03 Acute Lung 2.1E+02 1.2E+02 6.6E+01 2.4E+01 8.6E+00 'Acute Bone Total 3.3E+01 1.8E+01 1.1E+01 4.2E+00 1.4E+00
;Acute Bone Inhalatn 1.7E+01 9.7E+00 5.5E+00 2.0E+00 7.1E-01 ,Cloud Shine 5.7E+00 3.4E+00 2.6E+00 1.3E+00 4.7E-01 Inital Ground Shine 9.5E+00 5.2E+00 2.8E+00 8.9E-01 2.2E-01 ;4-Day Ground Shine 2.2E+02 1.2E+02 7.0E+01 2.6E+01 9.0E+00 ICEDE Inhalation !
2.9E+03 1.6E+03 9.0E+02 3.3E+02 1.2E+02
NUREG/CR5247, Vol.2,Rev.2
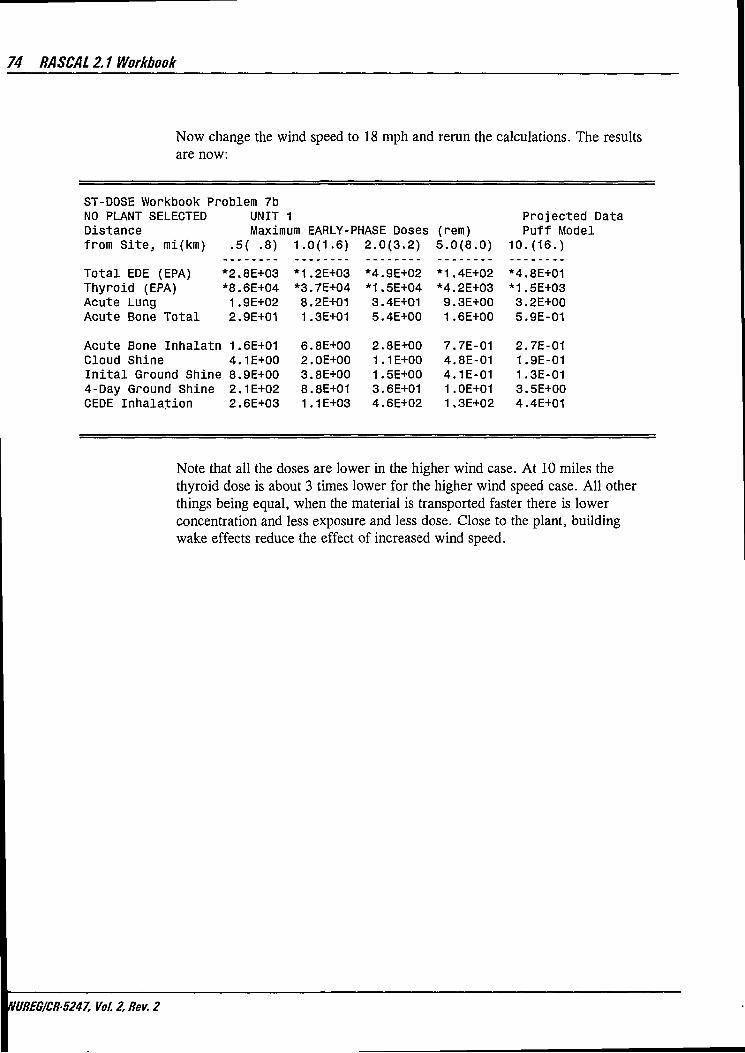
74 RASCAL 2.1Workbook
Now change the wind speed to 18 mph and rerun the calculations. The results are now:
ST-DOSE Workbook Problem 7b NO PLANT SELECTED UNIT 1 Projected Data Distance Maximum EARLY-PHASE Doses (rem) Puff Model from Site, mi(km) .5( .8) 1.0(1.6) 2.0(3.2) 5.0(8.0) 10.(16.)
Total EDE (EPA) *2.8E+03 M.2E+03 *4.9E+02 M.4E+02 *4.8E+01 Thyroid (EPA) *8.6E+04 *3.7E+04 *1.5E+04 *4.2E+03 *1.5E+03 Acute Lung 1.9E+02 8.2E+01 3.4E+01 9.3E+00 3.2E+00 Acute Bone Total 2.9E+01 1.3E+01 5.4E+00 1.6E+00 5.9E-01
Acute Bone Inhalatn 1.6E+01 6.8E+00 2.8E+00 7.7E-01 2.7E-01 Cloud Shine 4.1E+00 2.0E+00 1.1E+00 4.8E-01 1.9E-01 Inital Ground Shine 8.9E+00 3.8E+00 1.5E+00 4.1E-01 1.3E-01 4-Day Ground Shine 2.1E+02 8.8E+01 3.6E+01 1.0E+01 3.5E+00 CEDE inhalation 2.6E+03 1.1E+03 4.6E+02 1.3E+02 4.4E+01
Note that all the doses are lower in the higher wind case. At 10 miles the thyroid dose is about 3 times lower for the higher wind speed case. All other things being equal, when the material is transported faster there is lower concentration and less exposure and less dose. Close to the plant, building wake effects reduce the effect of increased wind speed.
NUREG/CRB247, Vol. 2, Rev. 2
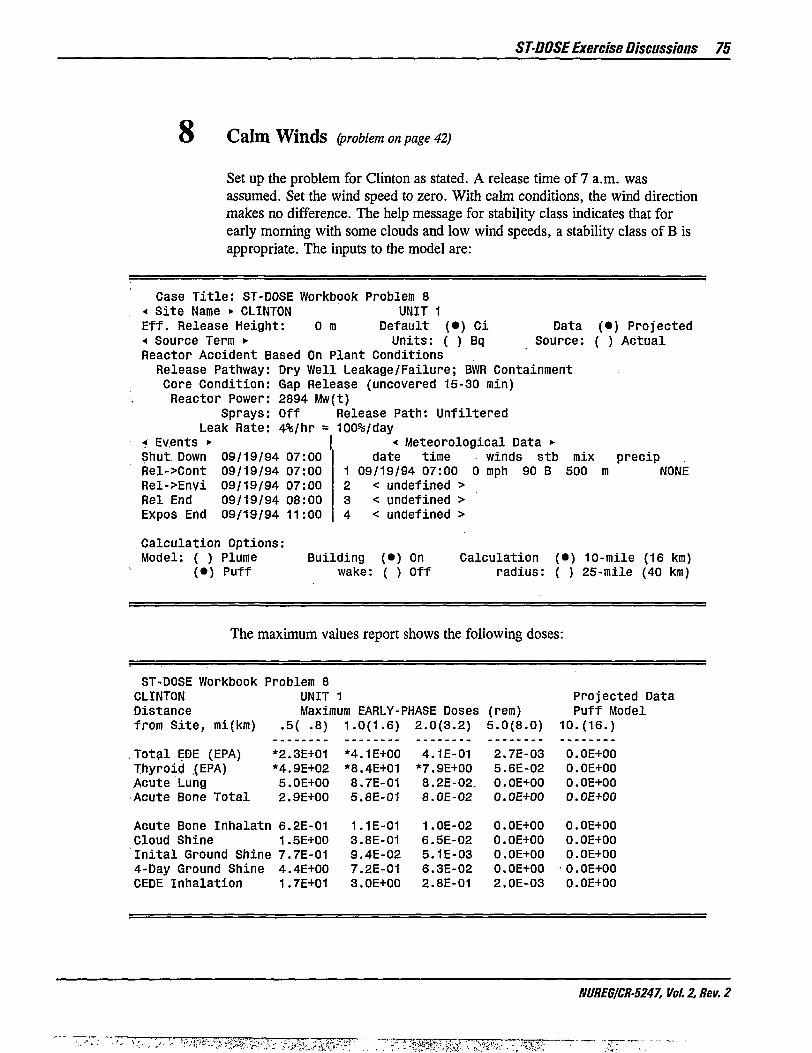
ST-DOSE Exercise Discussions 75
8 Calm Winds (problem on page 42)
Set up the problem for Clinton as stated. A release time of 7 a.m. was assumed. Set the wind speed to zero. With calm conditions, the wind direction makes no difference. The help message for stability class indicates that for early morning with some clouds and low wind speeds, a stability class of B is appropriate. The inputs to the model are:
Case T i t l e : ST-DOSE Workbook Problem 8 < Si te Name • CLINTON UNIT 1 Eff. Release Height: 0 m Default (•) Ci Data •* Source Term • Units: ( ) Bq Source: Reactor Accident Based On Plant Conditions
Release Pathway: Dry Well Leakage/Failure; BWR Containment
(•) Projected ( ) Actual
Core Condition: Gap Release (uncovered 15-30 min) Reactor Power: 2894 Mw(t)
Sprays: Off Release Path: Unfiltered Leak Rate: 4%/hr = 100%/day
* Events • 4 Meteorological Data »• Shut Down 09/19/94 07:00 date time winds stb mix precip Rel->Cont 09/19/94 07:00 1 09/19/94 07:00 0 mph 90 B 500 m NONE Rel->Envi 09/19/94 07:00 2 < undefined > Rel End 09/19/94 08:00 3 < undefined > Expos End 09/19/94 11:00 4 < undefined >
Calculation Options: Model: ( ) Plume Building (•) On Calculation (•) 10-mile (16 km)
(•) Puff wake: ( ) Off radius: ( ) 25-mile (40 km)
The maximum values report shows the following doses:
ST-DOSE Workbook Problem 8 CLINTON UNIT 1 Projected Data Distance Maximum EARLY-PHASE Doses (rem) Puff Model from Site, mi(km) .5( .8) 1.0(1.6) 2.0(3.2) 5.0(8.0) 10.(16.)
Total EDE (EPA) *2.3E+01 *4.1E+00 4.1E-01 2.7E-03 O.OE+00 Thyroid (EPA) *4.9E+02 *8.4E+01 *7.9E+00 5.6E-02 O.OE+00 Acute Lung 5.0E+00 8.7E-01 8.2E-02. O.OE+00 O.OE+00 Acute Bone Total 2.9E+00 5.8E-01 8.0E-02 O.OE+OO O.OE+00
Acute Bone Inhalatn 6.2E-01 1.1E-01 1.0E-02 O.OE+00 O.OE+00 Cloud Shine 1.5E+00 3.8E-01 6.5E-02 O.OE+00 O.OE+00 Inital Ground Shine 7.7E-01 9.4E-02 5.1E-03 O.OE+00 O.OE+00 4-Day Ground Shine 4.4E+00 7.2E-01 6.3E-02 O.OE+00 O.OE+00 CEDE Inhalation 1.7E+01 3.0E+00 2.8E-01 2.0E-03 O.OE+00
NUREG/CR-5247, Vol. 2, Rev. 2
••--•> r^.^KV-- r-^my-* • r-- 1?!?*^*'.
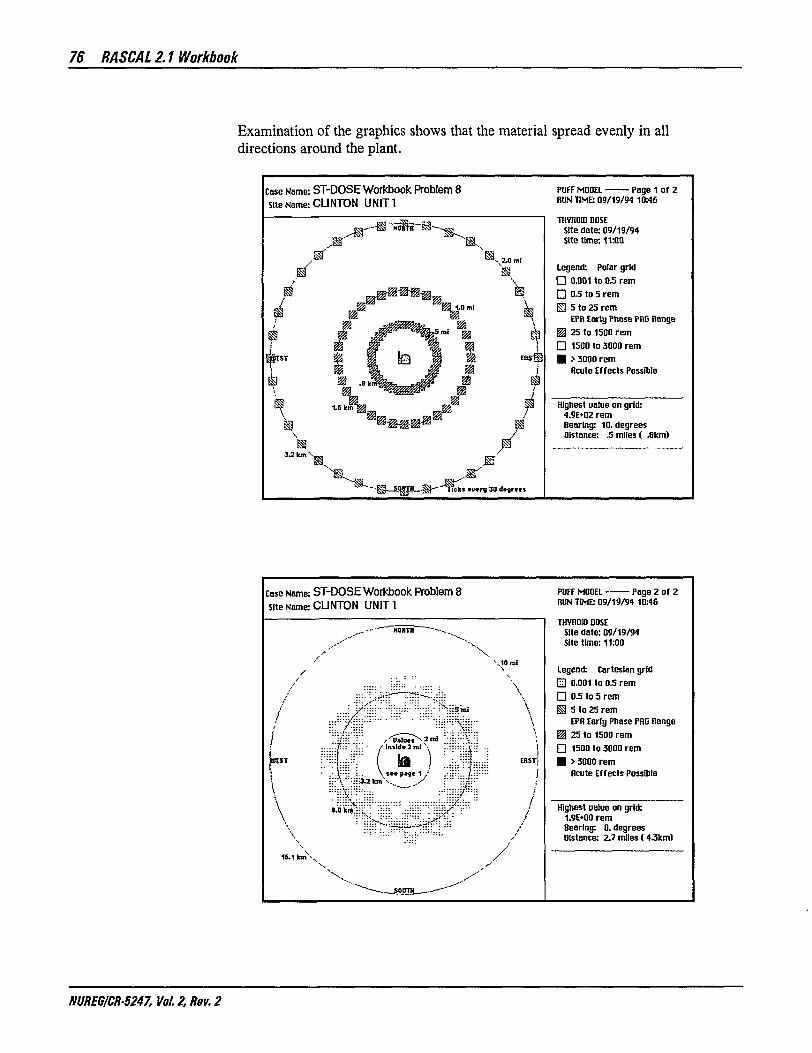
76 RASCAL 2.1 Workbook
Examination of the graphics shows that the material spread evenly in all directions around the plant.
case Name: ST-DOSE Workbook Problem 8 site Name: CLINTON UNIT1
.^W -W "Rmsr-sl-
&"
3 J k m \ _
i /
icks 9V9nt 30 d»9r«et
PUFF MODEL Page 1 of 2 RUN TIME 09/19/94 10:46
THYROID DOSE Site date: 09/19/94 Site time: 11:00
Legend: Polar grid • 0.001 to 05 rem • 0.5 to 5 rem ^ 5 to 25 rem
EPR Early Phase PHG Range B2 25 to 1500 rem • 1500 to 3000 rem • > 3000 rem
Rcute Effects Possible
Highest ualue on grid: 4.9E+02 rem Bearing: 10. degrees Distance: 3 miles ( .8km)
case Name: ST-DOSE Workbook Problem 8 Site Name: CLINTON UNIT1
X \10ml
\ \ V
3 mi
\ / Inf id* 2 ml ,
V . tee page 1 /
\
\ 8.0 km
/ - SOBTIL^—-
PUFF MODEL • • Page 2 of 2 RUN TIME: 09/19/94 10:46
THVR0ID DOSE Site date: 09/19/94 Site time: 11:00
Legend: Cartesian grid ED 0.001 to 0 5 rem • 0.5 to 5 rem | § 5 to 25 rem
EPR Early Phase PRO Range M 25 to 1500 rem • 1500 to 3000 rem • > 3000 rem
Route Effects Possible
Highest ualue on grid: 1.9E*00 rem Bearing: 0. degress Distance: 2.7 miles (4.3km)
NUREG/CR-5247, Vol. 2, Rev. 2

STDOSEExercise Discussions 77
If the wind speed is zero, why has the material moved out so far from the plant?
When the wind speed is less than 1 mph, diffusion coefficients are computed as a function of time. The horizontal diffusion coefficient grows at a rate of 2300 feet (700 m) per hour. The vertical diffusion coefficient grows as if the wind speed was 0.9 mph (0.4 m/s) in G stability. The material moves out in all directions from the source.
This problem indicates the difficulty in predicting the direction of material movement under low wind speed conditions. The calm case is the extreme. Given no vector along which to move that material, the model diffuses it equally in all directions. Even with a measured direction at low speeds that direction tends to vary considerably. At low wind speeds the material can move in unexpected directions and since it is moving slowly the concentrations are high.
NUREG/CR-5247, Vol. 2. Rev. 2
>MW:
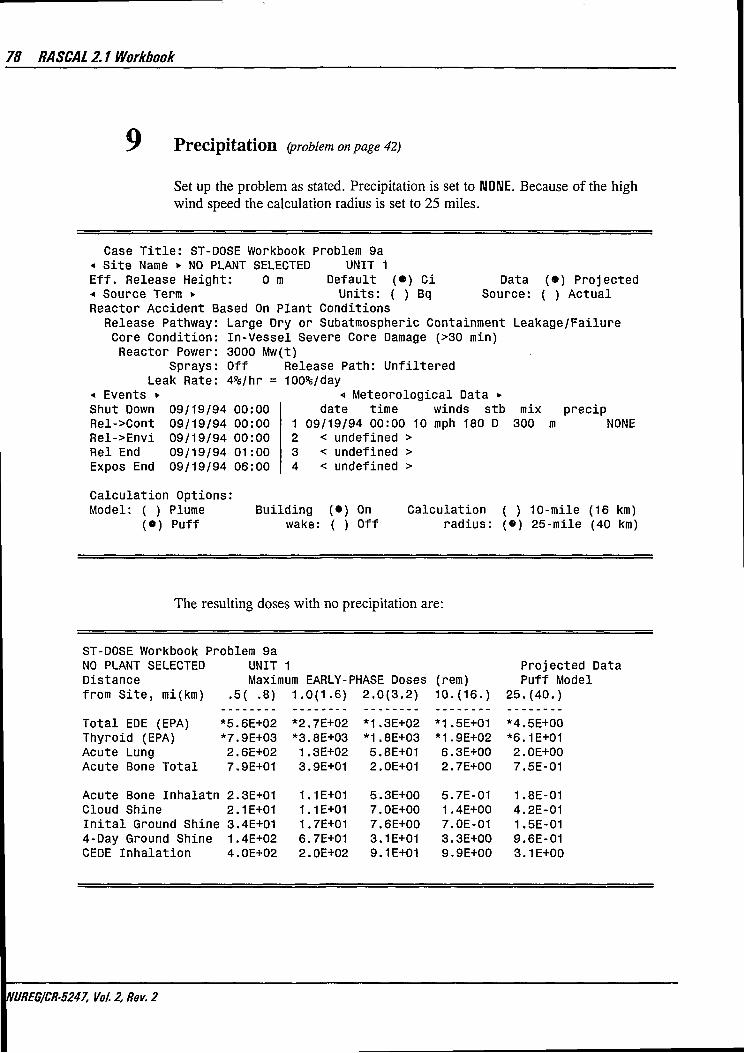
78 RASCAL 2.1 Workbook
Precipitation (problem on page 42)
Set up the problem as stated. Precipitation is set to NONE. Because of the high wind speed the calculation radius is set to 25 miles.
Data Source:
(•) Projected ( ) Actual
Case Title: ST-DOSE Workbook Problem 9a « Site Name • NO PLANT SELECTED UNIT 1 Eff. Release Height: 0 m Default (•) Ci - Source Term »• Units: ( ) Bq Reactor Accident Based On Plant Conditions Release Pathway: Large Dry or Subatinospheric Containment Leakage/Failure Core Condition: In-Vessel Severe Core Damage (>30 min) Reactor Power: 3000 Mw(t)
Sprays: Off Release Path: Unfiltered Leak Rate: 4%/hr = 100%/day
< Meteorological Data >• date time winds stb
1 09/19/94 00:00 10 mph 180 D 2 < undefined > 3 < undefined > 4 < undefined >
•« Events • Shut Down Rel->Cont Rel->Envi Rel End Expos End
09/19/94 00:00 09/19/94 00:00 09/19/94 00:00 09/19/94 01:00 09/19/94 06:00
mix 300
precip m NONE
C a l c u l a t i o n Opt ions : Model: ( ) Plume B u i l d i n g ( • ) On
(O) Puf f wake: ( ) Of f Calculation ( ) 10-mile (16 km)
radius: (©) 25-mile (40 km)
The resulting doses wi th no precipitation are:
ST-DOSE Workbook Problem 9a NO PLANT SELECTED UNIT 1 Dis tance Maximum EARLY-PHASE Doses f rom S i t e , mi(km) .5( .8) 1 .0(1.6) 2 . 0 ( 3 . 2 )
T o t a l EDE (EPA) *5.6E+02 *2.7E+02 *1.3E+02 Thy ro id (EPA) *7.9E+03 *3.8E+03 *1.8E+03 Acute Lung 2.6E+02 1.3E+02 5.8E+01 Acute Bone T o t a l 7.9E+01 3.9E+01 2.0E+01
Acute Bone I n h a l a t n 2.3E+01 1.1E+01 5.3E+00 Cloud Shine 2.1E+01 1.1E+01 7.0E+00 I n i t a l Ground Shine 3.4E+01 1.7E+01 7.6E+00 4-Day Ground Shine 1.4E+02 6.7E+01 3.1E+01 CEDE I n h a l a t i o n 4.0E+02 2.0E+02 9.1E+01
(rem) 1 0 . ( 1 6 . )
*1.5E+01 *1.9E+02 6.3E+00 2.7E+00
5.7E-01 1.4E+00 7.0E-01 3.3E+00 9.9E+00
Pro jec ted Data Puf f Model
2 5 . ( 4 0 . )
*4.5E+00 *6.1E+01 2.0E+00 7.5E-01
1.8E-01 4.2E-01 1.5E-01 9.6E-01 3.1E+00
NUREG/CR-5247, Vol. 2, Rev. 2

ST-DOSE Exercise Discussions 79
Now change the precipitation to MODERATE RAIN and run the calculations again.
The resulting early-phase doses are:
!ST-DOSE Workbook Problem 9b i NO PLANT SELECTED UNIT 1 Projected Data Distance Maximum EARLY-PHASE Doses (rem) Puff Model from Site, mi(km) .5( .8) 1.0(1.6) 2.0(3.2) 10.(16.) 25.(40.)
Total EDE (EPA) *2.1E+03 *1.1E+03 *5.1E+02 *2.0E+01 5.4E-01 Thyroid (EPA) *7.0E+03 *3.1E+03 *1.1E+03 *2.3E+01 3.1E-01 Acute Lung 2.3E+02 1.0E+02 3.8E+01 7.7E-01 1.1E-02 Acute Bone Total 4.7E+02 2.5E+02 1.2E+02 4.9E+00 2.8E-01
Acute Bone Inhalatn 2.1E+01 9.2E+00 3.4E+00 7.3E-02 2.0E-03 Cloud Shine 2.0E+01 9.9E+00 5.7E+00 8.4E-01 2.3E-01 Inital Ground Shine 4.2E+02 2.3E+02 1.1E+02 4.0E+00 4.7E-02 4-Day Ground Shine 1.7E+03 9.4E+02 4.5E+02 1.8E+01 2.9E-01 CEDE Inhalation 3.6E+02 1.6E+02 5.9E+01 1.2E+00 1.7E-02
The initial ground shine at 1 mile is almost 14X higher for the rain case. But, at 25 miles the initial ground shine for the rain case is lower. Why?
Material is washed out of the air and deposited on the ground by the rain. Because there is more material on the ground, ground shine dose increases. Because there is less material in the air, cloud shine decreases. If the rain had not started until after the material had moved away from the plant, "hot spots" could have been created. The Chernobyl accident demonstrates this effect.
The ST-DOSE model of RASCAL Version 2.1 does not allow spatially varying precipitation. That is, if it is raining, it effects the entire modeling area at once.
The plot of dose versus distance for rain and no rain shows the dramatic effect of washout. Note how cloud shine is effected in relation to ground shine.
NUREG/CR-5247, Vol. 2. Rev. 2

80 RASCAL 2.1 Workbook
1.0E+03 T
^1.0E+02
il.OE+01 co c § 1.0E+00 O 75 £ 1.0E-01 -r
1.0E-02 - i 1 1 1 1- -H 1 1-
10 15 Distance (miles)
20
-»- No Rain Moderate Rain
25
1.0E+02 T
«1.0E+01
c CO •o
I1.0E+00
1.0E-01 H 1 1 1 1- H 1 H
10 15 Distance (miles)
20
-»- No Rain Moderate Rain
25
NUREG/CRS247, Vol.2,Rev.2

ST-DOSE Exercise Discussions 81
10 Rain Created Hot Spot (problem on page 43)
Set up the problem as described for WNP-2.
Case T i t l e : ST-DOSE Workbook Problem 10 « Si te Name • WASHINGTON NUCLEAR UNIT 2 Ef f . Release Height: 0 m Default ( • ) Ci Data « Source Term • Uni ts: ( ) Bq Source: Reactor Accident Based On Plant Conditions
Release Pathway: Dry Well Leakage/Failure; BWR Containment
( • ) Projected ( ) Actual
Core Condition: In-Vessel Severe Core Damage (>30 min) Reactor Power: 3323 Mw(t) I
Sprays: On Release Path: Filtered Leak Rate: 4%/hr = 100%/day
•< Events >• < Meteorological Data • ; Shut Down 04/19/94 12:00 date time winds stb mix precip Rel->Cont 04/19/94 12:00 1 04/19/94 12:00 4 mph 270 B 500 m NONE . Rel->Envi 04/19/94 12:00 2 04/19/94 14:00 12 mph 240 D 500 ID HEAVY RAIN Rel End 04/19/94 12:30 3 04/19/94 14:15 4 mph 270 B 500 m NONE
: Expos End 04/19/94 18:00 4 < undefined > ; Calculation Options: : Model: ( ) Plume Building (•) On Calculation (•) 10-mile (16 km)
(•) Puff wake: ( ) Off radius: ( ) 25-mile (40 km)
Run the puff model. The maximum result report for the simulation shows:
ST-DOSE Workbook Problem 10 WASHINGTON NUCLEAR UNIT 2 Projected Data «Distance Maximum EARLY-PHASE Doses (rem) Puff Model from Site, mi(km) .5( .8) 1.0(1.6) 2.0(3.2) 5.0(8.0) 10.(16.)
1 Total EDE (EPA) *6.4E+00 *3.1E+00 *1.5E+00 7.4E-01 *2.2E+00 iThyroid (EPA) 7.2E-01 2.9E-01 1.2E-01 4.1E-02 6.6E-03 iAcute Lung 3.6E-02 1.4E-02 5.8E-03 2.1E-03 0.0E+00 •Acute Bone Total 4.9E+00 2.5E+00 1.3E+00 6.6E-01 8.8E-01
Acute Bone Inhalatn 3.0E-02 1.2E-02 4.9E-03 1.8E-03 0.0E+00 !Cloud Shine 4.0E+00 2.1E+00 1.1E+00 6.1E-01 1.8E-01 1Inital Ground Shine 8.8E-01 3.5E-01 1.3E-01 6.7E-02 7.4E-01 •4-Day Ground Shine 2.0E+00 8.0E-01 3.1E-01 1.8E-01 2.1E+00 iCEDE Inhalation 3.2E-01 1.3E-01 5.2E-02 1.8E-02 3.2E-03
Examine the graphics output for TEDE dose. The close-in (0-2 mile) picture shows some doses of 5 - 50 rem at 0.5 miles from the plant. The TEDE PAG is
NUREG/CR-5247, Vol. 2. Rev. 2

82 RASCAL 2.1 Workbook
exceeded at 2 miles. Beyond 2 miles, the TEDE drops below the PAG except for a "hot spot" between about 7 and 10 miles.
case Name: ST-DOSE Workbook Problem 10 Site Name: WASHINGTON NUCLEAR UNIT2
: m \
(HI L \
a P
'• §0I(IH—~"~' Tick* euerg 30 degree*
PUFF MODEL Page 1 of 2 RUN TIME 09/19/94 1056
TOTRL EFFECTIUE DOSE EQ (TEDE) Site date: 04/19/94 Site time: 18:00
Legend: Polar grid • 0.001 to 0.1 rem ^ 0.1 to 1.0 rem 1 ! 1 to 5 rem
EPR Early Phase PflG Range • 5 to SO rem • > SO rem
Health Effects Possible
Highest ualue on grid: 6.4E+00 rem Bearing: 90. degrees Distance: 5 miles ( .Stem)
case Name: ST-DOSE Workbook Problem 10 site Name: WASHINGTON NUCLEAR UNIT2
nits
-ssffnu
PUFF MODEL - - Page 2 of 2 RUN TIME: 09/19/94 1036
TOTRL EFFECTIUE DOSE EQ (TEDE) Site date: 04/19/94 Site time: 18:00
Legend: Cartesian grid D 0.001 to 0.1 rem ^ 0.1 to 1.0 rem M 1 to 5 rem
EPR Early Phase PflG Range • 5 to 50 rem • > 50 rem
Health Effects Possible
Highest ualue on grid: 2.9E*00 rem Bearing: 85. degrees Distance: 8.0 miles (12.91cm)
NUREG/CR-5247, Vol. 2. Rev. 2

ST-DOSE Exercise Discussions 83
The hot spot also shows up for the initial ground shine dose although in this case EPA PAGs are not exceeded.
cose Nome ST-DOSE Workbook Problem 10
Site Name: WASHINGTON NUCLEAR UNIT 2
\ / \ 10 mi
\
/ T rf^ /^6»ia»«N? >»i : . ; : :3i:;;j;;i ;
/ / l i » M r 2 n > l \ . . . . '•".":£
\ V « . p . , . i / •••••••••••-M • •;
tBSTi
\ \ « « p«s» > 3 J km v_
\ »J>km x
: : :' : : !"7
15.1 k m \
PUFF MODEL Page 2 of 2 RUN TIME: 09/19/94 1056
IMTIHL GROUND SHINE DOSE Site date: 04/19/94 Site time: 18:00
Legend: Cartesian grid E3 0.001 to 0.1 red • 0.1 to 1.0 rad 1 M to 5 rad
EPfl PUG Range ^ 5 to 50 rad • 50 to 150 rad
Early Health Effects Possible • > 150 rad
Early Deaths Possible
Highest ualue on grid: 9.7E-01 rad Rearing: 85. degrees Distance: 8J) miles (12.9km)
This happens when the material is being transported away from plant and encounters precipitation. In this case the plant had release a half hour "puff" of material. The rain storm washed material out during its 15 minutes. The TEDE dose in this area exceeds PAGs. Examining the components of the TEDE in the maximum values report to 10 miles shows that the dominant contributor to TEDE is the 4-day ground shine.
What protective actions would be recommended? These dose projections are far too uncertain to be used as the sole basis for a protective action. These projections do however indicate the possibility for hot spots. Monitoring teams should be sent to find these areas and they should be evacuated as appropriate.
If there is rain anywhere near the plant, send a field team out to look. Remember Chernobyl and the hot spot they had approximately 50 miles from the plant.
NUREG/CR5247, Vol. 2, Rev. 2

84 RASCAL 2.1 Workbook
11 Stability ClaSS (problem on page 43)
Setup the problem for Wolf Creek as described. Shutdown and release to containment both occurred at midnight. Use the help screens available on the meteorological data input form to determine appropriate values for the stability class and the mixing layer depth.
Help text on the stability class field:
++ Nighttime conditions Surface wind Daytime Insolation
speed Thin overcast or <= 3/8 m/sec mph Strong Moderate Slight >50% low clouds cloudiness
< 2 < 4 A A-B B 2-3 4-7 A-B B C E F 3-4 7-9 B B-C C D E 4-6 9-13 C C-D D D D > 6 > 1 3 C D D D D
++ Insolation = incoming solar radiation; i.e. strength of sunlight at ground level. Use slight only for mostly cloudy to overcast days or when it is near dawn or dusk. Use strong only for no clouds at mid-day during the summer. At all other times and conditions during daylight, assume moderate insolation.
Help text on the mixing layer depth field:
Stability Class A B C D E F G
January 500 500 300 200 200 150 100 February 500 500 300 200 200 150 100 March 850 600 500 400 250 150 100 Mixing Layer April 850 600 500 400 250 150 100 Depths May 850 600 500 400 250 150 100 (meters) June 1000 750 650 500 250 150 100 July 1000 750 650 500 250 150 100 August 1000 750 650 500 250 150 100 September 900 60.0 500 400 250 150 100 October 900 600 500 400 250 150 100 November 900 600 500 400 250 150 100 December 500 500 300 200 200 150 100
For the early morning case, assume F stability based on clear (less than 3/8 cloudiness) skies, nighttime conditions with 4-7 mph wind speed. The mixing
NUREG/CR-5247, Vol. 2, Rev. 2

STDOSE Exercise Discussions 85
layer depth for July with a stability class of F is 150 meters. Set the problem up using these inputs and the event timing and plant conditions specified. Use the puff model to do the calculations.
Case T i t l e : ST-DOSE Workbook Problem 11a < Si te Name • WOLF CREEK UNIT 1 Ef f . Release Height: 0 m Default (•) Ci •* Source Term *• Uni ts: ( ) Bq Reactor Accident Based On Plant Conditions
Release Pathway: Large Dry or Subatmospheric Containment Leakage/Failure In-Vessel Severe Core Damage (>30 min) 3411 MW(t)
Data (•) Projected Source: ( ) Actual
Core Condition Reactor Power
Sprays Leak Rate
•* Events • Shut Down Rel->Cont Rel->Envi Rel End Expos End
07/19/94 00:00 07/19/94 00:00 07/19/94 04:00 07/19/94 05:00 07/19/94 08:00
Off Release Path: Unfiltered 4%/hr = 100%/day
•* Meteorological Data • date time winds stb
1 07/19/94 04:00 6 mph 90 F 2 < undefined > 3 < undefined > 4 < undefined >
mix 150 m
precip NONE
Calculat ion Options: Model: ( ) Plume Bui lding (•) On Calculat ion
( • ) Puff wake: { ) Off radius: (•) 10-mile (16 km) ( ) 25-mile (40 km)
The results for the early morning scenario are shown below:
ST-DOSE Workbook Problem 11a WOLF CREEK UNIT J Projected Data • Distance Maximum EARLY-PHASE Doses (rem) Puff Model •from Site, mi(km) .5( .8) 1.0(1.6) 2.0(3.2) 5.0(8.0) 10.(16.)
Total EDE (EPA) *3.4E+02 *2.2E+02 *1.7E+02 *9.1E+01 *4.3E+01 Thyroid (EPA) *5.0E+03 *3.3E+03 *2.5E+03 *1.3E+03 *6.2E+02 Acute Lung 1.6E+02 1.1E+02 8.0E+01 4.3E+01 2.0E+01 !Acute Bone Total 3.1E+01 2.0E+01 1.5E+01 8.9E+00 4.5E+00
Acute Bone Inhalatn 1.5E+01 1.0E+01 7.5E+00 4.1E+00 1.9E+00 Cloud Shine 8.1E+00 5.3E+00 4.0E+00 3.1E+00 2.1E+00 )Inital Ground Shine 8.0E+00 5.2E+00 3.7E+00 1.7E+00 5.6E-01 '4-Day Ground Shine 7.1E+01 4.6E+01 3.5E+01 1.8E+01 8.3E+00 'CEDE Inhalation 2.6E+02 1.7E+02 1.3E+02 6.9E+01 3.2E+01
Both TEDE and thyroid dose greatly exceed the PAGs at 10 miles.
NUREG/CR-5247, Vol. 2, Rev. 2

86 RASCAL 2.1 Workbook
Examine the graphics output for several of the result types. Note that the plume is very narrow.
case Name: ST-DOSE Workbook Problem 11 a Site Name: WOLF CREEK UNIT 1
, ' Ua lun ' s 2ni i • intidt 2 ml '•
ka 3.2 km ^ ^
^_|0DXH — '
PUFF MODEL Page 2 of 2 RUN TIME: 09 /19 /94 12:44
THVROID DOSE Site date: 07/19/94 Site time: 08:00
Legend: Cartesian grid • 0.001 to 03 rem • 0.5 to 5 rem 0 5 to 25 rem
EPR Early Phase PRG Range ffl 25 to 1500 rem • 1500 to 3000 rem • > 3000 rem
Rcute Effects Possible
Highest value on grid: ZOE+03 rem Bearing: 270. degrees Distance: 2.7 miles ( 4.3km)
For the afternoon case, assume A stability based on strong sunlight (no clouds at mid-day) and 4-7 mph wind speed. The suggested mixing layer depth for that stability is 1000 meters. Revise the problem definition to reflect these new conditions and recalculate again using the puff model.
Case T i t l e : ST-DOSE-Workbook Problem 11b < S i te Name • WOLF CREEK UNIT 1 Ef f . Release Height: 0 m Default (•) Ci •* Source Term • Units: ( ) Bq Reactor Accident Based On Plant Conditions
Release Pathway: Large Dry or Subatmospheric Containment Leakage/Failure Core Condit ion: In-Vessel Severe Core Damage (>30 min)
Reactor Power: 3411 Mw(t)
Data (•) Projected Source: ( ) Actual
Sprays: Off Release Path: Unfiltered Leak Rate: 4%/hr = 100%/day
« Events • •* Meteorological Data • Shut Down 07/19/94 00:00 date time winds stb mix Rel->Cont 07/19/94 00:00 1 07/19/94 14:00 6 mph 90 A 1000 m Rel->Envi 07/19/94 14:00 2 < undefined > Rel End 07/19/94 15:00 3 < undefined > Expos End 07/19/94 18:00 4 < undefined >
precip NONE
Calculation Options: Model: ( ) Plume
(•) Puff Building (•) On
wake: ( ) Off Calculation
radius: (•) 10-mile (16 km) ( ) 25-mile (40 km)
NUREG/CR-5247, Vol. 2, Rev. 2

STDOSEExercise Discussions 87
The results for the afternoon case are shown below:
ST-DOSE Workbook Problem 11b | WOLF CREEK UNIT • • Projected Data Distance Maximum EARLY-PHASE Doses (rem) Puff Model j from Site, mi(km) .5( .8) 1.0(1.6) 2.0(3.2) 5.0(8.0) 10.(16.) J 'Total EDE (EPA) *3.0E+01 *7.5E+00 *4.3E+00 *1.5E+00 7.3E-01 "Thyroid (EPA) *4.4E+02 *1.1E+02 *6.1E+01 *2.2E+01 *1.1E+01 I Acute Lung 1.4E+01 3.5E+00 2.0E+00 7.1E-01 3.5E-01 ! '; Acute Bone Total 2.5E+00 8.3E-01 5.3E-01 1.4E-01 6.2E-02 !
I Acute Bone Inhalatn 1.4E+00 3.4E-01 1.9E-01 6.9E-02 3.4E-02 I Cloud Shine 6.0E-01 3.8E-01 2.7E-01 5.2E-02 2.1E-02 Inital Ground Shine 4.8E-01 1.1E-01 6.2E-02 1.9E-02 6.6E-03 4-Day Ground Shine 5.6E+00 1.4E+00 7.7E-01 2.7E-01 1.3E-01 CEDE Inhalation 2.4E+01 5.7E+00 3.3E+00 1.2E+00 5.8E-01
Again the TEDE and thyroid doses exceed the PAGs. However the doses are significantly lower. For example, the TEDE dose at 2 miles is down to 4.3 rem from 170 rem in the earlier case.
Examine the graphics displays again. Note that the plume is much wider and that the doses along the plume centerline are greatly reduced.
case Nama- ST-DOSE Workbook Problem 11 b Site Name: WOLF CREEK UNIT1
PUFF MODEL - • Page 2 of 2
\10ml
RUN TIME: 09/19/94 12rtt
THYROID DOSE Site date: 07/19/94 Site time: 18*0
Legend: Cartesian grid QD 0.001 to 0 5 rem • OS to 5 rem ^ 5 to 25 rem
EPfl Early Phase PfiG Range H 25 to 1500 rem • 1500 to 3000 rem • > 3000 rem
Acute Effects Possible
Highest ualue on grid: 3.4E+01 rem Bearing: 270. degrees Distance: 2.7 miles (43km)
NUREG/CR-5247, Vol. 2, Rev. 2
•'rt-tZK^T JWT:

88 RASCAL 2.1 Workbook
The stability class represents the amount of mixing that goes on in the atmosphere. Unstable conditions result in the material being much more widely dispersed and generally result in lower doses. What other factor contributed to the lower doses?
NUREG/CR-5247, Vol. 2, Rev. 2

ST-DOSEExercise Discussions 89
12 Elevated Release (problem on page 44)
This problem compares the resulting doses from two types of elevated releases. In addition to knowing the release height, it is important to know when building wake calculations should be turned off.
Part A: Isolated Stack
Use the Isotopic Release Rate source-term option. Convert the 6.7 Ci/minute to 1.12 Ci/second. The ST-DOSE inputs for the scenario with the 150 m release height are shown below. Note that the building wake is turned off because the release is from an isolated stack. The problem states a 15 minute release duration and 4 hours of exposure.
Case T i t l e : ST-DOSE Workbook Problem 12a < S i te Name • NO PLANT SELECTED UNIT 1 Ef f . Release Height: 150 m Default (•) Ci * Source Term • Uni ts : ( ) Bq User Specif ied Isotopic Release Rates Uni ts : Ci/sec
1-131 1.12E+000
Data ( • ) Projected Source: ( ) Actual
* Events • Decy S t r t Rel->Cont Rel->Envi Rel End
< NA > < NA >
09/19/94 00:00 09/19/94 00:15
Expos End 09/19/94 04:00
Calculation Options: Model: ( ) Plume
(•) Puff
t Meteorological Data • date time winds stb mix
1 09/19/94 00:00 4 mph 90 D 500 2 < undefined > 3 < undefined > 4 < undefined >
precip NONE
Building ( ) On wake: (•) Off
Calculation (•) 10-mile (16 km) radius: ( ) 25-mile (40 km)
The computed source-term report confirms that 1000 Ci of 1 3 1I were released during the 15 minute period.
Computed Source Term
A total of 1.0E+03 Ci were released.
Release Release Release Nuclide (Ci) Nuclide (Ci) Nuclide (Ci) 1-131 1.0E+03
NUREG/CR5247, Vol.2,Rev.2

90 RASCAL 2.1 Workbook
The doses resulting from the elevated release are:
ST-DOSE Workbook Problem 12a NO PLANT SELECTED UNIT 1 Projected Data Distance Maximum EARLY-PHASE Doses (rem) Puff Model from Site, mi(km) .5( .8) 1.0(1.6) 2.0(3.2) 5.0(8.0) 10.(16.)
Total EDE (EPA) O.OE+OO 2.0E-03 9.5E-03 1.0E-02 5.5E-03 Thyroid (EPA) O.OE+00 5.9E-02 2.9E-01 3.1E-01 1.7E-01 Acute Lung O.OE+00 O.OE+00 O.OE+OO O.OE+00 O.OE+OO Acute Bone Total 0.0E+00 O.OE+OO O.OE+00 O.OE+OO O.OE+00
Acute Bone Inhalatn O.OE+00 O.OE+00 O.OE+00 O.OE+OO O.OE+OO Cloud Shine O.OE+00 O.OE+00 O.OE+OO O.OE+00 O.OE+00 Inital Ground Shine O.OE+00 O.OE+00 O.OE+00 O.OE+00 O.OE+OO 4-Day Ground Shine O.OE+00 O.OE+00 O.OE+00 O.OE+00 O.OE+00 CEDE Inhalation O.OE+OO 1.8E-03 8.7E-03 9.4E-03 5.1E-03
The thyroid doses are all well below the EPA thyroid PAGs. However, note that the dose goes up initially as you move away from the source. Why?
Part B: Top of turbine building.
Set the new release height to 70 meters. Because the release point is no longer from an isolated stack, the building wake option is turned ON. Leave all the other conditions the same and run the calculations again. The results for this release are:
ST-DOSE Workbook Problem 12b NO PLANT SELECTED UNIT 1 Projected Data Distance Maximum EARLY-PHASE Doses (rem) Puff Model from Site, mi(km) .5( .8) 1.0(1.6) 2.0(3.2) 5.0(8.0) 10.(16.)
Total EDE (EPA) 1.4E-01 8.4E-02 5.6E-02 2.2E-02 9.4E-03 Thyroid (EPA) 4.2E+00 2.5E+00 1.7E+00 6.7E-01 2.9E-01 Acute Lung 9.3E-03 5.7E-03 3.8E-03 1.5E-03 O.OE+OO Acute Bone Total 1.5E-03 O.OE+00 O.OE+00 O.OE+00 O.OE+00
Acute Bone Inhalatn O.OE+00 O.OE+00 O.OE+OO O.OE+00 O.OE+00 Cloud Shine O.OE+00 O.OE+OO O.OE+00 O.OE+00 O.OE+OO Inital Ground Shine O.OE+00 O.OE+00 O.OE+OO O.OE+00 O.OE+00 4-Day Ground Shine 1.0E-02 6.1E-03 4.0E-03 1.6E-03 O.OE+00 CEDE Inhalation 1.3E-01 7.7E-02 5.2E-02 2.0E-02 8.7E-03
EPA PAGs for thyroid dose still have not been exceeded. However, with building wake ON the dispersion near the plant is increased and results in lower
NUREG/CR-5247, Vol. 2, Rev. 2
STDOSEExercise Discussions 91
doses but greater area affected. As noted in the help message for the building wake field and the warning message about using building wake with a non-zero release height, ST-DOSE forces the release to ground level when winds are not calm.
The NRC rule of thumb on the "Blue Card" is for a thyroid dose of 5-25 rem at 1 mile for 1000 Ci of iodine. In this calculation the thyroid dose at 1 mile is 2.5 rem, slightly below the card value. However, the "Blue Card" does not consider building wake effects. In most cases, a release from a reactor will be effected by building wake effects.
NUREG/CR-5247, Vol. 2, Rev. 2

92 RASCAL 2. J Workbook
13 Release Above Mixed Layer (problem on page 44)
Set up the problem for Davis Besse as stated. Because the effective release height is so high and is above the mixing layer depth, the building wake calculation should be turned off.
Case Title: ST-DOSE Workbook Problem 13a - Site Name • DAVIS BESSE UNIT 1 Eff. Release Height: 200 m Default (•) Ci •* Source Term • Units: ( ) Bq Reactor Accident Based On Plant Conditions
Release Pathway: Large Dry or Subatmospheric Containment Leakage/Failure Core Condition: In-Vessel Severe Core Damage (>30 min) Reactor Power: 2772 Mw(t)
Data Source:
(o) Projected ( ) Actual
Sprays: Leak Rate:
•* Events > Shut Down Rel->Cont Rel->Envi Rel End Expos End
Off 100%/hr
Release Path: Unfiltered
-< Meteorology Leal Data • 09/19/94 05:00 date time winds stb mix 09/19/94 05:00 1 09/19/94 05:00 1 mph 225 G 100 09/19/94 05:00 2 < undefined > 09/19/94 06:00 3 < undefined > 09/19/94 09:00 4 < undefined >
precip NONE
Calculation Options: Model: ( ) Plume Building ( ) On
(•) Puff wake: (•) Off Calculation '(•') 10-mile (16 km)
radius: ( ) 25-mile (40 km)
The results from the puff model calculations for a release above the mixing layer are:
ST-DOSE Workbook Problem 13a DAVIS BESSE UNIT 1 Projected Data Distance Maximum EARLY-PHASE Doses (rem) Puff Model from Site, mi(km) • 5( .8) 1.0(1,6) 2.0(3.2) 5.0(8.0) 10.(16.)
Total EDE (EPA) *7.2E+01 *9.2E+01 *1.1E+02 *9.9E+01 *6.8E+01 Thyroid (EPA) O.OE+00 O.OE+00 O.OE+00 O.OE+00 O.OE+00 Acute Lung O.OE+00 O.OE+00 O.OE+00 O.OE+00 O.OE+00 Acute Bone Total 7.2E+01 9.2E+01 1.1E+02 9.9E+01 6.8E+01
Acute Bone Inhalatn O.OE+00 O.OE+00 070E+00 O.OE+00 O.OE+00 Cloud Shine 7.2E+01 9.2E+01 1.1E+02 9.9E+01 6.8E+01 Inital Ground Shine O.OE+00 O.OE+00 O.OE+00 0.0E+00 O.OE+00 4-Day Ground Shine O.OE+00 O.OE+00 O.OE+00 O.OE+00 O.OE+00 CEDE Inhalation O.OE+00 O.OE+00 O.OE+00 O.OE+00 O.OE+00
The 200 meter effective release height placed the material above the mixing layer. The model assumes a "G" stability class for vertical diffusion in the
NUREG/CR-5247, Vol. 2, Rev. 2

STDOSEExercise Discussions 93
upper layer. This greatly reduces the ground level air concentrations and thus inhalation dose and ground shine dose. The material remains aloft much longer because of the reduced vertical diffusion. When the material does finally diffuse down to the ground inhalation doses will increase dramatically.
Now revise the problem with the release height within the mixing layer. A time of 10 a.m. was assumed for "mid-morning".
Case Title: ST-DOSE Workbook Problem 13b < Site Name • DAVIS BESSE UNIT 1 Eff. Release Height: 200 m Default (•) Ci « Source Term • Units: ( ) Bq Reactor Accident Based On Plant Conditions
Release Pathway: Large Dry or Subatmospheric Containment Le'akage/Failure
Data Source:
{•) Projected ( ) Actual
Core Condition: In-Vessel Severe Core Damage (>30 min) Reactor Power: 2772 Mw(t)
Sprays: Off Release Path: Unfiltered Leak Rate: 100%/hr
•* Events • < Meteorological Data • Shut Down 09/19/94 10:00 date time winds stb mix precip Rel->Cont 09/19/94 10:00 1 09/19/94 10:00 1 mph 225 B 600 m NONE Rel->Envi 09/19/94 10:00 2 < undefined > Rel End 09/19/94 11:00 3 < undefined > Expos End 09/19/94 14:00 4 < undefined >
Calculation Options: Model: ( ) Plume Building ( ) On Calculation (•) 10-mile (16 km)
(•) Puff wake: (•) Off radius: ( ) 25-mile (40 km)
The results of the puff model for a release within the mixing layer are:
ST-DOSE Workbook Problem 13b DAVIS BESSE UNIT 1 Projected Data Distance Maximum EARLY-PHASE Doses (rem) Puff Model from Site, mi(km) .5( .8) 1.0(1.6) 2.0(3.2) 5.0(8.0) 10.(16.)
Total EDE (EPA) *4.7E+03 *6.1E+03 *2.5E+03 *3.9E+02 0.0E+00 Thyroid (EPA) *6.1E+04 *8.4E+04 *3.5E+04 *5.2E+03 0.0E+00 Acute Lung 2.0E+03 2.7E+03 1.1E+03 1.7E+02 O.0E+00 Acute Bone Total 9.4E+02 9.3E+02 4.0E+02 7.1E+01 O.OE+OO
Acute Bone Inhalatn 1.8E+02 2.5E+02 1.0E+02 1.5E+01 0.0E+00 Cloud Shine 6.1E+02 4.9E+02 2.4E+02 5.4E+01 0.0E+00 Inital Ground Shine 1.6E+02 1.9E+02 6.0E+01 1.7E+00 0.0E+00 4-Day Ground Shine 9.8E+02 1.3E+03 5.2E+02 7.1E+01 0.0E+00 CEDE Inhalation 3.1E+03 4.3E+03 1.8E+03 2.6E+02 O.OE+OO
I
NUREG/CR-5247, Vol. 2, Rev. 2

94 RASCAL 2.1 Workbook
In this case, the release was into the mixed layer and the full effect of the unstable conditions is seen. All the doses are much higher. Thyroid doses at a half-mile have risen from below 0.001 rem (all doses below 0.001 are shown as 0.0) to 61,000 rem. Note that all the doses at 10-miles are zero because that plume had not yet arrived at that distance when the "snapshot" was taken of doses. Be careful, this would not be a good calculation for comparison with EPA PAGs. Why?
NUREG/CR-5247, Vol. 2, Rev. 2

STDOSEExercise Discussions 95
14
< -1 .9 1 .9 to -1 .7 1 .7 to -1 .5 1 .5 to -0 .5 0 .5 to 1 .5 1 .5 to 4 .0
> 4 .0
< -1.0 -1.0 to -0.9 -0.9 to -0.8 -0.8 to -0.3 -0.3 to 0.8 0.8 to 2.2
> 2.2
Wind Shift (problem on page 45)
Set up the problem as stated with the changing meteorology conditions and event times. The help text available for the stability class data input field indicates how to use wind direction fluctuations (sigma-theta). The appropriate portion of the help message is shown below.
I I . Selection by sigroa theta (wind direction fluctuation) i or delta-T (lapse rate) method:
Stability Sigma Theta Temperature change with height Class (degrees) ("C/100 m) (°F/100 ft)
A 25.0 B 20.0 C 15.0 D 10.0 E 5.0 F 2.5 G 1.7
Select the sigma-theta value in the help table that is closest to the measured value. The 9° sigma-theta translates into a stability class of D and the 21° into class B. The wind speeds can be entered as reported with the correct units selected on input. The summary of inputs is shown below.
Case Title: ST-DOSE Workbook Problem 14 < S i t e Name • NO PLANT SELECTED UNIT 1 Eff. Release Height: 0 m Default (•) Ci Data (•) Projected < Source Term • Units: ( ) Bq Source: ( ) Actual Reactor Accident Based On Plant Conditions
Release Pathway: Containment Bypass (Event V) Core Condition: In-Vessel Severe Core Damage (>30 min) Reactor Power: 3000 Mw(t) Release Path: Unfiltered
Leak Rate: 4%/hr = 100%/day •« Events > < Meteorological Data •
date time winds stb mix precip 1 09/19/94 00:00 12 mph 135 D 500 m NONE 2 09/19/94 03:00 2 m/s 190 B 500 m NONE 3 < undefined > 4 < undefined >
Shut Down 09/19/94 00:00 Rel->Cont < NA > Rel->Envi 09/19/94 00:00 Rel End 09/19/94 06:00 Expos End 09/19/94 06:00
Calculation Options: Model: (•) Plume Building (•) On Calculation (•) 10-mile (16 km)
( ) Puff wake: ( ) Off radius: ( ) 25-mile (40 km)
NUREG/CR-5247, Vol. 2, Rev. 2

96 RASCAL 2.1 Workbook
Run the calculations using the plume model. The results in the maximum value report are:
ST-DOSE Workbook Problem 14 NO PLANT SELECTED UNIT 1 Dis tance Maximum EARLY-PHASE Doses (rem) from S i te , mi(km) .5( .8) 1.0(1.6) 2.0(3.2) 5.0(8.0)
Projected Data Plume Model
10.(16.) 25.(40.)
T o t a l EDE (EPA) Thy ro id (EPA) Acute Lung Acute Bone T o t a l
*9.3E+02 *1.2E+04 4.0E+02 1.5E+02
*4.4E+02 *5.7E+03
1.9E+02 7.4E+01
*2.0E+02 *2.5E+03
8.3E+01 3.9E+01
*6.2E+01 *7.4E+02 2.4E+01 1.5E+01
*2.4E+01 6.3E+00 *2.8E+02 7.7E+01 9.2E+00 2.5E+00 6.0E+00 1.4E+00
Acute Bone I n h a l a t n 3.7E+01 1.7E+01 7.6E+00 2.2E+00 8.5E-01 2.3E-01 Cloud Shine 7.5E+01 3.9E+01 2.4E+01 1.1E+01 4.4E+00 1.1E+00 I n i t a l Ground Shine 3.8E+01 1.8E+01 7.5E+00 2.1E+00 6.8E-01 1.1E-01 4-Day Ground Shine 2.2E+02 1.0E+02 4.5E+01 1.3E+01 4.9E+00 1.3E+00 CEDE I n h a l a t i o n 6.3E+02 2.9E+02 1.3E+02 3.8E+01 1.5E+01 4.0E+00
The graph of thyroid dose to 25 miles calculated by the straight-line plume model shows all the material being transported to the northwest. This is consistent with the initial wind direction of 135 degrees (from the southeast). However, there is no accounting for the shift in the wind direction to the southwest.
case Name: ST-DOSE Workbook Problem 14a Site Name: NO PLANT SELECTED UNIT 1
PLUME MODEL Page 2 of 2 RUN TIME: 09/19/94 13:04
~ NORTM ^ ^
- • ' 25.0 m,
P \
! __0~ ""- 10.0 ml \
/ BiiP^ s ' 5 - o n > i ~; ' JlKST | \ [ £ j \ ! EflST-\ \ • !
\ ».0 km ^. ^y /
\ 16.1km /
/ / 40.2 k m \
^~"" - ——S0JJI8 "" T ick! eiren) 30 degree*
THVROID DOSE Site date: 09/19/94 Site time: 06:00
Legend: Polar Grid HD 0.001 to 0 5 rem • 0.5 to 5 rem H 5 to 25 rem
EPfl Early Phase PRG Range E l 25 to 1500 rem • 1500 to 3000 rem • > 3000 rem
Rcute Effects Possible
~ NORTM ^ ^
- • ' 25.0 m,
P \
! __0~ ""- 10.0 ml \
/ BiiP^ s ' 5 - o n > i ~; ' JlKST | \ [ £ j \ ! EflST-\ \ • !
\ ».0 km ^. ^y /
\ 16.1km /
/ / 40.2 k m \
^~"" - ——S0JJI8 "" T ick! eiren) 30 degree*
Highest ualue on grid: 7.4E+02 rem Bearing: 320. degrees Distance: 5.0 miles (8.0km)
~ NORTM ^ ^
- • ' 25.0 m,
P \
! __0~ ""- 10.0 ml \
/ BiiP^ s ' 5 - o n > i ~; ' JlKST | \ [ £ j \ ! EflST-\ \ • !
\ ».0 km ^. ^y /
\ 16.1km /
/ / 40.2 k m \
^~"" - ——S0JJI8 "" T ick! eiren) 30 degree*
NUREG/CRS247, Vol.2,Rev.2

ST-DOSE Exercise Discussions 97
Now run the calculations again using the puff model. The results change:
'ST-DOSE Workbook Problem 14 !NO PLANT SELECTED UNIT 1 iDistance Maximum EARLY-PHASE Doses (rem) 'from Site, mi(km) .5( .8) 1.0(1.6) 2.0(3.2) 5.0(8.0)
I Total EDE (EPA) |Thyroid (EPA) (Acute Lung !Acute Bone Total
*4.8E+02 *6.1E+03 2.0E+02 8.6E+01
*2.2E+02 *2.8E+03
9.3E+01 4.1E+01
*1.0E+02 *1.3E+03
4.1E+01 2.2E+01
*3.0E+01 *3.4E+02
1.1E+01 8.2E+00
Projected Data Puff Model
10.(16.)
*9.9E+00 *1.1E+02 3.7E+00 2.8E+00
Acute Bone Inhalatn 1.9E+01 8.6E+00 3.8E+00 1.0E+00 3.4E-01 Cloud Shine 3.8E+01 2.0E+01 1.2E+01 5.7E+00 2.0E+00 Inital Ground Shine 2.9E+01 1.3E+01 5.7E+00 1.5E+00 4.8E-01 4-Day Ground Shine 1.2E+02 5.6E+01 2.5E+01 6.6E+00 2.2E+00 CEDE Inhalation 3.2E+02 1.5E+02 6.5E+01 1.7E+01 5.8E+00
Note the differences in the patterns of the graphics.
case Name: ST-DOSE Workbook Problem 14b Site Name: NO PLANT SELECTED UNIT 1
__500TH__-
PUFF MOOa Page 2 of 2 RUN TIME: 09/19/94 1336
THYROID DOSE Site date: 09/19/94 Site time: 06:00
Legend: Cartesian grid ED 0.001 to 0 5 rem D 05 to 5 rem f l 5 to 25 rem
EPfl Early Phase PRG Range ^ 25 to 1500 rem • 1500 to 3000 rem • > 3000 rem
Rcute Effects Possible
Highest ualue on grid: 7.2F.+02rem Bearing: 315. degrees Distance: ZB miles (4.6km)
When the plume model is run, it uses only the first meteorological data set and all the material goes out in the same direction from the release point. When the puff model is used, the shift in wind direction is incorporated and the graphics show the material headed off in two directions. The maximum values reports both show TEDE and thyroid PAG exceeded at 10 miles. What the table does not show is the direction and spreading of the material. When conditions like
NUREG/CR5247, Vol. 2, Rev. 2
t'-^wmiwrn-
98 RASCAL 2.1Workbook
this occur it is important to look at the graphics and not just at the maximum value report. Protective actions should never be taken solely based on model projections. As discussed in Section 1.2 of Volume 1, it can be very difficult to project what is happening in the atmosphere when the release takes place.
NUREG/CR-5247, Vol. 2, Rev. 2

ST-DOSE Exercise Discussions 99
15 SGTR Coolant (problem on page 45)
Set up the problem as stated. Because of me abrupt reactor shutdown, yesterdays coolant sample cannot be considered valid. You can assume that the 100X normal non-nobles coolant case is the worst possible release if there is reason to think that the core remained covered with water (no core damage). In addition, as indicated in the help text, a once-through steam generator should always be assumed to be not partitioned. However, if the problem were worked first for the typical coolant case, the inputs would be:
Data Source:
(•) Projected ( ) Actual
Case Title: ST-DOSE Workbook Problem 15a < Site Name - NO PLANT SELECTED UNIT 1 Eff. Release Height: 0 m Default (•) Ci •< Source Term • Units: ( ) Bq Reactor Accident Based On Plant Conditions Release Pathway: Steam Generator Tube Rupture
Typical Coolant Not Partitioned 1 Tube at Full Pressure Safety Valve
•* Meteorological Data • date time winds stb mix
1 09/19/94 00:00 4 mph 90 D 500 2 < undefined > 3 < undefined > 4 < undefined >
Core Condition Steam Generator
Leak Rate Release Point
•* Events • Shut Down 09/19/94 00:00
< NA > 09/19/94 00:00 09/19/94 01:00 09/19/94 04:00
Rel->Cont Rel->Envi Rel End Expos End
precip NONE
Calculation Options: Model: ( ) Plume Building (•) On Calculation
(•) Puff wake: ( ) Off radius: (•) 10-mile (16 km) ( ) 25-mile (40 km)
Results for the typical coolant case are:
ST-DOSE Workbook Problem 15a NO PLANT SELECTED UNIT 1 Projected Data Distance Maximum EARLY-PHASE Doses (rem) Puff Model from Site, mi(km) ,5( .8) 1.0(1.6) 2.0(3.2) 5.0(8.0) 10.(16.)
Total EDE (EPA) 9.2E-03 5.6E-03 3.7E-03 1.5E-03 O.OE+00 Thyroid (EPA) 1.5E-02 9.2E-03 6.1E-03 2.4E-03 1.0E-03 Acute Lung 5.9E-03 3.6E-03 2.4E-03 O.OE+00 O.OE+00 Acute Bone Total O.OE+00 O.OE+00 O.OE+00 O.OE+00 O.OE+00
Acute Bone Inhalatn O.OE+00 O.OE+00 0I0E+00 O.OE+00 O.OE+00 Cloud Shine O.OE+00 O.OE+00 O.OE+00 O.OE+00 O.OE+00 Inital Ground Shine O.OE+00 O.OE+00 O.OE+00 O.OE+00 0.0E+00 4-Day Ground Shine O.OE+00 O.OE+00 O.OE+00 O.OE+00 O.OE+00 CEDE Inhalation 8.7E-03 .5.2E-03 3.5E-03 1.4E-03 O.OE+00
NUREG/CR-5247, Vol. 2, Rev. 2

100 RASCAL 2.1 Workbook
Now rerun the problem for the 100X spike non-noble case. The resulting doses are:
ST-DOSE Workbook Problem,15b NO PLANT SELEGTEO UNIT 1 Proj ected Data Distance Maximum EARLY-PHASE Doses (rem) Puff Model from Site, mi(km) .5( .8) 1.0(1.6) 2.0(3.2) 5.0(8.0) 10.(16.)
Total EDE (EPA) 9.0E-01 5.5E-01 3.6E-01 • 1.4E-01 6.2E-02 Thyroid (EPA) 1.5E+00 9.2E-01 6.1E-01 2.4E-01 1.0E-01 Acute Lung 5.9E-01 3.6E-01 2.4E-01 9.5E-02 4.1E-02 Acute Bone Total 3.5E-02 2.2E-02 1.5E-02 5.9E-03 2.3E-03
Acute Bone Inhalatn 1.9E-02 1.2E-02 7.8E-03 3.1E-03 1.3E-03 Cloud Shine 6.3E-03 4.8E-03 3.4E-03 1.8E-03 O.OE+00 Inital Ground Shine 9.3E-03 5.5E-03 3.4E-03 1.1E-03 O.'OE+OO 4-Day Ground Shine 3.6E-02 2.2E-02 1.4E-02 5.3E-03 2.0E-03 CEDE Inhalation 8.6E-01 5.2E-01 3.5E-01 1.4E-01 5.9E-02
Note the increase in doses by about 100 times. Spiking is a known phenomenon whose probability increases with rapid reactor shutdowns. Spikes may occur even if the core is covered throughout the accident. This problem illustrates the worst case release if there is no core damage.
Two points to consider:
1. Even for the worst case SGTR with no core damage, the release will not exceed EPA PAGs at one mile with average meteorological conditions (but could come close!)
2. If you have a U-tube steam generator and it can be assumed that the break is covered and the secondary side is full, then assume it is partitioned. Partitioning reduces the source term 25 times more than non-partitioned.
NUREG/CR-5247, Vol. 2, Rev. 2

STDOSEExercise Discussions 101
16 Plutonium Release (problem on page 46)
Set up the problem using the Isotopic Release Rates source-term option. The total release of 360,000 Ci of ^'Pu over 1 hour translates into a release rate of 100 Ci/sec. All other values are default as shown:
Case T i t l e : ST-D0SE Workbook Problem 16 < S i te Name • NO PLANT SELECTED UNIT 1 Ef f . Release Height: 0 m Default ( • ) Ci •* Source Term • Uni ts : ( ) Bq User Specif ied Isotopic Release Rates Uni ts : Ci/sec
Pu-239 1.00E+002
Data ( • ) Projected Source: ( ) Actual
i « Events • Decy Strt < NA >
; Rel->Cont < NA > : Rel->Envi 09/19/94 00:00
Rel End 09/19/94 01:00 ' Expos End 09/19/94 04:00
< Meteorological Data > date time winds stb mix precip
1 09/19/94 00:00 4 mph 90 D 500 m NONE 2 < undefined > 3 < undefined > 4 < undefined >
• Calculation Options: ; Model: ( ) Plume Building (•} On Calculation (•) 10-mile (16 km)
(•) Puff wake: ( ) Off radius: ( ) 25-mile (40 km)
The maximum early-phase doses calculated are:
ST-DOSE Workbook Problem 16 NO PLANT SELECTED UNIT 1 Projected Data Distance Maximum EARLY-PHASE Doses (rem) Puff Model from Site, mi(km) .5( .8) 1.0(1.6) 2,0(3.2) 5.0(8.0) 10.(16.)
Total EDE (EPA) *5.9E+05 *3.6E+05 *2.4E+05 *9.5E+04 *4.1E+04 Thyroid (EPA) 4.6E+00 2.8E+00 1.9E+00 7.4E-01 3.2E-01 Acute Lung 1.7E+04 1.0E+04 6.8E+03 2.7E+03 1.2E+03 Acute Bone Total 6.1E+02 3.7E+02 2.5E+02 9.8E+01 4.2E+01
Acute Bone Inhalatn 6.1E+02 3.7E+02 2.5E+02 9.8E+01 4.2E+01 Cloud Shine 0.0E+00 0.0E+00 0.0E+00 O.OE+00 O.OE+00 Inital Ground Shine 0.0E+00 O.OE+00 0.0E+00 O.OE+00 O.OE+00 4-Day Ground Shine 4.0E-03 2.5E-03 1.6E-03 O.OE+00 O.OE+00 CEDE Inhalation 5.9E+05 3.6E+05 2.4E+05 9.5E+04 4.1E+04
NUREG/CR-5247, Vol. 2, Rev. 2

102 RASCAL 2.1 Workbook
The impact of dose on early health effects is summarized in the table in the introduction and in the on-line help text. The help text associated with the Total Acute Bone Dose selection on the results screen reads:
This is the sum of effective,dose from initial ground shine, cloud shine, and acute inhalation.1 Select this item for insights into the early health effects listed below for reactor accidents. For accidents where lung dose will dominate (e.g. Pu release) the Acute Lung dose should be used for early health insights. Use Total Effective Dose Equivalent (TEDE) for comparison with EPA early-phase PAGs. The table below summarizes some early health effects and marks with a ."*";the thresholds used in the model to indicate potential health effects:
> DEATHS CHILD/ADULT : (Bone Marrow - Acute) .Exposure Rate ' Effects with MINIMAL Treatment 1000 R/hr 150 rads deaths might occur (threshold) 5 R/hr - f \\"' 220, rads deaths might occur (threshold) * 5 R/hr. , 440 rads 50 % deaths
Exposure Rate : . Effects with SUPPORTIVE Treatment 1000 R/hr .230 rads deaths might occur (threshold) 5 R/hr ;v' 330 rads deaths might occur (threshold) 5 R/hr ' '.'•.''•' 660 rads 50 % deaths
"/ HEALTH EFFECTS CHILD/ADULT : (Whole Body - Acute)
Vomiting and Diarrhea >6 R/hr 50 rads - health effects might occur *
(threshold) 150 rads 50 % occurrence
Note that early health effects of the bone and lung doses dominate in this case. Thyroid doses do not exceed PAGs. The acute bone dose indicates deaths possible at 2 miles and vomiting and diarrhea to about 10 miles. Here again, the model should probably be run again with an increased exposure time to see the effects beyond 10 miles.
NUREG/CR-5247, Vol. 2, Rev. 2

STDOSEExercise Discussions 103
As noted in the ST-DOSE help screens, for plutonium releases it is important to look at the acute lung dose to assess early health effects. The acute lung dose indicates possible deaths out beyond 5 miles.
Select this item to examine the early health effects shown below due to doses to the lungs. Dose calculated is a 30-day committed dose to an adult man. The table below summarizes the early death thresholds (a function of exposure rate).
Exposure Rate R/hr
Threshold rads
1000 * 700 100 -'"2000
50 4000
y\6 16,000 ,
* used in model
Source: NUREG/CR-4214
NUREG/CR-5247, Vol. 2, Rev. 2

104 RASCAL 2.1 Workbook
17 Noble Gas Only Release (problem on page 46)
Set up the problem as stated. Use the Mix Specified By Analyst source-term option with 100% Kr and Xe. The release height is set to 50 meters. Building wake is left turned ON since there is no indication that the release is from an isolated stack.
Case T i t l e : ST-DOSE Workbook Problem 17 -« S i t e Name • NO PLANT SELECTED UNIT 1 Ef f . Release Height: 50 m Default ( • ) Ci « Source Term • Units: ( ) Bq Gross Reactor Release wi th Mix Specif ied by Analyst
Release Rate: 1.00E+003 Ci/sec Fractions: Kr, Xe: 100.0000
« Events • Shut Down Rel->Cont Rel->Envi Rel End Expos End
I: Cs:
09/19/94 00:00 < NA >
09/19/94 00:00 09/19/94 01:00 09/19/94 04:00
Data Source:
0000 0000 0000 0000
(•) Projected ( ) Actual
Te, Sb: 0. 0.0000 Ba, Sr: 0. 0.0000 Ru, Mo: 0.
La, Y, Ce, Np: 0. « Meteorological Data >
date time winds stb mix 1 09/19/94 00:00 4 mph 90 D 500 m 2 < undefined > 3 < undefined > 4 < undefined >
precip NONE
Calculation Options: Model: ( ) Plume Building (•) On Calculation
(•) Puff wake: ( ) Off radius: (») 10-mile (16 km) ( ) 25-mile (40 km)
The results for the monitored release are:
ST-DOSE Workbook Problem 17 NO PLANT SELECTED UNIT 1 Projected Data Distance Maximum EARLY-PHASE Doses (rem) Puff Model from Site, mi(km) .5( .8) 1.0(1.6) 2.0(3.2) 5.0(8.0) 10.(16.)
Total EDE (EPA) *2.8E+00 *2.0E+00 *1.4E+00 7.0E-01 3.2E-01 Thyroid (EPA) 1.5E-02 9.0E-03 6.0E-03 2.5E-03 1.1E-03 Acute Lung 6.8E-03 4.1E-03 2.7E-03 1.2E-03 0.0E+00 Acute Bone Total 2.0E+00 1.5E+00 1.1E+00 5.7E-01 2.6E-01
Acute Bone Inhalatn 1.5E-02 8.9E-03 5.9E-03 2.5E-03 1.2E-03 Cloud Shine 1.7E+00 1.3E+00 9.5E-01 5.4E-01 2.6E-01 Inital Ground Shine 2.8E-01 1.6E-01 1.0E-01 3.1E-02 6.2E-03 4-Day Ground Shine 9.3E-01 5.6E-01 3.6E-01 1.4E-01 5.1E-02 CEDE Inhalation 1.5E-01 9.1E-02 6.0E-02 2.4E-02 1.0E-02
NUREG/CR-5247, Vol. 2, Rev. 2
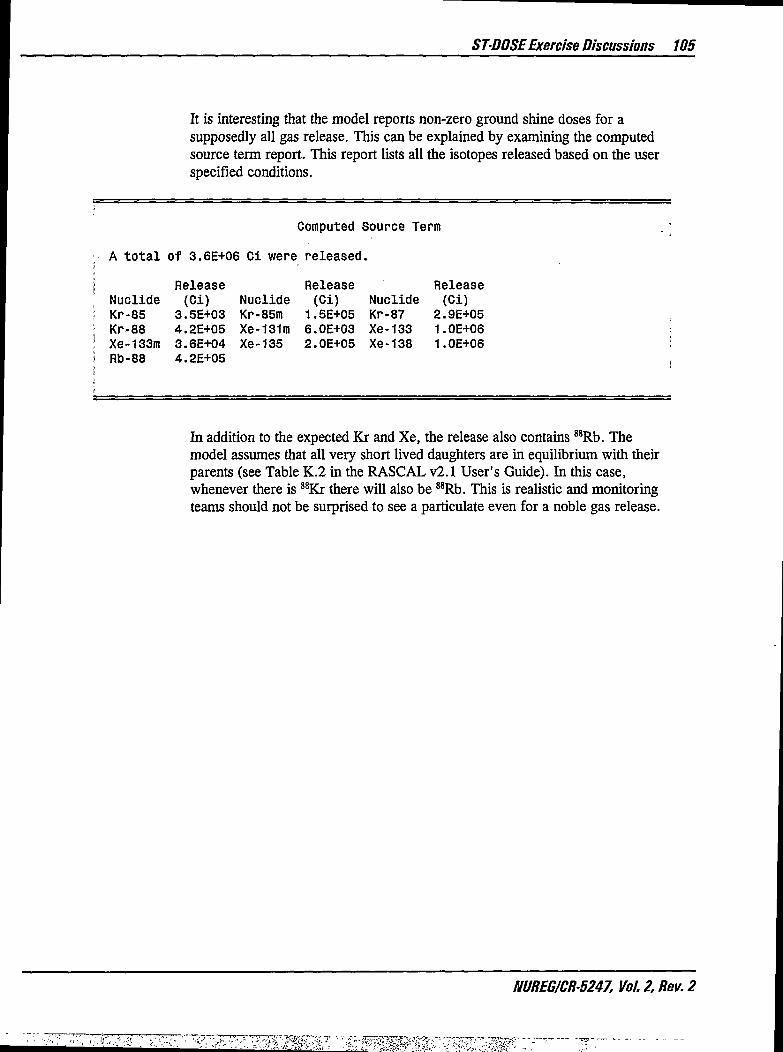
STDOSE Exercise Discussions 105
It is interesting that the model reports non-zero ground shine doses for a supposedly all gas release. This can be explained by examining the computed source term report. This report lists all the isotopes released based on the user specified conditions.
Computed Source Term
;• A to ta l of 3.6E+06 Ci were released,
[ Release Release Release Nuclide (Ci) Nuclide (Ci) Nuclide (Ci)
i Kr -85 3.5E+03 Kr-85m 1.5E+05 Kr-87 2.9E+05 ; Kr-88 4.2E+05 Xe-131m 6.0E+03 Xe-133 1.0E+06 I Xe-133m 3.6E+04 Xe-135 2.0E+05 Xe-138 1.OE+06 ! Rb-88 4.2E+05
In addition to the expected Kr and Xe, the release also contains 88Rb. The model assumes that all very short lived daughters are in equilibrium with their parents (see Table K.2 in the RASCAL v2.1 User's Guide). In this case, whenever there is 88Kr there will also be 88Rb. This is realistic and monitoring teams should not be surprised to see a particulate even for a noble gas release.
NUREG/CR5247, Vol.2,Rev.2
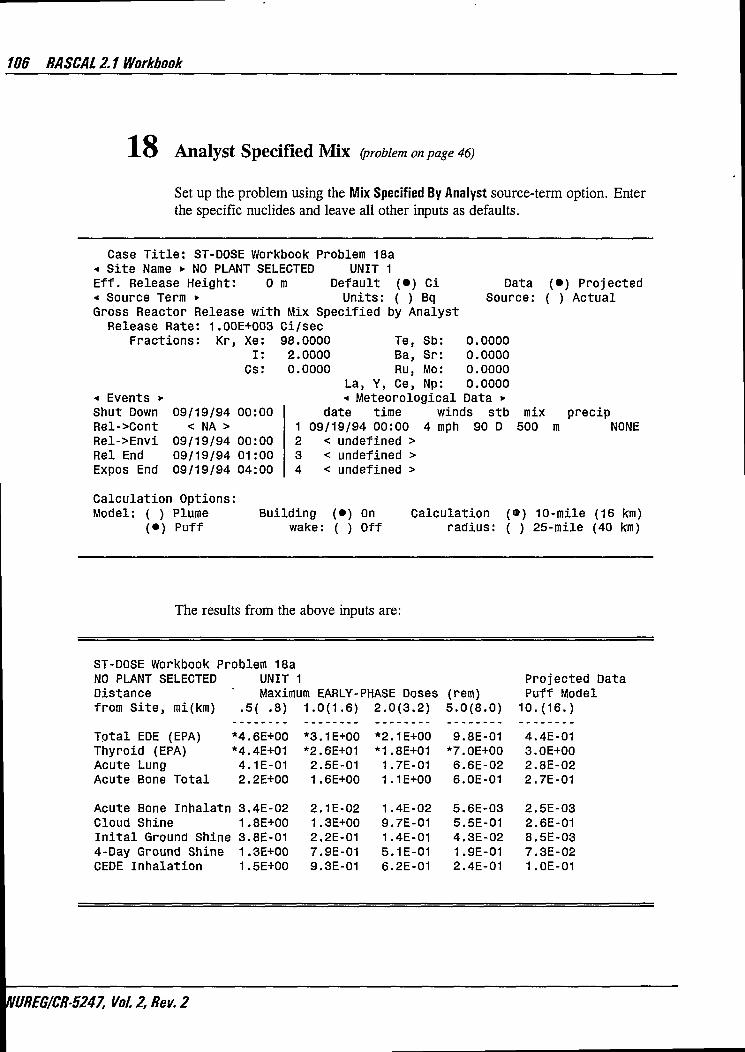
106 RASCAL 2.1 Workbook
18 Analyst Specified Mix (problem on page 46)
Set up the problem using the Mix Specified By Analyst source-term option. Enter the specific nuclides and leave all other inputs as defaults.
Case Title: ST-DOSE Workbook Problem 18a < Site Name • NO PLANT SELECTED UNIT 1 Eff. Release Height: 0 m Default (•) Ci Data (•) Projected •* Source Term »• Units: ( ) Bq Source: ( ) Actual Gross Reactor Release with Mix Specified by Analyst Release Rate: 1.00E+003 Ci/sec
Fractions: Kr, Xe: 98.0000 Te, Sb: 0.0000 I: 2.0000 Ba, Sr: 0.0000
Cs: 0.0000 Ru, Mo: 0.0000 La, Y, Ce, Np: 0.0000
* Events »- i Meteorological Data • Shut Down 09/19/94 00:00 date time winds stb mix precip Rel->Cont < NA > 1 09/19/94 00:00 4 mph 90 D 500 m NONE Rel->Envi 09/19/94 00:00 2 < undefined > Rel End 09/19/94 01:00 3 < undefined > Expos End 09/19/94 04:00 4 < undefined >
Calculation Options: Model: ( ) Plume
(•) Puff Building (•) On
wake: ( ) Off Calculation (») 10-mile (16 km)
radius: ( ) 25-mile (40 km)
The results from the above inputs are:
ST-DOSE Workbook Problem 18a NO PLANT SELECTED UNIT " I Projected Data Distance Maximum EARLY-PHASE Doses (rem) Puff Model from Site, mi(km) .5( .8) 1.0(1.6) 2.0(3.2) 5.0(8.0) 10.(16.)
Total EDE (EPA) *4.6E+00 *3.1E+00 *2.1E+00 9.8E-01 4.4E-01 Thyroid (EPA) *4.4E+01 *2.6E+01 *1.8E+01 *7.0E+00 3.0E+00 Acute Lung 4.1E-01 2.5E-01 1.7E-01 6.6E-02 2.8E-02 Acute Bone Total 2.2E+00 1.6E+00 1.1E+00 6.0E-01 2.7E-01
Acute Bone Inhalatn 3.4E-02 2.1E-02 1.4E-02 5.6E-03 2.5E-03 Cloud Shine 1.8E+00 1.3E+00 9.7E-01 5.5E-01 2.6E-01 Inital Ground Shine 3.8E-01 2.2E-01 1.4E-01 4.3E-02 8.5E-03 4-Day Ground Shine 1.3E+00 7.9E-01 5.1E-01 1.9E-01 7.3E-02 CEDE Inhalation 1.5E+00 9.3E-01 6.2E-01 2.4E-01 1.0E-01
NUREG/CR-5247, Vol. 2, Rev. 2

STDOSEExercise Discussions 107
Look at the computed source term output to see exactly what radionuclides make up the mix.
Computed Source Term A total of 3.6E+06 Ci were released.
! Release Release Release 1 Nuclide (Ci) Nuclide (Ci) Nuclide (Ci)
Kr-85 3.4E+03 Kr-85m 1.4E+05 Kr-87 2.9E+05 . Kr-88 4.1E+05 1-131 7.5E+03 1-132 1.1E+04 ! 1-133 1.5E+04 1-134 1.7E+04 1-135 1.3E+04 [ Xe-I3lm 5.9E+03 Xe-133 1.0E+06 Xe-133m 3.6E+04 1 Xe-135 2.0E+05 Xe-138 1.0E+06 Rb-88 4.1E+05 • Xe-135m 2.1E+03
RTM-93, Table C-3 on page C-85 gives the following reduction factors:
Sprays ON with 2-12 hour holdup 0.02
Suppression pool scrubbing (subcooled pool) 0.01
Dry filters and low pressure 0.01
Reduction factors are multiplied together to give a single number used to modify the amount of available material for release (see the source-term equation in Appendix C of the RASCAL v2.1 User's Guide). However, NUREG-1228 (pages 5-1 and 5-2) states that a maximum total reduction factor of 0.001 (0.1%) should be assumed for the product of all non-filter reduction mechanisms. In this case the product of the sprays on (0.02) and the suppression pool scrubbing (0.01) is 0.0002 (0.02%). This violates the rule for non-filter reduction factors. Thus, use the maximum reduction of 0.001 for the non-filter items times the 0.01 reduction for the filters to arrive at value of 0.0001(0.01%).
NUREG/CR-5247, Vol. 2, Rev. 2

108 RASCAL 2.1 Workbook
Revise the isotope mix to use 99.99% Kr, Xe and 0.01 % I and calculate again.
ST-DOSE Workbook Problem 18b .•• ' '''•.' NO PLANT SELECTED , UNIT / I '• . • -'. / " Projected Data Distance Maximum EARLY-PHASE Doses (rem) Puff Model from Site, mi(km) . .5(, .8): ,1.0(1.6) 2.0(3;;2) 5.0(8.0) ; 10.(16.)
Total EDE (EPA) *2.8E+00 *2,.0E+00 *1.4E+00 . 7.0E-01 3.2Er01 : Thyroid (EPA) '.: 2.3E-01 1.4E-01 9.4E-02 3.7E-02 1.6E-02 , Acute Lung 8.8E-03 5.3E-03 3.6E-03 1.5Er03< 0.0E+00. Acute Bone Total 2.0E+00 ; 1.5E+00 1.1E+00 5.7E-01 2.6E-01 ,
Acute Bone Inhalatn, 1.5Er02 9.0E-03 • 6.0E-03 2.6E-03 1.2E-03 ' Cloud Shine 1.7E-J-00 1.3E+00 9.5E-01 5.4E-01 2.6E-01 Inital Ground Shine 2.8E-01 1.6E-01. 1.0E-01 3.1E-02: 6.2E-03 4-Day Ground Shine 9.3E-01 5.6E-01 3.7E-01 1.4E-01. 5.1E-02 CEDE Inhalation 1.6E-01 . 9.5E-02 6;3E-P2 2.5E-02 1.1E-02
Lxjok at the thyroid doses. Why are they interesting?
The thyroid doses are about 200X lower in die second case. With the 98/2 percent mix, thyroid PAGs were exceeded to 5 miles. With only 0.01 % iodine, thyroid PAGs are not exceeded.
You should not use standard assumptions during accidents. Always make your best estimate based on the information available at the time!
NUREG/CR-5247, Vol. 2, Rev. 2

STDOSEExercise Discussions 109
19 Dry Well / Wet Well (problem on page 46)
Set up the problem as stated for the Enrico Fermi plant. Specify a BWR dry-well leakage/failure, in-vessel severe core damage, and a leak rate of 100%/day. Use default values for all other parameters.
( • ) Projected ( ) Actual
Case T i t l e : ST-DOSE Workbook Problem 19a « S i te Name • ENRICO FERMI UNIT 2 Ef f . Release Height: 0 m Default ( • ) Ci Data < Source Term »• Uni ts: ( ) Bq Source: Reactor Accident Based On Plant Conditions
Release Pathway: Dry Well Leakage/Failure; BWR Containment Core Condit ion: In-Vessel Severe Core Damage (>30 min)
Reactor Power: 3292 Mw(t) Sprays: Off Release Path: Unf i l tered
Leak Rate: 4%/hr = 100%/day < Meteorological Data • •« Events •
Shut Down Rel->Cont Rel->Envi Rel End Expos End
09/19/94 00: 09/19/94 00: 09/19/94 00: 09/19/94 01:
00 00 00 00
09/19/94 04:00
date time 1 09/19/94 00:00 2 < undefined > 3 < undefined > 4 < undefined >
winds stb mix 4 mph 90 D 500
precip NONE
Calculat ion Options: Model: { ) Plume Bui lding (•) On
(• ) Puff wake: ( ) Off Calculation (•) 10-mile (16 km)
radius: ( ) 25-mile (40 km)
The results for the dry well case are:
ST-DOSE Workbook Problem 19a j •' ENRICO FERMI UNIT 2 Projected Data
Distance Maximum EARLY-PHASE Doses (rem) Puff Model from Site, mi(km) .5( .8) 1.0(1.6) 2.0(3.2) 5.0(8.0) 10.(16.)
! Total EDE (EPA) *4.4E+02 *2.7E+02 *1.8E+02 *7.3E+01 *3.1E+01 j Thyroid (EPA) *6.2E+03 *3.8E+03 *2.5E+03 *9.9E+02 *4.3E+02 I Acute Lung 2.0E+02 1.2E+02 8.2E+01 3.2E+01 1.4E+01 Acute Bone Total 5.7E+01 3.8E+01 2.6E+01 1.1E+01 4.7E+00 I
Acute Bone Inhalatn 1.8E+01 1.1E+01 7.5E+00 3.0E+00 1.3E+00 Cloud Shine 2.2E+01 1.7E+01 1.2E+01 6.6E+00 3.0E+00 Inital Ground Shine 1.7E+01 9.9E+00 6.1E+00 1.9E+00 3.8E-01 4-Day Ground Shine 1.0E+02 6.0E+01 4.0E+01 1.5E+01 6.1E+00 CEDE Inhalation 3.2E+02 1.9E+02 1.3E+02 5.1E+01 2.2E+01
NUREG/CR-5247, Vol. 2, Rev. 2

/10 RASCAL 2,1 Workbook
Redefine the problem to be a wet-well release with a sub-cooled suppression pool. Recalculate the doses.
Data Source:
(•) Projected ( ) Actual
Case Title: ST-DOSE Workbook Problem 19b , •« Site Name • ENRICO FERMI UNIT 2 Eff. Release Height: 0 m Default (•) Ci + Source Term *• Units: ( ) Bq Reactor Accident Based On Plant Conditions Release Pathway: Wet Well Leakage/Failure; BWR Containment
In-Vessel Severe Core Damage (>30 min) 3292 Mw(t) Subcooled Release Path: Unfiltered 4%/hr = 100%/day
* Meteorological Data • date time winds stb
1 09/19/94 00:00 4 mph 90 D 2 < undefined > 3 < undefined > 4 < undefined >
Core Condition Reactor Power
Wet Well Leak Rate
< Events • Shut Down Rel->Cont Rel->Envi Rel End Expos End
09/19/94 00:00 09/19/94 00:00 09/19/94 00:00 09/19/94 01:00 09/19/94 04:00
mix precip 500 m NONE
Calculation Options: Model: ( ) Plume Building (•) On Calculation
(•) Puff wake: ( ) Off radius: (•} 10-mile (16 km) ( ) 25-mile (40 km)
The results for the wet well case are:
ST-DOSE Workbook Problem 19b ENRICO FERMI UNIT 2 Projected Data Distance Maximum EARLY-PHASE Doses (rem) Puff Model from Site, mi(km) .5( .8) 1.0(1.6) 2.0(3.2) 5.0(8.0) 10.(16.) Total EDE (EPA) *2.3E+01 *1.6E+01 *1.1E+01 *5.4E+00 *2.4E+00 Thyroid (EPA) *6.2E+01 *3.8E+01 *2.5E+01 *9.9E+00 4.3E+00 Acute Lung 2.1E+00 1.3E+00 8.4E-01 3.3E-01 1.4E-01 Acute Bone Total 1.4E+01 1.0E+01 7.3E+00 4.0E+00 1.8E+00 Acute Bone Inhalatn 2.8E-01 1.7E-01 1.1E-01 4.7E-02 2.1E-02 Cloud Shine 1.2E+01 9.1E+00 6.6E+00 3.7E+00 1.8E+00 Inital Ground Shine 2.0E+00 1.2E+00 7.4E-01 2.3E-01 4.6E-02 4-Day Ground Shine 6.8E+00 4.1E+00 2.7E+00 9.9E-01 3.7E-01 CEDE Inhalation 4.2E+00 2.5E+00 1.7E+00 6.7E-01 2.9E-01
Note that the thyroid doses are 100X less in the wet well case. TEDE doses are i5-20X lower. The comparison shows the importance of sending a release through the suppression pool (possible venting strategy). The pool acts like a big filter which removes a significant amount of the non-noble gases (I, Cs).
NUREG/CR-5247, Vol. 2, Rev. 2
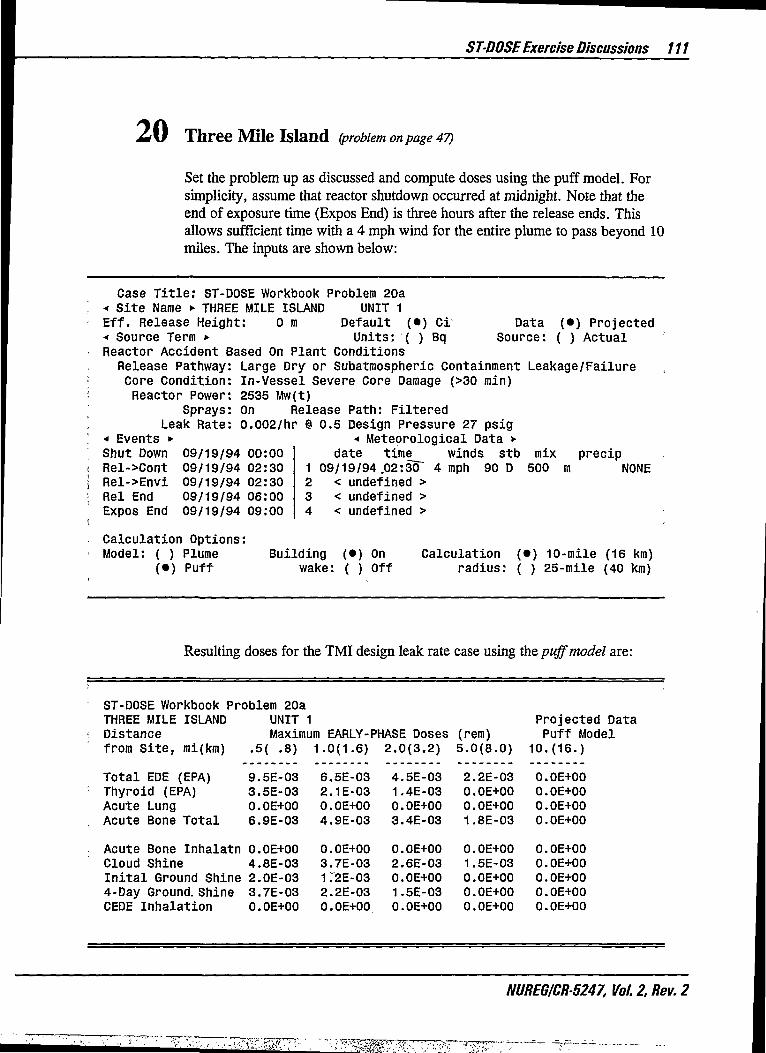
ST-DOSE Exercise Discussions 111
20 Three Mile Island (problem on page 47)
Set the problem up as discussed and compute doses using the puff model. For simplicity, assume that reactor shutdown occurred at midnight. Note that the end of exposure time (Expos End) is three hours after the release ends. This allows sufficient time with a 4 mph wind for the entire plume to pass beyond 10 miles. The inputs are shown below:
Data Source:
(•) Projected ( ) Actual
Case Title: ST-DOSE Workbook Problem 20a f Site Name • THREE MILE ISLAND UNIT 1 Eff. Release Height: 0 m Default (•) Ci < Source Term • Units: ( ) Bq Reactor Accident Based On Plant Conditions Release Pathway: Large Dry or Subatmospheric Containment Leakage/Failure
In-Vessel Severe Core Damage (>30 min) 2535 Mw(t) On Release Path: Filtered 0.002/hr @ 0.5 Design Pressure 27 psig
« Meteorological Data • date time winds stb
09/19794.02:30 4 mph 90 D < undefined > < undefined > < undefined >
Core Condition Reactor Power
Sprays Leak Rate
< Events *• Shut Down Rel->Cont Rel->Envi Rel End Expos End
09/19/94 00:00 09/19/94 02:30 09/19/94 02:30 09/19/94 06:00 09/19/94 09:00
1 2 3 4
mix 500
precip m NONE
Calculation Options: Model: ( ) Plume
(•) Puff Building (•) On
wake: ( ) Off Calculation
radius: (•) 10-mile (16 km) ( ) 25-mile (40 km)
Resulting doses for the TMI design leak rate case using the puff model are:
ST-DOSE Workbook Problem 20a THREE MILE ISLAND UNIT 1 Projected Data
i Distance Maximum EARLY-PHASE Doses (rem) Puff Model from Site, mi(km) .5( .8) 1.0(1.6) 2.0(3.2) 5.0(8.0) 10.(16.)
Total EDE (EPA) 9.5E-03 6.5E-03 4.5E-03 2.2E-03 O.OE+00 : Thyroid (EPA) 3.5E-03 2.1E-03 1.4E-03 O.OE+00 O.OE+00
Acute Lung O.OE+00 0.0E+00 O.OE+00 O.OE+00 O.OE+00 Acute Bone Total 6.9E-03 4.9E-03 3.4E-03 1.8E-03 O.OE+00
Acute Bone Inhalatn O.OE+00 O.OE+00 O.OE+00 0.0E+00 O.OE+00 Cloud Shine 4.8E-03 3.7E-03 2.6E-03 1.5E-03 O.OE+00 Inital Ground Shine 2.0E-03 1:2E-03 O.OE+00 O.OE+00 O.OE+00 4-Day Ground. Shine 3.7E-03 2.2E-03 1.5E-03 0.0E+00 O.OE+00 CEDE Inhalation O.OE+00 0.0E+00 O.OE+00 O.OE+00 O.OE+00
NUREG/CR-5247, Vol. 2, Rev. 2
.-•, -.<ft:-sar7T-' -'"-: -^m^^^r^-

112 RASCAL 2.1 Workbook
Note that the leak rate at TMI was effectively less than design. However, the cloud shine close to the plant is in the milli-rem range. This is consistent with measurements at TMI.
Now, revise the leak rate to represent the failure of the containment (100%/hour) 10 hours after shutdown. Rerun the calculations with the puff model again.
Data Source:
(•) Projected ( ) Actual
Case Title: ST-DOSE Workbook Problem 20b < Site Name > THREE MILE ISLAND UNIT 1 Eff. Release Height: 0 m Default (•) Ci < Source Term • Units: ( ) Bq Reactor Accident Based On Plant Conditions Release Pathway: Large Dry or Subatmospheric Containment Leakage/Failure
In-Vessel Severe Core Damage (>30 min) 2535 Mw(t) On Release Path: Unfiltered 100%/hr
« Meteorological Data • date time winds stb mix precip
1 09/19/94 10:00 4 mph 90 D 500 m NONE 2 < undefined > 3 < undefined > 4 < undefined >
Core Condition Reactor Power
Sprays Leak Rate
« Events • Shut Down Relr>Cont Rel->Envi Rel End Expos End
09/19/94 00:00 09/19/94 02:30 09/19/94 10:00 09/19/94 11:00 09/19/94 15:00
Calculat ion Options: Model: ( ) Plume . Bui lding (•) On
(• ) Puff wake: ( ) Off Calculat ion ( • ) 10-mile (16 km)
radius: ( ) 25-mile (40 km)
The results with the 100%/hour leak rate with 10 hours of hold-up are:
ST-DOSE Workbook Problem 20b THREE MILE ISLAND UNIT 1 Projected Data Distance Maximum EARLY-PHASE Doses (rem) Puff Model from Site, mi(km) .5( .8) 1.0(1.6) 2.0(3.2) 5.0(8.0) 10.(16.)
Total EDE (EPA) *2.2E+02 *1.4E+02 *9.3E+01 *3.9E+01 *1.7E+01 Thyroid (EPA) *2.8E+03 *1.7E+03 *1.1E+03 *4.5E+02 *1.9E+02 Acute Lung 9.2E+01 5.6E+01 3.7E+01 1.5E+01 6.3E+00 Acute Bone Total 4.4E+01 3.0E+01 2.1E+01 1.0E+01 4.5E+00
Acute Bone Inhalatn 1.0E+01 6.1E+00 4.1E+00 1.6E+00 7.0E-01 Cloud Shine 2.6E+01 2.0E+01 1.4E+01 7.8E+00 3.6E+00 Inital Ground Shine 8.2E+00 4.8E+00 3.1E+00 1.OE+00 2.7E-01 4-Day Ground Shine 4.5E+01 2.7E+01 1.8E+01 6;9E+00 2.8E+00 CEDE Inhalation 1.5E+02 9.2E+01 6.1E+01 2.4E+01 1.0E+01
NUREG/CR-5247, Vol. 2, Rev. 2

STDOSEExercise Discussions 113
The dose numbers speak for themselves. Note that the thyroid dose is very large and EPA PAGs are exceeded beyond 10 miles. However no deaths (acute bone inhalation > 200 rem) would have been expected.
1.0E+02 ¥
©1.0E+01 ^^ o 01 Q1.0E+00
g 1.0E-01 i o
CO
g 1.0E-02
1.0E-03 4 6
Distance (miles) 10
-•- Design Leak Rate -*- Containment Failure
1.0E+04
1.0E+03 --•
E 1.0E+02 -to S1.0E+01 -o Q 2 1.0E+00 i o
jE 1.0E-01 ••
4 6 Distance (miles)
10
-•- Design Leak Rate Containment Failure
NUREG/CR-5247, Vol. 2, Rev. 2

/14 RASCAL 2.1 Workbook
Since the EPA early-phase PAGs have been exceeded at 10 miles the model should be run again using a calculation radius of 25 miles. To do this the duration of exposure must be increased to allow sufficient time for the material to be transported beyond 25 miles. In this case the end of exposure was increased from 15:00 to 20:00.
Case Title: ST-DOSE Workbook Problem 20c •« S i t e Name > THREE MILE ISLAND UNIT 1 Eff. Release Height: 0 m Default (•) Ci < Source Term • Units: ( ) Bq Reactor Accident Based On Plant Conditions
Release Pathway: Large Dry or Subatmospheric Containment Leakage/Failure
Data Source:
(•) Projected ( ) Actual
Core Condition: In-Vessel Severe Core Damage (>30 min) Reactor Power: 2535 Mw(t)
Sprays: On Release Path: Unfiltered Leak Rate: 100%/hr
•* Events *• « Meteorological Data • Shut Down 09/19/94 00:00 date time winds stb mix precip Rel->Cont 09/19/94 02:30 1 09/19/94 10:00 4 mph 90 D 500 m NONE Rel->Envi 09/19/94 10:00 2 < undefined > Rel End 09/19/94 11:00 3 < undefined > Expos End 09/19/94 20:00 4 < undefined >
Calculation Options: Model: ( ) Plume Building {•) On Calculation ( ) 10-mile (16 km)
(•) Puff wake: ( ) Off radius: (») 25-mile (40 km)
The maximum value report for the calculations to the extended distance show both TEDE and thyroid PAGs exceeded at 25 miles.
ST-DOSE Workbook Problem 20a THREE MILE ISLAND UNIT " Projected Data Distance Maximum EARLY-PHASE Doses (rem) Puff Model from Site, mi(km) .5{ .8) 1.0(1.6) 2.0(3.2) 10.(16.) 25.(40.)
Total EDE (EPA) *2.3E+02 *1.4E+02 *9.6E+01 *1.7E+01 *3.9E+00 Thyroid (EPA) *2.8E+03 *1.7E+03 *1.1E+03 *1.9E+02 *4.7E+01 Acute Lung 9.2E+01 5.6E+01 3.7E+01 6.3E+00 1.5E+00 Acute Bone Total 5.3E+01 3.6E+01 2.5E+01 5.2E+00 9.4E-01
Acute Bone Inhalatn 1.0E+01 6.1E+00 4.1E+00 7.0E-01 1.8E-01 Cloud Shine 2.6E+01 2.0E+01 1.4E+01 3.6E+00 6.6E-01 Inital Ground Shine 1.7E+01 1.OE+01 6.8E+00 9.0E-01 1.1E-01 4-Day Ground Shine 5.3E+01 3.2E+01 2.1E+01 3.3E+00 7.0E-01 CEDE Inhalation 1.5E+02 9.2E+01 6.1E+01 1.OE+01 2.6E+00
NUREG/CR-5247, Vol. 2, Rev. 2

ST-DOSE Exercise Discussions 115
1.0E+03 T
"S 1.0E+02 ••
UJ Q UJ
£1.0E+01 -
1.0E+00 -t- •+-10 15 Distance (miles)
20 25
1.0E+04 T
Il.OE+03 d> CO o Q
£*1.0E+02
1.0E+01 •+- -+-10 15 Distance (miles)
20 25
NUREG/CR5247, Vol.2,Rev.2
. wy->j:: v^mz^z7c^: ^ - c : ̂ ^mmmtwr^^Fmsry---

/16 RASCAL 2.1 Workbook
21 ISOtopic Release (problem on page 47)
There are two ways to work this problem. Method A involves running the DECAY Calculator to determine an input source term for ST-DOSE after storing the I 3 1I for 1 month. Then the Isotopic Release Rate option in ST-DOSE is used. Method B uses the built in decay of the Isotopic Concentration option.
Method A: Isotopic Release Rate
Set up the DECAY calculator to decay 13,000 Ci of m I for 30 days.
Decay time: 30 days
-Nuclide Cone. -Nuclide Cone. -Nuclide Cone. -Nuclide Cone. Fe-55 0.0000000 Sn-123 0.0000000 Pm-147 0.0000000 Np-239 0.0000000 Fe-59 0.0000000 Sn-126 0.0000000 Sm-151 0.0000000 PU-236 0.0000000 Co-60 0.0000000 Sb-124 0.0000000 Eu-152 0.0000000 Pu-238 0.0000000 Ni-63 0.0000000 Sb-126 0.0000000 Eu-154 0.0000000 PU-239 0.0000000 Cu-64 0.0000000 Sb-127 0.0000000 Eu-155 0.0000000 Pu-240 0.0000000 Zn-65 0.0000000 Sb-129 0.0000000 Gd-153 0.0000000 Pu-241 0.0000000 Ge-68 0.0000000 Te-127 0.0000000 Tb-160 0.0000000 PU-242 0.0000000 Se-75 0.0000000 Te-I27m 0.0000000 Ho-166m 0,0000000 Am-241 0.0000000 Kr-85 0.0000000 Te-129 0.0000000 Tm-170 0.0000000 Am-242m 0.0000000 Kr-85m 0.0000000 Te-129m 0.0000000 Yb-169 0.0000000 Am-243 0.0000000 Kr-87 0.0000000 Te-13.1m 0.0000000 Hf-181 0.0000000 Cm-242 0.0000000 Kr-88 0.0000000 Te-132 0.0000000 Ta-182 0.0000000 Cm-243 0.0000000 Rb-86 0.0000000 ]>125 0.0000000 W-187 b.ooooooo Cm-244 o.ooooodo Sr-89 0.0000000 1-129 0.0000000 Ir-192 0.0000000 Cm-245 0.0000000 Sr-90 0.0000000 1-131 1.30E+004 AU-198 0.0000000 Cf-252 0.0000000 Sr-91 0.0000000 1-132 0.0000000 Hg-203 0.0000000 0.0000000
Calculate the decay and examine the remaining activity.
DECAY Input and Output Run Time: 09/25/94 09:49
Source Activity
1-131 1.30E+004 Xe-131m
Activity Remaining 9.78E+002 2.91E+001
Decay time = 30 days
Notes: 1. Activity units are assumed to be the same for source and remaining 2. To use these values in ST-DOSE, go to the 'Isotopic Concentrations'
source term there, and press the 'Import' push button. These values will be ADDED to any concentrations already present there.
NUREG/CR-5247, Vol. 2, Rev. 2
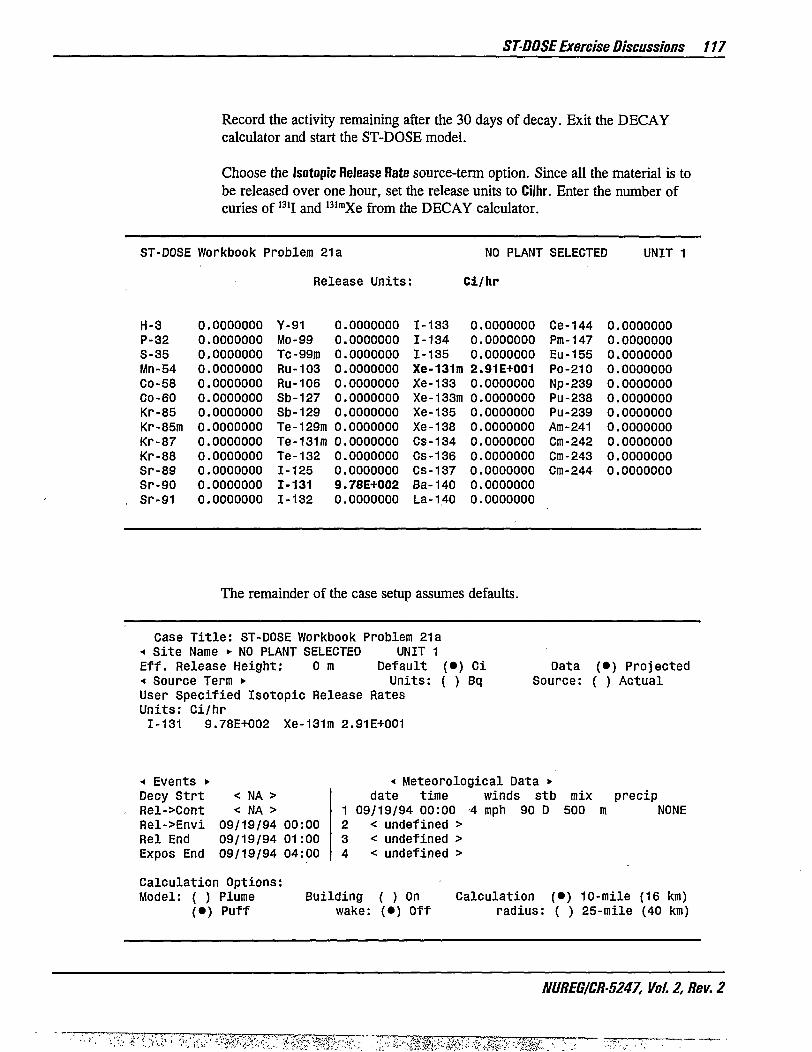
ST-DOSEExercise Discussions 117
Record the activity remaining after the 30 days of decay. Exit the DECAY calculator and start the ST-DOSE model.
Choose the Isotopic Release Rate source-term option. Since all the material is to be released over one hour, set the release units to Ci/hr. Enter the number of curies of I 3 1I and I 3 1 mXe from the DECAY calculator.
ST-DOSE Workbook Problem 21a NO PLANT SELECTED UNIT 1
Release Units : Ci/hr
H-3 0.0000000 Y-91 0.0000000 1-133 0.0000000 Ce-144 0.0000000 P-32 0.0000000 MO-99 0.0000000 1-134 0.0000000 Pra-147 0.0000000 S-35 0.0000000 Tc-99m 0.0000000 1-135 0.0000000 Eu-155 0.0000000 Mn-54 0.0000000 RU-103 0.0000000 Xe-131m 2.91E+001 Po-210 0.0000000 Co-58 0.0000000 RU-106 0.0000000 Xe-133 0.0000000 Np-239 0.0000000 Co-60 0.0000000 Sb-127 0.0000000 Xe-I33m 0.0000000 Pu-238 0.0000000 Kr-85 0.0000000 Sb-129 0.0000000 Xe-135 0.0000000 Pu-239 0.0000000 Kr-85m 0.0000000 Te-129m 0.0000000 Xe-138 0.0000000 Am-241 0.0000000 Kr-87 0.0000000 Te-131m 0.0000000 Cs-134 0.0000000 Cm-242 0.0000000 Kr-88 0.0000000 Te-132 0.0000000 Cs-136 0.0000000 Cm-243 0.0000000 Sr-89 0.0000000 1-125 0.0000000 CS-137 0.0000000 Cm-244 0.0000000 Sr-90 0.0000000 1-131 9.78E+002 Ba-140 0.0000000
, Sr-91 0.0000000 1-132 0.0000000 La-140 0.0000000
The remainder of the case setup assumes defaults.
Case T i t l e : ST-DOSE Workbook Problem 21a •« S i t e Name > NO PLANT SELECTED UNIT 1 Ef f . Release Height: 0 m Default ( • ) Ci * Source Term • Units: ( ) Bq User Specif ied Isotopic Release Rates Uni ts : C i /h r
1-131 9.78E+002 Xe-131m 2.91E+001
Data Source:
( • ) Projected ( ) Actual
< Events >• •« Meteorological Data • Decy Strt < NA > date time winds stb mix precip Rel->Cont < NA > 1 09/19/94 00:00 -4 mph 90 D 500 m NONE Rel->Envi 09/19/94 00:00 2 < undefined > Rel End 09/19/94 01:00 3 < undefined > Expos End 09/19/94 04:00 4 < undefined >
Calculation Options: Model: ( ) Plume Building ( ) On Calculation (•) 10-mile (16 km)
{•) Puff wake: (•) Off radius: ( ) 25-mile (40 km)
NUREG/CR-5247, Vol. 2, Rev. 2

/18 RASCAL 2.1 Workbook
Resulting doses from this case are:
ST-DOSE Workbook Problem 21 a NO PLANT SELECTED UNIT 1 Projected Data Distance Maximum EARLY-PHASE Doses (rem) Puff Model from Site, mi(km) .5( .8) 1.0(1.6) 2.0(3.2) 5.0(8.0) 10.(16.)
Total EDE (EPA) 9.0E-01 3.5E-01 1.3E-01 3.1E-02 9.9E-03 Thyroid (EPA) *2.7E+01 *1.1E+01 3.9E+00 9.4E-01 3.0E-01 Acute Lung 6.1E-02 2.4E-02 8.8E-03 2.1E-03 O.OE+00 Acute Bone Total 9.0E-03 3.5E-03 1.4E-03 O.OE+00 O.OE+00
Acute Bone Inhalatn 5.1E-03 2.0E-03 0.0E+00 O.OE+00 O.OE+00 Cloud Shine 1.2E-03 0.0E+00 O.OE+00 O.OE+00 O.OE+00 Inital Ground Shine 2.7E-03 1.0E-03 0.0E+00 O.OE+00 0.0E+00 4-Day Ground Shine 6.5E-02 2.5E-02 9.4E-03 2.2E-03 O.OE+00 CEDE Inhalation 8.3E-01 3.2E-01 1.2E-01 2.9E-02 9.1E-03
Method B: Isotopic Concentrations
This method takes advantage of the fact that decay and ingrowth will be calculated over a user specified period when using the Isotopic Concentrations source-term option. In this case the decay start time is when the l 3 l I was stored in the tank.
All the material is to be released over one hour. The actual volume of the tank is irrelevant. Set the release rate to 1.0 cc/hr and the concentration units to Ci/cc. Enter the I 3 1I concentration.
NUREG/CR-5247, Vol. 2, Rev. 2
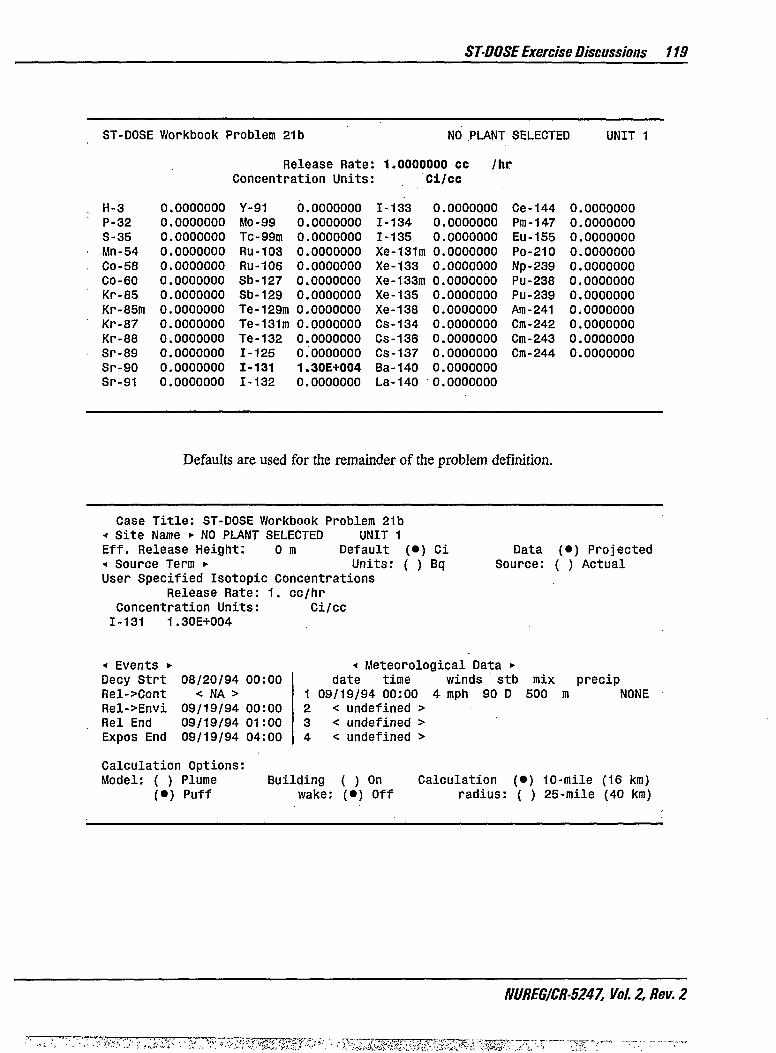
STDOSEExercise Discussions 119
ST-DOSE Workbook Problem 21b NO PLANT SELECTED UNIT 1
Release Rate: l.ooooooo cc Concentration Units: Ci/cc
/hr
, H-3 0.0000000 Y-91 0.0000000 1-133 0.0000000 Ce-144 0.0000000 P-32 0.0000000 MO-99 0.0000000 1-134 0.0000000 Pm-147 0.0000000 S-35 0.0000000 Tc-99m 0.0000000 1-135 0.0000000 EU-155 0.0000000
• Mn-54 0.0000000 RU-103 0.0000000 Xe-13lm 0.0000000 PO-210 0.0000000 , CO-58 0.0000000 RU-106 0.0000000 Xe-133 0.0000000 Np-239 0.0000000 CO-60 0.0000000 Sb-127 0.0000000 Xe-133m 0.0000000 PU-238 0.0000000 Kr-85 0.0000000 Sb-129 0.0000000 Xe-135 0.0000000 Pu-239 0.0000000 Kr-85m 0.0000000 Te-129m 0.0000000 Xe-138 0.0000000 Am-241 0.0000000 Kr-87 0.0000000 Te-I3lro 0.0000000 Cs-134 0.0000000 Cm-242 0.0000000 Kr-88 0.0000000 Te-132 0.0000000 CS-136 0.0000000 Cm-243 0.0000000 Sr-89 0.0000000 1-125 0.0000000 Cs-137 0.0000000 Cm-244 0.0000000 Sr-90 0.0000000 1-131 1.30E+004 Ba-140 0.0000000 Sr-91 0.0000000 1-132 0.0000000 La-140 0.0000000
Defaults are used for the remainder of the problem definition.
Case Title: ST-DOSE Workbook Problem 21b « Site Name • NO PLANT SELECTED UNIT 1 Eff. Release Height; 0 m Default •* Source Term • Units: User Specified Isotopic Concentrations
Release Rate: 1. cc/hr Concentration Units: Ci/cc 1-131 1.30E+004
(•) Ci Data (•) Projected ( ) Bq Source: ( ) Actual
« Events • Decy Strt Rel->Cont Rel->Envi Rel End Expos End
08/20/94 00:00 < NA >
09/19/94 00:00 09/19/94 01:00 09/19/94 04:00
Calculation Options: Model: ( ) Plume
(•) Puff
•« Meteorological Data > date time winds stb
1 09/19/94 00:00 4 mph 90 D 2 < undefined > 3 < undefined > 4 < undefined >
mxx precip 500 m NONE
Building ( ) On wake: (•) Off
Calculation (•) 10-mile (16 km) radius: ( ) 25-mile (40 km)
NUREG/CR-5247, Vol. 2, Rev. 2
TFT^.^Xf^Hfgr^ •• mj^0^^$^&-:wm
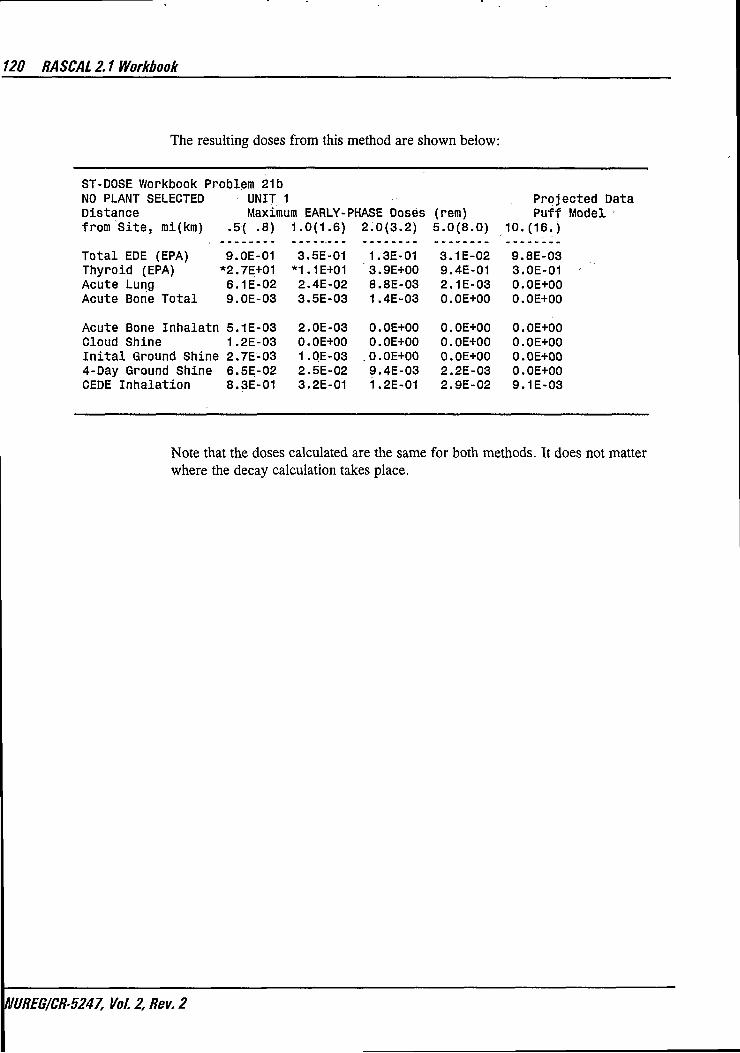
120 RASCAL 2.1 Workbook
The resulting doses from this method are shown below:
ST-DOSE Workbook Problem 21b NO PLANT SELECTED UNIT 1 Projected Data Distance Maximum EARLY-PHASE Ooses (rem) Puff Model from Site, mi(km) .5( .8) 1.0(1.6) 2.0(3.2) 5.0(8.0) 10.(16.)
Total EDE (EPA) 9.0E-01 3.5E-01 1.3E-01 3.1E-02 9.8E-03 Thyroid (EPA) *2.7E+01 *1.1E+01 3.9E+00 9.4E-01 3.0E-01 Acute Lung 6.1E-02 2.4E-02 8.8E-03 2.1E-03 O.OE+00 Acute Bone Total 9.0E-03 3.5E-03 1.4E-03 O.OE+OO O.OE+OO
Acute Bone Inhalatn 5.1E-03 2.0E-03 O.OE+OO O.OE+00 O.OE+00 Cloud Shine 1.2E-03 O.OE+OO O.OE+00 O.OE+00 O.OE+00 Inital Ground Shine 2.7E-03 1.OE-03 .O.OE+OO O.OE+OO O.OE+OO 4-Day Ground Shine 6.5E-02 2.5E-02 9.4E-03 2.2E-03 O.OE+00 CEDE Inhalation 8.3E-01 3.2E-01 1.2E-01 2.9E-02 9.1E-03
Note that the doses calculated are the same for both methods. It does not matter where the decay calculation takes place.
NUREG/CR-5247, Vol. 2, Rev. 2

STDOSEExercise Discussions 121
22 Containment Sample vs. Rad Monitor (problem on page 48)
In this problem there are two measurements to work with: the containment monitor reading and the results of the containment sample analysis. A separate model run should be made to determine doses based on each measurement.
Part A: Containment Monitor Reading
Set up the. problem using the Containment Monitor source term option.
ST-DOSE Workbook Problem 22a NO PLANT SELECTED UNIT 1
Wet Wel l Dry Well Location of Monitor: [•] PWR [ ] [ ] BWR Mark I
[ ] [ ] BWR Mark I I [ ] [ ] BWR Mark I I I
Reactor Power: 3000 Mw(t) Monitor Reading: 1.00E+004 R/hr
Containment Sprays: t ] On Release Path: { ] Filtered [•] Off - •"[•] Unfiltered \
Leak Rate: {•] 100%/hr [ ] 50%/hr [ ] 10%/hr
. [ ] 4%/hr = 100%/day ; [ ] 1%/hr [ ] 0.5%/hr [ ] 0.004%/hr @ Design Pressure 40 psig [ I 0.002%/hr @ 0.5 Design Pressure 20 psig
Set the event times such that the release to the environment starts 24 hours after the release to the containment. Assume default meteorology.
NUREG/CR-5247, Vol. 2, Rev. 2

122 RASCAL 2.1 Workbook
Case Title: STNDOSE Workbook Problem 22a « Site Name • NO PLANT SELECTED ' UNIT 1 Eff. Release Height: 0 m Default (•) Ci •« Source Term • Units: (; ) Bq Reactor Accident Based On Containment Monitor Readings
Reactor Type: PWR Monitor Reading: 1.00E+004 R/hr Reactor Power: 3000 Mw(t)
Data Source:
(«) Projected ( ) Actual
Sprays Leak Rate
•* Events • Shut Down Rel->Cont Rel->Ehvi Rel End Expos End
Off 100%/hr
< NA > 09/19/94 00:00 09/20/94 00:00 09/20/94 01:00 09/20/94 04:00
Release Path: Unfiltered
< Meteorological Data • date time
09/19/94 00:00 < undefined > < undefined > < undefined >
winds stb mix 4 mph 90 D 500
precip NONE
Calculation Options: Model: ( ) Plume Building (•) On
{•) Puff wake: ( ) Off Calculation (•) 10-mile (16 km)
radius: ( ) 25-mile (40 km)
The resulting early-phase doses are:
ST-DOSE Workbook Problem 22a NO PLANT SELECTED UNIT " I Projected Data Distance Maximum EARLY-PHASE Doses (rem) Puff Model from Site, mi(km) .5( .8) 1.0(1.6) 2.0(3.2) 5.0(8.0) 10.(16.)
Total EDE (EPA) *1.4E+01 *9.5E+00 *6.5E+00 *3.0E+00 *1.3E+00 Thyroid (EPA) *1.0E+02 *6.1E+01 *4.1E+01 *1.6E+01 *6.9E+00 Acute Lung 3.3E+00 2.0E+00 1.3E+00 5.3E-01 2.3E-01 Acute Bone Total 6.3E+00 4.6E+00 3.2E+00 1.7E+00 7.9E-01
Acute Bone Inhalatn 3.4E-01 2.1E-01 1.4E-01 5.5E-02 2.4E-02 Cloud Shine 5.0E+00 3.8E+00 2.7E+00 1.5E+00. 7.4E-01 Inital Ground Shine 1.0E+00 5.9E-01 3.7E-01 I.SEi'OI 2.3E-02 4-Day Ground Shine 3.9E+00 2.4E+00 1.5E+00 5.8E-01 2.2E-01 CEDE Inhalation 5.6E+00 3.4E+00 2.2E+00 8.9E-01 3.8E-01
The TEDE and thyroid PAGs are exceeded at 10 miles.
Examine the computed source term report to see how much core damage was estimated from the radiation monitor reading. Compare this number with the PWR Containment Monitor Readings in section B of the RTM. The values used in ST-DOSE have been updated from those in RTM-93. A later version of the RTM will contain the new values.
NUREG/CR-5247, Vol. 2, Rev. 2

STDOSEExercise Discussions 123
A total of 1.0E+07 Ci were released. Core condition determined from containment monitor reading: 1.8% In-Vessel Severe Core Damage
Release Release Release Nuclide (Ci) Nuclide (Ci) Nuclide (Ci) Kr-85 9.7E+03 Kr-85m 4.1E+05 Kr-87 8.1E+05 Kr-88 1.2E+06 Sr-89 1.5E+03 Sr-90 5.8E+01 Sr-91 1.8E+03 Y-91 1.3E+02 Mo-99 6.8E+02 TC-99ID 6.8E+02 RU-103 4.8E+02 RU-106 1.0E+02 Sb-127 4.8E+02 Sb-129 2.7E+03 Te-129m 4.3E+02 Te-131m 9.6E+02 Te-132 9.6E+03 1-131 1.6E+04 1-132 2.3E+04 1-133 3.2E+04 1-134 3.5E+04
: 1-135 2.8E+04 Xe-I31m 1.7E+04 Xe-133 2.9E+06 ! Xe-133m 1.0E+05 Xe-135 5.6E+05 Xe-138 2.9E+06 . CS-134 1.0E+03 CS-136 4.0E+02 CS-137 6.4E+02 | Ba-140 3.4E+03 La-140 1.7E+02 Ce-144 4.5E+02 ; Np-239 8.8E+03 Rb-88 1.2E+06 Rh-106 1.0E+02 i Te-129 4.3E+02 Xe-135m 4.5E+03 Ba-137m 6.4E+02 « Pr-144 4.5E+02 i
Part B: Containment Sample
Enter the measured concentrations on the Isotopic Concentrations source-term screen. Since the entire volume is released in one hour, set the release rate appropriately.
ST-DOSE Workbook Problem 22b NO PLANT SELECTED UNIT 1 Release Rate: 2.00E+006 ft**3/hr
Concentration Units: ! H-3 0.0000000 Y-91 0.0000000 1-133 P-32 0.0000000 MO-99 0.0000000 1-134 S-35 0.0000000 Tc-99m 0.0000000 1-135 Mn-54 0.0000000 RU-103 0.0000000 Xe-13lm Co-58 0.0000000 RU-106 0.0000000 Xe-133 CO-60 0.0000000 Sb-127 0.0000000 Xe-133m Kr-85 0.0000000 Sb-129 0.0000000 Xe-135 Kr-85m 0.0000000 Te-129m 0.0000000 Xe-138 Kr-87 0.0000000 Te-131m 0.0000000 Cs-134 Kr-88 0.0000000 Te-132 0.0000000 Cs-136 Sr-89 ' 0.0000000 1-125 0.0000000 CS-137 Sr-90 0.0000000 1-131 0.0000012 Ba-140 Sr-91 0.0000000 1-132 0.0000000 La-140
Ci/cc
0.0000038 Ce-144 0.0000000 0.0000000 Pm-147 0.0000000 0.0000032 Eu-155 0.0000000 0.0000000 Po-210 0.0000000 0.0000000 Np-239 0.0000000 0.0000000 PU-238 0.0000000 0.0000000 Pu-239 0.0000000 0.0000000 Am-241 0.0000000 0.0000010 Cm-242 0.0000000 0.0000006 Cm-243 0.0000000 0.0000000 Cm-244 0.0000000 0.0000000 0.0000000
NUREG/CR-5247, Vol. 2, Rev. 2
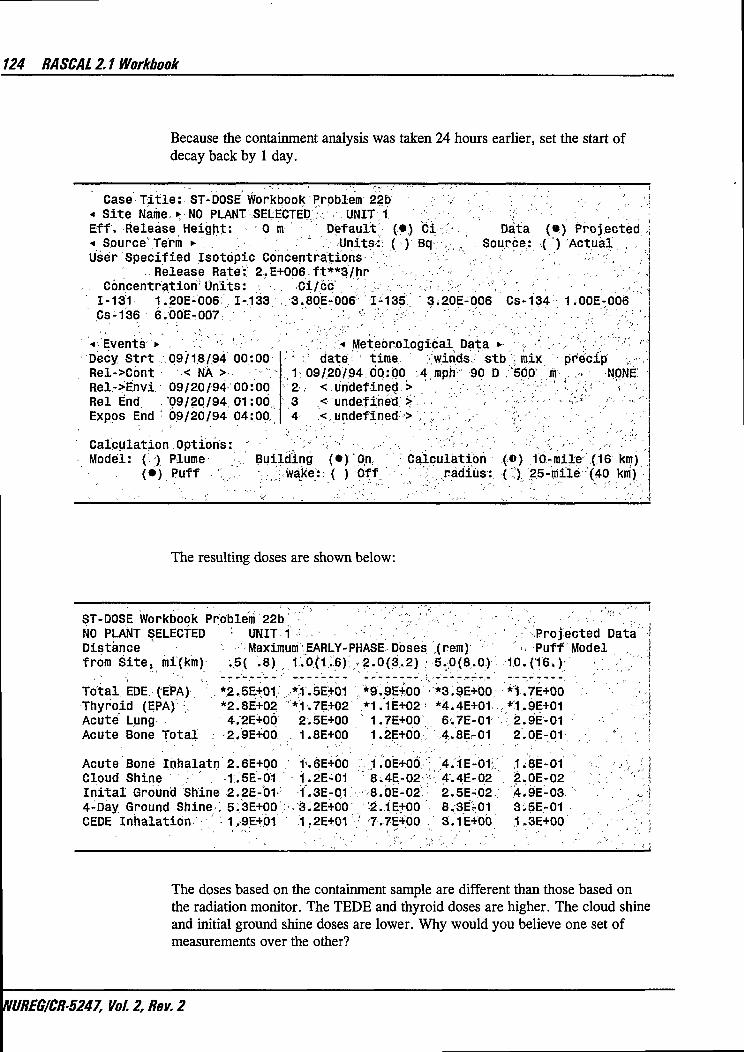
124 RASCAL 2.1 Workbook
Because the containment analysis was taken 24 hours earlier, set the start of decay back by 1 day.
Case T i t l e : ST-DOSE Workbook Problem 22b * S i t e Name, »r NO PLANT SELECTED' UNIT 1 Eff. Release Height*. 0 m Default - Source\Term »• : ! Units; User Specified Isotbpic Concentrations•-'.'""'
Release Rate: 2.E+006 ft**3/hr Concentration*Units: : Ci/cc
1-131 1.20E-006: 1-133 . 3.80Er 006 I^135 Cs-136 6.00E-007 T '••'•• c / {
( • ) Ci ( ) Bq,
Data Source:
C) Projected •.(") Actual ,
3;20E-006 Cs-134 1.00E-006
••Events > Decy Strt Rel->Cont Rel->Envi Rel End
09/18/94 00:00 '•< NA > •>".
09/20/94 00:00 09/20/94 01:00,
Expos End : 09/20/94 04:00
• •;":.' :'.« Meteorological Data •• :, ' , ; ; ; date! • time ;wirids stb ; mix pr'ecip ,-, 1 09/20/94 00:00 .4,mph 90 D .500: m ^ ,. NONE: '2-, < undefined > .' . _•'•;. y . \ - .-.'.'';;;•''. •-.,';*'"' '->'"• 3 < undefined > '< ' •':;•'•'••/' •-':•-''' ./'"' :"-' 4 <. undefxned > V :.'..-, ' .'.-• . ".;'•. -'•'-• -.-.•''
Calculation,Options: * : Model: ( ) Plume Building (•) On
(•} Puff .';.".;. ; wake: { ) Off Calculation (•) ibrraile (16 km)
: .radius:, {;) 25-mile (40 kni)
The resulting doses are shown below:
ST-DOSE Workbook Problem 22b :.,.'"' - •• . • . - • • • > • • ' ; . '. . - ' : -. , ,•,.„ /-' ' f
NO PLANT SELECTED UNIT 1'.; ,.• , ' " • - , • " ' , - : •Projected Data' •>
Distance Maximum EARLY-PHASE Doses (rem) •• Puff Model , J from Site, mi(km) .5( .8) 1.0(1.6): ,2.0(3.2) • 5.0(8.0) 1,0.(160: :, i Total EDE. (EPA) , *2,5E*01, *:T.5E+OI *9.9E+00 •*3.9E+00 *l.7E+oo ':. '••'' :,'--! Thyroid (EPA) •. *2.8E+02 *1.7E+02 •1.1E+02 *4;4E+01 ,*1.9E+01 I Acute Lung 4.2E+00 2.5E+00 N 1.7E+00 6.7E-01 2.9E-01 i Acute Bone Total 2.9E+00 1.8E+00 1.2E+00 4.8E-01 2.0E-01 . * j
Acute Bone inhalatn 2.6E+00 1'.6E+00 1.0E+0O 4.1E-01;, i;8E-oi " •/-, 11 Cloud Shine 1.5E-01 1.2E-01 8;4E-02 4.4E-02 2.0E-02 J , 1 Inital Ground Shine 2.2E-01- 1.3E-01 8.0E-02: 2.5E-02, 4.9E-03 '" ,„i 4-Day Ground ShineO 5.3E+00': -3.2E+00 2.1E+00 8.3Er01 3i5E-01 .-•;"'•: CEDE Inhalation ; 1.9E+01 1.2E+01 ; '7.7E+00 . 3.1E+00 1.3E+00
The doses based on the containment sample are different than those based on the radiation monitor. The TEDE and thyroid doses are higher. The cloud shine and initial ground shine doses are lower. Why would you believe one set of measurements over the other?
NUREG/CR-5247, Vol. 2, Rev. 2
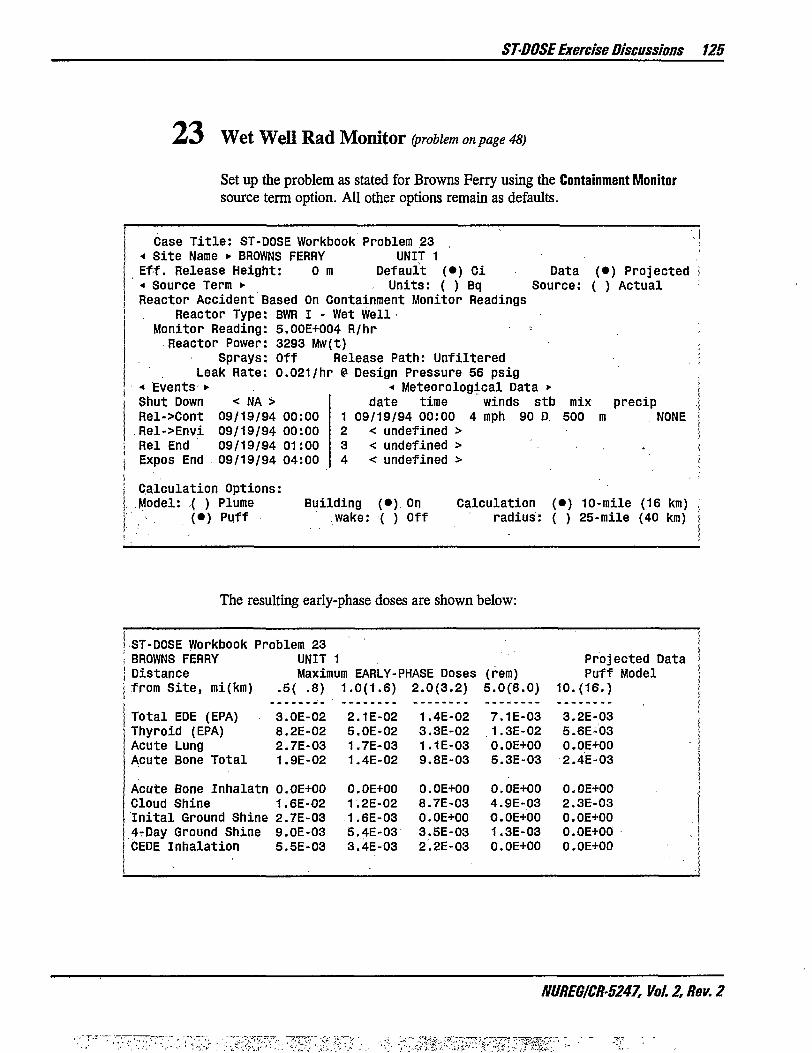
STDOSEExercise Discussions 125
23 W e t W e l l R a d M o n i t o r (problem on page 48)
Set up the problem as stated for Browns Ferry using the Containment Monitor source term option. All other options remain as defaults.
Case T i t l e : ST-DOSE Workbook Problem 23 < Si te Name • BROWNS FERRY UNIT 1 Ef-f. Release Height: 0 m Default (•) Ci Data •* Source Term »• Units: ( ) Bq Source: Reactor Accident Based On Containment Monitor Readings
(•) Projected ( ) Actual
Reactor Type Monitor Reading
Reactor Power Sprays
Leak Rate < Events • Shut Down Rel->Cont Rel->Envi Rel End Expos End
< NA > 09/19/94 00:00 09/19/94 00:00 09/19/94 01:00 09/19/94 04:00
BWR I - Wet Well 5.00E+004 R/hr 3293 Mw(t) Off Release Path: Unfiltered 0.021/hr @ Design Pressure 56 psig
•* Meteorological Data *• date time winds stb
1 09/19/94 00:00 4 mph 90 D 2 < undefined > 3 < undefined > 4 < undefined >
mix 500
precip NONE
j Calculation Options: I, Model: ( ) Plume Building (•) On |" (•) Puff wake: ( ) Off
Calculation (•} 10-mile (16 km) radius: ( ) 25-mile (40 km)
The resulting early-phase doses are shown below:
! ST-DOSE Workbook Problem 23 • ! BROWNS FERRY UNIT 1 Projected Data | Distance Maximum EARLY-PHASE Doses (rem) Puff Model s from Site, mi(km) .5( .8) 1.0(1.6) 2.0(3.2) 5.0(8.0) 10.(16.)
Total EDE (EPA) 3.0E-02 2.1E-02 1.4E-02 7.1E-03 3.2E-03 Thyroid (EPA) 8.2E-02 5.0E-02 3.3E-02 1.3E-02 5.6E-03 Acute Lung 2.7E-03 1.7E-03 1.1E-03 O.OE+00 O.OE+00 Acute Bone Total 1.9E-02 1.4E-02 9.8E-03 5.3E-03 2.4E-03
Acute Bone inhalatn 0.0E+00 0.0E+00 0.0E+00 O.OE+00 O.OE+00 Cloud Shine 1.6E-02 1.2E-02 8.7E-03 4.9E-03 2.3E-03 Inital Ground Shine 2.7E-03 1.6E-03 O.OE+00 O.OE+00 O.OE+00 4-Day Ground Shine 9.0E-03 5.4E-03 3.5E-03 1.3E-03 O.OE+00 CEDE Inhalation 5.5E-03 3.4E-03 2.2E-03 O.OE+00 O.OE+00
NUREG/CR-5247, Vol. 2, Rev. 2

126 RASCAL 2.1 Workbook
Examine the computed source term to see what extent of core damage was predicted.
A t o t a l of 3.3E+04 Ci were released. •""''.' t " .. ••.--,/
Core condit ion determined from containment monitor .' i •'•• ' • reading: 25.3% In-Vessel Severe Core Damage • .''• .- • • ' , ' . ' •
Release Release Release •- '/' '' <•'.,." Nuclide (Ci) Nuclide (Ci) Nuclide, (Ci): :-v • -; -Kr-85 3.1E+01 Kr-85m 1.3E+03 Kr-87 2.6E+03 •'•: • • •-
Kr-88 3.8E+03 Sr-89 1.2E+00 Sr-90 4.7E-02. ..-,' -•'••. Sr-91 1.4E+00 Y-91 1.0E-01 MO-99 5.5E-01 Tc-99m 5.5E-01 RU-103 3.9E-01 Ru-106 8.3E-02 ,... '; , „.; Sb-127 3.9E-01 Sb-129 2.1E+00 Te-129m 3.5E-01 '• / ' • > • ''
Te-.131m 7.8E-01 Te-132 7.8E+00 1-131 .. 1.3E+01 ' • ' • ' . '.'•
1-132 1.8E+01 1-133 2.6E+01 1̂ 1,34 2.9E+01 1-135 2.3E+01 Xe-131m 5.4E+01 Xe-133 9.4E+03 Xe-I33m 3.3E+02 Xe-135 1.8E+03 Xe-138 9.4E+03 • .'", Cs-134 8.1E-01 CS-136 3.3E-01 Cs-137 5.2E-01 •: . ' ' ,
Ba-140 2.8E+00 La-140 1.4E-01 Ce-144 3.6E-01 ,-''<' Np-239 7.2E+00 Rb-88 3.8E+03 Rh-106 8.3E-02 Te-129 3.5E-01 Xe-135m 3.6E+00 Ba-I37m 5.2E-01 Pr-144 3.6E-01
Compare the source term with the BWR Mark I & II Wet Well Containment Monitor Readings in section B of the RTM. The values used in ST-DOSE have been updated from those in RTM-93. A later version of the RTM will contain the new values.
NUREG/CR-5247, Vol. 2, Rev. 2

STDOSEExercise Discussions 127
24 Spent Fuel Accident - Closed Plant (problem on page 48)
Set up the problem for Trojan as stated using the Spent Fuel / Spent Fuel Pool source-term option.
Check the help message associated with the fuel condition choices:
The accident may involve a z i r ca l l oy f i r e , which e f fec t i ve l y resu l ts i n a release of the v o l a t i l e f i s s i on products (e .g . Cs) at the rate assumed f o r an in-vessel severe core damage accident. A z i r ca l l o y f i r e i s only remotely possible when there i s a recent ly discharged batch (w i th in 180-250 days) i n a compacted pool and may spread to f u e l bundles discharged i n the l a s t two years. A release of the gap from the pool i n the f u e l should be assumed only i f the pool i s drained.
Since the last batch of fuel was stored 1 year ago, a zircalloy fire is not possible. Set the date of the last batch to one year ago. Leave the reactor power at the default value. This assumes that on the average during the last fuel cycle that the plant operated at full power.
, ST-DOSE Workbook Problem 24 TROJAN UNIT 1
Fuel Condit ion: [ ] Z i rca l loy Fire - New Batch Only [ • ] Fuel Cladding Fai lure - Gap Release
I Reactor Power: 3411 Mw(t)
j Last batch put in pool: 09/19/93 00:00
; Number of Batches: 15 Sprays: [ ] On Release Path: [ ] Filtered
'] [•] Off [•] Unfiltered Leak Rate: [•] 100%/hr
[ ] 50%/hr [ ] 10%/hr [ ] 4%/hr = 100%/day t ] 1%/hr [ ] 0.5%/hr [ ] 0.1%/hr
Other model parameters remain as defaults.
NUREG/CR-5247, Vol. 2, Rev. 2

128 RASCAL 2.1 Workbook
Case Title: ST-DOSE Workbook Problem 24 « Site Name »• TROJAN UNIT 1 Eff. Release Height: 0 m Default (•) Ci < Source Term »• Units: (. ) Bq
Data Source:
Reactor Accident Based Oh. Spent Fuel / Spent Fuel Pool Fuel Condition: Fuel cladding Failure - Gap Release Reactor Power: 3411 Mw(t)
Batches: 15 Last Batch in Pool: 09/19/93 00: Sprays: Off Release Path: Unfiltered
Leak Rater100%/hr 00
•* Events • Shut Down Rel->Cont Rel->Envi Rel End Expos End
(•) Projected ( ) Actual
< NA > 09/19/94 00:00 09/19/94 00:00 09/19/94 01:00 09/19/94 04:00
date . time 1 09/19/94 00:00 2 . •'< undefined > 3 < undefined > 4 < undefined >
Meteorological Data *• winds stb mix
4 mph 90 D 500 precip NONE
Calculation Options: Model: ( ) Plume '
(•) Puff Building (•) On
wake: ( ) Off Calculation (©) 10-mile (16 km)
radius: ( ) 25-mile (40 km)
The resulting early-phase doses from this scenario are:
ST-DOSE Workbook Problem 24 • „ . ' TROJAN UNIT 1 Projected Data Distance Maximum EARLY-PHASE Doses (rem) Puff Model from Site, mi(km) .5{ .8) 1.0(1.6) 2.0(3.2) 5.0(8.0) 10.(16.)
Total EDE (EPA) *2.7E+02 *1.7E+02 *1.1E+02 *4.4E+01. *1.9E+01 Thyroid (EPA) *2.1E+02 *1.3E+02 *8.3E+01 *3.3E+01 *1.4E+01 Acute Lung 5.5E+01 3.3E+01 2.2E+01 8.7E+00 3.8E+00 Acute Bone Total 4.2E+01 2.6E+01 1.7E+01 6.8E+00 2.9E+00
Acute Bone Inhalatn 3.9E+01 2.4E+01 1.6E+01 6.3E+00 2.7E+00 Cloud Shine 1.2E+00 8.8E-01 6.3E-01 3.3E-01 1.5E-01 Inital Ground Shine 1.7E+00 9.8E-01 6.1E-01 1.9E-01 3.7E-02 4-Day Ground Shine 4.5E+01 2.7E+01 1.8E+01 7.2E+00 3.0E+00 CEDE Inhalation 2.3E+02 1.4E+02 9.2E+01 3.6E+01 1.6E+01
Both TEDE and thyroid doses are exceeded at 10 miles. The model should be run again with a calculation radius of 25 miles before making a relocation decision.
The computed source term report indicates that 2.7 million curies would be released.
NUREG/CR-5247, Vol. 2, Rev. 2

STDOSEExercise Discussions 129
ST-DOSE Workbook Problem 24 TROJAN UNIT 1
Computed Source Term
A total of 2.7E+06 Ci were released.
09/25/94 11:49 Projected Data
Release Release Release Nuclide (Ci) Nuclide (Ci) Nuclide (CI) Kr-85 1.3E+05 1-131 2.6E-08 Xe-131m 2.9E-05 Cs-134 6.2E+05 Cs-136 1.9E-04 Cs-137 9.6E+05 Rb-87 3.1E-08 Cs-135 1.4E-02 Ba-137m 9.6E+05
The thyroid dose is from the 1 3 4Cs and 1 3 7Cs.
NUREG/CR-5247, Vol. 2, Rev. 2
S^S^'K- •• ••

130 RASCAL 2.1 Workbook
25 Spent Fuel Accident During Refueling (problem on page 48)
Set up the problem for Pilgrim as stated using the Spent Fuel / Spent Fuel Pool source-term option. Since the latest batch was placed in the pool only 7 days ago a zircalloy fire is possible. Assume that the fuel was used with the reactor at full power. Set the date on which the last batch was put into the pool to seven days ago.
ST-DOSE Workbook Problem 25 PILGRIM UNIT 1
Fuel Condition: [•] Zircalloy Fire - New Batch Only [ ] Fuel Cladding Failure - Gap Release
Reactor Power: 1998 Mw(t)
Last batch put in pool: 09/12/94 00:00
Number of Batches: 13 Sprays: [ ] On
[•] Off Release Path: [ ] Filtered
[•] Unfiltered
Leak Rate: [•] 100%/hr [ ] 50%/hr [ ] 10%/hr [ ] 4%/hr = 100%/day [ ] 1%/hr [ ] 0.5%/hr [ ] 0.1%/hr
The remainder of the case set up uses the default values.
(•) Projected ( ) Actual
Case Title: ST-DOSE Workbook Problem 25 < Site Name • PILGRIM UNIT 1 Eff. Release Height: 0 m Default (•) Ci Data -« Source Term »• Units: ( ) Bq Source: Reactor Accident Based On Spent Fuel / Spent Fuel Pool
Fuel Condition: Zircalloy Fire - New Batch Only Reactor Power: 1998 Mw(t)
Batches: 13 Last Batch in Pool: 09/12/94 00:00 Sprays*. Off Release Path: Unfiltered
Leak Rate: 100%/hr •* Meteorological Data •
date time winds stb mix 1 09/19/94 00:00 4 mph 90 D 500 m 2 < undefined > 3 < undefined > 4 < undefined >
< Events »• Shut Down Rel->Cont Rel->Envi Rel End Expos End
< NA > 09/19/94 00:00 09/19/94 00:00 09/19/94 01:00 09/19/94 04:00
precip NONE
Calculation Options: Model: ( ) Plume
(•) Puff Building (•) On
wake: ( ) Off Calculation
radius: (•) 10-mile (16 km) ( ) 25-mile (40 km)
NUREG/CR-5247, Vol. 2, Rev. 2
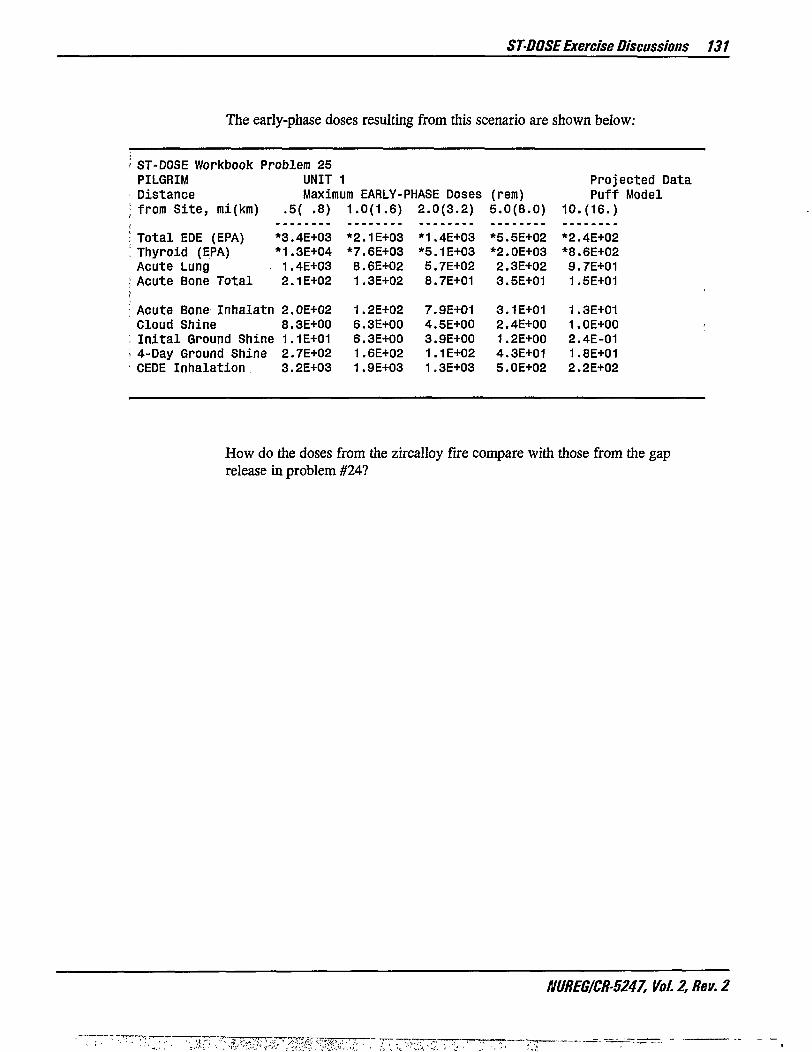
STDOSEExercise Discussions 131
The early-phase doses resulting from this scenario are shown below:
I ST-DOSE Workbook Problem 25 PILGRIM UNIT 1 Projected Data Distance Maximum EARLY-PHASE Doses (rem) Puff Model
; from Site, mi(km) • 5{ .8) 1.0(1.6) 2.0(3.2) 5.0(8.0) 10.(16.)
! Total EDE (EPA) *3.4E+03 *2.1E+03 *1.4E+03 *5.5E+02 *2.4E+02 ; Thyroid (EPA) *1.3E+04 *7.6E+03 *5.1E+03 *2.0E+03 *8.6E+02 Acute Lung 1.4E+03 8.6E+02 5.7E+02 2.3E+02 9.7E+01 ; Acute Bone Total 2.1E+02 1.3E+02 8.7E+01 3.5E+01 1.5E+01
Acute Bone Inhalatn 2.0E+02 1.2E+02 7.9E+01 3.1E+01 1.3E+01 Cloud Shine 8.3E+00 6.3E+00 4.5E+00 2.4E+00 1.0E+00
: Inital Ground Shine 1.1E+01 6.3E+00 3.9E+00 1.2E+00 2.4E-01 i 4-Day Ground Shine 2.7E+02 1.6E+02 1.1E+02 4.3E+01 1.8E+01 CEDE Inhalation 3.2E+03 1.9E+03 1.3E+03 5.0E+02 2.2E+02
How do the doses from the zircalloy fire compare with those from the gap release in problem #24?
NUREG/CR-5247, Vol. 2, Rev. 2

132 RASCAL 2.1 Workbook
26 Laboratory Explosion (problem on page 49)
Initially, all that is know for the source term is the 1000 curies of I 3 1I. Define the release using the Isotopic Release Rate option. Since the release is to take place over five minutes, set the release units to Ci/min and the release to 200 curies of 1 3 1I each minute.
ST-DOSE Workbook Problem 26a NO PLANT SELECTED UNIT 1 ,
Release Units Ci/min
H-3 0.0000000 Y-91 0.0000000 1-133 0.0000000 Ce-144 0.0000000 P-32 0.0000000 Mo-99 0.0000000 1-134 0.0000000 Pm-147 0.0000000 S-35 0.0000000 Tc-99m 0.0000000 1-135 0.0000000 EU-155 0.0000000 Mn-54 0.0000000 Ru-103 0.0000000 Xe-131ra 0;0000000 Po-210 0.0000000 Co-58 0.0000000 RU-106 0.0000000 Xe-133 0.0000000 Np-239 0.0000000 Co-60 0.0000000 Sb-127 0.0000000 Xe-133m 0.0000000 Pu-238 0.0000000 Kr-85 0.0000000 Sb-129 0.0000000 Xe-135 0.0000000 PU-239 0.0000000 Kr-85m 0.0000000 Te-129ra 0.0000000 Xe-138 0.0000000 Am-241 0.0000000 Kr-87 0.0000000 Te-I3lra 0.0000000 CS-134 0.0000000 Cm-242 0.0000000 Kr-88 0.0000000 Te-132 0.0000000 Cs-136 0.0000000 Cm-243 0.0000000 Sr-89 0.0000000 1-125 0.0000000 Cs-137 0.0000000 Cm-244 0.0000000 Sr-90 0.0000000 1-131 2.00E+002 Ba-140 0.0000000 Sr-91 0.0000000 1-132 0.0000000 La-140 0.0000000
Set the event times to reflect the 5 minute release duration. All other values were left as defaults.
Case T i t l e : ST-DOSE Workbook Problem 26a « S i te Name - NO PLANT SELECTED UNIT 1 Ef f . Release Height: 0 m Default (•} Ci « Source Term • Uni ts: ( ) Bq User Specif ied Isotopic Release Rates Uni ts : Ci/min
1-131 2.00E+002
Data (») Projected Source: ( ) Actual
•* Events • Decy S t r t Rel->Cont Rel->Envi Rel End Expos End
< NA > < NA >
07/04/94 12:00 07/04/94 12:05 07/04/94 16:00
Calculation Options: Model: ( ) Plume
(•) Puff
< Meteorological Data *• date time winds stb mix
1 07/04/94 12:00 4 mph 90 D 500 m 2 < undefined > 3 < undefined > 4 < undefined >
precip NONE
Building (•) On wake: ( ) Off
Calculation radius:
(©) 10-mile (16 km) ( ) 25-mile (40 km)
NUREG/CR-5247, Vol. 2, Rev. 2

STDOSEExercise Discussions 133
The early-phase doses are shown below. EPA PAGs have not been exceeded
ST-DOSE Workbook Problem 26a NO PLANT SELECTED UNIT 1 Projected Data Distance Maximum EARLY-PHASE Doses (rem) Puff Model
• from Site, mi(km) .5( .8) 1.0(1.6) 2.0(3.2) 5.0(8.0) 10.(16.)
Total EDE (EPA) 6.8E-02 4.2E-02 2.8E-02 1.1E-02 4.7E-03 ; Thyroid (EPA) 2.1E+00 1.3E+00 8.4E-01 3.3E-01 1.4E-01 Acute Lung 4.6E-03 2.8E-03 1.9E-03 O.OE+00 O.OE+00 Acute Bone Total 0.0E+00 O.OE+00 O.OE+00 O.OE+00 O.OE+00
Acute Bone Inhalatn 0.0E+00 0.0E+00 O.OE+00 O.OE+00 O.OE+00 Cloud Shine O.OE+00 O.OE+00 0.0E+00 O.OE+00 O.OE+00 Inital Ground Shine O.OE+00 O.OE+00 O.OE+00 O.OE+00 O.OE+00 4-Day Ground Shine 5.0E-03 3.0E-03 2.0E-03 O.OE+00 O.OE+00 CEDE Inhalation 6.3E-02 3.8E-02 2.6E-02 1.0E-02 4.3E-03
When the information on the other cylinder becomes available the problem definition needs to be revised. Use the DECAY calculator to estimate the isotopes available from the 100 Ci of M 2Cm. Set up DECAY for 180 days (6 months) of decay and enter-the amount of ^Cm.
Decay time: 180 days
-Nuclide Cone. -Nuclide Cone. -Nuclide Cone. -Nuclide Cone. Fe-55 0.0000000 Sn-123 0.0000000 Pm-147 0.0000000 Np-239 0.0000000 Fe-59 0.0000000 Sn-126 0.0000000 Sm-151 0.0000000 PU-236 0.0000000 Co-60 0.0000000 Sb-124 0.0000000 Eu-152 0.0000000 Pu-238 0.0000000 Ni-63 0.0000000 Sb-126 0.0000000 Eu-154 0.0000000 PU-239 0.0000000 Cu-64 0.0000000 Sb-127 0.0000000 Eu-155 0.0000000 PU-240 0.0000000 Zn-65 0.0000000 Sb-129 0.0000000 Gd-153 0.0000000 PU-241 0.0000000 Ge-68 0.0000000 Te-127 0.0000000 Tb-160 0.0000000 PU-242 0.0000000 Se-75 0.0000000 Te-127m 0.0000000 Ho-166m 0.0000000 Am-241 0.0000000 Kr-85 0.0000000 Te-129 0.0000000 Tm-170 0.0000000 Am-242m 0.0000000 .
; Kr-85m 0.0000000 Te-129ra 0.0000000 Yb-169 0.0000000 Am-243 0.0000000 Kr-87 0.0000000 Te-I3lm 0.0000000 Hf-181 0.0000000 Cm-242 1.00E+002 Kr-88 0.0000000 Te-132_ .o.poooooo Ta-182 0.0000000 Cm-243 0.0000000 Rb-86 0.0000000 1-125 0.0000000 W-187 0.0000000 Cm-244 0.0000000
NUREG/CR-5247, Vol. 2, Rev. 2
<Ss''>''&•-• V

134 RASCAL 2.1 Workbook
The resulting activity after the 180 days is shown below:
DECAY Input and Output
Source A c t i v i t y A c t i v i t y Remaining Decay time =180 days
Cm-242 1.00E+002 4.65E+001 PU-238 2.71E-001 U-234 2.13E-007
Notes: 1 . A c t i v i t y uni ts are assumed to be the same fo r source and remaining 2. To use these values i n ST-DOSE, go to the ' Isotopic Concentrations'
source term there, and press the ' Import ' push button. These values w i l l be ADDED to any concentrations already present there.
Exit the DECAY Calculator and restart ST-DOSE. Select the Isotopic Concentrations source term option. Import the results of the DECAY calculator by choosing the Import button. Manually enter the amount of the 1 3 1 I . To get a release over 5 minutes, leave the concentration units as Ci/cc and set the release rate to 0.2 cc/min.
ST-DOSE Workbook Problem 26b NO PLANT SELECTED UNIT 1
Release Rate: 0.2000000 cc /min Concentration Units: Ci/cc
H-3 0.0000000 Y-91 0.0000000 1-133 0.0000000 Ce-144 o.-ooooooo P-32 0.0000000 Mo-99 0.0000000 1-134 0.0000000 Pm-147 0.0000000 S-35 0.0000000 Tc-99m 0.0000000 1-135 0.0000000 EU-155 0.0000000 Mn-54 0.0000000 RU-103 0.0000000 Xe-131m 0.0000000 PO-210 0.0000000 Co-58 0.0000000 RU-106 0.0000000 Xe-133 0.0000000 Np-239 0.0000000 Co-60 0.0000000 Sb-127 0.0000000 Xe-133m 0.0000000 PU-238 0.2710000 Kr-85 0.0000000 Sb-129 0.0000000 Xe-135 0.0000000 PU-239 0.0000000 Kr-85m 0.0000000 Te-129m 0.0000000 Xe-138 0.0000000 Am-241 0.0000000 Kr-87 0.0000000 Te-131m 0.0000000 Cs-134 0.0000000 Cm-242 4.65E+001 Kr-88 0.0000000 Te-132 0.0000000 Cs-136 0.0000000 Cm-243 0.0000000 Sr-89 0.0000000 1-125 0.0000000 Cs-137 0.0000000 Cm-244 0.0000000 Sr-90 0.0000000 1-131 1.00E+003 Ba-140 0.0000000 Sr-91 0.0000000 1-132 0.0000000 La-140 0.0000000
Note that ST-DOSE does not support the addition of the 2 3 4 !! daughter of 2 4 2Cm to the Isotopic Concentration source term list. In this case the 2 3 4 U activity is very low and insignificant.
NUREG/CR-5247, Vol. 2, Rev. 2
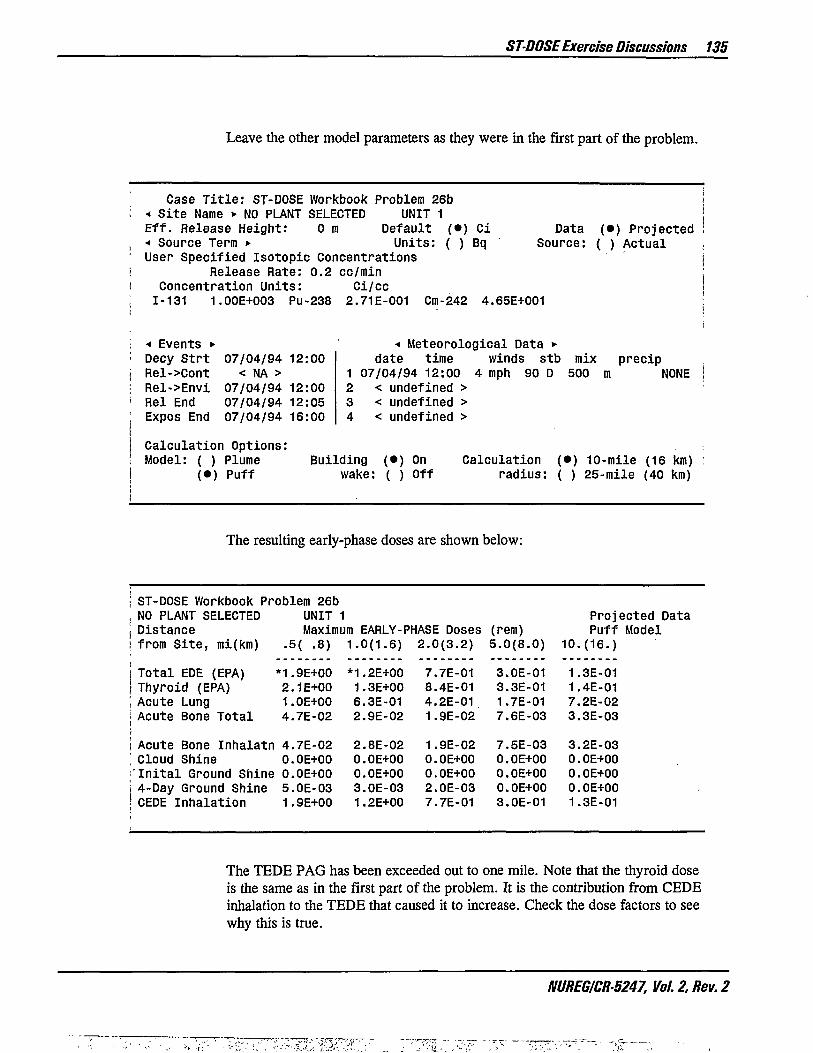
STDOSE Exercise Discussions 135
Leave the other model parameters as they were in the first part of the problem.
Case Title: ST-DOSE Workbook Problem 26b < Site Name • NO PLANT SELECTED UNIT 1 Eff. Release Height: 0 m Default (•) Ci < Source Term *• Units: ( ) Bq User Specified Isotopic Concentrations
Release Rate: 0.2 cc/min Concentration Units: Ci/cc 1-131 1.00E+003 PU-238 2.71E-001 Cm-242 4.65E+001
Data Source:
(•) Projected ( ) Actual
< Events • Decy Strt Rel->Cont Rel->Envi Rel End
07/04/94 12:00 < NA >
07/04/94 12:00 07/04/94 12:05
Expos End 07/04/94 16:00 Calculation Options: Model: ( ) Plume
(•) Puff
•* Meteorological Data • date time winds stb mix
1 07/04/94 12:00 4 mph 90 D 500 m 2 < undefined > 3 < undefined > 4 < undefined >
precip NONE
Building (•) On wake: ( ) Off
Calculation (•) 10-mile (16 km) radius: ( ) 25-mile (40 km)
The resulting early-phase doses are shown below:
I ST-DOSE Workbook Problem 26b , NO PLANT SELECTED UNIT 1 Projected Data j Distance Maximum EARLY-PHASE Doses (rem) Puff Model i from Site, mi(km) .5( .8) 1.0(1.6) 2.0(3.2) 5.0(8.0) 10.(16.)
I Total EDE (EPA) M.9E+00 *1.2E+00 7.7E-01 3.0E-01 1.3E-01 I Thyroid (EPA) 2.1E+00 1.3E+00 8.4E-01 3.3E-01 1.4E-01 I Acute Lung 1.0E+00 6.3E-01 4.2E-01 1.7E-01 7.2E-02 : Acute Bone Total 4.7E-02 2.9E-02 1.9E-02 7.6E-03 3.3E-03
i Acute Bone Inhalatn 4.7E-02 2.8E-02 1.9E-02 7.5E-03 3.2E-03 ; Cloud Shine O.OE+00 O.OE+00 O.OE+00 O.OE+00 O.OE+00 "Inital Ground Shine O.OE+00 O.OE+00 O.OE+00 O.OE+00 O.OE+00 i 4-Day Ground Shine 5.0E-03 3.0E-03 2.0E-03 O.OE+00 O.OE+00 j CEDE Inhalation 1.9E+00 1.2E+00 7.7E-01 3.0E-01 1.3E-01
The TEDE PAG has been exceeded out to one mile. Note that the thyroid dose is the same as in the first part of the problem. It is the contribution from CEDE inhalation to the TEDE that caused it to increase. Check the dose factors to see why this is true.
NUREG/CR-5247, Vol. 2, Rev. 2

136 RASCAL 2.1 Workbook
A c t u a l Meteoro log ica l D a t a (problem on page 49)
Follow the procedures for gathering Accu-Weather data for use with the ST-DOSE model. Fill out a ST-DOSE Weather Data worksheet and then use that data to make some dose estimates.
S a v e Resul t s tO R C S N e t w o r k (problem on page 49)
This problem can be worked only from a computer configured with the Response Computer System (RCS) software and connected to a RCS network.
At the completion of an ST-DOSE calculation, return to the Case Menu and choose Save This Case. From the following screen, choose the •» Save Case • button. This will write all the input and output files to the local workstation hard disk. Now select the TEDE and thyroid graphics products by checking the appropriate boxes. Choose the •< Save Results to Workstation • button. This will generate a PCX format graphics file and store it on the workstation disk.
Exit the ST-DOSE model and then RASCAL to return to the RCS menu. Select RASCAL | Files from the RCS menu bar. Highlight the name of the case just saved. The names of the saved graphics products will be listed. Highlight one of the graphics products and the choose the View button. The graphics image will be displayed in a window.
Close the display window. Choose Copy and then make Network the destination. All the saved text and graphics for the selected ST-DOSE case will be copied to the network and will be visible to all other users on the RCS and can be displayed using the video display system.
NUREG/CR-5247, Vol. 2, Rev. 2

137
Things To Think About
1. The Prairie Island plant site sits along the Mississippi River in SE Minnesota. The river flows from NW to SE and is enclosed by bluffs over 90 meters high. The nearest National Weather Service (NWS) station is at the Minneapolis - St. Paul airport that is approximately 45 km NW and not in the river valley. Which meteorological data (plant versus NWS) is best used with RASCAL? What happens as the material moves away from the plant and out of the river valley? If site data is not available, will you modify your NWS data to better represent the conditions you expect at the site?
2. A plant meteorology tower reports winds of 5 mph from 70 degrees. The NWS station 25 miles west reports 9 mph from 45 degrees. Which meteorological data do you use?
3. Assume a continuous release from containment. The release began with material from a melted core and continued as the core melted through the vessel. Would the model be able to handle this case?
4. How would you set up the four meteorology records for the ST-DOSE model to best simulate sea breeze?
5. You have been working a problem with a continuous release that has been ongoing for 8 hours. The meteorological conditions have changed over the period such that you now have more than four distinct sets of observed weather data. How do you combine some of the observations into one in order to stay within the ST-DOSE limit of having only 4 met data records?
NUREG/CR-5247, Vol. 2, Rev. 2
138 RASCAL 2.1 Workbook References 138
References
Eckerman, K.F. and J.C. Ryman. 1993. External Exposure to Radionuclides In Air, Water, and Soil. Federal Guidance Report No. 12, EPA 402-R-93-081, U.S. Environmental Protection Agency, Washington, D.C.
International Advisory Committee. 1991. The International Chernobyl Project: Technical Report. IAEA, Vienna.
McKenna, T.J. and J. Giitter. 1988. Source Term Estimation During Incident Response to Severe Nuclear Power Plant Accidents. NUREG-1228, U.S. Nuclear Regulatory Commission, Washington, D.C.
Sjoreen, A.L., G.F. Athey, J.V. Ramsdell, and T.J. McKenna. 1994. RASCAL Version 2.1 User's Guide. NUREG/CR-5247, Vol. 1, Rev. 2 (ORNL-6820), U.S. Nuclear Regulatory Commission, Washington, D.C.
U.S. Environmental Protection Agency. 1992. Manual of Protective Action Guides and Protective Actions for Nuclear Incidents. EPA-400-R-92-001, U.S. Environmental Protective Agency, Washington, D.C.
U.S. Nuclear Regulatory Commission (NRC). 1987. Reactor Risk Reference Document. NUREG-1150, U.S. Nuclear Regulatory Commission, Washington, D.C.
U.S. Nuclear Regulatory Commission (NRC). 1993. RTM-93 Response Technical Manual. NUREG/BR-0150, Vol. 1, Rev. 3, U.S. Nuclear Regulatory Commission, Washington, D.C.
NUREG/CR-5247, Vol. 2, Rev. 2

NRC FORM 335 U.S. NUCLEAR REGULATORY COMMISSION (2-89)
E M B 2 , BIBLIOGRAPHIC DATA SHEET (See instructions on the reverse)
1. REPORT NUMBER (Assigned bv NRC. Add Vol., Supp., Rev., and Addendum Numbers. If any.)
NUREG/CR-5247 2. TITLE AND SUBTITLE
RASCAL Version 2 . 1 Workbook
Vol . 2 , Rev. 2 2. TITLE AND SUBTITLE
RASCAL Version 2 . 1 Workbook
3. DATE REPORT PUBLISHED
2. TITLE AND SUBTITLE
RASCAL Version 2 . 1 Workbook MONTH 1 YEAR
December 1994
2. TITLE AND SUBTITLE
RASCAL Version 2 . 1 Workbook
4. FIN OR GRANT NUMBER E8211
5. AUTHOR(S)
G. F. Athey, A. L. Sjoreen, 1 T. J. McKenna 2
6. TYPE OF REPORT
Technical
5. AUTHOR(S)
G. F. Athey, A. L. Sjoreen, 1 T. J. McKenna 2
7. PERIOD COVERED (Inclusive Dates)
8, PERFORMING ORGANIZATION — NAME AND ADDRESS (If NRC. provide Division. Office or Region, U.S. Nuclear Regulatory Commission, and mailing address; if contractor, provide name and mailing address.)
Athey Consulting l 0 a k Ridge National Laboratory, Oak Ridge, TN 37831-6285 P.O. Box 178 2u.s . Nuclear Regulatory Commission, Washington, D.C. 20555-0001 Charlestown, WV 25414
9. SPONSORING ORGANIZATION — NAME AND ADDRESS (If NRC. type "Same as above": if contractor, provide NRC Division, Office or Region, U.S. Nuclear Regulatory Commission, and mailing address./
Incident Response Division Office for Analysis and Evaluation of Operational Data UJS. Nuclear Regulatory Commission Washington, DC 20555-0001
10. SUPPLEMENTARY NOTES
11. ABSTRACT (200 words or lessl
The Rad io log i ca l Assessment System fo r Consequence A n a l y s i s , Vers ion 2 . 1 (RASCAL 2.1) was developed fo r use by t h e NRC personne l who respond t o r a d i o l o g i c a l emergencies . This workbook complements t h e RASCAL 2 . 1 U s e r ' s Guide (NUREG/CR-5247, Vol. 1, Rev. 2 ) . The workbook c o n t a i n s e x e r c i s e s des igned t o f a m i l i a r i z e t h e u s e r wi th t h e computer-based t o o l s of RASCAL through hands-on problem s o l v i n g . The workbook con ta in s four major s e c t i o n s . The f i r s t RASCAL f a m i l i a r i z a t i o n e x e r c i s e t o acqua in t t h e use r wi th t h e o p e r a t i o n of t h e forms, menus, o n l i n e h e l p , and documenta t ion . The l a t t e r t h r e e s e c t i o n s c o n t a i n e x e r c i s e s i n us ing t h e t h r e e t o o l s of RASCAL Version 2 . 1 : DECAY, FM-DOSE, and ST-DOSE. A d i s c u s s i o n s e c t i o n d e s c r i b i n g how t h e t o o l s could be used t o s o l v e t h e problems fo l lows each s e t of e x e r c i s e s .
12. KEY WORDS/DESCRIPTORS (List words or phrases that will assist researchers in locating the report.!
Reac tor a c c i d e n t model Source term e s t i m a t i o n Atmospheric t r a n s p o r t
13. AVAILABILITY STATEMENT
Unlimited 12. KEY WORDS/DESCRIPTORS (List words or phrases that will assist researchers in locating the report.!
Reac tor a c c i d e n t model Source term e s t i m a t i o n Atmospheric t r a n s p o r t
14. SECURITY CLASSIFICATION
12. KEY WORDS/DESCRIPTORS (List words or phrases that will assist researchers in locating the report.!
Reac tor a c c i d e n t model Source term e s t i m a t i o n Atmospheric t r a n s p o r t
(This Paget
Unclass i f i ed
12. KEY WORDS/DESCRIPTORS (List words or phrases that will assist researchers in locating the report.!
Reac tor a c c i d e n t model Source term e s t i m a t i o n Atmospheric t r a n s p o r t
(This Reportl
Unclass i f ied
12. KEY WORDS/DESCRIPTORS (List words or phrases that will assist researchers in locating the report.!
Reac tor a c c i d e n t model Source term e s t i m a t i o n Atmospheric t r a n s p o r t
15. NUMBER OF PAGES
16. PRICE
NRC FORM 335 (2-89)