raymond james roadshow
TRANSCRIPT

InvestorPresentationRaymondJames:Winnipeg,Toronto&Montreal
October3-6,2016

CautionaryNoteNon-GAAP MeasuresThis presentation refers to various Non-GAAP measures, such as cash costs per payable ounce of silver, all-in sustaining cost per silver ounce sold and adjusted (loss) earnings.Readers should refer to the “Alternative Performance (Non-GAAP) Measures” section in Pan American Silver Corp.’s (the “Company”) Management’s Discussion and Analysis forthe period ended June 30, 2016 available at www.sedar.com.
Reporting Currency and Financial InformationUnlesswehavespecifiedotherwise,all references todollaramountsor$aretoUnitedStatesdollars.
Cautionary Note Regarding Forward Looking Statements and InformationCertain of the statements and information in this presentation constitute “forward-looking statements” within the meaning of the United States Private Securities LitigationReform Act of 1995 and “forward-looking information” within themeaning of applicable Canadian provincial securities laws. All statements, other than statements of historicalfact, are forward-looking statements or information. Forward-looking statements or information in this presentation relate to, among other things: our estimated production ofsilver, gold and other metals in 2016, 2017 and2018; our estimated cash costs per payable ounce of silver and AISCSOS in 2016, 2017 and 2018; our estimated profit margins for2016, 2017 and 2018; our estimated capital investments, and sustaining capital for 2016; the ability of the Company to successfully complete any capital investment programsand projects, and the impacts of any such programs and projects on the Company; the ability of the Company to realize value from transactions, including with respect toMaverix Metals Inc. and Kootenay Silver Inc.; and any anticipated level of financial and operational success in 2016.These statements and information reflect the Company’s current views with respect to future events and are necessarily based upon a number of assumptions that, whileconsidered reasonable by the Company, are inherently subject to significant operational, business, economic and regulatory uncertainties and contingencies. These assumptionsinclude: tonnage of ore to bemined and processed; ore grades and recoveries; prices for silver, gold and basemetals remaining as estimated; currency exchange rates remainingas estimated; capital, decommissioning and reclamat ion estimates; our mineral reserve and recourse estimates and the assumptions upon which they are based; pric es forenergy inputs, labour, materials, supplies and services (including transportation); no labour-related disruptions at any of our operations; no unplanned delays or interruptions inscheduled production; all necessary permits, licenses and regulatory approvals for our operations are received in a timely manner; and our ability to comply with environmental,health and safety laws. The foregoing list of assumptions is not exhaustive.The Company cautions the reader that forward-looking statements and information involve known and unknown risks, uncertainties and other factors that may cause actualresults and developments to differ materially from those expressed or implied by such forward-looking statements or information contained in this presentation and theCompany has made assumptions and estimates based on or related to many of these factors. Such factors include, without limitation: fluctuations in silver, gold and basemetalprices; fluctuations in prices for energy inputs, labour, materials, supplies and services (including transportation); fluctuations in currency markets (such as the Canadian Dollar,Peruvian Sol, Mexican Peso, Argentine Peso and Bolivian Boliviano versus the U.S. Dollar); operational risks and hazards inherent with the business of mining (includingenvironmental accidents and hazards, industrial accidents, equipment breakdown, unusual or unexpected geological or structural formations, cave-ins, flooding and severeweather); risks relating to the credit worthiness or financial condition of suppliers, refiners and other parties with whom the Company does business; inadequate insurance, orinability to obtain insurance, to cover these risks and hazards; employee relations; relationships with, and claims by, local communities and indigenous populations; our ability toobtain all necessary permits, licenses and regulatory approvals in a timely manner; changes in laws, regulat ions and government practices in the jurisdictions wherewe operate,including environmental, export and import laws and regulations; diminishing quantities or grades of mineral reserves as properties are mined; increased competition in themining industry for equipment and qualified personnel; and those factors identified under the caption “Risks Related to Pan American’s Business” in the Company’s most recentform 40-F and Annual Information Form filed with the United States Securities and Exchange Commission and Canadian provincial securities regulatory authorities. Although theCompany has attempted to identify important factors that could cause actual results to differ mater ially, theremay be other factors that cause results not to be as anticipated,estimated, described or intended. Investors are cautioned against undue reliance on forward-looking statements or information. Forward-looking statements and informationare designed to help readers understand management’s current views of our near and longer term prospects and may not be appropriate for other purposes. The Company doesnot intend, nor does it assume any obligation to update or revise forward-looking statements or information, whether as a result of new information, changes in assumptions,future events or otherwise, except to the extent required by applicable law.
Technical InformationTechnical information contained in this presentation with respect to Pan American has been reviewed or approved by Martin Wafforn, P.Eng., SVP Technical Servic es and ProcessOptimization, who isthe Company’s qualified person for the purposes of National Instrument 43-101. For additional information about the Company’s material mineralproperties, please refer to the Company’s Annual Information Form dated March 24, 2016, filed at www.sedar.com.
2

CautionaryNoteAboutMineralReservesandResourcesCautionary Note to US Investors Concerning Estimates of Mineral Reserves and Resources
This presentation has been prepared in accordance with the requirements of Canadian securities laws, which differ from the requirements of U.S. securities laws.Unless otherwise indicated, all mineral reserve and resource estimates included in this presentation have been prepared in accordance with Canadian NationalInstrument 43-101 – Standards of Disclosure for Mineral Projects (‘‘NI 43-101’’) and the Canadian Institute of Mining, Metallurgy and Petroleum classificationsystem. NI 43-101 is a rule developed by the Canadian Securities Administrators that establishes standards for all public disclosure an issuer makes of scientific andtechnical information concerning mineral projects.
Canadian standards, including NI 43-101, differ significantly from the requirements of the United States Securities and Exchange Commission (the “SEC”), andinformation concerning mineralization, deposits, mineral reserve and resource information contained or ref erred to herein may not be comparable to similarinformation disclosed by U.S. companies. In particular, and without limiting the generality of the foregoing, this presentation uses the terms ‘‘measured resources’’,‘‘indicated resources’’ and ‘‘inferred resources’’. U.S. investors are advised that, while such terms are recognized and required by Canadian securities laws, the SECdoes not recognize them. The requirements of NI 43-101 for identification of ‘‘reserves’’ are not the same as those of the SEC, and reserves reported by PanAmerican in compliance with NI 43-101 may not qualify as ‘‘reserves’’ under SEC standards. Under U.S. standards, mineralization may not be classified as a‘‘reserve’’ unless the determination has been made that the mineralization could be economically and legally produced or extracted at the time the reservedetermination is made. U.S. investors are cautioned not to assume that any part of a “measured resource” or “indicated resource” will ever be converted into a“reserve”. U.S. investors should also understand that “inferred resources” have a great amount of uncertainty as to their existence and great uncertainty as to theireconomic and legal f easibility. It cannot be assumed that all or any part of “inferred resources” exist, are economically or legal ly mineable or will ever be upgradedto a higher category. Under Canadian securities laws, estimated “inferred resources” may not form the basis of feasibility or pre-feasibility studies except in rarecases. Disclosure of “contained ounces” in a mineral resource is permitted disclosure under Canadian securities laws. However, the SEC normally only permitsissuers to report mineralization that does not constitute “reserves” by SEC standards as in place tonnage and grade, without reference to unit measures.Accordingly, information concerning mineral deposits set forth herein may not be comparable with information made public by companies that report inaccordancewith U.S. standards.
3

PAS– aninvestmentinsilver
• 2nd largestprimarysilverproducerintheworld• Portfolioofhigh-qualityassetsintheAmericas• Largereserves:proven+probableof280Moz silver• Solidproductionprofile• Significantexplorationpotential• Experiencedmanagementteam• Strongbalancesheet
Ourstrategyisfocusedonextractingvaluefromourportfolioofassets,improvingoperatingmarginsand
deployingprovenexpertisetopursueprofitablegrowth.4

Ouroperations
5

0
5
10
15
20
25
1995 1996 1997 1998 1999 2000 2001 2002 2003 2004 2005 2006 2007 2008 2009 2010 2011 2012 2013 2014 2015 2016E2017E2018E
MillionSilverOuncesProduced
Demonstratedproductiongrowth
(1) Please refer to the Company’s news release dated January 19, 2016 for a detailed discussion of these production range estimates.
(1) (1) (1)
AgProductionForecast2016:24.0- 25.0Moz2017:22.5- 24.0Moz2018:25.0- 27.0Moz
6

Profitmarginssettowiden
2016GuidanceRevisedAug11,2016
(1) Cash costs per payable ounce of silver, net of by-product credits. Actual cash costs for the first half of 2016 based on actual prices. By-product metal prices assumptions used for forecast cash costscalculation: Au $1,100/oz, Zn $1,700/tonne, Pb $1,600/tonne, Cu $4,600/tonne. For revised 2016 guidance, assumptions for second half of 2016 are: Au $1,300/oz, Zn $2,000/tonne, Pb $1,750/tonne, Cu$4,700/tonne. Cash cost is a non-GAAP measure. Cash costs does not have a standardized meaning prescribed by IFRS as an indicator of performance. The Company’s method of calculating cash costs maydiffer from the methods used by other entities and, accordingly, the Company’s cash costs may not be comparable to similarly titled measures used by other entities. Readers should refer to the “AlternativePerformance (Non-GAAP) Measures” section of the Company’s Management’s Discussion & Analysis for the period ended June 30, 2016, available at www.sedar.com for a more detailed description of thismeasure and its calculation. Exchange rates relative to US$ assumed: Mexican Peso 17:1, Peruvian Sol 3.3:1, Argentinean Peso 11:1, Bolivian Boliviano 7:1.
Firsthalf2016cashcosts:$6.81
7

Positionedforstrongsilverrevenue
8%4%
11%
27%
50%
Copper Lead Zinc Gold Silver
9%3%
9%
29%
51%
Copper Lead Zinc Gold Silver
2015Actual 2016Estimate
Basedonactualproduction andrealizedprices in2015(Ag$15.53;Au$1,162;Zn$1,889;Cu$5,314;Pb $1,745
Basedonthemid-point ofproduction estimatesfor2016(Agof24.0M- 25.0Mounces,Auof175,000- 185,000ounces,Znof46,000tonnes- 48,000tonnes, Pb of15,000tonnes-15,500tonnes, andCuof13,000tonnes - 13,500tonnes) andsecond half2016price deck(Ag$18.50;Au$1,300, Zn$2,000;Cu$4,700;Pb $1,750)
8

Firsthalf2016achievements• Cashcosts(1) down35%fromfirsthalf2015
• $6.81/ounceofsilver(netofby-productcredits)• outlook for2016cashcostsreduced30%from initial2016estimate
• All-insustainingcostspersilverouncesold(2) down15%fromfirsthalf2015• $12.21(netofby-productcredits)• outlook for2016all-insustainingcostsreduced16%from initial2016estimate
• Costreductions reflectincreasedproductivityatPeruvianmines,by-product salesandpositivemarketfactors(weakerFXandlowerinputcosts,incl.energy)
• Generatedoperatingcashflowbeforechangesinnon-cashoperatingworkingcapitalof$81.9Mandadjustedearningsof$23.4M(3) atsilverpricesaveraging$15.82/oz
This slide refers to measures that are not generally accepted accounting principle (“non-GAAP”) financial measures. These measures do not have astandardized meaning prescribed by IFRS as an indicator of performance, and may differ from methods used by other companies. Refer to“Alternative Performance (non-GAAP) Measures” section of the Company’s Management’s Discussion & Analysis for the period ended June 30,2016. These non-GAAP financial measures include:(1) Cash cost per payable ounce of silver, net of by-product credits (“cash costs”)(2) All-In Sustaining Costs per Silver Ounce Sold (“AISCSOS”)(3) Adjusted earnings (losses)9

Financialstrength
US$Million
Cashandcashequivalentsandshort-term investments 204.2
Working capital(1) 399.3
Total debt(2) 58.8
Totalavailableliquidity (3) 468.0
AtJune30,2016
(1) Working capital is a non-GAAP measure calculated as current assets less current liabilities. The Company and certain investors use this information to evaluate whether the Company is able to meet its current obligations using its current assets. Refer to the Company’s management’s discussion and analysis for the period ended June 30, 2016.(2) Inclusive of $5.7 million in capital leases.(3) Includes cash and cash equivalents, short-term investments, and the undrawn portion of the Company’s secured line of credit.
10

Capitalexpenditurestodecline
0.0
50.0
100.0
150.0
200.0
2014 2015 2016E 2017E 2018E
MillionUS
$
SustainingCapital ExpansionCapital
Expansioncapitalestimatesincludesthe investmenttoexpandourLaColorada andDoloresmines,anddoesnotreflecttheexpectationthattheLaColorada expansionshouldbe5-10%underbudget.
11

Capitalallocationpriorities
PanAmerican’sapproachtocapitalmanagementprioritizesinvestmentinprojectsthatgenerateahigh-rateofreturn,maintainingastrongbalancesheetandreturningcashtoshareholders.TheCompany’slastpublicequityofferingwasin2009.
$361
$491
$542
$423
$330
$227$204
$0
$100
$200
$300
$400
$500
$600
2010 2011 2012 2013 2014 2015 Q22016
MillionsUS$
Cash&STI
Financialdebt
Cumulativereturntoshareholders
$383Mintotalcumulativecashreturned toshareholders (dividends andsharebuy-backs)since2010inadditiontoinvesting$343Mincapitalprojects.
12

LaColorada reservesincrease300%
30.4MozAg
38.3MozAg
44.1MozAg
64.8MozAg
81.4MozAg
86MozAg91.2MozAg
13

Organicgrowth– LaColorada expansion
* For La Colorada’s complete mineral reserve details, please see Appendix IV
AtDec31,2015P&P3.8Mt*Ag 436g/t(53.7Moz)
Au0.33g/tPb 1.88%Zn3.47%
AtDec31,2015P&P2.8Mt*Ag 378g/t(34.0Moz)
Au0.31g/tPb 0.82%Zn1.47%
AtDec31,2015P&P0.4Mt*Ag 303g/t(3.5Moz)
Au0.30g/tPb 1.10%Zn1.44%
14

LaColorada expansion(1)Highlights• 69%increaseexpectedinaverageannual
silverproductionto7.7Moz by2018
• 137%and185%increaseexpectedinzincandleadproduction,respectively, by2018
ProjectScope• New600-metredeepmineshaft• Undergrounddevelopmenttoopennew
productionareas• Constructionofsulphide processingplant• New115kVpowerlineExpecttobe5-10%underbudgetandonschedule
• Sulphide processingplantbeganprocessingoreinJuly2016
• NewmineshaftbeganhoistingoreinSeptember2016
(1) For additional information, please refer to the Company’s technical report entitled “Technical Report – Preliminary Economic Analysis for the Expansion of the La Colorada Mine, Zacatecas, Mexico”, with an effective date of December 31, 2013 available at www.SEDAR.com. The results of this preliminary economic assessment are preliminary in nature, in that it includes inferred mineral resources that are considered too geologically speculative to have the economic considerations applied to them that would enable them to be categorized as mineral reserves, and there is no certainty that the assessment will be realized. Mineral resources that are not mineral reserves have no demonstrated economic viability.
Estimatedtotalinvestmentof$163.8M,includingsustainingcapitalIRR22%atAg$19/oz
15

Organicgrowth– Doloresexpansion
N
SouthextensionundergroundresourcesatDecember31,2014:
Tonnes Agg/t Aug/t
Measured 146,000 101 0.74
Indicated 2,907,000 56 1.59
TOTAL 3,054,000 58 1.5516

Doloresexpansion(1)Highlights
• Duringfirst5years,estimatedincreasesinaverageannualproductionof:
• 40%increaseinsilverfrom4.5Moz to6.3Moz
• 52%increaseingoldfrom135.1koz to205.7koz
• Reducecashcoststhroughoperationalefficiencies andhighergoldproduction
ProjectScope
• New5,600tpd pulpagglomerationplant
• New1,500tpd undergroundmine
Onbudgetandonschedule
• New115kVpowerlineenergizedinSeptember2016
• Pulpagglomerationplantstart-upestimatedformid2017
• Undergroundmineproduction estimatedtoreach1,500tpd byendof2017
(1) For additional information, please refer to the Company’s technical report entitled “Technical Report for the Dolores Property, Chihuahua, Mexico - Preliminary Economic Assessment of a PulpAgglomeration Treatment and Underground Option”, with an effective date of May 31, 2014 available at www.SEDAR.com. The results of this preliminary economic assessment are preliminary innature, in that it includes inferred mineral resources that are considered too geologically speculative to have the economic considerations applied to them that would enable them to be categorizedas mineral reserves, and there is no certainty that the assessment will be realized. Mineral resources that are not mineral reserves have no demonstrated economic viability.
• Estimatedcapitalinvestment~$132.4M(includingpower line)
• IRR27%atAg$19/oz &Au$1,200/oz
17

Productionbymine(2016Guidance)
16%3%
22%
15%
14%
11%
18%23%
4%
14%
15%
10%
18%
15%
SilverOunces SilverEquivalentOunces
Basedonthemid-point ofproduction estimatesfor2016(Agof24.0M- 25.0Mounces,Auof175,000 - 185,000ounces, Znof46,000tonnes - 48,000tonnes, Pb of15,000 tonnes 15,500tonnes, andCuof13,000tonnes - 13,500tonnes)andthefollowingpricedeck:Ag$18.50;Au$1,300, Zn$2,000;Cu$4,700;Pb $1,750.
18

Operations:MexicoLaColorada Dolores Alamo Dorado
Ownership 100% 100% 100%
Minetype Underground Openpit /heapleach Openpit
Products Silverandgolddore,silver-richzincandleadconcentrates
Silverandgold dore Silverandgold dore
Capacity 1,250tonnes perday 16,200 tonnes perday 4,000tonnes perday
2015Agproduction
5.13Moz 4.25Moz 2.97Moz
2015Aggrade 379grams/tonne 44grams/tonne 62grams/tonne
2016Agproductionforecast
5.60– 5.70Moz 3.40– 3.60Moz 1.00 – 1.20Moz
(1) Estimatedusingapriceof$17/oz ofsilverforLaColorada andDolores.ForAlamoDorado,allremainingreservesarestockpiledmaterialandestimatedusingapriceof$15/oz ofsilver.
(2) See reserves table intheAppendixsectionfor moreinformation.
Silver Reserves(1)(2) LaColorada Dolores AlamoDorado
Proven(containedMoz) 49.6 20.7 2.9
Probable(containedMoz) 41.6 32.4 0.0
Proven+probable(containedMoz)(2) 91.2 53.1 2.9
19

Operations:PeruHuaron Morococha
Ownership 100% 92.3%(1)
Minetype Underground Underground
Products Silver-richzinc,leadandcopperconcentrates
Silver-rich zinc,leadandcopperconcentrates
Capacity 2,300tonnes perday 2,000 tonnes perday
2015production 3.71Moz 2.17Moz
2015Aggrade 157grams/tonne 124grams/tonne
2016productionforecast
3.65– 3.80Moz 2.45– 2.60Moz
(1) FiguresreflectPanAmerican’s92.3%interestinMorococha(2) Estimatedusingapriceof$17/oz ofsilver(3) See reserves table intheAppendixsectionformoreinformation.
Silver Reserves(2)(3) Huaron Morococha
Proven(containedMoz) 33.6 13.0
Probable(containedMoz) 19.9 12.6
Proven+ probable(containedMoz)(3) 53.5 25.6
20
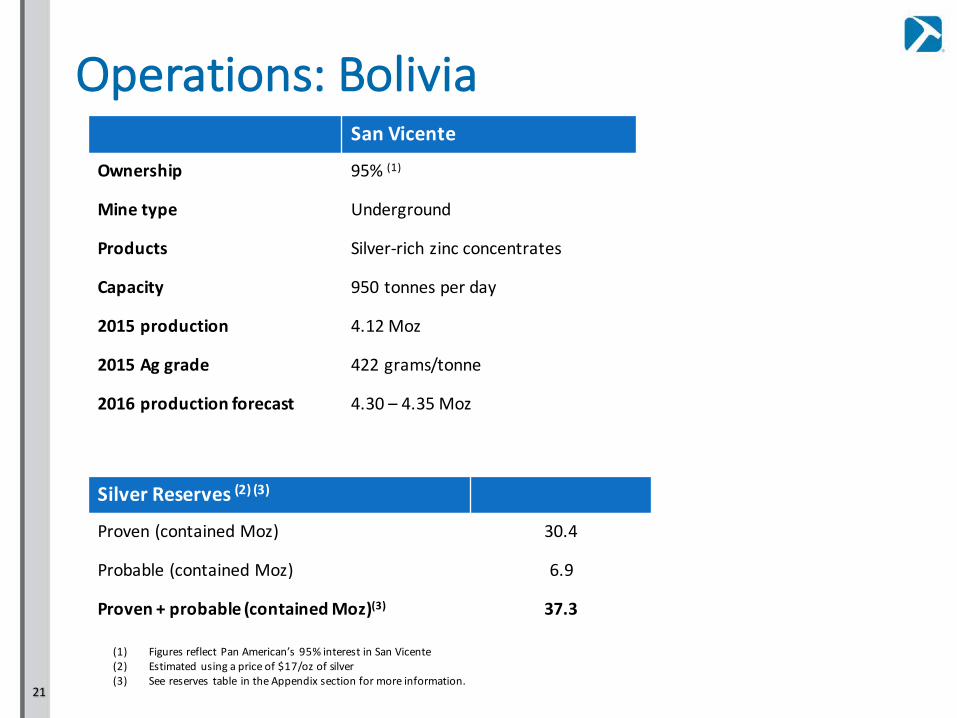
Operations:BoliviaSanVicente
Ownership 95%(1)
Minetype Underground
Products Silver-richzincconcentrates
Capacity 950tonnes perday
2015production 4.12Moz
2015Aggrade 422grams/tonne
2016production forecast 4.30 – 4.35Moz
(1) FiguresreflectPanAmerican’s95%interestinSanVicente(2) Estimatedusingapriceof$17/oz ofsilver(3) See reserves table intheAppendixsectionformoreinformation.
Silver Reserves(2)(3)
Proven(containedMoz) 30.4
Probable(containedMoz) 6.9
Proven+ probable(containedMoz)(3) 37.3
21

Operations:ArgentinaManantial Espejo
Ownership 100%
Minetype OpenPit/Underground
Products Silverandgolddore
Capacity 2,000tonnes perday
2015production 3.58Moz
2015Aggrade 158grams/tonne
2016production forecast 3.60– 3.75Moz
(1) Estimatedusingpricesof$14.50/oz ofsilverand$1,100/oz ofgoldforplanned2016production,thenusing$17/oz ofsilverand$1,180/oz ofgold.(2) See reserves table intheAppendixsectionformoreinformation.
Silver Reserves(1)(2)
Proven(containedMoz) 9.4
Probable(containedMoz) 2.4
Proven+ probable(containedMoz)(2) 11.8
22

Explorationandproductiongrowth• Solidperformanceonreplacingproduction withnewreserves
• Provenandprobablereservereplacementof101%(added293Moz ofcontainedsilvertomineralreserves)overlast12years
• ReservereplacementcostofUS$0.44/oz (1)
• LaColoradacontinuestodeliverinbothnewreservesandextensiontominelife
• HighpotentialatPeruoperations;nearsiteandgreenfieldexploration
• KootenaySilverInc.optionbringsanadvancedsilverexplorationprojectintothepipelinewithexcellentregionalexplorationpotential
• Explorationbudget for2016increased38%toUS$14.5M
• 100%ownerofNavidad,largestundeveloped silverdeposit intheworld
(1) Over 2004-2015(2) Estimated using a price of $12.52/oz of silver
Silver Resources(2)AsofDec.31,2015
ContainedAg(Moz) Tonnes (Mt) Ag(g/t)
Measured (containedMoz) 67.8 15.4 137
Indicated(containedMoz) 564.5 139.8 126
Inferred(containedMoz)(2) 119.4 45.9 81
23

StrategicinitiativestosurfacevalueMaverix (1)
• PanAmericanrealizedvalueforassetshiddenwithinitsportfoliothroughsaletoMaverixMetalsInc.(royalties,preciousmetalsstreams)
• Retained54%majorityownership(63%fully-diluted)inMaverix• Providesadditionalleveragetogoldandsilverprices• OpportunetimingforMaverix toattractnewgrowthprospects• Maverix up79%andhasamarketcapofabout$100Msinceacquisitionofassetsfrom
PanAmericanclosed(2)
Milpo Shalipayco JointVenture• PanAmericansold75%ofsharesinCompania Minera Shalipayco SACtoVotorantim
Metais – Cajamarquilla SAforUS$15Mcashand1%NetSmelterReturn(soldtoMaverix)
• PanAmericanreceivesfreecarryofitsremaining25%interesttocommercialproductioninthislargezincdevelopmentprojectlocatedinPeru
(1) See press release dated July 11, 2016 available at www.panamericansilver.com/investors/news(2) Based on Maverix opening price on TSX-V on July 12, 2016 of $0.70/share compared to closing price on Sept. 7, 2016 of $1.25/share.
24

TARGETS
• KootenaySilverInc.isapubliclytradedsilverexplorationcompany,exploringanddevelopingthePromontorio mineralbeltinSonora,Mexico
• KootenaySilverInc.discoveredtwodeposits: LaNegra andPromontorio
• PanAmericanhasenteredintoanoptionagreementtoearn75%interestintheMineraPromontorio mineralbeltproperties
• PanAmericancurrentlyownsapproximately10%ofKootenaySilver
Kootenayoptionagreement
Promontorio
MulatosLaColorada
Dolores
PinosAltos
Ocampo
Palmarejo
SuazalPiedrasVerdes
Alamo Dorado
LaCaridad
Cananea
SanFrancisco
ElChanate
Monterde
o
o
o
o
o
oo
oo
o
oo
oo
o
LaIndia
HERMOSILLO
OBREGON
KTNConcessions
SONORA
oVulcan
LaNegra
x
x
xox
REGIONALMINERALSETTINGCENTRAL-SOUTHSONORA
257+years between discoveries
x
O MinesandSerious PropertiesxProspects
Alamo DoradoDiscovery1997
LaColoradaDiscovery1740andBefore
LaNegraPromontorio
LANEGRA-PROMONTORIODISTRICT
RioYaqui
LOOKINGSOUTHWESTERLY
25

WhyinvestinPAAS1.Wellpositioned for improving profitmarginsthrough expansionsatLaColorada andDolores
2.Drivingdowncoststhroughoperationalefficienciesandincreasedproductivity (mechanizationatPeruvianmines)
3.Pipelineoforganicgrowthopportunities
4.Explorationpotential– budget increased38%inthesecondquarterof2016
5.Prudent financialmanagementcreatesvaluethroughout thecommoditypricecycle
6.Tradingatattractivevaluationrelativetopeersandstreamingcompanies
7.Support forsilverpricesthroughweakglobaleconomic fundamentalsandincreasinguseinindustrialapplications
26

SustainabilityleadershipRecognizedasaleaderinsustainabilityintheminingindustry
Plan
• Toolkits• Program
development
Engage
• StakeholderEngagement
• GrievanceMechanisms
Environmental&SocialAudits
SustainabilityReporting
InternalCapacityBuilding
EvaluatePerformanceMetrics
Implement
• Programsandprojectscoveringsustainabilitypillars
SustainabilityReport&Pillars
Education&Health
SustainableDevelopmentPrograms
LocalProcurementDevelopment
Infrastructure&UrbanFootprint
WaterandEnergy
Stewardship
TailingsFacilitySafety
EmergencyResponse
PreparednessMineClosure
Policy
• CSR• Environmental• Healthand
Safety• Governance
27

Sustainabilityawards&recognitions
Corporate
• CorporateKnightsrankedPanAmericanSilver36thontheirFuture40ResponsibleCorporateLeadersinCanada.
• ThePeruvian-CanadianChamberofCommerceawardedPanAmericanSilverthe“BusinessoftheYear2015”awardforourcontributions tosustainabledevelopment through ourUQLLU/Alpacadelos Andesweavingproject.
Mexico
• AllmineswereawardedwiththeSociallyResponsibleCompany(ESR)AwardpresentedbytheCentroMexicano paralaFilantropía (CEMEFI).
• AllminesmaintainedtheCleanIndustryindependent environmentalcertificationbytheMexicanEnvironmentProtectionAgency(PROFEPA).
28

SilvermarketIn2015:• Totalglobalsupplydeclinedfrom1.06Bto1.04Bounces• Mineproductiongrew2%topeakat887M ounces• Supplyfromscrapandrecyclingdeclinedby13%• SilverETF’sholdingsdeclined3%• Totalglobaldemandwas1.17Bounceswithgrowthinkeydemandcomponents(jewelry,bullionandphotovoltaics)
• Physicalmarketdeficitwas~130Mounces.2015wasthirdconsecutiveyearthatdemandsurpassedsupply
• Minesupplyexpectedtodeclinegoingforwardduetocost-relatedcutsandreducedinvestmentinexploration/development
Source:GFMS2016SilverSurvey releasedonMay5,2016Visitwww.silverinstitute.orgfortheSilverInstitute’spublications,includingtheWorldSilverSurvey2016
29

AppendixICompanyoverview
• Listings:NASDAQ (PAAS)andTSX (PAA)
• Marketcap:US$2.8B(1)
• Sharesoutstanding: approx.152.2M
• Averagedailyvolume:3.4M(1)
• Paiddividendssince2010- Currentyield0.3%(2)
AlldataasofcloseSept.28,2016(1)BasedonNasdaqexchange(2)BasedondividenddeclaredAug.11,2016,annualized(3)Source: IPREO
Ownership(3)
ReportedInstitutional Impliedretail Insiders
30

AppendixII2016ForecastConsolidatedOperationalHighlights 6Months
endedJune30,2016
ForecastFY2016
(AsatJan19,2016)
Forecast(1)FY2016
(AsatAug11, 2016)
Silver production (Moz) 12.75 24- 25 24– 25
Goldproduction (koz) 89.6 175 - 185 175– 185
Cashcosts(2)(netofby-productcredits) $6.81 $9.45- $10.45 $6.50- $7.50
All-in SustainingCostsperSilverOunceSold(3) (netofby-product credits)(“AISCSOS”)
$12.21 $13.60 - $14.90 $11.60- $12.60
• Totalcapitalexpendituresforecastof$200Mto$215M(including projectcapitalinvestmentof$135Mto$140M)
(1) Revised cash costs and AISCSOS forecasts assume by-product credit prices of $2,000/tonne ($0.91/lb) for zinc, $1,750/tonne ($0.79/lb.) for lead, $4,700/tonne ($2.13/lb.) for copper, and $1,300/oz. for gold.
This slide refers to measures that are not generally accepted accounting principle (“non-GAAP”) financial measures. These measures do not have a standardized meaning prescribed by IFRS as an indicator ofperformance, and may differ from methods used by other companies. Refer to “Alternative Performance (non-GAAP) Measures” section of the Company’s Management’s Discussion & Analysis for the period endedJune 30, 2016. These non-GAAP financial measures include: (2) Cash cost per payable ounce of silver, net of by-product credits (“cash costs”) and (3) All-In Sustaining Costs per Silver Ounce Sold (“AISCSOS”)
31

AppendixIIIFirsthalf2016consolidatedresults
Mine AgProduction(1)(Moz)
AuProduction(1)(koz)
$CashCosts(2) $AISCSOS(3)
LaColorada 2.75 1.35 7.00 8.98
Dolores 2.04 46.80 2.91 16.69
AlamoDorado 1.09 5.62 12.68 11.06
Huaron 1.91 0.41 6.83 11.01
Morococha 1.28 1.30 3.51 6.87
SanVicente 2.23 n/a 12.06 15.97
Manantial Espejo 1.46 34.09 2.47 3.42
Total 12.75 89.57 $6.81 $12.21(1)Totalsmaynotaddupduetorounding.(2)Averagerealizedby-productmetalpricesforH12015were:Au$1,211/oz,Zn$2,118/tonne,Pb $1,858/tonne,Cu$5,643/tonne.Cashcostsisanon-GAAPmeasure.Readersshouldreferto
the“AlternativePerformance(Non-GAAP)Measures”sectionof theCompany’sManagement’sDiscussion&Analysis fortheperiodendedJune30,2016,availableatwww.sedar.comforamoredetaileddescriptionof thismeasureanditscalculation.
(3)All-InSustainingCostsperSilverOunceSold(“AISCSOS”)isanon-GAAPmeasurethatmeasuresasilverminingcompany’sconsolidatedoperatingperformanceandtheabilitytogeneratecashflow fromalloperationscollectively.Webelieveitisamorecomprehensivemeasureofthecostofoperatingourconsolidatedbusinessthantraditionalcashandtotalcostsperounceasitincludesthecostofreplacingounces throughexploration,thecostofongoingcapitalinvestments(sustainingcapital),generalandadministrativeexpenses,aswellasotheritemsthataffect ourconsolidatedearningsandcash flow.Readersshould refertothe“AlternativePerformance(Non-GAAP)Measures”sectionoftheCompany’sManagement’sDiscussion&Analysis fortheperiodendedJune30,2016,availableatwww.sedar.comforamoredetaileddescriptionofthismeasureanditscalculation.
NOTE: ForadditionalinformationrelatingtotheCompany’sfinancialandoperatingresults,pleaserefertotheCompany’smostrecentMD&AandunauditedconsolidatedfinancialstatementsfortheperiodendedJune30,2016.32

AppendixIV2016operatingforecast
Mine Ag ProductionMoz AuProductionkoz $CashCosts(1)
LaColorada 5.6– 5.7 2.7– 2.9 7.00– 7.50
Dolores 3.4– 3.6 97.0– 102.0 0– 1.50
AlamoDorado 1.0– 1.2 7.0– 8.0 14.00 – 15.00
Huaron 3.7– 3.8 0.7– 0.8 8.25– 9.25
Morococha (92.3%)(2) 2.5– 2.6 3.0– 3.2 4.75– 6.50
SanVicente(95%)(2) 4.3– 4.4 n/a 12.00– 12.50
Manantial Espejo 3.6– 3.8 64.6– 68.1 1.75– 3.25
Total 24.0– 25.0 175.0– 185.0 $6.50– $7.50
(1) Cash costs per payable silver ounce, net of by-product credits. By-product metal prices assumptions used for 2016 cash costs calculation: Au $1,100/oz, Zn $1,700/tonne, Pb $1,600/tonne, Cu $4,600/tonne. Cash costs is a non-GAAP measure. Readers should refer to the “Alternative Performance (Non-GAAP) Measures” section of the Company’s Management’s Discussion & Analysis for the period ended June 30, 2016, available at www.sedar.com for a more detailed description of this measure and its calculation. (2) Reflects Pan American’s ownership in the operation.(3) All-In Sustaining Costs per Silver Ounce Sold (“AISCSOS”) is a non-GAAP measure and does not have a standardized meaning or a consistent basis of calculation prescribed by Canadian accounting standards. Readers should refer to the “Alternative Performance (Non-GAAP) Measures” section of the Company’s Management’s Discussion & Analysis for the period ended June 30, 2016, available at www.sedar.com for a more detailed description of this measure and its calculation.
• AISCSOS(3) expectedtobebetween$11.60and$12.60,netofby-productcredits
33

AppendixVPanAmericanSilverProvenandProbableReservesatDecember31,2015(1)(2)Property Location Category Tonnes
(Mt)Agg/t
ContainedAg(Moz)
Aug/t
ContainedAu (000’soz)
Cu%
Pb%
Zn%
Huaron Peru Proven 6.1 172 33.6 0.41 1.40 2.99
Probable 3.7 167 19.9 0.27 1.58 3.17
Morococha (92.3%) (3) Peru Proven 2.3 176 13.0 0.78 1.18 3.57
Probable 1.9 202 12.6 0.53 1.35 3.70
La Colorada Mexico Proven 3.3 474 49.6 0.35 36.2 1.69 3.15
Probable 3.7 346 41.6 0.30 35.9 1.18 2.06
Dolores Mexico Proven 23.0 28 20.7 0.96 706.0
Probable 29.2 34 32.4 0.92 864.0
Alamo Dorado Mexico Proven 1.6 55 2.9 0.23 12.2
Probable 0.0 - -
La Bolsa Mexico Proven 9.5 10 3.1 0.67 203.0
Probable 6.2 7 1.4 0.57 113.1
Manantial Espejo Argentina Proven 2.5 120 9.4 1.60 126.4
Probable 0.3 262 2.4 3.90 35.6
SanVicente(95%)(3) Bolivia Proven 2.0 482 30.4 0.35 2.66
Probable 0.4 511 6.9 0.48 2.24
Total (4) Proven+Probable 95.7 91 280.1 0.84 2132.4 0.45 1.30 2.97
(1) As of December 31, 2015. Prices used to estimate mineral reserves for 2015 were $17/oz of silver, $1,180/oz of gold, $1,800/tonne of lead, $1,800/tonne of zinc, and $5,000/tonne of copper, except atManantial Espejowhere$14.50/oz of silver and$1,100/oz of gold was used for planned2016 production, reverting to thepreviously stated metal pricesthereafter, and Alamo Dorado stockpileswhere metalprices of $15/oz of silver and $1,100/ozof goldwere used due to their planned processing in the short term. Metal prices used for LaBolsawere$14/ozof silver and $825/oz of gold.
(2) Mineral reserve estimateswere prepared under the supervisionof, orwere reviewedbyMartinG.Wafforn, P.Eng., Sr.Vice President Technical Services andProcessOptimization,who is the QualifiedPersonas that termis defined in National Instrument 43-101 (“NI43-101). Please refer tothe Company’sAnnual InformationFormdate March24, 2016,availableatwww.sedar.com for further information ontheseproperties, includingwith respect to mineral reserves.
(3) This information represents the portionof mineral reserves attributable to Pan American based on its ownership interest in the operating entity as indicated.(4) Totals may not add updue to rounding.
34
