razer inc.irmedia.razer.com/2018032217170100003082238_en.pdfglobal entertainment industry, where its...
TRANSCRIPT

1
Hong Kong Exchanges and Clearing Limited and The Stock Exchange of Hong Kong Limited take no responsibility for the contents of this announcement, make no representation as to its accuracy or completeness and expressly disclaim any liability whatsoever for any loss howsoever arising from or in reliance upon the whole or any part of the contents of this announcement.
RAZER INC.雷蛇*
(Incorporated in the Cayman Islands with limited liability)
(Stock code: 1337)
ANNOUNCEMENT OF ANNUAL RESULTS FOR THE YEAR ENDED DECEMBER 31, 2017
The Board is pleased to announce the audited consolidated results of the Group for the year ended December 31, 2017. In this announcement, “we”, “us”, and “our” refer to the Company and where the context otherwise requires, the Group.
KEY HIGHLIGHTS
• Revenue grew 32.1% year-on-year to US$517.9 million.
• Gross profit margin improved year-on-year from 27.9% to 29.2%.
• Loss for the year was US$165.8 million (US$31.8 million on an adjusted basis) for 2017 as compared to US$59.6 million (US$20.3 million on an adjusted basis) for 2016.
• Excluding non-cash share-based compensation and listing expenses, adjusted loss for the year of US$31.8 million reflects primarily our investments in developing the new Mobile business, while the losses were moderated due to enhanced profitability of our core Peripherals business as well as improved profit profile and scale of our Systems business. Furthermore, our adjusted loss of US$31.8 million for 2017 included a one-off charge of US$4.4 million related to the remeasurement of the deferred tax assets and liabilities of our U.S. incorporated subsidiaries being recognised in 2017, due to the tax reform enacted in the U.S.
• Loss from operations was at US$163.4 million for 2017 and adjusted EBITDA (defined as loss from operations added back with depreciation and amortisation, share-based compensation, and additionally, listing expenses in 2017 and impairment of acquisition-related intangible assets in 2016) was US$13.8 million for 2017, compared to loss from operations of US$63.1 million and adjusted EBITDA of US$9.5 million for 2016.
• Hardware:
o Peripherals revenues grew 13.4% year-on-year as the Group grew in tandem with the industry while maintaining industry high margins.
o Systems revenues grew 51.0% year-on-year. Gross profit margin for Systems improved year-on-year thanks to greater economies of scale and maturing financial profile.

2
• Software:
o Total registered users of our software platform grew to over 40 million as of December 31, 2017.
• Services:
o Started to monetise our hardware/software platform with the launch of zGold virtual credits service and loyalty-based zSilver rewards points system.
o Revenue from our Services business was US$10.6 million. The Services business has a significantly higher gross profit margin than our Hardware business.
• Others:
o We entered the mobile business category with the launch of the Razer Phone in November 2017. The Razer Phone has since been well-received by the market, being both a critical success with the press and reviewers, and a commercial success with our users.
o Revenue for Others grew nearly twelvefold to US$31.6 million, driven primarily by the contribution of the Razer Phone.
• See sub-sections headed “Loss for the year” and “Non-GAAP Measures” in the “Management Discussion and Analysis” section below.

3
FINANCIAL PERFORMANCE
Year ended December 31,2017 2016
US$’000 US$’000
Revenue 517,937 392,099
Gross profit 151,025 109,451
Loss before income tax (164,585) (63,270)
Loss for the year (165,839) (59,616)
Loss attributable to equity shareholders of the Company (164,020) (59,332)
Loss per share
Basic US$ (0.03) US$ (0.01)
Diluted US$ (0.03) US$ (0.01)
Non-GAAP measures
Loss for the year (165,839) (59,616)
Add:Share-based compensation 121,194 38,548Impairment of acquisition-related intangible assets – 805Listing expenses 12,820 –
Adjusted loss for the year (31,825) (20,263)
Loss from operations (163,414) (63,128)
Add:Depreciation and amortisation 15,640 14,230Share-based compensation 121,194 38,548Impairment of acquisition-related intangible assets – 805Listing expenses 12,820 –
Adjusted EBITDA (13,760) (9,545)

4
CHAIRMAN’S STATEMENT
2017 was a phenomenal year for gamers all around the world, the gaming industry and Razer.
The numbers of gamers around the world continued to increase, across geographies and demographics. As a result, the gaming industry continues to be the fastest growing segment in the entertainment industry, eclipsing the cinema and music industries. In addition, esports has quickly grown from a niche segment to mass market with millions of viewers to rival that of traditional sports.
The Razer ecosystem of hardware, software and services continues to be the largest integrated gaming ecosystem in the world1. We took huge strides in 2017 growing our ecosystem; within our Hardware business, Peripherals and Systems had robust year-on-year growth, and we successfully launched the Razer Phone, our first entrant in the mobile category, which represents an all new growth category for us. Our Software business witnessed strong growth, achieving over 40 million registered users. To round off the Razer ecosystem triumvirate, we launched the zGold virtual credits service as part of our Services business, and it has very quickly become one of the biggest virtual credits services for gamers around the world.
We achieved solid revenue growth of 32.1% year-on-year to US$517.9 million. Our gross profit margin increased from 27.9% to 29.2%. Our adjusted loss was US$31.8 million, primarily due to extensive investments in developing the new Mobile business, while the loss was moderated due to enhanced profitability in the core Peripherals business as well as improved profit profile and scale of our Systems business. Furthermore, our adjusted loss of US$31.8 million for 2017 included a one-off charge of US$4.4 million related to the remeasurement of the deferred tax assets and liabilities of our U.S. incorporated subsidiaries being recognised in 2017, due to the tax reform enacted in the U.S.
Our Hardware business made up the majority of our overall revenues with our Peripherals business growing 13.4% year-on-year, as we grew in tandem with the industry while maintaining our industry high margins. Our Systems business experienced excellent growth of 51.0% year-on-year, and correspondingly, with the scaling of our Systems business, our maturing financial profile for the Systems business also meant gross profit margin for the business improved year-on-year.
The Razer Phone had a stunning debut in November 2017, and contributed significantly to the US$31.6 million revenues in the Others segment, which primarily includes our next-generation products that remain in the development or early marketing phases. The Razer Phone has been both a critical success with the press and a commercial success with our users. The Razer Phone is an exciting prospect for the Company, and although the extensive investments in developing the phone and the Mobile business have impacted our profit in the short term, we believe this category will mature in line with the Systems business in the future.
While we do not monetise our Software business historically due to a focus on driving user acquisition and retention, we offer services to our users on our hardware/software platform. In our first year of launch of zGold, our Services business achieved revenues of US$10.6 million in its launch year with significantly higher gross profit margin than our Hardware business.
The Rise of Gamers, the Gaming Industry and esports
The gamer opportunity is massive. The world has approximately 2.1 billion gamers, which is estimated to grow to approximately 2.7 billion by 20212. With the growth of the number of

5
gamers, the gaming industry has grown in tandem as the fastest growing segment within the global entertainment industry, where its revenue exceeded both cinema and music in 20163, and reached US$101.1 billion in 2016. Games are integral to the modern way of life. More than 70% of millennials currently play games4.
According to Newzoo, esports is a massive standalone industry with a forecast global audience of 386 million in 2017, reaching 665 million in 2021. Esports revenues are forecasted to grow at a CAGR of 24.1% from 2017 to US$1.65 billion in 2021. To put that into context, major esports tournaments have a huge following; 60 million people watched the League of Legends final in 2017, more than the NBA Finals and The Oscars combined. China has the largest esports audience with 106 million viewers in 2016 and is expected to remain the largest in 2021, reaching a total of 218 million at a CAGR of 14.6% from 2017.
Esports is also gaining mainstream acceptance from various organisations worldwide. In early 2017, the Olympic Council of Asia announced esports will become a medal event at the 2022 Asian Games. More recently, the Hong Kong government announced it will allocate HK$100 million in its budget plan to Cyberport with esports earmarked as one of the supported areas of development, recognising the growing importance and potential of the esports market to the economy as a whole.
We are one of the pioneers of esports, having sponsored top athletes and tournaments for over a decade. As of December 31, 2017, Team Razer, our esports brand, comprised 175 top esports athletes from 30 different countries. In 2017, Team Razer developed new relationships with premier esports franchise such as SK Gaming and Rise Nation, while continuing to support long-term world champions SK Telecom T1 and Team Liquid. Razer’s sponsored teams dominated esports tournaments throughout 2017, winning various tournaments across the world.
With our loyal user base, strong social media presence and viral marketing campaigns, we are a prime mover to bring esports to the growing gamer market worldwide.
The Razer Ecosystem – the largest integrated gaming ecosystem in the world
The Razer ecosystem is clearly differentiated by our gaming hardware, software and services designed and developed to integrate seamlessly and enhance personalised user experiences across different entertainment genres. According to Newzoo, there is no single game focused brand that has the same breadth and strength as Razer’s ecosystem.
Our Hardware business includes our gaming peripherals which are designed to empower competitive gamers at the highest levels, including high-precision mice, fully customisable keyboards, audio devices, mouse mats and gaming console controllers. In addition, our systems products consist of gaming laptops that combine performance and an exceptional gamer user interface, providing seamless integration and enhanced portability for gamers.
Our Razer Software Platform grew from 35 million users as of June 30, 2017 to over 40 million users as of December 31, 2017. Our software platform comprises Razer Synapse, an IoT platform, which allows users to access our software platform via our hardware devices; Razer Chroma, our proprietary RGB lighting technology system; and Razer Cortex, an all-in-one game launcher, game optimiser, game aggregator and price comparison engine.
We believe these software offerings draw users to our ecosystem, keep them engaged and allow us to offer additional services to users. Our Razer Software Platform also allows us to collect data through analytics and make suggestions and recommendations to gamers to improve user experience and influence the design of future products.

6
We are in the early stages of monetising our Razer Hardware and Software Platform by offering Services to our users. We further expanded our ecosystem in March 2017 with the launch of zGold virtual credits, allowing users to purchase digital content and in-game items, and our loyalty-based zSilver rewards points system.
We believe our brand has a unique position as a lifestyle icon to allow us to expand into new categories easily. Moreover, the Razer ecosystem continually contributes to the successful launches of new hardware, software and services, creating a virtuous cycle. The Razer Phone, which has been positively received by the market, is a prime example of this.
2017 – a milestone in Razer’s history
Financially, we delivered solid year-on-year growth in revenue, with broad-based growth across all segments and geographies.
Operationally, we remained a clear leader in Peripherals, our profitable core, in key categories such as mice and keyboards in the U.S., Europe and China. We also gained market share in the audio category driven by a strong performance in the U.S. and China. We achieved significant growth in the console category, thanks to the introduction of Razer Raiju, a premium line of licensed gaming controller for PlayStation 4.
The growth of our Systems business outperformed the wider market due to strong brand awareness and our retail and regional expansion strategy.
On the Services front, we have seen growing traction with our zGold virtual credits globally through working with distributors such as MOL Global in Southeast Asia and CK Hutchison’s Three Group in Hong Kong. As of January 2018, we have approximately 4 million zVault e-wallets where users store their zGold and zSilver. In its debut year alone, our Services business achieved revenue of US$10.6 million with a significantly higher gross profit margin than our Hardware business.
The newly launched Razer Phone was a great success and contributed significantly to our revenues in Others segment.
We continue to establish a global footprint in the gamer market. As of December 31, 2017, our products are sold in 66 countries through 324 online platforms and through more than 25,000 offline retail outlets.
In 2017, we successfully completed our initial public offering on the Stock Exchange of Hong Kong. As a listed company, we intend to continue delivering the best user experiences to gamers, whilst expanding and deepening our brand appeal, and product and service offerings across the world.
The results are discussed in detail under the sections headed “Management Discussion and Analysis” and “Business Highlights” in this annual results announcement.
Outlook
In the coming years, we expect the number of gamers around the world to continue to grow and the gaming industry to keep pace as the fastest growing segment in the entertainment industry. We believe that esports will continue to gain traction into mainstream adoption. Riding the rising tide, Razer is at the forefront of the industry.

7
We expect that our integrated ecosystem of hardware, software and services will continue to further our leadership in the gaming industry where we are the choice partner for many players in the ecosystem.
For example, our tie up with Philips Hue’s smart lighting system allows users to sync any colour-capable Hue light product with Razer devices via our Razer Chroma software – which essentially brings our gaming software platform from the desktop to the smart home.
In addition, the spectacular launch of the Razer Phone in the crowded smartphone space has entrenched us in a position to bring more immersive experiences to our youth and millennial markets. We recently announced that Razer Phone will be the world’s first smartphone to deliver Netflix entertainment in both HDR and Dolby Digital Plus 5.1. While we are still in the early development and marketing phases of the mobile business, the launch of the mobile category has allowed us to be one of the very few technology companies in the world to have the unique opportunity to straddle the PC, console and mobile markets.
Finally, we have just begun to monetise our growing user base through zGold on the Razer Software Platform and our new zGold virtual credits service is expected to see good growth in 2018. Our content-neutral position allows us to partner with a variety of content providers to further grow our user base and to keep users engaged on our platform. We intend to expand the geographical reach of zGold through distribution partnerships (such as with MOL Global, Hutchison and other distributors) and directly through our zGold platform.
We recently increased our investment in MOL Global in February 2018. The additional investment positions us as their single largest shareholder and enables us to gain further access to MOL Global’s massive network of content, customers and partners throughout emerging markets, built over the past 17 years. The investment also allows us to expand our partnership beyond virtual credits service into fast growing areas such as e-payment and digital wallet solutions, both of which are very relevant to the youth and millennial users.
Razer is well positioned to lead the convergence of digital entertainment. The examples above are just a few initiatives that demonstrate how the Razer brand is leading the way in immersive digital entertainment.
Looking forward, we seek to broaden the appeal of our brand and roll out category-defining and award-winning products to even more gamers. We are in a very unique leadership position in one of the fastest growing industries with one of the most recognisable brands in the market. In addition, our brand has transcended that of gamers and has become synonymous with the youth lifestyle – allowing us to extend into multiple new verticals of growth – evidenced by our recent entry in the smartphone and virtual credits space.
We plan to achieve profitability primarily through the continued growth of our Peripherals business and, rapid scale of our Systems business. Our Services business will continue to see strong growth, and while we expect the profit margin to normalise, it will still be significantly higher than our Hardware margins.

8
In terms of our outlook for 2018 for the Group, we expect strong revenue growth in 2018 to persist. We expect significant investments in first half of 2018 in preparation for new product launches in the second half of 2018.
For our Hardware business, we expect to maintain steady, strong and profitable growth of our more established Peripherals business as we continue to introduce new product categories within this segment. Most recently, we made foray into the fast-growing streaming and broadcaster category to further participate in the growth of the esports market, given the growing popularity with streamers and broadcasters in the streaming of gameplay as well as live commentary to millions of esports spectators. On top of that, we expect that our Systems business, to which we have contributed a significant amount of investments in the past few years, will experience continued growth and be a key driver of our overall scale, revenue growth and profits, as we expand the availability of our systems outside of the U.S. and into Europe and Asia, to drive further economies of scale and improvement in gross profit margin as we expand this business.
For Software, as the user base continues to grow and become more engaged, it will enable us to understand them more with big data, which will in turn provide a much larger platform for monetisation of Hardware and Services businesses.
For our Services business, our launch year saw very high gross profit margin for our zGold virtual credits business and we expect it to normalise in 2018 but still maintain a significantly higher level than our Hardware business. We expect our Services business to continue growing and, as a result of its much higher gross profit margin, contribute significantly to our Company’s profits over time.
Finally, we expect our Mobile business to grow to take advantage of the untapped opportunity of mobile gaming and esports. As a result, we expect our integrated ecosystem to expand with each business segment experiencing continued growth and improvement in profit profile.
In 2018, as our Systems business and new categories such as Mobile expand as a proportion of our overall business, we expect the overall gross profit margin to be lower as compared with 2017. However, this will be moderated in part by the growth of our Peripherals and Services businesses which have much higher margins.
As a growth company serving the fast-expanding addressable market of gamers, we will continue to invest in new categories that will benefit the Razer ecosystem, our users and our partners.
In closing, I would like to take this opportunity to thank you all; our users and the Razer community, our esports athletes, our partners, our shareholders, our team, for your continued support. 2017 was a transformational year for Razer and we could not have done it without you.
For Gamers. By Gamers.
Min-Liang TanCo-Founder, Chairman and CEO
1, 2, 3, 4 Source: Reports prepared by Frost & Sullivan dated as of June 23, 2017 and Report prepared by Newzoo International N.V. dated as of October 17, 2017 (“Newzoo”)

9
BUSINESS HIGHLIGHTS
2017 Highlights
The Razer Ecosystem
Razer is the world’s leading lifestyle brand for gamers. The Razer ecosystem delivers gamers a competitive edge, immersive gaming experiences and access to a comprehensive catalogue of digital entertainment. Our ecosystem is one of the largest integrated ecosystems in the world for gamers, which consists of hardware, software and services designed and developed to integrate seamlessly and enhance personalised user experiences across different entertainment genres.
Hardware
Peripherals
Revenue from the core Peripherals segment increased by 13.4% year-on-year to US$338.7 million in 2017, primarily due to continued strong sales of the existing peripherals categories as well as the launch of new products in the gaming console peripherals and the streamer and broadcaster categories.
During the year, we reinforced our leadership in key categories such as mice and keyboards across the Americas, Europe and China, while expanding our market share in the audio category driven by strong performance in the Americas and China.
We recorded significant growth in the gaming console peripherals category, and re-focused our efforts around the growing streamer and broadcaster market with the introduction of two products that were designed hand-in-hand with streamers around the globe: The Razer Kiyo, hailed for its unique design and innovative ring light, and the Razer Seiren, an entry-level broadcaster microphone.

10
Systems
Revenue from the Systems segment increased 51.0% year-on-year to US$137.0 million in 2017, driven primarily by an increase in sales of the newer versions of our laptop models.
We increased our market share by outperforming the rest of the market, thanks to strong brand awareness, alongside our retail and regional expansion strategy.
In 2017, we were one of the top three fastest growing gaming systems brands in the Americas. Additionally, towards the end of 2017, we began to scale further the launch of our systems products outside of the U.S. in Europe and Asia.
Software
Our Razer Software Platform, another key pillar of the integrated ecosystem, grew from approximately 35 million users as of June 30, 2017 to over 40 million registered users as of December 31, 2017.
Our software platform comprises the Razer Synapse IoT platform, Razer Chroma lighting system and the Razer Cortex game launcher.
We recently expanded Razer Chroma beyond the desktop and into the smart home through partnering with Philips Hue, which enables integration of smart lighting with immersive gaming experiences.
Services
We are in the early stages of monetising our Razer Hardware and Software Platform by offering services such as zGold virtual credits service for gamers in purchasing digital content and in-game items from over 2,500 game titles, and our loyalty-based zSilver rewards points system, since March 2017. Through working with distributors such as MOL Global in Southeast Asia and CK Hutchison’s Three Group in Hong Kong, zGold has become one of the biggest virtual credits service for gamers in the world, and made up the bulk of our Services revenue in 2017, at significantly higher margins than our Hardware business. As of January 2018, we have approximately 4 million zVault e-wallets where users store their zGold and zSilver.
Others
This segment primarily includes our next-generation products, which remain in the development or early marketing and launch phases.
During the year, we entered the mobile device market to participate in the fast-growing mobile gaming and digital entertainment industry when we launched the first Razer Phone in November 2017. The Razer Phone is designed as the ultimate mobile entertainment device and is equipped with the world’s first 120 Hz UltraMotionTM display that delivers an incredible viewing experience for mobile entertainment content compared to other smartphones in the industry.
We secured partnerships with some of the world’s top gaming companies, such as Tencent for “Arena of Valor” and Square Enix for “Final Fantasy”, to bring compelling experiences to mobile and take full advantage of the Razer Phone’s features.
11
The Razer Phone is also the world’s first smartphone to deliver Netflix entertainment in both HDR and Dolby Digital Plus 5.1.
Feedback on the Razer Phone has been positive, and we expanded the shipments from select markets in North America, Canada and Europe, to select markets in Asia Pacific such as Singapore and Hong Kong.
In addition, THX, which is renowned for the certification of world-class cinemas and consumer electronics, began its full year contribution to our revenue since we acquired THX in October 2016. In December 2017, THX entered into a strategic partnership with China Film Giant Screen, (“CGS”) a subsidiary of China Film Group. The strategic partnership between THX and CGS is expected to enable both parties to work together over the next three years to secure commitments from exhibitors to roll out a target of 400 screens worldwide featuring jointly developed next generation cinema experience. In the same month, THX and CGS also announced the grand opening of Zhuhai Haiyun China Film Cinema, China’s first all-THX certified multiplex, together with two of CGS’s auditoriums.
Innovation and partnerships
Razer began 2017 very successfully by winning the ‘Best of Show’ award at the Consumer Electronics Show (“CES”) in Las Vegas, the world’s biggest consumer electronics show, for the seventh consecutive year for the Project Ariana concept, the world’s first video projection system designed for immersive gaming. Razer often brings new concepts and innovations to CES to demonstrate its ability to disrupt industries and define new experiences for the gaming and entertainment market.
The Razer Music initiative went from strength to strength during 2017, adding award winning artists like Anderson.Paak to further establish our high-performance Blade laptops in the creative industries. The annual RazerTour went on its 20-city journey across the U.S. bringing the Razer brand to popular events such as E3, Rooster Teeth’s RTX and Comic-Con.
2017 was another great year of presence for Razer at major global events such as IFA and Gamescom in Germany, the Tokyo Game Show, PAX West, BlizzCon, Dreamhack and TwitchCon, where hundreds of thousands of fans came to experience Razer’s ecosystem.
In May 2017, Razer formed its first telco alliance with Three Group in Europe and Hong Kong. Working alongside Three Group Hong Kong, Razer launched the sixth RazerStore in Causeway Bay, Hong Kong. Over 1,000 gamers queued up for hours in torrential rain to await the opening of the store. Razer and Three Group also worked collaboratively with the Li Ka Shing Foundation for the commemorative “HKXP” gaming event in July to bring gaming to the broader public.
Esports
Razer equips sponsored esports winning teams and athletes with the latest and greatest in high performance gaming equipment to give them the winning edge during competition. We work with our sponsored athletes to take direct player feedback in the development of future products to ensure the features and quality meet the highest standards of gaming needs. As of December 31, 2017, Team Razer comprised 175 top esports athletes from 30 different countries. Team Razer also developed new relationships with organisations such as SK Gaming and Rise Nation, while continuing to support its key long-term partners like SK Telecom T1 and Team Liquid. Razer’s sponsored teams took numerous podiums and first place trophies in a wide range of esports leagues and tournaments in 2017, including:

12
• SK Gaming – 1st place in 6 Premier/Major Counter-Strike Global Offensive events
• Team Liquid – 1st place at The International 2017 and 6 other 1st place finishes in Premier/Major DOTA 2 events
• SK Telecom T1 – 1st place at LCK Spring Split and Mid-Season Invitational, 2nd place at LOL World Championship. Faker was crowned the Best Esports Player 2017
• Rise Nation – 1st place at Street Fighter Capcom Cup
• Elevate – 1st place at World of Tanks WGLNA
• Xian – 1st place at Street Fighter Final Round XX
• QGHappy – 1st place KPL Fall Championship
Sales and Distribution
We sell our products (i) through a global distribution network of distributors (including those who operate or distribute to our three RazerStores in Bangkok, Manila and Hong Kong), (ii) through physical and online retailers, and (iii) directly to customers through our directly managed RazerStores in San Francisco, Shanghai and Taipei and our online store: www.razerstore.com.
The Group’s revenue by sales channels for 2017 and 2016 is as follows:
Year ended December 31,2017 2016
US$’000 % US$’000 %
Distributors 220,682 42.6 197,502 50.3Retailers 190,961 36.9 109,308 27.9Direct Sales 106,294 20.5 85,289 21.8
Total 517,937 100.0 392,099 100.0
The majority of our revenue for the year ended December 31, 2017 is derived from selling our products to distributors and retailers.
Our online store, www.razerstore.com, is available to customers in over 100 different countries and territories as of December 31, 2017, including the U.S., China and many countries throughout the European Union.
Our RazerStores serve mainly as “experience stores,” where customers can experience new products and immerse themselves in a dedicated gaming environment prior to making a purchase both in-store or online.

13
MANAGEMENT DISCUSSION AND ANALYSIS
Year ended December 31,2017 2016
US$’000 US$’000
Revenue 517,937 392,099
Cost of sales (366,912) (282,648)
Gross profit 151,025 109,451
Selling and marketing expenses (90,041) (69,993)Research and development expenses (80,809) (52,175)General and administrative expenses (143,589) (49,606)Impairment of goodwill – (805)
Loss from operations (163,414) (63,128)
Other non-operating expenses (3,147) (653)
Finance income 1,985 525Finance costs (9) (14)
Loss before income tax (164,585) (63,270)
Income tax (expense)/benefit (1,254) 3,654
Loss for the year (165,839) (59,616)
Loss attributable to:
Equity shareholders of the Company (164,020) (59,332)Non-controlling interests (1,819) (284)
Loss for the year (165,839) (59,616)
Non-GAAP measures
Adjusted loss for the year (31,825) (20,263)
Adjusted EBITDA (13,760) (9,545)

14
Revenue
Our revenue increased by 32.1% from US$392.1 million in 2016 to US$517.9 million in 2017, primarily due to an increase in revenue from Systems in 2017 and to a lesser extent revenue from Software and Services and Others which include new product categories such as mobile in 2017.
Our revenue is measured at the fair value of the consideration received or receivable, net of estimated product returns, and expected payments for cooperative marketing arrangements and pricing programs (if any). We generate revenue from four business segments: (i) Peripherals, (ii) Systems, (iii) Software and Services and (iv) Others. The following table sets forth our segment revenue by amount and as a percentage of our revenue for the periods presented.
Year ended December 31,2017 2016
US$’000 % US$’000 %
Segment RevenueHardware Peripherals 338,717 65.4 298,626 76.2 Systems 137,001 26.5 90,697 23.1Software and Services 10,604 2.0 95 0.0Others 31,615 6.1 2,681 0.7
517,937 100.0 392,099 100.0
We are a global company with an established footprint in the games industry and have a diversified revenue base.
Peripherals. We generate a majority of our hardware revenue from the sale of Peripherals, which primarily comprises the sale of high-precision mice, fully customisable keyboards, audio devices and gaming console controllers.
Revenue from the Peripherals segment increased by 13.4% from US$298.6 million in 2016 to US$338.7 million in 2017, primarily due to an increase in revenue generated by the sales of our gaming console controllers and audio devices.
Systems. The other major component of our hardware revenue comes from the sale of Systems, which primarily comprises of gaming laptops. We currently have three lines of laptops, namely Razer Blade Stealth, Razer Blade and Razer Blade Pro.
Revenue from the Systems segment increased by 51.0% from US$90.7 million in 2016 to US$137.0 million in 2017, primarily due to continued channel expansion in the U.S.
Software and Services. Revenue from the Software and Services segment increased from US$0.1 million in 2016 to US$10.6 million in 2017, primarily driven by our revenue-sharing arrangement with MOL Global on sales of zGold.

15
Others. Revenue from the Others segment increased from US$2.7 million in 2016 to US$31.6 million in 2017, primarily due to the launch of the Razer Phone in November 2017 and to a lesser extent arising from the acquisition of certain assets by THX from SST. THX acquired the assets in the fourth quarter of 2016 which began contributing to our revenue beginning in that quarter.
Cost of sales and gross profit
Cost of sales increased by 29.8% from US$282.6 million in 2016 to US$366.9 million in 2017. Gross profit increased from US$109.5 million in 2016 to US$151.0 million in 2017, an increase of 37.9% and gross margin increased from 27.9% for 2016 to 29.2% for 2017.
Peripherals. Segment cost for Peripherals increased by 13.1% from US$193.1 million in 2016 to US$218.4 million in 2017, which was generally in line with the increase in our Peripherals revenue. Gross margin for our Peripherals segment improved from 35.3% for 2016 to 35.5% for 2017.
Systems. Segment cost for Systems increased by 41.9% from US$88.1 million in 2016 to US$125.0 million in 2017, which was generally in line with the increase in our Systems revenue. Gross margin for our Systems segment increased from 2.9% for 2016 to 8.8% for 2017, primarily due to economies of scale and a general increase in margins across all existing Systems product lines.
Software and Services. Segment cost for Software and Services increased slightly from US$0.01 million in 2016 to US$0.2 million 2017 due to higher fees paid for payment processing services.
Others. Segment cost for Others increased from US$1.4 million in 2016 to US$23.3 million in 2017, which was generally in line with the increase in our Others revenue as a result of the launch of the Razer Phone in November 2017. Gross margin for our Others segment decreased from 47.6% for 2016 to 26.2% for 2017, primarily due to the increased sales contribution of the Razer Phone in 2017 to this segment.
Selling and marketing expenses
Selling and marketing expenses increased by 28.6% from US$70.0 million in 2016 to US$90.0 million in 2017. The increase was primarily due to (i) a US$7.7 million increase in salaries and benefits for personnel, primarily due to an increase in the headcount of our selling and marketing personnel in 2017, (ii) a US$4.5 million increase in share-based compensation expense in connection with RSUs granted to employees, and (iii) a US$2.7 million increase in marketing expenses primarily due to increased online advertising and other marketing events to promote new products and services launches.
Research and development expenses
Research and development expenses increased by 54.8% from US$52.2 million in 2016 to US$80.8 million in 2017. The increase was primarily due to (i) a US$9.8 million increase in share-based compensation expense in connection with the grant of RSUs to employees and to a lesser extent, post-combination compensation expenses in relation to the Nextbit acquisition, (ii) a US$9.2 million increase in external research and development costs primarily due to the development of new mobile devices and updates to Systems products, and (iii) a US$4.3 million increase in salaries and benefits for personnel primarily due to an increase in the headcount of our research and development personnel in 2017.

16
General and administrative expenses
General and administrative expenses increased by 189.5% from US$49.6 million in 2016 to US$143.6 million in 2017. The increase was primarily due to (i) a US$68.4 million increase in share-based compensation expense in connection with RSUs granted to employees including the one-time extraordinary grant of 105,104,724 RSUs (approximately US$52.3 million) to the Chief Executive Officer as disclosed in the section headed “Appendix IV – Statutory and General Information” in the Prospectus for his past contributions to the Group, (ii) listing expense of US$12.8 million incurred in connection with the initial public offering and listing of our shares in November 2017, and (iii) a US$7.1 million increase in salaries and benefits for personnel primarily due to an increase in the headcount of our general and administrative personnel in 2017.
Other non-operating expenses
Other non-operating expenses increased from US$0.7 million in 2016 to US$3.1 million in 2017. The increase was primarily due to the fair value remeasurement of the holdback shares associated with the acquisition of THX from SST.
Net finance income
Our finance income increased from US$0.5 million in 2016 to US$2.0 million in 2017 due to an increase in interest income from higher cash balances.
Loss before income tax
As a result of the foregoing, our loss before income tax increased from a loss of US$63.3 million in 2016 to a loss of US$164.6 million in 2017, an increase of 160.0%.
Income tax (expense)/benefit
There was a tax benefit of US$3.7 million in 2016, compared to an expense of US$1.3 million in 2017. The increase in tax expense was primarily due to tax reform enacted in the U.S. which resulted in a one-off charge of US$4.4 million related to the remeasurement of the deferred tax assets and liabilities of our U.S. incorporated subsidiaries being recognised in 2017.
Loss for the year
Our loss for the year increased by 178.2% from US$59.6 million in 2016 to US$165.8 million for 2017. The increase in loss for the year is attributed largely to the following:
A) Listing expenses of approximately US$12.8 million incurred in connection with the initial public offering and listing of the our shares in November 2017 as described in the sub-section headed “General and administrative expenses” above; and
B) Non-cash share-based compensation expense as described in the sub-sections headed “Selling and marketing expenses”, “Research and development expenses” and “General and administrative expenses” above which includes a one-time extraordinary grant of 105,104,724 RSUs (approximately US$52.3 million) to the Chief Executive Officer as disclosed in the section headed “Appendix IV – Statutory and General Information” in the Prospectus to reward his past contributions to the Group.

17
Non-GAAP Measures
To supplement our consolidated financial statements which are presented in accordance with IFRS, we also use adjusted loss and adjusted EBITDA as additional financial measures, which are not required by, or presented in accordance with, IFRS. We believe that these non-GAAP measures facilitate comparisons of operating performance from period to period and company to company by eliminating potential impacts of items that our management does not consider to be indicative of our operating performance. We believe that these measures provide useful information to investors and others in understanding and evaluating our consolidated results of operations in the same manner as they do for our management. However, our presentation of the adjusted loss and adjusted EBITDA may not be comparable to a similarly titled measures presented by other companies. The use of these non-GAAP measures have limitations as an analytical tool, and you should not consider them in isolation from, or as substitute for analysis of, our results of operations or financial position as reported under IFRS.
Adjusted Loss
We define adjusted loss as loss for the year added back with share-based compensation, expenses related to the initial public offering in 2017, and impairment of acquisition-related intangible assets in 2016. The following table reconciles our adjusted loss for the years presented to the most directly comparable financial measure calculated and presented in accordance with IFRS, which is loss for the years indicated.
Year ended December 31,2017 2016
US$’000 US$’000
Loss for the year (165,839) (59,616)Add: Share-based compensation 121,194 38,548 Impairment of acquisition-related intangible assets – 805 Listing expenses 12,820 –
Adjusted loss for the year (31,825) (20,263)
Adjusted EBITDA
We define adjusted EBITDA as loss from operations added back with depreciation and amortisation, share-based compensation, and in addition, expenses related to the initial public offering in 2017 and impairment of acquisition-related intangible assets in 2016. The following table reconciles our adjusted EBITDA for the years presented to the most directly comparable financial measure calculated and presented in accordance with IFRS, which is loss from operations for the years indicated.

18
Year ended December 31,2017 2016
US$’000 US$’000
Loss from operations (163,414) (63,128)
Add:Depreciation and amortisation 15,640 14,230Share-based compensation 121,194 38,548Impairment of acquisition-related intangible assets – 805Listing expenses 12,820 –
Adjusted EBITDA (13,760) (9,545)
Notwithstanding the above, in particular, the impact of the listing expenses and the non-cash share- based compensation, the Board is of the view that the Group’s main operational business is robust and the Group remains confident about the fundamentals and prospects of its ongoing operations as well as the growth prospects of its new businesses.
LIqUIDITY AND CAPITAL RESOURCES
Our cash and bank balances (comprising cash at bank and in hand, fixed deposits and money market funds held at call with banks) as at December 31, 2017 and 2016 were as follows:
2017 2016US$’000 US$’000
Cash at bank and in hand 645,938 37,686Fixed deposits and money market funds 63,311 83,443
Cash and cash equivalents in the consolidated cash flows statement 709,249 121,129Short-term fixed deposits 30,184 10,000
Cash and bank balances in the consolidated statement of financial position 739,433 131,129
As at December 31, 2017, our cash and bank balances was US$739.4 million. The increase was mainly due to the net proceeds of approximately US$596 million received from our initial public offering that was completed in December 2017.
We seek to maintain our cash balances in institutions across various jurisdictions, primarily denominated in U.S. dollars. We currently do not expect to incur any material liability in connection with any repatriation of earnings from foreign subsidiaries.
19
OTHER FINANCIAL INFORMATION
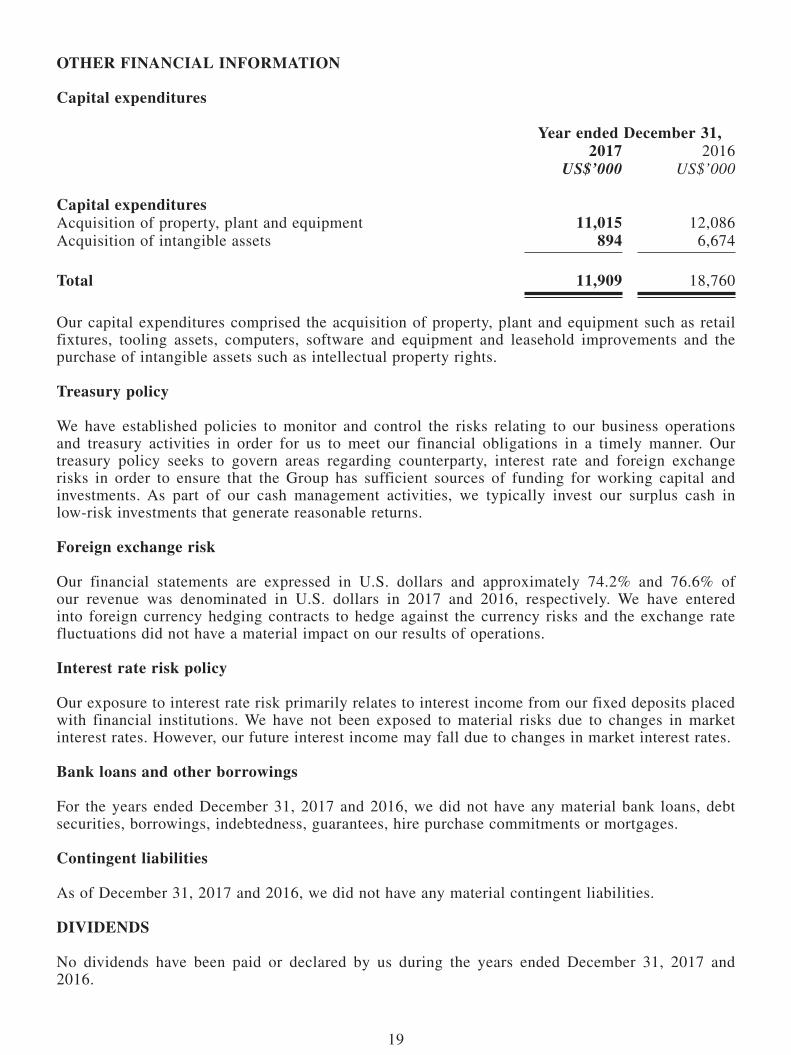
Capital expenditures
Year ended December 31,2017 2016
US$’000 US$’000
Capital expendituresAcquisition of property, plant and equipment 11,015 12,086Acquisition of intangible assets 894 6,674
Total 11,909 18,760
Our capital expenditures comprised the acquisition of property, plant and equipment such as retail fixtures, tooling assets, computers, software and equipment and leasehold improvements and the purchase of intangible assets such as intellectual property rights.
Treasury policy
We have established policies to monitor and control the risks relating to our business operations and treasury activities in order for us to meet our financial obligations in a timely manner. Our treasury policy seeks to govern areas regarding counterparty, interest rate and foreign exchange risks in order to ensure that the Group has sufficient sources of funding for working capital and investments. As part of our cash management activities, we typically invest our surplus cash in low-risk investments that generate reasonable returns.
Foreign exchange risk
Our financial statements are expressed in U.S. dollars and approximately 74.2% and 76.6% of our revenue was denominated in U.S. dollars in 2017 and 2016, respectively. We have entered into foreign currency hedging contracts to hedge against the currency risks and the exchange rate fluctuations did not have a material impact on our results of operations.
Interest rate risk policy
Our exposure to interest rate risk primarily relates to interest income from our fixed deposits placed with financial institutions. We have not been exposed to material risks due to changes in market interest rates. However, our future interest income may fall due to changes in market interest rates.
Bank loans and other borrowings
For the years ended December 31, 2017 and 2016, we did not have any material bank loans, debt securities, borrowings, indebtedness, guarantees, hire purchase commitments or mortgages.
Contingent liabilities
As of December 31, 2017 and 2016, we did not have any material contingent liabilities.
DIVIDENDS
No dividends have been paid or declared by us during the years ended December 31, 2017 and 2016.

20
FINANCIAL INFORMATION
Consolidated statement of profit or loss and other comprehensive income for the year ended December 31, 2017(Expressed in United States dollars)
Note 2017 2016US$’000 US$’000
Revenue 4 517,937 392,099
Cost of sales (366,912) (282,648)
Gross profit 151,025 109,451
Selling and marketing expenses (90,041) (69,993)Research and development expenses (80,809) (52,175)General and administrative expenses (143,589) (49,606)Impairment of goodwill – (805)
Loss from operations (163,414) (63,128)
Other non-operating expenses (3,147) (653)
Finance income 1,985 525Finance costs (9) (14)
Loss before income tax 6 (164,585) (63,270)
Income tax (expense)/benefit 7 (1,254) 3,654
Loss for the year (165,839) (59,616)

21
Note 2017 2016US$’000 US$’000
Loss for the year (165,839) (59,616)
Other comprehensive income for the year, net of nil tax unless specified
Items that may be reclassified subsequently to profit or loss:
Foreign currency translation differences – foreign operations 209 (80)Net change in fair value of available-for-sale investments 753 –
Other comprehensive income for the year 962 (80)
Total comprehensive income for the year (164,877) (59,696)
Loss attributable to:
Equity shareholders of the Company (164,020) (59,332)Non-controlling interests (1,819) (284)
Loss for the year (165,839) (59,616)
Total comprehensive income attributable to:
Equity shareholders of the Company (163,058) (59,412)Non-controlling interests (1,819) (284)
Total comprehensive income for the year (164,877) (59,696)
Loss per share 8
Basic US$ (0.03) US$ (0.01)
Diluted US$ (0.03) US$ (0.01)

22
Consolidated statement of financial position at December 31, 2017(Expressed in United States dollars)
NoteDecember 31,
2017December 31,
2016US$’000 US$’000
Non-current assets
Property, plant and equipment 15,937 14,334Intangible assets and goodwill 32,006 24,086Available-for-sale investments 10 20,250 –Deferred tax assets 22,150 11,054Restricted cash 1,635 1,589Other receivables 9 1,451 1,659
93,429 52,722
Current assets
Inventories 41,428 27,519Trade and other receivables 9 125,683 100,993Forward exchange contracts – 16Prepayments 2,914 3,901Current tax receivables 413 –Available-for-sale investments 10 1,753 –Restricted cash 210 200Cash and bank balances 11 739,433 131,129
911,834 263,758
TOTAL ASSETS 1,005,263 316,480
Current liabilities
Trade and other payables 12 215,616 160,759Forward exchange contracts – 8Deferred revenue 1,628 433Finance leases 48 108Current tax payables 674 3,468
217,966 164,776
Net current assets 693,868 98,982
Total assets less current liabilities 787,297 151,704

23
NoteDecember 31,
2017December 31,
2016US$’000 US$’000
Non-current liabilities
Deferred tax liabilities 60 106Deferred revenue 4 6Other payables 12 1,613 537Other tax liabilities 2,217 2,796Finance leases 27 71
3,921 3,516
NET ASSETS 783,376 148,188
Capital and reserves
Share capital 14 90,225 8Share premium 725,125 187,211Reserves (33,742) (42,618)
Total equity attributable to equity shareholders of the Company 781,608 144,601
Non-controlling interests 1,768 3,587
TOTAL EqUITY 783,376 148,188

24
Con
soli
dat
ed s
tate
men
t of
ch
ange
s in
eq
uit
y fo
r th
e ye
ar e
nded
Dec
embe
r 31
, 20
17(E
xpre
ssed
in
Uni
ted
Stat
es d
olla
rs)
Attri
butab
le to
equi
ty sh
areh
olde
rs of
the C
ompa
ny
Note
Shar
e ca
pital
Shar
e pr
emiu
mM
erge
r re
serv
e
Fore
ign
curre
ncy
trans
latio
n re
serv
e
Rese
rve f
or
treas
ury
shar
es
Shar
e-ba
sed
paym
ents
rese
rve
Retai
ned
Prof
its/
(Acc
umul
ated
loss
es)
Total
Non-
cont
rolli
ng
inter
ests
Total
eq
uity
US$’
000
US$’
000
US$’
000
US$’
000
US$’
000
US$’
000
US$’
000
US$’
000
US$’
000
US$’
000
Bala
nce a
t Jan
uary
1, 2
016
856
,451
(4,0
00)
(109
)(5
,499
)5,
794
26,7
3979
,384
–79
,384
Chan
ges i
n eq
uity
for 2
016:
Lo
ss fo
r the
yea
r–
––
––
–(5
9,33
2)(5
9,33
2)(2
84)
(59,
616)
Ot
her c
ompr
ehen
sive i
ncom
e–
––
(80)
––
–(8
0)–
(80)
Total
com
preh
ensiv
e inc
ome
––
–(8
0)–
–(5
9,33
2)(5
9,41
2)(2
84)
(59,
696)
Issua
nce o
f ord
inar
y sh
ares
,
as p
art o
f bus
ines
s com
bina
tions
–8,
823
––
––
–8,
823
–8,
823
Non-
cont
rolli
ng in
teres
ts co
ntrib
utio
n
relat
ed to
bus
ines
s com
bina
tions
––
––
––
––
3,87
13,
871
Issua
nce o
f ord
inar
y sh
ares
–1,
100
––
––
–1,
100
–1,
100
Issua
nce o
f Ser
ies C
conv
ertib
le
pref
eren
ce sh
ares
–12
1,15
8–
––
––
121,
158
–12
1,15
8Re
purc
hase
of o
rdin
ary
and
co
nver
tible
pref
eren
ce sh
ares
––
––
(45,
000)
––
(45,
000)
–(4
5,00
0)Re
tirem
ent o
f tre
asur
y sh
ares
–(3
21)
––
321
––
––
–Sh
are-
base
d co
mpe
nsati
on ex
pens
e–
––
––
38,5
48–
38,5
48–
38,5
48
Bala
nce a
t Dec
embe
r 31,
2016
818
7,21
1(4
,000
)(1
89)
(50,
178)
44,3
42(3
2,59
3)14
4,60
13,
587
148,
188

Attri
butab
le to
equit
y sha
reho
lders
of th
e Com
pany
Note
Shar
e ca
pital
Shar
e pr
emium
Mer
ger
reser
ve
Fore
igncu
rren
cytra
nslat
ionre
serve
Fair
value
reser
ve
Reser
ve fortre
asur
ysh
ares
Shar
e-bas
edpa
ymen
tre
serve
Accu
mulat
edlos
sesTo
tal
Non-
cont
rolli
ngint
erest
sTo
taleq
uity
US$’
000
US$’
000
US$’
000
US$’
000
US$’
000
US$’
000
US$’
000
US$’
000
US$’
000
US$’
000
US$’
000
Balan
ce at
Janu
ary 1
, 201
78
187,2
11(4,
000)
(189)
–(50
,178)
44,34
2(32
,593)
144,6
013,5
8714
8,188
Chan
ges i
n equ
ity fo
r 201
7:
Loss
for t
he ye
ar–
––
––
––
(164,0
20)
(164,0
20)
(1,81
9)(16
5,839
)
Othe
r com
preh
ensiv
e inc
ome
––
–20
975
3–
––
962
–96
2
Total
comp
rehen
sive i
ncom
e–
––
209
753
––
(164,0
20)
(163,0
58)
(1,81
9)(16
4,877
)
Issua
nce o
f ord
inary
share
s befo
re
initia
l pub
lic of
fering
(“IP
O”),
as
part
of bu
sines
s com
binati
ons
–9,7
49–
––
––
–9,7
49–
9,749
Issua
nce o
f ord
inary
share
s befo
re
IPO,
as pa
rt of
inve
stmen
t in
eq
uity s
ecur
ities
–19
,900
––
––
––
19,90
0–
19,90
0Iss
uanc
e of S
eries
D co
nvert
ible
pr
eferen
ce sh
ares
–43
,339
––
––
––
43,33
9–
43,33
9Re
tirem
ent o
f trea
sury
share
s–
(50,17
8)–
––
50,17
8–
––
––
Share
-bas
ed co
mpen
satio
n exp
ense
13–
––
––
–12
8,837
–12
8,837
–12
8,837
Effec
t of c
apita
lisati
on is
sue
70,80
2(70
,802)
––
––
––
––
–Iss
uanc
e of o
rdina
ry sh
ares
to
RSU
truste
e7,0
81–
––
–(7,
081)
––
––
–Iss
uanc
e of o
rdina
ry sh
ares
aft
er IP
O, as
part
of
pre-I
PO bu
sines
s com
binati
ons
103
4,997
––
––
––
5,100
–5,1
00Iss
uanc
e of o
rdina
ry sh
ares u
nder
IP
O, ne
t of s
hare
issua
nce e
xpen
ses
12,23
158
0,909
––
––
––
593,1
40–
593,1
40
Balan
ce at
Dec
embe
r 31,
2017
90,22
572
5,125
(4,00
0)20
753
(7,08
1)17
3,179
(196,6
13)
781,6
081,7
6878
3,376
25
26
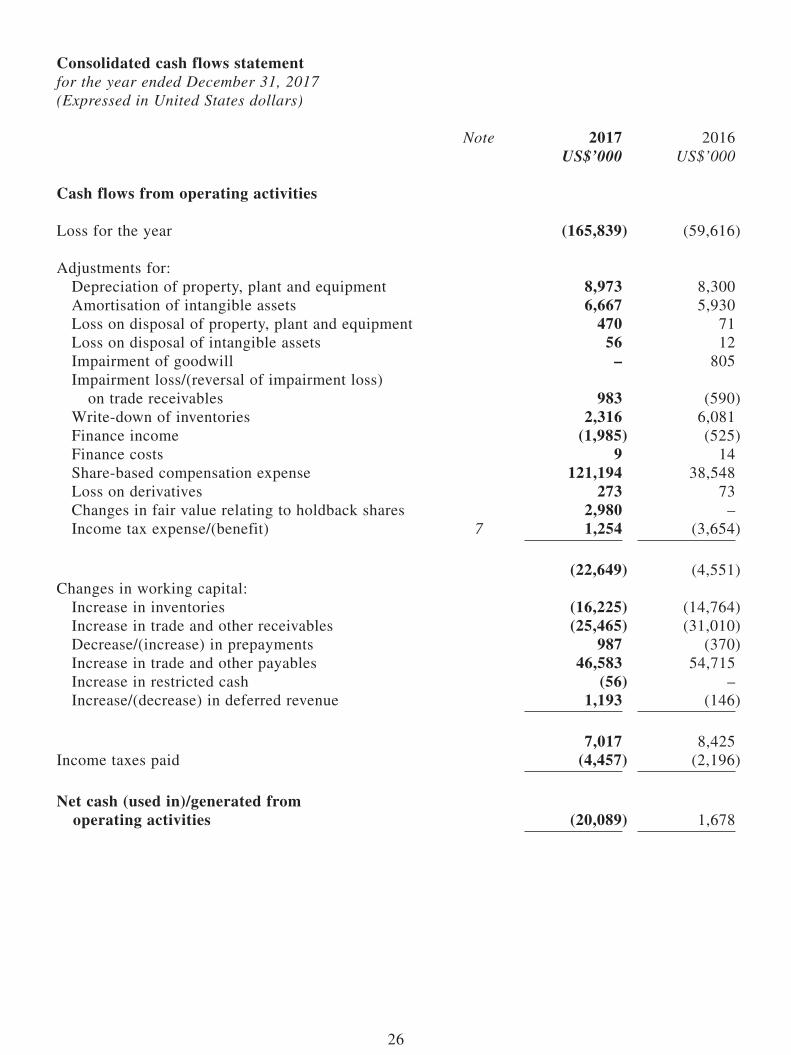
Consolidated cash flows statement for the year ended December 31, 2017(Expressed in United States dollars)
Note 2017 2016US$’000 US$’000
Cash flows from operating activities
Loss for the year (165,839) (59,616)
Adjustments for:Depreciation of property, plant and equipment 8,973 8,300Amortisation of intangible assets 6,667 5,930Loss on disposal of property, plant and equipment 470 71Loss on disposal of intangible assets 56 12Impairment of goodwill – 805Impairment loss/(reversal of impairment loss) on trade receivables 983 (590)Write-down of inventories 2,316 6,081Finance income (1,985) (525)Finance costs 9 14Share-based compensation expense 121,194 38,548Loss on derivatives 273 73Changes in fair value relating to holdback shares 2,980 –Income tax expense/(benefit) 7 1,254 (3,654)
(22,649) (4,551)Changes in working capital:
Increase in inventories (16,225) (14,764)Increase in trade and other receivables (25,465) (31,010)Decrease/(increase) in prepayments 987 (370)Increase in trade and other payables 46,583 54,715Increase in restricted cash (56) –Increase/(decrease) in deferred revenue 1,193 (146)
7,017 8,425Income taxes paid (4,457) (2,196)
Net cash (used in)/generated from operating activities (20,089) 1,678

27
Note 2017 2016US$’000 US$’000
Cash flows from investing activitiesInterest received 1,985 525Acquisition of property, plant and equipment (11,015) (12,086)Acquisition of intangible assets (894) (6,674)Increase in short-term fixed deposits (20,184) (10,000)Investment in available-for-sale equity securities (1,350) –Acquisition of subsidiaries, net of cash assumed – (4,125)
Net cash used in investing activities (31,458) (32,360)
Cash flows from financing activitiesInterest paid (9) (14)Issuance of ordinary shares and convertible preference shares before IPO 43,339 122,258Repurchase of ordinary shares and convertible preference shares – (45,000)Repayment of finance lease liability (104) (110)Payment of issuance costs of ordinary shares under IPO (11,999) –Proceeds from issuance of ordinary shares under IPO 608,263 –
Net cash generated from financing activities 639,490 77,134
Net increase in cash and cash equivalents 587,943 46,452Cash and cash equivalents at January 1 11 121,129 74,731Effect of exchange rate fluctuations on cash and cash equivalents 177 (54)
Cash and cash equivalents at December 31 11 709,249 121,129
During the year ended December 31, 2017, the Group issued 5,611 ordinary shares as the consideration for the acquisition of the business of Nextbit.
During the year ended December 31, 2017, the Group issued 8,634 ordinary shares in exchange for 19.9% of equity interest in MOL Global.
During the year ended December 31, 2017, the Group issued holdback shares of 10,251,660 shares after taking into account the capitalisation issue, to settle the consideration for the business acquisition from SST.
During the year ended December 31, 2016, the Group issued 5,078 ordinary shares as part of the consideration transferred for the business acquisition from SST.

28
NOTES TO THE FINANCIAL STATEMENTS
1 GENERAL INFORMATION
Razer Inc. (“the Company”) is a company incorporated in the Cayman Islands with limited liability. The address of the Company’s registered office is P.O. Box 309, Ugland House, Grand Cayman, KY1-1104, Cayman Islands. The dual global headquarters and principal places of business of the Company are located at 201 3rd Street, Suite 900, San Francisco, CA 94103, the United States of America and 514 Chai Chee Lane, #07-05, Singapore 469029.
The Company’s shares have been listed on the Main Board of The Stock Exchange of Hong Kong Limited since November 13, 2017 by way of its IPO.
The Company is an investment holding company. The principal activities of the Company and its subsidiaries (together “the Group”) are those relating to the design, manufacture, distribution, research and development of gaming peripherals, systems, software, services, mobiles and accessories.
The consolidated financial statements for the year ended December 31, 2017 comprise the Company and its subsidiaries.
2 BASIS OF PREPARATION
The consolidated results set out in this announcement do not constitute the consolidated financial statements of the Group for the year ended December 31, 2017, but are extracted from those consolidated financial statements.
The consolidated financial statements have been prepared in accordance with the IFRSs which collective term includes all applicable individual International Financial Reporting Standards, International Accounting Standards and Interpretations issued by the International Accounting Standards Board (“IASB”) and the disclosure requirements of the Hong Kong Companies Ordinance. These financial statements also comply with the applicable disclosure provisions of the Rules Governing the Listing of Securities on The Stock Exchange of Hong Kong Limited.
3 ACCOUNTING POLICIES
IASB has issued certain new and revised IFRSs that are first effective or available for early adoption for the current accounting period of the Group; however, the Group has not early applied the following new or amended standards in preparing these consolidated financial statements. The new and revised accounting standards and interpretations issued that will be effective for the accounting period beginning on or after January 1, 2018 are set out below.
Effective for accounting periods
beginning on or after
IFRS 9, Financial instruments January 1, 2018
IFRS 15, Revenue from contracts with customers January 1, 2018
IFRIC 22, Foreign Currency Transactions and Advance Consideration January 1, 2018
Amendments to IFRS 1, First-time Adoption of International Financial Reporting Standards (Annual Improvements to IFRS Standards 2014-2016 Cycle) January 1, 2018
Amendments to IFRS 2, Share-based Payment: Classification and Measurement of Share-based Payment Transactions January 1, 2018
IFRS 16, Leases January 1, 2019
IFRIC 23, Uncertainty over Income Tax Treatments January 1, 2019
Amendments to IFRS 10, Consolidated Financial Statements and IAS 28, Investments in Associates and Joint Ventures: Sale or Contribution of Assets between an Investor and its Associate or Joint Venture
Date yet to be confirmed

29
The Group is in the process of making an assessment of what the impact of these amendments and new standards is expected to be in the period of initial application. So far the Group has identified some aspects of the new standards which may have an impact on these financial statements. While the assessment has been substantially completed for IFRS 9 and IFRS 15, the actual impacts upon the initial adoption of the standards may differ as the assessment completed to date is based on the information currently available to the Group, and further impacts may be identified before the standards are initially adopted in the Group’s interim financial report for the six months ending June 30, 2018. The Group may also change its accounting policy elections, including the transition options, until the standards are initially applied in that financial report.
4 REVENUE
2017 2016US$’000 US$’000
Sales of goods 510,540 390,303Royalty income 5,851 1,569Others 1,546 227
Total 517,937 392,099
5 SEGMENT INFORMATION
The Group has four reportable segments, as described below, which are the Group’s business units. The business units offer different products and services, and are managed separately because they require different technology and marketing strategies.
The Chief Operating Decision Maker (“CODM”) of the Group periodically reviews and makes operating decisions, manages the growth and profitability of the business using the below segment reporting structure based on product lines:
• Peripherals primarily consists of gaming mice, keyboards, audio devices and mouse mats developed, marketed and sold;
• Systems consists of laptops developed, marketed and sold;
• Software and Services primarily consists of provision of software over the Razer Software Platform and zGold virtual credits service; and
• Others primarily consists of new products and services which are in the development or early marketing phase including the Razer Phone and recently acquired business such as THX.
Information regarding the results of each reportable segment is included below. Performance is measured based on segment gross profit, as included in the internal management reports that are reviewed by the CODM. The CODM does not evaluate operating segments using asset information.

30
Peripherals Systems
Software and
Services Others TotalUS$’000 US$’000 US$’000 US$’000 US$’000
2017
Revenue 338,717 137,001 10,604 31,615 517,937Depreciation and amortisation (4,893) (7,407) (1,035) (2,305) (15,640)Gross profit 120,301 11,990 10,454 8,280 151,025
2016
Revenue 298,626 90,697 95 2,681 392,099Depreciation and amortisation (4,902) (8,610) (597) (121) (14,230)Gross profit 105,478 2,617 81 1,275 109,451
Revenue from customers that account for 10% or more of the Group’s revenue during the respective years is as follows:
2017 2016US$’000 US$’000
Customer A –* 42,721Customer B 60,743 –*
* Revenue from the customers accounted for less than 10% of the Group’s revenue.
The following table presents a summary of revenue by region based on the location of customers and the amounts of non-current assets based on the location of the asset. The Group geographically categorises a sale based on the region to which the customer resides in.
Revenue by regions were as follows:
2017 2016US$’000 US$’000
Americas^ 240,825 196,661EMEA 151,466 105,712Asia Pacific excluding China# 65,471 39,977China 60,175 49,749
Total revenue 517,937 392,099
Non-current assets* by regions were as follows:
2017 2016US$’000 US$’000
Americas^ 20,326 20,988EMEA 119 131Asia Pacific excluding China# 19,472 9,805China 8,026 7,496
Total non-current assets* 47,943 38,420

31
Disclosures on significant revenue and non-current assets by country are separately disclosed below.
^ Revenue from Americas region includes revenue from the U.S. of US$223,499,000 for the year ended December 31, 2017 (2016:
US$180,878,000). Non-current assets at Americas region includes non-current assets at U.S. of US$20,326,000 as at December 31,
2017 (2016: US$20,988,000).
# Revenue from Asia Pacific region includes revenue from Singapore of US$11,149,000 for the year ended December 31, 2017 (2016:
US$7,010,000). Non-current assets at Asia Pacific region includes non-current assets at Singapore of US$17,092,000 as at December
31, 2017 (2016: US$9,536,000).
* Non-current assets presented consist of property, plant and equipment, intangible assets and goodwill.
6 LOSS BEFORE INCOME TAx
The following items have been included in arriving at loss before income tax:
2017 2016US$’000 US$’000
Auditors’ remuneration– Audit services 706 466– Other services 1,360 160Impairment of goodwill – 805Operating lease expense 4,219 3,733Exchange gain (318) (573)Staff costs:– Salaries and other benefits 63,848 44,598– Contributions to defined contribution plans# 3,730 3,134– Share-based compensation expense 119,321 36,357
# The Group’s subsidiaries in Singapore participate in a defined contribution scheme which is administered by the Central Provident
Fund (“CPF”) Board in Singapore. Employees who are Singapore citizens and Singapore Permanent Residents and their employers
are required to make mandatory contributions to CPF at the prevailing CPF contribution rates, subjected to a cap of monthly income
of SGD 6,000 per employee.
Contributions to the defined contributions schemes of other countries are at various funding rates that are in accordance with the
local practices and regulations. Contributions relating to the defined contribution schemes are charged to profit or loss as incurred.
Contributions to the defined contribution plans vest immediately. Other than the mandatory contributions made by the Group
under the respective defined contribution plans, the Group has no further obligations for the actual pension payments or any post-
retirement benefits.

32
7 INCOME TAx ExPENSE/(BENEFIT)
2017 2016US$’000 US$’000
Current tax expenseCurrent year 2,127 3,669
Deferred tax expenseOrigination and reversal of temporary differences (5,307) (7,361)Other deferred charges 4,434 38
(873) (7,323)
Total income tax expense/(benefit) 1,254 (3,654)
During the year ended December 31, 2017, a tax benefit of US$10,269,000 related to share-based compensation was recognised in equity. There were no income tax expense/(benefit) recognised in other comprehensive income or directly in equity during the year ended December 31, 2016.
On December 22, 2017, a new corporate tax law was enacted in the U.S. This new tax law permanently reduces the U.S. corporate income tax rate from 34% to 21% effective for tax years including or commencing on January 1, 2018. This change resulted in US$4,434,000 expense related to the re-measurement of deferred tax assets and liabilities of the Group’s U.S. subsidiaries being recognised in 2017.

33
2017 2016US$’000 US$’000
Reconciliation of effective tax rateLoss before income tax (164,585) (63,270)
Income tax using Singapore tax rate of 17% (27,979) (10,756)Effect of different tax rate in foreign jurisdictions (937) (1,714)Non-deductible expenses 6,479 2,372Current year losses for which no deferred tax asset was recognised 9,883 5,767Tax incentives 8,970 390Effect of re-measurement of temporary differences of the Group’s U.S. subsidiaries 4,434 –Others 404 287
Total income tax expense/(benefit) 1,254 (3,654)
Tax incentives
A subsidiary, Razer (Asia-Pacific) Pte. Ltd. was awarded the Development and Expansion Incentive under the International Headquarters Award (the “Incentive”) by the Ministry of Trade & Industry (“MTI”) on July 30, 2012. The income arising from the qualifying activities in excess of US$2,036,000 (equivalent to SGD2,699,000) is taxed at a concessionary rate from October 1, 2011 to September 30, 2018, subject to the subsidiary meeting the conditions of the award. Income arising from activities not covered under the Incentive is taxed at the prevailing Singapore corporate tax rate.
8 LOSS PER SHARE
(a) Basic loss per share
The calculation of basic loss per share was based on the loss attributable to equity shareholders of the Company of US$164,020,000 (2016: loss of US$59,332,000) divided by the weighted average of ordinary shares of 5,346,307,237 shares (2016: 5,037,716,492 shares after adjusting for the capitalisation issue (note 14)) in issue during the year.
Weighted average number of ordinary shares:
2017 2016Number of
sharesNumber of
shares
Issued ordinary shares at the beginning of the year 627,207 656,572Effect of treasury shares (51,289) (57,587)Effect of purchase of treasury shares – (767)Effect of shares issued related to business combinations 1,381,393 1,270Effect of shares issued related to investments in equity securities 5,396 –Effect of shares issued in exchange of services – 26Effect of conversion of convertible preference shares to ordinary shares 31,272 –Effect of capitalisation issue 5,190,164,107 5,037,116,978Effect of shares issued upon IPO 154,149,151 –
Weighted average number of ordinary shares at end of the year 5,346,307,237 5,037,716,492

34
(b) Diluted loss per share
During the years ended December 31, 2017 and 2016, the conversion of all potential ordinary shares outstanding would have an anti-dilutive effect on the loss per share. Accordingly, the diluted loss per share is the same as basic loss per share.
9 TRADE AND OTHER RECEIVABLES
The Group usually grants credit terms ranging from 30 days to 60 days following the invoice date. The ageing of trade and other receivables by due date of the respective invoices at the reporting date is:
2017 2016
GrossImpairment
losses GrossImpairment
lossesUS$’000 US$’000 US$’000 US$’000
Neither past due nor impaired 114,884 – 88,353 –Past due 1-30 days 10,817 – 9,650 –Past due 31-60 days 951 – 1,828 –Past due 61-90 days 179 (2) 525 –More than 90 days 2,059 (1,754) 3,212 (916)
Trade and other receivables 128,890 (1,756) 103,568 (916)
10 AVAILABLE-FOR-SALE INVESTMENTS
2017 2016US$’000 US$’000
Equity security (quoted) – current 1,753 –Equity security (unquoted) – non-current 20,250 –
22,003 –
During the year ended December 31, 2017, the Group acquired 19.9% of unquoted issued share capital of MOL Global in exchange for 8,634 ordinary shares of the Company with an estimated fair value US$19,900,000.
11 CASH AND BANK BALANCES
2017 2016US$’000 US$’000
Cash at bank and in hand 645,938 37,686Fixed deposits and money market funds 63,311 83,443
Cash and cash equivalents in the consolidated cash flows statement 709,249 121,129Short-term fixed deposits 30,184 10,000
Cash and bank balances in the consolidated statement of financial position 739,433 131,129
The effective interest rate relating to fixed deposits at the reporting date for the Group ranges from 0.4% to 1.60% per annum (2016: 0.1% to 1.17%). Interest rates are repriced at monthly intervals.
As at December 31, 2017, the short-term fixed deposits of US$30,184,000 (2016: US$10,000,000) are bank deposits with original maturities over three months and redeemable on maturity. The short-term fixed deposits are denominated in US$ and the weighted average effective interest rate is 1.59% (2016: 1.17%).

35
12 TRADE AND OTHER PAYABLES
The ageing analysis of trade payables, based on due date, is as follows:
2017 2016US$’000 US$’000
Up to 3 months 149,372 122,938Over 3 months but within 6 months 139 38Over 6 months but within 12 months 532 64Over 12 months 367 191
150,410 123,231
13 SHARE-BASED COMPENSATION ExPENSE
The Group has the following share-based payment arrangements:
Restricted Stock Units
On August 23, 2016, the Company’s shareholders approved the 2016 Equity Incentive Plan, which is a share-based incentive plan designed to reward, retain and motivate the Group’s employees. The RSUs were granted to certain employees, consultants and the Company’s directors in 2016. Each RSU will entitle the holder to one ordinary share of the Company.
RSUs granted to employees and consultants shall vest upon the satisfaction of both a service condition and a liquidity condition. The service condition for these awards is satisfied over four tranches and becomes exercisable at the rate of 25% over four tranches. The liquidity condition is satisfied upon the occurrence of a qualifying event, defined as a change of control transaction or six months following the completion of the Company’s IPO. Under the settlement procedures applicable to these awards, the Group is permitted to deliver the underlying shares within 30 days before or after the date on which the liquidity condition is satisfied. For accounting purposes, the liquidity condition is considered a non-market performance vesting condition which is taken into consideration in estimating the number of RSUs that are expected to vest.
Share-based compensation expense relating to awards granted to employees is recognised on a graded acceleration vesting amortisation method over the applicable service period. Share-based compensation expense relating to awards granted to consultants are recognised on a straight-line basis over the four tranches.
RSUs granted to the Company’s directors are not subject to a liquidity condition in order to vest and the service condition for this award is satisfied over four tranches and becomes exercisable at the rate of 25% over four tranches. Compensation expense related to these grants is based on the grant date fair value of the RSUs and is recognised on a graded acceleration vesting amortisation method over the four tranches.
For grants awarded prior to the IPO, the grant date fair value is based on the price of recent investments in the Company by third-party investors. For grants awarded after the IPO, the grant date fair value is based on the closing price of the Company’s shares as of the grant date. The number of RSUs granted during 2017 was 213,226,125 after adjusted for capitalisation issue (note 14). The number of RSUs granted during 2016 was 61,861 (519,817,983 after capitalisation issue). The weighted average grant date fair value of RSUs granted during 2017 was US$0.38 per share after adjusted for capitalisation issue. The weighted average grant date fair value of RSUs granted during 2016 was US$1,737.34 per share (US$0.21 per share after capitalisation issue).

36
14 CAPITAL AND RESERVES
Share capital
2017 2016No. of shares Amount No. of shares Amount
US$’000 US$’000
Authorised:At January 1 4,000,000 40 4,000,000 40Increase of authorised ordinary shares 9,996,000,000 99,960 – –
Ordinary shares 10,000,000,000 100,000 4,000,000 40
Ordinary shares, issued and fully paidAt January 1 627,207 6 656,572 6Issued in business combinations before IPO and capitalisation issue 5,611 – 5,078 –Issued for equity securities before IPO and capitalisation issue 8,634 – – –Issued in exchange for services before IPO and capitalisation issue – – 633 –Retirement of treasury shares (31,713) – (35,076) –Conversion of convertible preference shares to ordinary shares after IPO 232,944 2 – –Effect of capitalisation issue# 7,080,222,566 70,802 – –Issuance of ordinary shares to RSU Trustee after IPO 708,104,004 7,081 – –Issued in pre-IPO business combinations after IPO 10,251,660 103 – –Issuance of ordinary shares under IPO 1,223,140,000 12,231 – –
At December 31 9,022,560,913 90,225 627,207 6
Convertible preference sharesAt January 1 233,716 2 161,771 2Issuance of shares before IPO and capitalisation issue 18,804 – 71,945 –Retirement of treasury shares (19,576) – – –Conversion of convertible preference shares to ordinary shares after IPO (232,944) (2) – –
At December 31 – – 233,716 2
# Capitalisation issue: On October 25, 2017, the Company’s shareholders resolved, among other things that, subject to the completion of IPO and fulfilment of certain other conditions, all the issued and unissued preferred shares will be re-classified and re-designated as ordinary shares of US$0.01 par value each, following which each issued and unissued ordinary share of US$0.01 par value each of the Company will be subdivided into 8,403 shares of US$0.01 par value each such that the authorised share capital of the Company shall be US$100,000,000 divided into 10,000,000,000 shares of par value US$0.01 each and the issued share capital (including those preferred shares to be re-classified and re-designated as ordinary shares on the listing date) shall be US$70,810,000 divided into 7,081,065,249 shares of US$0.01 par value each.
15 SUBSEqUENT EVENTS
On February 8, 2018, the Group entered into a share purchase agreement to purchase additional 10,125,670 shares in MOL Global representing approximately 15.0% of the total issued share capital of MOL Global as at the date of the share purchase agreement. The total consideration paid under the share purchase agreement amounted to US$15,000,000. Upon completion of this investment, the Group holds approximately 34.9% equity interest in MOL Global and will account for this investment as an associate based on equity accounting.

37
OTHER INFORMATION
Acquisition of shares of MOL Global
As disclosed in the Company’s announcement dated February 8, 2018, the Group acquired 10,125,670 additional ordinary shares in the capital of MOL Global (the “Acquisition”). Following the Acquisition, the Group holds approximately 34.9% of the total issued share capital in MOL Global and is the single largest shareholder of MOL Global, which enables the Group to gain further access to MOL Global’s network of content, customers and partners throughout emerging markets. The Board believes that the Acquisition will also allow the Group to further expand the existing partnership with MOL Global beyond virtual credits into areas such as e-payment and digital wallet solutions.
Purchase, Sale or Redemption of the Company’s Listed Securities
The shares of the Company were listed on the Main Board of the Stock Exchange on the Listing Date.
Since the Listing Date and up to December 31, 2017, neither the Company nor any of its subsidiaries has purchased, sold or redeemed any of the Company’s listed securities.
Compliance With the Corporate Governance Code
The Company has adopted and applied the principles as set out in the CG Code.
The Board is of the view that since the Listing Date and up to December 31, 2017, the Company has complied with all the applicable code provisions as set out in the CG Code, except for code provisions A.2.1, A.5.6 and A.6.4.
Mr. Min-Liang Tan is both the Chairman and the Chief Executive Officer of the Company. Mr. Min-Liang Tan, a co-founder and an executive Director of the Company, has served as the Chief Executive Officer since September 2006 and was appointed the Chairman of the Board in June 2017. This is a deviation from code provision A.2.1 which requires that the roles of chairman and chief executive officer should be separate and should not be performed by the same individual.
The Board believes that Mr. Min-Liang Tan should continue to assume the responsibilities of the Chief Executive Officer of the Company and Chairman of the Board as this arrangement will improve the efficiency of the decision-making and execution process of the Company. The Company has put in place an appropriate check-and-balance mechanism through the Board and the independent non-executive Directors. In light of the above, the Board considers that the deviation from code provision A.2.1 of the Corporate Governance Code is appropriate in the circumstances of the Company.
Code provision A.5.6 provides that the nomination committee (or the board) should have a policy concerning diversity of board members, and should disclose the policy or a summary of the policy in the corporate governance report. Although a policy on the diversity of the board members has not been formally adopted, the Board considers that the Company’s existing practices (including the role of the Nomination Committee) have due regard for the benefits of diversity on the Board. Board appointments have been, and will continue to be, made based on attributes that complement and expand the skill set, experience and expertise of the Board as a whole, taking into account factors such as age, professional experience, qualifications, cultural and educational background, and any other factors that the Board and the Nomination Committee may consider relevant to the Company’s strategy, governance and business and that contribute to the Board’s effectiveness. The Board and the Nomination Committee review and monitor, from time to time, the effectiveness and application of these factors.

38
Code provision A.6.4 provides that the Board should establish written guidelines no less exacting than the Model Code for relevant employees in respect of their dealings in the issuer’s securities. The Company has adopted written guidelines for relevant employees in respect of prohibitions of dealings in the Company’s securities under part A of the Model Code by relevant employees since the Listing Date. The Board has also approved the written guidelines for the procedure of notification under part B of the Model Code.
Audit and Risk Management Committee
The Audit and Risk Management Committee of the Company has met and reviewed the results and the consolidated financial statements of the Group for the year ended December 31, 2017 prior to recommending them to the Board for approval.
Auditor’s Procedures Performed on this Results Announcement
The financial figures in respect of Group’s consolidated statement of profit or loss and other comprehensive income, consolidated statement of financial position, consolidated statement of changes in equity and consolidated cash flows statement and the related notes thereto for the year ended December 31, 2017 as set out in the preliminary announcement have been compared by the Group’s auditor, KPMG, Certified Public Accountants, to the amounts set out in the Group’s audited consolidated financial statements for the year and the amounts were found to be in agreement. The work performed by KPMG in this respect did not constitute an audit, review or other assurance engagement in accordance with Hong Kong Standards on Auditing, Hong Kong Standards on Review Engagements or Hong Kong Standards on Assurance Engagements issued by the Hong Kong Institute of Certified Public Accountants and consequently no assurance has been expressed by the auditor.
Dividends
The Board does not recommend the payment of any dividend for the year ended December 31, 2017.
Use of Proceeds from the Initial Public Offering
As at December 31, 2017, we received net proceeds of approximately US$596 million in connection with the initial public offering.
We intend to apply the net proceeds from the initial public offering for the purposes as set out in the Prospectus. As at December 31, 2017, the net proceeds have not been used and have been held in accordance with our treasury policies as further described in the section headed “Management Discussion and Analysis” above.
Publication of Annual Results and Annual Report
This annual results announcement is published on the website of the Stock Exchange at www.hkexnews.hk and the website of the Company at www.razerzone.com. The annual report of the Group for the year ended December 31, 2017 will be published on the aforesaid websites of the Stock Exchange and the Company and will be dispatched to the Company’s shareholders in due course.

39
Information about the Company
The Company is a leading global lifestyle brand for gamers that offers an integrated portfolio of gaming hardware, software and services designed and developed to integrate seamlessly and enhance personalised user experiences across different entertainment genres.
DEFINITIONS AND GLOSSARY OF TECHNICAL TERMS
In this announcement, unless the context otherwise requires, the following expressions shall have the following meaning:
“2016 Equity Incentive Plan”
the 2016 Equity Incentive Plan approved by the Board on July 25, 2016 and the Company’s shareholders on August 23, 2016 (and subsequently amended by the Board and the Company’s shareholders on October 25, 2017) for the grant of, among others, RSUs to eligible participants
“Board” the board of directors of the Company
“CAGR” compound annual growth rate
“CG Code” the Corporate Governance Code as set out in Appendix 14 to the Listing Rules
“China” the People’s Republic of China, which for the purpose of this announcement and for geographical reference only, excludes Hong Kong, Macau and Taiwan
“Company” or “Razer” Razer Inc., an exempted company incorporated in the Cayman Islands with limited liability, the shares of which are listed on the Main Board of the Stock Exchange (stock code: 1337)
“Director(s)” director(s) of the Company
“EBITDA” Earnings before interest, taxes, depreciation and amortisation
“EMEA” Europe, the Middle East and Africa
“esports” professional competitive gaming
“GAAP” Generally Accepted Accounting Principles
“gamers” individuals who play games across any platform
“games” games played primarily on personal computers, mobile devices and consoles
“gaming system” personal computers, both desktops and laptops, that have been purchased primarily with playing games in mind and are branded and advertised as such

40
“Group” the Company and its subsidiaries
“HK$” Hong Kong dollars, the lawful currency of Hong Kong
“Hong Kong” the Hong Kong Special Administrative Region of China
“IFRS” the International Financial Reporting Standards
“initial public offering” the initial public offering of the shares of the Company, further details of which are set out in the Prospectus
“IoT” Internet-of-Things, system of interrelated computing devices which collect and exchange data over a network
“Listing Date” November 13, 2017, the date on which the shares of the Company were listed on the Stock Exchange
“Listing Rules” the Rules Governing the Listing of Securities on The Stock Exchange of Hong Kong Limited
“Model Code” the Model Code for Securities Transactions by Directors of Listed Companies as contained in Appendix 10 to the Listing Rules
“MOL Global” MOL Global, Inc.
“Nextbit” Nextbit Systems Inc.
“peripherals” hardware devices, such as mice, keyboards, headsets, audio devices and controllers, used to play games in conjunction with a personal computer or console
“Prospectus” the prospectus of the Company dated November 1, 2017
“RSUs” restricted stock units, being contingent rights to receive shares of the Company which are granted pursuant to the 2016 Equity Incentive Plan
“Stock Exchange” The Stock Exchange of Hong Kong Limited
“SST” Slot Speaker Technologies, Inc., (formerly known as THX Ltd.)
“THX” THX Ltd. (formerly known as Razer Tone, Inc.), a company incorporated in Delaware, the United States on August 19, 2016 and our 80%-owned subsidiary

41
“U.S.” the United States of America
“US$” United States Dollars, the lawful currency of the United States
“%” per cent
By order of the BoardRazer Inc.
Min-Liang TANChairman
Hong Kong, March 22, 2018
As at the date of this announcement, the board of directors of the Company comprises Mr. Min-Liang Tan as Chairman and Executive Director, Mr. Khaw Kheng Joo and Mr. Chan Thiong Joo Edwin as Executive Directors, Mr. Lim Kaling as Non-executive Director, and Mr. Gideon Yu, Mr. Chau Kwok Fun Kevin and Mr. Lee Yong Sun as Independent Non-executive Directors.
* For identification purposes only