re-engineering the outpatient process flow of a multi
TRANSCRIPT

CRANFIELD UNIVERSITY
DR. NIVEDITHA M.S
RE-ENGINEERING THE OUTPATIENT
PROCESS FLOW OF A
MULTI-SPECIALITY HOSPITAL
SCHOOL OF AEROSPACE, TRANSPORT
AND MANUFACTURING
Health Administration
MASTER OF SCIENCE
Academic Year: 2014 - 2015
Supervisor: Peter Lee
January 2015


CRANFIELD UNIVERSITY
SCHOOL OF AEROSPACE, TRANSPORT
AND MANUFACTURING
Health Administration
MASTER OF SCIENCE
Academic Year 2014 - 2015
DR. NIVEDITHA M.S
RE-ENGINEERING THE OUTPATIENT
PROCESS FLOW OF A
MULTI-SPECIALITY HOSPITAL
Supervisor: Peter Lee
January 2015
This thesis is submitted in fulfilment of the requirements for the degree of
Master of Science in Health Administration.
© Cranfield University 2015. All rights reserved. No part of this publication
may be reproduced without the written permission of the copyright holder.


i
ABSTRACT
Manufacturing concepts such as Just-in-Time, Lean and Six-Sigma, Japanese 5S,
Materials Requirement Planning, Scheduling and Capacity Management have been
applied in the Healthcare industries in the West for the last decade and has yielded
positive results. In this study, these concepts and philosophies have been applied to an
Indian Multi-speciality Hospital to improve its OPD process flow and increase patient
satisfaction.
The Outpatients Department (OPD) is usually the most crowded sector in a hospital.
The frequent problems encountered include the waiting period for consultation, an
unpredictable number of Walk-in patients, insufficient and operationally deficient OPD
reception staff and unattended appointment patients. This study aims at, identifying
methods to standardise OPD operations management. It has made the process more
efficient through optimum resource utilisation. This will increase patient satisfaction
by meeting and exceeding their expectations while maintaining quality of care.
This research was conducted by mapping the process flow and using the data that was
collected through an observational, cross-sectional, non-interventional study. Though
there were a comprehensive set of recommendations at the end of the study, only a
few could be implemented due to the introduction of a new Hospital Information
System (HIS) software putting the implementation plan on hold.

ii

iii
ACKNOWLEDGEMENT
This Live project was very challenging and would not have been possible without the
support and co-operation of all those involved in helping me. I am fortunate to have
been guided and willingly supported by my Cranfield Professors and the hospital
personnel where the research was conducted. I would like to specially thank those
without whose persistent help and support this thesis would not have been
accomplished.
Firstly, I give my profound gratitude to God Almighty for always being with me and
giving me the strength to meet the challenges opposed by the study. His endless
blessing with good health empowered me to complete all my tasks on time.
My supervisor, Mr. Peter Lee for having faith in me and encouraging me throughout.
His constant guidance, appreciation and confidence in my efforts have helped me walk
the extra mile. His endless patience and time in answering all my queries and his
advice has always helped ease my worries. He shall remain my inspiration.
Dr. Vinit B Samant, my guide and mentor who always stood by and motivated me
never to give up in difficult times. His undivided attention and dedication towards my
study, gave a new look to the project. It was a great privilege to work under him. The
entire hospital staff, for their kindness and cooperation which made this journey of
learning a joyful one.
My parents for their enduring care, implicit support, patience and understanding
without which I would not have been able to fulfil this responsibility. Their push and
confidence has helped me reach my goal. My hearty thanks to all my friends for their
encouragement and support, never doubting my ability to achieve my ambition.
THANK YOU.

iv

v
TABLE OF CONTENTS
ABSTRACT ………………….……….………………………………………………………………….. i
ACKNOWLEDGEMENT ……….…………………………………………………………..……. iii
LIST OF TABLES …….…………………….………………………..………………………..….…. x
LIST OF FIGURES ………………………..…………………….…….………………….…...…… xi
LIST OF ABBREVIATIONS ….…..………….……………………………………….……….. xiii
LIST OF DEFINITIONS ……………………………………………………………………………. xv
CHAPTER 1 : INTRODUCTION …….…..………………………...………………………..… 1
1.1 : Problems in Healthcare …..……………….……………………………….. 5
1.2 : Risks in Health Operations ………..………………………………………. 7
1.3 : Work Culture ……………………………………………………………………... 9
CHAPTER 2: LITERATURE REVIEW ………………………………………….……………. 11
2.1 : Manufacturing Strategies …………………………..……………….. 15
2.1.1 : JIT ………………………………………………..…………..….……..…… 16
2.1.1.A : Introduction to JIT ……………….…………………………. 16
2.1.1.B : JIT Implementation ……………………………………….… 17
2.1.1.C : Pull System …………………………………………………..… 19
2.1.1.D : JIT Limitations ……………………………………………….… 20
2.1.2 : Lean Approach ……………..……………….…………………………. 21
2.1.2.A : Introduction to Lean ……………………………………….. 21

vi
2.1.2.B : Lean Implementation ………………………………….….. 23
2.1.2.C : Six-Sigma ………………………..………………………………. 25
2.1.2.D : Lean Limitations …………….…………………..………..… 27
2.1.3 : Japanese 5S …………………………………..….………..….…….… 28
2.1.3.A : Introduction to Japanese 5S ……………………….…… 29
2.1.3.B : Japanese 5S Implementation …………………….……. 30
2.1.3.C : Japanese 5S Limitations …………………………….……. 32
2.1.4 : Materials Requirement Planning [MRP] …..……..…….… 33
2.1.4.A : Introduction to MRP ……………………………………….. 33
2.1.4.B : Manufacturing Resource Planning [MRP II] …….. 34
2.1.4.C : Enterprise Resource Planning [ERP] ………………... 35
2.1.4.D : Implementation of MRP, MRP II and ERP ….……. 35
2.1.4.E : Limitations of MRP, MRP II and ERP ………………… 37
2.1.5 : Process mapping …………………………………….………………… 38
2.1.5.A : Introduction to Process Mapping ……….…………... 38
2.1.5.B : Benefits of Process Mapping …………………………... 40
2.1.6 : Scheduling ……………………………………………………………..… 43
2.1.6.A : Introduction to Scheduling ……………………………... 43
2.1.6.B : Appointment Scheduling …………………………….….. 44
2.1.6.C : Bailey’s Rule ……………………………………………………. 47
2.1.6.D : Application of Scheduling in Healthcare …………. 48
2.1.6.E : Open Access Concept ……………………………………… 53
2.1.7 : Capacity Management ……………..………………….………..… 55

vii
2.1.7.A : Introduction to Capacity Management .………….. 55
2.1.7.B : Capacity Planning for Optimum Space Utilisation ……………………………………………………….. 56
2.1.7.C : Measuring Efficiency in Healthcare …………………. 58
CHAPTER 3 : RESEARCH AIM AND OBJECTIVES ....................................... 61
3.1 : Research Question ……….……………….………….………………... 61
3.2 : Aim of the Study …………………………………………...………….... 61
3.3 : Objectives ………………………………………………..…………………. 62
3.4 : Significance of the Study …..…………………………..……………. 63
CHAPTER 4 : METHODOLOGY …………………………….……………………………….. 65
4.1 : Research Setting ………………………………………………………… 66
4.2 : Organization Need ……………………………….…………………….. 66
4.3 : Study Design ………………………………………………………………. 66
4.3.1 : Process Mapping ……………….…………….………………..… 69
4.3.1.A : AS – IS Process …………..…………………………….… 70
4.3.1.B : Validation of AS – IS Process ………………………. 73
4.3.1.C : Root Cause Analysis for Waiting Time in OPD 73
4.3.1.D : TO – BE Process ………………………………………….. 75
4.3.2 : Sampling Technique …………………………………………….. 75
4.3.3 : Inclusion and Exclusion Criteria ……………………………. 77
4.3.4 : Sample Breakdown …………………………………………..…. 79
4.3.5 : Data Collection ……………………………………..…………….. 79
4.3.6 : Checklist ………………………………………………………………. 81
viii
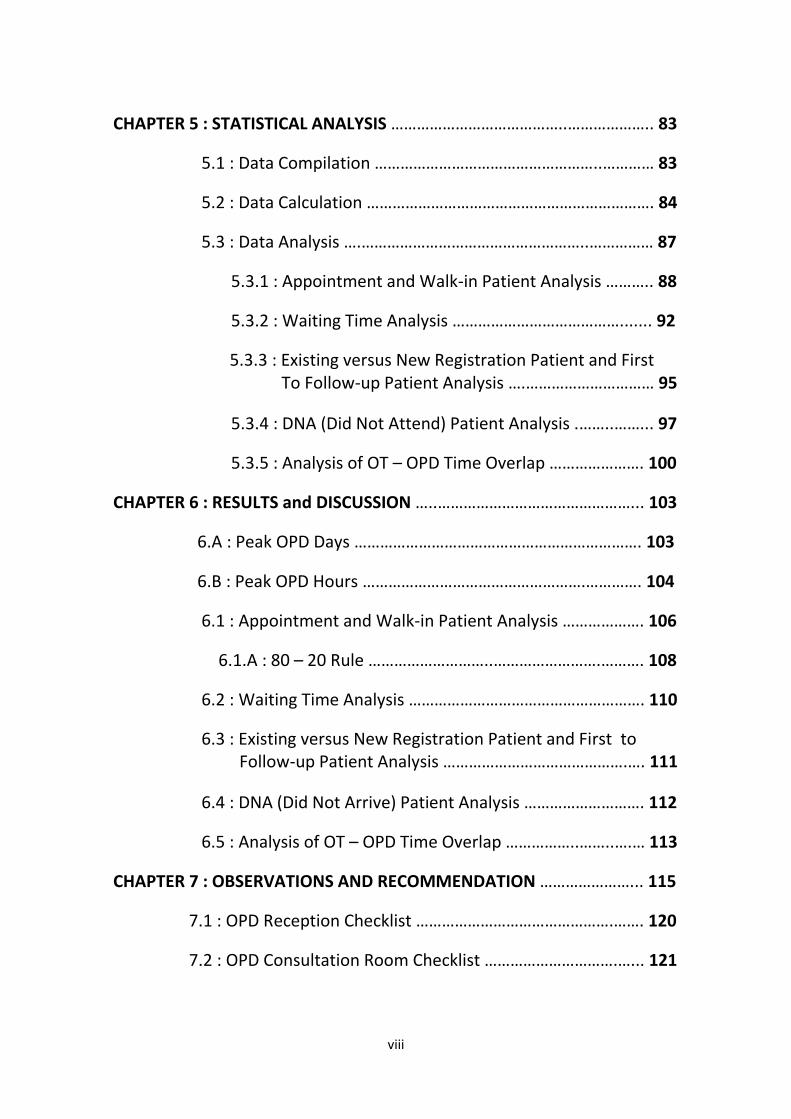
CHAPTER 5 : STATISTICAL ANALYSIS …………………………………..……………….. 83
5.1 : Data Compilation ……………………………………………..………… 83
5.2 : Data Calculation …………………………………………………………. 84
5.3 : Data Analysis ….……………………………………………..…………… 87
5.3.1 : Appointment and Walk-in Patient Analysis ……….. 88
5.3.2 : Waiting Time Analysis …………………………………....... 92
5.3.3 : Existing versus New Registration Patient and First To Follow-up Patient Analysis ….………………………… 95
5.3.4 : DNA (Did Not Attend) Patient Analysis .……..……... 97
5.3.5 : Analysis of OT – OPD Time Overlap …………………. 100
CHAPTER 6 : RESULTS and DISCUSSION …..………………………………………... 103
6.A : Peak OPD Days …………………………………………………………. 103
6.B : Peak OPD Hours …………………………………………….…………. 104
6.1 : Appointment and Walk-in Patient Analysis ………………. 106
6.1.A : 80 – 20 Rule ………………………..…………………….………. 108
6.2 : Waiting Time Analysis ………………………………………………. 110
6.3 : Existing versus New Registration Patient and First to Follow-up Patient Analysis …………………………………….…. 111
6.4 : DNA (Did Not Arrive) Patient Analysis ………………………. 112
6.5 : Analysis of OT – OPD Time Overlap ……………..……..….… 113
CHAPTER 7 : OBSERVATIONS AND RECOMMENDATION …………………... 115
7.1 : OPD Reception Checklist ……………………………………….……. 120
7.2 : OPD Consultation Room Checklist ………………………….…... 121

ix
7.3 : Additional Resources Needed in Ophthalmology Consultation Room ……………………………………………………… 123
7.4 : Additional Resources Needed in ENT Consultation Room ………………………………………………………………………….. 124
7.5 : TO – BE Process Map ………………………………………….………. 125
7.5. A : Validation of the TO – BE Process Map ….……………. 125
7.6 : Implementation Plan …………………………….………….………… 126
7.6.1 : Strategy for Implementation …………………..….………… 126
CHAPTER 8 : CONCLUSION ………………………………….…………..………….....…. 129
8.1 : Limitations …………………………………………………….……………. 134
8.2 : Further Work ………………………………………….…………………… 135
REFERENCES ……………………………………………………………………...….….……..… 136
BIBLIOGRAPHY ....................................................................................... 153
APPENDIX ………………………………………………………………….…………….………… 155
Appendix A : Project Gantt Chart ……………………….……………………………… 155
Appendix B : AS – IS Process Map ……………….…………………………………….. 156
Appendix C : TO – BE Process Map ……………………………………………………. 157
Appendix D : Data Compilation Table ……………………………………….…….… 158
Appendix E : OT – OPD Time Overlap ………………………………………………... 161

x
LIST OF TABLES
Table 1 : India and its Healthcare Scenario …………………………………..………… 2
Table 2 : Benefits of Process Mapping ………………………………………………….. 41
Table 3 : Sample Breakdown in the Study …………………………..……..…………. 79
Table 4 : Number of Male and Female Patients under Paediatric and Adult Group …..…………………………………………………………….…. 87
Table 5 : Adult Patients Grouped in Six Age Groups …………………..…………. 88
Table 6 : Division of Appointment and Walk-in Patients in the Four OPD Sectors …………..…….………………………………………..………………. 89
Table 7 : Comparison of Appointment and Walk-in Patient between the
Medical and Surgical Speciality ………………………………………………. 91
Table 8 : Average Waiting Time for Appointment and Walk-in Patients of all the Medical Specialties ………………………………………..………… 92
Table 9 : Average Waiting Time for Appointment and Walk-in Patients of all the Surgical Specialties ..……………………………………………….. 94
Table 10 : Comparison of Follow up Patients Percentage between the Four OPD Sectors ………………..…………………………………….…………. 96
Table 11 : Average DNA Percentage of the Four OPD Sectors ………….…… 97
Table 12 : Reasons for DNA Occurrence ……………………………………………….. 99
Table 13 : Number of OT-OPD Time Overlaps of Surgical Specialities .… 100
Table 14 : Average Number of Outpatients on a Daily Basis ……….....…… 103
Table 15 : Average Number of Outpatients on an Hourly Basis ......…….. 105

xi
Table 16 : Total Number of Outpatients seen Speciality-wise Over a Period of 3 Months (1st March 2014 – 31st May 2014) ………...………… 109
Table 17 : OPD Reception Checklist ..……………………………………………....... 120
Table 18 : OPD Consultation Room Checklist ………………………………..……. 121
Table 19 : Additional Resources Required in Ophthalmology Consultation Room …………………………………………………………….. 123
Table 20 : Additional Resources Required in ENT Consultation Room … 134
LIST OF FIGURES
Figure 1 : Search Strategy for Literature Review ………………………………..... 12
Figure 2 : The Five Steps of 5S ……..………………………………………………………. 30
Figure 3 : Inputs Converted to Outputs by a Process ………….………………… 39
Figure 4 : What is Process Mapping? ……………………………………………………. 40
Figure 5 : Process Framework ………………………..…………………………………….. 42
Figure 6 : Research Strategy ….……………………………………………………………… 68
Figure 7 : Root Cause Analysis for Waiting Time in OPD ……………………….. 75
Figure 8 : Types of Sampling Techniques …….……………………….………………. 76
Figure 9 : Number of Male and Female Patients under Paediatric and Adult Group ………………………………………………………………..… 87
Figure 10 : Number of Patients in each Age Group ……………………………….. 88
Figure 11 : Comparison of the Total Appointments to Walk-in Patients .. 89

xii
Figure 12 : Comparison of the Total Number of Appointments and
Walk-in Patients of the Four OPDs ……………………………………... 90
Figure 13 : Comparison of the Appointment to Walk-in Ratio of the Four OPDs ………………………………………………………………………….. 90
Figure 14 : Comparison of the Total Number of Appointment and Walk-in Patients for Medical and Surgical Specialities ………… 91
Figure 15 : Comparison of the Appointment to Walk-in Ratio for Medical and Surgical Specialities ……………………………………………………… 92
Figure 16 : Waiting Time for the Appointment and Walk-in Patients of all the Medical Specialties ………………………………………………………. 93
Figure 17 : Waiting Time for the Appointment and Walk-in of all the Surgical Specialties …………………………………………………….……….. 94
Figure 18 : Comparison between New and Existing Patient ………………….. 95
Figure 19 : Comparison between First Visit and Follow-up Ratio of the Total Patients …………………………………………………….……..………… 95
Figure 20 : Comparison of the First Visit to Follow-up Patient Ratio of the Four OPDs ……..…………..………………………………………………... 96
Figure 21 : Comparison between the Medical and Surgical Speciality Follow-up Patient Percentage ……………..……………………………... 97
Figure 22 : Comparison of the Average DNA Percentage of the Four OPDs ……….………………………………………………………………………..… 98
Figure 23 : Comparison of DNA Percentage for Individual Specialities ….. 98
Figure 24 : Reasons for DNA Occurrence ………………………………….……...….. 99
Figure 25 : OT-OPD Overlap Time of the Surgical Specialities ……………… 101
Figure 26 : Peak OPD Days ………………………………………………………………….. 104
Figure 27 : Peak OPD Hours …..………………………………………………………...… 105

xiii
Figure 28 : Trend Analysis of Appointment and Walk-in Patients from January 2013 to September 2014 …………………………..…………. 107
Figure 29 : Comparison of the Total Number of Outpatients seen Speciality wise Over a Period of 3 Months from 1st March
2014 – 31st May 2014 ……………………………….……………………… 110
Figure 30 : Implementation Strategy ………………………………….………….…… 126
Figure 31 : Comparison of the Appointment to Walk-in Patients Ratio from January 2013 – September 2014 ………..…………………… 136
Figure 32 : Project Gantt Chart …………………………………….…………………….. 155
Figure 33 : AS – IS Process of the OPD …………………..……………………………. 156
Figure 34 : TO – BE Process of the OPD …………..……………………………….…. 157
Figure 35 : Data Compilation Table ………….…………………………………………. 158
Figure 36 : OT – OPD Overlap Time for Surgical Specialities ….……………. 161
Figure 37 : OT – OPD Overlap Time for Individual Surgical Speciality Consultants ………………..…………………………………………………….. 162
LIST OF ABBREVIATIONS
A:W – Appointment to Walk-in Ratio
CQI – Continuous Quality Improvement
DNA – Did Not Attend
EDC – Electronic Data Capture
ERP – Enterprise Resource Planning

xiv
ExP – Existing Patient
HAI – Hospital Acquired Infections
HIS – Hospital information System
IT – Information Technology
JCI – Joint Commission International
JIT – Just in Time
MRP – Materials Requirement Planning
MRP II – Manufacturing Resource Planning
OPD – Out Patients Department
OPT – Optimised Production Technology
OT – Operation Theatre
PI – Process Improvement
PRD – Patient Relations Department
PRM – Patient Relations Manager
SD – Standard Deviation
TAT – Turn Around Time
TPM - Total Productive Maintenance
UHID – Unique Hospital Identity Number
VSM – Value Stream Mapping

xv
WHO – World Health Organisation
LIST OF DEFINITIONS
Appointment Patient – is an Outpatient who books a consultation
slot before coming to the hospital for consultation.
DNA – is an Appointment patient who does not attend the
consultation after booking an appointment slot.
Existing Patient (ExP) – is an Outpatient who is registered in the
hospital and holds a UHID number.
First Visit – is a New or an Existing Outpatient coming for
consultation the first time or the third time within 7 days for the
same consultant and is billed for consultation.
Follow up – is an Existing Outpatient who comes for a follow up
consultation within 7 days from the date of billing his first
consultation, to the same consultant and is not billed for the
consultation.
New Patient – is an Outpatient who is not registered in the hospital
and does not hold a UHID number.
Walk-in Patient – is an Outpatient who comes for consultation
without booking prior appointment slot.

xvi

1
1. INTRODUCTION
Health was defined in the Constitution of the World Health Organisation (WHO) for the
first time in 1946 as: “a state of complete physical, mental and social well-being and
not merely the absence of disease or infirmity”. The preamble further states that “the
enjoyment of the highest attainable standard of health is one of the fundamental
rights of every human being without distinction of race, religion, political belief,
economic or social condition.”(WHO 1946, p1315). Although Health is a universal
need, needs for health care provision is largely involuntary, varied, and idiosyncratic
(Hodgson 2009).
Increasing knowledge and awareness about health has brought the importance of
healthcare and the provision of the required care and treatment and the facilities
available to support the ill to the forefront of people’s minds. Healthcare organisations
aim at providing essential sets of healthcare facilities and services to meet the needs of
an individual’s health. With the advancement of technology and growth in the world
economy, there has been improvement in the quality of people's lives, with more
resources being diverted into the healthcare industry. In most countries, due to limited
resources, the cost of health care is becoming increasingly difficult to afford. As a
result, there has been an increasing number of studies in the field of operations
research globally, using theories such as simulation, scheduling and queuing modelling
to solve these problems (Cheng-Hua, Yuan-Duen et al., 2006). The application of
Operations Research brings greater versatility and variety to the management of
healthcare organisations (Sweeney et al., 1989; Ginter et al., 1998). The two most
important aspects of all healthcare organisations are quality of service and overall cost.
Higher quality of care at a lower cost increases patient satisfaction and thereby the
competitiveness of the organisation (Cheng-Hua, Yuan-Duen et al., 2006). The
healthcare industry is fast becoming the most important industry, impacting everyone
in society because of its broad-based inclusive and extensive nature of functioning. An
efficient and proficient healthcare system is inextricably linked to national economic
performance. Its delivery is a complex endeavour (Sheffield, 2008) as it involves

2
emergencies which are non-deferrable and hence should be devoid of ambiguity or
error (Shortell and Kaluzny, 2000). There is evidence to suggest that the increasing cost
of healthcare is putting pressure on access to, and quality of, healthcare delivery
(Blumenthal, 1999). Thus, healthcare is consuming an increased percentage of our
economic product and its rising cost can in part be attributed to the inefficiencies in
healthcare delivery according to Hall (2006).
Ovretveit (2000) believes that quality in a healthcare organisation is three dimensional-
a) Patient quality: which includes necessary needs of the patients.
b) Professional quality: which includes the needs of patients according to the
conjectures of the professionals.
c) Management quality: which comprises the resources to deliver the wants
and needs of the patients without waste, errors or delay, and within policy
and legal regulation.
India is a developing country, with the second largest population in the world. Even
though 20% of the global disease burden is borne by India alone, ample numbers of
people are deprived of basic healthcare facilities (as shown in Table 1). India’s hospital
bed density is only 0.86 beds per thousand populations. In the west, Germany has the
highest with 8.3beds per 1000 people, with the US and UK both having 3.1 beds per
1000 people. Brazil, which is at a similar stage of economic development to India, has
2.3beds per 1000 population. The Indian Government does not recognise healthcare as
a top priority, with only 6% of GDP being spent on its requirements, which is amongst
the lowest globally. The biggest challenge is to keep “in sync” accessibility with the
quality of patient care (Üsou, Shetty et al., 2012).
Per Capita Income Rs 60,950/£750
Doctor Density 1:1722
Hospital Bed Density 0.86/1000 population
Table 1 : India and its Healthcare Scenario (Üsou, Shetty et al., 2012).

3
Healthcare provision in India is arranged as follows:
The Government Sector
The Private Sector
The Public Private partnership
The Government Sector – largely comprises of the Primary Health Care centres that
are mainly situated in rural areas and are scattered across the nation. They provide
basic healthcare facilities for the rural population, usually free or at a minimal cost.
The Private Sector - this is also spread across the country and ranges from small
polyclinics to bigger multi-speciality hospitals. It caters mainly to the urban population
or those referred from the primary setups for more advanced care and treatment. The
cost of healthcare here is quite high and thus, people with low purchasing power
cannot afford it.
The Public - Private Partnership – its existence is an outcome of a contract or
agreement between Public authorities and private companies to run a hospital in
unison.
The provision of corporate hospitals is relatively recent in India. It’s only in the last
three decades that such hospitals have started to be established in the country. Some
of the top hospitals in India are:
Apollo Group of Hospitals
Fortis Hospitals
Wockhardt Hospitals
Colombia Asia Hospitals
Manipal Hospitals
Narayana Hrudayalaya Cardiac Hospital
These hospitals not only provide services for the Indian population but also serve a
large percentage of international patients through what is commonly called Medical

4
Tourism. Equipped with state of the art technology and proficient doctors, these
hospitals are of international quality. Most of them are JCI (Joint Commission
International) accredited which is the gold standard for quality in the healthcare
industry (Üsou, Shetty et al., 2012). The high quality of service delivered by them has
influenced the rapid growth in Medical Tourism, bringing in overseas patients seeking
top class healthcare facilities at a reasonable cost.
In India, the provision of healthcare services and healthcare workers, including
doctors, nurses and pharmacists, is highly concentrated in urban areas and the private
sector. Urban residents, constitute 28% of India's population and have access to 66%
of the country's available hospital beds, while the remaining 72% who live in rural
areas have access to just one-third of the beds. Over the past 25 years, both rural and
urban patients have increased their use of private service providers over public
options. This is due to gaps in the quality and availability of facilities, long waiting times
and the absence of diagnostic equipment in public setups (Yip and Mahal, 2008).
Recent reforms in healthcare have shifted the focus of health organisations to
streamline their processes to deliver high quality care whilst reducing the cost (Miller,
Kochut et al, 2003). The patient’s choice of healthcare service provider is usually
influenced by its reputation, resources, service provided, waiting period and relative
price. Healthcare providers can reduce costs by more effective and efficient utilisation
of the available resources and capacity, with minimal length of patient stay and
improved patient services. All this can be brought about by standardising and
optimising the processes, with the joint outcomes of cost optimisation and reducing
patient waiting times. With a thorough knowledge on the relationship between the
resources, utilisation and patient throughput, major managerial issues can be resolved
to further improve hospital operations (Hutzschenreuter, Kristine, 2010). Ultimately,
the end goal of all hospitals is to have continuously increasing revenue without
affecting quality of patient care, whilst preserving patient satisfaction. To fulfil patient
satisfaction quality of service management is of prime importance in every health
organisation (Miller, Kochut et al., 2003).

5
1.1 : Problems in Healthcare
Where access to healthcare exists, the biggest problem in healthcare across the world
is “long waiting times” (Tolbert 2014). Appointment waiting time and time spent by
the patient waiting at the facility, defined as “provider waiting time”, are among the
top 10 causes of patient dissatisfaction as indicated by the findings of Gesell and
Gregory in 2004. Healthcare is an industry that is strained with surges in demand from
its customers (patients). When patient numbers spike, everything from management
of amenities to personal care shifts into overdrive (Littmann 2014). Another concern is
the rising healthcare cost pressurising the healthcare providers to have more effective
resource management to enable reduction in cost (Smith-Daniels et al., 1988,
Sweeney, D.R. 1996). This trend for the efficient use of resources is critical in an era of
rapidly escalating costs has continued. Wright, Bretthauer et al., in 2006 noted that
healthcare managers face increased pressure to reduce costs while delivering high-
quality service.
Common problems faced in Healthcare (Binder 2013) –
1. Long Waiting Times: - due to improper scheduling and process flow – a result of
demand outstripping supply.
2. Too Much Unnecessary Care: – advising needless investigations and tests.
3. High Cost: – is an outcome of incorrect resource and material planning, strategy
planning, unnecessary care.
4. Lack of Transparency: – Lack of information to choose the right health care.
5. Medical Negligence: – on the part of hospital, staff or the patient.
6. Mishandling of infectious waste: - improper disposable of infectious waste may
lead to spread of infections.
7. Data Management: - Managing large sets of confidential data of the patients
and the Health Organisation.
8. Avoidable Harm to Patients: - one in four Medicare beneficiaries admitted in
the US suffers some form of harm during their stay (often hospital acquired
infections).

6
Hospitals aim to provide quality service and treatment at reasonable cost, yet patients
complain about the increasing health costs, hospital charges, doctor’s fees, poor
service quality, long waiting times etc. This has lead health organisations to employ
methods that improve patient care, efficiency and reduce costs (Shivaji, Subramanian,
2009). Omaswa, Burnham et al (1997) discussed the problems faced by the outpatients
in the Masaka Hospital (Uganda), where patients frequently left without treatment
due to indefinitely long waiting times. An Ishikawa diagram identifying causes of these
delays that were responsible for dissatisfaction of both patients and staff was plotted.
Subsequent examination of outpatient records, observations of patient flow, and
discussions with patients and staff revealed the following problems: low morale among
health workers, shortage of supplies, inadequate supervision by hospital management,
poor coordination of patient flow, and inefficient dispensing of drugs. However, this
would be a hospital at the extreme of operational inefficiency, nonetheless, there are
similar, if not as extreme, problems faced in the developed world’s hospitals.
Conversely, some researchers have noted that chasing operational efficiency may not
have the best outcome for the patient. Koning, Verver et al., (2006), identified that
operational efficiency has significantly increased the cost of healthcare. Operational
insufficiencies are associated with administrative, logistical, medical service delivery
process and healthcare delivery systems. Efforts to reduce inefficiency and quality
improvement has made better healthcare affordable by a large percentage of
population. However, “as health systems consist of many interacting activities,
improvements in one segment of patient flow will have unpredictable effects on other
segments” (Haraden and Resar, 2004). This is highlighted out by Goldratt’s Theory of
Constraints (1984) whereby eliminating one bottleneck will result in moving the
bottleneck to another part of the process.
Emphasis on preventive medicine and short length of inpatient hospital stay has made
outpatient services a vital component in health care. In this fast-growing industry,
hospitals that fail to have cost effective outpatient services find themselves financially
unviable (Goldsmith, 1989). Right decision making at strategic and operational level
helps achieve cost-effectiveness in outpatient services (Cayirli and Veral 2003).

7
Development in the field of Medical Science, Medical Engineering and Technology has
improved treatment methods cutting down on the time needed to treat an illness,
thus comforting patients who dislike staying in hospital for long to complete their
course of treatment. The latest technology has paved the way for several Day-Care
procedures and Outpatient treatment making it possible to treat the patients more
efficiently with in-patient procedures being replaced by day case procedures. The
increasing demand for treatment on OPD basis has shifted the attention of the
operations team from the Inpatients to the Outpatients Department as the
Outpatients generate more revenue than the Inpatients on a daily basis. Consequently,
there have been a number of studies conducted in the Outpatients Department to
improve the quality of service provided, increase patient satisfaction, reduce the
waiting time and attain cost effectiveness.
1.2 : Risks in Health Operations
The healthcare industry is becoming more focused on benchmarking and
measurement (Hall 2014) as means to improve efficiency during times of economic
crisis and political austerity measures. It is vulnerable to several risks related to health
care reform, which, if not managed correctly, will cause long lasting damage to its
reputation. A Healthcare Risk Management Week is held every year during the third
week in June by the American Society for Healthcare Risk Management (ASHRM) (Hall
2014). Some risk factors in healthcare are –
1) Patient’s Safety Risk – when a disease is wrongly diagnosed or an incorrect
treatment is advised.
2) Fraudulent Risks – administering unnecessary investigations which not only
burden patient’s expenses but also exhaust laboratory resources.
3) Documentation Risks – error in billing or prescribing incorrect dosage of
medicine.
4) IT Risk – increasing use of technology has its own complexity

8
a) Security breach – confidential information and sensitive data can be
hacked or altered and illegally used for financial gain.
b) System failure - doctor will be unable to view patient’s record in
time to make critical decisions about treatment in case of system
failure.
5) Ethics and Integrity Risk – due to internal corruption within the organisation
staff.
6) Environmental and Health Risk - waste management forms a very important
part of the health industry. Safe waste disposal, proper hygiene and sanitation
standards if not followed will have a devastating effect on the environment.
The commonest risk to patients during a long hospital stay is of Hospital
Acquired Infections (HAI).
7) Social Media Risk – these may expose the organisation to potential irregularity,
legal and reputational risks ranging from privacy violations, to data abuse and
theft.
Effective risk assessment and management requires understanding the perceptions of
involved stakeholders and how their beliefs can influence risk management decisions
(Wood, Bostrom et al., 2012). Risk management can be brought about by inducing
disciplines to reduce the incidence of organisational loss, which may be proactive,
endeavouring to prevent or mitigate a loss or reactive, in order to control damage.
Health care providers need to manage risk by profoundly understanding the industry’s
issues and requirements. The challenge lies in finding a metric that measures risks
effectively and efficiently (Hall 2014). A Metric Stream (a system that provides an
integrated and flexible framework for documenting and assessing risks, defining
controls, managing assessments and audits, identifying issues, and implementing
recommendation plans) approach of identifying risk, analysing risk, evaluating risk,
controlling risk, monitoring risk, reporting risk and managing the risk will provide
centralised framework for the Risk Management (Watson 2012).

9
1.3 : Work Culture It is important to consider the differences between the Western Culture and Eastern
(Asian) Culture. This is because many of the management and operational concepts
and techniques have been developed in the West. Cultural differences may therefore
affect the effectiveness of the applied techniques. Thus, a brief understanding and
recognition of the differences in the work culture between the East and the West will
help to evaluate the degree of adaptability to the changes introduced. In the western
system, importance is given to working within the system, delegation of work, control,
direction and manipulation of people. Whereas, the Eastern system give their
employees freedom and autonomy to work more enthusiastically as they believe in
creativity and growth (Fine 1983). Eastern culture favours comprehensive thinking
while the Western culture favours analytical thinking. Eastern culture emphasises
collectivism and group consciousness while Western culture emphasises individual
benefits (Peng Luo 2008). When dealing with challenges, westerners solve problems
directly and quickly with little emotional fuss but Asians give great importance to
emotions and find consensual solutions that do not offend anyone. Time is money in
industrialised countries, however in Asian nations, interpersonal relations and
traditions are given higher value. In Western society, there are fewer hierarchical
levels and the manager considers himself to be part of the team. The subordinates are
expected to ask questions that challenge the leader’s instructions and purpose. They
promote individualism and the supervisor assures that opinion of every staff member
counts. Asian and Indian companies have well-defined hierarchical structures where
each person understands his/her position in the organisation and the staffs follow
every instruction of the manager without asking for clarification or questions. The
West believes that a professional relationship should not become overtly personal;
hence they are direct and clear in their instructions and comments to others, whereas,
the Asians perceive directness to be rude and offending so they use phrases that are
diplomatic and polite while making agreements. Technology places a very important
role in developed countries as all work is computerised and accessed electronically,

10
but in developing countries most of the work is done manually as the people are not
much oriented to technology.
Thus, while adapting Western and industrialised nation’s ideas in Asian nations and
developing countries their differences in work culture should be considered to rely on
the effectiveness of the concept being implemented.

11
2. LITERATURE REVIEW
This chapter deals with a review of the relevant literature, to acquire in-depth
knowledge of the study to be conducted and to understand the various studies
conducted in the field of healthcare. Under-pinning knowledge for the present study
comes from the Manufacturing Strategies such as – JIT, Lean, TQM, TPM, MRP, ERP,
OPT, capacity planning, scheduling, Process Mapping etc.
To begin with, a strategy was planned for Literature Review as in Figure 1. Literature
sources include: ABI/INFORM, Scopus, ProQuest, Elsevier and Google Scholar.
Literature search identified 685 plus articles which were narrowed down to 392
articles and from which 176 of them have been cited.

12
Continued…
Data base for Literature Review
Understand Healthcare
Marketing, Medical
Tourism and Insurance
Emergence and growth.
Its role in reducing
patient pocket expenses
Technology
and HIS
1) Quick and easy networking within the hospital
2) EDC (electronic data capture), time saving –
large data processed in short time
3) Cuts on paper cost
4) Easy to store, retrieve and refer all data from
the time organisation came into being
Operations
Research
Acquire knowledge on the work
done in this field
Problems in
delivering Quality
care and services
Man-power
Material
Machine
Money
Re
sou
rce O
ptim
isation
Limitation
s

13
Figure 1 : Search Strategy for Literature Review.
Application of manufacturing
strategies in Healthcare sector
for Process Improvement
JIT, TQM, Japanese 5S
Lean and Six Sigma
MRP, MRP II
Scheduling
Capacity Planning
Application of these strategy
help to
1. Improve and maintain
quality process
2. Reduce waste and non-
value added process
3. Cut on inventory cost and
reduce patient bill
4. Increase revenue of the
organisation
5. Understand AS-IS process
and then formulate TO-BE
process at the end of the
study
Cite all articles
Process Mapping

14
Operations Research and optimisation techniques have gained importance in
healthcare. Attention has gradually expanded from resource allocation and strategic
planning to include operational issues such as resource scheduling and treatment
planning. (Rais, Viana et al., 2011).
In recent years, healthcare marketing has further expanded the scope of healthcare by
spreading its importance and awareness amongst its populations. Most of the well-
established healthcare organisations have their marketing team, which promote the
organisation’s goals and attract its customers, drawing unpredictable number of
patients. Many companies are now linking up with health organisations to provide
health facilities to their employees and their dependents, thereby bringing in
additional customers.
Hospital Information System (HIS) is an advanced technology outcome which helps
easy and quick networking of patient data within the hospital. It allows all permitted
staff to access the information in the system, making it effortless to share information
between departments. For this very reason, it should be user friendly so that anyone
accessing the system can do so without complications. Prior to the advent of HIS,
paper was the material used to store all information, thus bundles of paper occupied
large storage space and at the same time were subjected to risks such as fire,
misplacement, theft, damage etc. In case of any such accidents there was no back-up
information available that could be restored, hence any information lost was
permanently lost.
Development in the field of technology and the introduction of HIS has had a
considerable and significant impact. Some of its benefits are –
a) Large amounts of manual and paper work can be reduced to a great extent.
b) Minimum space is required to store huge amounts of data.
c) All information entered can be accessed, processed and transferred easily.
d) Manual errors are reduced to a great extent.
e) Back-up of all data is possible and it can be retrieved easily in case of any
mishap.

15
f) Information accessed electronically hastens the process.
g) Information is secured and cannot be accessed by everyone.
h) It is reliable, less time consuming and cost effective.
Along with its advantages some of the drawbacks with the HIS are –
a) System breakdown: this halts the entire process until an alternative is set-up.
b) Security breach – confidential information and sensitive data can be hacked or
altered.
c) Can be accessed only by skilled employees.
d) Training demands on workforce.
e) Maintenance of records and system software and hardware can be expensive.
Even though HIS has been used for a long time in developed nations, India has adopted
this technology only over the past few decades. As a developing country, the majority
of the population is not technically oriented and thus finds it difficult to adapt to the
new era. However, the corporate hospitals are trying to keep in line with the Western
technology and the smaller private healthcare centres have now started implementing
and adapting to the new technology. Nevertheless, primary health centres and the
other government set-ups still continue to use the paper method.
2.1 : Manufacturing Strategies
Buffa, (1984) and Wheelwright, (1984) identified four magnitudes of manufacturing
strategy: (1) cost, (2) quality, (3) flexibility and (4) dependability. Boyer et al., 2005
confirm that these magnitudes are still recognised as the key components of
competitive priorities in manufacturing strategy. In the 1970s and early 1980s, Japan
entered world markets by competing on cost, coupled with high quality of
conformance and built a loyal customer base. According to Daniel et al., 2009 the
Japanese captured significant market share in global markets with a cumulative

16
philosophy that there need not be a trade-off between cost and quality. Some
researchers have tried applying manufacturing strategies in healthcare to improve
process flow, to improve and maintain quality with advancing technology, to optimise
usage of available resources and ultimately, to lower the cost without compromising
the quality of services provided. Over the past few decades, these methods have been
successfully implemented in the healthcare industries of the West and of late, are now
being applied in Indian healthcare (Indian Medical Society 2013).
2.1.1 : Just-In-Time
The Just-in-Time philosophy will be explored in this section.
2.1.1.A : Introduction to JIT
The essence of JIT manufacturing is the timely provision of materials, components and
sub-assemblies as need arises in the manufacturing process (Daniel et al., 2009). JIT
involves making, only what is needed, when it is needed and in the amount it is
needed. It aims to meet demand instantly with perfect quality and have no waste.
Global competition has forced manufacturing companies to explore techniques for
reducing their costs, without conceding customer satisfaction. Thus, Lean
manufacturing, particularly, just-in-time (JIT) is considered a powerful tool to reduce
waste and inefficiency, speed up production processes, and increase delivery
performance (Danese, Romano et al., 2012). JIT has five basic techniques: set-up time
reduction, equipment layout, pull system production, daily schedule adherence, and
JIT delivery by suppliers. The first four concern the JIT production area while the last
one refers to JIT supply (Cua et al., 2001).
JIT philosophy as initiated by Toyota Production Company (1956) identifies and
eliminates all waste and emphasises continuous improvement in productivity (Brox
and Fader, 2002). More widely, non-value adding activities are identified and removed
in order to reduce cost, and improve quality and delivery (Hall, 1983; Brox and Fader,

17
2002; Zelbst et al., 2010). The objective of JIT is to maximize a firm's profit and
customer value (Chen, Tan et al., 2011). From the 1980s, JIT has been propagated all
over the world. In the past three decades, the experience of JIT mainly came from
developed countries like USA, UK and Japan (Hall, 1983; Spencer and Guide, 1995;
Huson and Nanda, 1995; Yasin and Wafa, 1996; Sakakibara et al. , 1997; Nakamura et
al. , 1998; Brox and Fader, 2002; Shah and Ward, 2003; Matsui, 2007), however, there
is also an increasing trend for experience to come from other developing countries,
especially from Asian-Pacific countries such as Singapore (Hum and Ng, 1995), New
Zealand (Upton, 1998), Egypt (Salaheldin, 2005), India (Wakchaure and Venkatesh,
2006), Turkey (Aydin et al. , 2008), etc.
2.1.1.B : JIT Implementation
Research conducted on JIT has shown that, its implementation has benefited
manufacturing firms in consistently improving quality, satisfying customer
requirements, minimising levels of inventory and improving relationships with
suppliers (Aghazadeh, 2003). Reduction in materials handling costs and maximum use
of space can be achieved by the JIT approach provided there is continuous arrival of
correct material and backup of necessary inventories (Petersen, 2002). Salaheldin
(2005) surveyed the benefits of JIT implementation in the Egyptian industrial sector,
which included cost reduction, quality improvement, lead time reduction, inventory
reduction and increase in resource utilisation. He further argued that the effect of JIT is
not the same in all manufacturing environments. It is more effective where there is
repetitive production with fairly stable demand. The management philosophy, world
class manufacturing, is about emphasising external and internal customers' needs and
expectations with the importance of doing things right in order to meet corporate
objectives. Research (Farsijani, Fard et al., 2012) has shown that implementation of a
world class production technique such as JIT is not unique in all times, places and
circumstances. JIT implementation varies from one company to another and the
approach, whilst recognisable as JIT will not be identical. However, key concepts of JIT,
such as minimising inventory levels will be identifiable.

18
Continuous improvement, process control and reliability form important principles of
JIT which help improve process efficiency, ensure product quality, and reduce costs
(Greb, 2009). Tom van Laar, head of global technical operations at Novartis says low
throughput time helps a manufacturer respond quickly to sudden increases in demand,
which sometimes occur after launching a new drug. On the other hand, long
throughput times require a company to create a large inventory of a product before
launch to rapidly satisfy a potential increase in demand. Thomas cautions that a drug
producer may not essentially achieve the same level of success as a carmaker with the
JIT approach because financial and manufacturing concerns differ in the
pharmaceutical and automotive industries and the challenges faced are different. Laar
admits, although technology varies in manufacturing industry, that the basic
methodology, concept, and approaches are the same (Greb, 2009).
Inman, Green, Kenneth et al., (2011), in their study conducted on Agile manufacturing
indicated three things – firstly, JIT-purchasing has a direct positive relationship with
agile manufacturing while the positive relationship between JIT-production and agile
manufacturing is mediated by JIT-purchasing; secondly, agile manufacturing has a
direct positive relationship with the operational performance of the firm and
operational performance of the firm has a direct positive relationship with the
marketing performance of the firm, and; thirdly, the positive relationship between the
operational performance of the firm and the its financial performance is mediated by
its marketing performance. Mackelprang and Nairs (2010) concluded that the
relationship between JIT practices and performance is significant and positive when
considering operational measures such as manufacturing costs, inventory costs, cycle
time, speed and on-time delivery. Mistry (2005) in his interviews conducted in an
electronics manufacturing company found that, besides inventory reduction, a further
important benefit of the JIT supplier delivery program was the simplification of
receiving activities for the manufacturer.
JIT and MRP are currently the two most implemented manufacturing
technologies/approaches. Based on 246 Chinese companies' survey, it was found that

19
the degree of the MRP and JIT implementation and integration has a positive
relationship with the manufacturer's performance (Chen, Shang et al., 2008). The
hybrid MRP and JIT system synergy created is widely accepted in China as it attains
better performance.
(Mazanai, 2012), revealed that due to the impeding challenges such as lack of reliable
supplier networks, lack of capital and lack of knowledge of immediate financial gains in
the application of JIT principles, the majority of SMEs manufacturing sector were not
implementing JIT. However, statistically positive correlations between the application
of JIT inventory management principles and cost efficiency, quality and flexibility were
found, inferring that JIT inventory management application can benefit SMEs
significantly in terms of improved quality of products, increased operational cost cuts
and increased flexibility.
A successful implementation of the JIT approach in St James' Hospital in Leeds, UK,
helped reduce costs, contain inventory and improve service (Slack, Chambers et al.,
2009). Some of the reforms brought about were; 1) Single sourcing of suppliers, that
helped the hospital negotiate for lower prices 2) Streamlining the admissions process
in Urology Department, resulted in a faster, cheaper and more reliable process 3)
Introduction of the Kanban system facilitated inventory control and cost saving.
2.1.1.C : Pull System JIT concept is based on Pull systems (a system where the production of inventory items
commence when there is a demand for it) work on a daily schedule and aim at
synchronising production activities to fulfil customer demand. Pull systems use Kanban
cards or other pull signals to control the flow of production throughout the factory by
manufacturing and shipping only what has been consumed downstream (Monden,
1981). According to Sakakibara et al. (1997) the term "JIT production system" originally
identified the pull production logic, described as "only the necessary products, at the
necessary time, in the necessary quantity" (Danese, Romano et al., 2012). In contrast
to the push system (a system where the production of inventory items is determined

20
by a pre-existing schedule), JIT is centred on the pull system, where product is
manufactured in response to actual consumer demand. The goal of JIT manufacturing
is to generate products only when they're needed and in the quantities necessary to
satisfy the demand.
2.1.1.D : JIT Limitations
Singh, Ahuja et al (2013) concluded that implementing JIT is not an easy task and is
restricted by organisational, financial, cultural, behavioural, operational, technological
and departmental barriers. Ideal JIT is theoretical as true JIT does not exist. This is
because, at some point in the supply chain inventory needs to be stocked. In the
manufacturing industry, the manufacturers do not hold stock as the requirements for
inventory is pushed on to the suppliers who store and supply it only when the need
arises. Not holding the stock entirely depends on the response time.
Matson and Matson (2007) identified 20 issues or problems encountered by
automotive companies in Tennessee and Alabama when implementing JIT in their
businesses. Whilst some of these may or may not be appropriate in a healthcare
implementation of JIT, nonetheless some are valid. For example, one of the most
significant problems was motivation of the workforce to change, and another was the
lack of a suitable working space to enable a JIT layout. These can be translated into the
healthcare scenario in India since workers are very conservative in their working
practices and many hospitals have limited space and scope to change floor plans.
The healthcare industry is very different from the manufacturing industry as any
negligence potentially, could have more serious and immediate consequences, for
example, the loss of life. Critical resources like life-saving drugs in Emergency
Department and blood for transfusion in the Blood Bank are essential and need to be
stored at all times. Their immediate need cannot easily be predicted and lack of such
stock especially blood products and drugs will lead to clinical complications, ultimately
damaging the hospital’s reputation. In the case of epidemics or natural disasters, lack
of medical stock can cost many lives, thus reputable hospitals hold stock of essential

21
medicines, instruments and other items that are required for treatment. However, the
optimum number of drugs, swabs, gauze, dressing sets etc. can be stocked in the nurse
station on every floor and Kanban system approach can be applied to replace the used
ones. Also, the JIT approach can be applied when a significant high demand can be
accurately predicted (Leblanc, Jones, et al 2012) in the Outpatient Department and
Day-care centres. JIT idea allows administrators to amend the duty schedule and shift
staff, to make available increased man power at the counters during the peak hours to
meet the rising demands of the patients, so that they are attended to at the right time
leading to dissolution of the peak demand.
2.1.2 : Lean Approach This section discusses the Lean concept and its applications.
2.1.2.A : Introduction to Lean
Lean is an integrated system of principles, practices, tools and techniques focused on
reducing waste, synchronising work flows, and managing variability in production
flows. Lean focuses on the customer and the entire value chain. While Lean’s strength
lies in its set of standard solutions to common problems, it is weak on organizational
infrastructure, deployment plans, analytical tools, quality improvement and control
(Koning, Verver et al., 2006). In the US, Lean methods were adopted in service
industries and later by the healthcare industry with an attempt to increase efficiencies
and reduce costs (Shivaji, Subramanian, 2009).
The Lean approach is best suited to the optimum use of resources to produce high
quality service at low cost. Lean involves moving towards the elimination of all waste
in order to develop an operation that is faster and more dependable, producing higher
quality products and services and above all operating at low cost. Lean manufacturing
was introduced by Toyota nearly 50 years ago (Trebilcock, B., 2004). It isn't a process
or a technology but a philosophy aimed at reducing waste by optimising processes

22
across an enterprise, from the point of order to the point of delivery. Taichi Ohno, the
father of Lean manufacturing, identified "seven deadly wastes" that prevent the value-
added flow from raw materials to finished goods, says Doug Bonzelaar. They are: 1.
overproduction, 2. waiting, 3. downtime, 4. unnecessary product movement, 5. excess
inventory, 6. unnecessary motion, and 7. defective products (Trebilcock, B., 2004).
To be globally competitive, every industry must emphasise on speed, efficiency, and
customer value. In business, incorporating Lean principles have helped achieve
significant economic benefits by improving quality, costs, and cycle time. For best
outcome of integrating Lean principles, the organisation must look for new
opportunities. Lean supports the idea of "delighting the customer through a
continuous stream of value adding activities" (Womack and Jones, 1996). Lean is not
about doing better than competitors (Hartwell and Roth, 2006); but about going
beyond and being the best in every process and product.
The idea of Lean flow is to deliver products and services of the right quality, in the right
amounts, at the right place (JIT) to meet the demands of the customers signalled in the
form of a purchase. Thus, a well-planned lean system can effectively respond to
fluctuating customer demands and requirements. Lean manufacturing tools used to
eliminate waste are: value stream mapping (VSM), standard work, 5S housekeeping,
single minute exchange of die (SMED), and visual management. (Cudney, Elrod et al.,
2011). The five core principles of lean are: value, value stream, pull, flow and
perfection. The success of Lean always relies on the important concept definition of
Value. The first part of the Lean principle implementation starts with identifying value
from the point of all the stakeholders to the organisation (Shivaji, Subramanian, 2009).
“Lean is about making value flow at every step where value is what a customer is
willing to pay for and waste is what a customer would not pay for”. Young and Mc
CLean (2008) define value from a patient point of view as, the route patients take from
entry into hospital until he leaves; i.e. designing pathways around creating value to
patients at each step. To map a value added process all people who “touch” the
patient pathway (receptionist, paramedics, nurse, specialist doctors and departmental

23
managers) should be included, excluding the steps like waiting for bed availability, the
consultant, sample collection or medication which are non-value adding to the patient
(Burgess and Radnor 2013).
2.1.2.B : Lean Implementation
Lean is a process improvement methodology, which is based on continuous
improvement focusing on value, flow and waste reduction. To be effective at
delivering sustained and continuous service improvement, Lean implementation
should be aligned to organisational strategy, where Lean becomes part of the
organisational culture (Davies and Walley, 2000; Corbett, 2007; Ben-Tovim et al., 2007;
Hines et al., 2004; Hines et al., 2008). In the last two decades, the Lean concept has
largely been used in manufacturing processes, but now it is also being applied to a
wide range of service operations. It is important to understand the difference between
the manufacturing sector and service sector before implementing Lean. Also,
healthcare industries have a different customer orientation than the other service
industries (Shivaji, Subramanian, 2009). Alsmadi, Almani et al (2012), analysed the
difference in Lean practices and their relationship to firm performance
between manufacturing and service sectors in the UK. Though the study proposed
Lean application in the service sectors, Lean practices needed further adaption to
ensemble service operations. The study outcome clearly stated that service firms are
concerned with the soft practices of Lean, such as people and customer involvement,
while in manufacturing-related practices such as total productive maintenance, set-up
time and supplier feedback they are found to be underperforming. Moreover, the
results showed a positive relationship between Lean practices and firm
performance in both sectors and the degree of effect on performance was found to be
identical between the two sectors.
The literature reports several successful implementations of Lean in hospitals. Applying
Lean techniques (combined with six sigma) at Stanford Hospital and Clinics (George,
2003) describes the achievement of a 48% reduction in mortality rate from coronary

24
artery bypass graft surgery with a 40% reduction in the costs of running the cardiac
unit and a reduction of $25 million in yearly material cost. On the other hand, process
simplification shortened the average length of stay in the emergency room from 247 to
139 minutes in 2005 (Weinstock, 2007). Lean has also helped public hospitals,
examples are: the British National Health System (NHS) adopted Lean and issued a
report on Lean thinking for the NHS (Jones & Mitchell, 2006), New York Technology
Development Organisation (TDO) developed a program for healthcare organisations
based around lean-manufacturing principles (Tampone, 2005), Chalice discussed steps
to control healthcare costs using Lean methods (Chalice, 2005). A team of 15 people at
University of Iowa Health Centre used a Lean methodology and eliminated non-value
added activities in Radiology CT scanning resulting in increased revenue by
approximately $750,000 per year (Bahensky, Roe, & Bolton, 2005).
Extending Lean implementation to the supply base was a bigger challenge as it
affected the social as well as technical systems of the organisation (Abdulmalek and
Rajgopal, 2007). For example, Textron Defence Systems obliterated functional groups
and restructured around core processes to support Lean implementation (Klein and
Maurer, 1994). Warner Robbins Air Logistics Centre (WRALC) agreed on changing many
of its internal systems, such as the technical system, the behavioural system, and the
management system, to support Lean implementation (Dickmann, 2005).
Furthermore, Lean execution requires linking with the extended supply chain. In the
case of Lockheed Martin Aeronautics Company (LMAC) a system-of-systems approach,
recognising their interactions with both upstream influences and downstream
customers was applied (Ferdowsi and Stanke, 2002). Thus, a context-specific viewpoint
and a systems viewpoint that covers the extended supply chain is required for
employing the Lean approach. Various researches on adopting Lean thinking in support
functions indicated that Lean philosophy is not limited to manufacturing industry alone
and can be relevant in any business domain. Awareness of the external and internal
advances of a company enables it to incorporate changes and survive. Ahlstrom (2004)
investigated the possibilities of applying Lean in service companies and found that

25
perhaps Lean is better suited for service rather than manufacturing companies
depending on the nature and characteristics of the services.
Lean thinking has great power in helping organisations to think out of box and gain
new insights for their process improvement (Shivaji, Subramanian, 2009). Lean
Methodology intends to streamline the processes and the improvements
accomplished are evident more quickly compared to other methodologies enabling the
employees to appreciate the results instantaneously (Towne, J., 2006). Eckelbecker
(2012) studied cases where medical administrators were adapting "Lean" or "Six
Sigma" in Worcester and other locations, to exclude waste and save money, but this
notion was not accepted by nurses and labelled unsuccessful, according to experts. It
can be a turning point in hospitals as employers, insurers and government pushed to
control medical spending. This involved the separation of patients in the emergency
department showed faster flow of care reducing patient waiting times by more than 5
percent and another, concentrating on billing for radiology procedures, reduced
denials from insurers by more than 80 percent, bringing in additional payments to the
hospital. One of the first projects involved tapering down a 23-step discharge process
to a nine-step process, reducing the time taken to send the patients home. Another
was “just in time” that included organising supply rooms to order bandages and
culture bottles only when supplies were low. On the other hand, some nurses were
unhappy with the Lean method as they spent less time with the patients. Frequent
failures are faced by Lean adopters. Lean experts have estimated that only 20 percent
of Lean efforts in health care persist and succeed, because; top executives do not
make it an on-going priority, organisations are not willing to adapt to change in work
culture, improvements occur in isolated departments rather than whole entire
organisation.
2.1.2.C : Six-Sigma In the mid-1980s, Motorola developed the Six Sigma concept that focused on
improvement and significant reduction of process defects. Quality is specifically

26
measured in terms of defect rates and is assessed from the customer’s perspective.
More formally, Six Sigma has been defined as “an organised and systematic method
for strategic process improvement and new product and service development that
relies on statistical methods and the scientific method to make dramatic reductions in
customer defined defect rates” (Linderman et al. 2003). To approach a problem, Six
Sigma deploys a five phase strategy (DMAIC); D-Define: identify/define the problem
and set the goals, M-Measure: gather data, measure inputs and outputs, A- Analyse:
develop problem hypotheses and identify root causes, I-Improve: develop
improvement ideas and establish solution, C-Control: establish performance standards
and deal with any problems. Six-Sigma offers a structured, analytic, logically sound
approach to problem solving and a strong organisational framework for its deployment
yet one weakness of Six Sigma is its complexity (Koning, Verver et al., 2006). In the
case of simple problems where easy solutions can be implemented, observance of Six
Sigma may be considered “overkill” and inefficient (George 2003). While, Lean focuses
on doing the right things (value-adding activities), Six Sigma focuses on doing things
right (with no errors). Critics of both Six Sigma and Lean highlight that these quality
techniques focus on processes rather than the systems where the processes operate
(Stamatis 2000).
In Towne (2006), the Virtua Health Centre, in Marlton, NJ, U.S.A., had relied on the Six
Sigma methodology for six years to achieve organisational goals of excellent service,
caring culture, clinical quality and safety, best people employment and resource
stewardship. Virtua then turned to the Lean Methodology, which complemented Six
Sigma and allowed for quick turnaround. For any organisation attempting
transformation, the main obstacle is staff resistance to change. The employees need to
be motivated and wholly involved in the process so that they feel responsible and are
encouraged to work for the betterment of the organisation. GE Healthcare, found that
any initiative must come from top management with good communication to the staff
so that they understand what has to be achieved and how it has to be done. It can be
considered that Lean makes the staff feel more responsible and empowered as their

27
ideas are utilised to improve the work process. While, Six Sigma accomplishes major
changes, Lean focuses on the smaller stuff.
2.1.2.D : Lean Limitations
Liker and Rother (2011) explain the reasons for failure of Lean implementation. Firstly;
Lean activity fades away with time and its effects decline. Secondly; Expecting
immediate results. Thirdly; Top Managers are either not willing to embrace the
philosophy or do not understand it wholly. Fourthly; Lack of motivation and continuity
of the employees. Lean is a slow, steady and continuous improvement process that
takes time before results are evident. If the process is adopted and continued with the
same commitment, after a few months employees can look back and realise how much
has been accomplished. It is not a one-time process but an unceasing attempt towards
continuous improvement, thus the organisational leader should fully understand the
concept and constantly motivate his employees to retain their interest.
Shivaji and Subramanian (2009) highlighted certain constraints encountered by
Jefferson County Hospital during Lean implementation. 1) Waning of management
interest in Lean due to problems of funding, designing and building a new hospital
facility 2) Initial training provided by the Lean consultant was oriented more to a
manufacturing company rather than a hospital 3) Employees were reluctant to
participate in Lean training sessions or to study the current system, etc., in addition to
their usual daily activities 4) Lack of incentives for employees to make suggestions that
helped improve operations and cuts costs. Lean effectiveness increases when the focus
is on the process and not on the people.
Liker and Morgan (2006) outlined and illustrated that Lean can be applied beyond
manufacturing to any technical or service process and must be adopted as a continual,
comprehensive, and coordinated effort for change and learning across the
organisation. But, Lean efforts represent “limited, patchy approaches, quick fix to
reduce lead time and costs and increase quality, which never create a true learning
culture.” Other problems that can interrupt lean implementation are failure to address

28
fundamental structural issues. Most managers fail to realise that Lean is a
management philosophy and not a collection of tools for problem solving. Most
leaders are not thoroughly knowledgeable and fail to understand its value or do not
have the patience and control to implement it. Lean mainly depends on the employee
willingness to adapt to the changed work culture and any resistance to this is the first
step towards lean failure.
The primary motive of the Lean concept was to reduce the waiting time of the patients
and provide them with timely information and service (Shivaji and Subramanian,
2009). Common problems observed in the Outpatient Department are the waiting
queue at the counter, unnecessary movement of the patient from one counter to
another, wastage of paper following incorrect print outs, excessive numbers of files
and forms occupying the limited space available. All of these can be resolved with the
JIT and Lean approach. Waiting queues can be cleared, by relocating and temporarily
increasing the manpower at the counter when it is crowded. Unnecessary movement
can be cut down by having a systematic flow, for example, registration at front lobby
followed by instructing the patient to go to the OPD where the patient ID is
acknowledged and billed for consultation, after which the patient is directed to the
vital signs check room, after completing which he takes a seat in the OPD premises
until called for his consultation. The systems used in the hospital should support a
strong HIS network so that, following consultation, any laboratory investigations
advised can be billed at the OPD counter and the patient can go directly to the sample
collection room with the bill. By keeping a limited stock of paper at the counter, with
careful usage, minimal errors and wastage would cut down the cost. Having the
required number of well-arranged forms and files at the desk will condense the space
occupied by them, thereby providing space to allot the other resources.
2.1.3 : Japanese 5S
This section will now consider Japanese 5S concept and methodology.

29
2.1.3.A : Introduction to Japanese 5S
“5S is a system designed to prevent items, tools and equipment from being lost or
misplaced”. It focuses on creating a workplace that is more efficient, effective and
organized (Hogrefe 2013). 5S is the first step towards Total Quality Management and
Business Excellence. It was originally developed by just-in-time expert and
international consultant Hiroyuki Hirano as an extension of his earlier work on just-in-
time production systems. 5S represents a simple good housekeeping approach to
improve the work environment coupled with the principles of Lean manufacturing
systems. The focus lies in the concept of how the visual workplace can be utilised to
drive inefficiencies out of the manufacturing process (Shil, 2009). 5S is a proven
method used to systematically organise, standardise, clean and maintain the
workplace (Lewis, 2007). The platform for developing an integrated management
system lies in merging Total Productive Maintenance (TPM) and 5S Japanese acronym
for Continuous Quality Improvement (CQI) (Bamber et al., 2000). 5S stands for – seiri,
seiton, seiso, seiketsu and shitsuke (as in Figure 2). Becker 2001, Gapp et al., 2008
explain the 5 steps in the 5S process as –
a. Seiri (Sort) - identify unnecessary work, space, items and remove them. It is
most effective when essential items are identified and kept. Clearing the area,
allocating space for remaining items by placing, stacking and storing the
materials enhances overall safety.
b. The object of Seiton (set in order) is to arrange work place items for quick
identification. For this purpose, everything should be organised according to
the frequency of use. Concept, such as "first in first out" and color-coding
materials can be implemented to organise the workplace.
c. The goal of Seiso (shine) is to make the employees accept that proper
workspace maintenance is part of their job and a daily cleaning process will
help identified the waste sources. A dedicated tidying routine will inevitably
resolve safety concerns.

30
d. Seiketsu (standardise) formalise procedures to avoid wasted indecision times
by determining the best way to complete a task such that the organisation will
work towards the best practices.
e. Shitsuke (Self-discipline) form favourable habits and maintaining them in the
long term.
Safety can be coined as the sixth "S," but whether unified or not, the natural
conclusion of a 5S workplace is a safe, productive environment (Hogrefe 2013).
Figure 2: The Five Steps of Japanese 5S.
2.1.3.B : Japanese 5S Implementation
A framework of applying 5S within a business was first formalised in the early 1980s by
Takashi Osada (Ho et al., 1995). The practice of 5S aims to embed the values of
organisation, neatness, cleaning, standardisation and discipline into the workplace
(Osada, 1991). It benefits both the customer and the employee. In Japan the 5S
practice was initiated in the manufacturing sector and then extended to other
industries and services sector (Gapp, Fisher et al., 2008). 5S describes how to organise
SUSTAIN - make
established procedures a routine
SORT - eliminate
waste
SET IN ORDER - keep only
needed items in right place
SHINE - maintain a
clean workplace
STANDARDISE - work
towards best practices

31
and lay out a space for maximum efficiency and effectiveness by identifying; sorting
and storing the items used, and maintain the area to help sustain the newly organised
areas (Mehok, 2011).
Hubbard (1999) studied the implementation of the 5S in the Clarkson Company that
yielded an excellent result. They began organising the workplace by using Red Tags to
identify unneeded items then brought in orderliness by analysing their processes and
eliminating wasted motion. Next a cleanliness checklist was introduced and the
employees were made responsible for the neatness of the work environment. These
three steps resulted in a standardised workplace and lastly the discipline acquired by
every employee ensured that they followed the correct procedures developed in the
5S implementation. The red tag program recovered 10 percent of the floor space
which was used as a storage area and the colour coding strategy for materials helped
to determine where things belonged.
Application of Japanese 5S in healthcare results in a neat and clean healthcare facility,
improves productivity, increases patient safety, decreases waiting time and minimizes
cost. Medication errors can be reduced to a great extent by; a) labelling drug
containers or trays and placing the right drugs in them; b) Disposing expired
medications that are no longer used, indeed creating more space to place medicines
that are used; c) segregating the medications and placing high risk medicines in
cupboards so that it is not used carelessly; d) placing the drugs, medications and other
items required in the order of their importance; e) keeping the workplace and the
surroundings clean as this will abate the possibility of acquiring hospital acquired
infections.
Casey (2013) studied North American organsations that adopted 5S approach and
found that disorganisation returns after few months. He reasoned it to be because of
the significant cultural differences between Japanese and North Americans. The
Japanese live in limited space, hence store just what they want and need whereas, the
North Americans are accustomed to wide open spaces. In Japan conformity is
cherished but conformity is not always valued by North Americans. Thus, they adopt a

32
culture of individualism and excess. Casey proclaims that an organisation should start
with the standardisation step and know what is expected when standards are in place,
next systemize a process to measure orderliness and then consecutively follow the
sort, set in order and shine steps. The failure for Japanese 5S implementation by the
North Americans could have been for two reasons – 1) Union resistance to change
introduced in the work pattern; 2) Bad implementation approach by the management.
2.1.3.C : Japanese 5S Limitations
Oswald (as in Casey 2013) declares that for successful implementation of 5S, teamwork
and the winning spirit of the employees is necessary. Application of 5S, helps to
continuously improve and maintain the quality in an organisation. By identifying the
essential items, arranging them in the order of importance (keeping things used most
within easy reach), cleaning the work place, good maintenance of resources will help
cut down on non-value added work, thus saving time, space and cost. If the employees
are resistant to change and are unwilling to acquaint to changed work pattern then it is
nearly impossible to successfully implement 5S approach. For this reason, the manager
must induce enthusiasm and interest in the employees so that they agree to adapt to
new work patterns and take up the responsibility to sustain the improved process.
Becker (2001); Eckhardt (2001); Zelinski (2005) state that 5S is easy to understand but
difficult to realise how it helps improve organisation decision making and
performance. 5S is designed for “ordinary, everyday companies” that intend to
improve their efficiency and productivity levels. Proper labelling, designated storage
spaces, and communication centres are a few ways to incorporate 5S practices into the
workplace (Hogrefe 2013). Orderliness in the workplace eliminates three types of
waste: searching waste, difficulty of-use waste, and the waste of returning items to
their proper place (Hubbard, 1999). Thus, this concept is appreciated by production
managers as it focuses on improving productivity and quality, while lowering product
costs and enhancing the flexibility of operations (Becker 2001). Lewis (2007) postulates
the result of applying 5S in business is; enhanced quality, improved safety, increased

33
throughput, reduced cost and pride of ownership. Although 5S is predominantly used
in the manufacturing sector, it is now deployed in industries such as banking, mining,
construction and healthcare.
2.1.4 : Materials Requirement Planning [MRP]
This section explores the MRP concept and its development into MRP II and ERP
methodologies.
2.1.4.A : Introduction to MRP
Healthcare industry is subjected to constant advancement and improvement in
medications, procedures and equipment. Hospital cost suppression is an important
problem challenging the health care administration and the advancement in
information technology like Enterprise Resource Planning (ERP), Material
Requirements Planning (MRP), and Manufacturing Resources Planning (MRPII) in
production processes and supply chains has instilled interest in the administrators
(Costa, Lameira et al., 2013). As MRP involves production schedule, inventory records,
bill of materials and calculating time-phased material, component and sub-assembly
requirements, both gross and net, processing capability and storage capacity has made
commercial use of MRP possible and practical. While the prime objective of MRP is to
compute material requirements, it proves to be a useful scheduling tool as it employs
backward scheduling wherein lead times is used to work backwards from a due date to
a start date. As the MRP systems popularity increased, practitioners and researchers
realised that the data and information produced by it could be augmented with
additional data to meet other information needs like Capacity Requirements Planning
module, which could be used in developing capacity plans to produce the master
production schedule. Further, manpower planning and support for human resources
management were incorporated and distribution management capabilities were
added. What started as an efficiency-oriented tool for production and inventory

34
management has become a cross-functional information system serving diverse user
groups (Mcgaughey and Gunasekaran, 2007).
The core principle of MRP is that, if a product or service is composed of several inputs,
the demand for these inputs depends upon the amount of product to be produced.
Thus, a company can calculate its material requirements if it knows how much of
product has to be produced. Some limitations while implementing MRP involve: 1. The
production-marketing interface, 2. Invalid scheduling caused by inadequate capacity
planning and 3. Lack of data integrity (Piper 1988).
2.1.4.B : Manufacturing Resources Planning [MRPII]
MRP in MRPII stands for manufacturing resource planning rather than materials
requirements planning. Manufacturing resource planning is a computer-supported
planning and scheduling system that enables management to control: 1. production
scheduling, 2. cash flow, 3. manpower planning, 4. capacity planning, 5. inventory, 6.
distribution, and 7. materials purchases and offers certain benefits that include: a. low
inventories, b. lower prices, c. shortened lead times, and d. increased management
productivity. MRP system evolved from material requirements planning to an
enterprise information system resource in manufacturing operations.
The need for greater efficiency and effectiveness was common even to non-
manufacturing sectors such as healthcare, financial services, aerospace, and the
consumer goods sector who adapted MRPII to manage critical resources (Mcgaughey
and Gunasekaran, 2007). MRP II anticipates the materials needed, in the quantity
needed and the dates on which they will be needed (McLeod, 1995). The objectives of
MRP II are to reduce inventory-holding cost, improve customer services and plant-
operating efficiency (Wilson et al, 1994). The information management capability of
MRP II is particularly relevant when there are unpredictable customer requirements
and complex product structures. Key feature of MRP II is its ability to maintain correct
priorities so that production can focus on what is really needed (Fogarty et al., 1991).

35
2.1.4.C : Enterprise Resource Planning [ERP]
The ERP system is an information system that integrates business processes and aims
to create value and reduce costs by making the right information available to the right
people at the right time in order to make good decisions in managing resources
effectively and proactively. The origin of ERP can be traced back to materials
requirement planning (MRP) (Mcgaughey and Gunasekaran, 2007). ERP is comprised of
multi-module application software packages (Sane, 2005) designed with large
automated cross-functional systems that bring about improved operational efficiency
and effectiveness through integrating, streamlining, and improving fundamental back-
office business processes. Traditionally, the objective of ERP systems was greater
efficiency in general and, to a lesser extent, greater effectiveness.
2.1.4.D : Implementation of MRP, MRP II and ERP
Hutchins (1999) formulated seven fundamental points essential for the success of the
MRP implementation: 1) Manage the data – eliminate all informal data systems. 2)
Changing a company often requires drastic actions and it is important to convince the
people that the company will change. 3) Stop measuring the wrong things and start
measuring the right things. To make things happen, system implementation needs to
be directly tied to compensation. 4) Do not run parallel systems - Users always
outsmart programmers. If the old system is allowed to remain, the workers will find a
way to let the manager think they are using the new system while actually continuing
the old. 5) Project evaluation - Management, vendors, implementation team, and the
users who make it happen must be rewarded publically on reaching the finish line. 6)
Education and training – Implementation requires knowledge and right understanding
of the system if not the users will invent their own process from a part of the system
and manipulate it. 7) Monitor the system and project all the way through.
Steinberg, Khumawala, Scamell et al., (1982) reported the problems that healthcare
organisations face are similar to manufacturing organisations. In the case of hospitals
expired medications, obsolete equipment and short shelf-life drugs lead to excessive

36
inventory, wastage of space and high operational costs. MRP II for surgical supplies
was developed at Park Plaza Hospital, a private hospital in Houston, Texas. The system
was used to procure only the minimum levels of inventory needed to support a
detailed schedule of surgical procedures. Although application of the MRP II method
will not reduce the cost to a great degree, it will help dampen the rising cost of
healthcare. The automated inventory management method long used by
manufacturers, can be implemented in the healthcare sector to cut down cost by
managing the lowest possible inventory level. MRP: 1. ensures that materials required
for delivering goods and services are available, 2. maintains the lowest possible
inventory levels 3. Plans and integrates service activities, schedules, and purchasing
requirements (Hien, Randall, Wells et al., 1989).
Studies on MRP II implementation showed that, MRP II on raw materials inventory
levels facilitated in maintaining lower levels of safety stock (Braglia and Petroni, 1999).
Tower, Knibbs et al., 2005, asserted that in the MRP II system, orders for raw materials
are sequenced to arrive at approximately the same time as each item appears in the
Master Production Schedule, resulting in reduced average inventory levels. Thus Plossl
(1994), states that reducing average inventory level reduces inventory investments to
a minimum.
The application of the MRP approach in Outpatients Department will lead to lower
inventory costs, reflected by a reduction in the patient’s bill. Resources provided in the
consultation room like soap/sanitizer, medications, gels, equipment, bandages etc.,
should be checked for their expiry dates. Their availability in the rooms should be only
what is required, as excess will lead to expired stock piling up with wasted investment
on the excess inventory.
Most firms implement ERP with the goal of replacing diverse functional systems with a
single integrated system that does the work faster, better, and cheaper (Mcgaughey
and Gunasekaran, 2007). In a hospital, responsibility of services is shared between
many autonomous units. To implement ERP, acceptance is required by its various
stakeholders to bring in organisational and technical changes in the sector. For this

37
very reason, it is essential to understand the attitude, behaviour and expectations of
the physicians and the administrators to reduce friction between the departments
(Boonstra, Govers et al., 2009). This can be best done by enquiring about the demands
and requirements of the consultants and whilst considering the financial objectives of
the hospital.
2.1.4.E : Limitations of MRP, MRP II and ERP
Previous research in the materials management literature has identified
how failure occurs in MRP systems. Even well-established companies with
excellent MRP implementation plans have failed with no logical explanations Hutchins,
(1999). 4 statements with limited foundation in fact are: 1) MRP is an ''either-or''
proposition. 2) MRP is a closed-loop system. 3) There is no such thing as a unique
company. 4) MRP is a standardised technology; contribute to the failure of an MRP
system if good judgement is not exercised in considering their validity and/or impact.
Hutchins, also expressed certain limitations while implementing MRP. 1) Developing an
unrealistic implementation schedule whilst not keeping in check the realistic state of
the company would invariably cause failure. 2) There is no perfect system, some
changes to the processes needs to be made to accommodate the software. 3) Work
problems that no one will be able to anticipate. 4) Need for a contingency plan to
switch to when the system fails. 5) A company improves because of its employees
input and not because of the system. The users know better what the system can and
cannot do. 6) Need for continuous training as it is not a one-time event. 7) Failure to
evaluate results.
Wailgum (2009) highlighted some failed implementations of ERP – 1) SAP's R/3 ERP
software adopted by Hershey Food’s which prevented it from delivering $100 million
worth of Kisses for Halloween in 1999 and caused the stock market price to dip by 8
percent. 2) An ERP, supply chain and CRM project that aimed to upgrade the systems
caused a 20 percent stock dip and a collection of class-action lawsuits in 2000 for Nike.
3) In 2004, SAP system ERP implementation caused a huge loss of revenue that was

38
more than five times the project’s estimated cost. 4) In 2004, a computer program
introduced at the University of Massachusetts, Stanford and Indiana University was a
disaster as the students found it very difficult to comply with the ERP applications that
left them at best unable to find their classes and at worst unable to collect their
financial aid cheques. 5) “Garbage-disposal” giant Waste Management in 2005 filed a
suit and claimed SAP executives participated in a fraudulent sales scheme that resulted
in the massive failure. 6) Oracle's master plan to build the next-generation of
applications that are completely standard using Fusion Applications in January 2006
did not accomplish. 7) Oracle alleged in 2007 that SAP (via Tomorrow Now a small
company) compiled an illegal library of Oracle's copyrighted software code and other
materials, forcing the company to shut down in 2008 following a lawsuit. 8) In 2008.
CIOs were reluctant to take chances storing the sensitive data (accounting, HR, supply
chain) contained in their ERP systems in another company's data centre as they were
committed to their traditional ERP systems.
Thus, for a successful implementation of MRP, before introducing any system or
bringing any change the organisation needs to understand the impacts of the same
and choose a system that would suit the requirements of the company. The manager
must have an open discussion with his employees before bringing in changes to assess
the acceptance of the new system by the users. Continuous training sessions should be
conducted so that the users completely understand the concept and are motivated to
adopt the new system.
2.1.5 : Process Mapping
This section discusses the importance of process mapping and its benefits to develop
more effective processes.
2.1.5.A : Introduction to Process Mapping
A process converts inputs into outputs (as in Figure 3). To achieve this it may require
tools, materials, methods and man-power.

39
Figure 3 : Inputs Converted to Outputs by a Process
Processes are arguably the most vital area of control for an enterprise as they
constitute a substantial portion of organisational costs, and an organisation is only as
effective as its processes. An effective method of documenting processes is to map
them; this is called Process Mapping. It is an analytical technique used in business to
understand processes and procedures by visually illustrating the activities, decision
points, timings, precedence, dependencies and the work flows (Figure 4. explains all
about process mapping). Process mapping is an excellent tool to establish strong
internal controls and to know how the company operates (Pardiso, Cruickshank et al.,
2007). This tool is very powerful in defining the current state of operations if done
accurately and serves as a road map for isolating and eliminating problem areas. The
most important part is to have a well-organised plan with well-defined boundaries
ascertaining the beginning and end of the process (Argent 2007).
“A good process map visually represents the work flow, identifies problem areas and
opportunities for process improvement and provides understanding of the entire
process, specific roles and contributions of process participants” (Deas 2009). Process
maps are excellent problem solving tools that streamline activities and eliminate non
value-added steps. In the 1970s, after the quality movement took hold in the US, the
most widely accepted process mapping tool was the flow-chart until it lost its
credibility in recent years, as Continuous Quality Improvement defines this term as
being evolved from being managed and controlled by a few experts to being used by
all employees. With the introduction of the Toyota Production System, a new process
INPUTS
1. Man
2. Materials
3. Methods
4. Skills
5. Knowledge
6. Machine
PROCESS
OUTPUT
1. Product
2. Service
3. Information
4. Paperwork

40
mapping concept called Value Stream Mapping emerged. Nash, Poling et al., (2009)
propose that as many Six Sigma practitioners have adopted this concept that it may
very soon become the initial tool of choice for process mapping worldwide.
Figure 4 below, expresses the sequence followed to perform a process map. However,
Shivaji and Subaramanian have missed the crucial and vital requirement of validation
of the As-Is and To-Be process maps by process owners. This ensures that the process
has been captured correctly and is a true reflection of the processes.
Figure 4 : What is Process Mapping? (Shivaji and Subramaniam 2009).
2.1.5.B : Benefits of Process Mapping
A process map helps to increase efficiency, eliminate needless activities, reduce cycle
time, and simplify workflow (as in Table 2.). The critical tool in Lean is a Value Stream
Understand, analyse and document processes and activities
Establish shared knowledge base
Analyse areas for development and improvement
Show in order, steps converting Inputs to outputs
Identify if system can support these efficiencies
Remove non-value added steps and constraints
Understand Work process and resource allocation
Identify opportunities for improvement
Produce AS-IS and TO-BE process maps
P
R
O
C
E
S
S
M
A
P
P
I
N
G

41
Map (VSM) that can be used as a quality improvement activity guide, as it highlights
non value-adding steps and bottlenecks in the process (Koning, Verver et al., 2006) by
eliminating steps that are redundant, out-dated, or non-value added thus, shortening
the process (IOAM’s Report 2010). This technique diagnoses and identifies potential
and actual blocks in the existing process that prevent a quality service reaching the
customer and proposes a re-engineered process to remove the bottlenecks (Akamavi
and R.K 2005).
Improved schedule and budget predictability Increased productivity
Improved cycle time Increased customer satisfaction
Improved employee morale Increased return on investment
Improved quality (as measured by defects) Decreased cost of quality
Table 2 : Benefits of Process Mapping (Koning, Verver et al., 2006).
Uppal, Wang, Fulton et al (2012) reported that Lean methodology along with other
systems engineering tools were adopted to systematically assess, evaluate, and
improve an outpatient wound clinic process in order to deliver efficient and patient-
centred care. Techniques such as process mapping, spaghetti mapping, and cause-
effect diagrams were used to identify the non-value added activities
and recommendations were proposed to streamline patient, staff, documentation and
information flow, reduce patient waiting time, and increase clinic throughput. The
study provided an opportunity for the process owners to understand the Lean
concepts and gave a new perspective to their processes.
A well delineated process map exhibits a process framework for continuous
improvement (as in Figure 5.)

42
Figure 5 : Process Framework (Subramaniam 2009).
Although, Shivaji and Subramaniam (2009) introduced the process framework, (as in
Figure 5) yet again, (as in their description of the stages of mapping in figure 4) they
did not recognise the importance of, or mention, validation of the process by the
process owner(s). Thus there was no certainty or guarantee if the AS – IS process
mapped was complete and correct. Also, non-validation of the TO – BE process map
would lead to failure in the acceptance and buy-in by the workforce and the
management. Therefore, it is essential that a process map is always validated by the
owner(s) to make sure that the process and the role of each stakeholder in the process
is rightly understood.
Where a Process Map is a simple workflow diagram that brings a clearer understanding
of a process or series of parallel processes, a Process Model consists of a series of steps
and decisions involved in the way work is completed. A process model is derived from
a process map but has additional information as it looks deeper into the process and
ideally a process model can give a better understanding of the organisation and how it
functions. IDEF3 is a process model which is used widely in business process mapping.
It provides a structured method for expressing knowledge about how an organisation
works by collecting and documenting processes and captures the behavioural aspects
of an existing or proposed system.
Identify Best
Practices
AS-IS process
Analyse and
Evaluate
TO-BE
process Implement
Continuous Improvement
Process
Improvement Process
Re-engineer

43
2.1.6 : Scheduling
This section investigates different types of scheduling and the importance of having an
effective scheduling system to improve customer satisfaction.
2.1.6.A : Introduction to Scheduling
The goal of effective scheduling systems is to match demand with capacity so that
resources are better utilised and patient waiting times are minimised (Cayirli, Veral et
al., 2003). The operation of an appointment system depends on the effectiveness of
appointment allocation designed to suit the needs of the individuals. Appointment
allocation deals with scheduling resources to satisfy demand at the right time and right
place. In healthcare, resources could be in the form of machines, staff, space, time or
equipment and the demand is the customer order. The prime factors that affect
operations of appointment systems are staff scheduling and appointment scheduling
(Yedehalli, et al., 2005). Staff scheduling finds its application in many different
industries – employee scheduling at a fast food chain, airline crew scheduling, nursing
application, scheduling a rotating workforce, military manpower planning, scheduling
bus drivers etc. (Bailey 1997). Naidu et al (2005) identified the importance of resource
scheduling in healthcare, giving an outline on the various approaches such as linear
programming, expert based systems and heuristic approaches for achieving an optimal
staff planning that would meet the requirement at the lowest possible cost.
Potentially, well-designed appointment systems (AS) can increase the utilisation of
expensive personnel and equipment-based medical resources along with reducing
patient waiting time according to Cayirli, Veral et al., (2003). In outpatient services, the
major reason for patients' dissatisfaction is the excessive waiting times (Huang 1994).
Patients expect reasonable waiting times in addition to clinical competence (Jackson
1991).

44
2.1.6.B : Appointment Scheduling
Appointment Scheduling is defined “as a method of allocating fixed number of
resources and service among customers using certain rules and criteria to ensure
efficient and quick access to all customers while maximising utilisation or minimising
costs” (Salinkar 2010 p48) and this is applied in service industries such as airlines,
clinics, restaurants (Denton and Gupta 2003). Appointment scheduling in healthcare is
different from other services because problems of resource utilisation and server
efficiency are affected by the unpredictability of human nature. The demand for a
doctor’s time by two different patients with the same ailment can be very different,
unlike the airlines seating capacity which stays fixed and unchangeable (Gupta and
Denton 2008). Appointment scheduling becomes challenging because of the
unpredictable, non-deterministic and dynamic demand patterns. Walk-in patients with
no scheduled appointment necessitate estimation of demand and the associated
variability. However, scheduling for surgical procedures is different from outpatient
scheduling. Here the operation theatre is booked for different surgeons in blocks, so as
to maximize the resource utilisation, which takes precedence over patient and
provider preferences. The goal of a well-designed appointment system is to ensure
timely and quick access to all customers while maximising server utilisation. (Salinkar
2010).
Appointment scheduling in health care systems is needed to regulate demand (patient
appointment requests) and supply (service capacity of health care providers).
Appointment systems have two objectives: (i) provide a quality service with short
waiting times for patients (ii) protect the system from daily fluctuations in demand
leading to an inefficient system, with low utilisation levels on some days and overloads
on others. Past research has shown that the longer the appointment is delayed, the
higher are the chances of no-show and cancellation (Gallucci et al. 2005). A clinic's
choice of a scheduling policy depends on various factors that determine its sensitivity
towards no-shows, flexibility in adjusting its physician capacity, willingness to work
overtime, and/or willingness to overbook patients depending on the daily workload

45
(Liu 2009). Denton and Gupta (2003), Robinson and Chen (2003), and Klassen and
Rohleder (2004) state that the object is to balance server idling, customer waiting and
tardiness (overtime) costs with a focus on determining appointment times for punctual
patients with random service times. While, Muthuraman and Lawley (2008) assume
that scheduling decisions can be made based on a clinic’s past data. They state that
this data can identify the correlation between various patient attributes and their no-
show probabilities. However, LaGanga and Lawrence (2007) studied how appointment
overbooking compensated for patient no-shows so as to improve the overall
performance of the clinic. Unfortunately, overbooking is a risky strategy and may not
necessarily work in private clinics. For instance, if the no-show rate turns out to be
zero or much lower than the predicted rate on a particular day, then the clinic would
flood with patients and the appointment patients would not tolerate long waits opting
for a refund which would lead to loss in patient number and revenue to the clinic.
The appointment scheduling process can either be static or dynamic. If the complete
demand for a given day is known before the start of scheduling, then the schedule can
be optimised in a deterministic manner resulting in a static scheduling process (Gupta
and Denton 2008). However, in reality, appointments are usually made over the phone
thus appointment requests are stochastic. Scheduling decisions taken in such
situations are dynamic scheduling decisions where an appointment request needs to
be fulfilled one at a time, and the entire future demand is not known at the time of
scheduling each patient (Muthuraman and Lawley 2008). The dynamic scheduling
approach attempts to account for demand load variation (Rohleder and Klassen 2002),
and thus patient rescheduling due to preferences or cancellations (Hur et al. 2004).
Appointment scheduling considers two queues – the first queue, where patients wait
to receive an appointment, and the second queue formed on the day of the
appointment to consult. The length of appointment queue can be shortened by
increasing the number of patients seen per day. However, the length of the waiting
queue increases correspondingly (Salinkar 2010). Designing of an appointment
schedule is controlled by three parameters – the block size (one patient or more than
one patients scheduled at a time), the block interval (fixed intervals or variable

46
intervals when patients are called) and the initial block size (one or more patients
called at the beginning of the session) (Muthuraman and Lawley 2008). Ideally, an
appointment system assigns a consultation time slot with the consultant and a start
time of OPD session for the consultant. If every patient is seen by the consultant at the
scheduled time and this lasts for the allocated interval, after which the patient leaves
and the next patient is immediately consulted, there would be no delays; patients
would experience zero wait times and the provider would experience no idle time
between appointments. In practice the arrival of walk-ins, lateness of patients or
consultant, non-attenders and the difference between the allotted and the actual time
taken for consultation disrupts the schedule. Thus designing an appointment schedule
needs to consider these parameters to minimise disruption of the schedule. Hence the
basic problem of designing an appointment schedule is that of a trade-off between
minimizing patient waiting time and maximizing provider utilisation at a given available
capacity (Salinkar 2010).
The two complementary criteria for a schedule are minimizing the forfeits for not
delivering on time and minimizing the idleness cost (Sourd, 2005). With the increase in
healthcare costs and advancing technology, same day procedures are being carried out
in outpatient settings with an upsurge in number of patient appointments, thus
requiring more effective appointment scheduling (Salinkar, 2010). A characteristic of
outpatient practice is the queuing system for scheduling patients to provide a
predetermined time interval (Mercer 1973). Thus long appointment waiting times are
a chief cause for high no-show rates (Kopach et al, 2007).
There are two different research approaches for tackling the problem of appointment
scheduling – analytical approaches and simulation-based heuristic approaches.
Analytical approaches include queuing theory, mathematical programming and
dynamic programming that focus on the appointment scheduling problem under
bounded conditions and do not consider patient or provider characteristics (Salinkar
2010). Fries and Marathe (1981) used a dynamic programming approach to arrive at an
optimal number of appointment slots so as to minimize the overall cost function of

47
the expected patient waiting time and the provider idle time. An approximation
method was applied, as the dynamic programming approach required a deterministic
value for the total number of appointments to be scheduled. Earlier research, (Mercer
1960 and 1973) disclosed queuing theory was for the steady-state of a system which
was more suitable for obtaining estimates of resource requirements and expected
waiting times. A time-dependent Markov chain queuing model developed by Brahimi
and Worthington (1991) modelled a random arrival rate of patients, and a distinct
service time distribution, recognising that complicating factors like patient lateness,
preferences, and no-shows require a simulation approach. Denton and Gupta (2003)
modelled a two-step linear programming approach to address the appointment
scheduling problem which incorporated patient waiting costs, provider idle time costs,
and costs incurred by lateness, for a given session length. Advantages of utilising the
simulation approach to solve appointment scheduling problems are that continuous
service time distributions and the stochastic arrival process can be modelled easily.
Simulation modelling techniques befit the inherent stochastic and non-determinate
nature of scheduling for outpatient healthcare services (Salinkar 2010). Many studies
used simulation approaches as they easily incorporated environmental factors such as
no-shows, walk-ins, service time variation and patient sequencing and classification
(Cayirli et al. 2008). A recent study has developed an in-depth simulation modelling
approach to also include into scheduling consideration the total service time during a
patient visit in addition to the consultation time with the provider (Wijewickrama and
Takakuwa 2008).
2.1.6.C : Bailey’s Rule
Early research in the field of appointment scheduling advocated individual
appointment times for every patient over the then prevalent block-appointment
scheduling schemes (Bailey 1952) which maximized provider utilisation and minimized
provider idle time at the expense of increased patient waiting times. Bailey designed
an appointment scheduling rule by which the provider’s idle time was kept at a
minimum while not compromising the value of the patient’s time. Bailey’s rule – two

48
patients are scheduled at the same time followed by one patient at appointment
intervals equal to the mean consultation time of the provider. This rule assumes
random consultation times fitted into a distribution with a mean consultation time.
This rule provides a simple and relatively effective method to schedule patients using
an estimate of the average consultation time for a given provider (Salinkar 2010).
White and Pike (1964) proposed a modification to the Bailey’s Rule to accommodate
unpunctual patients in the appointment schedule viz. block scheduling by determining
the total patients seen at the clinic and the average consultation time with the doctor.
Welch (1964) concluded that patient waiting time, consultation time, and punctuality
of patients and providers affect performance of outpatient clinics, dependent on which
metrics are used.
Outpatient appointment scheduling has been the subject of scientific investigation
since the beginning of the 1950s, when Bailey and Welch wrote about appointment
systems in hospital outpatient departments (1952). The objective of appointment
scheduling is to have a short waiting time for patient and little idle time for the
physician so as to finish on time. Bailey and Welch introduced the first advanced
scheduling rule and tested it through simulation (Kandorp and Koole 2007).
2.1.6.D : Application of Scheduling in Healthcare
Scheduling outpatient clinic appointments is a necessity for planning surgeons'
activities within a clinical practice (Vissers, 1979). A schedule determines the
appointment time and duration of consultation for a patient (Jun et al., 1999). The
length of time a patient has to wait for consultation depends on the number of
appointments, the availability of the consultant, and the method of appointment
scheduling (Meredith et al., 1999). Appointment allocation in outpatient clinics is
similar to timetabling in educational institutions which involves assigning a faculty to a
course/subject and a room for a fixed time period. Each faculty differs in their skill
level (Hinkin, Thompson et al., 2002); there could be many different sections for each
course/subject and number of room available (Breslaw 1976, Hinkin, Thompson et a,

49
2002). Some faculties may prefer to teach more than one course in successive time
periods, while others may need a break between two successive lectures. Similar to
the educational institutions, clinics scheduling appointments involves scheduling a
combination of doctors, nurses, patients and treatments to a time period. Here,
doctors perform the function of the faculty members, treatments are considered to act
as courses and the patients are the students (Yedehalli et al., 2005).
Effective scheduling systems have the goal of matching demand with capacity so that
resources are better utilised and patient waiting times are minimized (Cayirli, Veral et
al., 2003). The waiting time for any service is a major concern for customers and
waiting for a scheduled appointment can be annoying. However, appointment
scheduling is a challenging task, mainly due to the uncertainties associated with service
times (Klassen, Rohleder et al., 2004). Muthuraman, Lawley et al (2008) formulated an
appointment scheduling policy for outpatient clinics, wherein a schedule was
constructed for a single service period partitioned into time slots of equal length. A
scheduler assigned a slot for every patient who called for an appointment and each
patient booked had a no-show probability thus slots were over-booked to compensate
for this.
Rinder, Weckman et al (2010) discussed two types of scheduling methods used in
healthcare: work scheduling and staff scheduling. Patients can be scheduled in
outpatient clinics as there are a given number of slots available based on the type of
work needed to be completed and the number of providers available by hour of the
day and the day of the week (Kachhal, 2001). A) Work scheduling includes both
resource scheduling and staff scheduling. There are a number of external factors that
influence the work schedule, such as no-show appointments and cancellations,
emergency appointments, and walk-ins. A smooth patient flow often determines the
profitable use of provider and staff time. B) A personnel schedule is prepared once the
work schedule is ready after determining the staff requirements. There are two types
of personnel scheduling: cyclical and non-cyclical. The cyclical type assigns the same
pattern after a certain number of days or weeks and has the advantage that the

50
personnel know their schedule but there is a lack of flexibility in accommodating
demand and worker needs. The non-cyclical type is based on demand and staff
availability and generates a new schedule for a short period of time. It is able to
accommodate staff needs and change in demand but it requires more planning.
Optimisation techniques are used for developing personnel schedules (Kachhal, 2001).
Kaandorp, Koole et al (2007) developed a mathematical model type of scheduling
where patient mean waiting time, physician idle time, and tardiness were calculated
with the objective of minimizing the sum of the three variables. Since the number of
solutions given by this model was huge a search algorithm was necessary. Isken,
Rajagopalan et al (2002) used a data mining technique, K-means for clustering, "to help
the development of patient type definitions for purpose of building ... simulation or
analytical models of patient flow in a hospital". It was based on the idea that each
patient has a different need whether it is treatment, consequence of treatment or the
resources that need to be allocated to the patients. To solve this problem, patients
were classified into groups that had the same needs. The K-means clustering method
was used to classify patients.
Gul, Denton et al (2011) asserted that designing a schedule to achieve smooth patient
flow in an Outpatient Procedure Centre (OPC) is a complicated task, as it is dependent
on a set of co-ordinated activities including patient intake and preparation, surgical
procedure, and patient recovery. Uncertainty in the duration of surgical procedures
causes long patient wait times, poor utilisation of resources, and high overtime costs.
Large numbers of surgical procedures with uncertainty in the duration of activities and
a fixed time length of surgical suite availability poses scheduling problems involving
multiple, competing criteria. Gul, Denton et al (2011) believed expected patient
waiting time and expected surgical suite overtime are performance indicators a
manager must consider on a daily basis, although a schedule with small time intervals
between procedures will have low surgical suite overtime and high patient waiting
times, and vice versa. They proposed a hybrid solution technique mixing a bi-criteria
genetic algorithm (GA) with appointment time-setting heuristics to find the (near)

51
Pareto optimal set of schedules and reveal the trade-off between factors affecting
both the patient and the provider. They then tested several commonly used scheduling
heuristics against the genetic algorithm to estimate the potential benefits of
optimisation-based methods for scheduling system improvements and finally used GA
to estimate the potential benefits of optimising daily procedure mix. Chow et al. (2011)
built a surgery schedule combining Monte Carlo simulation and Mixed Integer
Programming models to reduce variation in bed occupancy in surgical wards. They
scheduled surgery block times and determined surgical mix within each block. Cayirli et
al. (2006) tested several sequencing and appointment rules for clinic visits using
simulation models with regards to patient waiting time, doctor idle time, and
overtime. A significant finding of their study was that the impact of sequencing on the
criteria is more important than that of the appointment rule.
Pooling referrals on a single appointment list, and scheduling appointments with the
first available, not the referral, surgeon has been recommended as a method of
reducing time to appointment (Kipping et al., 2000; NHS Modernisation Agency,
2005a). In this method, the patient is referred to an outpatient clinic rather than to a
named surgeon (NHS Modernisation Agency, 2005b). The Audit Commission, 2002;
Appleby et al, 2003 argue that pooling referrals reduce the uneven distribution of
patients over individual waiting lists, contributing to variation in waiting time (Katz et
al , 1991). Vasilakis, Sobolev et al., 2007 tested three hypotheses on the impact of the
pooled-lists method: (a) fewer patients will be waiting for an appointment during
weeks with no appointments available, (b) referral to appointment time will be
shorter, and (c) appointment to surgery time will increase. They reported the results of
their simulation study that compared two methods of scheduling outpatient clinic
appointments. In the first method, individual surgeon appointment lists scheduled
appointments with the named referral surgeon. The second method used a pooled
appointment list to schedule appointments with the first available and not the referral
surgeon.

52
Perfection in process performance is crucial for improving healthcare delivery. In the
healthcare system, the demand is the number of patients to be seen every day and the
resources are the nurses, physicians, rooms, and instrumentation that are available.
The ability to balance the rising demand with the available resources will propose a
solution for the scheduling problem (Rinder, Weckman et al., 2010). The last few
decades has seen advancement in scheduling methods from manual scheduling to
computerised approaches. All the methods developed in recent decades have not only
improved the quality of service, but also assisted schedulers to work more efficiently
(Chien, Tseng et al., 2008). These new methods aim at staff scheduling as well as
patient scheduling – reduction of patient waiting time (indirect and direct waiting
time), and total time spent in hospital.
All methods for patient, physician and staff scheduling, mathematical
modelling/optimisation, genetic algorithm, local search, and data mining, have
common objectives such as: to decrease patients waiting time, reduce physician idle
times, increase equipment utilisation, select the maximum number of patients; fairly
distribute patients among physicians, and reduce the time and effort to construct the
schedule. The variables taken into account for this are: number of open slots per day,
number of days in the schedule, length of appointment, and the number of patients to
be scheduled every day. Accomplishing these objectives will not only improve the
quality of services provided but also reduce its cost (Rinder, Weckman et al., 2010).
Often physicians are not punctual or patients are late for their appointments. A major
problem is the missed appointment; when patients do not arrive and do not cancel
their appointment in advance. Recent studies concluded that the no-show rates may
be around 20% (Bennett, Baxley et al., 2009) and vary between 15-30% in general
adult and paediatric clinics (LaGanga, Lawrence et al., 2007). Missed appointments
lead to loss in revenue and underutilisation of resources, reduce provider productivity
and efficiency, increase health care costs, and limit the ability of a clinic to serve its
patients by reducing its effective capacity. Other concerns that require attention are
indirect patient waiting time, late cancellation and no-shows, emergency walk-ins and

53
patient preferences (Gupta, Denton et al., 2008). No-shows and Walk-ins greatly
influence the scheduling system; hence managing them is a challenging task. By not
arriving for an appointment, a patient denies the appointment to another patient, and
indirectly increases the indirect waiting time. Walk-ins occur randomly, increasing
patient waiting time and overloading the nurses and physicians. Lastly, patient
preferences are not taken into account when scheduling, preferences may differ from
person to person and thus clustering of patients with similar preferences can help
develop a schedule for that particular group (Rinder, Weckman et al., 2010).
Some limitations imposed by new methods are that artificial intelligence techniques
develop rules based on the input and constraints specific to each healthcare facility
and thus these models may not be valid for application to a wide range of healthcare
facilities. Rinder, Weckman et al (2010) reviewed the use of heuristic models which
proved to be successful in improving healthcare scheduling. However, more external
variables, such as patient behaviour, needs to be taken into account when developing
scheduling methods.
Laganga (2011) conducted a Lean process improvement project to increase the
capacity of new patient admission into a healthcare service operation system. The
transformation in service processes reported a 27% increase in service capacity to
intake new patients and a 12% reduction in the no-show rate as a result of the Lean
project. Laganga noted that changes due to Lean methodologies demonstrated the
need for a focus on efficient and effective in scheduling techniques. He reported that
the maximum benefits from efficiency drives require systematic scheduling
techniques.
2.1.6.E : Open Access Concept
Scheduling systems can be designed based on three types of access models –
prescheduled (traditional) access, the carve-out model, and the open access
(alternatively called advanced access) (Salinkar, 2010). Open access addresses the long
appointment waiting times by finishing today’s work today (Murray and Tantau 2000).

54
This implies that when a patient calls an appointment is granted within the next one to
three days. Many clinics have adopted open access, although it requires working
overtime to clear the backlog from the traditional scheduling model, which is based on
a fully pre-scheduled appointment scheduling system. In carve-out models, one half of
the total clinic capacity is reserved for prescheduled patients and the second half is
utilised for same day appointments (Murray and Tantau 2000). This model may not
perform better than the traditional appointment scheduling if it starts compromising
or mismanaging the appointment slots allocated for open access in a way that patients
start experiencing a non-standardised process of appointment scheduling (Murray and
Berwick 2003).
Open Access (OA) proposes a way to reduce no-shows and cancellations by giving
patients same-day appointments on the day they call for them. However, OA cannot
be a universal solution for all appointment scheduling problems as it will not work in
small capacity clinics with a large demand for patient appointment requests (Liu 2009).
Open Access can eliminate no-shows as most patients are seen on the next day
(Kopach et al. 2007). No shows waste valuable resources when scheduled
appointments are missed without sufficient notice to reallocate the appointment. They
also provide a source of frustration not only for patients waiting for appointments, but
amongst staff. Thus, it is the aim of every healthcare organisation that delivers medical
or clinical care, to reduce no shows to zero. Existing literature on Open Access shows
that all of Open Access practices are primary care practices, requiring predictable
service times. In addition, Open Access is not suitable for scheduling high volume
clinics where the demand exceeds the supply. Thus, for Open Access to work, the
demand and supply for appointments must be in balance (Salinkar, 2010). Murray et
al. (2003), Solberg et al. (2004), Belardi et al. (2004), and Dixon et al. (2006) strongly
advocate OA, while Lamb (2002) is strongly against it. Lamb’s objections are based
around his observation that Open Access can demotivate staff, increase errors and
places unnecessary mental and emotional strain on staff. He noted that clinicians and
nursing staff were often “bullied” into working overtime to fulfil the demand for
appointments. Nevertheless, for OA to work, demand and supply (capacity) need to be

55
“in balance." However, distributing demand over several days can regulate daily load
on the system reducing severity of overloads, but this will consequently increase the
no-shows and cancellations (Liu 2009). The carve-out model schedules a varying
proportion of patients from the advanced access pool and the prescheduled pool for a
given day be based on the optimal proportion of patients that maximizes revenue for
the day (Gupta and Wang 2008) or maximizes the percentage of advanced access
patients for the day (Qu et al. 2007). Advanced access scheduling, introduced in the
early 1990s, significantly improved the performance of outpatient clinics. Its successful
implementation required the match of daily healthcare provider capacity with patient
demand (Rardin, Williams et al., 2007).
Significant no-show rates and escalating appointment lead times complicate effective
management of an Outpatients clinic. Murray and Tantau (1999) proposed a method
called Open or Advance access with an essence “do today’s demand today” to avoid
wasted capacity due to no-shows. Jonathan Patrick (2011) developed a Markov
Decision Process (MDP) model with short booking windows that was significantly
demonstrated to be better than open access. The model analysed a number of
scenarios that explore the trade-off between patient-related measures (lead times)
and physician or system-related measures (revenue, overtime and idle time). Through
simulation, Patrick (2011) demonstrated that the MDP model does as well or better
than open access in terms of minimizing costs (or maximizing profits) as well as
providing more consistent throughput.
2.1.7 : Capacity Management
This section explores the concept of capacity management and its application.
2.1.7.A : Introduction to Capacity Management
In modern work practice, workplace efficiency depends on workplace
utilisation. From an office productivity point of view, efficiency is the generation of the

56
greatest amount of production with the minimum of waste which can be achieved by
enabling people to produce the right work at the best quality with the potential to add
value or increase knowledge (Davies, 2005). Thus effective utilisation of the workplace
is to enable productivity with minimum costs (Khamkanya, Heaney et al., 2012).
Capacity management in healthcare involves decisions concerning acquisition and
allocation of three types of resources: workforce, equipment and facilities. Thus
selection of a healthcare facility involves decisions on size, location and the general
mix of services offered (Smith-Daniels et al 1988). There are many methodologies and
strategies to increase productivity of employees through workplace design, the
relationship of workgroups, environmental stimuli, etc. (Brill et al, 1984, 1985; Duffy,
1992; Clements-Croome, 2000; Becker, 2002; DEGW, 2005). Under-utilisation of space
should be the focus where an organisation is subjected to drive down cost and
stimulate a creative workforce (Duffy, 2000). To eliminate under-use of office floor-
space, there is an inherent ideal outcome in which all workspaces in a department are
fully utilised. However, it is improbable that ideal outcome is achieved in practice but it
is worthwhile to investigate feasible ways of efficiency improvement using
mathematical stimulations to explore scenarios that would be impossible in practical
situations (Fawcett, Chadwick et al., 2007).
A demand forecast is critical for staffing, production planning and managing care,
continuity and access. Demand for hospital appointments is determined by the service
delivered at the hospital and those obtained by other healthcare providers. Narrowing
the gap between demand and capacity is critical to improving access and continuity of
care (Davis, Charles, Farmer et al., 2012). Demand uncertainty in the field of health-
care pertaining to changes in demand patterns driven by demographics and in delivery
of services has become an important issue to be researched (Jack, Power et al., 2009).
2.1.7.B : Capacity Planning for Optimum Space Utilisation
Davis, Charles, et al (2012), in their study, highlighted certain important points; 1)
Capacity of a healthcare service depends on – the number of available appointments,

57
types of appointments, the number of consulting rooms, consulting hours, access to
clinical information, patient flow, and availability of staff. 2) While scheduling
appointments and staff, demand should be a top consideration. 3) Extending clinic
timings beyond business hours can offer appointments to meet demand of patients
before and after work and school, reducing the unnecessary burden on the Emergency
Department. 4) Patient flow is mostly affected by clinical and administrative
information and an efficient and effective support staff. 5) Standardising and defining
roles of each member in the team will not only increase productivity but also increase
quality and safety. 6) To ensure the successful implementation of staff roles, there
should be measures of performance and monitoring to ensure sustainability. 7)
Decreasing no shows can increase capacity. Manual or automated reminders such as
phone calls, e-mails, or text messages can decrease no shows. The difference in the
actual capacity and the demand or demand forecast is the demand/capacity gap which
can be narrowed by increasing capacity or decreasing demand. If the gap is large, it
creates frustrated patients because there are no available appointments, increases
emergency visits, and causes poor patient and staff satisfaction. The goal is to decrease
the gap by developing mitigation strategies. If the gap can be reduced to within 5-10
percent, most of the patient needs can be met. Making the gap zero would require
over staffing and is not desirable. Another way to narrow the gap is to decrease
demand by reducing unnecessary health care utilisation while simultaneously
encouraging the appropriate use of health care resources. Also, continuity with the
same provider and health care team can alone decrease demand for services.
Systematic studies of systems with variable demand began 100 years ago with Erlan’s
pioneering work on telephone systems and extensive knowledge has been explored in
fields such as operational research and systems engineering (Brockmeyer et al, 1948;
Hillier and Lieberman 2001). With sophisticated approaches to space-time
management, gain in utilisation and efficiency can be achieved by moving from “full”
demand” (where full demand is the historical maximum cumulative demand over a set
period of time) to “expected demand”. When demand exceeds the full demand,
demand can be reduced to the full demand. Though this works by providing each

58
employee with a non-shared workspace by executing special space-time management
(Fawcett, Chadwick et al., 2007). New working practices that reduce territoriality have
broadly been discussed in recent years (for example, Worthington, 2005). However, if
the transition from current to new space-time management practices is not handled
effectively, the new practices may fail (Van der Voordt, 2004). When there is variability
in activities, it is exceedingly difficult to move beyond the expected demand and
provide enough workspaces to cope with reasonable peaks in demand. This may be
reachable by maintaining a continuous queue of people who can be assigned to
workspaces as soon as they are vacated (Fawcett, Chadwick et al., 2007).
Tyler et al. (2003) determined the optimum Operation Room (OR) utilisation by
analysing important factors such as average patient waiting time and variability of case
durations that impact OR utilisation. Guinet and Chaabane (2003) solved the weekly
patient-to-OR assignment problem using a primal-dual heuristic. They considered
patient satisfaction and resource efficiency with an objective to minimize the number
of days patients wait in the hospital and the overtime. Lamiri et al., (2008) aimed to
minimize OR utilisation costs and patient-related costs by proposing a stochastic
programming model for the assignment of elective surgeries. Uncertainty of demand
for emergency cases was solved using a column generation method. Column
generation is a statistical method where only the variables which have a significant
impact are considered. Traditional linear program methods often require consideration
of many variables which can render the solution of the equation potentially irrelevant.
Column generation focuses on those variables which are deemed statistically to have
the greatest effect. Lovejoy and Li (2002) focused on the trade-off between waiting
time, procedure start time reliability, and hospital revenues to expand the OR capacity.
2.1.7.C : Efficiency Measurement in Healthcare
Utilisation is dependent on efficiency. To have an optimum utilisation of space it is
necessary that efficiency is measured, but measuring efficiency in healthcare is not an
easy task as it depends on a number of variables and risk factors. Burgess (2012)
attempts to explain that efficiency in healthcare is significantly related to quality, value

59
and cost where value is defined as quality/cost. He further states, efficiency could be a
concept related to cost (saving or minimizing costs) or related to both cost and quality
(some sense of optimisation) or directly related to overall value. In addition to this
Burgess concludes that to some extent efficiency is dependent on access to healthcare.
Hollingsworth (2003) reviewed a number of studies conducted on measuring
healthcare efficiency and identified that measurement of efficiency in healthcare has
expanded over the past few years and that non-parametric and parametric methods
have been employed to measure and analyse the operational performance of
healthcare services. Rahman (2006) conducted a study on managerial efficiency in
Bangladesh. This study assessed the status of health care services provided in terms of
their technical efficiency, explored the potential cost-savings by eliminating
inefficiency and examined what factors contributed to the inefficiencies. Meanwhile, in
the USA, Kumar and Nunne (2008) attempted to compare the efficiency of general and
specialty hospitals using stochastic frontier regression analysis based on realistic
assumptions from the data collected. They concluded that speciality hospitals were
more efficient than general ones. However Gomes et al., (2010) proposed a systematic
approach to measuring, tracking, monitoring and continuously improving efficiency,
availability and quality in healthcare by quantifying service effectiveness in healthcare
operational setting. One other way of measuring efficiency as suggested by Anderson-
Miles (1994) was ‘Benchmarking’ which was previously applied in other industries and
had entered the health sector. He recognised that benchmarking has the potential to
improve efficiency, cost-effectiveness, and quality of healthcare services.
This section has considered a range of concepts and techniques all of which are
common place in Western manufacturing and service industries. It has noted that since
the early 2000s, they have been increasingly applied in Western healthcare, often with
great success. Indian healthcare is beginning to take note and attempt to apply some
of the same principles as diaspora return from working and studying abroad. However,
it was noted, that failures in implementation are often not down to the limitations of
the techniques, but can actually be caused by cultural differences in the working
methods of Indians when compared to Westerners. It should also be noted that there

60
is no one system, concept or technology which can provide all the answers. Often, the
best solution comes from a hybrid approach combining the most effective bits of each
method. Though, it was also noted that the most effective bits of each
method/technique may vary when implemented in different settings.

61
3. RESEARCH AIM AND OBJECTIVES This chapter deals begins with a research question which provides the relevance of the
research to the wider healthcare community. The aim of the study brings this into
sharper focus for the hospital at the centre of the research. The primary and secondary
objectives will break the aim down into manageable packages which will contribute to
achieving the aim. It also highlights the significance of the research.
3.1 : Research Question
To what extent can Western manufacturing management concepts and scheduling
strategies be applied in Indian healthcare?
Indian healthcare, as noted in the introduction is under great pressure from under-
funding and increasing demand due to India’s burgeoning population. India, with the
world’s second largest population has a massive healthcare burden which is only being
addressed by a Government spend of less than 6% of GDP. Thus, this research aims to
identify how efficiency can be improved in an Indian hospital by utilising proven
techniques from Western manufacturing and service companies. Many of these, as the
literature has proven, have been successfully applied in Western healthcare.
3.2 : Aim of the Study
This study aims:
“To apply manufacturing management concepts and methods to achieve
improvements in patient retention, by improving the process flow, to optimise the
use of resources whilst maintaining high quality care in an Indian Super-Speciality
Hospital.”
The aim concentrates on several key elements. These are:

62
that there are techniques which can be applied, having been successful in
Western hospitals, to an Indian hospital.
that retention of patients is a key objective of the hospital due to the positive
effect this will have on revenue through word of mouth and brand recognition.
that analysing and improving the current processes will identify areas which
can generate greater efficiency in working methods, scheduling of patients and
ultimately, improve patient satisfaction.
that maintaining the high standard of healthcare provided to the study
hospital’s patient base is paramount to the success of the organisation and
must not be jeopardised.
Thus, these will be brought about by process mapping to understand the current
systems in the hospital. The author will then consider and apply, where appropriate,
elements and concepts from some of the strategies used in manufacturing. These
strategies, such as, JIT, Lean, Japanese 5S, MRP, ERP, Capacity planning and Scheduling
are now being applied in the health and service industries in attempt to attain a
flawless process which will improve productivity and flow, increase quality whilst
reducing operational costs.
3.3 : Objectives
These following objectives were set to accomplish the aim:
Primary objectives –
1) Analyse and re-engineer the process flow in the OPD – It is necessary to first
thoroughly understand the present methods and process in the OPD and then
identify the problems occurring and analyse the root cause.
2) Standardise OPD operational processes – Once the root cause for the problems
in the OPD is identified and analysed, changes in the OPD process flow will be
brought about and implemented to check for the viability of the improved

63
process. Standardised process flow will thus be more convenient for the
patients as well as the staff in all the OPD sectors.
3) Implement the re-engineered process – The proposed process is validated by
the Operations Manager and then implemented to assess the significance of
the changes brought about in the process.
Secondary objectives –
1) To map the AS – IS process of the OPD in order to obtain knowledge on the
present system – The journey of an Outpatient is observed and noted from the
time he/she enters the hospital until he/she leaves after consultation. This will
aid in fully understanding the Outpatient process flow.
2) Analyse all operational factors essential for the study – Data attributes
influencing operational factors and the process flow are selected to be studied.
3) Prepare a checklist on the necessary resources required in each consultation
room and the OPD reception – In order to have a standardised and regularised
OPD, a checklist will be prepared with all the materials and resources needed
and implemented to ensure room readiness before the consultant arrives.
4) Produce a TO-BE process map of the OPD, reflecting viable changes that can be
brought about – After identifying and analysing problems in the present
process, changes in the Outpatient process flow are proposed and a TO – BE
process is mapped. This is then validated by the Operation Manager and
implemented to evaluate the changes.
3.4 : Significance of the Study
The significance of this Research is based on two factors –
IMPORTANCE – Across India, the waiting period for consultation has been
identified as the prime problem in the Outpatient Department of private
hospitals and clinics. This results in cancellation of appointments and refunds
which not only causes patient dissatisfaction towards hospital services but also

64
affects the hospital revenue. In the study hospital, on an average, 0.8% of the
total number of appointments booked was being cancelled daily due to
prolonged waiting time. This amounted to a considerable loss in revenue. Thus
it is essential to understand the process flow of an outpatient in order to find
the means by which waiting periods could be reduced. Also, with the increase
in total number of outpatients attending the OPD, the study hospital observed
a decline in the percentage of booked patients compared to a rise in the Walk-
in patient’s percentage. This was mainly because those patients who previously
booked an appointment for consultation were unhappy with the long waiting
time at the OPD which upset their schedule for the day. These patients now
preferred walking in for consultation at a time of their own convenience. Thus,
this reflected a great need to strengthen the Appointment system.
FEASIBLITY – A thorough understanding of all the factors influencing waiting
periods of a patient: OPD arrival time of the consultant; average time taken for
consultation; number of walk-in patients and overlapping of OT and OPD timing
of surgical consultants, were selected as data attributes. These were analysed
to arrive at possible methods by which waiting time could be shortened. To
have an efficient and effective process flow, it is necessary to understand the
present system and all factors influencing it to bring about viable changes to
achieve a streamlined process.

65
4. METHODOLOGY
This chapter begins with the introduction of the hospital where the research was
conducted and explains in detail the methods, tools and various techniques used in the
study. This project was very challenging and interesting, as it was a live study
conducted in a 300 bed tertiary-care multispecialty hospital. The study was conducted
with the aim of standardising the processes within the OPD, to expedite the flow of
patients and optimise the use of time, space and other resources. Appendix A shows
the Project Plan and this highlights the project milestones.
4.1 : Research Setting
The study was carried out in a 300 bed tertiary-care Multi-specialty Corporate Hospital
in Bangalore for a duration of 36 weeks. The hospital is Joint Commission
Internationals (JCI) accredited, which is the gold standard accreditation for Healthcare
organisations around the world. It is well equipped with the state-of-the-art
technology and has an excellent infrastructure with some of the best medical
fraternity in the country. Established in 2006, the hospital has had continuous growth
in the field of healthcare and has emerged as one of the best hospital in India. Along
with Indian patients, it draws a large percentage of international patients through
Medical Tourism, providing them a vast range of facilities and services with the best
possible medical care and treatment.
This research was conducted in the Out Patients Department area of the hospital
which includes several specialties like – Internal Medicine, General Surgery,
Orthopaedics, Paediatrics, Obstetrics and Gynaecology, Neuro-medicine, Neuro-
surgery, Gastroenterology, Dermatology, Endocrinology, Cardiology, Ophthalmology,
ENT, Psychiatry.

66
4.2 : Organization Need
The hospital has faced a number of issues with its Out Patients Department (OPD) for a
number of years. These include a significant increase in Did Not Attends (DNAs)
whereby a patient with a scheduled appointment fails to attend and notify of non-
attendance. At the same time, there has been an increase in the number of Walk-In
Patients who have attended the clinic without a pre-scheduled appointment. Walk-In
patients pose a number of problems for the hospital including how to actually
accommodate them within the consultant’s schedule. Proposed solutions have
included having consultants treating only Walk-In patients, having Walk-In periods
scheduled on particular days and even making all appointments Walk-In. All of these
solutions have their own particular set of problems, and outcomes. One outcome
already noted are reduced patient satisfaction amongst retained patients as their
scheduled appointment times are not being met.
Private Indian Healthcare is expensive relative to the average Indian household
income. Additionally, there is ever increasing competition as new providers emerge
and existing healthcare groups merge to form stronger, larger rivals. It is therefore
very important for the healthcare organisation that operates the study hospital that it
maintains its position of market dominance. It recognises that this study may unearth
techniques which could be utilised across all its hospitals as with the Üsou, Shetty et al
2011, study.
4.3 : Study Design
It is an observational, cross sectional study in a non-interventional control group,
conducted in the OPD area of a multi-speciality hospital that functions between the
hours of 0800 to 2000. Data was collected over a span of 8 hours every day for a
period of 15 weeks.
The study began with mapping the AS-IS process of the OPD patient flow and collecting
retrospective data from the HIS, (Hospital Information System) to fix the sample size

67
(which is a minimum of 30% footfall for a month, for each consultant of every
speciality) and then continued as a concurrent study, wherein simultaneous
observation and data collection was carried out at the OPD sector. The entry and exit
time of each patient is noted using a digital watch and manually entered into an Excel
sheet, following the display of the patient ID number on the screen within the OPD
premises. The consultation time for each patient was then calculated from the
difference between the timings and the average time taken by each consultant was
derived from it. A standardise checklist was prepared to ensure that all required
materials and resources are made available in each consultation room, to make their
usage optimum.
The study is carried out in three phases –
Phase 1 – Included data collection
a) Retrospective data collection from the HIS to determine the sample size.
b) Concurrent data collection by observation of the required parameters within
the OPD processes.
Phase 2 - Involved compilation of the data collected, calculation and data analysis to
arrive at the results of the study.
Phase 3 – Was the final phase that involved, discussion of the findings of the study,
making recommendations and implementing a pilot to evaluate the effectiveness of
this study and its recommendations.
A fundamental layout for the Research to be conducted was planned and a strategy to
proceed with the study was agreed between the industrial supervisors, the author and
the thesis supervisor. This strategy is depicted in in Figure 6.

68
Figure 6 : Research Strategy.
This study’s aim is to understand how to “Re-engineer the Outpatient Process Flow”
for optimum use of available resources. It does not include the Re-engineering process
itself, as the Implementation phase (indicated in the Red Box) was not carried out. The

69
project’s scope includes only making the recommendations and proposing a TO-BE
process (after validation).
The methodology deals mainly with three obligatory steps to conduct research; which
intends to be the blueprint to change: Firstly – Process Mapping, Secondly – Sampling
of the population and selecting the sample to be studied and Thirdly – Data Collection
and Analysis.
4.3.1 : Process Mapping
The first important step was to conduct the AS-IS process mapping, to understand the
present system and identify the problems occurring in the process which helped to
decide on the data parameters required for the study. Following data collection and
analysis, recommendations on practical changes that can be brought in are made in
order to create a TO-BE process map.
For a complete understanding of the OPD system an in-depth knowledge of the
Outpatient process flow is essential. This should include the activities occurring at each
step and the waiting time and other information which can identify factors which are
hindering the process flow. The complete process of an Outpatient Department is
discussed in this chapter and mapped using Microsoft Visio 2010.
The study involves observing the AS-IS Process in the OPD area of the hospital, to
identify the shortcomings and propose a TO-BE Process with an objective of
constructing a more efficient process flow which would maintain the quality of care
whilst meeting the expectations of the patients and thus increasing their satisfaction.
The journey of an outpatient from the time of entry into the hospital till their exit is
witnessed and the waiting periods at every step are identified.

70
4.3.1.A : AS – IS Process
Process flow of an Outpatient begins with the Registration process in the case of a new
patient and from Acknowledgement of the UHID number into the system in the case of
an existing patient and ends with the patient being advised, either with a prescription
for medication/treatment or for laboratory/radiological investigations or with an
admission request form where needed.
The various stakeholders involved in the OPD process flow are –
a. Patient
b. Registration Counter staff
c. OPD Reception staff
d. Vitals assessment Nurse
e. Consultant
f. Outpatient Billing staff
g. Sample collection staff
h. Laboratory technicians
i. Radiology Procedure staff and technicians
j. Treatment Room nurse
The series of events occurring in the Process flow of an Outpatient from the time a
patient enters the hospital till he exits are as follows –
Step 1 : Acquiring hospital UHID number
In the case of a New patient, at the Registration counter, the registration file is
completed and submitted following which the registration staff enter the details of
the patient into the system and prints the UHID card.
Step 2 : Acknowledging the patient
In the case of a new patient, after the registration process is completed, the
patient is directed to the OPD for acknowledgement of the UHID number. On the
other hand, a known patient who already holds a UHID number proceeds directly
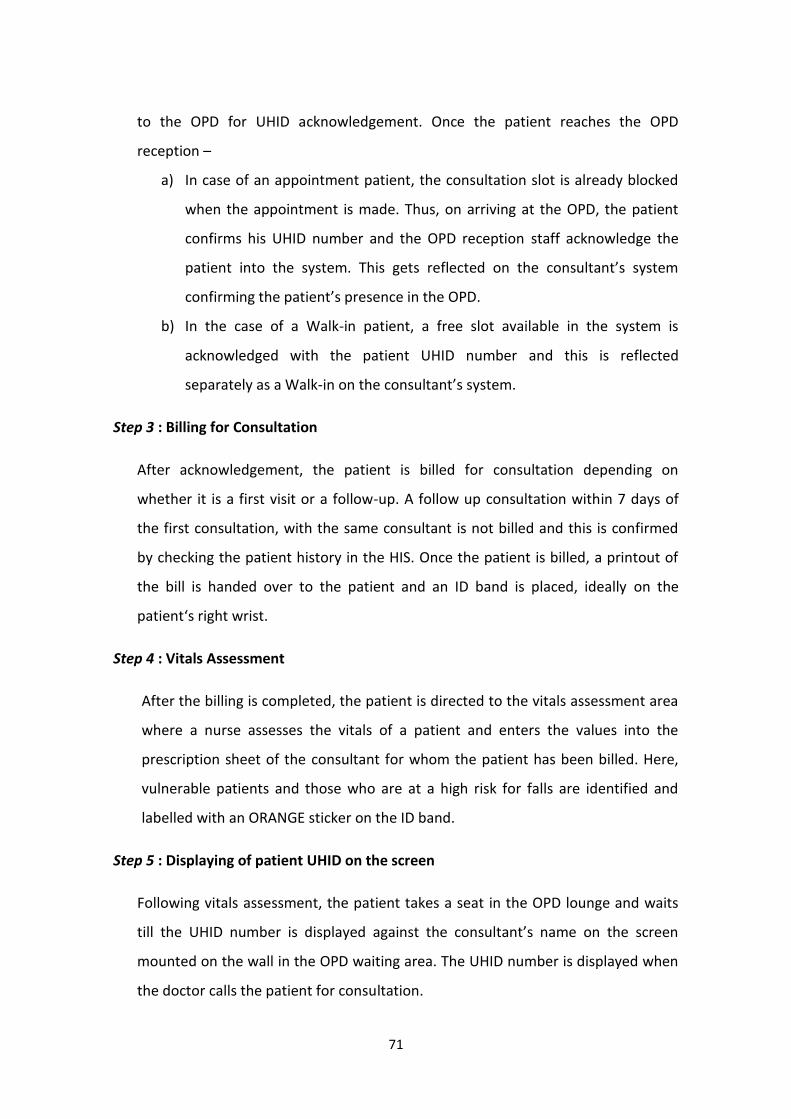
71
to the OPD for UHID acknowledgement. Once the patient reaches the OPD
reception –
a) In case of an appointment patient, the consultation slot is already blocked
when the appointment is made. Thus, on arriving at the OPD, the patient
confirms his UHID number and the OPD reception staff acknowledge the
patient into the system. This gets reflected on the consultant’s system
confirming the patient’s presence in the OPD.
b) In the case of a Walk-in patient, a free slot available in the system is
acknowledged with the patient UHID number and this is reflected
separately as a Walk-in on the consultant’s system.
Step 3 : Billing for Consultation
After acknowledgement, the patient is billed for consultation depending on
whether it is a first visit or a follow-up. A follow up consultation within 7 days of
the first consultation, with the same consultant is not billed and this is confirmed
by checking the patient history in the HIS. Once the patient is billed, a printout of
the bill is handed over to the patient and an ID band is placed, ideally on the
patient‘s right wrist.
Step 4 : Vitals Assessment
After the billing is completed, the patient is directed to the vitals assessment area
where a nurse assesses the vitals of a patient and enters the values into the
prescription sheet of the consultant for whom the patient has been billed. Here,
vulnerable patients and those who are at a high risk for falls are identified and
labelled with an ORANGE sticker on the ID band.
Step 5 : Displaying of patient UHID on the screen
Following vitals assessment, the patient takes a seat in the OPD lounge and waits
till the UHID number is displayed against the consultant’s name on the screen
mounted on the wall in the OPD waiting area. The UHID number is displayed when
the doctor calls the patient for consultation.

72
Step 6 : Consultation with the patient
Once the patient UHID number is displayed, the patient enters the respective
consultant’s room and comes out after completing his consultation.
Step 7 : Outcome of consultation
This is specific to each patient –
a) Patient is prescribed medication – Patient goes to purchase medicines in the
pharmacy within the hospital premises or outside.
b) Patient is advised to have an injection/treatment/minor procedure – Patient is
directed to the Treatment Room where the patient takes a token and waits for
their number to be called for the procedure to be done. Once the procedure is
completed, the patient is then billed accordingly at the OPD reception.
c) Patient is advised Laboratory/Radiological investigations –
i. Laboratory investigation – Patient goes to the front office for billing for the
investigation and then is directed to the sample collection area where the
sample is collected. The collected sample is sent to the laboratory in
batches, where it is processed and the results of the tests are obtained.
ii. Radiology investigation – Patient goes to the front office for billing for the
investigation and then is directed to the Radiology Department, where the
patient is called for the procedure (X-ray or Ultrasound). In case of a CT
scan or MRI, a separate appointment needs to be taken.
d) Patient is advised admission – Consultant gives an admission request form to
the patient which is submitted at the front office to book a room for admission
and the patient is admitted.
NOTE : Refer Appendix B for the AS – IS Process Map of the OPD.

73
Idle Time (Patient waiting time) in the Process flow
Idle time was observed in the process flow of an Out Patient where Queuing occurs
indicating waited time for patients are –
1) At the Registration counter to obtain UHID number
2) OPD reception for acknowledgement of UHID number and billing for the
consultation fee.
3) At the vitals assessment area
4) Waiting in the OPD lounge to see the consultant
5) Billing of investigations, post consultation
6) At the sample collection area, to collect sample
7) At the Radiology section, patient waits to be called in for the procedure.
8) At treatment room, till patient token number is displayed
9) At report collection desk
4.3.1.B : Validation of the AS – IS Process
A process map should be validated by the process owners to ensure it is the correct
representation of the process being examined. It also ensures that process owners
understand and are committed to the re-engineering process by offering them greater
involvement. Due to the hierarchical nature of Indian Healthcare, individual process
owners were not permitted to sign off their processes. Therefore, the AS – IS process
was validated by the senior representative of the hospital, Dr. Vinit Samant
(Operations Manager) on the 12th May, 2014.
4.3.1.C : Root Cause Analysis for Waiting Time in OPD
Factors identified to be influencing the waiting time period of a patient are (as in
Figure 7.) –

74
A. Patient
A Walk-in patient waits invariably for the consultation depending on the
number of Appointment patients present.
A New patient needs to complete the Registration procedure and hence has
a longer process to comply with.
An Appointment patient who arrives late, after the allotted time
subsequently ends up waiting.
A patient making payment through Debit card takes longer time to be billed
than a patient paying cash.
B. Consultant
Punctuality of the consultant. Late arrival of the doctor delays the
consultation of the first appointment, subsequently postponing other
appointments.
In many cases there is an overlap of OT and OPD slot time for surgical
consultants.
C. Nursing staff
The ability of the nurse to complete vitals assessment and treatment
procedures more efficiently.
Availability of adequate number of nursing staff in relation to the
number of patients needing to be assessed.
D. OPD reception staff
Depends on their work aptitude to reduce billing errors and have
minimal refunds.
Being more vigilant about avoiding errors concerning UHID
acknowledgement.
E. System
Systems break down causing delay in the process.

75
Figure 7 : Root Cause Analysis for Waiting Time in OPD.
4.3.1.D : TO – BE Process
The TO – BE process map which implements the recommendations was created after
completion of data analysis and interpretation and can be viewed in the
Recommendations chapter.
4.3.2 : Sampling Technique
Sampling is an integral part of the Research Methodology. It is a process used to select
a segment of the population to collect the data from and extrapolate the conclusions
of a study. Thus the selected sample should ideally reflect the target population.
“Sampling Theory is developed to determine mathematically the most effective way to
acquire a sample that would accurately reflect the population under study” (Nalzaro,
2012). A good sample should represent the study population and be of adequate size.
It should be reliable, unbiased and yield precise estimates for the whole population.
Figure 8. shows the Types of Sampling Techniques.

76
Figure 8 : Types of Sampling Techniques.
The sampling technique used in the study is Simple Random Sampling.
The reasons for choosing this method are –
1) Easy, simple to understand and less time consuming.
2) Chosen sample is homogenous.
3) The findings of the sample chosen will be generalised to the entire population.
4) All the elements in the population have an equal chance of being selected.
5) Amount of sampling error associated with any sample drawn can be computed
easily.
6) Does not require prior knowledge of the true composition of the population.
Limitations – Less precise than other methods.
SAMPLING TECHNIQUES
Non Probability Probability
Convenience
Quota
Purposive
Simple Random
Systematic
Stratified
Cluster
Multi-stage

77
4.3.3 : Inclusion and Exclusion Criteria
The study population includes all patients walking into the OPD for consultation; newly
registered or known, including international patients, and those with appointments or
attending on a walk-in basis, whether it was their first visit or follow up, post-operative
follow up including the health check package customers. The patients excluded were
those who came to discuss their reports. From the HIS, the total number of patients
seen for a month by each consultant was retrieved and a minimum of 30% footfall for
a month was calculated and selected as the sample size, since 30% is seen as
statistically significant in any statistical test. The month of January 2014, is chosen to
derive this sample size. A random sample from all the departments is then studied, on
a two week rotational basis in each OPD and the data is compiled for analysis to arrive
at the results.
The specialities included in the study are –
1. Internal Medicine 11. Psychiatry
2. General Surgery 12. Endocrinology
3. Obstetrics and Gynaecology 13. Dermatology
4. Orthopaedics 14. Vascular Surgery
5. Paediatrics 15. Surgical Gastroenterology
6. Ophthalmology 16. Geriatric Medicine
7. ENT 17. Pulmonology
8. Neuro Medicine 18. Urology
9. Neuro surgery 19. Cardiology
10. Rheumatology 20. Paediatric Orthopaedics
These specialties were selected as they were observed during the author’s hospital
orientation and acclimatisation period to be crowded on all days. They had fully
booked appointments and an unpredictable number of Walk-in patients flooding into
the OPD area. This resulted in a prolonged waiting period for patients and extended
consulting hours for the doctors. Hence these specialities require assistance with

78
streamlining the appointment system and allotting a fixed number of Walk-in for each
consultant to make better use of time, space and other resources available.
On the other hand some specialities excluded were –
1. Clinical Psychology 8. Cardio-thoracic vascular Surgery
2. Infectious Diseases 9. Neuro Anaesthesia
3. Nephrology 10. Dentistry
4. Oncology 11. Hand Surgeon
5. Paediatric Surgery 12. Cosmetology
6. Paediatric Endocrinology 13. Liver Clinic
7. Medical Gastroenterology 14. Infertility Clinic
As they were observed to be relatively free, with a majority of the patients who have
appointments and only an occasional patient walking in without an appointment.
Furthermore, for these specialities the consultants had their respective coordinators
who dealt with allotting appointments to the patients depending on the doctor’s
availability to attend to his patients in the OPD.
DNA patient sample
A sample size of 200 patients was chosen to study the reason for high proportion of
DNA (Did Not Attend) over a span of two months. Patients for all the consultants
within those specialities chosen for the study were included. However, patients who
arrived late for consultation after the scheduled time were excluded and not
considered as a DNA patient.
Sample for overlapping of OT and OPD time
Simultaneously along with other data collection, for a period of four weeks, the
coinciding of OT and OPD timing for surgical consultants was studied. This included all
the consultants of surgical specialities that were chosen for the research.

79
4.3.4 : Sample Breakdown
The OPD sector of this multi-specialty hospital is divided into 8 zones – OPD 1, OPD 2,
Paediatric OPD, Oncology OPD, Cardiology OPD, Dental OPD, IVF clinic, Nephrology and
Gastrology OPD. Each zone has a number of specialities within it. In accordance with
the inclusion and exclusion criteria, the OPD zones and the specialities in them which
were selected for the research are shown in Table 3. which explains the sample
breakdown for the study. A total of 58 consultants from the 21 chosen specialities
were planned to be studied.
OPD 1
1. Orthopaedics
2. Internal
Medicine
3. Neuro-
diagnostics
4. Neuro-surgery
5. Ophthalmology
6. ENT
7. Psychiatry
8. Rheumatology
9. Urology
10. Pulmonology
OPD 2
1. Endocrinology
2. Dermatology
3. Gynaecology
4. General Surgery
5. Geriatric
Medicine
6. Paediatric
Orthopaedics
7. Surgical
Gastroenterology
8. Vascular Surgery
Paediatric OPD
1. Paediatric
medicine
2. Neonatology
Cardiology OPD
1. Cardiology
Table 3 : Sample Breakdown in the Study.
4.3.5 : Data Collection
The entire process of an Outpatient consultation from the time of registration, in
the case of a new patient or acknowledgement of the ID number into the system in
the case of an existing patient, is witnessed till the patient is called for the

80
consultation and walks out, either with a prescription for treatment or for
laboratory/radiological investigations or with an admission request form if needed.
Retrospective data was retrieved from the HIS and 30% footfall for the month of
January 2014 of individual consultants to be studied was calculated and fixed as
the sample size.
Data was primarily collected by observing the time taken for consultation by each
consultant for every patient from a randomly selected sample. Entry time of the
patient is noted when the patient UHID number is displayed on the screen.
HIS provides information on the registration status of every patient and if the
patient is a Walk-in or has previously taken an appointment.
HIS also provides details on the patient history and information to know whether
it’s the first visit or a follow up case.
Waiting time for every patient either with Appointment or Walk-in was tracked
from the time the patient UHID number is acknowledged into the system till the
patient is called in for consultation.
Information on the OPD consultation hours of each consultant was obtained from
the Patient Relations Manager (PRM) and checked if it was followed as per the
allotted time.
Each room was inspected prior to each appointment, to see if it was well equipped
with all materials and resources required for that particular speciality. A checklist
was prepared and implemented to cross check the rooms regularly.
Although not originally part of the methodology, two other parameters were included
in data collection, as they seemed to greatly influence the OPD scheduling system.
i. Tracking the DNA patients gained importance, as it was noted during data
collection that a prominent percentage of Appointment patients did not arrive
for the consultation, denying the opportunity of booking an appointment slot
for genuine patients who had to come as Walk-in patients. Tracking involved
following up on DNAs where contact details were available and asking the
reasons for non-attendance.

81
ii. Tracking overlap of the OPD and OT timing of Surgical consultants became
necessary as on many occasions the surgeon was in the OT when an OPD
appointment had been scheduled for a patient who had to invariably wait for
an unspecified length of time to consult the doctor.
To track the number of DNA patients, the total number of appointments booked
per session and the number of unturned appointments for that consultant was
procured.
A telephone call was made to each of the unturned Appointment patients on the
following day to know the reason for not attending their appointment.
To tap the overlapping of OT and OPD timings for surgical consultants, firstly, the
OPD timings of each consultant was noted from the PRM. Secondly, each day’s OT
lists scheduled, was collected from the OT executive and then the two timings
were matched to check for overlapping. This was carried out for a period of four
weeks which amounted to 24 days, as there were no elective surgeries scheduled
on Sundays.
4.3.6 : Checklist
Initially, the hospital did not recognise the need for a checklist at the OPD even
though; it was being used in the In-Patient Department. Here, the house-keeping staff
used a checklist to ensure room readiness with all the resources and materials in place
before being occupied by a patient. However in the OPD sector, certain materials and
resources thought to be necessary were placed in the consultation room and at the
reception, but were not replaced even after being emptied, until asked for. During the
OPD operating hours, it was often noticed that the consultants called for the OPD
house-keeping staff when certain resources were needed. These resources were
unavailable or had not been replaced after being used. Occasionally the maintenance
staff was requested, during consultation, to check on the electricals that had
malfunctioned. On many occasions, the consultants had to walk up to the OPD
reception to get extra investigation forms and other request forms. This action

82
invariably prolonged waiting time which caused delay in consultation. Hence, it was
necessary to introduce a Checklist in order to have the consultation rooms ready
before the consultants arrived.
In order to develop an OPD checklist, the following method was applied:
1) Interview: A minimum of two consultants from each speciality were
interviewed. This identified the resources and equipment required in their
consultation rooms. It also noted which extra materials would aid in providing a
quality service to the patients.
2) Inspection: a thorough inspection of the OPD reception area and individual
consultation rooms was performed to determine the materials/resources
required for each consultation and the current level of provision of
materials/resources was also noted.
3) Design: A checklist inclusive of all materials and resources required was then
prepared based on the identified needs of the consultant. It included
separating out those materials and resources which were common to all
specialties and those which were unique to specialties.
4) Implement: Each room was set up to ensure room readiness before the arrival
of each consultant.
Thus, by applying the Lean and Japanese 5S philosophies, sources of waste were
eliminated and reduced. Having only the required materials and resources present,
eliminated idle time spent searching for a required item amidst items which are
surplus to requirement. This applies Seiton (order) and Seiri (sort) from the lean
philosophy to making sure resources were available and easily selected. The Checklist
also applied Shitsuke (sustain) in ensuring equipment maintenance was performed
before the day’s consultations. Seiketsu (standardise) was utilised by identifying
specialty-specific and specialty-unique resources.

83
5. STATISTICAL ANALYSIS
This chapter deals with data compilation, calculation, analysis and arriving at the
results of the study using the appropriate formulae and statistical packages. Data
collected in Phase 1 of the study was analysed using the statistical tools included with
Microsoft Excel 2010.
5.1 : Data Compilation
During Phase 1 of the study, data collected for each consultant was directly
entered into Excel. On completion of data collection, the data was grouped
according to speciality. The compiled data was then formulated into a table to
arrive at the results.
The data points collected for the calculations were –
1) Consultant name and speciality.
2) Total number of patients (sample size) studied for a particular consultant.
3) Time taken to consult with the sample number of patients by every
consultant.
4) Total number of Appointment patients in the sample of each consultant.
5) Total number of Walk-in patients in the sample of each consultant.
6) Appointment to Walk-in patient ratio.
7) Average time taken to consult an Appointment patient.
8) Average time taken to consult a Walk-in patient.
9) Number of patients in the sample who were billed.
10) Number of follow up patients in the sample who were not billed.
11) Percentage of follow-up patients for each consultant.
12) OPD consulting time allocated per week for every consultant of all
specialities in minutes.
13) Total number of patients a doctor can ideally consult in a week.
14) Average number of patients, presently consulted by the doctor per week.

84
15) Average time (in minutes) of the allocated consultation time exceeded by
the consultants.
16) Consultation slot time suggested for each consultant.
17) Number of Appointment patients that can be allocated every hour to each
consultant.
18) Number of Walk-in patients that can be allowed every hour for each
consultant.
19) Percentage of DNA appointments.
20) Additional number of Walk-in patients that can be allowed considering
those who DNA.
21) Total number of Walk-in patients that can be allowed per OPD session to
each consultant of every speciality.
5.2 : Data Calculation
A set of formulae are adopted as performance indicators to calculate and arrive
at a number of parameters that will help to regularise the OPD and standardise
the outpatient process flow.
A. To Fix a Consultation Slot Time
a) Time taken by each doctor to consult a patient is calculated by the
difference between the entry and exit time of the patient into the
consultation room. Expressed as :
Consultation time Exit time Entry time b) Average consultation time is then derived by calculating the mean
consultation time for the chosen sample size specific to each doctor.
Average Consultation Total Consultation Time
Time n
(where, n = sample size for the consultant)

85
c) Appointment to Walk-in patient ratio (A : W) is determined from dividing
the total number of appointments by total number of walk-in patients for
each consultant.
Appointment to Total Number of Appointments
Walk-in Ratio Total Number of Walk-ins
d) Taking to account the A : W and the average consultation time, the time
that needs to be allocated for each consultation is fixed accordingly.
B. To Calculate Maximum Number of Walk-in Patients that can be
Allocated to Every Doctor of each Speciality
a) For the sample size of each consultant, the Appointment patients were
identified from the HIS noting down their total numbers.
b) Number of Walk-in patients seen was arrived at by calculating the
difference between the total number of patients consulted and the number
of appointment patients included in this number.
Number of Total Number of Number of Walk-in Patients Patients Consulted Appointment Patients
c) Average consultation times for Appointment patient and Walk-in patients
were calculated separately by identifying individual times for each
consultant.
Average Appointment Total Appointment Consultation time Consultation time Number of Appointment patients
Average Walk-in Total time for Walk-in consultation Consultation time Number of Walk-in patients

86
d) OPD consultation time (in hours) allocated for every consultant in a week,
was noted down from the PRM Department and was converted into
minutes.
e) Total number of patients that can be seen by a doctor during the time
allocated in a week for that doctor was then calculated by dividing the
product of sample size studied and the total time in minutes taken to
consult the chosen sample by the total consultation time in minutes
allocated for that consultant in a week.
Total number of Sample size Total consultation time taken Patients that can for the sample size (in mins) be seen per week Total Consultation time (in mins) allotted For the consultant per week
f) Standard Deviation (SD) for Appointment and Walk-in consultation time
was obtained separately using the statistical tool in Microsoft Excel 2010.
g) The percentage of DNA appointments for every consultant was determined
dividing the number of unattended appointment patients by the total
number of appointments booked for the session and multiplying that
product by 100.
DNA% Number of unturned Appointments 100 Total number of Appointments booked
h) Together with the DNA%, consultation slot time fixed in previous
calculation and the Appointment to Walk-in patient ratio for a particular
consultant, the maximum number of Walk-in patients that can be allotted
to every doctor is determined.

87
5.3: Data Analysis
The findings of the study following data analysis in Phase 2 are discussed in this
chapter.
The study was carried out in four sectors of the OPD – OPD1, OPD2, (refer to the
Sample Breakdown in table no. 3 on page 78 to identify the specialities under OPD1
and OPD2), Paediatric OPD and Cardiology OPD. The Total number of patients studied
was 5550, from the 58 consultants that were chosen for the study.
Out of the 5550 patients, 1118 fell into the Paediatric group (below 18 years of age) of
which 660 were male patients and 458 were female patients and the remaining 4432
were adult patients of which 2127 were males and 2305 were females (as shown in
Table no.4 and Figure no.9). Furthermore, the adult patients studied were grouped
into 6 age groups as shown in Table 5. and Figure 10.
660
2127 458
2305
0
500
1000
1500
2000
2500
3000
3500
4000
4500
5000
Paediatrics Adults
Nu
mb
er o
f P
atie
nts
MalesFemales
Number of Male and Female Patients under Paediatric and Adult group
Group Number of Males
Number of Females
Paediatrics 660 458
Adults 2127 2305
Table 4 : Number of Male and Female patients under Paediatric and Adult group.
Figure 9 : Number of Male and Female Patients under Paediatric and Adult group.

88
Age in years Number of patients
18-27 226
28-37 547
38-47 1828
48-57 1165
58-67 564
68-77 102
Table 5 : Adult patients grouped into Six Age Groups
Figure 10 : Number of Patients in each Age Group
5.3.1 : Appointment and Walk-in Patient Analysis
Out of the total number of patients studied, the number of Appointment patients
was 2837 and Walk-in patients was 2713, indicating only a marginal difference
between the hospital Appointment and Walk-in patients. However, the hospital
226
547
1828
1165
564
102
0
200
400
600
800
1000
1200
1400
1600
1800
2000
18-27 28-37 38-47 48-57 58-67 68-77
No
. of
Pat
ien
ts
Patient Age Group (in years)
Number of Patients in each Age Group

89
received a slightly greater number of appointment patients than walk-in (as in
figure 11.).
Figure 11 : Comparison of the Total Appointments to Walk-in Patients Studied.
Table 6. and Figure 12, 13 show detailed division of the patients based on the OPD
sectors studied. It elucidates that the number of Walk-in patients were greater than
the Appointment in OPD 1 and Paediatric OPD, whereas in OPD 2 and Cardiology OPD
the number of Appointment patients were more than the Walk-in patients.
OPD Sectors Appointments Walk-in Total Patients Variability
OPD 1 1238 1327 2565 W > A
OPD 2 877 708 1585 A > W
Paediatric 550 600 1150 W > A
Cardiology 172 78 250 A > W
Table 6 : Division of Appointment and Walk-in Patients in the Four OPD Sectors.
51% 49%
Appointments
Walk-ins
Appointment to Walkin Ratio of the Total Patients Studied

90
Figure 12 : Comparison of the Total Number of Appointments and Walk-in Patients of
the Four OPDs.
Figure 13 : Comparison of the Appointment to Walk-in Ratio of the Four OPDs.
1238
877
550
172
1327
708
600
78
0
200
400
600
800
1000
1200
1400
OPD 1 OPD 2 Peds OPD Cardio OPD
Nu
mb
er o
f p
atie
nts
Appointment
Walk-in
Total Number of Appointment and Walk-in Patients of the four OPDs
0%
10%
20%
30%
40%
50%
60%
70%
80%
90%
100%
OPD 1 OPD 2 Peds OPD Cardio OPD
Per
cen
tage
Walk-inAppointment
Appointment to Walk-in Ratio of the Four OPDs
52% 45%
52%
31%
48% 55% 48%
69%

91
A comparison made between the Medical and Surgical Specialities, showed that from
the total number of patients studied, 3301 patients belonged to Medical Speciality
and 2249 to Surgical Speciality (as in Table no 7.). The study further revealed that, the
Walk-in numbers were greater than those of the Appointments for Medical Speciality
and the Appointments were greater than Walk-in for Surgical Speciality (as in Figure 14
and Figure 15.).
Speciality No. of Appointments No. of Walk-in Variability
Medical 1610 1691 W > A
Surgical 1227 1022 A > W
Table 7 : Comparison of Appointment and Walk-in Patients between the Medical and
Surgical Speciality.
Figure 14 : Comparison of the Total Number of Appointment and Walk-in Patients for
Medical and Surgical Specialities.
1610
1227
1691
1022
0
200
400
600
800
1000
1200
1400
1600
1800
Medical Surgical
Nu
mb
er o
f p
atie
nts
Appointments
Walk-in
Total Number of Appointment and Walk-in Patients for Medical and Surgical Specialities

92
Figure 15 : Comparison of the Appointment to Walk-in Ratio for Medical and Surgical
Specialities.
5.3.2 : Waiting Time Analysis
Waiting time for all the Outpatients studied was tracked from the time the patient
UHID number was acknowledged into the system by the OPD reception staff to the
time patient was called in for consultation.
A. Waiting Time for Medical Specialties (as in Table 8. and Figure 16.)
Specialties Average Patient Waiting Time in minutes
Appointment Walk-in
Internal Medicine 25 75
Neuro-diagnostics 20 35
Psychiatry 20 30
Rheumatology 25 45
Endocrinology 30 50
Dermatology 10 20
0%
10%
20%
30%
40%
50%
60%
70%
80%
90%
100%
Medical Surgical
Per
cen
tage
Walk-in
Appointments
Appointment to Walk-in Ratio for Medical and Surgical Specialities
49%
51% 45%
55%

93
Geriatric Medicine 22 30
Paediatrics 25 80
Neonatology 20 40
Cardiology 45 70
Table 8 : Average Waiting Time Period for Appointment and Walk-in Patients of all
the Medical Specialties.
Figure 16 : Waiting Time for the Appointment and Walk-in Patients of all the Medical Specialties.
Appointment patients waited a maximum of 45 minutes for Cardiology, while Walk-in
patients waited a maximum of 80 minutes and 75 minutes for Paediatric and Internal
Medicine Specialty respectively. However in both patient types the least waiting time
was for Dermatology, as this specialty had the fastest turn-around time (TAT) for
consultation.
25 20 20
25 30
10
22 25
20
45
75
35 30
45 50
20
30
80
40
70
0
10
20
30
40
50
60
70
80
90
Tim
e in
min
ute
s
Appointment
Walk-in
Average Waiting Time for Appointment and Walk-in Patients of all Medical Specialties Studied

94
B. Waiting Time for Surgical Specialties (as in Table 9. And Figure 17.)
Specialties Average Patient Waiting Time in minutes
Appointment Walk-in
Orthopaedics 25 45
Neuro-surgery 20 40
Ophthalmology 20 35
ENT 20 30
Urology 35 52
Gynaecology 45 80
General Surgery 28 35
Paediatric Ortho 18 25
Surgical Gastroenterology
20 30
Vascular Surgery 26 35
Table 9 : Average Waiting Time Period for Appointment and Walk-in Patients of all
the Surgical Specialties.

95
Figure 17 : Waiting Time for the Appointment and Walk-in of all the Surgical
Specialties.
The highest waiting time for both appointment and walk-in of 45 and 80 minutes
respectively was noted in Gynaecology. In contrast, Paediatric Orthopaedics had the
least waiting times of 18 and 25 minutes respectively for appointment and walk-in
patients.
5.3.3 : Existing versus New Registration Patients and First
Visit to Follow-up Patient Analysis
In the duration of the study, the numbers for each of First Visit patients, Follow-up
patients, newly registered patients and existing patients for every consultant were
tracked.
Among the total patients studied, the number of New Registration was 1186 and
Existing was 4364, the number of First Visit was 4587 and Follow-up was 963. Thus,
25 20 20 20
35
45
28
18 20 26
45 40
35 30
52
80
35
25 30
35
0
10
20
30
40
50
60
70
80
90
Tim
e in
mu
nte
s
Appointment
Walk-in
Average Waiting Time for Appointment and Walk-in Patients of all Surgical Specialties Studied

96
the hospital saw a considerable percentage of Existing Patients at 79% and Follow-up
of 17% (as in Figure 18. and 19.).
Figure 18 : Comparison between New Figure 19 : Comparison between First Visit and Exiting Patients. and Follow-up Ratio of the Total Patients.
Table 10. and Figure 20. show detailed division of the Follow-up percentage in the four
sectors of the OPD, which reveals that the Cardiology OPD has the highest percentage
of Follow-ups at 29% and Paediatric OPD has the least with 14% Follow-ups.
OPD No. of First Visit No. of Follow-ups Follow-up %
OPD 1 2140 425 17
OPD 2 1276 309 19
Paediatric OPD 993 157 14
Cardiology OPD 178 72 29
Table 10 : Comparison of Follow up Patient Percentage between the Four OPD
Sectors.
21%
79%
New Registration
Old Registration
New versus Existing Patient Ratio of the Total Patients Studied
83%
17%
First Visit
Follow up
First Visit to Follow up Ratio of the Total Patients Studied

97
Figure 20 : Comparison of the First Visit to Follow-up Ratio of the Four OPDs.
A comparison between Medical and Surgical Speciality for the Follow-up showed
Surgical Speciality to have a greater percentage of Follow-up patients than the
Medical Speciality (as in Figure 21.).
0%
10%
20%
30%
40%
50%
60%
70%
80%
90%
100%
OPD 1 OPD 2 Peds OPD Cardio OPD
Nu
mb
er o
f p
atie
nts
Follow up
First Visit
First Visit to Follow up Ratio of the Four OPDs Studied
17% 19% 14%
29%

98
Figure 21 : Comparison between the Medical and Surgical Speciality Follow-up
Percentage.
5.3.4 : DNA (Did Not Attend) Patient Analysis
Following data analysis, a prominent finding of the study was the high percentage of
appointment patients who did not arrive for the consultation. It was found that the
hospital had an average DNA percentage of 26.5% (as in Table 11. And Figure 22.).
OPD Average DNA%
OPD 1 28
OPD 2 28
Paediatric OPD 26
Cardiology OPD 23
Table 11 : Average DNA Percentage of the Four OPD Sectors.
0%
10%
20%
30%
40%
50%
60%
70%
80%
90%
100%
Medical Surgical
Nu
mb
er o
f p
atie
nts
Follow upFirst visit
First visit to Follow -up Ratio of Medical
16% 19

99
Table 11., concludes Cardiology OPD to have the least DNA percentage of 23% and that
OPD 1 and 2 have an equal DNA percentage of 28%.
Figure 22 : Comparison of the Average DNA Percentage of the Four OPDs.
From Figure 23, it is clearly visible that Dermatology had the highest DNA percentage
of 43% and Psychiatry the lowest DNA percentage of 16%.
Figure 23 : Comparison of DNA Percentage for Individual Specialities.
0
5
10
15
20
25
30
Per
cen
tage
Average DNA % of the four OPDs
28% 28% 26%
23%
OPD 1 OPD 2 Peds OPD
Cardio OPD
35
24.5
31 32
26 25
16
28 32
43
20 24
20
27 29
20
40
26 23
05
101520253035404550
Per
cen
tage
DNA% for Individual Specialities

100
Telephone calls made to 200 DNA patients on the subsequent day after not arriving for
the consultation revealed the following reasons for not attending the appointment (as
in Table 12. And Figure 24.).
Reasons for DNA Number of Patients Percentage
Patient was cured 90 45
Unsatisfied with hospital services 12 6
Went to a different hospital for consultation
14 7
Failed to remember about their appointment
42 21
High Cost 8 4
Others 34 17
Table 12 : Reasons for DNA Occurrence.
Figure 24 : Reasons for DNA Occurrence.
45%
6% 7%
21%
4%
17% Patient was cured
Unsatisfied with hospital services
Went to other place for consultation
Fail to recall about the appointment
High Cost
Other Reasons
Percentage chart showing Reasons for DNA Occurrence

101
A high DNA percentage of 45% was a positive feedback as the disease of the patient
was cured. However, a small percentage of 4% DNA was because they found the
consultation fee to be very high.
5.3.5 : Analysis of OT-OPD Time Overlap
This study also looked into the number of times OT-OPD timing of surgical consultants
overlapped. It was found that Urology Speciality has a maximum of 43 overlaps. In
contrast ENT and General Surgery speciality had the least number of 8 overlaps over a
period of 4 weeks (as in Table 13. And Figure 25.).
Specialities No. of Overlaps
General Surgery 8
Orthopaedics 20
Urology 43
Gynaecology 35
Ophthalmology 11
ENT 8
Surgical Gastroenterology
9
Vascular Surgery 11
Neurosurgery 21
Table 13 : OT-OPD Time Overlaps of the Surgical Specialities.

102
Figure 25 : OT-OPD Overlap Time of the Surgical Specialities.
8
20
43
35
11 8 9
11
21
0
5
10
15
20
25
30
35
40
45
50
Ge
ne
nra
l…
Ort
ho
pae
dic
s
Uro
logy
Gyn
aeco
logy
Op
hth
alm
olo
gy
ENT
Gas
tro
en
tero
l…
Vas
cula
r…
Ne
uro
surg
ery
Nu
mb
er o
f ti
mes
ove
rlap
ped
Number of OT-OPD Time Overlaps for

103
6. RESULTS and DISCUSSION
The results of the study obtained in the previous chapters are further discussed here.
The discussion in this chapter draw an insight into the outcome of the study makes
recommendations and supports the conclusions derived.
6.A : Peak OPD Days
During the 5 months of data collection from February 2014 to June 2014, it was
witnessed that the OPD had the highest average footfall on Saturdays and lowest
average footfall on Tuesdays, where the average number of patients attending
were 795 and 515 respectively (as in Table 14 and Figure 26.).
Days Average Number of Patients
Monday 705
Tuesday 515
Wednesday 605
Thursday 625
Friday 660
Saturday 795
Table 14 : Average Number of Outpatients seen on a Daily Basis.

104
Figure 26 : Peak OPD Days
The observed high footfall on Saturdays is because people were comparatively free
from their work as the software companies and schools are closed making it
convenient for them to visit a doctor without applying for leave. However, one theory
accounting for low footfall on Tuesday could be that Hindus do not believe in initiating
anything new or bringing in any changes to their daily routine starting on a Tuesday.
6.B : Peak OPD Hours
The peak hours in OPD were between 10:00 AM to 1 PM during the 8AM to 8PM
stretch of the OPD time, where an average of about 389 patients were consulted
over a span of 3 hours (as in Table 15. And Figure 27.). The reason for this
occurrence was that, the maximum numbers of consultants were present at the
OPD during this period.
705
515
605 625 660
795
0
100
200
300
400
500
600
700
800
900
Monday Tuesday Wednesday Thursday Friday Saturday
Ave
rage
No
. of
Pat
ien
ts
Peak OPD Days

105
Time in Hours Av. No of Patients
0801 – 9000 15
0901 – 1000 55
1001 – 1100 125
1101 – 1200 148
1201 – 1300 116
1301 – 1400 60
1401 – 1500 90
1501 – 1600 60
1601 – 1700 45
1701 – 1800 30
1801 – 1900 22
1901 - 2000 10
Table 15 : Average Number of Outpatients seen on an Hourly Basis.
Figure 27 : Peak OPD Hours.
15
55
125
148
116
60
90
60
45
30 22
10
0
20
40
60
80
100
120
140
160
0801 -0900
0901 -1000
1001 -1100
1101 -1200
1201 -1300
1301 -1400
1401 -1500
1501 -1600
1601 -1700
1701 -1800
1801 -1900
1901 -2000
Av.
No
. of
Pat
ien
ts
Time in Hours
Peak Hours in OPD

106
6.1: Appointment and Walk-in Patient Analysis
Data collected over a period of 5 months, comprised a total number of 5550 patients
of which 2837 were with Appointments and 2713 attended the Walk-in clinic,
indicating that the hospital received greater number of appointment patients.
Although the difference is not very distinct in the study, the percentage of
Appointment patients was 51% and Walk-in was 49%, making the difference
statistically insignificant.
A Trend Analysis of Appointment and Walk-in patients from January 2013 to
September 2014 (a span of 21 months) was done wherein total number of
Outpatients, including those with Appointments and those who attended the Walk-in
clinics were retrieved from the HIS. The data showed that over that period, the
hospital observed a steady increase in the total number of Outpatients; however the
ratio of patients with Appointments to those who attended the Walk-in clinics
declined. It was noted that the number of Walk-in patient over- took the
Appointments in the last three months (July 2014 – September 2014).
The graph in Figure 28 indicates the trend towards change in Appointment to Walk-in
ratio from January 2013 to September 2014; clearly showing increasing number of
Walk-in patients over those with appointments. A simultaneous increase in total
number of outpatients is also observed reflecting the need for an improved
Appointment System.

107
Figure 28 : Trend Analysis of Appointment and Walk-in Patients from January 2013 to
September 2014.
A detailed analysis of the four OPD sectors revealed that the number of patients with
appointments were greater than those who attended the Walk-in with respect to
OPD2 and Cardiology OPD, confirming that these OPDs which mainly constituted the
Surgical Specialities, received more patients with appointments. On the other hand, in
OPD1 and Paediatric OPD the Walk-in patient numbers exceeded those with
appointments, proving that the Medical Specialities received a greater number of
Walk-in patients. However, Cardiology OPD had the least Walk-in percentage of 31%,
as most of the patients who came here were either for cardiac procedures who
preferred taking a prior appointment to schedule their procedures or were senior
citizens who opted to book an appointment in order to cut down their waiting time for
consultation.
0
5000
10000
15000
20000
25000
No
. of
Pat
ien
ts
No. of Pts
App Numb
Wk-innumb
Trend Analysis of Appointment and Walk-in Patients from January 2013 to September 2014

108
A comparison between the Medical and Surgical Specialities showed that the Medical
Specialities have a ratio division of 51% Walk-in and 49% Appointments and the
Surgical Specialities have a ratio division of 55% Appointments and 45% Walk-in. This
was mainly because with Medical Specialities, patients with minor ailments walk in for
consultation without prior appointments accounting for inestimable number of Walk-
in patients, whereas, in the Surgical Specialities, patients took prior appointment with
surgeons to schedule elective surgery and complete preliminary investigations for
fitness before surgery.
6.1.A : 80 – 20 Rule
In 1906, Vilfredo Pareto created a mathematical formula to describe the unequal
distribution of wealth in Italy, observing that 20% of the people owned 80% of the
wealth. In the late 1930s and 40s, the Quality Management pioneer Dr Joseph M.
Juran recognised a universal principle of "vital few and trivial many" – 20 percent
of something is always responsible for 80 percent of the results. He attributed
the 80/20 Rule to Pareto, calling it Pareto's Principle. The 80/20 Rule states that, in
anything, a few (20%) are vital and many (80%) are trivial. Thus it prompts a
manager to focus on the 20% that matter.
In Pareto's case it meant 20 percent of the people owned 80 percent of the wealth.
Juran's work identified 20 percent of the defects caused 80 percent of the
problems. The 80/20 Rule can be applied in almost anything, from the science of
management to the physical world. 20 percent of the stock takes up 80 percent of
the warehouse space and that 80 percent of the stock comes from 20 percent of
the suppliers. Also 80 percent of the sales come from 20 percent of the sales staff.
20 percent of the staff causes 80 percent of the problems, yet another 20 percent
of the staff will provide 80 percent of your production. It works both ways.
The total number of Outpatients over a period of 3 months (1st March 2014 – 31st
May 2014) was analysed specialty-wise to determine the top three demanding
specialities (as in Table 16.) and the 80 – 20 Rule was applied. Thus, the top three

109
specialities were responsible for 80% of the problems occurring in the OPD. Hence,
any changes in these specialities (vital few) for the betterment of the process
would solve the problems in other specialities (trivial many).
Specialties Total no. of Patients
Paediatrics 9509
Internal Medicine 7977
Gynaecology 5961
Orthopaedics 4632 ENT 3325
Urology 2429
Dermatology 2322 Neuro-diagnostics 2255
Endocrinology 2188 Cardiology 1983
Ophthalmology 1760 General Surgery 1665
Psychiatry 832
Geriatric Medicine 549 S.Gastroenterology 541
Rheumatology 492 Neuro-surgery 477
Vascular Surgery 365
Table 16 : Total Number of Outpatients seen Speciality-wise Over a Period of 3
Months (1st March 2014 – 31st May 2014).

110
Figure 29 : Comparison of the Total Number of Outpatients Seen Speciality-wise
Over a Period of 3 Months from 1st March 2014 – 31st May 2014.
Figure 29. Clearly illustrate that Paediatrics, Internal medicine and Gynaecology are the
top three demanding specialities in descending order. Thus, process modification
within these three specialities may resolve a majority of the OPD problems. Whilst,
there are other specialities which need process modification, these 3, represent the
majority of the bottlenecks due to demand for their service. Hence, the changes
recommended should be first implemented in these three specialities in order to make
the improvements more evident.
6.2 : Waiting Time Analysis
The most prevalent problem in the Outpatients Department was the protracted
waiting time experienced by the patients. Table 7 and Table 8 on Page 92 and 93
respectively show that four specialties; Gynaecology, Paediatrics, Internal Medicine
9509
7977
5961
4632
3325
2429 2322 2255 2188 1983 1760 1665
832 549 541 492 477 365
0
1000
2000
3000
4000
5000
6000
7000
8000
9000
10000
No
. of
Pat
ien
ts s
ee
n
Total Outpatients Seen speciality-wise Over a Period of 3 Months from 1st March 2014 – 31st May 2014

111
and Cardiology had an average waiting time of more than 60 minutes for Walk-in
patients and an average waiting time of more than 30 minutes for patients with
appointment.
Reasons for the prolonged waiting were –
A. Medical Specialties
a) The allotted consultation slots fell short of the time needed to elicit patient
history and for examination.
b) Inestimable number of Walk-in patients.
c) Occasional late arrival of the Consultant to the OPD.
d) Conducting Ward rounds during OPD hours.
B. Surgical Specialties
a) Overlapping of OT and OPD time of the consultant.
b) Occasionally, the consultant would be in the treatment room with post-
operative follow up cases for minor dressing/procedures.
6.3 : Existing versus New Registration Patients and
First Visit to Follow-up Patient Analysis
Two other important parameters; Patient’s Registration status and the consultation
Visit Number of the patient were tracked during the study. This reflected, patient
satisfaction in terms of resources and services provided, effectiveness of the
treatment prescribed which would impact on the reputation of the consultants as
well as the hospital in general.
From the total number of patients studied, the number who were Newly
Registration were 1186, existing patients were 4364, number of First Visit were
4587 and the number of consultant requested Follow-up were 963. It was observed
that the hospital had a high percentage of 79% existing patients and a considerable
rate of 17% Follow-ups. This potentially indicates that the patients were content

112
and relied on the hospital services to a great extent and returned to the hospital to
seek treatment, thus demonstrating their loyalty.
Furthermore, a comparison between the four OPD sectors showed, Cardiology OPD
to have the highest percentage of Follow-ups which was 29% and Paediatric OPD
with the least at 14%. The high Follow-up rate for Cardiology was because all
patients who underwent Angioplasty, Coronary Artery Bypass Grafting, Cardiac
catheterisation and other cardiac procedures were advised to have a minimum of
three follow-up visits as part of their procedure package and were hence not billed
for those follow-up visits. A comparison between Medical and Surgical specialities
showed 19% follow-up for Surgical against 16% for Medical speciality. This was
mainly because the post-operative patients returned for suture removal and
surgical wound dressing.
6.4 : DNA (Did Not Attend) Patient Analysis
A very significant finding of the study was the high percentage of patients with
appointments who ‘did not attend’ (DNA). These booked appointments made
consultation slots unavailable for genuine patients who had to come as a Walk-in.
Following data analysis, it was found that the hospital had a high average DNA
percentage of 26.5%. Considering the four OPD sectors individually, Cardiology
presented with the least DNA percentage of 23%, whereas, OPD1 and OPD2 had an
equal DNA percentage of 28%. Further, on analysing individual specialities,
Dermatology showed highest DNA rate of 43% contrary to Psychiatry with the least
DNA rate of 16%.
The following reasons were given by patients who did not attend their
appointments and were contacted by telephone:
1. Patient was cured (45%)
2. Unsatisfied with hospital services (6%)

113
3. Went to a different hospital for consultation (7%)
4. Fail to remember the appointment (21%)
5. High cost (4%)
6. Others (17%)
While a majority, constituting about 45% of DNA was because the patient had been
cured and did not require any further consultation indicated a positive feedback, a
small 4% of them complained that the fee charged by the hospital was very high.
During the study of the DNA sample, it was found that out of the 200 patient’s
interviewed on telephone, 96% of them were existing patients who had previously
attended the hospital. The remaining 4% were all new patients who withdrew
mainly because of the high consultation fee opting for a different hospital.
Thus, this topic needs a further explorative study to find out the means by which
the percentage of DNA for individual consultants can be reduced in order to bring
down the average DNA percentage of the hospital to below 15%.
6.5: Analysis of OT-OPD Time Overlap
The lack of communication between the surgeons who schedule the surgeries and
the PRM/OPD reception staff blocking consultation slots for appointments for
patients, often led to the overlapping of the OT and OPD timing of the surgical
speciality consultants. This inevitably prolonged the waiting time for an Outpatient
causing confusion, especially annoying the patients who had made appointments
and became discontented.
A study into the OT-OPD overlap, conducted for a period of 24 days indicated that,
the Urology specialty had the maximum of 43 overlaps, whereas the ENT and
General Surgery specialties both had the least of 8 overlaps. This is mainly because,
all Urology consultants are allotted a longer duration of fixed OPD hours on all days
(except Sunday), which makes planning of surgeries on any of the days intercept
with the OPD hours at some point. On the other hand, each consultant of ENT and

114
General Surgery speciality are not scheduled for OPD consultation on all days of
the week thus, enabling the surgeons to plan surgeries on their non-OPD days, to
avoid overlapping with their OPD hours.

115
7. OBSERVATIONS and RECOMMENDATIONS
This chapter consists of discussions about the problems encountered in the Out
Patient Department, instigating constraints in the process flow. Recommendations are
made for some changes that could ease patient flow making it more convenient for the
patients and augmenting their satisfaction.
A. At the Registration Desk
Starting from the time the Registration file is taken to fill in details, till the UHID
card is printed, the average time to register a patient varies from 3-5 minutes.
Problems
1. Long queue at the registration desk during peak hours is a usual occurrence due
to one operating system (desktop) and a single staff member handling the
counter.
2. At times, a few patients have difficulty in filling the registration form and
complying with the Registration process.
3. System failure within; either the computer or the UHID card printer.
Recommendations
Introduce a second system (desktop) to work on and have adequate staff at
peak hours, to quickly disperse the large numbers of patients and avoid
long queue at the counter.
Have dedicated personnel on floor for patients who need assistance in
filling the form, or have difficulty in communicating due to variance in the
language spoken and for guidance in directing to respective departments.
These personnel can be floor navigators, easing the process flow for those
patients who have difficulty in complying with the outpatient process.

116
Introduce online registration forms for new patients so that they can fill the
form and bring it along to cut down on their waiting time for registration.
This on other hand will avoid long queues at the registration desk.
Introduce iPads/Tablets with staff who can walk amongst the queues and
register patients while they wait, quickly dispersing the crowd.
B. At Front Office
Inpatient Admission, Investigation Billing and Laboratory Report Collection are
completed in the Front Office.
The Inpatient admission process, from the time the admission request form
is submitted and the details are fed into the system, till a room is blocked,
the process takes about 5-7 minutes on an average for each patient,
provided the requested category of the room is available at that time.
Investigations are billed by entering the UHID number of a patient and
selecting the respective investigations to be billed. This on an average takes
3-5 minutes for each patient, varying according to the number of
investigations that need to be billed.
When a patient comes to collect the laboratory reports, the UHID number is
entered into the system and the patient’s reports are printed and handed
over. This takes about 1-3 minutes on an average for each patient.
Problems
Limiting the investigation billing and laboratory report collection to the front
office, results in amassing of people.
Recommendations
Have well trained staff to enable decentralised billing for investigations at
respective OPDs on days of lower footfall; this will diffuse the crowd at the

117
front office and reduce unnecessary movement of the patient making it
more convenient.
Laboratory investigation report printouts should be made obtainable at
respective OPDs as well, to further reduce patient movement.
In the long term, digital copies of all investigations, histories and diagnoses
should be the aim of the hospital.
C. At the OPD Reception
The average time taken to enter the UHID of a patient into the system, bill the
consultation and tie the ID band on the patient is around 2-4 minutes.
Problems
1. Lengthy queue for UHID number acknowledgement and billing the consultation
due to under-usage of the available systems and inadequate amount of staff
resulting in large numbers of people waiting during peak hours.
2. Long waiting time is experienced by patients at the Walk-in and at times even by
those with appointments especially with Medical specialities, as the slots
presently allocated in the system are not specific to the speciality and
consultants, thus the consultation time exceeds the time set aside for it.
3. Extension of the doctor’s OPD consultation hours due to continuous
unpredicted Walk-in patients.
4. Intermittently, situation arises when the consultant calls a Walk-in instead of a
patient with an appointment even though the latter has arrived on time, making
the patient wait beyond the allotted time, thereby leading to patient
annoyance.
5. A few consultants arrive late to the hospital setting back the first appointment
consultation time, thereby further delaying the subsequent consultations.
6. A considerable number of Did Not Attend (DNA) customers result in wasted
slots as the appointments are not cancelled with prior intimation, thus making
slots unavailable for genuine patients who come as walk-ins.

118
7. Overlapping of OT and OPD timing of surgical speciality consultants.
8. Doctors often complain about consultation room cleanliness and readiness.
9. During peak hours, a single nurse assessing the vitals of each patient is unable to
examine each patient thoroughly. Many times, this results in the patients being
called in for consultation before their vitals are checked.
10. Errors made by the OPD reception staff -
a) Third consultation within 7 days of first consultation is occasionally
mistaken as a follow up visit and not billed.
b) Frequent refunds are made because of wrong UHID number
acknowledgement and billing.
c) At times, acknowledging (entering) the patient UHID number into the
system is missed in-spite of billing the consultation, unnecessarily
prolonging the waiting time with delayed consultation.
11. Wrong booking of – appointment time/ missed blocking appointment slot by the
PRM (Patient Relations Department) when patient calls to book an
appointment.
12. Non-availability of certain speciality consultants during hospital OPD time span.
13. System failure: it could be the computer, the printer, card swipe machine or the
UHID display screen in the waiting area. The IT department usually takes about
15-20 minutes to attend to the problem.
Recommendations
Redeploy OPD reception staff when OPD gets busy, to address the increasing
number of patients and avoid large queues of patients.
Fix consultation slot time specific to each consultant for every speciality, in
accordance with the average consultation time for a booked appointment,
thereby reducing the waiting time for patients.
Have a fixed number of Walk-ins that can be allocated per consultant for each
speciality to avoid inestimable Walk-in patients. This allows the doctor to finish
his consultations within his OPD hours and the room will be ready to be

119
occupied by the next consultant. For this purpose, have well trained, efficient
staff to answer telephone calls regarding appointments and consultation. Thus,
Walk-in patients beyond the allocated number for a particular consultant
would be offered appointments on other days.
Reschedule each doctor’s consultation hours based on their OPD arrival time
and the average number of patients consulted by them per session.
Have a fixed schedule allocation by which the patients with appointments and
Walk-in patients are called for consultation. This means that the Walk-in can be
informed of an approximate waiting time period (arbitrarily 2 patients with
appointments followed by one Walk-in patient for those consultants who have
greater numbers of patients with appointments).
For fully booked appointment specialities, assign Walk-in days for each
consultant for every specialty so that Walk-in patients can be seen on first
come first serve basis without disturbing the appointment schedule.
To avoid overlapping of OT and OPD timing, have fixed OT and OPD days for
every consultant to completely avoid overlapping or develop an efficient HIS
program that does not allow a surgeon to book an OT case during his
consultation hours.
When OPD is busy, have two nurses to assess patient’s vitals to ensure all
patients have a thorough vital check before being called for consultation.
Recognise the reason for occurrence of DNA and follow up those patients to
reduce the overall DNA percentage to below 15%.
Have well trained, competent staff at the OPD desk and the PRM Department
to minimize errors and work towards achieving zero error.
Optimise OPD time and space utilisation in a way such that, there is one
consultant from each speciality available in the OPD throughout the OPD
timings of the hospital.
In case of system failure (usually the printer or the UHID display screen), have a
member of IT staff to attend and fix it as soon as possible or have back-up
systems ready to replace it immediately, if repair will be delayed. This obviously

120
has to be balanced with cost and at what point during the working day the
failure occurs. If it happens towards the end of the working day, it may be
prudent to fix it during the out of work maintenance hours, depending on the
likely impact to OPD operations.
Every department must organise a bi-monthly meeting with their respective
departmental staff, to discuss the problems confronted on the floors and how
best to resolve them.
Implement OPD reception and consultation room checklist to make sure all
necessary resources are available at all times and check to ensure cleanliness
and readiness of the consultation rooms before the arrival of the doctor.
The OPD checklists recommended are as follows –
7.1 : OPD Reception checklist
This checklist is introduced in the OPD reception area which is situated in the OPD
waiting lounge. All the Outpatients are seated here while waiting for their consultation
turn. The checklist will help in providing more organised and satisfactory services to
the patients.
1. Reception desk a) Cleaned b) Telephone working c) All systems checked and
functional d) Functional printers with sheets e) Visiting cards of the consultants f) Feedback forms g) Card swipe machine h) Tissue paper
2. Clean seating arrangement for patients
3. Good Lighting

121
4. Fan/Air conditioner working
5. Fire extinguisher and sensors
6. Doctor availability display board working
7. Drinking water with disposable glasses
8. Brochure stand filled
9. Newspaper (English and local language)
10. Magazine (News, Business, Health)
11. Television working
12. Name card of all doctors at doors of respective rooms placed
13. Clean and empty dustbin
14. Stationary
a) Plain sheets and extra pens b) Prescription, admission, consent
forms c) Radiological investigation forms d) Patient history file e) Stapler with pins f) Consultant letter heads g) Envelopes h) Hospital seal i) Punching machine
15. Sockets and plug-in points tested
16. Floors and washroom to be clean and dry
Table 16 : OPD Reception Checklist.
7.2 : OPD Consultation Room Checklist
This checklist is introduced in the consultation rooms to meet the needs of the patient
as well as the consultant and ensures room readiness before the consultant arrives.

122
1. Good Lighting
2. Fan/Air-conditioner working
3. Table and chair cleaned
4. 3 Chairs (doctor, patient, attender)
5. Pen and Writing pad
6. Telephone functioning
7. System checked and functional
8. Examination couch cleaned
9. Curtains cleaned
10. Bedspread and pillow cover clean
11. Examination Light working
12. Calendar
13. Sealed water bottle and disposable glasses
14. Clean Apron
15. Stethoscope, BP apparatus and torch
16. Clean Dustbin for proper segregated waste disposal
17. Prescription forms, Admission forms and surgery forms
18. Letter heads of the consultant
19. X-ray and other investigation forms
20. X-ray view box working
21. Sterile Gloves and face mask
22. Height tape attached
23. Weighing machine functional

123
24. Clean wash basin and mirror checked
25. Soap/Liquid soap and sanitizer
26. Clean Towel and tissue roll
27. Clock working
28. Kidney tray, cotton, gauze and bandage
29. Bin to dispose sharps
30. Punching machine and stapler with pins
31. Stool to step onto the bed
32. Plugs and sockets tested Table 17 : OPD Consultation Room Checklist.
7.3 : Additional Resources Needed in Ophthalmology
Consultation Room
This checklist is introduced in the ophthalmology consultation room along with the
previously mentioned OPD consultation room checklist. It enlists the additional
resources that are needed in this room.
1. Snell’s chart and different reading charts
2. Torch
3. Lens
4. Slit lamp
5. Direct and indirect ophthalmoscope
6. Alcohol swab and cotton buds
7. Near vision charts
8. Colour blindness test charts

124
9. Pupil dilating drops
10. Fluorescein sodium ophthalmic strip
11. Lacrimal syringing set (sterile needle, syringe, distilled water)
Table 18 : Additional Resources required in Ophthalmology Consultation Room
7.4 : Additional Resources Needed in ENT Consultation Room
This checklist is introduced in the ENT consultation room along with the OPD
consultation room checklist mentioned earlier. It enlists the additional resources that
are needed in this room.
1. Explanation Charts of Ear, Nose and Throat
2. Head Mirror
3. Tuning fork
4. Otoscope
5. Torch
6. Nasal twang
7. Ear drops (to soften wax)
8. Sterile forceps set
9. Sterile syringe with needle
10. Tongue Depressor
Table 19 : Additional Resources required in ENT Consultation Room

125
7.5 : TO – BE Process Map
After the study results were obtained, problems in the Outpatient process flow were
discussed with the management and a TO – BE process was proposed. Before
suggesting any changes to the process, bottlenecks in the present process flow were
identified which were, mainly crowding of the patients at the Registration desk and
OPD reception and unnecessary movement of the patients for billing investigation and
report collection. Following these, certain changes were suggested in the current
process flow in order to reduce waiting time, cut down unnecessary patient movement
and make the process more efficient. In the present process flow all investigation
billing and laboratory report collection was delimited to the front desk making it
inconvenient for the patients counting for their needless movement and over-
crowding at the front desk. Initially, the primary changes recommended were to
decentralise billing and make outpatient laboratory reports available at all counters to
ease the patient flow and disperse the crowd at the front desk.
A greater detail of the To-Be Process is elucidated in the Implementation Plan in
section 7.6.
7.5.A : Validation of the TO – BE Process
The TO – BE process was validated by Dr. Vinit Samant (Operations Manager) on the
20th September, 2014.
NOTE : Refer Appendix C for the TO – BE Process Map of the OPD.

126
7.6 : IMPLEMENTATION PLAN
As a result of discussion and proposing recommendations with a TO – BE process map,
the project was validated by the Operations Manager before developing a strategy to
implement the pilot study.
7.6.1 : Strategy for Implementation (as in Figure 30.)
Figure 30 : Implementation Strategy

127
Implementation involves three phases –
1. Phase 1 : includes the following
a) Train the entire staff involved in the outpatient services regarding the
changes adopted in the process flow.
b) Make the validated TO – BE process effective.
c) Bring about the necessary changes in staffing.
i. Appoint a coordinator to attend Registration queries at front
desk.
ii. Allocate an extra nurse in vitals assessment area.
iii. Have an effective staff schedule such that it allows relocating of
the staff during peaks hours to quickly disperse the large groups
of patients at the counter.
d) Modifications in the HIS
i. Introduce online Registration.
ii. Fix consultation slot time in the system, specific to individual
consultants.
iii. Have software that recognises the maximum number of Walk-in
patients that can be allowed to every consultant so that the staff
does not encourage Walk-in patients beyond this.
2. Phase 2 : Following the changes made effective in Phase 1, this phase
involves
a) Data collection of all parameters that were included during the original
study.
b) Data analysis to obtain the results.
3. Phase 3 : Involves comparison of the results before and after implementing
the pilot study to evaluate the effectiveness of the Research.

128
Here are some of the recommendations that were implemented at the end of the
study –
a) A second terminal at the Registration counter was introduced with additional
staff to speed up patient processing.
b) Man power (OPD coordinators/navigators) one in each OPD sector were
appointed, to assist patients having difficulty in complying with the hospital
process.
c) A result of Lean application and implementation of the TO – BE process map
was that the reception staff were trained to bill investigations at all counters
and a decentralised billing helped to scatter crowd gathering at the front office
and eliminate unnecessary movement all the way to a single billing counter.
d) All systems at the OPD counter were made functional and the staff were
scheduled in a way that during the period of high footfall, the OPD coordinators
could help process patients much more quickly.
e) Checklists were introduced and Japanese 5S was implemented to make sure
that each consultation room is checked before the consultant arrived. The OPD
reception was also inspected regularly to make sure all required resources
were available.
f) Training sessions were conducted for the staff to motivate them to work more
efficiently towards achieving zero error.
g) Bi-monthly individual departmental meetings were scheduled, where the
manager discussed problems faced on floors by the staff and brainstorming
sessions were conducted to find best solutions for resolving these issues.

129
8. CONCLUSIONS
The conclusions derived from the study are discussed in this chapter. It aims to identify
and understand the problems and drawbacks of the present system. This study
proposed ways to bring about changes that would be acceptable to the stakeholders in
order to improve the processes, whilst carefully considering the work culture of the
organisation.
1. During the study, the main operational issues concerning the Outpatient
department that were identified were –
a) Waiting Time: This was of prime concern as the majority of the patients
who remained dissatisfied were mainly because of indefinite period of
waiting for consultation. This caused great annoyance especially for the
Appointment patients whose consultation was not at the scheduled time.
This was one of the reasons for refunds requested by patients who chose to
leave without consulting the doctor, affecting the hospital revenue.
b) Inestimable number of Walk-in patients: As the total number of
Outpatients increased over the period, it was observed that the ratio of
Appointment to Walk-in patients declined. A trend analysis from January
2013 to September 2014 revealed that the appointment percentage had
dropped from 68% to 49% and simultaneously walk-in percentage had risen
from 32% to 51% (as in Figure 31.). Presently, 3 out of 10 Walk-in patients
were those who previously were Appointment patients. They had now
turned into Walk-in patients because of their previous experiences of not
being seen at the time scheduled. This proved that the hospital needed to
strengthen its Appointment Scheduling system in order to improve patient
satisfaction.

130
Figure 31 : Comparison of the Appointment to Walk-in Patients Ratio from January
2013 to September 2014.
c) Extension of doctor’s consulting hours beyond the allotted time: Two
reasons that caused this were: firstly, as the consultation slots in the system
were not specific to the speciality and the consultant, it was often noted
that the allotted slot time was inadequate. Appointments require time to
elicit history and examine the patient. The lack of this establishment of
patient history had a “knock on” effect which delayed every subsequent
appointment scheduled. Secondly, the continuous flow of unexpected and
unplanned Walk-in patients who came for consultation. This reflected the
need for fixing consultation slot time specific to the consultant.
d) Significant number of DNA patients: Consultation slots booked by patients
who later neither attended the OPD nor cancelled their appointment was
another reason that increased the number of Walk-in patients as the
68 65 68 63 59 61 58 55 58 60 57 55 53 50 53 47 54 51 47 47 49
32 35 32 37 41 39 42 45 42 40 43 45 47 50 47 53 46 49 53 53 51
0
20
40
60
80
100
120Ja
n-1
3
Feb
-13
Mar
-13
Ap
r-1
3
May
-13
Jun
-13
Jul-
13
Au
g-1
3
Sep
-13
Oct
-13
No
v-1
3
De
c-1
3
Jan
-14
Feb
-14
Mar
-14
Ap
r-1
4
May
-14
Jun
-14
Jul-
14
Au
g-1
4
Sep
-14
Per
cen
tage
Walk-in %
Appointment %
Ratio of Appointment to Walk-in Patients from January 2013 to September 2014

131
appointment slots were made full and unavailable to genuine patients who
had to come as walk-in.
e) Double booking of Surgical consultants: This was an outcome of the
communication gap between the surgeons scheduling surgeries and the
staff blocking slots for OPD Clinic patients. It was mostly observed in
specialities where all consultants were allotted OPD hours every day. This
meant that, elective surgeries scheduled on any day would overlap with the
OPD clinic at some point in time. Also, there was no allowance in the HIS to
indicate to the staff booking appointments, that the surgeon had scheduled
a surgery. Thus, updating the HIS was necessary to include this option.
f) Insufficient and operationally deficient OPD reception staff: There was not
enough training sessions for OPD Reception Staff. This prevented them
from learning ways to eliminate and reduce errors. It also prevented them
discussing the difficulties faced by them while interacting with the patients.
Thus methods to improve the hospital services and patient experience were
not voiced and thus overlooked. This may have contributed to the noted
lack of staff motivation many of whom were unwilling to adapt to changes
proposed for the betterment of the organisation.
2. In spite of the above problems, the consultant’s dedication towards treating the
patient, the quality of service provided and the latest medical and surgical
equipment and technology offered by the hospital was successful in retaining 79%
of its patients. These patients not only marked their loyalty to the brand name but
were also willing to suggest the hospital name to others which aided in recruiting a
higher number of new patients.
3. Although the hospital observed a considerable DNA rate of 26.5% for follow up
visits, 45% of the DNA rate was because the patients were usually cured after their
first visit to the consultant. Thus, their pre-booked appointment for a follow up
visit was not used. This caused inefficiency in scheduling appointments, wasted

132
consultants’ time and caused dissatisfaction for patients trying to book
appointments. However, despite the problems caused by “cured” DNAs, this was a
positive feedback for the hospital due to the consultants’ proficiency in treating the
patients. Therefore, these expert consultants, to a great extent were responsible
for upholding and improving the reputation of the hospital and its brand.
4. The most significant impact was the implementation of Lean and Japanese inspired
OPD reception and consultation room checklist. This was prepared following a
thorough inspection of the OPD, process analysis, and interviews with the
consultants. The OPD house-keeping team who ensured room cleanliness and
readiness before arrival of each consultant expereinced immediate results (within
2 days), almost reducing consultants complaints on room readiness to zero. This
improved consultant mood, increased patient satisfaction, and ensured lost
revenue was minimised.
5. Nevertheless, a well-planned OPD process flow is the key for effective operations.
Having a uniform and streamlined process flow in every OPD sector, eliminating
unnecessary patient movement for billing and report collection and by reducing
the waiting time for a patient at every step of the process would help ensure a
more efficient process flow. Ultimately, the patient experience is key to this
hospital and its “sister” hospitals in the group maintaining and growing its brand
reputation. There is a high level of competition for the “patient Dollar” (Rupee) and
Indians are very quick to change allegiance when faced with poor service, bad staff
attitude, and inefficient practices. Thus, ensuring everything in their experience has
a positive effect is best served by refining the process and making it patient centric.
6. Finally, in answer to the research question, it has been proven that with
appropriate adaptation and consideration, western manufacturing techniques can
be successfully implemented in an Indian hospital to a wide extent. Indian
Healthcare follows the US model and thus is profit driven rather than patient need
driven. Thus, any methods, strategies or initiatives which drive down costs and

133
thus improve profits are always welcomed. The research adds the dimension of not
just reducing operating costs, but improving the patient experience. It has shown
by creating operational process focused on the patient, that efficiency gains and
thus operating cost reduction can be both achieved. The main consideration the
researcher notes is not the methodology or implementation of the procedures and
processes, but the support of senior management and the buy-in of the
operational, nursing and clinical staff. It is therefore this researcher’s contention
that the research aim has been met and demonstrated, albeit with the exception
that full implementation was not possible.
8.1 : Limitations of the Study
Possible limitations posed by the study were –
1. Authenticity of the information entered into the HIS. Unlike the UK NHS, for
example, Indian healthcare does not have unique, personalised and lifetime
medical records allocated at birth which remain with the patient
irrespective of where the patient is treated. In the UK NHS, the medical
records belong to the patient not the hospital. Thus, each healthcare
organisation has a duty to update and pass on the medical record on the
request of either the patient or a healthcare organisation. In India, medical
records are guarded by the healthcare organisation/hospital as a means to
encourage the patient to return. Due to this, HIS has many duplicate,
incomplete, incorrect and inaccurate medical records. This means that the
information cannot give a full medical picture to the consultant potentially
risking the patient and perhaps complicating treatment.
2. In the course of the study, there were several consultants who left the
hospital, in the middle of data collection and thus were excluded.
Contrastingly, there were several new consultants who joined towards the

134
end of the study and they could not be included. Hence the consultation
slot and number of Walk-in patients was not allocated in these cases.
Ideally the work should have been process modelled instead of process
mapped, but due to time scale constraint and corporate concern regarding
hospital information security breaches this was not possible. Process
modelling is more detailed and accurate capture of the process. Object
oriented data is collected at each event. The sort of data collected varies,
but mostly includes timings, utilisation levels, capacities and throughput
levels amongst other things. A process map is a one-dimensional expression
of a chain of events essentially, irrespective of notation method, a flow
diagram.
3. Without capturing object data decision making is somewhat handicapped
since, identifying the improvements will require examination of the very
data not collected.
4. The biggest limitation and most disappointing occurred towards the end of
the project. The Chief Executive Officer, who was also the main supporter
of Cranfield and the commissioner of the research left for a new position in
Malaysia with a rival organisation. This catalysed a change in the
management staff, a change in priorities and a different focused strategy.
However, it did bring a new HIS software system, but its introduction put
the implementation plan on hold. This resulted in the proposed To-Be
process and all the recommendations suggested not being implemented as
intended.
8.2: Further Work
This study was conducted for a duration of 36 weeks. It paves the way for further work
that can be carried out in the Outpatients Department:

135
1. Implementation of the TO – BE process. Improve effectiveness by changing
staff schedule to reflect OPD peak hours and their requirements. Implement
the recommendations as suggested and execute the implementation study
as planned in the Implementation strategy.
2. Have regular monthly checks on the process for up to two years to check
improvement levels in the OPD system. Select and compare the following
metrics: total patient waiting time, number of patients consulted hourly, the
ratio of Appointment to Walk-in patient and percentage of DNA patients,
patient satisfaction levels. This will allow monitoring and checking on the
success levels of the implemented process.
3. A further study on DNA levels is required to explore methods that would
help bring down the overall DNA percentage from 26.5% to below 15%. This
could be achieved by following up on the unattended appointments and
inculcating ways by which DNA occurrence can be minimized.
4. Ultimately, the entire hospital requires every department, every speciality
and every process in medical, clinical, clinical support and facilities to be
process modelled in its entirety. Often bottlenecks and process obstructions
often lie in what seems to be completely unconnected and remote locations.
Unless a complete process modelling is conducted of the entire hospital it
may well be impossible to achieve as close to 100% efficiency.

136
REFERENCES
(N.A) (N.D) Cultural Differences: Asian Business Customs [online] -
http://www.chalre.com/hiring_managers/asian_business_differences.htm accessed on
8th November, 2014.
(N.A) (N.D) Enable a Collaborative, Transparent and Efficient Approach to Risk
Management in Healthcare Organisations with Metric Stream Solutions [online] -
http://www.metricstream.com/solution_briefs/healthcare-risk-management.htm
accessed on 21 May 2014.
(N.A) (N.D) Health Care Practice : An Integrated Approach to Meet the Financial and
Risk Related Needs of Health Care Organisations [online] -
http://www.aon.com/industry-expertise/healthcare.jsp accessed on 21 May 2014.
(N.A) (N.D) How One AP Pro Sees Process Mapping to Improve Operations. 2010.
IOMA's Report on Managing Accounts Payable, 2010(5), pp. 1-5+.
(N.A) (N.D) IDEF3 Process Description Capture Method. IDEF integrated definitions
method [online] http://www.idef.com/idef3.htm accessed on 11th November, 2014.
(N.D) Curtiss Quirin : Why lean efforts fail. [online] -
http://www.reliableplant.com/Read/22985/lean-efforts-fail-plant accessed on 6th
December 2014.
Abdulmalek, F.A., and Rajgopal, J. (2007), "Analysing the benefits of lean
manufacturing and value stream mapping via simulation: a process sector case study",
International Journal of Production Economics, Vol. 107, pp. 223-36.
Advison (2012): “Emerging Environmental Risks In The Healthcare Industry –
Productivity and Insight for Insurance Professionals”.
Aghazadeh, S. (2003), "JIT inventory and competition in the global environment: a
comparative study of American and Japanese values in auto industry", Cross Cultural
Management, Vol. 10 No. 4, pp. 29-42.

137
Ahlstorm, P. (2004), “Lean service operations: translating lean production principles to
service operations”, International Journal of Services Technology and Management,
vol 4, pp. 545-564.
Akamavi, R.K., (2005). “Re-engineering service quality process mapping: e-banking
process.” The International Journal of Bank Marketing, 23(1), pp. 28-53.
Alex Tolbert (2014): “Whole world has health care problems.” May 2014.
Alsmadi, M., Almani, A. and Jerisat, R., (2012). “A comparative analysis of Lean
practices and performance in the UK manufacturing and service sector firms.” Total
Quality Management & Business Excellence, 23(3-4), pp. 381.
Anand Subramaniam, (2009) : AS-IS and TO-BE process mapping, Quality Minds.
Anderson-Miles,E., (1994). “Benchmarking in healthcare organisations: An
introduction. Healthcare Financial Management”, 48(9), pp. 58-61.
Anyanwu. K, Sheth. A, Cardoso. J, Miller. J, Kochut. K (2003) : “Healthcare Enterprise
Process Development and Integration” : Journal of Research and Practice in
Information Technology, Vol. 35, No. 2.
Appleby J et al (2003). “Sustaining Reductions in Waiting Times: Identifying Successful
Strategies.” King's Fund: London.
Argent, D., (2007). Mapping the Process. Paper, Film and Foil Converter, 81(6), pp. 14.
Audit Commission (2002). Access to Care: Ear, Nose and Throat and Audiology
Services. Audit Commission, London, UK.
Bailey NTJ, Welch JD (1952) “Appointment Systems in Hospital Outpatient
Departments.” Lancet 259: pp. 1105–1108.
Bailey, N. T. J. (1952). “A Study of Queues and Appointment Systems in Outpatient
Departments with Special Reference to Waiting Times.” Journal of Royal Statistical
Society Series B. 14, pp. 185-99.

138
Bailey, R. N., Garner, K. M., and Hobbs, M. F., (1997). “Using simulated annealing and
genetic algorithms to solve staff scheduling problems,” Asia-Pacific Journal of
Operations Research, Nov 1997, 14(2), pp. 27-43.
Becker, J.E., (2001). “Implementing 5S: To promote safety & housekeeping.”
Professional safety, 46(8), pp. 29-31.
Bennett, K.J., and Baxley, E. (2009). “The Effect of a Carve-out Advanced Access
Scheduling System on Noshow Rates.” Family Medicine 41, (1), 51-56.
Blumenthal D. (1999) “Health care reform at the close of the 20th century.” New
England Journal of Medicine 340: pp. 1916-1920.
Boonstra, A. and Govers, M.J.G., (2009). “Understanding ERP system implementation
in a hospital by analysing stakeholders.” New technology, work and employment,
24(2), pp. 177-193.
Brahimi, M. and Worthington, D. J. (1991). “Queuing Models for Out-Patient
Appointment Systems: A Case Study.” The Journal of the Operational Research Society
42(9): pp. 733-46.
Burgess, J.F. (2012). Innovation and efficiency in health care: does anyone really know
what they mean? Health Systems.
Burgess, N. and Radnor, Z., (2013). “Evaluating Lean in Healthcare. International
journal of health care quality assurance, 26(3), pp. 220-35.
Casey, J., (2013). “5S Shakeup.” Quality Progress, 46(10), pp. 18-23.
Cayirli, T., E. Veral, H. Rosen. (2006). “Designing appointment scheduling systems for
ambulatory care services.” Health Care Management. Sci. 9(1): pp. 47-58.
Cayirli, T., Veral, E., and Rosen, H. (2008). “Assessment of Patient Classification in
Appointment System Design.” Production and Operations Management 17(3): pp. 338-
53.

139
Cayirli, T.E. and Veral, H.R., (2003), "Outpatient Scheduling in Health Care: A Review of
Literature," Production and Operations Management, 12, pp. 519-549.
Chaudhuri, A. and Lillrank, P., (2013). “Mass personalisation in healthcare: insights and
future research directions.” Journal of Advances in Management Research, 10(2), pp.
176-191.
Chen, Z. And Shang, J.S., (2008). “Manufacturing planning and control technology
versus operational performance: an empirical study of MRP and JIT in China.”
International Journal of Manufacturing Technology and Management, 13(1), pp. 4.
Chen, Z. and Tan, K.H., (2011). “The perceived impact of JIT implementation on
operations performance.” Journal of Advances in Management Research, 8(2), pp. 213-
235.
Cheng-Hua, w., Yuan-Duen, l., Wei-i, l. and Pang-Mau, L., (2006). “Application of
Queuing Model in Healthcare Administration with Incorporation of Human Factors.”
Journal of American Academy of Business, Cambridge, 8(1), pp. 304-310.
Chien, C-F, Tseng, F-T, and Chen, C-H. (2008). “An Evolutionary approach to
rehabilitation patient scheduling:” A Case Study. European Journal of Operational
Research, 189, pp. 1234-1253.
Chow, V. S., M. L. Puterman, N. Salehirad, W, Huang, D. Atkins (2011). “Reducing
surgical ward congestion through improved surgical scheduling and incapacitated
simulation.” Prod. Oper. Manag. 20(3): 418-430.
Cua, K.O., McKone, K.E. and Schroeder, R.G. (2001), "Relationships between
implementation of TQM, JIT, and TPM and manufacturing performance", Journal of
Operations Management, Vol. 19 No. 6, pp. 675-94.
Cuatrecasas, L., (2004). “A lean management implementation method in service
operations.” International Journal of Services Technology and Management, 5(5), pp.
532-544.
140
Cudney, E. and Elrod, C., (2011). “A comparative analysis of integrating lean concepts
into supply chain management in manufacturing and service industries.” International
Journal of Lean Six Sigma, 2(1), pp. 5-22
Danese, P., Romano, P. And Bortolotti, T., (2012). “JIT production, JIT supply and
performance: investigating the moderating effects.” Industrial Management + Data
Systems, 112(3), pp. 441-465.
Daniel, S.J., Reitsperger, W.D. And Morse, K., (2009). “A longitudinal study of Japanese
manufacturing strategies for quality, JIT and flexibility.” Asian Business &
Management, 8(3), pp. 325-356.
Denton, B. and Gupta, D. (2003). “A Sequential Bounding Approach for Optimal
Appointment Scheduling.” IIE Transactions 35(11): 1003-16.
Dickmann, J. (2005), "Lean change at a crossroads: C-130 depot maintenance at
Warner Robins ALC", Lean Enterprise Change Research Case.
Dietrich, B., (2006). “Resource planning for business services. Association for
Computing Machinery.” Communications of the ACM, 49(7), pp. 62-64.
Duffy, F. (2000), "New ways of working: a vision for the future", in Clements-Croome,
D. (Ed.), Creating the Productive Workplace, Spon, London.
Eckelbecker, L., (2012), Oct 28. “Lean approach to health care.” Telegram & Gazette,
14. ISSN 10504184.
Farsijani, H., Fard, Y.S., Kharazian, M.A. And Nikabadi, M.S., (2012). “A Method for
Identifying Critical Success Factors of JIT Implementation in Different Circumstances.”
Journal of Supply Chain Management Systems, 1(1), pp. 1-9.
Fawcett, W. And Chadwick, A., (2007). “Space-time management and office floor space
demand: Applied experience and mathematical simulations.” Journal of Corporate Real
Estate, 9(1), pp. 5-24.

141
Ferdowsi, B. and Stanke, A. (2002), “Lean Effects on Aerospace Programs” (LEAP)
Project F-16 Case Study Report, Lean Aerospace Initiative, Cambridge, MA.
Fine, H.R., (1983). “Improving Productivity - Western Versus Eastern Styles.” The
Government Accountants Journal, 32(3), pp. 42.
Fogarty, D. et al. (1991), “Production and Inventory Management,” 2nd ed., South-
Western Publishing, Cincinnati, OH.
G Navas, H.,V. and Machado, V.C., (2013). “Systematic Innovation in a Lean
Management Environment.” IIE Annual Conference. Proceedings, , pp. 2138-2147
Gallucci, G., W. Swartz, F. Hackerman. (2005). Brief reports: “Impact of the wait for an
initial appointment on the rate of kept appointments at a mental health centre.”
Psychiatry. Serv. 56(3) 344-346.
Gapp, Fisher, Kobayashi, (2008). “Implementing 5S within a Japanese context: an
integrated management system.” Management Decision, 46(4), pp. 565-579.
George, M. L. (2003). “Lean Six Sigma for Service: How to Use Lean Speed and Six
Sigma.” Quality to Improve Services and Transactions: McGraw-Hill.
Gesell, S., B. and Gregory, N. (2004). “Identifying Priority Actions for Improving Patient
Satisfaction with Outpatient Cancer Care.” Journal of Nursing Care Quality 19(3): pp.
226 – 233.
Goldratt, E.M. Cox, J. (1984). “The Goal – A Process of On-going Improvement.” North
River Press Publishing Cooperation. Great Barrington M.A, USA.
Goldsmith, J., (1989), "A Radical Prescription for Hospitals," Harvard Business Review,
67, 3, pp. 104-111.
Gomes, C.F., Yasin, M.M. And Yasin, Y., (2010). “Assessing operational effectiveness in
healthcare organisations: a systematic approach.” International journal of health care
quality assurance, 23(2), pp. 127-40.

142
Greb, E., (2009). “Is JIT Manufacturing the Right Prescription?” Pharmaceutical
Technology, 33(3), pp. 72-72,74,76,78.
Guido C. Kaandorp and Ger Koole (2007) : Optimal outpatient appointment scheduling,
Health Care Manage Sci 10: pp. 217–229.
Guinet, A., S. Chaabane. (2003). “Operating theatre planning.” International Journal of
Production. Econ. 85(1): pp. 69-81.
Gul, S., Denton, B.T., Fowler, J.W. And Huschka, T., (2011). “Bi-Criteria Scheduling of
Surgical Services for an Outpatient Procedure Centre.” Production and Operations
Management, 20(3), pp. 406-XI.
Gupta, A., and Denton, B. (2008). “Appointment Scheduling in Health Care: Challenges
and Opportunities.” IIE Transactions 40, pp. 800-819.
Gupta, D. and Wang, L. (2008). “Revenue management for a primary-care clinic in the
presence of patient choice.” Operations Research 56(3): pp. 576-92.
Hall. R. (2006). “Patient flow: the new queuing theory for healthcare.” OR/MS Today
33, pp. 36-40.
Haraden C and Resar R (2004). “Patient flow in hospitals: understanding and
controlling it better.” Front Health Service Management 20 : pp. 3-15.
Hartwell, J. and Roth, G. (2006), "Case study Rockwell Collins and IBEW locals 1362 and
1634 investing in knowledge skills and future capability in an uncertain business
environment", Lean Enterprise Change Research Case Studies.
Heroman, William M, Davis, Charles B, And Farmer, Kenneth L, (2012). “Demand
Forecasting and Capacity Management in Primary Care.” Physician Executive, 38(1),
pp. 30-4.
Hien, V.T., Randall, D.C. and Wells, W.C., (1989). “Manufacturers' Inventory
Management for Hospitals.” Information Strategy, 6(1), pp. 10.

143
Hodgson, G.M., (2009). “Towards an alternative economics of health care.” Health
Economics, Policy and Law, 4(1), pp. 99-114
Hogrefe, K., (2013). Everything in its place. ISHN, 47(6), pp. 67.
Hollingswoth, B. (2003). “Non-parametric and Parametric Applications Measuring
Efficiency in Healthcare.” Healthcare Management Science vol 6, 203-218.
Hubbard, R., (1999). Case study on the 5S program: “The five pillars of the visual
workplace.” Hospital materiel management quarterly, 20(4), pp. 24-28.
Hutchins, H.A., (1999). “Seven key elements of a successful implementation, and eight
mistakes you will make anyway.” Hospital materiel management quarterly, 21(2), pp.
76-82.
Hutzschenreuter, Anke Kristine, (2010). “A Computational Approach to Patient Flow
Logistics in Hospitals” - Eindhoven: Technische. University Eindhoven.
IMS Institute for Healthcare Informatics Releases New Study: 'Understanding
Healthcare Access in India: What is the Current State?'. (2013). Health & Beauty Close
– Up.
Inman, R.A., Sale, R.S., Green, Kenneth, W., Jr And Whitten, D., (2011). “Agile
manufacturing: Relation to JIT, operational performance and firm performance.”
Journal of Operations Management, 29(4), pp. 343.
Isken, M.W., and Rajagopalan, B. (2002). “Data Mining to Support Simulation Modeling
of Patient Flow in Hospitals.” Journal of Medical Systems 26, (2), 179-197.
Jack, E.P. And Powers, T.L., (2009). “A review and synthesis of demand management,
capacity management and performance in health-care services.” International Journal
of Management Reviews, 11(2), pp. 149-174.
Jeffry Liker and Mike Rother, (2011). Why Lean Programs Fail -- Where Toyota
Succeeds: A New Culture of Learning.

144
Jun JB, Jacobson SH and Swisher JR (1999). “Application of discrete-event simulation in
health care clinics”: A survey. Journal of Operational Researsh. Soc 50 : pp. 109-123.
Kaandorp, G.C. and Koole, G. (2007). “Optimal Outpatient Appointment Scheduling.”
Health Care Management Science 10, 217-229.
Kachhal, S. K., (2001). “Industrial engineering Applications in Health Care Systems.” In
Handbook of Industrial Engineering. Technology and Operations Management. 3rd
Edition. Edited by: Gabriel Salvendy. Published by: John Wiley and Sons, Inc. New York.
Khamkanya, T., Heaney, G. And Mcgreal, S., (2012). “Scenario-based approach to office
occupancy analysis.” Property Management, 30(4), pp. 333-350.
Klassen, K.J. And Rohleder, T.R., (2004). “Outpatient appointment scheduling with
urgent clients in a dynamic, multi-period environment.” International Journal of Service
Industry Management, 15(2), pp. 167-186.
Klein, J. and Maurer, P. (1994), "Integrators, not generalists needed: a case study of
IPD teams at Textron Defense Systems", Lean Enterprise Change Research Case
Studies.
Kong, N. And Fabri, P.J., (2009). “Optimal Physician Scheduling in a Multi-Clinic
Network to Improve Patient Accessibility to Outpatient Care.” IIE Annual Conference.
Proceedings, , pp. 1808-1813.
Koning. H, Verver. J, Bisgaard. S, Ronald. J.M.M (2006) : “Lean Six Sigma in Healthcare.”
Journal of Healthcare Quality, Vol. 28, No. 2.
Krupp, J.A.G., (1984). “Why MRP Systems Fail: Traps to Avoid.” Production and
Inventory Management, 25(3), pp. 48.
Kumar, S. and Nunne, W.H., (2008). “Measuring technical efficiency of specialty
hospitals in the US.” Journal of Revenue and Pricing Management, 7(2), pp. 139-152.
LaGanga, L. and Lawrence, S.R. (2007). “Clinic Overbooking to Improve Patient Access
and Increase Provider Productivity.” Decision Sciences 38, (2), 251-276.

145
Laganga, L.R., (2011). “Lean service operations: Reflections and new directions for
capacity expansion in outpatient clinics.” Journal of Operations Management, 29(5),
pp. 422.
Lamiri, M., X. Xie, S. Zhang. (2008). “Column generation approach to operating theater
planning with elective and emergent patients.” IIE Trans. 40: pp. 838-852.
Landel, R.D. and Snyder, A., (2011). “Business Process Mapping.” Charlottesville
Langabeer, J.R., Dellifraine, J.L., Heineke, J. and Abbass, I., (2009). “Implementation of
Lean and Six Sigma quality initiatives in hospitals: A goal theoretic perspective.”
Operations Management Research, 2(1-4), pp. 13-27.
Leah Binder (2013): “The Five Biggest Problems In Health Care Today”, Pharma and
Healthcare.
Leblanc, L., Hoot, N.R. and Jones, (2012). “Simulation Models for Just-in-Time Provision
of Resources in an Emergency Department.” Rochester: Social Science Research
Network.
Lewis, J., (2007). “Organising the workplace.” FDM, 79(3), pp. 69-70.
Liker, J.K and Morgan, J.M (2006). “The Toyota Way in Services: The Case of Lean
Product Development.” Acad Manage Perspect May 1, 2006 vol. 20 pp. 5-20
Liu, N., (2009). “Appointment scheduling in health care”’ The University of North
Carolina at Chapel Hill.
Lovejoy, W. S., Y. Li. (2002). “Hospital operating room capacity expansion.” Manage.
Sci. 48(11): pp. 1369-1387.
Ludy Mae Nalzaro (2012) “Sample and Sampling Techniques”, Chapter 8.
Mackelprang, A.W. and Nair, A. (2010), "Relationship between just-in-time
manufacturing practices and performance: a meta-analytic investigation", Journal of
Operations Management, Vol. 28, pp. 283-302.

146
Martin Littmann (2014): “Resolving real world Healthcare Problems Virtually; Building
a Smarter Planet”, May 2014.
Matson, J.E and Matson, J.O. (2007) : “Just‐in‐time implementation issues among
automotive suppliers in the southern USA.” Supply Chain Management: An
International Journal, Vol. 12 Iss 6 pp. 432 – 443.
Mazanai, M., (2012). “Impact of just-in-time (JIT) inventory system on efficiency,
quality and flexibility among manufacturing sector, small and medium enterprise
(SMEs) in South Africa.” African Journal of Business Management, 6(17), pp. 5786.
Mcgaughey, R.E. And Gunasekaran, A., (2007). “Enterprise Resource Planning (ERP):
Past, Present and Future.” International Journal of Enterprise Information Systems,
3(3), pp. 23-35.
McLeod, R. (1995), Management Information Systems, 6th ed., Prentice Hall,
Englewood Cliffs, NJ.
Mehok, K., (2011). “The Journey Into 5S.” Automotive Body Repair News, 50(9), pp. 58-
61.
Mercer, A. (1960). “A Queuing Problem in which the Arrival Times of the Customers
are Scheduled.” Journal of the Royal Statistical Society. Series B (Methodological) 22(1)
: pp. 108-13.
Mercer, A. (1973). “Queues with Scheduled Arrivals: A Correction, Simplification and
Extension.” Journal of the Royal Statistical Society. Series B (Methodological) 35(1): pp.
104-16.
Meredith P, Ham C and Kipping R (1999). “Modernising the NHS: Booking Patients for
Hospital Care.” Health Services Management Centre, University of Birmingham:
Birmingham.

147
Méxas, M.P., Quelhas, O.L.G., Costa, H.G. And Lameira, V.D.J., (2013). “A Set of Criteria
for Selection of Enterprise Resource Planning (ERP).” International Journal of Enterprise
Information Systems, 9(2), pp. 44.
Mistry, J.J. (2005), "Origins of profitability through JIT processes in the supply chain",
Industrial Management & Data Systems, Vol. 105 No. 6, pp. 752-68.
Murray M, Tantau C (1999) “Redefining open access to primary care.” Manag Care Q 7:
pp. 45–51.
Murray, M. and Berwick, D. (2003). “Advanced Access: Reducing Waiting and Delays in
Primary Care.” Innovations in Primary Care JAMA. 289(8): pp. 1035-40.
Murray, M. C. and Tantau. (2000). “Same-day appointments: Exploding the access
paradigm.” Family Practice Management. September: pp. 45-50.
Muthuraman, K. And Lawley, M., (2008). “A stochastic overbooking model for
outpatient clinical scheduling with no-shows.” IIE Transactions, 40(9), pp. 820.
Naidu, K. D., Sulllivan, K. M.,Wang, P. P., and Yang, Y., (2005). “Managing personnel
through staff scheduling algorithms," Proceedings of the Fifth Joint Conference on
Information Sciences, 5(2), pp. 829-835.
Nash, M.A. and Poling, S.R., (20090. “Process Mapping for the 21st Century.” Quality,
48(8), pp. 24-25.
NHS Modernisation Agency (2005b). Improvement leaders' guide. “Improving flow:
Process and systems thinking.” NHS Modernisation Agency, Department of Health,
London, UK.
NHS Modernisation Agency (2005a). Improvement leaders' guide. “Matching capacity
and demand: Process and systems thinking.” NHS Modernisation Agency, Department
of Health, London, UK.

148
Omaswa, F., Burnham, G., Baingana, G., Mwebesa, H. And Morrow, R., (1997).
“Introducing quality management into primary health care services in Uganda. World
Health Organisation”. Bulletin of the World Health Organisation, 75(2), pp. 155-61.
Ovretveit.J. (2000), “The Norwegian Approach to Integrated Quality Development”,
HealthCare Review online: Experience in practice, Vol.2 No.1.
Paradiso, J. and Cruickshank, J.R., (2007). “Process Mapping for SOX and Beyond.”
Strategic Finance, 88(9), pp. 30-35.
Patrick, J., (2012). “A Markov decision model for determining optimal outpatient
scheduling.” Health care management science, 15(2), pp. 91-102.
Peng Luo, (2008). “Analysis of Cultural Differences between West and East in
International Business Negotiation,” International Journal of Business and
Management, Vol 3, No. 11.
Petersen, P. (2002), "The misplaced origin of just-in-time production methods",
Management Decision, Vol. 40 No. 1, pp. 82-8.
Piper, C.J., (1988). “Material Requirements Planning: From Inventory Control to
Inventory Management.” Industrial Management, 12(9), pp. 4.
Qu, X., Peng, Y., Kong, N. And Shi, J., (2013). “A two-phase approach to scheduling
multi-category outpatient appointments - A case study of a women's clinic.” Health
care management science, 16(3), pp. 197-216.
Qu, X., Rardin, R.L., Williams, J.A.S. And Willis, D.R., (2007). “Matching daily healthcare
provider capacity to demand in advanced access scheduling systems.” European
Journal of Operational Research, 183(2), pp. 812.
Rahman, M.A., (2006). “Measuring and explaining the managerial efficiency of private
medical clinics in Bangladesh”: An exploratory study, Brandeis University, The Heller
School for Social Policy and Management.

149
Rais, A. and Viana, A., (2011). “Operations Research in Healthcare: a survey.”
International Transactions in Operational Research, 18(1), pp. 1-31.
Reh, F.J., (2005). “Pareto's Principle-The 80-20 Rule.” Business Credit, 107(7), pp. 76.
Rinder, M.M. And Weckman, G., (2010). “Techniques in Modelling Healthcare
Operation Data from Hospitals to Improve Scheduling: a Review and Assessment.” IIE
Annual Conference. Proceedings, pp. 1-6.
Salaheldin, I.S., (2005). “JIT implementation in Egyptian manufacturing firms: some
empirical evidence.” International Journal of Operations & Production Management,
25(3), pp. 354-370.
Salinkar, J., (2010). “Dynamic-interval scheduling policies to minimize appointment
waiting time for outpatient healthcare settings”, State University of New York at
Binghamton.
Schansberg, D.E., (2014). “The Economics of Health Care and Health Insurance.” The
Independent Review, 18(3), pp. 401-420.
Sharon Hall (2014): “The Role of Risk Management in Healthcare Operations;” Kevin
Norris, Benefits Education and Events.
Sheffield J. (2008) “Inquiry in Health Knowledge Management.” Journal of Knowledge
Management 12: pp. 160-172.
Shil, N.C., (2009). “Explicating 5S: Make you Productive.” Interdisciplinary Journal of
Contemporary Research In Business, 1(6), pp. 33-47.
Shivaji, E. and Subramaniam, S., (2009). “Applying Lean Techniques in Hospital.”
Rochester: Social Science Research Network. Pp. 1-9
Shortell SM and Kaluzny AD. (2000): “Organisation Theory and Health Care
Management; Health Care Management: Organisation Design and Behaviour.” 4th
Edition ed. Albany, NY: Delmar.

150
Singh, G. And Ahuja, I.S., (2013). “Strategies and success factors for overcoming
challenges in JIT implementation in Indian manufacturing industry.” International
Journal of Technology Policy and Management, 13(1), pp. 15.
Slack, N., Chambers, S., Johnston, R., and Betts, A., (2009): “Operations and Process
Management: Principles and Practice for Strategic Impact,” 2nd Edition, Pearson
Education, Harlow, UK.
Smith-Daniels, V., Schweikhart, S.B. And D., (1988). “Capacity Management In Health”
Care Services: Review And Future. Decision Sciences, 19(4), pp. 889.
Steinberg, E., Khumawala, B. and Scamell, R., (1982). “Requirements Planning Systems
in the Health Care Environment.” Journal of Operations Management, 2(4), pp. 251
Stephen Deas, (2009) : “Simple Process Mapping Techniques,” Quality Minds.
Sweeney, D.R. (1996). Your office: A Lot of Things Will Have to Change. Medical
Economics 73, (7), 97-102.
Thomas, W.S., (2007). “Achieving success through adoption of Enterprise Resource
Planning”: A quantitative analysis of SAP users in North and South America, Capella
University.
Thomas. L and Jackson, (2009): “5S for Healthcare, Lean tools for Healthcare services,”
Rona Consulting group and Productivity Press, pp. 6-14.
Towers Watson (2012): “Strategic Risk Management for the Hospital Industry in
Transition.”
Towers, N., Knibbs, A. And Panagiotopoulos, N., (2005). “Implementing manufacturing
resource planning in a Greek aerospace company”: A case study. International Journal
of Operations & Production Management, 25(3), pp. 277-289.
Towne, J., (2006). “Going 'Lean' Streamlines Processes Empowers Staff and Enhances
Care.” Hospitals & Health Networks, 80(10), pp. 34-5.

151
Trebilcock, B., (2004). “Lean & mean.” Modern Materials Handling, 59(3), pp. 43-48.
Tyler, D., C. A. Pasquariello, C. H. Chen. (2003). “Determining optimum operating room
utilisation.” Anesthesia. Analog. 96: pp. 1114-1121.
Uppal, R., Li, D., Wang, S., Fulton, J., Beinlich, N., Mostow, E., Anthony, R. And Nice, L.,
(2012). “Continuous Process Improvement in an Outpatient Wound Clinic using Lean
and Systems Engineering Tools.” IIE Annual Conference. Proceedings, pp. 1-10.
Üsou, Shetty, Sonu, K., (2012), Group project thesis, MSc Health Operations Cranfield
University. “A study of patient discharge process in a super speciality hospital: A step
towards process Re-engineering.”
Van der Voordt, DJ.M. (2004), "Productivity and employee satisfaction in flexible
workplaces", Journal of Corporate Real Estate, Vol. 6 No. 2, pp. 133-48.
Vasilakis, C., Sobolev, B.G., Kuramoto, L. And Levy, A.R., (2007). “A simulation study of
scheduling clinic appointments in surgical care: individual surgeon versus pooled lists.”
The Journal of the Operational Research Society, 58(2), pp. 202-211.
Vissers J (1979). “Selecting a suitable appointment system in an outpatient setting.”
Med Care 17 : 1207-1220.
Wailgum, T. (2009). “10 Famous ERP Disasters, Dustups and Disappointments.”
Welch, J. D. (1964). “Appointment Systems in Hospital Outpatient Departments.”
Operational Research Quarterly 15(3): 224-32.
White, B. and Pike, M. C. (1964). “Appointment Systems in Out-Patients’ Clinics and
the Effect of Patients’ Unpunctuality.” Medical Care 2(3): 133-145.
Wijewickrama, A. and Takakuwa, S. (2008). “Outpatient appointment scheduling in a
multi facility system.” Paper presented at the 40th Winter Simulation Conference,
December 07-10, in Miami, FL.

152
Wilson, F., Desmond, J. and Roberts, H. (1994), "Success and failure of MRP II
implementation", British Journal of Management, Vol. 5, pp. 221-40.
Womack, J.P. and Jones, D.T. (1996), “Lean Thinking: Banish Waste and Create Wealth
in Your Corporation,” Simon & Schuster, New York, NY.
Wood, M.D., Bostrom, A., Bridges, T. and Linkov, I., (2012). “Cognitive mapping tools:
review and risk management needs.” Risk analysis, 32(8), pp. 1333-1348
World Health Organisation, (1946): “Constitution of the World Health Organisation.”
AmJ Public Health. 1946;36(11);pp. 1315-1323.
Wright, P.D., Bretthauer, K.M., and Coté, M.J. (2006). “Re-examining the Nurse
Scheduling Problems: Staffing Ratios and Nursing Shortages.” Decision Sciences 37, (1),
pp. 39-70.
Yedehalli Venkataramu, R., (2005). “A revenue management framework for
appointment allocation in rehabilitation outpatient clinics,” Wichita State University.
Yip, W. and Mahal, A. (2008) : “The Health Care Systems Of China And India:
Performance And Future Challenges”, Health Affairs July 2008;27(4);pp. 921-932.

153
BIBLIOGRAPHY
Agarwal, A.K. (2007). “Standard Operating Procedures for Hospitals in India.”
Arthur, J. (2009). “Lean and Six Sigma for Hospitals. Simple Steps to Fast, Affordable
and flawless Healthcare.”
Augustine, B. Bhasi, M. Madhu, G. (2012). “Use of Planning and Controlling in
Manufacturing Industries”: International Journal of Operations Management and
Information Technology Vol 2(1): pp. 1-38.
Berwick, K. (2010). “Transforming Healthcare.”
Capron, B., Kuiper, D., Levy, L. And Dureno, D., (1995). “Methodology for avoiding
failure.” Manufacturing Systems.
Dodwad, S.S. (2013). “Quality Management in Healthcare.” Indian Journal of Public
Health. Vol 57. pp 138-143.
Engle Paul, (Aug 2012). Lean office .
Humphrey, Brad. (2008). “The 5S formula that improves efficiency and helps your
company shine.”
Leung, J.Y. (2004). “Handbook of Scheduling: Algorithms, Models and Performance
Analysis.” Chapman and Hall (CRC). New York.
Manjunath, U. (2012). “Total Quality Services in Healthcare.”
Maulik, S. (2011) “The healthcare Quality Book : Vision, Strategy and Tools,” (3rd
edition).
Pranckevicius, Dario; Diaz, Deisell M; Gitlow, Howard, A lean six sigma case study:
Application of the "5s" techniques (2008). Journal of Advances in Management
Research 5.1.

154
Sakharkar, B.M. (2009). “Principles of Hospital Administration and Planning” (2nd
Edition).
Spencer, M.S., (1991). Using 'The Goal' in an MRP System. Production and Inventory
Management Journal, 32(4), pp. 22.
Srinivasan, G. (2012). “Operations Research Principles and Applications” (2nd Edition).
Srivastava, T.N. (2012). “Statistics for management” (2nd Edition).
Tabish, S.A. (2001). “Hospital and Health Services Administration : Principles and
Practice.”
Thomas Cummings, Christopher Worley (2009), “Organisation Development and
Change,” 10th edition.

155
APPENDIX
APPENDIX A
Project Plan Gantt Chart
Figure 32 : Project Gantt Chart

156
APPENDIX B
AS – IS Process Map of the OPD
Figure 33 : AS – IS Process of the OPD
The AS – IS process was validated by Dr. Vinit Samant (Operations Manager) on the
12th May, 2014.

157
APPENDIX C
TO – Be Process Map of the OPD
Figure 34 : TO – BE Process Map of the OPD
The TO – BE process was validated by Dr. Vinit Samant (Operations Manager) on the
20th September, 2014.

158
APPENDIX D
Data compilation table.

159
Figure 35 : Data Compilation Table
Abbrevations used
Speciality Abbreviations ENT ENT Internal Medicine IM Neuro Medicine NM Neuro Surgery NS Ophthalmology OP Orthopaedics OR Psychiatry PSY Urology UR Dermatology D

160
Endocrinology E General Surgery GS Geriatrics GR Gynaecology GY Peds Orthopaedics PO Gastroenterology GE Vascular Surgery VS Paediatrics P Neonatology NN Cardiology C
Signficance of each Column
A = Consultant
B = Total Pts : Total number of Patients studied
C = Time consulted : Time taken to consult the total number of patients studied.
D = Appointments : Number of patients in the study who had taken an appointment.
E = Walk-in : Number of patients in the study who walked in without an appointment.
F = A : W - Comparison between the number of appointments and number of walk-ins in the study.
G = AvT App (min) : Average time in minutes taken to consult appointment patients.
H = AvT Wk (min) : Average time in minutes taken to consult walk-in patients.
I = Follow up % : Percentage of patients in the study not billed.
J = Time allotted/week (min) : Consultation time allotted for the consultant in a week.
K =Total Pts that can be seen/week : Number of patients that can be consulted by respective doctors in one week.
L = Av No. of Pts seen/week : Average number of patients a doctor presently consults in a week.
M = Slot time (min) : Slot time suggested for each consultant from the study.
N = No. App : Number of slots that can be allotted for appointment patients in one hour.
O = No. Walk-in : Number of slots that can be allotted for walk-in patients in one hour.
P = DNA % : Percentage of patients who did not attend after booking an appointment.
Q = Addnl Wk-in : Additional number of walk-ins that can be allowed keeping in mind DNA%.
R = Total Wk-ins/hr : Total number of walk-ins that can be allowed per hour for respective Consultants.

161
All the data collected were compiled into a table. Due to large number and size of the
individual consultant data sheets it was impossible to include them in the report.
However they are available for inspection on the supplied data stick/cdrom.
APPENDIX E
OT – OPD Overlap Time
Figure 36 : OT – OPD Overlap Time of Surgical Specialities

162
Figure 37 : OT – OPD Overlap Time of Individual Surgical Speciality Consultants