re-testing pisa students one year later. on school value ...checchi.economia.unimi.it/pdf/86.pdf ·...
TRANSCRIPT
Re-Testing PISA Students One YearLater. On School Value AddedEstimation Using OECD–PISA
Massimiliano Bratti* Daniele Checchi#Università degli Studi di Milano Università degli Studi di Milano and IZA, Bonn and IZA, Bonn
In two provinces of Northern Italy the OECD PISA 2009test was re-administered to the same individuals one year later.We show that: a) cross-sectional school fixed effects estimatesare volatile over time, given the high year-to-year attrition inthe student population; b) longitudinal measures of schoolvalue added are more robust to student attrition, but requireadequate control for sample selection of both schools and stu-dents; c) longitudinal measures provide still inadequate meas-ures of teachers/schools contribution to student competenceswhen the secondary school tracks students on ability, studentscan change tracks and/or drop out from schools.[JEL Classification: I21; J24].
1
* <[email protected]>, Department of Economics, Management and QuantitativeMethods (DEMM), Università degli Studi di Milano.
# <[email protected]>, Department of Economics, Management and Quantitative Meth-ods (DEMM), Università degli Studi di Milano.We wish to thank for their collaboration: INVALSI (Istituto Nazionale per la Valutazione delSistema Educativo di Istruzione e di Formazione), in particular Piero Cipollone, Laura Palmerioand Sabrina Greco; IPRASE (Istituto Provinciale per la Ricerca e la Sperimentazione Educativa- Trento), in particular Francesco Rubino, and SREV (Struttura Regionale per la valutazionedel sistema educativo - Valle d’Aosta), in particular Piero Floris and Paola Gallotta. We alsothank Anna De Paoli for research assistantship in the field analysis conducted in Trento. Par-ticipants to the workshops and conferences “Improving Education through Accountability andEvaluation. Lessons from Around the World” (2013, Rome), the Fifth International Workshopon the Applied Economics of Education (2013, Catanzaro), the 25th Conference of the EuropeanAssociation of Labour Economists (2013, Turin), Enrico Rettore and Erich Battistin are grate-fully acknowledged for their comments. The usual disclaimers apply.
Keywords: Italy; OECD-PISA; school assessment; studentattrition.
Checchi imp_Layout 1 27/11/17 17:43 Pagina 1
Rivista di Politica Economica ottobre/dicembre 2016
2
1. - Introduction
Students and families are often interested in identifying which are the schoolsattaining the best performance, irrespective of whether this outcome is due tobetter students, better teachers, better resources or a combination of them. Re-searchers and policy makers are more interested in the contribution that schoolsand teachers provide to students’ competences, sometimes indicated as schoolvalue added (VA, hereafter – see American Statistical Association, 2014). Theavailability of reliable measures of school VA raises schools’ accountability, sincepolicy makers can allocate resources in an efficient and effective way. The generalconsensus is that building a proper measure of school VA requires longitudinaldata, which allow for measuring the increase in knowledge for the same individualovertime, some of which may be attributed to the attended school. However, re-cent contributions (Rothstein, 2009 and 2010) have shown that also longitudinalmeasures can provide biased measures if it is not possible to control for self-sortingof students
Our paper exploits data collected in an occurrence of PISA testing/retesting toexplore the possibility of properly measuring the school VA in the framework ofthe Italian secondary school. This framework is interesting for at least two reasons:first, Italy has only recently started to build up a national system of school evalu-ation, and only very recently some analysis of school VA have begun to appear(INVALSI, 2016, chap. 7); second, the Italian secondary school is organised alongthree tracks (academic - licei, technical - istituti tecnici, and vocational - scuole pro-fessionali), with significant mobility across tracks and early school leaving (exceed-ing 20% at the time of the present survey). One may object that PISA survey isnot intended to evaluate single schools, rather to measure the performance of na-tional educational systems in a comparative perspective. However, PISA surveysmeasure “knowledge for life”, which represents a concept of knowledge which isnot necessarily curricular and which is assumed to be persistent over an individual’slife cycle. This is probably closer than curricular competences to the economicconcept of “human capital”, which represents the stock of knowledge embodiedin the individual and which contributes to increasing her productivity or qualityof life (health, political participation, etc.),1 and can be used to monitor regionaldifferences or to promote educational reforms (like de-tracking – see Pons, 2011).
1 Curricular competences may instead be year or age specific, i.e. they may be subjected to avery high rate of depreciation, and may not represent an optimal measure to evaluate the “socialrole” of schools.
Checchi imp_Layout 1 27/11/17 17:43 Pagina 2

Thanks to two field experiments conducted in two Northern Italian regions(Trento and Valle d’Aosta), PISA tests were re-administered in 2010 to the samestudents who were included in the 2009 official survey. To the best of our knowl-edge, this is the first paper to use data on a PISA re-test, and gives us the oppor-tunity to investigate some important issues. First, the re-test exercise is useful tocontrast cross-sectional measures of school VA, which are commonly available,with longitudinal measures. Second, the re-test was implemented on a voluntarybasis in Trento while the entire student population was involved in Valle d’Aosta.This enables us to discuss the issue of panel attrition in two very different survey’scontexts, and its relevance when the objective is to build longitudinal measuresof school value added. Third, possibly as a consequence of different educationalpolicies conducted at regional level, our analysis uncovers marked differences inthe two “educational systems”: the correlation between school fixed effects com-puted from cross-sectional data in 2009 and 2010 is high in Trento and low inValle d’Aosta; in addition, when measuring school VA in a longitudinal perspec-tive, the persistence in students’ achievements is low in Trento and high in Valled’Aosta. Fourth, we make an attempt at evaluating schools’ contribution to ameasure of skills (knowledge for life) which is closer to the concept of humancapital than those measured by standardized curricular tests.
Our suggested interpretation of these two apparently contradictory results isrooted into the different selectivity of the two educational systems. Indeed, whilein Trento only 8% of the students who were originally tested in 2009 droppedout or changed school in 2010, the percentage rises to about 21% in Valled’Aosta. Through a simple economic framework in which an individual’s schoolperformance depends positively on the ability of her peers and negatively on theheterogeneity of the peer group, we suggest that higher “selectivity” (defined asa higher number of students dropping out or changing schools) is a possible de-terminant of both the lower correlation between cross-sectional measures ofschool VA and the higher year-to-year persistence in student test scores.
Our analysis also shows that, irrespective of different drop-out rates, longitu-dinal measures of school VA, based on panel data, are little sensitive to studentattrition, i.e. to the fact that some students who participated in PISA 2009 forvarious reasons did not participate in the 2010 re-test exercise. However, if thestudents changed track from one year to the next (and this is more frequent atthe end of grade 10, which is the modal grade attended by PISA students) the es-timated VA is likely to be biased, since academic schools are losing weaker stu-dents, while vocational schools are gaining students from more selective schools.
M. BRATTI - D. CHECCHI Re-Testing PISA Students One Year Later. On School Value ...
3
Checchi imp_Layout 1 27/11/17 17:43 Pagina 3

Thus longitudinal measures in tracked school systems do not provide unbiasedestimates of the true school VA due to the potentially different student selectionand retention policies used by schools and educational systems.
The structure of the paper is as follows. The next section introduces institu-tional backgrounds of the two re-tests, whereas Section 3 illustrates similaritiesand differences between the conditions under which the two experiments wereconducted. Our empirical strategy is illustrated in Section 4, providing the the-oretical justification for the following empirical analysis; technical aspects relatedto selection bias and strategies to cope with it are reported in an appendix. Themain empirical results are reported in Section 5 and discussed in Section 6. Thefinal Section summarizes the main findings and concludes.
2. - Data and Context
Italy has always participated in the OECD-PISA project since its inception in2000. Due to the lack of a national system of school assessment, the PISA surveybecame the first source of information on the performance of the Italian second-ary school system, showing significant between-region and between-school vari-ations (Bratti et al., 2007).2 Table 1 shows that student performance varies alongtwo dimensions: the type of track attended and the North-South latitude. Look-ing at country level, the average distance between an academic oriented track(liceo) and a vocational track (istituto tecnico or scuola professionale) is close to oneand half standard deviation.3 The geographic divide is as much impressive: otherthings constant, the North-Eastern part of the country obtains the highest averagetest score, closely followed by the North-West macro-region. The Centre andSouth-Islands then follow, with a gap well above half standard deviation.
In this paper we will focus onto two Northern regions which have conductedtwo re-tests of students for research purposes: Trento and Valle d’Aosta (see Figure1). The Autonomous Province of Trento is a small province of half million in-habitants, located in the North-East part of Italy, close to the Austrian border.Valle d’Aosta is an even smaller province (more precisely a region which containsonly one province) in terms of population (128,000 inhabitants), located in theNorth-West of the country, for centuries under the rule of the French-origin royal
Rivista di Politica Economica ottobre/dicembre 2016
4
2 Many regional governments financed the oversampling of the PISA survey in order to obtainadequate information to assess local school systems.
3 In the international sample PISA scores have a mean of 500 and a standard deviation of 100.
Checchi imp_Layout 1 27/11/17 17:43 Pagina 4
family Savoy, which one century and half ago succeeded in unifying the Italiannation. As other bordering regions (like Friuli Venezia Giulia), due to politicalreasons related to the difficult process of country unification both provinces enjoygreater autonomy in administration (like school design) and revenue collection(not participating in the cross-region redistribution). Nevertheless both follow theItalian scheme of a tracked secondary school system, even if their regional-basedvocational tracks enjoy (at least in the Trento region) better standards, as in theGerman tradition. When looking at student achievements through the PISA lens(see again Table 1) we observe that students from Trento’s or Valle d’Aosta’sschools obtain results that are in line with the bordering macro-regions, and betterthan the Central and Southern regions. This is mostly attributable to the relativeperformance of state vocational schools, which score almost half of a standard de-viation above the schools of the same track in the rest of the country. In additionto macro-inequalities, and despite the existence of tracks which attract differenttypes of students, there is also significant between-school variation.
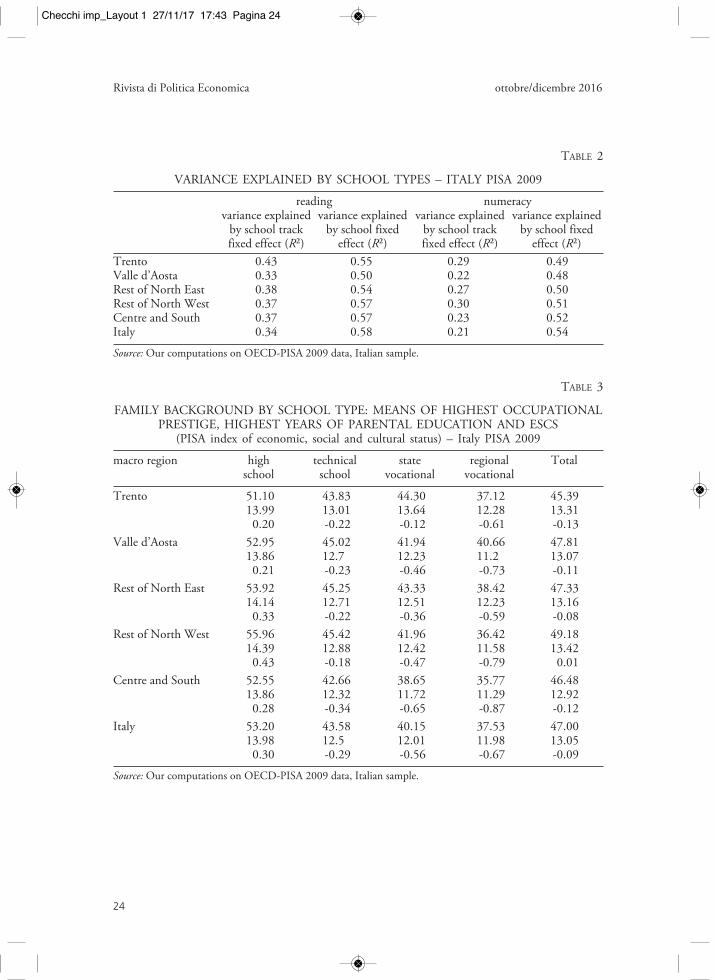
Before entering the analysis of school quality, the differences across regionsand across school tracks raise questions about student allocation across tracks.When we look at the variance decomposition (Table 2), we notice that the be-tween-track variance is higher in Trento compared to the rest of the country,while it is lower in the case of Valle d’Aosta. By contrast, there are no significantdifferences across areas when considering the between-school variance. This sug-gests that the relevant choice in Trento is the school track (since school qualityseems rather homogenous within tracks), while in Valle d’Aosta there is an addi-tional problem of choosing both the track and the school. The literature pointsto family background as the main factor driving students into different tracks.Without resorting to multivariate analysis, simple descriptive statistics (Table 3)suggest that sorting by social background may be less pronounced in Trento vis-à-vis the rest of the country.4 While in the rest of Italy students from better back-grounds (higher social prestige associated to parental occupation, better parentaleducation as measured by years of education and better ESCS score)5 are gatheredby the academic track (liceo), then by technical schools and eventually by voca-
M. BRATTI - D. CHECCHI Re-Testing PISA Students One Year Later. On School Value ...
5
4 A more rigorous statistical analysis (ordered probit model) does not identify a precise patternof sorting across regions, probably due to the lack of a proper measure of student ability.
5 ECSC stands for index of Economic, Social and Cultural status and is derived from the highestoccupational status of parents, highest educational level of parents (in years of education), fam-ily wealth, cultural possessions and home educational resources. It is recoded as zero meanvariable.
Checchi imp_Layout 1 27/11/17 17:43 Pagina 5

Rivista di Politica Economica ottobre/dicembre 2016
6
tional schools, in Trento this selection process is less pronounced, and studentsin vocational schools seem better endowed with parental resources (at least vis-à-vis students in technical schools). What is common to the whole country is thatregional vocational schools (which are characterised by shorter duration, threeinstead of five years) attract students from poorer backgrounds. Despite Trentoand Valle d’Aosta being hardly representative of the entire country, they do rep-resent two interesting case studies, which are sufficiently dissimilar one to theother to highlight different problems connected to the measurement of schoolVA using longitudinal data.
3. - Description of the PISA Re-Tests
In the year 2009 a decision to re-test PISA students was independently madeby two local educational authorities, following the advice of the local supervisorycommittees. In the case of Trento the opportunity was given by an effort at datacollection, needed for the drafting of a biannual report on the state of Trento’sschooling system. In the case of Valle d’Aosta the occasion came from the debateon the benefits to student learning deriving from bilingual education (Italian andFrench). As easily conceivable, the two projects underwent different negotiationswith local schools’ headmasters, the final outcome being different strategies ofimplementation which do not grant full comparability of the two exercises. Themain differences concern student participation (sampled in Trento, universal inValle d’Aosta), school participation (voluntary in Trento, mandatory in Valled’Aosta), test score reweighting (performed by INVALSI, the Italian agency ofschool assessment, in Trento and by ACER6-PISA consortium in the case of Valled’Aosta) and the language used for the test (only Italian for Trento, Italian orFrench for Valle d’Aosta). Nevertheless, the testing strategy is identical, and thisgrants sufficient comparability of the estimates across the two exercises. The po-tential sample selectivity issues related to the structure of two re-test exercises arediscussed in the Appendix: our overall conclusion is that selection biases are lim-ited in the Trento experiment (because negative selection of schools somehowbalances positive selection among students), while there are biases in the Valled’Aosta experiment, due to positive selection of students associated with earlyschool leaving or track change.
6 ACER stands for Australian Council for Educational Research.
Checchi imp_Layout 1 27/11/17 17:43 Pagina 6

3.1 Structure of the PISA Test in 2009 and 2010Following discussions with the PISA’s headquarter and with the Italian na-
tional agency for school assessment (INVALSI), it was decided to resubmit in2010 the same PISA booklets already used in 2009 for two main reasons. First,questions are not related to academic curricula set by the Ministry of Education,but they are intended to measure «… students’ ability to complete tasks relatingto real life, tapping a broad understanding of key concepts, rather than limitingthe assessment to subject-specific knowledge» (OECD, 2010, p. 24). As a conse-quence, administering the test a second time does not prevent checking for im-provements in pupils’ literacy levels. Second, the test is available in 13 differentversions of an equivalent level of difficulty (booklets) and it has, therefore, beenpossible for each participant to minimize the number of identical questions be-tween the two test sessions. In fact, each student has been assigned a booklet in2009 and one in 2010, according to the scheme described in Table 4.7 The stu-dents then had to answer several questions, three quarters different and one quar-ter identical between sessions; the test is focused on the assessment of readingskills, since the main PISA test’s focus in 2009 (and therefore also the 2010 re-test) was on students’ comprehension of written texts, although half of the bookletconcerns competences in science and mathematics. In both events the student,the school and the parent questionnaires were not administered twice, on the pre-sumption that relevant information would have not changed after one year.
3.2 Participating Schools and Test Administration in TrentoDuring the winter 2009 all 49 secondary schools in the Trento province whose
pupils had taken the test PISA 2009 were contacted and asked to resubmit anequivalent test to the same students, and only 35 agreed to a second administrationof the test.8 We discuss in the Appendix the potential selection bias arising from
M. BRATTI - D. CHECCHI Re-Testing PISA Students One Year Later. On School Value ...
7
7 Each booklet consists of four sections and each section is identified by a type (M = mathema-tics, S = sciences and R = reading) and an index. There are, therefore, three different sectionsfor mathematics (M1, M2 and M3) and sciences (S1, S2, S3) and seven different sections forreading (R1, ..., R7). It has to be noted that the allocation of the booklets was such that eachstudent answered in 2010 some questions that had already been responding in 2009. Thisoverlap occurs for all students, but only for a quarter of the questions, which is a single sectionof the test (grey cells in Table 4 show the overlapping section). For example, all students whohad received the booklet 1 in 2009 were assigned the booklet 7 in 2010, where section M3 iscommon to both years.
8 As our main focus is on VA estimation for upper secondary schools, we dropped from theanalysis one lower secondary school which was sampled in PISA 2009.
Checchi imp_Layout 1 27/11/17 17:43 Pagina 7

schools’ and/or students’ non-participation to the 2010 re-test. Whenever possible,for each school the reference person who had been responsible for testing in 2009was contacted again in 2010. After meeting all reference persons to illustrate thepotential test administration problems9 (April 16th, 2010), in May 2010, the book-lets and the lists containing the identification codes of the students were transmit-ted from INVALSI to the local agency Istituto Provinciale per la Ricerca e laSperimentazione Educativa (IPRASE). Schools were given a window of two weeksfor administering the test. The schools were required to return to IPRASE thebooklets compiled within 48 hours from completion of the retest. In June, thetests were sent back from IPRASE to INVALSI which carried out the correctionand scoring. INVALSI was constantly present in each stage of the re-test exercise,providing the technical assistance for test administration, correction of open ques-tions and estimation of student scores (including the plausible values).10
3.3 Participating Schools and Test Administration in Valle d’AostaFollowing a request from the local educational authority for evaluating the
impact of bilingual education (Italian and French) onto student learning, anagreement was signed with the OECD-PISA consortium in order to administerthe French version of the questionnaire to a random sample of students fromValle d’Aosta’s secondary schools. In order not to alter the standard national as-sessment conducted in 2009, it was decided to re-test Valle d’Aosta’s students in2010 using an identical scheme of booklet rotation to that just described (Table4). Given the small size of each age cohort, all 15-year-old students enrolled inregional upper secondary schools (including private ones) were tested in 2009(universal coverage). The very same students who were still enrolled in one of the
Rivista di Politica Economica ottobre/dicembre 2016
8
9 In the meeting some doubts emerged about absent pupils. In the case of pupils who wereabsent on the day of the retest, they were not given the opportunity to be tested in a secondsession. However, schools were asked to report the reasons of the student’s absence from school:transfer to another school, authorisation denied by parents, school drop-out, or “standard”truancy. Schools were instead requested to administer the tests to the students who were sam-pled for PISA 2009 but were absent during the test day, and who were instead present in 2010.Teachers in charge of the test administration were required to try to replicate in 2010 the sametesting conditions existing in 2009 (duration, rules of conduct, rooms’ characteristics, time ofthe day). The main goal was to make the two testing exercises as similar as possible in order tominimise the incidence of framing problems.
10 Starting from original students’ answers to the tests, INVALSI estimated the plausible valuesin the Trento 2009 sample provided by ACER-OECD, and then used the same algorithm toimpute the 2010 plausible values. Technical details on the estimation procedure are reportedin DI CHIACCHIO C. et AL. (2010). Thus scores in 2009 and 2010 are comparable.
Checchi imp_Layout 1 27/11/17 17:43 Pagina 8

regional secondary schools were retested on the same day (April 13th, 2010) oneyear later, but half of them (randomly determined at school level) obtained abooklet in Italian and the other half got it in French (the language spoken in thebordering region, even if the local variant – patois valdôtain – has dialectal inflex-ions).11 In this way it became possible to test both the potential increase in com-petences (comparing test scores in Italian over the two years) as well as theadvantage/disadvantage of using Italian or French while tested. The tests werethen mailed directly to ACER which returned the plausible values computed ac-cording to the international scale.
The universal coverage of the 2009 survey highlights a different aspect of at-trition in longitudinal studies. Looking at the numbers reported in Table 5, weobserve that 879 students took the test in 2009, but only 736 were traced in thefollowing year, losing 16% of the initial student body.12 Among the 143 lost stu-dents, 75 are officially reported as absent/truant the day of the 2010 test, 16 areunmatched among the two samples and the remaining 52 are truly drop-outs(since compulsory education ends at the age of 15 in Italy) or movers outside theregion. Within the 736 students included in the longitudinal component, only696 persisted in the same track, while 40 (equivalent to 4.5% of the initial studentbody) changed school track within the local schooling system.13 In order to eval-uate the school VA, we have to rely on this permanent component only, but wetry to account for the potential bias due to these different sources of attrition.
4. - Econometric Models of School Value Estimation
Various definitions of school VA exist in the academic literature. In general,school VA can be defined as the contribution that schools give to students’ com-petences over and above contextual factors. A good school VA model should takeinto account the characteristics of the student intake, which are likely to affect
M. BRATTI - D. CHECCHI Re-Testing PISA Students One Year Later. On School Value ...
9
11 Details can be found in Assessorato Istruzione e Cultura della Regione autonoma Valle d’AostaDipartimento Sovraintendenza agli Studi - Ufficio Supporto Autonomia Scolastica (2012),La Maîtrise de langue française. Rapport Régional PISA 2010 - Edition pour la Vallée d’Aoste.
12 ACER-OECD released a file containing 752 observations appearing in both surveys, and wematched them to the public file of PISA 2009 survey using the test results. We were able tomatch 736 students, thus losing 16 additional students which are reported in Table 5 as outsidethe local schooling system.
13 Table 5 shows only track changes (40 students), but comparing the school code over the twoyears allows for the identification of 12 additional students who changed school within thesame track (and which are consequently excluded from the panel component).
Checchi imp_Layout 1 27/11/17 17:43 Pagina 9

students’ competences irrespective of schools they are enrolled in. EducationalVA can be evaluated at different levels of aggregation. One can be interested inthe school’s VA or in teachers’ VA, as in Rothstein (2009). In this latter case inorder to distinguish the effect of teachers from that of the peer group it is neces-sary to have information on different classes within the same school, which is notthe case of OECD-PISA, where students are sampled out of schools and are notrepresentative of specific classes.
If we intend to use the above field experiments to evaluate schools we need tomake two important assumptions. The first one is that PISA tests, measuring“knowledge for life” and not curricular competences, can be an adequate outcometo evaluate schools’ performances. The second assumption is that these compe-tences for life, which are also correlated to idiosyncratic factors (unobservable tal-ent, family background, contextual factors), can be increased via effectiveschooling. In the light of policy interventions intended to enhance low-perform-ing educational systems which the OECD-PISA surveys have provoked in manycountries, we view these two assumptions as consistent with PISA project.
An important reference for researchers aiming at estimating educational pro-duction functions (EPF) is Todd and Wolpin (2003) who discuss the problemsposed by this difficult object. The authors carefully describe all the limitations ofcross-sectional measures of school VA, and the extreme richness of data neededto obtain unbiased estimates of the effects of inputs entering the EPF, which thenallow for an unbiased calculation of school VA. Unfortunately, in most cases re-searchers have to work with much less rich data, and this is also our case. Toddand Wolpin (2003) highlight how the availability of longitudinal data representsa first step towards a better understanding of the process of knowledge produc-tion. However, Rothstein (2010) shows that the absence of random allocation ofstudents to classes/teachers/schools prevents an unbiased estimation even of thelongitudinal VA of schools, due to serial correlation of students’ test scores.
In order to illustrate these problems, we assume that the data generatingprocess for student literacy (Tijt) can be expressed through the following EPF f (.):
(1) T f B VA aijt it jt i ijt= ( ), , ,ε
Rivista di Politica Economica ottobre/dicembre 2016
10
Checchi imp_Layout 1 27/11/17 17:43 Pagina 10

M. BRATTI - D. CHECCHI Re-Testing PISA Students One Year Later. On School Value ...
11
where i, j and t are subscripts for individual, school and time respectively.14 Tijt isthe test score of student i in school j surveyed in year t, while Bit are current familyinputs. Time-invariant unobservable individual components (like innate ability,self-confidence) are represented by ai. The contribution of school j (includingthe effect of teachers’ quality, motivation, school finances, etc.) to student i’s per-formance at time t is defined as the school valued added VAjt. εijt captures the ef-fect of time variant unobservable variables.
As it is often customary in the EPF literature, we adopt a linear specification.For illustrative purposes, let us assume that the student performance equation isgiven by the following EPF:
(2)
The contribution of school j to student i’s performance at time t is capturedby a fixed effect (λj) and by the interaction τj · t (a school-specific age trend); εijtis a white noise. Equation (2) shows that two potential measures of VA are avail-able. In cross-sectional studies, the researcher will be able to estimate only λj,while in longitudinal studies, i.e. when repeated observations on test scores areavailable, both the school fixed effect and the school-specific age trend could inprinciple be estimated. The specification also shows that in the absence of a meas-ure of individual ability it is difficult to interpret λj as school value added, sincethese coefficients also capture the effect of other time-invariant schools’ attributes(including the peer effect). By contrast, τj · t can be considered as a more correctmeasure of school VA as it refers to the average improvement overtime in the lit-eracy levels of the students enrolled in school j.
Estimation of equation (2) with ordinary least squares (OLS) poses severalproblems. Indeed, individuals are unlikely to randomly self-sort across schools,causing a correlation between individual ability, which is unobservable and enters
T t B t aijt it j j i ijt= + ⋅ + + + ⋅ + +( )α α α λ τ ε0 1 2
14 Here we do not follow a “cumulative approach” for knowledge production, that is we do notlet past literacy enter the current production of literacy (thus equation (1) does not correspondto models VAM1-VAM2-VAM3 proposed in ROTHSTEIN, 2010) So doing we focus on thebest-case scenario in which the availability of two adjacent time observations (Tijt and Tijt-1) oftest scores (as in our case) can help the researcher to estimate the “true” EPF. This would notbe possible if EPF had a cumulative form since Tijt-2 (which is not observed), for instance, entersTijt-1. However, we will see in what follows that also in our specification past performance willenter current performance through the role of unobserved individual ability (see equation (5)).
Checchi imp_Layout 1 27/11/17 17:43 Pagina 11

the error term, and school fixed effects and age-specific school trends. The esti-mates of all coefficients suffer from an omitted variables bias.
This can be partially addressed having repeated observations on student per-formance. Lagging equation (2) one period we obtain
(3)
from which we can easily derive an expression for individual ability
(4)
and replacing (4) in (2) we eventually get
(5)
Equation (5) clearly shows that a measure of past literacy Tijt-1 acts as a suffi-cient statistics for individual unobserved ability. In this case, under the assump-tion that Δε ≡ (εijt − εijt−1) is uncorrelated with school VA, consistent estimates ofschools’ VA can be retrieved from the OLS estimates of the school fixed effectsτj. In addition, equation (5) also allows for consistent estimation of the effect offamily inputs α2 if the variation in family inputs ΔB ≡ (Bit – Bit-1) is uncorrelatedwith Δε.
Two things are noteworthy. First, past performance enters equation (5) witha unitary coefficient. However, in the data we do not observe true literacy but animperfect measure of it, namely Tijt = T *
ijt + mT where mT is the measurementerror in the true literacy score T*. Classical measurement error (e.g., mT could beconsidered as pure luck) in the absence of other regressors in (5) could lead to anattenuation bias, and the estimated coefficient on Tijt-1 could be less than one.With other covariates, the sign and magnitude of the bias depends on the corre-lation between Tijt-1 and the other explanatory variables. Second, if family ques-tionnaires are not re-administered every year (as in our case for the Trento’s and
T t B t aijt it j j i ijt− − −= + ⋅ −( ) + + ⋅ −( ) + + +1 0 1 2 11 1α α α τ λ ε 11( )
a T t B ti ijt it j j ijt= − − ⋅ −( ) − − ⋅ −( ) − −− − −1 0 1 2 11 1α α α τ λ ε 11
T T B Bijt ijt it it j ijt ijt= + + ⋅ −( ) + + −( )− − −1 1 2 1 1α α τ ε ε .
Rivista di Politica Economica ottobre/dicembre 2016
12
Checchi imp_Layout 1 27/11/17 17:43 Pagina 12

for Valle d’Aosta’s re-tests), we only have one measure of family background(Bit–1). When the two observations of test scores are close enough in time, the as-sumption that ΔB = 0, i.e. of no variation in family background, can be consid-ered quite innocuous. In this case the EPF becomes
(6)
which corresponds to VAM1 model in Rothstein (2010). However, if ΔB = 0,including only past family inputs leads to the specification
(7)
where the sum in brackets represents the new error term. Then it is clear that theestimates of the contribution of past family background are biased if α2 ≠ 0 andfamily background is correlated over time (as it is likely to be the case). As Tijt – 1includes past family background, also the coefficient on past performance is biased(under the same hypothesis of serial correlation). The estimates of the school fixedeffects are unbiased only under the assumption of no school selection accordingto current family background.15 This additional assumption is not too strong ifthe choice of the specific school has been made in the past, as it happens in thecase of Italy where upper secondary schooling starts at age 14, according to per-sistent family characteristics which are well proxied by Bit – 1. However, as dis-cussed in the Appendix, when changes of school occur within the sample period(as in the case of Valle d’Aosta for a significant share of students – see also Table5) VA estimates must be taken with caution, because they are likely to be biased.16
T Tijt ijt j ijt ijt= + + + −( )− −1 1 1α τ ε ε
T T B Bijt ijt it j it ijt ijt= + − + + + −( )⎡⎣− − −1 1 2 1 2 1α α τ α ε ε ⎤⎤⎦
M. BRATTI - D. CHECCHI Re-Testing PISA Students One Year Later. On School Value ...
13
15 The inclusion of past performance in (7) will partly account for this selection if family back-ground is serially correlated. A comparison between the estimates of (6) and (7) can also suggestwhether the assumption ΔB = 0 is credible, as in this case equations (6) and (7) should givevery close estimates of the school fixed effects τj.
16 The direction of the bias is in principle undetermined, unless one is able to model the processof school/track change of the students. Table 5 suggests that most of the school mobility is adownward mobility (i.e. towards less demanding tracks, as vocational tracks in Valle d’Aostaare characterised by lower performance, not so in the case of Trento – see Table 1). If this isthe prevailing flow, we expect a positive bias in the estimated VA for Valle d’Aosta; see thediscussion in the Appendix.
Checchi imp_Layout 1 27/11/17 17:43 Pagina 13

In this context, sudden changes in family background, unless very extreme (e.g.,parental death), are rather unlikely to push individuals to change school or dropout. Summarizing, under equation (7) being the true data generating process foreducational performance, we can get unbiased estimates for the school VA’s aslong as we can exclude: a) measurement errors in measures of students’ past per-formance; b) variations in current family background; and c) student self-selectioninto the different schools according to unobservable characteristics. Owing to thecharacteristics of our data, these will be our maintained assumptions throughoutthe rest of the paper.
5. - School Value Added Estimation
In this section, we report the estimates of school VAs obtained from EPF es-timation for Trento and Valle d’Aosta. Given the limited number of students perschool, we are forced to assume that the contribution given by school j to its stu-dents’ literacy levels (the VA) is the same for all students, i.e. the school has an“intercept effect” only.17 Table 7 shows the results for Trento. All regressions areestimated on the panel component so as to isolate the effect of using differentspecifications of the EPF from potential differences in the composition of thesamples.18 In column (1) we have reported a simple specification which does notinclude school fixed effects (SFE, hereafter), using the test scores in 2009 as thedependent variable. The age and grade of the student turn out to be positivelyassociated with performance in the PISA test. The same happens for cultural cap-ital (the number of books at home), and the family socio-economic index(HISEI). Having attended kindergarten and being a first-generation immigrantare marginally significant, with a positive and a negative sign, respectively. In col-umn (2) we include SFE: the inclusion of SFE generally has the effect of reducingthe coefficients’ magnitude of the significant regressors, suggesting that self-se-lection of schools and/or students is taking place (see the Appendix). Culturalcapital, HISEI and first-generation immigrants all reduce in size. Column (3) es-
Rivista di Politica Economica ottobre/dicembre 2016
14
17 This assumption could be relaxed by including interaction terms between the school indicatorsand student characteristics but this is feasible only when a large number of students are sampledfor each school.
18 We should keep in mind that unless we adopt random effect models, we are forced to chooseone excluded school, which then represents the benchmark case against which we comparethe relative effectiveness of the remaining schools. In the present analysis, we have left out thefinal school (that with the highest code), which in both regions is a regional vocational school.
Checchi imp_Layout 1 27/11/17 17:43 Pagina 14

M. BRATTI - D. CHECCHI Re-Testing PISA Students One Year Later. On School Value ...
15
timates the same model of column (1) but using the 2010 test score as the de-pendent variable. The results in column (1) and (3) are qualitatively and quanti-tatively very similar. The same is observed when comparing column (2) andcolumn (4), which both include SFE. The coefficients on grade, cultural capitaland first-generation migrants tend to be slightly lower in 2010.
Columns (1) to (4) estimate performance in levels, while column (5) specifiesa “value added model”, including the test score in 2009 as an additional regressorfor the test score in 2010. Notably, the only significant regressors turn out to bepast test performance and first generation immigrant status. The coefficient onthe past test score is 0.304 (column (7) controlling for self-selection), well belowthe coefficient of one predicted from the model outlined in Section 4. As we men-tioned earlier, this may be partly due to measurement error and the fact that testscores are likely to contain some noise, and not to perfectly measure true literacy.In column (6) we have included only past performance among the regressors.Under the assumption that changes in student characteristics in two adjacentyears are almost null, we should expect very similar estimates of the SFE fromthe models (5) and (6). Indeed, the coefficients on past scores in the two columnsare not statistically different.
Below Table 7 we have reported the correlation and the rank correlation be-tween the estimates of the SFE obtained with various models. We focus on therank correlation because ranking schools is often in the interest of educationalpolicy makers. First, when using specifications in levels, the rankings of SFE in2009 and 2010 are highly correlated (0.88). When switching to a longitudinalvalue added model, the rank correlation is much more similar with respect to thespecification in levels in 2010 than in 2009 (0.81 vs. 0.98), but is in both casesvery high. All in all, these estimates suggest that if one focuses on the panel com-ponent of the dataset, that is on the students which participated in the two testingexercises, and there are no significant alterations of the student body attributableto drop-out or school changes, the specific model used to estimate SFE does notmake a huge difference for the estimation of schools’ VA. However, estimates ofthe school VA may be influenced by the student self-selection in the 2010 re-test. For this reason in column (7) we have reported the results of the estimatescontrolling for the propensity score, i.e. the probability of having participated inboth tests,19 and also the rank correlation with the SFE estimated with suchmodel. As shown by column (7) of Table 7 the propensity score (PS, hereafter)
19 For the specification of the PS we used the model in column (3) of Table A1.
Checchi imp_Layout 1 27/11/17 17:43 Pagina 15
is not statistically significant, suggesting that the inclusion of past performanceis sufficient to control for the potential self-selection of students according to past(or prospective) performance. Consistently, the rank correlation of the SFE ofmodel (5) and (7) is almost one. Our analysis suggests therefore that in the ab-sence of track changes or selective drop-out (like it was the case for Trento) con-trolling for past performance is likely to address all ability-related potentialestimation bias generated by panel attrition.20
When we repeat the exercise in the case of Valle d’Aosta (see Table 8) we finda similar attenuation of the coefficients on individual characteristics when SFEare included (columns (2) and (4)), confirming that students are (at least partially)sorted in schools according to individual characteristics. When we use past per-formance as a control (column (5)) we observe a much higher first order autore-gressive, i.e. AR(1), coefficient than what we obtain in the case of Trento (0.63vs. 0.30)21 while many individual characteristics still retain statistical significance(gender, modal grade, parental education, availability of books and immigrationstatus). Controlling for self-selection into the panel sample (column (7)) does notchange the results much, also given the absence of reliable exclusion restrictions.Eventually, when we restrict to the reduced form represented by equation (6) (seecolumn (6)), while controlling for the test language, we find that the AR(1) co-efficient is still significantly different from one (test F = 45.11 (0.00)) but muchhigher in magnitude than for Trento. When we move to the rank correlationamong the estimated measures of school VAs, we observe that single year cross-sectional measures are not even correlated; the correlation increases when we con-
Rivista di Politica Economica ottobre/dicembre 2016
16
20 Yet we are unable to fully account for unobservable components related to students’ ability inmeasuring schools’ contribution to student test scores. If we net out these components by tak-ing first differences in test scores as our dependent variable (model VAM1 in ROTHSTEIN J.,2010) and we estimate school fixed effects, we find limited correlation with previous measuresof VAs (see the final row of the correlation matrix in Table 7). Visual inspection of this alter-native measures of SFE suggests that in the case of Trento school rankings are rather differentwhen we consider single-year measures obtained from cross-sectional data, but when we usepast performance as an additional control the problem of self-selection is minimised. However,if can get rid of student time-invariant unobservable characteristics through the use of firstdifferences in students’ scores, school rankings appear quite different. But the use of individualfirst differences imposes the restriction of a unitary coefficient for Tijt-1, which is clearly rejectedin our data (see Table 7). This explains the low correlation between the SFE computed underthis strategy and the ones previousely estimated.
21 The difference between the two provinces disappears when we replace individual data withschool averages: 0.99 (s.e. 0.13) for Valle d’Aosta against 0.93 (s.e. 0.06) for Trento, but theseestimates are computed only over 22 and 35 observations, respectively.
Checchi imp_Layout 1 27/11/17 17:43 Pagina 16

sider longitudinal measures, but it does not reach the high value obtained in thecase of Trento.22
6. - A Suggested Interpretation
In this section, we propose a potential reading of our results, and in particularof the differences found between the estimates using the two re-tests. The maindifferences are summarised in Table 9. First, the correlation between the cross-sectional measures of school VAs in 2009 and 2010 is very high in Trento (0.92)while it is almost zero in Valle d’Aosta (-0.02). Second, the coefficient on pasttest score is small in Trento (ranging between 0.26 and 0.30 - see Table 7) andmuch larger in Valle d’Aosta (between 0.63 and 0.78 - see Table 8).
In what follows we propose a possible interpretation of these two empirical factsbased on differential school selectivity in the two provinces. Here, selectivity must beinterpreted as dynamic selectivity, which is the change in the student body recordedover time in a specific school. Schools may be rather effective in inducing studentsto switch schools or drop-out by means of bad marks, retention and di-sciplinarymeasures; but they may also be quite effective in contrasting these changes in orderto retain students, using remedial courses, guidance and/or financial support. Wedefine selective schools those recording a high number of school switchers or drop-outs.23 We intend to show that different degrees of selectivity may produce the con-trasting evidence recorded in the two regions (highlighted in Table 9).
Let us suppose that student competence in school j at time t (the PISA testscore in our case) is an increasing function of past year’s performance, individualability, peer group’s average ability and the degree of homogeneity in (abilitiesof) the peer group:
(8) T T a aijt ijt i jt jt
SFE
ijt
jt
= + + ⋅ − +−12α βσ ε
M. BRATTI - D. CHECCHI Re-Testing PISA Students One Year Later. On School Value ...
17
22 What is more surprising is the higher correlation between the rankings obtained with andwithout controlling for individual student fixed effects in Valle d’Aosta (last row of the corre-lation matrix in Table 8): while in the case of Trento the rank correlation between longitudinalSFE measures with and without controls for unobservables was low, in the case of Valle d’Aostait exceeds 0.7, suggesting that in the latter case these student components do not play any role.
23 This is different from high selectivy at entry in terms of student ability, which may producethe opposite result (i.e. low drop-out and school changes).
Checchi imp_Layout 1 27/11/17 17:43 Pagina 17

Rivista di Politica Economica ottobre/dicembre 2016
18
where Tijt stands for the PISA score of individual i in school j at time t, ai is herlevel of (unobservable) ability (time-invariant by assumption), –ajt = a–it is the av-erage ability of her peers, σ 2
jt is the peer group’s variance in ability and εijt anidyonsincratic error terms. Individual performance is assumed to depend posi-tively on an individual’s past performance and ability, on the average level of abil-ity of her peers, while it is negatively affected by school heterogeneity. The lattercan be motivated by the difficulties of teaching to individuals with different levelsof ability (i.e., a “teaching quality” effect) or by class disruptive behaviour à laLazear (2001).24 Due to non-observability of abilities, the third and fourth ad-dends in equation (8) jointly determine the SFE for school j at time t. In ouranalysis we are not able to disentangle the separate effects of the peer group andpeer heterogeneity, which are both subsumed by the SFE. Given this simple set-ting, we may wonder what would be the effect of school VA estimation of havingtwo educational systems (of the two different provinces) with different degrees ofselectivity.25 A high dynamic selectivity of the province’s school system means thatas time goes by, the school intake in terms of peer group’s quality will tend tochange. In equation (8) we face two effects. First, in the high-selectivity systemthe estimates of school VA in two adjacent years, t and t + 1, are likely to be lesscorrelated than in the low-selectivity system, where average ability and its variancetend to be more persistent overtime. This effect can be particularly sizable in thefirst years of upper secondary schooling that also are the most selective, and inwhich the two PISA tests were administered (second and third years of upper sec-ondary education, corresponding to grade 10 and 11, respectively). This is con-sistent with the first empirical fact that cross-sectional measures of school VAsshow a higher correlation in Trento than in Valle d’Aosta. This however alsoposes some methodological issues, as cross-sectional measures of VAs for the same
24 An additional justification for the inclusion of the variance among peers with a negative effectcan be obtained by the existence of strong complementarities in individual abilities in the EPF(BENABOU R., 1996a and 1996b). In the limiting case where the elasticity of substitution goesto zero, the educational production function takes the form
and the individual performance happens to be constrained by the lowest of peers’ ability.25 We have shown in the Appendix that in the case of Trento the rate of student (panel) attrition
in the schools which did participate in the 2010 re-test is around 20% (18.8%), but only about8% are school drop-outs or school switchers. In the case of Valle d’Aosta, the incidence ofschool drop-out and school switchers is more than double (22% - see Table 5).
T a n a a aijt i i i i= + −( )⎡⎣ ⎤⎦ ⎯ →⎯⎯ [ ]− →∞ −σ σ σ
σ1
1
min ,
Checchi imp_Layout 1 27/11/17 17:43 Pagina 18
M. BRATTI - D. CHECCHI Re-Testing PISA Students One Year Later. On School Value ...
19
school can be very volatile from year to year, and moreover do not “penalize”schools for the potentially high number of drop-outs or school switchers. Actually,the SFE in (8) could increase overtime if a school exercises cream-skimmingamong its student body (corresponding to an overestimate of VA due to studentsorting-out of the schools).
Let us recall that according to equation (8) individual past performance Tijt–1can be expressed as
(9)
Then in less selective school environments both the average level of peergroup’s ability and its variability will be highly correlated over-time. This meansthat in those environments lagged performance will be more correlated with thecurrent school VA (the SFE), resulting in a lower AR(1) coefficient in the econo-metric specifications that controls for SFE. This is consistent with the evidenceof a lower AR(1) coefficient in Trento than in Valle d’Aosta, i.e., the second em-pirical fact that we observed.
The same argument could also explain why in the case of Trento we do notfind any statistically significant association between family background charac-teristics and student performance after controlling for SFE (see column (5) inTable 7), while some student characteristics turn out significantly affecting theperformance in the case of Valle d’Aosta.
A possible reason for the high selectivity of the school system in Valle d’Aostais that students are initially more mismatched to schools, e.g., they often choseschools which are not aligned with their aspirations and levels of ability. This maystem, for instance, from better school guidance in Trento than in Valle d’Aosta.Better matches between students and schools imply similar family backgroundcharacteristics across students, i.e. a more homogeneous school intake that is cap-tured by the SFE. In schools where students are more mismatched and have moreheterogeneous background characteristics, the SFE will not be a good proxy ofpeer characteristics, some of which may turn out to be significantly associated withschool performance. Indeed, in the case of Trento we observe that individual pastperformance captures almost all relevant information at the individual level (seecolumns (5) or (7) in Table 7), and SFE are highly correlated across years (rankcorrelation of cross-sectional estimates is 0.88 – see bottom line of the correlation
T f a aijt i jt jt− − −= ( )1 1 12, , .σ
Checchi imp_Layout 1 27/11/17 17:43 Pagina 19

Rivista di Politica Economica ottobre/dicembre 2016
20
matrix associated to Table 7). A quite different situation emerges in the Valled’Aosta’s re-test. In this case including past performance does not eliminate thestatistical significance of other individual characteristics (see column (5) in Table8 – these effects are attenuated when we account for potential self-selection intothe sample, as done in column (7) of the same table) and SFE are less correlatedacross survey years (correlation is null or even negative).
Despite the limited degrees of freedom, we can estimate an AR(1) coefficientfor the panel component of students in each school. By restricting the set of re-gressors to gender, age, grade attended and a proxy for family background (num-ber of books available at home), we estimated an AR(1) coefficient for eachschool, and plotted it against a measure of school (social) heterogeneity, namelythe standard deviation of the prestige associated with parental occupations of theenrolled students. These scatter-plots are shown in Figures 2 and 3 which suggesta greater variation for the AR(1) coefficients in the case of Trento (Figure 2) com-pared to the case of Valle d’Aosta (Figure 3). In both regions we find a weak butpositive correlation between social heterogeneity and persistence in individualtest scores: when the social environment is more homogeneous, past performancein learning has a lower correlation with current performance, while on the con-trary it increases in more heterogeneous environments.
Our suggested interpretation finds additional support in Table 10, which hi-ghlights the differences between cross-sectional and longitudinal estimates of gra-dients of individual family backgrounds and school tracks. In the table only somecoefficients are shown, but the estimated models are fully equivalent to those pre-sented in Tables 7 and 8 (except the fact that SFE are replaced by school trackfixed effects). In columns (1), (2) and (3) we present the results referring to thepanel component of the Trento re-test: the first two columns refer to cross-sec-tional estimates, while the third one exploits the longitudinal dimension by in-cluding past performance as an additional regressor. Columns (4), (5) and (6)replicate the same exercise for Valle d’Aosta; in order to account for possible di-stortions induced by different test languages, columns (7) and (8) restrict the ana-lysis to the subsample of students who took the test in Italian. We notice thatthe introduction of past test performance as an additional regressor generally re-duces the correlation between a student’s literacy level and her characteristics,but this reduction is more pronounced in the case of Valle d’Aosta, in whichschools have a more heterogeneous student body. With our data we are unableto ascertain whether curricular differences, teaching quality and/or contextual ef-fects (e.g., peer groups) drive these effects, as well as whether there is any role for
Checchi imp_Layout 1 27/11/17 17:43 Pagina 20
individual effort. More detailed information would indeed be needed to discri-minate further among these alternative explanations.
7. - Concluding Remarks
What can be learned from the two PISA re-tests described in this paper? Firstof all, we have shown that cross-sectional measures of school value added (i.e.those obtained by educational production functions not controlling for past testscores) face remarkable problems of non-random attrition. In educational settingscharacterized by high student attrition, this could lead to very volatile measuresof VAs which are difficult to interpret by both the public and policy makers. Inthe case of Valle d’Aosta, for instance, we have shown that the correlation betweenthe estimated school VA in 2009 and 2010 is close to zero.
We have then contrasted the cross-sectional measures with longitudinal meas-ures of school VAs. Here we face two main issues: first, in settings characterizedby low student attrition (drop-out or school switchers), longitudinal and cross-sectional measures of school VA turn out to be very correlated; by contrast, thecorrelation between the two measures is much lower when student attrition ishigh. Second, notwithstanding the problem of potential non-random student at-trition, we show that longitudinal models, controlling for past test scores, lead toschool VAs estimates that are less sensitive to sample selection. This holds truein both high and low attrition settings, and points to the importance of testingthe same cohort of students over time to build robust measures of school VAs.
Another finding in our analysis is that the persistence in test scores (the firstorder autoregressive coefficient) estimated in longitudinal models of school VAis higher in high attrition educational settings. We propose a rationalization ofthis evidence based on a simple conceptual framework where individual compe-tences depends on past performance, own ability and abilities of the peer group,along with the variance of these abilities in the peer group. Intuitively, more se-lective systems, i.e. systems in which there is a high number of drop outs or schoolswitchers, may be those in which individuals were initially mismatched with re-spect to the schools they enrolled in. This will be reflected in a higher hetero-geneity in the school intake, both at a given point in time and overtime, especiallyin the initial grades of a school cycle (e.g., in the case of the PISA tests analysedin this paper students were sampled in the second and third year of upper sec-ondary education). If this is the case, the school fixed effects are very poor proxies
M. BRATTI - D. CHECCHI Re-Testing PISA Students One Year Later. On School Value ...
21
Checchi imp_Layout 1 27/11/17 17:43 Pagina 21

of (i.e., less correlated with) students’ characteristics, including past performance,inducing a higher persistence in test scores (i.e., a higher first autoregressive co-efficient). Moreover, a higher school mismatch also entails a peer group whichchanges overtime both in average ability and in its variance. As peer group’s effectsenter the estimate of the school VA (school fixed effects) this also implies a highervariability in cross-sectional measures of school VAs overtime in more selectiveschooling environments.
Thus our main policy recommendation is that VAs measures should be takenwith caution in school settings where high selectivity takes place. Although thismay be quite obvious in the case of curricular competences, we show that this isalso the case when a measure of knowledge which should be less sensitive to schoolinputs, like that provided by PISA, is used. While in compulsory education incomprehensive schools one may accept the underlying assumption of studentsbeing randomly allocated to schools and teachers (despite residential segregationmay work against such an assumption), in non-compulsory schooling in trackedsecondary school systems, school switching and dropping-out represent an oftenunsurmountable obstacle for using student tests to evaluate schools performance.Repeated testing of students may represent a partial way out of the problem, aslong as student attrition is not excessive.
The main limitation of our study is the reliance on single case studies, withoutthe possibility to check whether our suggested interpretation holds for a largervariety of situations (including other geographical contexts, and/or other schoolgrades). In the recent years the National Agency for the Evaluation of the SchoolSystem (INVALSI) has developed a procedure to link student test scores over dif-ferent grades (grade 2, 5, 8 and 10), which in principle makes our exercise replic-able on a wider scale. However, looking at aggregate school leaving rates, schoolselectivity takes place between grade 8 and grade 11, where only one test measureis available. Thus ad-hoc experiments remain necessary if one aims to deepen theissue of secondary school assessment.
Rivista di Politica Economica ottobre/dicembre 2016
22
Checchi imp_Layout 1 27/11/17 17:43 Pagina 22

M. BRATTI - D. CHECCHI Re-Testing PISA Students One Year Later. On School Value ...
23
TABLE 1
DESCRIPTIVE STATISTICS, BY MACRO-REGIONS AND TYPE OF SCHOOL ATTENDED - ITALY PISA 2009
Literacy (mean, standard deviation and number of observations) macroregion high technical state regional Total
school school vocational vocationalTrento 563.69 510.60 472.73 414.57 507.5
62.69 61.77 70.35 71.98 86.49575 425 136 311 1,447
Valle d’Aosta 560.37 513.58 464.01 424.71 517.1165.33 61.37 71.78 55.63 81.34
432 121 283 35 871other North 562.38 508.98 459.41 414.16 507.27Eastern regions 63.38 62.61 78.08 75.55 85.97
2,019 1,558 947 737 5,261other North 562.28 503.58 435.11 401.96 512.36Western regions 64.35 67.95 82.89 73.58 88.19
2,031 1,343 824 235 4,433Central and 532.80 457.98 399.31 365.60 480.19Southern regions 66.70 72.69 75.35 67.55 88.85
8,819 5,934 3,796 219 18,768Italy 543.56 476.08 418.47 405.70 491.78
67.19 73.77 81.02 74.91 89.1613,876 9,381 5,986 1,537 30,780
Numeracy (mean, standard deviation and number of observations)macroregion high technical state regional Total
school school vocational vocationalTrento 549.36 534.21 475.66 443.81 515.3
71.03 60.46 72.29 63.30 78.96575 425 136 311 1,447
Valle d’Aosta 533.45 531.49 462.04 409.9 505.0177.59 66.75 68.47 49.66 81.71
432 121 283 35 871other North Eastern 552.99 529.96 464.09 445.45 515.10regions 68.99 64.83 70.53 70.02 80.10
2,019 1,558 947 737 5,261other North 546.68 511.93 438.01 412.36 508.83Western regions 71.07 65.34 74.46 72.00 83.63
2,031 1,343 824 235 4,433Central and 511.04 473.18 407.06 382.87 476.54Southern regions 75.04 74.77 71.35 63.56 84.44
8,819 5,934 3,796 219 18,768Italy 524.65 491.67 424.50 430.33 490.41
75.75 75.42 75.55 71.43 85.0813,876 9,381 5,986 1,537 30,780
Source: Our computations on OECD-PISA 2009 data, Italian sample.
Checchi imp_Layout 1 27/11/17 17:43 Pagina 23
Rivista di Politica Economica ottobre/dicembre 2016
24
TABLE 2
VARIANCE EXPLAINED BY SCHOOL TYPES – ITALY PISA 2009
reading numeracyvariance explained variance explained variance explained variance explained
by school track by school fixed by school track by school fixed fixed effect (R²) effect (R²) fixed effect (R²) effect (R²)
Trento 0.43 0.55 0.29 0.49Valle d’Aosta 0.33 0.50 0.22 0.48Rest of North East 0.38 0.54 0.27 0.50Rest of North West 0.37 0.57 0.30 0.51Centre and South 0.37 0.57 0.23 0.52Italy 0.34 0.58 0.21 0.54
Source: Our computations on OECD-PISA 2009 data, Italian sample.
TABLE 3
FAMILY BACKGROUND BY SCHOOL TYPE: MEANS OF HIGHEST OCCUPATIONALPRESTIGE, HIGHEST YEARS OF PARENTAL EDUCATION AND ESCS
(PISA index of economic, social and cultural status) – Italy PISA 2009
macro region high technical state regional Totalschool school vocational vocational
Trento 51.10 43.83 44.30 37.12 45.3913.99 13.01 13.64 12.28 13.310.20 -0.22 -0.12 -0.61 -0.13
Valle d’Aosta 52.95 45.02 41.94 40.66 47.8113.86 12.7 12.23 11.2 13.070.21 -0.23 -0.46 -0.73 -0.11
Rest of North East 53.92 45.25 43.33 38.42 47.3314.14 12.71 12.51 12.23 13.160.33 -0.22 -0.36 -0.59 -0.08
Rest of North West 55.96 45.42 41.96 36.42 49.1814.39 12.88 12.42 11.58 13.420.43 -0.18 -0.47 -0.79 0.01
Centre and South 52.55 42.66 38.65 35.77 46.4813.86 12.32 11.72 11.29 12.920.28 -0.34 -0.65 -0.87 -0.12
Italy 53.20 43.58 40.15 37.53 47.0013.98 12.5 12.01 11.98 13.050.30 -0.29 -0.56 -0.67 -0.09
Source: Our computations on OECD-PISA 2009 data, Italian sample.
Checchi imp_Layout 1 27/11/17 17:43 Pagina 24

M. BRATTI - D. CHECCHI Re-Testing PISA Students One Year Later. On School Value ...
25
TABLE 4
SCHEME FOR BOOKLET ROTATION IN THE PISA 2010 RE-TEST
Bookid Pisa 2009 Bookid Re-test 2010
1 M1 R1 R3 M3 7 R6 M3 S3 R42 R1 S1 R4 R7 3 S1 R3 M2 S33 S1 R3 M2 S3 5 R4 M2 R5 M14 R3 R4 S2 R2 9 M2 S2 R6 R15 R4 M2 R5 M1 11 M3 R7 R2 M26 R5 R6 R7 R3 13 S3 R2 R1 R57 R6 M3 S3 R4 1 M1 R1 R3 M38 R2 M1 S1 R6 2 R1 S1 R4 R79 M2 S2 R6 R1 4 R3 R4 S2 R210 S2 R5 M3 S1 8 R2 M1 S1 R611 M3 R7 R2 M2 10 S2 R5 M3 S112 R7 S3 M1 S2 6 R5 R6 R7 R313 S3 R2 R1 R5 12 R7 S3 M1 S2
Notes: Grey cells correspond to the common sections in both 2009 and 2010 tests. Each booklet section is identifiedby a letter indicating the typology (M for maths, S for sciences and R for reading) and a numeric value.
TABLE 5
PARTICIPATION TO RE-TEST IN 2010 – VALLE D’AOSTA
→ school attended in 2010high technical state regional out of Total % % drop-out
schools school vocational vocational schooling/ drop- +mobilityschool school absent/not out to different
matched schools↓ school attended in 2009
high schools 352 2 24 3 51 432 0.118 0.185technical school 0 100 5 0 16 121 0.132 0.174state vocational school 1 0 222 3 57 283 0.201 0.216regional vocational school 0 0 0 22 13 35 0.371 0.371lower secondary 0 0 2 0 6 8 0.750 1.000
Total 353 102 253 28 143 879 0.163 0.208
Source: Our computations on OECD-PISA 2010 Valle d’Aosta’s retest.
Checchi imp_Layout 1 27/11/17 17:43 Pagina 25

TABLE 6
SAMPLE MEANS OF READING TEST SCORES – STUDENTS REMAINING IN THESAME SCHOOLS – VALLE D’AOSTA
test in Italian test in French2009 test 2010 test 2009 test 2010 test
high school (Licei) 568.14 576.69 569.44 525.78technical schools (Istituti tecnici) 519.74 526.29 525.04 450.81state vocational schools (Istituti professionali statali) 474.70 479.73 474.97 416.74regional vocational schools (Centri formazione professionale regionali) 429.15 367.77 430.16 293.20
Total 527.34 532.35 529.20 473.58
Source: Our computations on OECD-PISA 2010 Valle d’Aosta’s retest data.
TABLE 7
ALTERNATIVE STRATEGIES TO IDENTIFY SCHOOL FIXED EFFECTS(intercepts only) – TRENTO
(1) (2) (3) (4) (5) (6) (7)VARIABLES TN 2009 TN 2009 TN 2010 TN 2010 TN 2009-10 TN 2009-10 TN 0910
panel panel panel panel panel panel panelcomponent component component component component component component
no SFE SFE no SFE SFE SFE SFE SFE with PS
test score in 2009 0.257*** 0.295*** 0.304***(reading) [0.054] [0.055] [0.070]female 4.921 -4.277 5.885 -3.647 -2.547 -1.277
[7.401] [7.570] [7.953] [7.090] [5.944] [5.935]age of student 22.093** 14.365** 20.118* 4.784 1.089 -10.85
[9.676] [6.524] [11.155] [9.230] [8.452] [14.580]grade compared 52.383** 40.467*** 35.144** 15.597* 5.186 18.718to modal grade in country [19.996] [11.325] [14.690] [9.076] [8.883] [12.913]attended kindergarten 30.921* 20.279 23.722* 14.406 9.189 15.087
[16.674] [15.078] [13.080] [13.957] [13.307] [13.874]single parent 8.244 12.706 -1.239 3.4 0.131 -15.23
[9.751] [9.111] [11.480] [11.915] [11.572] [15.678]how many books 18.405*** 8.397*** 15.118*** 3.973* 1.812 4.341at home [2.944] [1.885] [2.403] [2.277] [2.231] [3.720]highest parental -0.99 -2.183* -0.485 -2.039* -1.477 -3.046education in years [1.157] [1.188] [1.072] [1.040] [0.969] [1.896]highest parental 1.086*** 0.334* 0.858* -0.108 -0.194 -0.21occupational status [0.257] [0.195] [0.451] [0.381] [0.366] [0.364]wealth -5.612 -3.898 -7.198 -5.267 -4.265 -6.101
[4.668] [5.180] [6.123] [4.694] [5.152] [4.898]second-generation -10.144 1.262 -9.594 6.928 6.604 -8.415immigrants [14.291] [14.232] [24.709] [29.179] [28.190] [28.485]
continued
26
Rivista di Politica Economica ottobre/dicembre 2016
Checchi imp_Layout 1 27/11/17 17:43 Pagina 26

continued TABLE 7
(1) (2) (3) (4) (5) (6) (7)VARIABLES TN 2009 TN 2009 TN 2010 TN 2010 TN 2009-10 TN 2009-10 TN 0910
panel panel panel panel panel panel panelcomponent component component component component component component
no SFE SFE no SFE SFE SFE SFE SFE with PS
first-generation -41.721* -41.763*** -38.894* -39.041***-28.296** -28.605**immigrants [22.370] [14.770] [19.946] [11.117] [10.725] [10.697]propensity score (PS) -159.94
[146.637]
Observations 753 753 753 753 753 753 753R² 0.289 0.523 0.182 0.472 0.503 0.492 0.503Number of schools 35 35 35 35 35 35 35School FE NO YES NO YES YES YES YES
CORRELATION AMONG SCHOOL FIXED EFFECTS
Model (2) (4) (5) (7) student FE
SFE 2009 (2) 1.000SFE 2010 (4) 0.918 1.000longitudinal SFE 2009-2010 (5) 0.865 0.993 1.000longitudinal SFE 2009-2010 with PS (7) 0.876 0.987 0.989 1.000for comparison:longitudinal SFE 2009-2010 with student FE -0.263 0.117 0.225 0.179 1.000
RANK CORRELATION AMONG SCHOOL FIXED EFFECTS
Model (2) (4) (5) (7) student FESFE 2009 (2) 1.000SFE 2010 (4) 0.887 1.000longitudinal SFE 2009-2010 (5) 0.809 0.975 1.000longitudinal SFE 2009-2010 with PS (7) 0.818 0.963 0.974 1.000for comparison:longitudinal SFE 2009-2010 with student FE -0.347 0.020 0.162 0.116 1.000
Source: Our estimates on OECD-PISA 2010 Trento’s retest data.Note: Robust standard errors in brackets clustered at school level: * significant at 10%; ** significant at 5%; ***significant at 1%. Weight = student weights.
M. BRATTI - D. CHECCHI Re-Testing PISA Students One Year Later. On School Value ...
27
Checchi imp_Layout 1 27/11/17 17:43 Pagina 27

TABLE 8
ALTERNATIVE STRATEGIES TO IDENTIFY SCHOOL FIXED EFFECTS(intercepts only) – VALLE D’AOSTA
(1) (2) (3) (4) (5) (6) (7)VARIABLES AO 2009 AO 2009 AO 2010 AO 2010 AO 0910 AO 0910 AO 0910
panel panel panel panel panel panel panelcomponent component component component component component component
no SFE SFE no SFE SFE SFE SFE SFE with PS
test score in 2009 0.688*** 0.778*** 0.629***(reading) [0.036] [0.033] [0.100]female 9.012 9.627** 19.890*** 22.483*** 15.866** 13.731*
[6.367] [4.621] [6.457] [6.106] [5.772] [6.886]age of student 22.560*** 10.341 20.753** 5.979 -1.135 2.2
[7.006] [7.120] [9.532] [9.671] [8.023] [8.235]grade compared to 62.584***36.364*** 67.029*** 40.027*** 15.015** 4.007modal grade in country [8.682] [4.931] [11.685] [7.176] [5.775] [17.298]attended kindergarten 60.945** 32.750* 68.407*** 33.681* 11.18 -6.884
[22.830] [17.535] [20.202] [18.998] [18.931] [28.633]single parent -8.442 -2.893 -11.151 -8.323 -6.313 -6.306
[8.908] [5.760] [10.574] [7.564] [4.896] [4.858]how many books 13.821***10.260*** 14.724*** 10.914*** 3.853** 4.302**at home [2.639] [2.251] [2.714] [1.880] [1.662] [1.950]highest parental 0.958 -0.493 3.334** 1.697* 2.035** 1.489education in years [1.018] [0.762] [1.285] [0.959] [0.748] [1.249]highest parental 0.679** -0.011 0.49 -0.209 -0.201 -0.115occupational status [0.292] [0.193] [0.363] [0.258] [0.166] [0.203]wealth -9.531 -3.34 -6.223 -1.412 0.889 0.872
[6.044] [2.438] [5.871] [2.462] [2.617] [2.638]second-generation 5.573 -9.68 75.713** 55.108** 61.662*** 60.760***immigrants [45.060] [36.019] [31.018] [23.113] [21.253] [21.283]first-generation -32.731**-38.683*** -46.851** -51.842***-25.236** -24.708*immigrants [15.600] [13.423] [16.580] [12.393] [11.833] [12.028]test conducted -60.519***-62.690***-62.483***-61.604***-62.352***in French [5.939] [4.874] [3.763] [3.501] [3.731]propensity score (PS) 70.012
[101.390]Observations 663 663 663 663 663 663 663R² 0.345 0.62 0.38 0.625 0.741 0.721 0.741Number of schools 22 22 22 22 22 22 22School FE NO YES NO YES YES YES YES
Source: Our estimates on OECD-PISA 2010 Valle d’Aosta’s retest data.Note: Robust standard errors in brackets clustered at school level - * significant at 10%; ** significant at 5%; ***significant at 1%. Weight = student weights.
Rivista di Politica Economica ottobre/dicembre 2016
28
Checchi imp_Layout 1 27/11/17 17:43 Pagina 28

continued TABLE 8
CORRELATION AMONG SCHOOL FIXED EFFECTS
Model (2) (4) (5) (7) student FE
SFE 2009 (2) 1SFE 2010 (4) -0.0192 1longitudinal SFE 2009-2010 (5) 0.189 0.8494 1longitudinal SFE 2009-2010 with PS (7) 0.1862 0.8558 0.9962 1for comparison:longitudinal SFE 2009-2010 with student FE 0.3086 0.5808 0.9171 0.9101 1
RANK CORRELATION AMONG SCHOOL FIXED EFFECTS
Model (2) (4) (5) (7) student FE
SFE 2009 (2) 1SFE 2010 (4) -0.1338 1longitudinal SFE 2009-2010 (5) 0.1022 0.7222 1longitudinal SFE 2009-2010 with PS (7) 0.0864 0.773 0.9898 1for comparison:longitudinal SFE 2009-2010 with student FE 0.3461 0.2332 0.7538 0.7154 1
Source: Our estimates on OECD-PISA 2010 Valle d’Aosta’s retest data.
TABLE 9
MAIN DIFFERENCES BETWEEN TRENTO AND VALLE D’AOSTA PISA 2010 RE-TESTS
Empirical “facts” Trento Valled’Aosta
Correlation between 2009 and 2010 cross-sectional school VAs High LowCoefficient on lagged performance in the longitudinal model of school VA Low High
M. BRATTI - D. CHECCHI Re-Testing PISA Students One Year Later. On School Value ...
29
Checchi imp_Layout 1 27/11/17 17:43 Pagina 29

Rivista di Politica Economica ottobre/dicembre 2016
30
TAB
LE10
ALT
ERN
ATIV
E M
EASU
RES
OF
FAM
ILY
BAC
KG
RO
UN
D A
ND
SC
HO
OL
TYP
E G
RAD
IEN
TS
(1)
(2)
(3)
(4)
(5)
(6)
(7)
(8)
(9)
(10)
(11)
Tre
nto
Val
le d
’Aos
taV
alle
d’A
osta
(onl
y It
alia
n)TN
2009
TN 20
10TN
201
0Δ
coeff
AO 20
09AO
2010
AO 20
10Δ
coeff
AO 20
10AO
2010
Δco
effpa
nel
pane
lpa
nel
pane
lpa
nel
pane
lpa
nel
pane
lco
mpon
ent
comp
onen
tco
mpon
ent
comp
onen
tco
mpon
ent
comp
onen
tco
mpon
ent
comp
onen
tcro
ss-sec
tcro
ss-sec
tlon
gitud
inal
cross-
sect
cross-
sect
longit
udina
lno
Fren
chno
Fren
chcro
ss-sec
tlon
gitud
inal
test
scor
e in
200
9 0.
348
0.70
20.
649
(rea
ding
)[0
.049
]**
[0.0
33]*
*[0
.035
]**
grad
e at
tend
ed
41.1
7424
.686
10.3
62-5
8.0%
48.9
9850
.21
15.7
88-6
8.6%
50.8
9515
.711
-69.
1%(c
ompa
red
to
[13.
587]
**[9
.573
]*[7
.668
][5
.569
]**
[7.7
82]*
*[5
.721
]*[7
.149
]**
[7.0
52]*
mod
al g
rade
)ho
w m
any
book
s 11
.631
7.79
53.
749
-51.
9%12
.505
13.3
014.
533
-65.
9%14
.691
5.19
7-6
4.6%
at h
ome
[2.1
86]*
*[2
.283
]**
[2.1
99]
[2.2
96]*
*[2
.042
]**
[1.7
52]*
[3.0
22]*
*[2
.584
]hi
ghes
t par
enta
l -1
.748
-1.4
41-0
.832
-42.
3%-0
.348
1.73
91.
987
14.3
%2.
932
3.26
111
.2%
educ
atio
n in
yea
rs[1
.158
][1
.073
][0
.977
][0
.781
][1
.017
][0
.758
]*[0
.903
]**
[0.5
60]*
*fir
st-ge
nera
tion
-42.
234
-36.
927
-22.
234
-39.
8%-3
6.56
9-5
2.03
8-2
6.34
2-4
9.4%
-34.
888
-29.
192
-16.
3%im
mig
rant
s[1
6.58
4]*
[13.
280]
**[1
0.90
1]*
[14.
776]
*[1
3.60
8]**
[12.
438]
*[1
7.77
5][1
7.52
7]ac
adem
ic o
rient
ed
116.
732
135.
415
94.8
06-3
0.0%
117.
687
197.
632
114.
962
-41.
8%18
9.96
510
7.8
-43.
3%sc
hool
s (Li
cei)
[15.
760]
**[1
4.40
9]**
[14.
382]
**[1
3.33
0]**
[23.
276]
**[2
2.93
1]**
[29.
399]
**[2
8.72
8]**
tech
nica
l sch
ools
70.6
9182
.227
57.6
35-2
9.9%
89.4
1915
7.31
994
.511
-39.
9%16
6.58
310
7.14
5-3
5.7%
(Isti
tuti
tecn
ici)
[14.
461]
**[1
3.10
3]**
[10.
774]
**[1
2.61
0]**
[22.
073]
**[2
3.43
5]**
[29.
329]
**[2
8.71
2]**
state
voc
atio
nal
32.5
0962
.738
51.4
29-1
8.0%
44.9
7511
9.68
388
.084
-26.
4%11
8.57
785
.512
-27.
9%sc
hool
s (Ist
ituti
[18.
399]
[18.
977]
**[1
3.83
2]**
[16.
281]
*[2
3.68
7]**
[22.
754]
**[3
0.81
3]**
[28.
023]
**pr
ofess
iona
li sta
tali)
Fren
ch-6
1.00
9-6
1.74
[4.8
24]*
*[3
.764
]**
Obs
erva
tions
753
753
753
663
663
663
328
328
R²0.
450.
380.
450.
520.
570.
720.
530.
69
Sour
ce: O
ur e
stim
ates
on
OEC
D-P
ISA
2010
Tre
nto’
s and
Val
le d
’Aos
ta’s
rete
st da
ta.
Not
e: ro
bust
stand
ard
erro
rs in
bra
cket
s clu
stere
d at
scho
ol le
vel -
wei
ght=
stude
nt w
eigh
ts - *
sign
ifica
nt at
5%
; ** s
igni
fican
t at 1
%. R
egre
ssor
s inc
lude
gen
der,
age,
kin
der-
gart
en a
ttend
ed, s
ingl
e pa
rent
, par
enta
l occ
upat
ion,
pro
xy fo
r fam
ily w
ealth
, sec
ond
gene
ratio
n im
mig
rant
s.
Checchi imp_Layout 1 27/11/17 17:43 Pagina 30

FIGURE 1
LOCATION OF THE RELEVANT PROVINCES
Source: Our elaboration.
M. BRATTI - D. CHECCHI Re-Testing PISA Students One Year Later. On School Value ...
31
Valle d'Aosta (left) and Trento (right)
Checchi imp_Layout 1 27/11/17 17:43 Pagina 31

FIGURE 2
SOCIAL HOMOGENEITY AND PERSISTENCE - TRENTO
Source: Our elaboration on OECD-PISA 2010 Trento’s retest data.
FIGURE 3
SOCIAL HOMOGENEITY AND PERSISTENCE - VALLE D’AOSTA
Source: Our elaboration on OECD-PISA 2010 Valle d’Aosta’s retest data.
Rivista di Politica Economica ottobre/dicembre 2016
32
810
1214
1618
-1 -.5 0 .5 1 1.5AR(1) coefficient in PISA reading 2009-10
st. dev. parental occupational prestige Fitted valuesRegressors for AR(1) include gender, age, grade attended and books available - dot size proportional to 1/s.e.
Social homogeneity and persistence in competence formation - Trento
05
1015
20
-.5 0 .5 1 1.5AR(1) coefficient in PISA reading 2009-10
st. dev. parental occupational prestige Fitted valuesRegressors for AR(1) include gender, age, grade attended and books available - dot size proportional to 1/s.e.
Social homogeneity and persistence in competence formation - Aosta
Checchi imp_Layout 1 27/11/17 17:43 Pagina 32

APPENDIX
A. Potential Sample Selection Biases
The two re-tests conducted in Trento and Valle d’Aosta are potentially affectedby sample selection biases. The bias is likely to be more severe in Trento, as par-ticipation to the 2010 re-test took place on a voluntary basis, than in Valled’Aosta. However, there are potential sources of bias also for the latter even if allschools participated in the re-test. In what follows we examine what factors areassociated with schools’ (for Trento) and students’ participation in the 2010 re-tests (for both provinces).
Trento
As we have anticipated in Section 3, participation of schools to the Trento’sPISA 2010 re-test took place on a voluntary basis. For this reason, the results ofthe re-test exercise cannot be considered as representative of the 16-year-old pop-ulation of Trento. What kind of bias can be expected from the schools’ self-se-lection into the re-test? It is plausible to think that the relatively better performingschools in PISA 2009 may have accepted to participate (positive selection) sincethey were expecting better results also in the 2010 re-test (even if they were un-aware of their placement when they took the decision). In this case, the 2010 re-test may overestimate the competences of Trento’s students. However, suchpositive selection is less likely to apply with respect to VA, namely the specific con-tribution given by schools to the improvement of student competences, as schoolsmay have only vague notions of their VA.26
Among the 49 Trento’s upper secondary schools sampled in PISA 2009, 14(29%) refused to participate in the 2010 follow-up. Among them, there are 4 ac-ademic oriented schools (licei), 4 technical schools, 2 vocational state schools and4 regional centres. Observing the school’s distribution, there is no clear evidenceof positive selection, according to which we would have expected licei to partic-ipate more than other school types. In Table A1 we analyse the potential distor-tions produced by the sample selection on the educational production function
M. BRATTI - D. CHECCHI Re-Testing PISA Students One Year Later. On School Value ...
33
26 Even if the schools may ignore the VA associated to each class, for the US ROTHSTEIN J. (2009)shows evidence of non-random assignment of teachers to classes also in terms of potentialcompetences’ improvements, i.e. of VA.
Checchi imp_Layout 1 27/11/17 17:43 Pagina 33

(EPF) estimates. In column (1) we have reported a simple OLS estimation of theEPF for 2009.27 Variables which are significantly associated with test scores arethe attended grade, having attended kindergarten, books at home, highestparental occupational status, immigration status and school track, much in linewith the previous literature. In column (2) we report the probit coefficients forthe probability of schools’ participating in the re-test. Owing to the small samplesize (49 schools), we have specified a parsimonious model. Among the regressorsonly (school average) past kindergarten attendance, the (school average) numberof books at home and the (school average) PISA 2009 test score are significantlyassociated to schools’ participation, respectively with positive (kindergarten andbooks) and negative (previous year score) signs. After controlling for past per-formance, school track is not a significant predictor of school participation in there-test. Past performance seems to contribute in a substantial way to the likelihoodof schools’ participating in the re-test, which falls by about 0.7 percent points(p.p.) for a one-point increase in the 2009 (school average) score. This meansthat schools which are one standard deviation (100 points) above the average per-formance have a 70 p.p. lower probability of participating to the re-test. Curiouslyenough, this indicates negative rather than positive selection. A possible interpre-tation of this result is that some schools which performed relatively well in 2009preferred not to participate because they were afraid of lowering their performancein 2010 (or simply they would not spend additional instructional time, since theincentives were absent).
However, our data may be affected by a second source of selection. The schoolswhich decided to participate might have adopted strategic behaviours by encour-aging participation of abler students and discouraging that of least able students,so as to artificially inflate their measured performance.28 In any case, voluntaryabsences are likely to be higher among low-performing students, which bias up-ward the PISA scores.29 There is also another source of panel attrition which maypotentially bias our estimates: some students may have dropped-out from educa-
Rivista di Politica Economica ottobre/dicembre 2016
34
27 In all the estimates we take as measures of students’ performance the average between the fiveplausible values provided by the OECD or INVALSI. We are aware that using simple OLSestimates without replication weights leads to biased standard errors, but it is not clear whichstrategy should be adopted when multiple plausible values exist both on the RHS and the LHSof the estimated equation (as in equation (6) for Tijt-1 and Tijt).
28 See BRATTI M. et AL. (2004) for a discussion on this in the context of Higher Education.29 Although the direction of the bias on school VA is less clear.
Checchi imp_Layout 1 27/11/17 17:43 Pagina 34

tion or transferred to another school, and this is unlikely to be random with re-spect to their past performance. In particular, we expect least able students to bemore likely to drop out or transfer to other schools, which may introduce an up-ward bias in the measured competences. Also in this case, like for schools’ partic-ipation in the re-test, it is unlikely that the students’ self-selection may have takenplace based on the knowledge of the true school VA: as a consequence also thispotential source of positive bias should be only minor. The percentage of absencesfrom the re-test is 18.8%: 10.43% are ordinary absences, 0.19% refer to childrenwhose parents denied permission, 0.10% to children with special conditions (e.g.,disability), 8.04% to children who dropped out or transferred to another school.As it is clear, most absences represent ordinary student truancy, but as we said,randomness is unlikely also for these absences.
In column (3) we report the probit estimates of a student’s probability to par-ticipate in the re-test exercise, conditional on her school having participated. Inthis model, which is estimated at the student level, we can include a wider set ofcontrols compared to column (2). We have included all controls already consid-ered in the estimation of the EPF in column (1). Indeed, most of these controlsmay have a direct effect on absenteeism, e.g., highly educated parents may valueeducation more and push their children to reduced absenteeism, and have indirectpositive effects through past (or expected future) performance. The model in col-umn (3) also includes the day of the week in which the test was administered bythe school, as student truancy may be concentred especially in certain days of theweek. This variable will be also useful in our later attempt to address student self-selection in the estimation of the EPF. The results in column (3) show that thereis indeed a statistically significant positive association between PISA past per-formance and the likelihood of participating in the re-test exercise, although themarginal effect is not very large: a one-standard deviation increase in the PISAscore (100 points) raises the probability of participating by 3 p.p. Column (3)suggests that only past performance and the day of testing are strongly associatedwith student participation. Curiously enough, absenteeism does not appear to berelated to family background after controlling for past performance. Absencesturn out to be significantly more frequent on Wednesday (-9.3 p.p. in the prob-ability of participation) and Saturday (-10.5 p.p.), i.e. in the middle and at theend of the week. The Wald test for the exclusion of the day of the week from theprobit model returns a value of 21.5 distributed as a χ2 (5).
Column (4) re-estimates the same model reported in column (1) restricted tothe sample of students participating in the 2010 re-rest. A comparison between
M. BRATTI - D. CHECCHI Re-Testing PISA Students One Year Later. On School Value ...
35
Checchi imp_Layout 1 27/11/17 17:43 Pagina 35
column (1) and (4) suggests only minor changes in the magnitude of the signif-icant coefficients, indicating that negative selection among schools, attrition andpositive selection among students in the re-test somehow compensate each other,reducing the bias in the relevant coefficients. The statistical significance of thecoefficient of the dummy for vocational schools is reduced, suggesting that voca-tional schools may have pushed only their better students to participate in there-test.
Column (5) reports the model including the same regressors and estimatedon the sample of students who participated in both PISA tests (the panel com-ponent) but considering the score in the PISA 2010 reading test as the dependentvariable. Here we note some non-negligible changes with respect to the previouscolumn. In particular, the effect of the school grade almost halves, while that ofstate vocational school doubles. In general, regional vocational schools (the ex-cluded case) lose ground with respect to all the other school types. These effectsare likely to be associated with the differential retention policies and drop-out inthe different schools, and are consistent with regional vocational schools beingthe least selective. The difference in the average ability between regional vocationalschools and the other school types tend to increase at higher grades).
In column (6) we make an attempt to correct the EPF’s estimates for studentself-selection. In particular, we include the propensity score (PS), the probabilityof attending the 2010 re-test obtained from the probit model in column (3) (seeAngrist 1997). The coefficient on the propensity score is positive but significantonly at the 10% level, and the coefficients associated with statistically significantregressors do not change much with respect to column (5). The only exceptionsare the proxy for cultural capital (number of books at home) and student gradewhich lose statistical significance presumably owing to their correlation with thepropensity score (i.e. the probability of participating in the re-test).
In column (7) and (8) we follow an alternative procedure to address the selec-tivity issue. We estimate a Heckman sample selection model where the EPF isreported in column (7) and the selection equation in column (8).30 The selectionequation uses the same specification as in column (3). The results in column (7)are very similar to those in column (6). The estimated correlation between theerror terms of the EPF and the selection equation turns out to be high in magni-
Rivista di Politica Economica ottobre/dicembre 2016
36
30 The model was estimated in one step with maximum likelihood.
Checchi imp_Layout 1 27/11/17 17:43 Pagina 36

tude (-0.886) and very significant (the standard error is 0.046), confirming againthat relatively better performing students participated in the 2010 re-test.31
Summing up, the analysis for Trento suggests that two countervailing forceswere at play. On the one hand schools with a better performance in 2009 wereless likely to participate in the 2010 re-test. On the other hand, conditional onschool participation, relatively better students took part in the re-test. Thus, con-trolling for past student performance becomes important because it helps reducethe distortions produced by self-selection into the re-test.
Valle d’Aosta
Unlike for the re-test conducted in Trento, the 22 schools of Valle d’Aostawere obliged to administer to their entire student body the PISA test in bothyears. However, grade 10 (which is the modal grade for 15-year-old students)concludes compulsory education in Italy, and a fraction of students abandonedtheir educational career, while another fraction kept on but changed schools. Aswe have anticipated in Section 3, school leavers and movers jointly represent 21%of the student body, and we wonder how this may affect the estimate of schools’VA. School leavers are likely to be weaker students, thus raising the average testperformance of the remaining students. If track allocation of students is not ran-dom, school switchers (mostly from academic oriented tracks to technical andvocational schools) are likely to raise the performance of the abandoned schoolsas well as of the receiving schools.
Following the same scheme used for the Trento re-test, Table A2 analyses thepotential distortions produced by sample selection on the EPF estimates. In col-umn (1) we have reported a simple OLS estimation of the EPF for 2009. Thiscross-section EPF is consistent with theoretical expectations (as well as with pre-
M. BRATTI - D. CHECCHI Re-Testing PISA Students One Year Later. On School Value ...
37
31 Indeed, let us write the main performance equation as Tijt = Xijt β + εijt and the selection equationas Pijt = Zijtδ + uijt where Zijt is a vector of regressors including all covariates in the vector Xijt andan excluded variable used to identify the model, Pijt is an indicator variable which takes valueone in case of participation in the re-test exercise and zero otherwise, and εijt and uijt two normallydistributed error terms. It can be shown that E(Tijt|Pijt) = Xijtβ + ρσλ(Zijtδ) + εijt where ρ is thecorrelation coefficient between εijt and uijt and σ is the standard deviation of εijt. λ(Zijtσ) =φ(Zijtδ)/Φ(Zijtδ) is the so called Inverse Mill’s (IMR) ratio, where φ(.) and Φ(.) are the standardnormal density and distribution functions (see HECKMAN J.J., 1979). Thus the quantity on thedenominator of the IMR is the propensity score, and ρ < 0 implies a positive dependence oftest scores on the propensity score. Thus, results in column (7) are consistent with column (6).
Checchi imp_Layout 1 27/11/17 17:43 Pagina 37

vious results for Trento): test score in literacy is positively correlated with grade(repeating students have a lower score, while early beginners, i.e. those enrolledbefore the legal age, do better, as both variables are likely to capture ability), booksat home (which is probably very correlated with parental years of education,which are not statistically significant) and first-generation immigrant status, whichis negatively associated with reading ability in the host country. There are positivepremia in test scores associated with attending an academic oriented school (liceo)compared to the excluded category of regional vocational schools (100 test points,equivalent to one standard deviation, and in line with the corresponding estimatefor Trento) or a technical school (72 test points); no difference is observed be-tween state-organised or region-organised vocational schools. These results arein line with the previous literature, suggesting that a large fraction of school dif-ferences is captured by student sorting into tracks.
In column (2) we report the probit coefficients for the probability of students’remaining in the regional schooling system, irrespective of the school attended(724 over 839 students with non-missing information), whereas column (3) re-stricts the sample to the students who remained in the same school (663 stu-dents32), thus controlling for both the probability of dropping-out and movingdownward in the school tracks. Both columns indicate that there is a positive se-lection into taking the test the following year, based on past performance, withthe marginal effect in the former (0.05 additional probability points per one hun-dred points in test score) being almost half of the impact measured in the latter(0.09 additional probability points per one hundred points in test score). Moresurprising is that the leaving/moving probability is independent of school track,suggesting that the downward mobility (from academic oriented to vocationalschools) of students partially offsets the differential in dropping out (see the finaltwo columns of Table 5). Some evidence of a role of family resources is reflectedin the negative correlation with parental occupational status, which however doesnot predict school change at a large extent. Differently from the case of Trento,we cannot exploit additional information on test taking, like the week day of thetest (since all students were tested on the same day), which would help us to iden-
Rivista di Politica Economica ottobre/dicembre 2016
38
32 Let us remind the sample selection leading to the panel component in Valle d’Aosta (see Sec-tion 3): from 879 students taking the test in 2009, only 736 took the test in 2010, with 40changing track and 12 changing schools within the same track. Thus the panel componentconsists of 684 students, which falls to 663 because of missing information on some demo-graphic variables.
Checchi imp_Layout 1 27/11/17 17:43 Pagina 38

tify the effect of the propensity score whose identification then depends on pastperformance score only.33
Column (4) reports the estimates of the model reported in column (1), re-stricted to students who remained in the same school. A comparison betweencolumns (1) and (4) indicates that there is limited selection bias in estimating thefamily’s impact, since the correlation of performance with the number of booksat home, wealth and migration status are not statistically different in the twomodels. Confidence intervals also overlap for dummies of school tracks, whichabsorb most of the parental background effect. Interestingly, the coefficient ongrade attended (which captures the effect of school repeaters) declines, since partof the repeaters (probably the least able) has either dropped out or changed school.
The PISA 2009 gradients estimated in column (4) are to be compared withthe PISA 2010 gradients estimated in column (5), where the sample is restrictedto the students remaining in the same school.34 The EPFs estimated in two adja-cent years look rather stable. However, as in the case of Trento, we observe anincrease in the magnitude of the coefficients associated with the type of secondaryschool attended, consistently with the idea that remaining in the school for anadditional year strengthens its impact. The difference between these coefficientsmay be taken as gross estimates of the VA associated with the school type: thusattending an academic school in Valle d’Aosta was associated to 117 PISA pointsin reading in 2009 and 197 points one year later, yielding a measure of 80 pointsof VA. Similarly, we obtain 68 points for technical schools and 75 for state vo-cational schools, which are to be compared with the corresponding measures forTrento (see columns (4) and (5) in Table A1): 21 points for academic schools,12 points for technical schools and 30 points for state vocational schools. Thesesimple calculations highlight an issue discussed in the paper: all cross-sectionalmeasures are conditional on a benchmark (the excluded case) and cannot be takenin their absolute value. The higher VA measures recorded in Valle d’Aosta arethe likely reflection of a decline in the absolute results of regional vocationalschools, especially when compared with tests administered in French. If we ob-serve the mean test scores reported in Table 6 we notice an improvement by allschool types but regional vocational schools when the test is administered in Ital-
M. BRATTI - D. CHECCHI Re-Testing PISA Students One Year Later. On School Value ...
39
33 Indeed, since in Table A2 we do not adopt a longitudinal VA model (including past test scorein the EPF), past test score can be used to identify the model. In longitudinal VA models, bycontrast, identification will rely on functional form only.
34 The file obtained from ACER-OECD also contains new 16-year-old entrants in 2010, whichhowever were not made available to us due to lack of a privacy consensus agreement.
Checchi imp_Layout 1 27/11/17 17:43 Pagina 39

ian, and a general worsening when the test is taken in French. This is partiallycontrolled for by a dummy variable, which suggests a penalization of almost 60points associated with the use of French in the questionnaire, despite the strongemphasis on bilingual education in the region.
The coefficients on family background and school type change when we ac-count for sample self-selection, either by including the estimated probability ofentering the permanent component of the sample (from column (3)) in column(6) or by adopting an Heckman selection model (columns (7) and (8)). In bothcases, the identification relies on imposing the exclusion of 2009 test score fromthe prediction of 2010 test score (i.e. adopting a cross-sectional specification).The magnitude of the coefficients on school types falls by approximately 20points, indicating that part of the measured VA should be imputed to studentself-sorting in the same schools. The coefficient on the PS in column (7) is highand statistically significant, suggesting that increasing the probability of partici-pating in the 2010 re-test by 10 percent points is associated with a 67-point in-crease in the PISA score. Surprisingly enough, the correlation coefficient betweenthe error terms of the EPF and the selection equation in the Heckman’s selectionmodel (column (8)) turns out to be almost identical in magnitude to the Trento’sexperiment (-0.885 with a standard error of 0.033).
Summarising, this appendix suggests that school VA measurement in Valled’Aosta’s schools is likely biased by changes in sample composition: if schoolleavers and school switchers are negatively selected, we should observe an overes-timate of the whole school/teacher contribution to the improvement of students’test scores. In the paper, we do nonetheless our best to obtain robust school VAmeasures given the limitations of the available data.
Rivista di Politica Economica ottobre/dicembre 2016
40
Checchi imp_Layout 1 27/11/17 17:43 Pagina 40

TABLE A1
POTENTIAL SAMPLE DISTORTIONS – TRENTO
(1) (2) (3) (4) (5) (6) (7) (8)TN 2009 TN TN TN 2009 TN 2010 TN 2010 TN 2010 Heckman
all available selection selection panel panel panel participating selectionobs no SFE equation to equation to component component component school no equation
PISA 2010 PISA 2010 no SFE no SFE no SFE SFE (by student)(by school) within corrected
participating with PSschool (bystudent)
female 0.996 -0.308 0.033 -12.204 -14.105 -14.463 -13.263 0.098[6.674] [1.020] [0.110] [6.846]* [7.511]* [6.030]** [8.457] [0.114]
age of student 7.51 -1.048 -0.294 11.455 8.628 16.781 15.3 -0.23[6.031] [2.772] [0.170]* [8.572] [11.117] [10.756] [12.652] [0.149]
grade compared to 44.482 -0.907 0.294 41.174 24.686 14.008 13.108 0.101modal grade in country [9.331]*** [1.283] [0.169]* [13.587]*** [9.573]** [9.321] [10.251] [0.177]attended kindergarten 37.554 11.93 0.15 25.593 17.143 11.915 10.649 0.07
[10.210]***[3.806]*** [0.249] [15.107]* [14.811] [15.626] [18.741] [0.248]single parent 10.123 -0.341 9.997 0.899 13.088 12.085 -0.32
[6.258] [0.159]** [9.554] [10.791] [11.376] [9.864] [0.148]**how many books 11.027 1.759 0.063 11.631 7.795 5.16 5.504 0.017at home [1.528]*** [0.900]* [0.042] [2.186]*** [2.283]*** 3.273] [2.713]** [0.043]highest parental -1.449 -0.076 -0.038 -1.748 -1.441 -0.13 -0.238 -0.021education years [0.793]* [0.417] [0.021]* [1.158] [1.073] [1.450] [1.001] [0.020]highest parental 0.477 0.01 0 0.423 0.128 0.125 0.161 0.002occupational status [0.145]*** [0.075] [0.005] [0.202]** [0.356] [0.289] [0.299] [0.003]wealth -6.071 -0.047 -4.28 -5.693 -3.846 -4.166 -0.06
[3.391]* [0.092] [4.620] [5.418] [5.134] [4.672] [0.078]second-generation -4.694 -0.313 -4.905 -4.619 8.998 4.556 -0.392immigrants [12.599] [0.357] [16.583] [26.031] [25.981] [26.545] [0.306]first-generation -28.147 0.031 -42.234 -36.927 -33.658 -36.996 0.018immigrants [10.698]** [0.255] [16.584]**[13.280]***[13.345]** [15.751]** [0.265]high school (Licei) 109.527 1.164 0.292 116.732 135.415 121.684 120.156 -0.114
[11.405]*** [1.335] [0.159]* [15.760]***[14.409]***[12.175]***[14.819]*** [0.166]technical schools 73.454 1.554 0.092 70.691 82.227 76.96 76.417 -0.115(Istituti tecnici) [9.962]*** [1.081] [0.121] [14.461]***[13.103]***[9.824]*** [12.343]*** [0.125]state vocational schools 38.915 -0.083 -0.01 32.509 62.738 61.345 58.832 -0.199(Istituti professionali statali) [14.234]*** [0.860] [0.106] [18.399]* [18.977]***[11.325]*** [18.063]*** [0.109]*test score 2009 (reading) -0.026 0.001 0.003
[0.012]** [0.001]** [0.001]***day of 2010 testing 0.079 -0.08= Monday [0.108] [0.151]day of 2010 testing 0.136 -0.13= Tuesday [0.100] [0.095]
continued
M. BRATTI - D. CHECCHI Re-Testing PISA Students One Year Later. On School Value ...
41
Checchi imp_Layout 1 27/11/17 17:43 Pagina 41
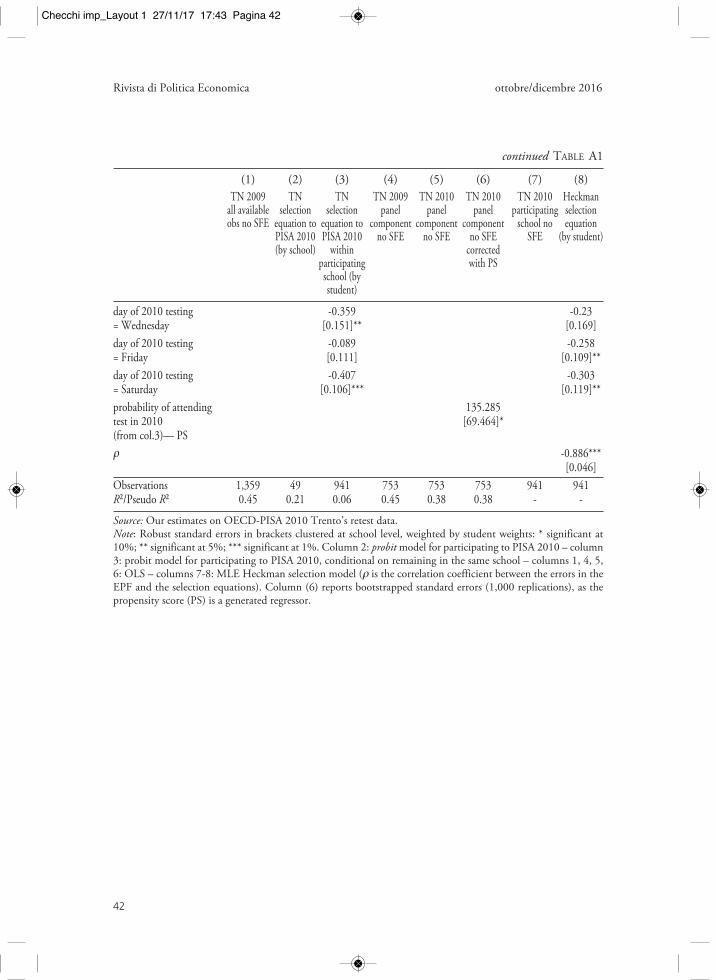
continued TABLE A1
(1) (2) (3) (4) (5) (6) (7) (8)TN 2009 TN TN TN 2009 TN 2010 TN 2010 TN 2010 Heckman
all available selection selection panel panel panel participating selectionobs no SFE equation to equation to component component component school no equation
PISA 2010 PISA 2010 no SFE no SFE no SFE SFE (by student)(by school) within corrected
participating with PSschool (bystudent)
day of 2010 testing -0.359 -0.23= Wednesday [0.151]** [0.169]day of 2010 testing -0.089 -0.258= Friday [0.111] [0.109]**day of 2010 testing -0.407 -0.303= Saturday [0.106]*** [0.119]**probability of attending 135.285test in 2010 [69.464]*(from col.3)— PSρ -0.886***
[0.046]Observations 1,359 49 941 753 753 753 941 941R²/Pseudo R² 0.45 0.21 0.06 0.45 0.38 0.38 - -
Source: Our estimates on OECD-PISA 2010 Trento’s retest data.Note: Robust standard errors in brackets clustered at school level, weighted by student weights: * significant at10%; ** significant at 5%; *** significant at 1%. Column 2: probit model for participating to PISA 2010 – column3: probit model for participating to PISA 2010, conditional on remaining in the same school – columns 1, 4, 5,6: OLS – columns 7-8: MLE Heckman selection model (ρ is the correlation coefficient between the errors in theEPF and the selection equations). Column (6) reports bootstrapped standard errors (1,000 replications), as thepropensity score (PS) is a generated regressor.
Rivista di Politica Economica ottobre/dicembre 2016
42
Checchi imp_Layout 1 27/11/17 17:43 Pagina 42

TABLE A2
POTENTIAL SAMPLE DISTORTIONS – VALLE D’AOSTA
(1) (2) (3) (4) (5) (6) (7) (8)AO 2009 AO AO AO 2009 TN 2010 AO 2010 AO 2010 Heckman
all available selection selection panel panel panel participating selectionobs no SFE equation to equation to component component component school no equation
PISA 2010 panel no SFE no SFE no SFE SFEno SFE component corrected
of PISA with PS2010 no
SFE
female 7.564 0.083 0.135 5.11 15.494 -8.616 11.486 0.016[5.683] [0.108] [0.075]* [5.463] [5.953]** [4.489]* [5.556]** [0.083]
age of student 5.877 -0.492 -0.206 13.222 7.214 32.789 9.596 -0.227[5.021] [0.229]** [0.223] [7.275]* [11.093] [7.030]*** [13.624] [0.202]
grade compared to modal 55.232 0.305 0.553 48.998 50.21 -90.018 29.297 0.2grade in country [5.535]*** [0.200] [0.088]*** [5.569]*** [7.782]***[11.147]*** [6.826]*** [0.104]*attended kindergarten 14.877 0.605 0.807 37.03 40.114 -165.589 3.443 0.724
[12.775] [0.345]* [0.348]** [21.181]* [18.912]**[22.193]*** [28.116] [0.349]**single parent -4.879 -0.269 -0.256 -9.612 -14.163 38.140 -4.698 -0.222
[6.035] [0.212] [0.185] [6.701] [8.258] [6.952]*** [8.005] [0.182]how many books at home 12.657 0.01 -0.022 12.505 13.301 9.696 12.592 -0.092
[2.250]*** [0.033] [0.035] [2.296]*** [2.042]*** [1.708]*** [2.129]*** [0.037]**highest parental -0.76 0.03 0.027 -0.348 1.739 -2.829 0.792 0.023education in years [0.703] [0.021] [0.022] [0.781] [1.017] [0.834]*** [1.019] [0.018]highest parental 0.147 -0.01 -0.004 0.228 -0.036 0.532 0.023 -0.005occupational status [0.157] [0.003]*** [0.003] [0.184] [0.246] [0.167]*** [0.219] [0.003]*wealth -10.515 -0.068 0.003 -10.256 -7.333 -1.916 -6.912 0.052
[3.749]** [0.132] [0.077] [4.200]** [3.562]* [3.085] [4.124]* [0.080]second-generation -24.055 -0.164 0.276 -23.561 42.457 1.367 34.524 0.377immigrants [43.177] [0.524] [0.527] [50.152] [32.084] [27.112] [31.948] [0.538]first-generation -41.803 0.065 0.461 -36.569 -52.038 -110.779 -61.488 0.727immigrants [10.609]*** [0.229] [0.238]* [14.776]**[13.608]***[12.824]***[15.677]***[0.220]***high school (Licei) 100.557 0.56 -0.159 117.687 197.632 139.945 175.148 -1.001
[15.475]***[0.198]*** [0.210] [13.330]***[23.276]***[18.374]***[28.712]***[0.391]**technical schools 72.677 0.65 0.211 89.419 157.319 57.282 127.879 -0.54(Istituti tecnici) [12.431]***[0.220]*** [0.292] [12.610]***[22.073]***[19.235]***[28.444]*** [0.446]state vocational schools 25.837 0.696 0.314 44.975 119.683 31.605 92.144 -0.139(Istituti professionali statali) [15.225] [0.174]*** [0.186]* [16.281]**[23.687]***[18.553]* [29.357]*** [0.393]test score in 2009 (reading) 0.003 0.004 0.009
[0.001]** [0.001]*** [0.001]***test conducted in French -61.009 -60.444 -59.434
[4.824]*** [4.124]*** [4.182]***probability of attending 673.1test in 2010 (from col.3) [48]***
— PScontinued
M. BRATTI - D. CHECCHI Re-Testing PISA Students One Year Later. On School Value ...
43
Checchi imp_Layout 1 27/11/17 17:43 Pagina 43

continued TABLE A2
(1) (2) (3) (4) (5) (6) (7) (8)AO 2009 AO AO AO 2009 TN 2010 AO 2010 AO 2010 Heckman
all available selection selection panel panel panel participating selectionobs no SFE equation to equation to component component component school no equation
PISA 2010 panel no SFE no SFE no SFE SFEno SFE component corrected
of PISA with PS2010 no
SFE
ρ -0.885***[0.033]
Observations 839 839 839 663 663 663 839 839 R²/Pseudo R² 0.53 0.10 0.11 0.52 0.57 0.70
Source: Our estimates on OECD-PISA 2010 Valle d’Aosta’s retest data.Note: Robust standard errors in brackets clustered at school level, weighted by student weights: * significant at10%; ** significant at 5%; *** significant at 1%. Column 2: probit model for participating to PISA 2010 – column3: probit model for participating to PISA 2010, conditional on remaining in the same school – columns 1, 4, 5,6: OLS – columns 7-8: MLE Heckman selection model (ρ is the correlation coefficient between the errors in theEPF and the selection equations). Column (6) reports bootstrapped standard errors (1,000 replications), as thepropensity score (PS) is a generated regressor.
Rivista di Politica Economica ottobre/dicembre 2016
44
Checchi imp_Layout 1 27/11/17 17:43 Pagina 44

BIBLIOGRAPHY
ANGRIST J.D. (1997), «Conditional Independence in Sample Selection Models», Eco-nomics Letters, vol. 54, no. 2, pp. 103-112 .
AMERICAN STATISTICAL ASSOCIATION (2014), «Statement on Using Value-Added Modelsfor Educational Assessment», April 8, http://www.amstat.org/policy/pdfs/asa_vam_ state-ment.pdf
BENABOU R. (1996a), «Heterogeneity, Stratification, and Growth: Macroeconomic Im-plications of Community Structure and School Finance», American Economic Review,vol. 86, no. 3, pp. 584-609.
-.- (1996b), «Equity and Efficiency in Human Capital Investment: The Local Connec-tion», Review of Economic Studies, vol. 62, no. 2, pp. 237-264.
BRATTI M. - CHECCHI D. - FILIPPIN A. (2007), «Geographical Differences in Italian Stu-dents’ Mathematical Competences: Evidence from PISA», Giornale degli Economisti eAnnali di Economia, vol. 66, no. 3, pp. 299-335.
BRATTI M. - MCKNIGHT A. - NAYLOR R. - SMITH J. (2004), «Higher Education Out-comes, Graduate Employment and University Performance Indicators», Journal of theRoyal Statistical Society Series A, vol. 167, no. 3, pp. 475-496.
DI CHIACCHIO C. - GIANGIACOMO P. - PALMERIO L. (2010), Progetto sull’analisi delvalore aggiunto - Trentino - Rapporto INVALSI sullo scoring degli Studi 2009-2010,Nota Metodologica, mimeo, Frascati.
HECKMAN J.J. (1979), «Sample Selection Bias as a Specification Error», Econometrica,vol. 47, no. 1, pp. 153-161.
INVALSI (2016), Rilevazioni nazionali degli apprendimenti 2015-16, Roma, Istituto nazionaleper la valutazione del sistema educativo di istruzione e di formazione. 215‐16. Rome
LAZEAR E.P. (2001), «Educational Production», The Quarterly Journal of Economics,116(3), pp. 777-803.
OECD (2010), PISA 2009 Results: What Students Know and Can Do - Student Performancein Reading, Mathematics and Science, vol. I, mimeo.
PONS X. (2011), «What Do We Really Learn from PISA? The Sociology of Its Receptionin Three European Countries (2001-2008)», European Journal of Education, vol. 46,no. 4, pp. 540-548.
PUHANI P.A. (2000), «The Heckman Correction for Sample Selection and Its Critique»,Journal of Economic Surveys, vol. 14, no. 1, pp. 53-68.
ROTHSTEIN J. (2009), «Student Sorting and Bias in Value-Added Estimation: Selection onObservables and Unobservables», Education Finance and Policy, vol. 4, no. 4, pp. 537-571.
-.- (2010), «Teacher Quality in Educational Production: Tracking, Decay and StudentAchievement», Quarterly Journal of Economics, vol. 125, no. 1, pp. 175-214.
TODD P. - WOLPIN K.I. (2003), «On the Specification and Estimation of the ProductionFunction for Cognitive Achievement», Economic Journal, vol. 113, no. 485, pp. F3-F33.
M. BRATTI - D. CHECCHI Re-Testing PISA Students One Year Later. On School Value ...
45
Checchi imp_Layout 1 27/11/17 17:43 Pagina 45

Checchi imp_Layout 1 27/11/17 17:43 Pagina 46