reaction kinetics of hydroxyl radical with polycyclic
TRANSCRIPT

Graduate Theses, Dissertations, and Problem Reports
2016
Reaction Kinetics of Hydroxyl Radical with Polycyclic Aromatic Reaction Kinetics of Hydroxyl Radical with Polycyclic Aromatic
Hydrocarbon Precursors Hydrocarbon Precursors
Juddha Thapa
Follow this and additional works at: https://researchrepository.wvu.edu/etd
Recommended Citation Recommended Citation Thapa, Juddha, "Reaction Kinetics of Hydroxyl Radical with Polycyclic Aromatic Hydrocarbon Precursors" (2016). Graduate Theses, Dissertations, and Problem Reports. 6789. https://researchrepository.wvu.edu/etd/6789
This Dissertation is protected by copyright and/or related rights. It has been brought to you by the The Research Repository @ WVU with permission from the rights-holder(s). You are free to use this Dissertation in any way that is permitted by the copyright and related rights legislation that applies to your use. For other uses you must obtain permission from the rights-holder(s) directly, unless additional rights are indicated by a Creative Commons license in the record and/ or on the work itself. This Dissertation has been accepted for inclusion in WVU Graduate Theses, Dissertations, and Problem Reports collection by an authorized administrator of The Research Repository @ WVU. For more information, please contact [email protected].

Reaction Kinetics of Hydroxyl Radical with Polycyclic Aromatic Hydrocarbon Precursors
by
JuddhaThapa
Dissertation Submitted to the Eberly College of Arts and Sciences
at West Virginia University
in partial fulfillment of the requirements for the degree of
Doctor of Philosophy in Physical Chemistry
Approved by
Fabien Goulay, Ph.D., Committee Chairperson
Kenneth Showalter, Ph.D.
Michelle Richards-Babb, Ph.D.
Kung Wang, Ph.D.
Brian Anderson, Ph.D.
C. Eugene Bennett Department of Chemistry
Morgantown, West Virginia
2016
Keywords: Gas Phase Reactions, Free Radicals, Hydrocarbons, Rate Constant, Pulsed Laser
Photolysis, Laser Induced Fluorescence, Temperature and Pressure Range, Addition
Intermediates
Copyright 2016 Juddha Thapa

Abstract
Reaction Kinetics of Hydroxyl Radical with Polycyclic Aromatic Hydrocarbon Precursors
JuddhaThapa
The incomplete combustion of fuels inside of an internal combustion engines generates unwanted byproducts such as soot. Because of health and environmental concerns, soot formation has been a very active area of research in combustion chemistry. However, the mechanism of formation of soot is still not well understood. It has been proposed that the soot formation is initiated by the reaction of small free radicals with abundant hydrocarbon fuel molecules producing aromatic ring structures at high temperatures. These aromatic ring structures further react to form polycyclic aromatic hydrocarbons (PAHs) that are stable at the high temperatures of combustion environments. These PAHs collide and stick with each other forming dimers, trimers, tetramers, etc. Eventually such stable PAHs-stabilomers condense and transform into solid particles (soot). To minimize pollutants and increase the efficiency of engines, it is very important to understand the chemistry of the elementary reactions at the molecular level. The reactions of hydroxyl free radicals with polycyclic aromatic hydrocarbon precursor molecules are studied experimentally in a quasi-static gas cell using laser pump-probe spectroscopy. Hydroxyl free radicals are generated by pulsed laser photolysis (PLP) using the third (355 nm) or fourth (266 nm) harmonic of Nd:YAG laser and their concentration is monitored as a function of laser delay-time using a frequency-doubled tunable dye laser perpendicular to the photolysis laser. The off-resonance fluorescence from the hydroxyl free radicals at 310 nm is collected by a photomultiplier tube (PMT) placing it orthogonal to the photolysis and probe laser beams.
The reactions of hydroxyl radicals (OH) with phenylacetylene and fulvenallene have been investigated from 298 K to 450 K. The concentrations of the hydrocarbon reactants are measured using FTIR spectroscopy and UV absorption. The room temperature reaction rate of the OH + phenylacetylene reaction is measured to be 8.75(±0.73)×10-11 cm3s-1. The reaction rate coefficient is pressure and temperature independent over the 1-7.5 Torr and 298-423 K pressure and temperature ranges. The rate coefficient is larger than that expected based solely on association with the aromatic ring, which suggests reaction with the triple bond. For the OH + fulvenallene reaction, the room temperature rate coefficient is found to be 8.8(±1.7)×10-12 cm3s-1 with the negative temperature dependence. The comparison of the experimental rate coefficients with the calculated abstraction rate coefficients suggests that over the experimental range, association of hydroxyl radical (OH) to fulvenallene plays the significant role toward the formation of PAH precursors.

iii
"I dedicate this dissertation to my parents
Dhan Bahadur Thapa and Krishna Kumari Thapa,
who sacrificed their life for
my education despite they themselves having no formal education."

iv
Acknowledgments
I would like to gently close my eyes for a moment and remember all the helping hands
lent to me throughout my Ph.D. education.
Dr. Fabien Goulay, you are the great adviser who always motivated and mentored me in
all the circumstances. I am truly grateful to you for allowing and trusting me to use all the new
instruments in the new laboratory despite knowing I was a new researcher. Thank you very much
for crafting a confident researcher in me through your adept advice. Your comments and
suggestions in all the steps were always precious to proceed in scientific research. Thank you
both for pointing my limitations and suggesting the ways forward. I am also grateful to all my
laboratory mates in Goulay laboratory for their help and friendship.
I would like to express my appreciation to Sherman Adams for making wonderful glass
apparatus for the experiments; Allen Burn for making all the metal and teflon equipment; and
Philip Tucker for helping in all electrical and electronic equipment. Philip Tucker-your marks
will always be deeply felt at Goulay Laboratory.
Thank you very much the friends in Dr. Wang laboratory for letting me use the oven or
clean my dirty glassware.
I am also extremely grateful to my Ph.D. committee members, Dr. Kenneth Showalter,
Dr. Michelle Richards-Babb, Dr. Kung Wang, and Dr. Brian Anderson for their time, advice, and
encouragement.
I would also like to express my deepest gratitude to my parents for their unconditional
support, sacrifice, and encouragement throughout my life. You always backed me up and never
let me down. You have the invaluable role in making me the first generation college student. I

v
always thank God for having parents like you who always put my education the first priority. I’m
also thankful to my wife Nirmala Thapa for loving support. I experienced difficulty having to
live away from the family, and I’m thankful that you always provided the emotional strength to
pursue my education The birth of my son, Aarush, last year not only reminded me of my
responsibilities and deeper joys of life but also provided the relaxing and rejuvenating moments
in the evening when I returned home after a long research or teaching day.
Lastly, I am very much grateful to the student organization “Nepalese Students and
Scholars Association, West Virginia University (NSSAWVU)” for consolidating all the
Nepalese students at WVU and their families. All the social events and camping were great
platform to be together and share common interests. Those events were really recreational and
became the place to relieve stress. I was able to overcome frustrations resulted from the failure of
some research steps many times and hectic schedule in the personal and college lives. This
organization really made me feel at home away from home.

vi
Table of Contents Abstract…………………………………………………………………………………………..ii
Dedication………………………………………………………………………………………..iii
Acknowledgements……………………………………………………………………………...iv
Table of Contents………………………………………………………………………………..vi
List of Figures………………………………………………………………………………….....x
List of Schemes……………………………………………………………………………........xvi
List of Tables…………………………………………………………………………………...xix
List of Symbols and Abbreviations…………………………………………………………...xxi
Chapter 1: Introduction…………………………………………………………………………1
1.1 Combustion…………………………………………………………………………………....1
1.2 Types of Fuels…………………………………………………………………………………2
1.2.1 Conventional Resource…………………………………………….................................2
1.2.1.1 Petroleum………………………………………………………………………….3
1.2.1.2 Natural Gas………………………………………………………………………..4
1.2.2 Non-Conventional Source………………………………………………………………5
1.2.2.1 Biofuels and its Types…………………………………………………………….5
1.3 Types of Combustion Engines………………………………………………………………..6
1.4 Combustion Byproducts……………………………………………………………………..10
1.5 Low Temperature Combustion (LTC): A Way to Improve Combustion Device……………12
1.6 Combustion Chemistry………………………………………………………………………13
1.7 Important Species in Combustion............................................................................................14
1.8 OH Radical Reaction Scheme………………………………………………………………..15
1.8.1 The Temperature Dependence of the Different Reaction Channels…………………...17
1.8.2 The Effect of Pressure on the Stabilization of the Adduct……………………………..19
vii
1.9 First Ring Formation and Carbon Molecular Growth………………………………………..20
1.10 Formation of Polycyclic Aromatic Hydrocarbons (PAHs)…………………………………22
1.10.1 The HACA Mechanism………………………………………………………………24
1.10.2 Formation of Soot………………………………………………………………….....27
1.11 Resonance-Stabilized Radicals (RSRs): Alternative Pathways for PAH Formation………28
1.11.1 Definition and Characteristics………………………………………………………..28
1.11.2 Current Knowledge on Resonance-Stabilized Radical Reactivity…………………...30
1.11.3 Previous Experiments and Computational Studies on Resonance-Stabilized Radicals.........................................................................................................................31
1.11.4 What Else do We Need to Know……………………………………………………..35
1.12 Relevance of my Research……………………………………………………….................36
References……………………………………………………………………………..................37
Chapter 2: Experimental Methods………………………………………………………….....42
2.1 Vacuum and Gas Set Up……………………………………………………………..............42
2.1.1 The Reaction Chamber………………………………………………………………...42
2.1.2 Vacuum Pump and Gas Injection………………………………………………….......43
2.1.2.1 Vacuum Pump……………………………………………………………………….44
2.1.2.2 Injection of Gases………………………………………………………………..45
2.1.2.3 Calibration of Mass Flow Controllers (MFCs)………………………………….46
2.1.2.4 Determination of Buffer Gas Total Flow Rate and Average Linear Velocity…..47
2.1.2.5 High Temperature Set Up……………………………………………………….49
2.2 The Pulsed Laser Photolysis-Laser Induced Fluorescence (PLP-LIF) Technique………….49
2.2.1 Background……………………………………………………………………………49
2.2.2 Pulsed Photolysis………………………………………………………………………51
2.2.3 Laser Induced Fluorescence (LIF)…………………………………………………......51

viii
2.3 Laser and Optical Systems……………………………………………………………...........55
2.3.1 Nd:YAG and Harmonic Generation…………………………………………………...58
2.3.1.1 Harmonic Generation………………………………………………………….....59
2.3.1.2 Q-Switching………………………………………………………………….......60
2.3.2 Tunable Dye Laser……………………………………………………..........................62
2.3.3 Photomultiplier Tube (PMT)…………………………………………………..............65
2.4 Kinetic Measurements………………………………………………………….....................67
2.4.1 LIF Measurements……………………………………………………………..............67
2.4.2 Pump-Probe Timing……………………………………………………………............68
2.4.3 Example of LIF Emission……………………………………………………...............69
2.4.4 Pseudo First Order Approximation……………………………………….....................70
2.5 Experimental Validation………………………………………………………......................72
2.5.1 OH + Propene, Butene, Acetaldehyde, and Benzene………………………….............73
2.5.2 Computational Method…………………………………………………………….......74
References……………………………………………………………………………..................74
Chapter 3: Reaction of the OH Radical with Phenylacetylene……………………................77
3.1 OH Radical Reaction with Aromatic Molecules…………………………………….............77
3.2 Phenylacetylene in Combustion……………………………………………..........................79
3.3 Number Density of Phenylacetylene…………………………………………………...........81
3.4 Determination of the Phenylacetylene Absorption Cross-Section at 266 nm…….................83
3.5 OH Radical Precursor………………………………………………………………………..87
3.5.1 Hydrogen Peroxide……………………………………………………………….........87
3.5.2 Nitrous Acid (HONO)………………………………………………………………....87
3.6 Protection of the Laser Windows……………………………………………………............89
3.7 Kinetic Measurements………………………………………………………………….........91

ix
3.7.1 Pseudo-First Order Kinetics………………………………………………...................91
3.7.2 Laser Power Dependence of Phenylacetylene………………………………................93
3.7.3 HONO as OH Precursor……………………………………………………..................95
3.8 Pressure and Temperature Dependence of Phenylacetylene + OH Kinetics……...................96
3.9 Discussion of the Reaction Mechanism…………………………………………...................98
3.10 Conclusion………………………………………………………………………………...103
References....................................................................................................................................105
Chapter 4: Reaction of the OH Radical with Fulvenallene…………………………………107
4.1 Fulvenallene in Combustion Environments………………………………………………...107
4.2 Fulvenallene Synthesis and Characterization…………………………………....................108
4.2.1 Properties of Fulvenallene and its Precursors…………………………………...........108
4.2.2 Fulvenallene Synthesis………………………………………………………………..109
4.2.3 Liquid Phase NMR Spectroscopy……………………………………………….........112
4.2.4 Gas Phase FTIR Spectroscopy…………………………………………………..........114
4.2.5 Fulvenallene Purity…………………………………………………………………...118
4.3 Kinetic Measurements……………………………………………………………...............121
4.3.1 Fulvenallene Number Density………………………………………………..............121
4.3.2 Pseudo-First Order Kinetics…………………………………………….....................122
4.3.3 Temperature Dependence of the Rate Constant…………………………...................124
4.4 Discussion on the Mechanism……………………………………………...........................126
4.5 Conclusion………………………………………………………………………………….128
References……………………………………………………………………….......................129
Chapter 5: Conclusion and Future Directions……………………………………................131
References…………………………………………………………………………...................134
Appendix……………………………………………………………………….........................136

x
List of Figures
Chapter 1: Introduction
Figure 1a. First rotation of four stroke engine (A) Intake stroke (B) Compression stroke………7
Figure 1b. Second rotation of four stroke engine (C) Power stroke (D) Exhaust stroke…………7
Figure 2. Modified gas turbine…………………………………………………………………...9
Figure 3. Temperature dependence for the reaction of OH with benzene………………………18
Figure 4. Temperature dependence for the reaction of OH with propene………………………18
Figure 5. The reaction rate of propene as a function of total density of the gas………………...20
Figure 6. Structures of two, three, and four ringed PAHs………………………………………23
Figure 7. Proposed scheme of soot formation (adapted from Richter and Howard)……………27
Chapter 2: Experimental Methods
Figure 1. Experimental schematic for the kinetic measurements from 300 to 450 K and 1 to 10
Torr………………………………………………………………………………………………43
Figure 2. Lobed rotors in Roots Blower vacuum pump………………………………………...45
Figure 3. Plot of measured flowrate vs read flowrate for the 200 sccm mass flow controller….47
Figure 4. Schematic of laser induced fluorescence of Hydroxyl Radical……………………….52
Figure 5. OH LIF spectrum for A2Σ+-X2Π electronic transition (v'=1, v"=0)…………………..53
Figure 6. Fluorescence decay due to the dye laser……………………………………………...54

xi
Figure 7. Schematic of a laser cavity……………………………………………………………56
Figure 8 (a) Three-level and (b) Four-level lasing systems……………………………………..57
Figure 9. Energy levels in (a) Free Nd3+ and (b) Nd3+ split by crystal field interactions……….59
Figure 10. Nd:YAG laser profile at 1064 nm…………………………………………………...62
Figure 11. Energy level scheme for a dye molecule nine processes important in laser action….63
Figure 12. Structure of Rhodamine 590 dye…………………………………………………….64
Figure 13. Reflection mode photocathode in a circular cage in side-on photomultiplier tube….66
Figure 14. Timing between the pump and probe lasers…………………………………………68
Figure 15. Emission of OH fluorescence following dye laser excitation……………………….69
Figure 16. A plot of k1st vs number density of propene at 5 Torr. The line is obtained using a
linear fit to the data and k2nd values are presented with 2σ precision……………………………72
Chapter 3: Reaction of the OH Radical with Phenylacetylene
Figure 1. Plot of OH radical reaction rate coefficients against electrophilic substituent constants
for monosubsituted aromatic compounds. The red dot is for phenylacetylene………………….79
Figure 2. Schematic of experimental set up to determine the cross-section of phenylacetylene at
266 nm…………………………………………………………………………………………...81
Figure 3. Bubbler pressure vs number density of phenyl acetylene in the reaction cell. The solid
line represents the fit relating the bubbler pressure to the number density of phenylacetylene,

xii
given by the equation. A, B and C are constants from the fit and Pbubb is the bubbler pressure in
Torr………………………………………………………………………………………………83
Figure 4. Typical plot of vs Pabscell (Torr) at 254 nm…………………………………...85
Figure 5. Typical plot of vs Pabscell (Torr) at 266 nm…………………………………...85
Figure 6. Plot of cross-section of phenylacetylene at 266 nm vs molar fraction of
phenylacetylene in helium…………………………………………………………………….....87
Figure 7. Schematic of experimental setup used for synthesis of HONO………………………88
Figure 8. Long arm window to prevent the diffusion of phenylacetylene……………………...90
Figure 9. Typical traces of OH decays for varying concentrations of Phenyl acetylene at
photolysis laser fluence of 147 mJ/cm2. Plots are generated as a function of decay signal as a
function of delay time between the probe laser and photolysis laser, fit to a single exponential
function with corresponding residuals and k1st values…………………………………………...92
Figure 10. Typical traces of OH decays for varying concentrations of Phenyl acetylene at
photolysis laser fluence of 147 mJ/cm2. Plots are generated as a function of decay signal as a
function of delay time between the probe laser and photolysis laser, fit to a single exponential
function with corresponding residuals and k1st values…………………………………………...93
Figure 11. Power dependence of the second order rate constant (k2nd) plotted as a function of
fluence of photolysis laser at 266 nm. The error bars for individual k2nd values are 2σ
precision.........................................................................................................................................94
0IIln
0IIln

xiii
Figure 12. Plot of second order rate constant (k2nd) a function of laser fluence using HONO as
radical source at 355 nm…………………………………………………………………………95
Figure 13. First order rate constants (k1st) obtained from OH decay profiles plotted against
concentrations of phenyl acetylene. The second order rate constant (k2nd) is the slope of the solid
line obtained from a linear least-squares fit with 2σ standard deviation………………………...96
Figure 14. Plot of second order rate constant (k2nd) of the reaction of OH from HONO photolysis
at 355 nm with phenyl acetylene plotted against pressure of reaction cell. Each data point
represents weighted averaged k2nd value with 2σ precision values obtained from multiple runs
(minimum 5)……………………………………………………………………………………..97
Figure 15. Second order rate constants (k2nd) for the reaction of OH from HONO photolysis at
355 nm with phenyl acetylene plotted against temperature of reaction cell (293 - 423 K). Each
data point represents weighted averaged k2nd value with 2σ precision values obtained from
multiple runs (minimum 3, maximum 7)………………………………………………………...97
Figure 16. Exothermicites for the addition reaction intermediates and some of their
isomers………………………………………………………………………………………….101
Chapter 4: Reaction of the OH Radical with Fulvenallene
Figure 1. Fulvenallene………………………………………………………………………….107
Figure 2. Experimental set up for the synthesis of Fulvenallene………………………………110
Figure 3. (a) Experimental and (b) simulated 1H NMR spectrum of the liquid fulvenallene
dissolved in CDCl3……………………………………………………………………………...113

xiv
Figure 4. Baseline subtracted IR absorption spectra of the gas mixture recorded with 4 cm-1
resolution………………………………………………………………………………………..115
Figure 5. Baseline subtracted absorption spectrum with 8 cm-1 resolution of the synthesized
liquid vapors in helium. The fulvenallene vibrational bands are assigned according to Angell et.
al………………………………………………………………………………………………...116
Figure 6. (a) Simulated spectrum (B3LYP/CBSB7 method) of fulvenallene and (b) baseline
subtracted absorption spectrum of the gas mixture. The calculated spectrum is scaled by a factor
0.952 to match the observed normal modes of fulvenallene…………………………………...118
Figure 7. Simulated absorption spectra of homophthalic anhydride and benzocyclobutenone
using the B3LYP/CBSB7 method. The calculated spectra are scaled by a factor 0.952……….119
Figure 8. Baseline subtracted absorption spectrum (8 cm-1 resolution) of a gaseous sample,
showing additional absorption bands at 1264 cm-1, 1037 cm-1 and 820 cm-1…………………..120
Figure 9 (a) Temporal profile of the OH radical and (b) pseudo first-order decay as a function of
fulvenallene number density recorded at 298 K and 5 Torr. The red lines are (a) an exponential
and (b) a linear fit to the data. The error bars are 2σ from the least-squared exponential
fits………………………………………………………………………………………………124
Figure 10. Second-order rate coefficients (k2nd) as a function of reaction cell temperature from
298 to 450 K. Each data point is averaged k2nd with 1σ precision values from multiple runs (3 to
5 runs). The red line is the fit to our experimental data and the black dotted line is the abstraction
rate constants calculated by da Silva et.al. as a function of temperature (K)…………………..126

xv
Chapter 5: Conclusion and Future Directions
Figure 1. Schematic of high temperature pulsed fast flow reactor…………………………….134

xvi
List of Schemes
Chapter 1: Introduction
Scheme 1. Complete combustion of hydrocarbon fuels…………………………………………..1
Scheme 2. Incomplete combustion of hydrocarbon fuels………………………………………...1
Scheme 3. Formation of nitric acid (HNO3)……………………………………………………..11
Scheme 4. Formation of sulfurous (H2SO3) and sulfuric (H2SO4) acids………………………...11
Scheme 5. Formation of carbon dioxide…………………………………………………………11
Scheme 6. Hydroxyl radical reacts with methane to yield methyl radical………………………15
Scheme 7. Hydroxyl radical reacts with acetaldehyde to form acetyl radical…………………...16
Scheme 8. Hydroxyl radical reacts with ethylene to form OH-ethylene adduct………………...16
Scheme 9. Hydroxyl radical reacts with acetone to form an adduct and acetic acid through CH3
elimination……………………………………………………………………………………….16
Scheme 10. Hydroxyl radical reacts with benzene to form Van der Waals association
complex…………………………………………………………………………………………..17
Scheme 11. The reaction of hydroxyl radical with propene……………………………………..19
Scheme 12. Propargyl radical self recombines to form benzene or phenyl radical……………..21
Scheme 13. Hydrogen-atom assisted isomerization of fulvene to benzene……………………..22
Scheme 14. The reaction of propargyl radical with acetylene to generate benzene……………..22

xvii
Scheme 15. Benzene reacts with gaseous hydrogen atom to form phenyl radical………………24
Scheme 16. The phenyl radical leading to the formation of naphthalene and
acenaphthylene…………………...................................................................................................24
Scheme 17. Formation of naphthalene through the HACA mechanism………………………...25
Scheme 18. Phenyl radical reacting with benzene to form biphenyl and biphenyl radical reacting
with acetylene to form phenanthrene…………………………………………………………….26
Scheme 19. Hydroxyl radical reacting with phenylacetylene to form phenanthrenyl radical…...26
Scheme 20. Resonance structures of fulvenallenyl radical……………………………………...29
Scheme 21. Two propargyl radicals forming 1,5-hexadiyne and 1,2-hexadiene-5-yne…………30
Scheme 22. Two propargyl radicals forming benzene, fulvene, and phenyl radical…………….30
Scheme 23. Propargyl radical combines with allyl radical to form benzene via fulvene……….31
Scheme 24. Cross combination of RSRs to form addition products…………………………….31
Scheme 25. Two cyclopentadienyl radicals form naphthalene………………………………….32
Scheme 26 Two cyclpentadienyl radicals form naphthalene and fulvalene…………………….32
Scheme 27. Two cyclopentadienyl radicals react to form naphthalene…………………………33
Scheme 28. (i) Adduct (C10H10) and (ii) naphthalene and azulene in the study by Knyazev and
popov……………………………………………………………………………………………..34
Scheme 29. (i) Fulvenalenyl and propargyl form naphthalene (ii) fulvenallenyl and
xviii
cyclopentadienyl form diphenyl and (iii) self-recombination of fulvenallenyl form
phenanthrene……………………………………………………………………………………..35
Scheme 30. Resonance structures of OH-phenylacetylene adduct……………………………...36
Chapter 3: Reaction of the OH Radical with Phenylacetylene
Scheme 1. Phenyl radical reacts with gaseous acetylene to form phenylacetylene or benzene
reacts with ethynyl radical to form phenylacetylene…………………………………………….80
Scheme 2. Phenylacetylene radical formed from phenylacetylene reacts with gaseous acetylene
to form naphthalene……………………………………………………………………………...80
Chapter 4: Reaction of the OH Radical with Fulvenallene
Scheme 1. Proposed mechanism of fulvenallene formation…………………………………...109

xix
List of Tables
Chapter 1: Introduction
Table 1. Major combustion byproducts as pollutants…………………………………………...10
Table 2. Health effect of pollutants from combustion of fossil fuels and biomass adapted from
Smith et.al. and Naeher et.al……………………………………………………………………..12
Table 3. Some PAHs and their fluorescence excitation and emission wavelengths……………..23
Chapter 2: Experimental Methods
Table 1. Excitation and detection wavelengths of the radicals corresponding to their
transitions………………………………………………………………………………………..55
Table 2. Specifications of Nd:YAG laser……………………………………………………….62
Table 3. Specifications of tunable dye laser…………………………………………………….65
Table 4a. Rate coefficients (cm3 s-1) of the validation reactions compared to published
literature………………………………………………………………………………………….73
Table 4b. Rate coefficients (cm3 s-1) for validation of the high temperature setup……………..74
Chapter 3: Reaction of the OH Radical with Phenylacetylene
Table 1. Cross-section of phenylacetylene at 266 nm, molar fraction of phenylacetylene in
helium and standard deviation for each set of experiment………………………………………86
Table 2. Rate coefficients (cm3 s-1) for the OH reaction with various mono-substituted aromatic
rings………………………………………………………………………………………………99

xx
Table 3. Enthalpy of reaction for the abstraction and H-loss channels of OH +
Phenylacetylene………………………………………………………………………………...100
Chapter 4: Reaction of the OH Radical with Fulvenallene
Table 1. Physical properties of the reactant and products……………………………………...109
Table 2. Vibrational assignments of the observed gas phase fulvenallene absorption bands….117
Table 3. Wavenumber, calculated dipole strength, and measured intensity for fulvenallene and
homophthalic absorption bands. The ratio of the molar fractions is calculated using equation
2…………………………………………………………………………………………………121
Table 4. Rate coefficient and fulvenallene number density for single kinetic measurements, and
averages values. Symbols refer to the experiments performed with the same gaseous
mixture………………………………………………………………………………………….125
Table 5. Reaction enthalpy for the abstraction and addition channels of OH + Fulvenallene
calculated using the CBSQB3 method………………………………………………………….128

xxi
List of Symbols and Abbreviations
Chapter 1: Introduction
VOCs Volatile Organic Compounds
NSOs Nitrogen, Sulfur, and Oxygen
FAME Fatty Acid Methyl Ester
PPO Pure Plant Oil
DI Direct Injection
IDI Indirect Injection
SI Spark Ignition
CI Compression Ignition
ICE Internal Combustion Engine
NOx Nitrogen Oxides
SOx Sulfur Oxides
HCs Hydrocarbons
PM Particulate Matter
IR Infrared
PAH Polycyclic Aromatic Hydrocarbon
LTC Low Temperature Combustion
PPCI Partially Premixed Compression Ignition
HACA Hydrogen Abstraction Acetylene Addition
UV Ultraviolet
RSRs Resonance-Stabilized Radicals
K Kelvin
PLP-LIF Pulsed Laser Photolysis-Laser Induced Fluorescence
Pa Pascal

xxii
Chapter 2: Experimental Methods
UHP Ultra-High Purity
CGA Compressed Gas Association
CF Conflat
iQDP iQ Dry Dump
iQMB iQ Mechanical Booster
m3hr-1 Cubic Meter per Hour
rpm Rotations per Minute
MFCs Mass Flow Controllers
SSR Solid State Relays
NVOC Natural Volatile Organic Compound
Nd:YAG Neodymium Yttrium Aluminium Garnet
PLP Pulsed Laser Photolysis
LIF Laser Induced Fluorescence
ppm Parts per Million
nm Nanometer
ns Nanosecond
FWHM Full Width Half Maximum
KBP Potassium Pentaborate
BBO β-barium Borate
ps Picosecond
M Molar
PMT Photomultiplier Tube
mA/W Milliamperes/Watts
A/W Amperes/Watts
xxiii
µs Microsecond
DG Delay Generator
PC Personal Computer
GPIB General Purpose Interface Bus
HPLC High Performance Liquid Chromatography
Chapter 3: Reaction of the OH Radical with Phenylacetylene
sccm Standard Cubic Meter per Minute
INT Intermediate
Chapter 4: Reaction of the OH Radical with Fulvenallene
kJ Kilojoule
Abs Abstraction
PTFE Polytetrafluoroethylene
NMR Nuclear Magnetic Resonance
MHz Megahertz
HSQC Heteronuclear Single Quantum Coherence
HMBC Heteronuclear Multiband Coherence
1D One Dimensional
2D Two Dimensional
NOESY Nuclear Overhauser Effect Spectroscopy
FTIR Fourier Transform Infrared Spectroscopy
L Liter

1
Chapter 1: Introduction
1.1 Combustion
During combustion the chemical energy of fuel molecules (solid, liquid, and gas) is
converted into usable energy such as heat or work. In the case of complete combustion the
reaction of a fuel with an oxidizer in the presence of nitrogen generates carbon dioxide and water
along with the production of energy as shown in scheme 1.
Fuel (hydrocarbons) + Air (O2 and N2) → CO2 + H2O + N2 + Energy
Scheme 1. Complete combustion of hydrocarbon fuels
In the case of incomplete combustion, the fuel does not burn completely due to the
limited amount of oxygen and therefore generates various products along with the production of
energy as shown in scheme 2.
Fuel (hydrocarbons) + Air (O2 and N2) → unburned hydrocarbons + NOx (nitrogen oxides) + CO
+ particulates (particulate matters) + CO2 + H2O + VOCs (volatile organic compounds-benzene,
ethylbenzene, cyclopentane, propene, etc.) + Energy
Scheme 2. Incomplete combustion of hydrocarbon fuels
About 90% of the worldwide energy is obtained from the combustion of fuel.1 In
practice, combustion of fuel in internal combustion engines is incomplete, therefore releasing
less energy and more undesirable products. The fuel efficiency of modern gasoline engines is
only about 14-30%.2 In order to increase the efficiency of engines and minimize pollutants it is
crucial to obtain a full understanding of the chemical reactions governing combustion chemistry.

2
This requires investigating the thermochemistry, kinetics, and reaction mechanism of this
complex chemical system.
Combustion byproducts, especially soot, have drawn much interest owing to their adverse
health effects. Soot formation is poorly understood due to the limitation of accurate experimental
reaction kinetics as well as the lack of knowledge about the elementary reaction mechanisms
leading to molecular growth. These key parameters contribute to the inaccuracy of combustion
models that are used to optimize the efficiency of engines and reduce emissions. In addition,
improved combustion, towards complete oxidation of the hydrocarbon fuels will help reducing
fuel consumption and achieve clean emissions from combustion devices.3
D.P. Mishra1 defines fuels as being compounds that can donate electrons and oxidizer as
compounds that can accept electrons. In other words, the molecule with higher electronegativity
acts as an oxidizer whereas that with the lower electronegativity acts as a fuel. The most
important oxidizer is undoubtedly the oxygen present in air.
1.2 Types of Fuels
Fuels can be categorized into conventional and non-conventional or alternative
resources.4
1.2.1 Conventional Resource – Upon consumption, a conventional resource cannot be
replenished by natural means. Fossil fuels are the most widely used conventional resources
especially for use in transportation. Fossil fuels were formed 300 million years ago.5 Organisms,
plants, and animals died, decayed, decomposed, and were buried by earth materials for several
million years. After several million years, the decomposed material formed organic matter that
eventually led to fossil fuels.5

3
Fossil fuels are mainly carbon-based fuels such as coal, oil or petroleum, and natural gas.
These have been the dominant source of energy providing over 80% of the total energy for
hundreds of years.6,7 In this dissertation, only petroleum and natural gas are discussed.
1.2.1.1 Petroleum - Petroleum (crude oil) is the primary source of energy production.8 It
is a yellow to black viscous liquid containing mainly carbon (82-87%) and hydrogen (11-15%)
along with other elements such as oxygen (<1.5%), nitrogen (<1.5%), and sulfur (<6%) in small
amount. Alkanes are the main constituents of petroleum and contain numerous isomers.9
Petroleum comprises of alkanes, cycloalkanes, aromatics, and heteroatomic compounds
containing nitrogen, sulfur, and oxygen (NSOs).
Alkanes may be straight chained or branched. The number of carbon atoms ranges from
C1 to C78. Alkenes and alkynes are not found initially but they result from various refinery
processes. Cycloalkanes are mostly found in the form of cyclopropane (C3H6), cyclobutane
(C4H8), cyclopentane (C5H10), and cyclohexane (C6H12). Aromatic compounds in petroleum vary
from 10 to 50%. Aromatics include single ring compounds e.g. benzene, toluene, xylene and its
isomers, and mesitylene (1,3,5-trimethylbenzene) and condensed ring forms e.g., naphthalene,
anthracene, phenanthrene, pyrene, etc. referred to as polycyclic aromatic hydrocarbons.9
One of the important fuels obtained from petroleum during the distillation of oil is diesel.
Diesel is cheaper but lower quality than gasoline (the first distillation product of oil). The
molecules in diesel fuels are larger e.g., alkylated naphthalenes and n-alkanes are desirable e.g.,
hexadecane (C16H34). High boiling components such as polycyclic aromatic hydrocarbons are
undesirable products. Biodiesels made from vegetable oils, animal fats or grease wastes are

4
known to be less pollutant. The elements present in biodiesel are C (76%), H (13%), O (11%), N
(0%), and S (0%).9
The quality of diesel fuel is measured by the cetane number. A high cetane number
corresponds to faster ignition of the fuel. For the same number of carbons the cetane number
ranks according to n-alkanes>alkenes>cycloalkanes>alkylaromatic. For alkanes, the cetane
number drops as the number of carbons decreases. Diesel is more efficient than gasoline and is
used specifically in diesel engines. Diesel engines are a type of internal combustion engine that is
used in cars, trucks, busses, trains, boats, and agricultural vehicles. Marine ships use heavier
diesel engines than those used for automobiles and trucks.
1.2.1.2 Natural Gas - The elements present in natural gas are C (76%), H (18%), O
(<2%), N (<5%), and S (<1%) with methane as the main constituents. Other alkanes such as
ethane, propane, butane, and pentane are present as well as nitrogen, carbon dioxide, hydrogen
sulfide, and helium.10 It is used in water heaters, cooking stoves, gas turbines and some engines.
It is also used to produce hydrogen, ammonia, sulfur, carbon black, and ethylene (another
petrochemical product).10
Natural gas is found under pressure in rock reservoirs. It is formed by the degradation of
organic materials accumulated for millions of years. Natural gas can be formed at shallow depths
by the anaerobic decomposition of sedimentary organic material at low temperature. It can also
be formed at deeper depths by thermal cracking of sedimentary organic material into
hydrocarbon liquid and gas (oil in conjunction with gas-primary gas) and thermal cracking of oil
at high temperatures (secondary gas).10

5
1.2.2 Non-Conventional Resource - Non-conventional sources can be replenished quickly
and energy obtained from these sources is believed to be cleaner compared to fossil fuel energy.
Biofuels are an example of alternative fuels.
1.2.2.1 Biofuels and its Types - Biofuels are liquid (e.g., methanol, ethanol, and
biodiesel) or gaseous (methane and hydrogen) fuels derived from biomass. Biomass is an organic
material obtained from living organisms especially plants or plant based materials e.g., trees,
grasses, agricultural crops that are not used as food.11 The sources of biomass are also called
feedstocks. Some examples of feedstocks are oilseed crops, sawdust, black liquor (byproduct of
paper making process), cheese whey (byproduct of cheese making process), vegetable oils from
plant sources for biodiesel, and animal manure, fats, oil, greases, unused wood from
construction, packaging wastes, solid wastes, and landfill gases.11 Based on feedstock and
utilization, biofuels can be divided into two categories: First generation and second generation.12
(i) First Generation - These biofuels are derived from materials such as sugar, starch,
esters of glycerol, free fatty acids and glycerides (fats and vegetable oils), and fatty
acids, cellulose, hemicelluloses, and lignin (wood for solid biofuels). Some of the first
generation biofuels are bioalcohols (e.g., methanol, ethanol, propanol, butanol), fatty
acid methyl ester (FAME or biodiesel) and pure plant oil (PPO).
(ii) Second Generation - These are derived by utilizing unused land and consuming
wastes. Feedstocks e.g., lignocellulosic material from byproducts of agriculture such
as rice husk, sawdust, corn rub etc. are used for the second generation biofuels.13
High organic contents in wastes possess high amount of carbohydrates and protein.
Anaerobic digestion of wastes makes it suitable for bioenergy production.14

6
The most common biofuel is ethanol15 and the key feedstocks to produce ethanol are
corn, sugarcane, wheat, sugar beet, soybean, palm oil.16 The main advantage of using ethanol is
its economic value and feasibility to produce in high yield.
1.3 Types of Combustion Engines
Combustion engines are devices that use heat and pressure released by the combustion
chemical reaction to generate mechanical energy that can be used to run automobiles or
industrial machines. In internal combustion engines the chemical energy from the chemical
reaction is directly utilized to do mechanical work.3,17 Here, internal combustion engines are
briefly discussed as they are dominant in vehicles.
The reciprocating piston-cylinder configuration is the most popular internal combustion
engine with the aim of achieving high work output with a high efficiency. In this configuration, a
piston moves back and forth in a cylinder transmitting power through the rod. Flow of gas into
and out of the engine is controlled using valves or ports. This reciprocating engine can be
designed to operate in four or two strokes.18 In this dissertation only four-stroke engine will be
discussed as they are the most efficient. Four-stroke engine completes its one cycle in four steps.
Figure 1a shows the intake and compression strokes of four stroke engine.
(A) Intake stroke – During this stroke the inlet valve is open and the piston moves down the
cylinder. Air or premixed fuel is sucked in. The exhaust valve remains closed.
(B) Compression stroke – During this stroke both valves remain closed and the piston moves
upward compressing the mixture of air and fuel. As the piston reaches almost the top
part, ignition occurs.

7
Figure 1a. First rotation of four stroke engine (A) Intake stroke (B) Compression stroke19
Figure 1b shows the power and exhaust strokes that occur in four-stroke engine
(C) Power stroke - Both intake and exhaust valves are closed. The combustion flame propagates throughout the space of the cylinder raising the pressure and temperature. The piston is forced down. At the end of power stroke, the exhaust valve opens.
(D) Exhaust stroke - Exhaust valve remains open and the piston moves upward forcing the emission of remaining gasses and particulate matters. At its end the exhaust valve closes.
Figure 1b. Second rotation of four stroke engine (C) Power stroke (D) Exhaust stroke19
These two cycles in the four stroke engine are repeated rapidly during the operation.
The two main types of four stroke internal combustion engines are:18
(i) Spark Ignition (SI) or Otto Engine - The fuel is ignited by a spark and the engine
completes the cycle as described in four stroke engine.
When the engine is working, controlled air enters through the throttle and is evenly gets
distributed in all the cylinders as the piston moves back. The fuel is injected through the intake
8
port or valve and the fuel air are mixed homogeneously in the cylinder. The homogeneous
mixture is then compressed by the inward movement of the piston. The spark ignites the mixture
raising its pressure and temperature. The flame extinguishes as it reaches the walls of the
cylinder. The huge pressure developed forces the piston back again due to the expansion of the
gaseous mixture. At the end, the exhaust gaseous mixture is expelled through the exhaust valve.
(ii) Compression Ignition (CI) or Diesel Engine - In the diesel engine, a high rise in
temperature and pressure due to high compression spontaneously ignites the fuel-air
mixture. During the compression stroke, air is compressed beyond the autoignition
temperature of the fuel. Then the diesel spray evaporates, mixes, ignites, and burns.17
Diesel fuel can be burned in the compression engine by direct injection (DI) method or
indirect injection (IDI) method.17 In the indirect injection method, air is compressed in the pre-
reaction chamber during the compression stroke. This creates a turbulent flow and the sprayed
diesel mixes well. An increase in pressure in the pre-reaction chamber that is greater than that in
the main chamber initiates the ignition of the fuel-air mixture. The flame makes its way to the
main chamber resulting in a swirling turbulent flame. Because automobiles operate over a wide
range of speeds, the indirect injection method is used whereas in ships, trucks, and electric power
generation, the direct injection method is used.
Diesel engines have higher compression ratios than spark ignition engine. This results in
better fuel–air mixing ratio and ignition that leads to higher power and better efficiency. The
knock is lower than in SI engine because of fuel mixing prior to ignition. Knock is the pinging
sound produced inside the engine due to incorrect fuel-air mixture. Still, because of reduced
mixing time compared to SI engine, the combustion is incomplete leading to decreased power.3

9
Besides internal combustion engines, there are other methods for power generation such
as wind turbines, water turbines, steam turbines and gas turbines.
(iii) Gas Turbines - Turbines operate through spinning motion. Gas turbines are the most
popular turbines and are based on the same principle as internal combustion engines.
They have high efficiency (nearly 500 kW more than internal combustion engine,
ICE) and power per weight. These gas turbines are used to power aircrafts, trains,
ships, electric generators, etc.
A Gas turbine consists of a compressor-burner-turbine combination. It consists of a
primary zone for combustion that requires compressed air (20-30%). This region has a high
pressure and temperature. The secondary zone is mainly for the exhaustion of the remaining
gasses and byproducts. Basically, a fuel-air mixture is compressed in the primary zone and then
ignited to produce high pressure. The gas is then expanded to make the turbine move. Spinning
of turbine makes the propeller move or spin the shaft in vehicular application and is used for
power generation. Figure 2 shows the simple schematic of a modified version of a gas turbine. A
diffuser (not shown in the figure) is added to reduce the air inlet velocity that makes primary and
secondary air section. A flame holder is inserted to allow enough reaction zone and for
stabilization. The geometry is conical in inlet and outlet for uniform gas discharge temperature.
Fuel nozzle is also designed to provide conical spray of fuel droplets.3
Figure 2. Modified gas turbine3

10
1.4 Combustion Byproducts
Fuels burn completely or incompletely and generate products along with the production
of energy. In internal combustion engines, the fuel does not burn completely and various
products are generated. These unwanted byproducts result mainly from the combustion of fossil
fuels and biofuels20 and are considered as the primary pollutants. The most important pollutants
are summarized in table 1.
Table 1. Major combustion byproducts as pollutants
Pollutants Nitrogen Oxides (NOx)21
Carbon Monoxide (CO)
Hydrocarbons (HCs)
Particulate Matter (PM)22
Composition Mainly comprise NO and NO2
-- mainly formaldehyde, acetaldehyde, 1,3-butadiene, and benzene
Mixture of solid carbon material or soot and organic materials consisting of hydrocarbons and their partial oxidation products e.g. polycyclic aromatic hydrocarbons. smoke, soot
Characteristic NO is colorless and NO2 is brown gas. Both are toxic and play a role in producing photochemical smog
Colorless, odorless gas, toxic, even fatal in high concentration, bonds with hemoglobin interfering with oxygen transport, oxidizes to CO2
Hydrophobic, highly flammable, toxic
Fine (<2.5 μm in size) rather than coarse (10-2.5 μm),17 toxic
Origin Nitrogen and oxygen dissociate into their atomic forms and NOx are formed. NO oxidizes to NO2. An example of NO and NO2 formation.23 O + N2 ↔ NO + N NO + O ↔ NO2
During engine warm up, limited evaporation of fuel leads to a greater CO emission.24 Another source is the decomposition of CO2 at high temperatures.
Unburned hydrocarbon fuels emitted during the start-up and warming stage due to limited evaporation and oxidation of the fuel.
Initiates from the reaction of small radicals, molecules with fuel during combustion

11
NOx and SOx affect the environment by forming acid rains as shown in scheme 3 and 4
respectively.
NO2 + OH (from water vapor) + hν → HNO3
Scheme 3. Formation of nitric acid (HNO3)21
SO2 + H2O → H2SO3 and SO3 + H2O → H2SO4
Scheme 4. Formation of sulfurous (H2SO3) and sulfuric (H2SO4) acids21
These NOx are also responsible for increasing the ground level ozone concentration,
which is a component of photochemical smog (mixture of nitrogen oxides, ground level ozone,
volatile organic compounds, etc.). These acid rain and smog damage forests, streams and
agricultural products.
CO is produced mostly in fuel rich combustion and contributes to smog production by
reacting with oxygen and nitrogen in the exhaust stream and atmosphere. It also contributes to
increasing the concentration of CO2 by reacting with O2 and NO as shown in scheme 5.17 Excess
CO2 produced in the atmosphere absorbs infrared (IR) light escaping from the Earth’s
atmosphere and contributes to Earth greenhouse effect.
CO + 1/2O2 → CO2 and NO + CO → 1/2N2 + CO2
Scheme 5. Formation of carbon dioxide
Exposure to the emissions from combustion has several health effects to humans. These
pollutants affect respiration, skin, eyes, nose, lungs, liver, kidneys, and stomach. Long exposure
can even lead to death. For example, CO has 200 times more affinity to hemoglobin than

12
oxygen. When CO is inhaled CO binds with hemoglobin to form carboxyhemoglobin making the
tissues oxygen deficient. CO poisoning is the most common fatal air poisoning. The health
effects of combustion emissions are summarized in table 2.
Table 2. Health effect of pollutants from combustion of fossil fuels and biomass adapted
from Smith et.al.25 and Naeher et.al.26
Pollutant Health effect Nitrogen oxides (NOx) Respiratory problem (bronchial reactivity), increased susceptibility to
bacterial and viral lung infections Carbon monoxide (CO) Reduced oxygen delivery to tissues owing to formation of carboxyhemoglobin, can be acutely fatal
Sulfur oxides (SOx) Respiratory problems (bronchial reactivity), reduces nose sensitivity Particulate matter and soot Eye irritation, Bronchial irritation, inflammation, increased reactivity,
increased cardiovascular mortality Organic air pollutants: Benzene Acetaldehyde Phenols Formaldehyde, 1,3-butadiene, Cresols PAHs (Pyrene, Benzopyrene Benzo(a)pyrene Dibenzopyrenes, Dibenzocarbazoles)
Respiratory problems Carcinogenicity Co-carcinogenicity Mucus coagulation, cilia toxicity
Short term effects-eye and skin irritation27, nausea27, vomiting and diarrhea (high concentration)27, Inflammation Long term effects-Skin, lung, bladder, and gastrointestinal cancers, DNA, cataracts, liver and kidney damage Gene mutation cell damaging and cardiopulmonary mortality Asthma28, Increased allergic sensitization
1.5 Low Temperature Combustion (LTC): A Way to Improve Combustion Devices
Extensive research has focused on low temperature combustion that could mitigate
pollutants and alleviate efficiency of engines. LTC combines the advantages of both spark
ignition and diesel compression engines by using auto ignition in lean and homogeneous fuel-air
mixture.17 Spark ignition engines operate at low compression ratio with increased pumping loss
whereas diesel engines have high compression ratio and higher efficiency.29 In LTC, as no spark
plug is required, it is possible to inject very low fuel concentrations and maintain low

13
temperatures (<2000 K) throughout the entire combustion process. Overall this leads to fuel
economy and reduced NOx and carbon emissions.29.
In LTC, after autoignition, the flame propagates as well as ignites at various spots in the
chamber and the combustion duration is shorter while still releasing more energy. Because of
homogeneous mixture, initiation of ignition is kinetically controlled rather than diffusion
controlled as in non-premixed mixture.17 So cylinder temperature, pressure, and fuel composition
play important role in initiating the ignition. Use of partially premixed lean fuel-air mixture,
often referred as partially premixed compression ignition (PPCI), reduces the amount of soot in
the exhaust by increasing the combustion duration.30 This also reduces the high-pressure rise
allowing partial mixing of fuel inside the cylinder.
Under very lean fuel conditions, incomplete combustion at temperatures lower than 1500
K still lead to the formation of large hydrocarbons.31,32 The development of low-temperature
technologies is therefore partially limited by the lack of understanding of molecular growth and
especially PAH formation. One other advantage of LTC is that it can be operated with liquid and
gaseous fuels.
1.6 Combustion Chemistry
Combustion chemistry is initiated by the reaction of abundant fuel molecules with air
(O2/N2) at high temperatures and pyrolyzes to give reactive intermediate species. These
intermediate species, mostly small radicals and atoms, are responsible for propagating the
chemical reactions leading to molecular growth. During this complex chemical transformation,
molecular bonds are broken and new bonds are formed resulting in heat release that can be used
for mechanical works. Developing a fundamental understanding of the chemistry of these

14
intermediates is vital in order to develop new combustion strategies with lower pollutant
emission and higher efficiency.
1.7 Important Species in Combustion
The most important reactive intermediates in fuel chemistry are radicals. They are odd
electron species resulted from the homolytic cleavage process initiated by heat or chemical
reaction with a reagent. Radicals are electrically neutral and highly reactive. There are hundreds
of chemical species and hundreds/thousands of chemical reactions that arise from these species
in combustion environments. Small radicals such as hydroxyl (OH)33-35, methylidene (CH)33,34,36,
cyano (CN)36,37, propargyl (C3H3)38,39, and allyl (C3H5)40 have been observed to be the key
species in combustion engines and flame. Wang and Frenklach41 and Marinov et.al.42 have
included several hundreds of radical reactions in their combustion model. Similarly, Norinaga
et.al.43 have included 227 species and 827 reactions in their chemical scheme over the 1073-1300
K temperature range.
These radicals are responsible for the formation of key hydrocarbons in combustion, and
especially aromatic species. Benzene is present in flames17,44,45 and is widely accepted to be
formed by the self-recombination of propargyl radicals.46-48 The recombination of propargyl
could also form phenyl or C6H6 isomers.48 The reaction of benzene with C2H radical may form
phenylacetylene through an addition/H-loss mechanism.49,50 According to the hydrogen
abstraction acetylene addition (HACA) mechanism (described in section 1.10.1), benzene may
further react with atomic hydrogen to give the phenyl radical (C6H5) and molecular
hydrogen.41,51,52 The reaction of phenyl radical with acetylene followed by H-loss leads to the
formation of phenylacetylene (C6H5CCH).
15
Larger radicals such as fulvenallenyl (C7H5)53 and cyclopentadienyl (C5H5)54,55 have also
recently been proposed as important intermediates in combustion. Theoretical investigations
predict that the fulvenallenyl radical may be formed by hydrogen abstraction from53 or
unimolecular decomposition of fulvenallene (C7H6),56,57 which is the main toluene
(C6H5CH3)56,58-60, benzyl (C6H5CH2)61-64 pyrolysis and photolysis products.65 This dissertation
focuses on the reaction of hydroxyl radical (OH) with phenylacetylene (C8H6) and fulvenallene
(C7H6).
1.8 OH Radical Reaction Scheme
The OH is a key radical in combustion, as it contributes to the oxidation of fuel
molecules as well as to the propagation of the radical reaction schemes. The reaction
mechanisms characteristic of the hydroxyl radical are (i) abstraction, (ii) addition, and (iii)
association.
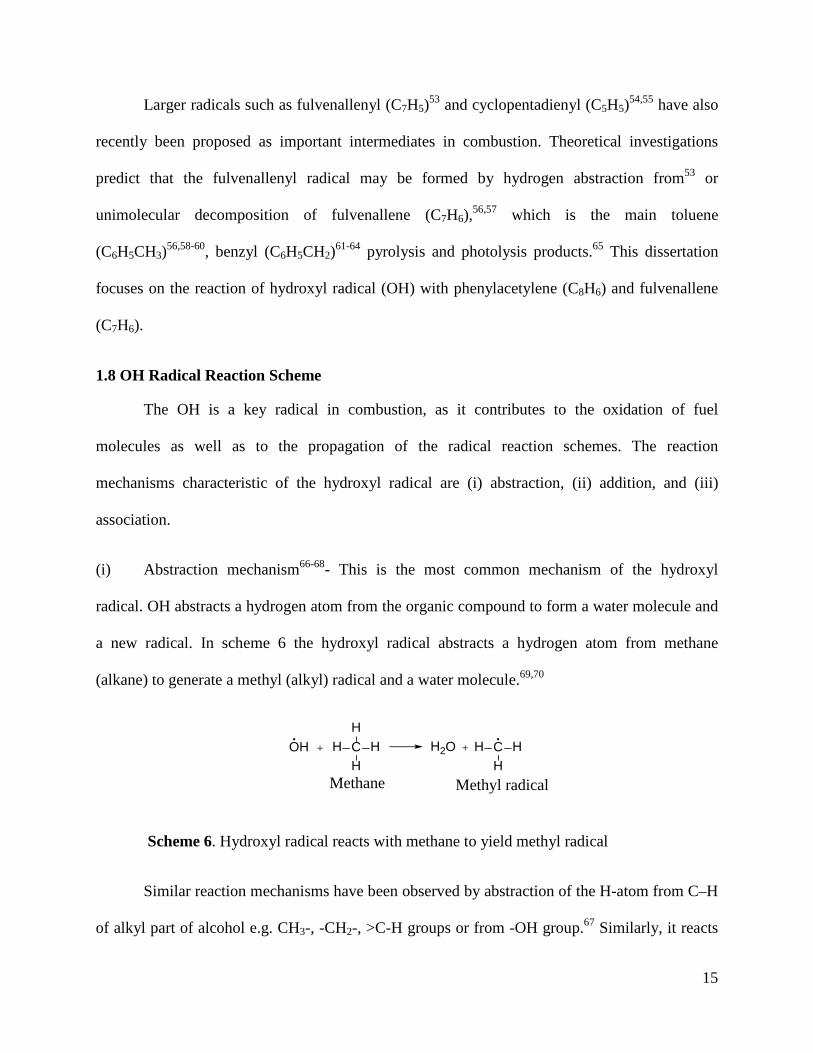
(i) Abstraction mechanism66-68- This is the most common mechanism of the hydroxyl
radical. OH abstracts a hydrogen atom from the organic compound to form a water molecule and
a new radical. In scheme 6 the hydroxyl radical abstracts a hydrogen atom from methane
(alkane) to generate a methyl (alkyl) radical and a water molecule.69,70
OH H2OCH
HH
H CHH
H
Methane Methyl radical
Scheme 6. Hydroxyl radical reacts with methane to yield methyl radical
Similar reaction mechanisms have been observed by abstraction of the H-atom from C–H
of alkyl part of alcohol e.g. CH3-, -CH2-, >C-H groups or from -OH group.67 Similarly, it reacts

16
with aldehydes and ketones, mostly by abstracting hydrogen atom from –C(O)H or -C(O)R to
form water and new radical as shown in scheme 7.71
CH
HH
CH
OOH H2O
Acetaldehyde Acetyl radical
CH
HH
CO
Scheme 7. Hydroxyl radical reacts with acetaldehyde to form acetyl radical
(ii) Addition mechanism66-68-The OH radical can also add to unsaturated carbon to form an
adduct.
In scheme 8 hydroxyl radical reacts with ethylene to form an adduct.72,73
OH C CH
H
H
HC C
H
HHH
OH
Scheme 8. Hydroxyl radical reacts with ethylene to form OH-ethylene adduct
In the case of acetone as shown in scheme 9, studies suggest that the reaction proceeds
via addition74 to form acetic acid through CH3 elimination.
OH CO
CH3 CH3CO
CH3 OH
Acetone Acetic acid
CH3(CH3)2C(OH)O
Association complex
Scheme 9. Hydroxyl radical reacts with acetone to form an adduct and acetic acid
through CH3 elimination

17
(iii) Association mechanism – In this case the reaction proceeds through the formation of
a pre-reactive complex or Van der Waal’s complex between the OH and the
unsaturated hydrocarbon. In scheme 10, the OH radical associates with the benzene
ring.75
OH OH
Scheme 10. Hydroxyl radical reacts with benzene to form Van der Waals association
complex
1.8.1 The Temperature Dependence of the Different Reaction Channels
The reaction rate coefficients for the abstraction, addition, and association channels are
dependent on temperature. The abstraction channel often proceeds through a transition state
above the energy of the reactants. This results in a reaction rate coefficient that increases with
increasing temperature, following the Arrhenius equation. Figure 3 shows the temperature
dependence of the OH + benzene reaction rate coefficient measured experimentally by Tully
et.al.75 The reaction rate coefficient increases with increasing temperature above 500 K likely
due to increasing contribution of the abstraction of H atom from benzene by the OH radical.

18
Figure 3. Temperature dependence for the reaction of OH with benzene.75
For addition mechanisms, often the reaction rate coefficient decreases with increase in
temperature due to the formation and decomposition of a barrierless activated complex at the
entrance channel. Figure 4 shows the temperature dependence of the reaction rate coefficient of
OH + propene investigated experimentally by Vakhtin et.al.72 The reaction rate decreases with
increase in temperature due to the formation of OH-propene adduct which dissociates back to the
reactants at higher temperature.
Figure 4. Temperature dependence for the reaction of OH with propene.72

19
1.8.2 The Effect of Pressure on the Stabilization of the Adduct.
In scheme 11 the hydroxyl radical reacts with propene to form an energy-rich association
adduct.72 This adduct has three pathways:
i. It can decompose back to the reactants
ii. It can form products
iii. It can form stabilized adduct by colliding with buffer gas.
OH C3H6 C3H6OHC3H6O H
C3H5 H2O
C3H7O
k4 M
k+OH
k-OH
ki
Scheme 11. The reaction of hydroxyl radical with propene72
Applying steady-state approximation and pseudo-first order approximation, the kmeasured
of scheme 11 is given by equation 1. During the experiment, the value of kmeasured is obtained.
OH4i1iOH
4i1imeasured k.
]M[kkk
]M[kkk +
=−
=
+Σ+
+Σ= Eq. (1)
For ideal gas
TKP]M[B
= Eq. (2)
Where [M] is the concentration of buffer gas, P is the pressure of the reaction, KB the Boltzmann
constant, and T the temperature in Kelvin.

20
Since the concentration of the buffer gas is proportional to the pressure, kmeasured is related
to the pressure. At low pressure, a large fraction of the adduct decomposes back to the reactants
reforming OH and leading to a lower apparent rate coefficient. As the pressure increases more
adduct molecules are stabilized leading to less OH formation and an increasing apparent rate
coefficient. At high pressure, the adduct is rapidly quenched to stable products without
decomposing back to the reactants. In this case, the measured rate coefficient appears to be
independent on pressure. Figure 5 shows the reaction rate of propene as a function of total
number density which is proportional to pressure. The black points are the data from Vakhtin
et.al.72 and red points are the data taken during the validation of the experimental set up in the
new laboratory. At low pressure, the reaction rate increases with the pressure whereas at high
pressure, the reaction rate is independent of pressure.
Figure 5. The reaction rate of propene as a function of total density of the gas
1.9 First Ring Formation and Carbon Molecular Growth
The formation of the first aromatic ring, benzene, from aliphatic radicals and molecules
in combustion environments is a crucial step toward the formation of polycyclic aromatic
hydrocarbons. The most widely accepted route for the formation of benzene is the self-

21
recombination of propargyl (C3H3) radicals.42,76-81 This step is believed to be the rate limiting
step during the formation of polycyclic aromatic hydrocarbons. Scheme 12 shows the formation
of benzene or phenyl radical from two propargyl radicals as suggested by the above studies.
Scheme 12. Propargyl radical self recombines to form benzene or phenyl radical
The ease of benzene formation from the recombination of propargyl radicals is
attributed to the barrierless pathway. Based on theoretical calculations by Georgievskii et.al.47,
the exit channel of the recombination reaction of propargyl radicals is barrierless. In addition, the
potential energy surface calculated by Miller and Klippenstein48,82 shows low-energy reaction
paths with no energy barrier from the recombination reaction of propargyl leading to benzene or
phenyl + H.
The first ring benzene may also be formed by the hydrogen-atom assisted isomerization
of fulvene. In scheme 13 (i) a propargyl radical combines with an allyl radical to form fulvene
(C5H4CH2). Under fuel-rich conditions, H atom assisted isomerization leads to benzene
formation.83,84 (ii) Cyclopentadiene reacts with CH3 to form C5H4CH3 which loses an H atom to
form fulvene. This leads to the formation of benzene by hydrogen atom assisted isomerization.85-
87
C3H3 C3H3 C3H3 C3H3 Hor
Benzene Phenyl radical

22
C3H3 C3H5 2HC5H4CH2
H
H
CH3 C5H4CH3 H
(i)
(ii)
+ H
- H
H
Scheme 13. Hydrogen-atom assisted isomerization of fulvene to benzene
Alternatively, the propargyl radical may react with abundant gaseous acetylene (building
block) to form cyclopentadienyl (c-C5H5) radical. This cyclopentadienyl radical reacts rapidly
and forms benzene as shown in the scheme 14 below.85
C3H3 + C2H2 → c-C5H5 + CH3 → C6H7 + H → C6H6 (benzene) + 2H
Scheme 14. The reaction of propargyl radical with acetylene to generate benzene
1.10 Formation of Polycyclic Aromatic Hydrocarbons (PAHs)
Polycyclic aromatic hydrocarbons (PAHs) are the organic compounds made up of
carbons and hydrogens forming two or more fused aromatic ring structures. They can be
categorized into two types: low molecular weight and high molecular weight PAHs.28 Those
containing less than four fused or condensed rings e.g., naphthalene, anthracene, phenanthrene,
etc. are low molecular weight PAHs and those containing more than four fused aromatic rings
e.g., pyrene, benzo (a)-anthracene, etc. are high molecular weight PAHs. According to Masih
et.al.88 their physical properties vary depending on their size and structure. In general, pure PAHs

23
are crystalline and lipophilic in nature implying they dissolve well in organic solvents. They are
stable, light sensitive, heat and corrosion resistant.88 Being most stable at high temperature in the
combustion environment, they are called stabilomers.89 They have a specific UV absorption
spectrum. The fluorescence excitation and emission wavelengths in nanometers of some PAHs
are given in the table 3.
Table 3. Some PAHs and their fluorescence excitation and emission wavelengths
PAH Excitation wavelength (nm) Emission wavelength (nm) Naphthalene90 273 333 Phenanthrene90 297 340 Anthracene90 295 430 Pyrene90 260 430 Benzo (a)-anthracene90 260 430 Chrysene90 260 430
The major sources of PAHs in our atmosphere are transportation vehicles that use various
fuels.90,91 Figure 6 shows the structures of two, three and four-ringed PAHs formed during fuel
burning processes.
Naphthalene (C10H8) Anthracene (C14H10) Phenanthrene (C14H10)
Pyrene (C16H10) Benzo(a)-anthracene (C18H12) Chrysene (C18H12)
Figure 6. Structures of two, three, and four ringed PAHs

24
1.10.1 The HACA Mechanism
Hydrocarbons growth in combustion environment occurs through the accepted “HACA”
mechanism. HACA stands for “H-abstraction-C2H2-addition” (hydrogen-abstraction-acetylene-
addition).92 This mechanism proceeds through repetitive two steps: (i) abstraction of a hydrogen
atom and (ii) addition of an acetylene molecule. The abstraction often occurs though the reaction
with a hydrogen atom to form H2 and a hydrocarbon radical.41,51 In scheme 15 gaseous hydrogen
atom abstracts hydrogen atom from the benzene ring to form the phenyl radical hydrogen.
H H2
Scheme 15. Benzene reacts with gaseous hydrogen atom to form phenyl radical
An acetylene molecule can then add to the phenyl radical to form phenylacetylene
through H-atom elimination. Phenylacetylene can further react to give the naphthalene and
acenaphthylene as shown in scheme 16.93
C2H2+ H
-H -H2
+ C2H2
+H
+C2H2
Naphthalene
Acenaphthylene
+ H .........
Scheme 16. The phenyl radical leading to the formation of naphthalene and
acenaphthylene

25
This process can repeat until the formation of two or peri-condensed (three or more)
rings. The entire process is thermodynamically driven by the formation of hydrogen molecule
and the loss of hydrogen.92
This HACA mechanism has been recently observed experimentally by Parker et.al94 who
probed phenylacetylene intermediate and naphthalene using photoionization mass spectrometry
under combustion-like environment at 300 Torr pressure and 1020 ± 100 K temperature. Scheme
17 shows the HACA reaction pathway proposed by Parker et al. for the formation of naphthalene
After the formation of the phenyl radical, its reaction with acetylene forms the styrenyl radical.
Further reaction with acetylene forms naphthalene. In this mechanism there is no need for second
H-abstraction from phenylacetylene. Alternatively, o-vinylphenyl radical can be formed by
isomerization of styrenyl radical. O-vinylphenyl radical on reacting with acetylene forms
naphthalene.
C2H2
CHC
H
CHCH
H
+ C2H2
+ C2H2
Isomerization
Styrenyl radical
o-vinylphenyl radical
Naphthalene
Scheme 17. Formation of naphthalene through the HACA mechanism

26
Benzene can also react with the phenyl radical to form biphenyl as shown in scheme 18.
Further reaction with acetylene can lead to the formation of phenanthrene.92,95,96
Scheme 18. Phenyl radical reacting with benzene to form biphenyl and biphenyl radical
reacting with acetylene to form phenanthrene
The HACA mechanism can also be initiated through reaction with other radicals. Scheme
19 depicts the formation of large polycyclic molecules initiated by the addition of the OH radical
on phenylacetylene.97 The initially formed adduct may react with gaseous acetylene to form a
naphthyl radical through water elimination. This naphthyl radical can again react with gaseous
acetylene to form acenaphthylene or lead to the pathway forming phenanthrenyl radical.
COH
- H
- H
+ C2H2 + C2H2
- H + C2H2
+ H
- H2- H
+ C2H2
OHH
- H2OAcenaphthylenePhenylacetylene Adduct + H
Scheme 19. Hydroxyl radical reacting with phenylacetylene to form phenanthrenyl
radical
H C2H2 H

27
1.10.2 Formation of Soot
Figure 7 shows a proposed schematic representation of the gas phase and heterogeneous
schemes leading to the formation of soot in combustion environments.52 The formation of soot is
initiated in the molecular zone. This zone is the chemically rich area where small radicals (e.g.
C3H3, CH, OH) and molecules (e.g., aliphatic hydrocarbons) are formed. These small radicals
and molecules react with abundant fuel molecules to form aromatic molecules such as benzene in
case of aliphatic fuels such as methane, ethylene, acetylene or butane.52,98 In case of aromatic
fuels, it breaks down into large concentrations of acetylene and benzene. Benzene might react
with C2 and C3 species such as acetylene to form large fused ring aromatic hydrocarbons called
polycyclic aromatic hydrocarbons (PAH described in section 1.10).
Figure 7. Proposed scheme of soot formation (adapted from Richter and Howard52)

28
The smaller PAHs grow into heavy PAHs by reacting with other reactive species. These
heavy aromatic molecules might condense near the particle nucleation region to form nascent
soot particles. This means in the particle nucleation region, PAH species begin to collide and
stick to each other forming PAH dimers.92 PAH dimers collide with PAH molecules to form
PAH trimers or with other PAH dimers to form PAH tetramers. This process continues and the
individual PAH size keeps increasing via molecular growth reactions. Eventually these PAH
clusters evolve into solid (soot) particles.92 Soot particles are believed to have surface radical
sites reacting with gas phase molecules such as acetylene or large aromatic radicals resulting in
surface growth. Soot particles coagulate via particle-particle collisions resulting into aggregates.
The size of soot particles emitted from vehicles varies from 10 to 150 nanometers. Rose
et.al.99 measured the size of soot particles from 30 to 150 nm but the major fraction of soot were
found around 80 nm. Karjalainen et.al.100 investigated the size distribution of exhaust particles in
modern gasoline vehicles and found two modes of non-volatile exhaust particles, one with mean
size of 30 nm and the other with mean size of 70 nm. Their results indicated that these particle
modes consisted of soot but with different morphology. According to Kim et.al.101 the size of
soot particles was less than 100 nm for both diesel and gasoline automobiles.
1.11 Resonance-Stabilized Radicals (RSRs): Alternative Pathways for PAH Formation
1.11.1 Definition and Characteristics
Based on the experimental and kinetic modeling of PAH formation in methane and
ethylene flames, Melius et.al.85 concluded that the HACA process cannot account for the amount
of PAHs formed in flames. Resonance stabilized radicals have recently been proposed as an
alternative route to PAH formation.
Resonance stabilized radicals have an unpaired electron distributed over multiple sites in

29
the molecule resulting in several electronic structures called resonance structures. Due to the
delocalization of the unpaired electron over the molecule, resonance stabilized radicals form
weaker bonds with stable molecules (e.g., oxygen)78,102 compared to other ordinary radicals.
These weak addition complexes are neither stabilized by collisional quenching nor support
rearrangement.82 So RSRs are relatively unreactive and accumulate at high temperature in
combustion environments.
The difference between the energy of the actual radical and its possible resonance
structures is the resonance energy. The extra stability makes the radical thrive in harsh conditions
such as combustion environment where they can accumulate in large concentrations.98 Because
the resonance energy of the radicals may be lost upon their reaction with other radicals or
molecules they are resistant to oxidation and thermal decomposition.53 The most common
resonance stabilized radicals in combustion are propargyl (C3H3), allyl (C3H5), cyclopentadienyl
(C5H5), fulvenallenyl (C7H5), and benzyl (C6H5CH2) radicals. Scheme 20 shows the resonance
structures and respective hybrid structure of fulvenallenyl radical. The real structure of the
radical is an average of all the resonance structures. The stability of fulvenallenyl radical is due
to the conjugated propargyl and cyclopentadiene units,103 making it the most stable C7H5 isomer.
CC
H
CCH
CCH
C
C
H
CCH
CCH
CCH
Scheme 20. Resonance structures of fulvenallenyl radical
Some resonance-stabilized radicals such as cyclopentadienyl and fulvenallenyl have
recently been considered as precursors to polycyclic aromatic hydrocarbon formation through

30
self and cross recombination. The increase in credibility on these radicals is credited to their high
thermal stability and resistance to oxidation in flames while remaining reactive enough.
1.11.2 Current Knowledge on Resonance Stabilized Radical Reactivity
At high concentrations and assuming the rapid reaction rates, RSR may self- or cross-
combine forming larger molecules. Scheme 21 shows the self-recombination of propargyl (C3H3)
radicals to form C6H6 isomers at room temperature.104 Depending on the orientation of the
radicals, it can yield different products.
C CH C CH
HC C H
H
H
H2C C CH
CH2C CH CH
HC
H
HCCH
CH CH2C
H2C C CH
C CH
Scheme 21. Two propargyl radicals forming 1,5-hexadiyne and 1,2-hexadiene-5-yne
Miller and Klippenstein82 predicted theoretically that at higher temperature (>1200 K)82
the combination orientation could be either head-head or tail-tail and could form benzene,
fulvene, and phenyl radical by eliminating H atom as shown in scheme 22.
C CH C CH
HC C H
H
H
H
Scheme 22. Two propargyl radicals forming benzene, fulvene, and phenyl radical

31
Miller et.al.84 predicted the formation of benzene through cross-combination of the
propargyl radical with the allyl radical followed by elimination of hydrogen atoms as shown in
scheme 23.84
C3H3 C3H5 C5H4CH2 2H
+ H
H
Scheme 23. Propargyl radical combines with allyl radical to form benzene via fulvene
Other cross-recombination products have also been predicted as shown in scheme 24 by
Georgievskii et.al.47
C3H3 + C3H5 → CH2CCHCH2CHCH2
C3H3 + C3H5 → CHCCH2CH2CHCH2
Scheme 24. Cross combination of RSRs to form addition products
RSR can also combine with other carbon containing radicals. The experimental work of
Fahr and Nayak104 showed the combination of C3H3 with CH3 yielded 1-butyne (CH≡C-CH2-
CH3) and 1,2-butadiene (CH2=C=CH-CH3).104
1.11.3 Previous Experiments and Computational Studies on Resonance Stabilized Radicals
Cyclopentadienyl is one of the most important RSRs with a resonance stabilization
energy of 22 Kcal/mole 105. Melius et. al.85 investigated the recombination reaction mechanism
of two cyclopentadieyl radicals theoretically. In their study, naphthalene is formed from two

32
cyclopentadienyl radicals via the formation of C10H10 and C10H9 intermediates as shown in
scheme 25.
c-C5H5c-C5H5 C10H10 C10H9 C10H8
H-H
Scheme 25. Two cyclopentadienyl radicals form naphthalene
Mebel and Kilsov54 investigated the recombination reaction of two cyclopentadienyl
radicals using various theoretical and computational methods. The formation of naphthalene
occurs through the formation of 9,10-dihydrofulvalene (C10H10) and 9-H-fulvalenyl (C10H9)
which is favorable at temperatures below 1000 K. Scheme 26 shows the mechanism proposed by
Mebel and Kilsov.54 for the combination of two cyclopentadienyl radicals to form
naphthalene(C10H8) + H and fulvalene (C10H8) + H. This channel is recommended for kinetic
modeling.
c-C5H5c-C5H5 C10H10C10H9
H H
9,10-dihydrofulvalene
H
C10H8
H/
Naphthalene
H
9-H-fulvalenyl
-H
Scheme 26 Two cyclpentadienyl radicals form naphthalene and fulvalene
Cavalotti and Polino55 investigated the new pathway for the recombination of
cyclopentadienyl radicals theoretically using density functional theory and CBS-QB3. Scheme
27 shows their proposed C10H10 adduct formation from two cyclpentadienyl radicals that follows

33
the route of azulyl radicals to form naphthalene. This channel is predicted to be dominant below
1200 K. The pathway from azulene to naphthalene has been well paved by Alder et.al.106 and
Stirling et.al.107 For the azulyl radical, the radical is shown in one site however it can be in
different site.
Adduct (C10H10) Azulene
H
Azulyl radical
H
Naphthalene
Scheme 27. Two cyclopentadienyl radicals react to form naphthalene
To my knowledge there is only one experimental work to date on the self-reaction of
cyclopentadienyl radical. Knyazev and Popov108 studied the reaction kinetics of self-
recombination of cyclopentadienyl radicals using laser photolysis/photoionization mass
spectroscopy over the 304-600 K temperature range. The radicals were generated by laser
photolysis of cyclopentadiene at 248 nm. The room temperature reaction rate was found to be
(3.98±0.41) × 10-10 cm3s-1 and the reaction showed negative temperature dependence over their
experimental range. Below 600 K C10H10 intermediate dominates whereas above 800 K gas
chromatography/mass spectrometry show two isomers of C10H8 viz. naphthalene being the major
product and azulene the minor one as shown in the scheme 28.

34
Adduct (C10H10)
Naphthalene Azulene
(i)
(ii)
Scheme 28. (i) Adduct (C10H10) and (ii) naphthalene and azulene in the study by
Knyazev and popov108
Another important RSR in combustion is fulvenallenyl which is formed from either
dissociation or weak H atom abstraction from fulvenallene.109 da Silva et.al.57 studied the
decomposition of fulvenallenyl radical theoretically and experimentally. The major dissociation
products were found to be propargyl and diacetylene (C4H2).
Da Silva and Bozzeli53 proposed self-reaction and cross-reaction of fulvenallenyl radical
with propargyl and cyclopentadienyl radicals to form PAHs such as phenanthrene, naphthalene
and diphenyl. Scheme 29 (i) and (ii) are cross-combination reactions of fulvenallenyl with
propargyl and cyclpentadienyl yielding naphthalene and diphenyl respectively. Scheme 29 (iii) is
the self-recombination of fulvenallenyl radicals yielding phenanthrene.

35
CC
C
C HC
C CC
(i)
(ii)
(iii)
Fulvenallenyl + Propargyl
Fulvenallenyl + Cyclopentadienyl
Fulvenallenyl + Fulvenallenyl
Naphthalene
Diphenyl
Phenanthrene
Scheme 29. (i) Fulvenalenyl and propargyl form naphthalene (ii) fulvenallenyl and
cyclopentadienyl form diphenyl and (iii) self-recombination of fulvenallenyl form phenanthrene
1.11.4 What Else do We Need to Know?
Soot formation can only be understood by identifying key reactions leading to their
molecular precursors and investigating their reaction rates experimentally. Along with the
formation of benzene, the recombination of resonance-stabilized radicals is believed to be the
alternative routes for PAH formation.53,108 However, there is still a limited number of
experimental studies on their reaction kinetics due to their high reactivity and the difficulty of
generating them in known concentrations.108 Despite these difficulties, there are experimental
studies on self-reactions on propargyl radicals80,104 and cyclopentadienyl radicals.108 In addition
Knyavev and Popov108 have demonstrated that RSR recombination reaction can have strong
negative temperature dependent. Furthermore the radical-radical reactions are pressure

36
dependent. For example Howe and Fahr110 observed significant pressure and temperature
dependencies on propargyl self-reaction.
The significance of the fulvenallenyl radical reactions is suggested from theoretical
studies but there is not even a single experimental study on this radical. So generating
fulvenallenyl radical and studying its self and cross radical reaction kinetics at relevant pressure
and temperature is crucial at this point. It would give more insight into the understanding of the
role of fulvenallenyl resonance stabilized radical in the formation of polycyclic aromatic
hydrocarbon (PAH).
1.12 Relevance of My Research
In one of the studies,111 the reaction of the hydroxyl radical was investigated with
phenylacetylene over the 1-7.5 Torr (133.32-999.92 Pa) pressure and 298-423 K temperature
ranges using pulsed laser photolysis-laser induced fluorescence (PLP-LIF) technique.
Phenylacetylene is a known PAH formation precursor. The reaction was found to be pressure
and temperature independent suggesting the formation of an addition intermediate. Based on the
exothermicity calculation of the intermediates using Gaussian 09, CBS-QB3, the addition of OH
to the outer carbon of -C2H in phenylacetylene is the most likely reaction outcome. Furthermore,
this product is stabilized by resonance, with four resonance structures as shown in scheme 30.
CC
H
OHC
CH
OH CCH
OH CCH
OH CCH
OH
Scheme 30. Resonance structures of OH-phenylacetylene adduct

37
This motivated us to study the reaction of hydroxyl radical with fulvenallene-another
compound believed to contribute to PAH formation. da Silva et.al.53 suggested that OH could
abstract the loosely bound hydrogen atom from fulvenallene to form fulvenallenyl, a resonance
stabilized radical in combustion. This reaction was studied over 298-450 K at 5 Torr using PLP-
LIF technique. The reaction rate coefficient was independent of pressure but showed negative
temperature dependence. This suggests an association mechanism dominant at room and lower
temperature whereas abstraction is likely to dominate at temperature higher than 450 K. This
indicates that the fulvenallenyl radical is likely to be formed at higher temperature in combustion
environment. To confirm the formation of fulvenallenyl radical, higher temperature kinetic
studies of OH with fulvenallene are needed in order to determine the contribution of
fulvenallenyl radical in PAH formation. Self and cross-combination reactions of fulevenallenyl
radicals (resonance-stabilized radicals) also need to be investigated over a wide range of
temperatures.
References:
(1) Mishra, D. P. Experimental combustion : an introduction, 2014. (2) Where the Energy Goes: Gasoline Vehicles, https://www.fueleconomy.gov/feg/atv.shtml;
Department of Energy. (3) Keating, E. L. Applied combustion; CRC Press/Taylor & Francis: Boca Raton, 2007; Vol.
206.;206;. (4) Srivastava, S. P.; Hancsók, J.; ebrary, I. Fuels and fuel-additives; Wiley: Hoboken, New
Jersey, 2013. (5) DOE: Fossil Fuels: How Fossil Fuels Were Formed 2016. (6) Liberman, M. A. Introduction to Physics and Chemistry of Combustion: Explosion,
Flame, Detonation; Springer: Berlin, 2008; Vol. 1. Aufl.;1;. (7) Mohr, S. H.; Wang, J.; Ellem, G.; Ward, J.; Giurco, D. Fuel 2015, 141, 120. (8) Miller, B. G. M. S.; Books24x, I. Clean coal engineering technology; Butterworth-
Heinemann: Burlington, MA, 2011. (9) Schobert, H. H.; ebrary, I. Chemistry of fossil fuels and biofuels; Cambridge University
Press: New York;Cambridge [England];, 2013. (10) Mokhatab, S.; Poe, W. A.; Speight, J. G.; Gulf Professional Pub.: Burlington, MA, 2006. (11) Pogaku, R.; Sarbatly, R. H.; Ebooks, C. Advances in biofuels; Springer: New York, 2013;
Vol. 2.

38
(12) Naik, S. N.; Goud, V. V.; Rout, P. K.; Dalai, A. K. Renewable & Sustainable Energy Reviews 2010, 14, 578.
(13) Chaudhary, G.; Singh, L. K.; Ghosh, S. Bioresource Technology 2012, 124, 111. (14) Chen, Y.; Cheng, J. J.; Creamer, K. S. Bioresource Technology 2008, 99, 4044. (15) Balat, M. Energy Exploration & Exploitation 2007, 25, 195. (16) Balat, M.; Balat, H. Applied Energy 2009, 86, 2273. (17) Ferguson, C. R.; Kirkpatrick, A. 2015. (18) Stone, R. Introduction to internal combustion engines; SAE International: Warrendale,
PA., 2012. (19) Roth A.C., F. B. J., and Scott W.; Goodheart Willcox: 2012. (20) Andreae, M. O.; Merlet, P. Global Biogeochemical Cycles 2001, 15, 955. (21) Ferguson, C. R.; Kirkpatrick, A. T. Internal Combustion Engines : Applied
Thermosciences (3rd Edition); Wiley: Somerset, NJ, USA, 2015. (22) Kirchstetter, T. W.; Harley, R. A.; Kreisberg, N. M.; Stolzenburg, M. R.; Hering, S. V.
Atmospheric Environment 1999, 33, 2955. (23) Wang, F.; Li, P.; Zhang, J.; Mei, Z.; Mi, J.; Wang, J. International Journal of Hydrogen
Energy 2015, 40, 6228. (24) Liberman, M. A.; Springer: Berlin, 2008. (25) Smith, K. R.; Frumkin, H.; Balakrishnan, K.; Butler, C. D.; Chafe, Z. A.; Fairlie, I.;
Kinney, P.; Kjellstrom, T.; Mauzerall, D. L.; McKone, T. E.; McMichael, A. J.; Schneider, M. In Annual Review of Public Health, Vol 34; Fielding, J. E., Ed. 2013; Vol. 34, p 159.
(26) Naeher, L. P.; Brauer, M.; Lipsett, M.; Zelikoff, J. T.; Simpson, C. D.; Koenig, J. Q.; Smith, K. R. Inhalation Toxicology 2007, 19, 67.
(27) Unwin, J.; Cocker, J.; Scobbie, E.; Chambers, H. Annals of Occupational Hygiene 2006, 50, 395.
(28) Kim, K.-H.; Jahan, S. A.; Kabir, E.; Brown, R. J. C. Environment International 2013, 60, 71.
(29) Yao, M.; Zheng, Z.; Liu, H. Progress in Energy and Combustion Science 2009, 35, 398. (30) Musculus, M. P. B.; Miles, P. C.; Pickett, L. M. Progress in Energy and Combustion
Science 2013, 39, 246. (31) Charalambides, A. G. In Advances in Internal Combustion Engines and Fuel
Technologies; Ng, H. K., Ed.; InTech: 2013. (32) Jun, D.; Ishii, K.; Iida, N. Jsme International Journal Series B-Fluids and Thermal
Engineering 2003, 46, 60. (33) Love, N.; Parthasarathy, R. N.; Gollahalli, S. R. International Journal of Green Energy
2011, 8, 113. (34) Tinaut, F. V.; Reyes, M.; Gimenez, B.; Pastor, J. V. Energy & Fuels 2011, 25, 119. (35) Yu, X.; Yang, Z.; Peng, J.-B.; Zhang, L.; Ma, Y.-F.; Yang, C.-B.; Li, X.-H.; Sun, R.
Chinese Physics B 2015, 24. (36) Luque, J.; Jeffries, J. B.; Smith, G. P.; Crosley, D. R. Combustion and Flame 2001, 126,
1725. (37) Zhou, B.; Brackmann, C.; Li, Z.; Alden, M. Combustion and Flame 2015, 162, 368. (38) Ledesma, E. B.; Marsh, N. D.; Sandrowitz, A. K.; Wornat, M. J. Proceedings of the
Combustion Institute 2002, 29, 2299.

39
(39) Taatjes, C. A.; Hansen, N.; Osborn, D. L.; Kohse-Hoeinghaus, K.; Cool, T. A.; Westmoreland, P. R. Physical Chemistry Chemical Physics 2008, 10, 20.
(40) Wang, K.; Villano, S. M.; Dean, A. M. Combustion and Flame 2015, 162, 4456. (41) Wang, H.; Frenklach, M. Combustion and Flame 1997, 110, 173. (42) Marinov, N. M.; Pitz, W. J.; Westbrook, C. K.; Vincitore, A. M.; Castaldi, M. J.; Senkan,
S. M.; Melius, C. F. Combustion and Flame 1998, 114, 192. (43) Norinaga, K.; Janardhanan, V. M.; Deutschmann, O. International Journal of Chemical
Kinetics 2008, 40, 199. (44) Pitz, W. J.; Mueller, C. J. Progress in Energy and Combustion Science 2011, 37, 330. (45) Battin-Leclerc, F. Progress in Energy and Combustion Science 2008, 34, 440. (46) Hansen, N.; Miller, J. A.; Kasper, T.; Kohse-Hoeinghaus, K.; Westmoreland, P. R.;
Wang, J.; Cool, T. A. Proceedings of the Combustion Institute 2009, 32, 623. (47) Georgievskii, Y.; Miller, J. A.; Klippenstein, S. J. Physical Chemistry Chemical Physics
2007, 9, 4259. (48) Miller, J. A.; Klippenstein, S. J. Journal of Physical Chemistry A 2003, 107, 7783. (49) Goulay, F.; Leone, S. R. Journal of Physical Chemistry A 2006, 110, 1875. (50) Woon, D. E. Chemical Physics 2006, 331, 67. (51) Frenklach, M.; Warnatz, J. Combustion Science and Technology 1987, 51, 265. (52) Richter, H.; Howard, J. B. Progress in Energy and Combustion Science 2000, 26, 565. (53) da Silva, G.; Bozzelli, J. W. Journal of Physical Chemistry A 2009, 113, 12045. (54) Mebel, A. M.; Kislov, V. V. Journal of Physical Chemistry A 2009, 113, 9825. (55) Cavallotti, C.; Polino, D. Proceedings of the Combustion Institute 2013, 34, 557. (56) Polino, D.; Famulari, A.; Cavallotti, C. Journal of Physical Chemistry A 2011, 115, 7928. (57) da Silva, G.; Trevitt, A. J.; Steinbauer, M.; Hemberger, P. Chemical Physics Letters
2011, 517, 144. (58) Zhang, T.; Zhang, L.; Hong, X.; Zhang, K.; Qi, F.; Law, C. K.; Ye, T.; Zhao, P.; Chen, Y.
Combustion and Flame 2009, 156, 2071. (59) Hansen, N.; Kasper, T.; Klippenstein, S. J.; Westmoreland, P. R.; Law, M. E.; Taatjes, C.
A.; Kohse-Hoeinghaus, K.; Wang, J.; Cool, T. A. Journal of Physical Chemistry A 2007, 111, 4081.
(60) Li, Y.; Zhang, L.; Tian, Z.; Yuan, T.; Wang, J.; Yang, B.; Qi, F. Energy & Fuels 2009, 23, 1473.
(61) Cavallotti, C.; Derudi, M.; Rota, R. Proceedings of the Combustion Institute 2009, 32, 115.
(62) da Silva, G.; Cole, J. A.; Bozzelli, J. W. Journal of Physical Chemistry A 2009, 113, 6111.
(63) Derudi, M.; Polino, D.; Cavallotti, C. Physical Chemistry Chemical Physics 2011, 13, 21308.
(64) Buckingham, G. T.; Ormond, T. K.; Porterfield, J. P.; Hemberger, P.; Kostko, O.; Ahmed, M.; Robichaud, D. J.; Nimlos, M. R.; Daily, J. W.; Ellison, G. B. Journal of Chemical Physics 2015, 142.
(65) Shapero, M.; Cole-Filipiak, N. C.; Haibach-Morris, C.; Neumark, D. M. Journal of Physical Chemistry A 2015, 119, 12349.
(66) Gligorovski, S.; Strekowski, R.; Barbati, S.; Vione, D. Chemical Reviews 2015, 115, 13051.
(67) Atkinson, R.; Arey, J. Chemical Reviews 2003, 103, 4605.

40
(68) Atkinson, R. Chemical Reviews 1986, 86, 69. (69) Gierczak, T.; Talukdar, R. K.; Herndon, S. C.; Vaghjiani, G. L.; Ravishankara, A. R.
Journal of Physical Chemistry A 1997, 101, 3125. (70) Srinivasan, N. K.; Su, M. C.; Sutherland, J. W.; Michael, J. V. Journal of Physical
Chemistry A 2005, 109, 1857. (71) Tyndall, G. R. S.; Orlando, J. J.; Wallington, T. J.; Hurley, M. D.; Goto, M.; Kawasaki,
M. Physical Chemistry Chemical Physics 2002, 4, 2189. (72) Vakhtin, A. B.; Murphy, J. E.; Leone, S. R. Journal of Physical Chemistry A 2003, 107,
10055. (73) Morris, E. D.; Stedman, D. H.; Niki, H. Journal of the American Chemical Society 1971,
93, 3570. (74) Wollenhaupt, M.; Crowley, J. N. Journal of Physical Chemistry A 2000, 104, 6429. (75) Tully, F. P.; Ravishankara, A. R.; Thompson, R. L.; Nicovich, J. M.; Shah, R. C.;
Kreutter, N. M.; Wine, P. H. Journal of Physical Chemistry 1981, 85, 2262. (76) Hansen, N.; Miller, J. A.; Klippenstein, S. J.; Westmoreland, P. R.; Kohse-Hoeinghaus,
K. Combustion Explosion and Shock Waves 2012, 48, 508. (77) Kern, R. D.; Singh, H. J.; Wu, C. H. International Journal of Chemical Kinetics 1988, 20,
731. (78) Miller, J. A.; Melius, C. F. Combustion and Flame 1992, 91, 21. (79) Pope, C. J.; Miller, J. A. Proceedings of the Combustion Institute 2000, 28, 1519. (80) Shafir, E. V.; Slagle, I. R.; Knyazev, V. A. Journal of Physical Chemistry A 2003, 107,
8893. (81) Wu, C. H.; Kern, R. D. Journal of Physical Chemistry 1987, 91, 6291. (82) Miller, J. A.; Klippenstein, S. J. Journal of Physical Chemistry A 2001, 105, 7254. (83) Hansen, N.; Li, W.; Law, M. E.; Kasper, T.; Westmoreland, P. R.; Yang, B.; Cool, T. A.;
Lucassen, A. Physical Chemistry Chemical Physics 2010, 12, 12112. (84) Miller, J. A.; Klippenstein, S. J.; Georgievskii, Y.; Harding, L. B.; Allen, W. D.;
Simmonett, A. C. Journal of Physical Chemistry A 2010, 114, 4881. (85) Melius, C. F.; Colvin, M. E.; Marinov, N. M.; Pitz, W. J.; Senkan, S. M. Reaction
mechanisms in aromatic hydrocarbon formation involving the C5H5 cyclopentadienyl moiety, 1996.
(86) Ikeda, E.; Tranter, R. S.; Kiefer, J. H.; Kern, R. D.; Singh, H. J.; Zhang, Q. Proceedings of the Combustion Institute 2000, 28, 1725.
(87) Moskaleva, L. V.; Mebel, A. M.; Lin, M. C. The CH3+C5H5 reaction: A potential source of benzene at high temperatures, 1996.
(88) Masih, J.; Masih, A.; Kulshrestha, A.; Singhvi, R.; Taneja, A. Journal of Hazardous Materials 2010, 177, 190.
(89) Stein, S. E.; Fahr, A. Journal of Physical Chemistry 1985, 89, 3714. (90) Harrison, R. M.; Smith, D. J. T.; Luhana, L. Environmental Science & Technology 1996,
30, 825. (91) Marr, L. C.; Kirchstetter, T. W.; Harley, R. A.; Miguel, A. H.; Hering, S. V.; Hammond,
S. K. Environmental Science & Technology 1999, 33, 3091. (92) Frenklach, M. Physical Chemistry Chemical Physics 2002, 4, 2028. (93) Richter, H.; Benish, T. G.; Mazyar, O. A.; Green, W. H.; Howard, J. B. Proceedings of
the Combustion Institute 2000, 28, 2609.

41
(94) Parker, D. S. N.; Kaiser, R. I.; Troy, T. P.; Ahmed, M. Angewandte Chemie-International Edition 2014, 53, 7740.
(95) Frenklach, M.; Clary, D. W.; Gardiner Jr, W. C.; Stein, S. E. Symposium (International) on Combustion 1988, 21, 1067.
(96) Frenklach, M.; Yuan, T.; Ramachandra, M. K. Energy & Fuels 1988, 2, 462. (97) D'Anna, A.; Violi, A.; D'Alessio, A. Combustion and Flame 2000, 121, 418. (98) Miller, J. A.; Pilling, M. J.; Troe, E. Proceedings of the Combustion Institute 2005, 30,
43. (99) Rose, D.; Wehner, B.; Ketzel, M.; Engler, C.; Voigtlander, J.; Tuch, T.; Wiedensohler, A.
Atmospheric Chemistry and Physics 2006, 6, 1021. (100) Karjalainen, P.; Pirjola, L.; Heikkila, J.; Lahnde, T.; Tzamkiozis, T.; Ntziachristos, L.;
Keskinen, J.; Ronkko, T. Atmospheric Environment 2014, 97, 262. (101) Kim, W. S.; Kim, S. H.; Lee, D. W.; Lee, S.; Lim, C. S.; Ryu, J. H. Environmental
Science & Technology 2001, 35, 1005. (102) Atkinson, D. B.; Hudgens, J. W. Journal of Physical Chemistry A 1999, 103, 4242. (103) Chakraborty, A.; Fulara, J.; Maier, J. P. Angewandte Chemie-International Edition 2016,
55, 228. (104) Fahr, A.; Nayak, A. International Journal of Chemical Kinetics 2000, 32, 118. (105) Zhong, X.; Bozzelli, J. W. International Journal of Chemical Kinetics 1997, 29, 893. (106) Alder, R. W.; East, S. P.; Harvey, J. N.; Oakley, M. T. Journal of the American Chemical
Society 2003, 125, 5375. (107) Stirling, A.; Iannuzzi, M.; Laio, A.; Parrinello, M. Chemphyschem 2004, 5, 1558. (108) Knyazev, V. D.; Popov, K. V. Journal of Physical Chemistry A 2015, 119, 7418. (109) Polino, D.; Cavallotti, C. Journal of Physical Chemistry A 2011, 115, 10281. (110) Howe, P. T.; Fahr, A. Journal of Physical Chemistry A 2003, 107, 9603. (111) Kailasanathan, R. K. A.; Thapa, J.; Goulay, F. Journal of Physical Chemistry A 2014,
118, 7732.

42
Chapter 2: Experimental Methods
2.1 Vacuum and Gas Set Up
The reactions of hydroxyl radical with polycyclic aromatic hydrocarbon precursors were
studied at pressures ranging from of 1-10 Torr (rough or low vacuum region, 1-760 Torr or
133.32-1.01×10⁵ Pa) in a buffer gas of helium. Ultra-high purity (UHP) grade (99.99%) helium
gasses from Matheson Tri Gas were regulated using Harris CGA E-4 9296 multi-stage regulator
and Matheson regulator (model no. 3539-350) and connected to MKS mass flow controllers
using 1/4ʺ copper tube. The major experimental components used for these experiments are
discussed in the following sub-sections.
2.1.1 The Reaction Chamber
The experiments were conducted in a stainless steel 6-way-cross chamber. A schematic
of the reaction chamber is shown in Figure 1. All six ports of the reaction chamber had 1.5ʺ inner
diameter and are 2ʺ in length. Four of these ports were horizontal and two were vertical. Two of
the four horizontal ports were extended by connecting optical ports of 1ʺ inner diameter and 4ʺ in
length through CF flanges. One of the horizontal ports was extended by connecting a constricted
stainless steel port of 0.4ʺ inner diameter and 8ʺ in length. The remaining horizontal port was
first connected to a stainless steel tee, 1.5ʺ in diameter and 3ʺ in length for connection to the
vacuum pump. All the horizontal ports had 1/4ʺ tubes for the injection of gas injection and
pressure measurements using capacitance manometer (Baratron MKS instruments). The lower
vertical port was closed using a stainless steel blank flange. The upper vertical port had a quartz
window for UV-light transmission.
The four horizontal ports described above for laser access were terminated by a 1ʺ
uncoated UV fused silica windows held by Viton O-rings and Teflon rings. The windows were at

43
Brewster angle (53°) in order to reduce reflection of the vertically polarized laser beam. A plano
concave mirror was placed (fixed) in the lower inner portion of the lower vertical port to collect
the signal from the radicals.
Figure 1. Experimental schematic for the kinetic measurements from 300 to 450 K and 1 to 10 Torr
2.1.2 Vacuum Pump and Gas Injection
The required dynamic vacuum of 1-10 Torr at a constant total mass flow rate of helium
buffer gas was achieved by using a high volume flow rate vacuum pump. The vacuum pump and
gas injection method are discussed in the following sub-sections.

44
2.1.2.1 Vacuum Pump
Vacuum was maintained in the reaction chamber using an Edwards iQDP80/iQMB500
mechanical booster combination also called Roots Blower. The iQMB is a mechanical booster
connected to the inlet of a iQDP rotary backing pump. Both pumps are water cooled through a
circulation of chilled water.1 The Roots Blower is a dry pump that avoids contamination of the
system with a low maintenance cost.2 It is designed for working in harsh environments requiring
high pumping speeds, while minimizing contamination from pump oil. Its operating pressure
range is between roughing (1-760 Torr) and high-vacuum (down to 10-5 Torr)2,3 independently of
gas composition. Its compression ratio (ratio of outlet to inlet pressure) ranges from 10-50.3 The
pumping capacity of the Roots blower used in these experiments is 600 m3 hr-1 (cubic meter per
hour).
Roots Blower is a valveless, rotary positive displacement pump. This means the Roots
Blower operates by forcing the fixed volume of gas from its inlet pressure section to its discharge
zone. It has two 8-shaped rotors interlocked and synchronized rotating in opposite directions
with a rotation speed of the order of 3000 rpm (rotations per minute). The space between two
rotors is approximately 0.2 mm. The rotors do not contain any oil, making it suitable for
applications requiring high gas purity. Figure 2 shows the two lobed rotors and the arrowheads
show their movement during the operation. The rotation of the 8-shaped rotors in opposite
direction traps the air within the spaces surrounding the lobes forcing it into the outlet section.4

45
Figure 2. Lobed rotors in Roots Blower vacuum pump4
The pressure in the reaction chamber was regulated using a butterfly valve placed
between the reaction chamber and the flexible stainless-steel tube that was connected to the
vacuum chamber.
2.1.2.2 Injection of Gases
All the gaseous reactants (propylene, butane, benzene vapors in He, acetaldehyde vapors
in He, fulvenallene vapors in He) and gaseous radical precursors (HONO) were mixed in the
stainless steel mixing cylinder of volume 50 cm3 placed before the reaction chamber and
introduced into the reaction chamber. Helium was used as the main carrier gas to avoid any
reaction with the free radicals. The flow rates of all gases were monitored and controlled by
calibrated mass flow controllers (MKS Instruments).
Liquid reactants such as phenylacetylene, were placed inside of a bubbler and maintained
at constant temperature using a regulated oil bath (1016S, ISOTEMP) at 15˚C. For benzene, oil

46
bath was used at room temperature. A fraction of the carrier gas (from 5 to 10%) was bubbled
through the liquid to obtain a saturated gas flow. In the same way, vapors of the hydroxyl radical
precursor-liquid hydrogen peroxide (30 and 50 % w/w)-was placed inside of a bubbler which
temperature was regulated using a water bath. The fraction of the carrier gas flowing through the
bubbler ranged from 5 to 10% of the total flow.
2.1.2.3 Calibration of Mass Flow Controllers (MFCs)
Depending on their flow rate capacity mass flow controllers (MFCs) were calibrated
using custom-made cylinders of known volume (i. radius=2.5" and height=12.5", ii. radius=2.5"
and height=25.5" or iii. radius=2.5" and height=47.75") initially evacuated to pressure below 0.1
Torr. A set flow rate of helium was flown through the MFC into one of the cylinders. The
pressure was measured using capacitance manometer and recorded as a function of time. The
standard flow rate through the controller was determined from the slope of the pressure vs.
time using equation 1:
Eq. (1)
V the volume of the cylinder and tubings, P0 is the standard pressure (1.013×10⁵ Pa), T0 is the
standard temperature (273.15 K) and T the temperature used for calibration (room
temperature=300 K).
The above process was repeated for several set flow rates of helium over the entire range
of the MFC. The calibration factors of the MFC were determined from the slope of the measured
flow rates versus the set flow rates. Figure 3 shows the measured flow rate plotted against the set
flow rates for a MFC (full range 200 sccm, serial number 021869896). The experimental points
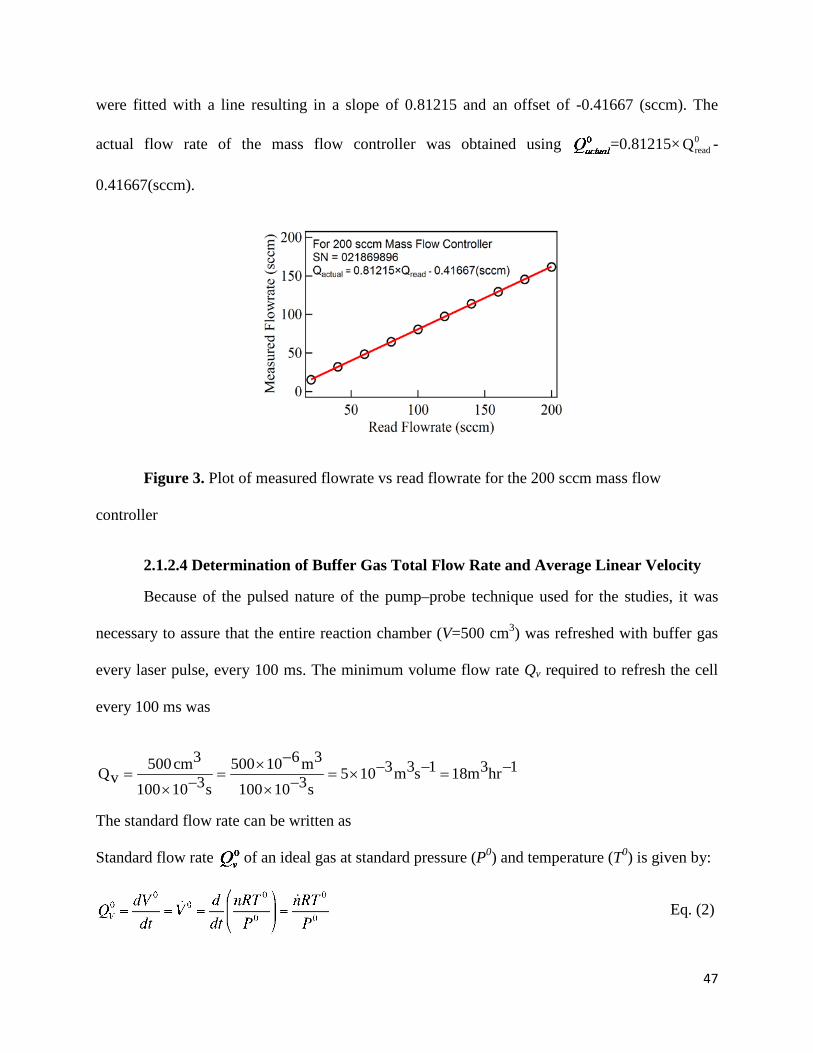
47
were fitted with a line resulting in a slope of 0.81215 and an offset of -0.41667 (sccm). The
actual flow rate of the mass flow controller was obtained using =0.81215× 0readQ -
0.41667(sccm).
Figure 3. Plot of measured flowrate vs read flowrate for the 200 sccm mass flow
controller
2.1.2.4 Determination of Buffer Gas Total Flow Rate and Average Linear Velocity
Because of the pulsed nature of the pump–probe technique used for the studies, it was
necessary to assure that the entire reaction chamber (V=500 cm3) was refreshed with buffer gas
every laser pulse, every 100 ms. The minimum volume flow rate Qv required to refresh the cell
every 100 ms was
1hr318m1s3m3105s310100
3m610500s310100
3cm500vQ −=−−×=−×
−×=−×
=
The standard flow rate can be written as
Standard flow rate of an ideal gas at standard pressure (P0) and temperature (T0) is given by:
Eq. (2)

48
where n is the number of moles of gas and R the gas constant. The molar flow rate and the
mass flow rate are related by:
Mmn•
•
= Eq. (3)
where M is the molar mass of the gas. Plugging equation 3 in 2 we obtain
0
0
m0
0m0
v MPRTQ
MPRTmQQ ==
ρ=
•
Eq. (4)
with 0ρ density of the gas at standard pressure and temperature and Qm the mass flow rate.
Similarly, under the experimental conditions of pressure P and temperature T:
vm QRTPMQ = Eq. (5)
Incorporating Qm from equation 5 in 4 results in
v
0
00v .Q
TT.
PPQ = Eq. (6)
At P=5 Torr, and T=300K (typical experimental conditions) we obtained 0vQ =1797.0 sccm
(standard cubic centimeter per minute). The experimental value was 1.8 slm (standard litter per
minute). Values at lower pressure were obtained by normalizing by the cell pressure, =3.6
slm at 10 Torr.
An estimate of linear velocity of the buffer gas in the reaction cell can be obtained using
Qv=vS with S the cross-section in the middle region of the reaction chamber (2 cm diameter).
This leads to the velocity of the buffer gas of about 3.98 ms-1. The size of the optical detection
region in the cell is determined by the diameter of the photolysis laser pulses, approximately 0.5
cm. Therefore the resident time t of the reactants in the detection region is:

49
ms26.1s1026.198.3105.0t 3
2
=×=×
= −−
In order to approximate the cell to a static cell, the reaction time is kept shorter than the resident
time.
2.1.2.5 High Temperature Set Up
For the high temperature set up, the reaction chamber was wrapped with a constant-
wattage heat cable and insulated using fiberglass. Temperature dependence of the rate coefficient
was investigated over the 298-450 K temperature range. The gas temperature in the center of the
reaction chamber was measured using a retractable Type K thermocouple. Temperatures at the
inlet of the reaction chamber and at the point of pressure measurement were also monitored
using two Type K thermocouples. The temperature control circuit used controllers (Omega-
CN710), and solid-state relays (SSR330AC) to regulate power to the heat cables. Before every
experiment the reaction chamber was allowed to thermalize for about an hour, minimizing
fluctuations in measured temperatures.
2.2 The Pulsed Laser Photolysis-Laser Induced Fluorescence (PLP–LIF) Technique
2.2.1 Background
The pulsed laser photolysis–laser induced fluorescence (PLP–LIF) technique has been
extensively used to study the reaction kinetics of short lived species5,6 (radicals/molecules) that
are important in combustion6-11, atmospheric12-15, and interstellar medium7,8,16,17 chemistry. In
this technique, a short laser pulse (~10 ns or less) initiates the reaction by breaking the bond of
the radical precursor to generate radicals (e.g. Br3CHh3CHBr3 +→ν+ ).18 The most
commonly used photolysis lasers are excimer (193 nm and 248 nm) and Nd:YAG (266 nm and

50
355 nm). The other tunable laser (dye laser) monitors the radical concentration using Laser
Induced Fluorescence (LIF). The beams of the photolysis and probe lasers usually propagate
perpendicular to each other, as shown in Figure 1. This leads to a detection region of about ~3
mm.
This pump–probe PLP-LIF technique became popular since early 1980s. Owing to the
broad implication and spectrum in the research area of reaction kinetics, this technique has been
widely used over the last decades. Robertshaw et.al.19 investigated the reaction of hydroxyl
radical with nitrogen dioxide. OH radicals were generated using pulsed laser photolysis of nitric
acid (HNO3) and by monitoring the decay of OH radicals by laser induced fluorescence at
excitation wavelength of 282 nm and observing its emission wavelength at 310 nm. Perry9
studied the reaction of NCO radical, an important intermediate in fuel and flame with hydrogen
and nitric oxide.9 In this study, an excimer laser was employed to photolyze HNCO at 248 nm to
generate NCO radical and a tunable dye laser was used for NCO LIF at excitation wavelength of
416.8 nm and monitored its fluorescence at 438.5 nm.9 Blitz et.al.20 studied the reaction of CH
radical that is important in combustion and planetary atmospheres with H2O using PLP-LIF. CH
radicals were generated by photolyzing CHBr3 at 248 nm using an excimer laser and monitored
the concentration of CH by LIF using tunable dye laser at excitation wavelength 430 nm
(A2Δ←X2Π) observing its fluorescence at 490 nm.20 Similarly, Rudich et.al.21 studied the
reaction of hydroxyl radical with methyl butenol, an important natural volatile organic
compound (NVOC) in the atmosphere. In this study, OH radicals were generated from HONO
using pulsed laser photolysis (frequency tripled Nd:YAG laser) at 355nm and the concentration
of OH radicals were monitored using tunable dye laser exciting at 281.1 nm and monitoring its
fluorescence at 308.8 nm.

51
2.2.2 Pulsed Photolysis
In pulsed photolysis short-lived radicals are produced in high concentrations
instantaneously using an intense pulse with high peak power in the UV or visible region.22 The
laser has a very short pulse (in the order of nanoseconds), shorter than the lifetime of the radicals
or intermediates. The laser is a well collimated beam.22 The monochromatic light of the laser
ensures selective photolysis of the radical precursor.23 Fixed wavelength lasers such as Nd:YAG
(532 nm, 355 nm, and 266 nm) and excimer (193 nm and 248 nm) are the most widely used
pulsed sources for photolysis. Here the fourth harmonic (266 nm) of a Nd:YAG laser was used to
break the weak O–O bond (196 KJ/mol)24 in H2O2 to generate two OH radicals as shown in R1
below. The third harmonic (355 nm) of the same Nd:YAG laser was used to photolyze HONO
(200 KJ/mol) 25,26 as shown in R2 below and generate OH radicals with limited photolysis of the
hydrocarbon precursor.27,28 Alternatively excimer laser (193 nm and 248 nm) can be used to
generate OH radicals from H2O2.29
2OH)nm266(h2O2H →ν+ (R1)
NOOH)nm355(hHONO +→ν+ (R2)
2.2.3 Laser Induced Fluorescence (LIF)
Laser induced fluorescence (LIF) is the emission of photons from the species (radicals or
molecules) following the absorption of a laser pulse. In LIF, light radiation from a tunable laser
is tuned to a wavelength matching the absorption line of the species. Upon absorption of the
resonant excitation wavelength, the species goes from a lower electronic state to a higher excited
electronic state with a short lifetime (10-5 to 10-10 s). The excited state then relaxes spontaneously

52
to a lower vibronic state. In the case that the returning state is different than the initial state, the
emitted radiation has a different wavelength than that of the excitation radiation. The broadband
off-resonance fluorescence is observed using a bandpass filter.30 As the species are excited at
their resonant wavelength, the absorption cross-section is larger providing higher sensitivity of
the species with very low concentration (ppm level).
Figure 4 shows a schematic of the laser induced fluorescence scheme of hydroxyl radical
(OH). Hydroxyl radical initially in their ground X2Π state and vibrational level v"=0 absorbs a
photon of light from a frequency doubled tunable dye laser at about 282 nm to go to the first
excited A2Σ states in v'=1. In the excited electronic state OH has a very short lifetime of
approximately 700 nanoseconds.31-33
Figure 4. Schematic of laser induced fluorescence of Hydroxyl Radical
In figure 4, the ground and first excited vibrational states of each electronic states are
labeled by the quantum numbers v = 0, 1. Only the fluorescence from the first vibrational level of
OH
Ground Electronic State
Excited Electronic State
Laser LIF
0
1
0
1
+∑
2A
Π2
X
(1-0) excitation (1-1) fluorescence
282nm 310nm

53
the excited state to the first vibrational level of the ground electronic state at (310 nm) is
observed using a band pass filter (FWHM±10 nm).
Figure 5 shows the experimental LIF spectrum of OH radical for excitation wavelengths
ranging from 281 nm to 283 nm. All the rotational lines in Figure 5 are from the A–X (v'=1,
v"=0) vibronic band. The most intense absorption line at 281.95 nm corresponds to a
superposition of several rotational lines and is used for the OH detection. The fluorescence
emission is monitored at 310 nm using a band pass filter (FWHM±10 nm).
Figure 5. OH LIF spectrum for A2Π-X2Σ electronic transition (v'=1, v"=0)
In the equations below, OH refers to the ground electronic state of the hydroxyl radical
while OH* refers to the excited electronic state. The coefficient k* is the first order decay rate of
the excited state and is related to the Einstein A coefficient for spontaneous emission and non-
radiative quenching rate. It corresponds to the inverse of the fluorescence lifetime. Within a
steady state approximation the fluorescence signal is directly proportional to the concentration of
ground state OH radicals.
∗→ν+ OHhOH
ν+→∗∗ hOHOH k

54
[LIF] ∝ [OH*] ∝ [OH]
Figure 6 shows the typical fluorescence decay following the dye laser excitation. The Y-
axis represents the laser-induced fluorescence and the X-axis represents fluorescence time in
nanoseconds. The laser triggers at 50ns and the fluorescence decay is gated using an integration
window from a boxcar average. As shown in the figure 6, the fluorescence decay is in the order
of nanoseconds, which is much shorter than the reaction time, which occurs in the order of
microseconds.
Figure 6. Fluorescence decay due to the dye laser
The main advantages of using LIF for the detection of OH radicals are:
1. LIF is very sensitive time resolved and radical specific technique.
2. It is a spatially resolved measurement technique.
The limitations of LIF are:
1. The technique measures the ground state population indirectly making it difficult to
quantify due to quenching of the excited state. The concentration of OH ground state is
monitored by looking at the fluorescence signal emitted from the OH excited state. The

55
fluorescence signal is assumed to be proportional to the amount of radical in the excited
state, which in turn is assumed to be proportional to the ground state OH radicals. Thus,
LIF is an indirect measurement technique.
2. Not all species (radicals or molecules) absorb at the desired wavelengths and fluoresce.
Table 1 shows some of the widely studied radicals using laser-induced fluorescence. It shows the
excitation wavelengths and detection wavelengths corresponding to their transitions. The radicals
are detected using band pass or long pass filters.
Table 1. Excitation and detection wavelengths of the radicals corresponding to their
transitions
Radical Excitation wavelength Transition Detection range OH34 282 A-X 310 (band-pass filter) CH35 431 A-X 490 (band-pass filter) CN36 387 B-X 420 (band-pass filter)
1CH237 537 B-A 580 (band-pass filter)
HCO38 258.7 B-X 300 (band-pass filter) H2CO39 370 A-X41
0 >380 (long-pass filter)
2.3 Laser and Optical Systems
Laser is an acronym for ‘light amplification by stimulated emission of radiation’. A laser
consists of three main elements: pumping source, active or gain medium, and a laser cavity.
Laser actions occur through stimulated emission when the population of the upper energy level
of the active medium is much higher than that of the lower energy level, referred to as population
inversion. Active medium may be solid (e.g. Nd:YAG laser), liquid (e.g. dye laser) or gas (e.g.
excimer laser).
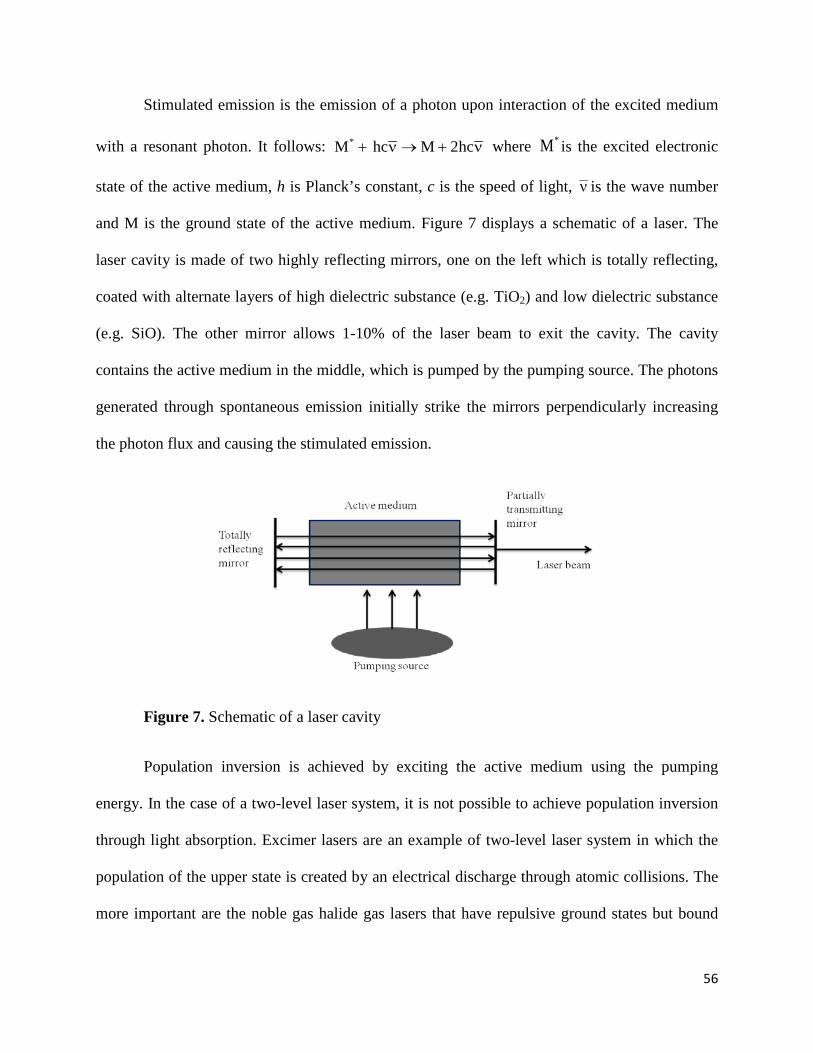
56
Stimulated emission is the emission of a photon upon interaction of the excited medium
with a resonant photon. It follows: ν+→ν+ hc2MhcM* where *M is the excited electronic
state of the active medium, h is Planck’s constant, c is the speed of light, ν is the wave number
and M is the ground state of the active medium. Figure 7 displays a schematic of a laser. The
laser cavity is made of two highly reflecting mirrors, one on the left which is totally reflecting,
coated with alternate layers of high dielectric substance (e.g. TiO2) and low dielectric substance
(e.g. SiO). The other mirror allows 1-10% of the laser beam to exit the cavity. The cavity
contains the active medium in the middle, which is pumped by the pumping source. The photons
generated through spontaneous emission initially strike the mirrors perpendicularly increasing
the photon flux and causing the stimulated emission.
Figure 7. Schematic of a laser cavity
Population inversion is achieved by exciting the active medium using the pumping
energy. In the case of a two-level laser system, it is not possible to achieve population inversion
through light absorption. Excimer lasers are an example of two-level laser system in which the
population of the upper state is created by an electrical discharge through atomic collisions. The
more important are the noble gas halide gas lasers that have repulsive ground states but bound
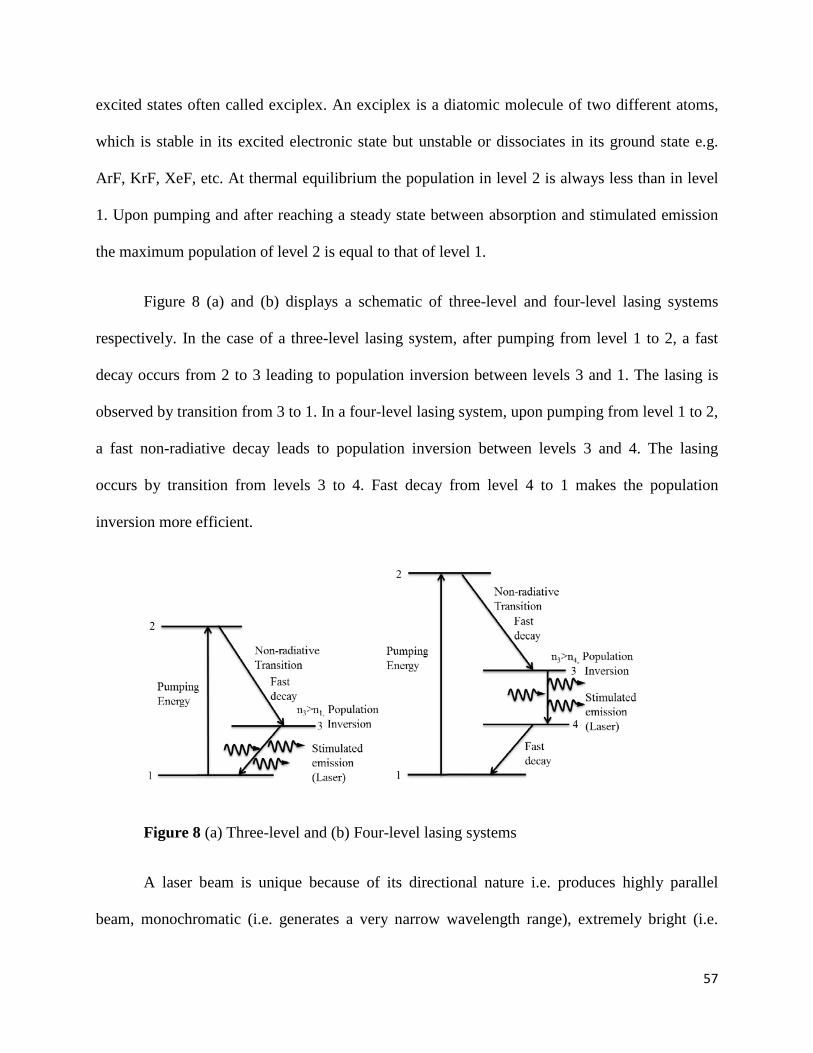
57
excited states often called exciplex. An exciplex is a diatomic molecule of two different atoms,
which is stable in its excited electronic state but unstable or dissociates in its ground state e.g.
ArF, KrF, XeF, etc. At thermal equilibrium the population in level 2 is always less than in level
1. Upon pumping and after reaching a steady state between absorption and stimulated emission
the maximum population of level 2 is equal to that of level 1.
Figure 8 (a) and (b) displays a schematic of three-level and four-level lasing systems
respectively. In the case of a three-level lasing system, after pumping from level 1 to 2, a fast
decay occurs from 2 to 3 leading to population inversion between levels 3 and 1. The lasing is
observed by transition from 3 to 1. In a four-level lasing system, upon pumping from level 1 to 2,
a fast non-radiative decay leads to population inversion between levels 3 and 4. The lasing
occurs by transition from levels 3 to 4. Fast decay from level 4 to 1 makes the population
inversion more efficient.
Figure 8 (a) Three-level and (b) Four-level lasing systems
A laser beam is unique because of its directional nature i.e. produces highly parallel
beam, monochromatic (i.e. generates a very narrow wavelength range), extremely bright (i.e.

58
power emitted per unit area per unit solid angle is very high), and coherent nature (i.e.
electromagnetic waves are in phase).
2.3.1 Nd:YAG and Harmonic Generation
The neodymium-yttrium aluminium garnet (Nd:YAG) is a solid state laser that has
embedded Nd3+ ions in a solid matrix (a synthetic mineral) called yttrium aluminium garnet
(Y3Al5O12). The Nd3+:YAG rod is 6-9 cm long and has 0.5-2.0% by weight of Nd3+ ions.40 The
ground configuration of Nd3+ is KLM4d104f35s25p6 and the important terms arising from this
configuration are 4I and 4F. Figure 9(a) shows the energy levels of multiplets arising from 4I and
4F terms of free Nd3+ ions. Figure 9(b) shows the 4F3/2 state split into two components due to
crystal field interactions and 4I11/2 splits into six components. The laser action involves the
transition of 4F3/2-4I11/2 that occurs at 1.064 µm. It can be seen in the figure that 4F3/2 is the lowest
energy of 4F term while 4I11/2 is not the lowest energy state. This indicates that Nd:YAG is a four-
level laser. The transition that is important for laser has Δῦ (wave number) = 9391 cm-1 that
corresponds to Δλ (wavelength) = 1064 nm at room temperature.

59
Figure 9. Energy levels in (a) Free Nd3+ and (b) Nd3+ split by crystal field interactions40
Nd:YAG laser that operates at fundamental wavelength of 1064 can be frequency
doubled, tripled, and quadrupled to obtain wavelengths of 532 nm, 355 nm, and 266 nm
respectively. This can be achieved by harmonic generation.
2.3.1.1 Harmonic Generation40
The relation between the oscillating electric field (E) of light propagating in a medium
with the induced dipole moment (μ) and polarizability (α) is given by equation 7.
.......E.E.E.E241E.E.E
61E.E
21E +δ+γ+β+α=µ Eq. (7)
where β is the hyperpolarizability, γ the second hyperpolarizability, and δ the third
hyperpolarizability. These second and third terms are non-linear in E. Because of high laser

60
power these terms become significant and lead to harmonic generation. The magnitude of the
oscillating electric field can be given by equation 8.
t2sinAE πν= Eq. (8)
where A is the amplitude and ν the frequency. The square of the electric field in equation 8 can
therefore be written as
)t22cos1(A21)t2(sinAE 2222 νπ−=πν= Eq. (9)
The cosine term in equation 9 has twice the frequency than the fundamental radiation. This
process of frequency doubling is called second harmonic generation. Although fourth harmonics
can be obtained directly from the 3rd and 4th term of equation 7, higher conversion is obtained by
doubling the 2nd harmonic with a second crystal. Third harmonic generation is obtained by
frequency mixing of the fundamental at 1064 nm with the second harmonic at 532 following a
similar mechanism.
To achieve the second, third and fourth harmonic generations experimentally, various
crystalline materials are commercially available. Some of the examples include potassium
pentaborate (KB5O8, KPB), β-barium borate (BaB2O4, BBO), and lithium niobate (Li3NbO4) that
are suitable for the limited wavelength range. In the present experiments BBO crystals are used.
The efficiency of frequency doubling is 20 to 30%.
2.3.1.2 Q-Switching40
The quality factor or the resolving power of the laser cavity is defined by equation 10.

61
ν∆ν
=Q Eq. (10)
where ν is the frequency and Δν is the line width of the laser radiation. The relation of Q with the
energy stored in the cavity (Ec) and the energy allowed to leak out (Et) during a time t is given by
the equation 11.
t
c
EtE2Q πν
= Eq. (11)
In Q-switching operation, the Q of a laser cavity is reduced for a very short period of time. This
prevents the oscillation of laser radiation between the cavity mirrors. During this time the
population inversion in the upper level increases. Then Q is allowed to increase rapidly resulting
in very short pulses. This cycle is repeated.
In this research, the third and fourth harmonic of a Continuum Surelite III-10 Nd:YAG
(10 Hz) laser were used to photolyze HONO at 355 nm and H2O2 at 266 nm, respectively. The
photolysis beam utilized had an average diameter of ~7.5 mm with maximum measured laser
fluence at the entrance of the reaction cell of 147 mJ/cm2. The second harmonic of a Nd:YAG
(532 nm) was used to pump a dye laser. Table 2 shows the specifications that includes beam
diameter, beam energy, and pulse widths for Surelite III-10 Nd:YAG lasers..41 The beams were
horizontally polarized at 1064, 355 and 266 nm and vertically polarized at 532 nm.

62
Table 2. Specifications of Nd:YAG laser
Beam diameter 9.5 mm Energy 1064 nm 850 mJ 532 nm 425 mJ 355 nm 165/225 mJ 266 nm 100 mJ Pulse width 1064 nm 4-6 ns 532 nm 3-5ns 355 nm 3-5 ns 266 nm 3-5 ns
Figure 10 shows the plot of intensity of Nd:YAG laser versus time in nanoseconds. The
pulse width of Nd:YAG laser at 1064 nm is approximately 6 ns and is very shorter than the
reaction time.
Figure 10. Nd:YAG laser profile at 1064 nm
2.3.2 Tunable Dye Laser
A dye laser is tunable over a wide range of wavelength and has an organic liquid dye as
active medium. These dyes have strong visible absorptions from the ground electronic state (S0)
to the first excited singlet state (S1). The dye has oscillator strengths (related to the probability of

63
transition) nearly equal to 142,43 and fluorescence quantum yield (number of molecules
fluorescing/number of quanta absorbed) nearly equal to 1.44 In the present research, Rhodamine
590 (Rhodamine 6G) dissolved in methanol is used.
Figure 11. Energy level scheme for a dye molecule nine processes important in laser
action40
Figure 11 shows the energy level diagram for a dye molecule. S0, S1, and S2 are the
lowest electronic singlet states whereas T1 and T2 are the triplet states. These states comprise
vibrational and rotational sub-levels that appear as continuum due to interaction with the liquid
solvent. The population inversion can be achieved in S1 or S2 as shown in the Figure 11 by 1 and
2 absorption. Here the collisional or vibrational-rotational relaxation occurs by processes labeled
3 and 4 within 10 picoseconds (ps). Lasing occurs between the bottom of the S1 band and the S0
band and from there relaxation process occurs (6) to the bottom of the band. The population of S1
can also decay due to process 7 (intersystem crossing). The lifetime of molecules in T1 is long

64
ranging from 100 ns to 1 ms, due to the forbidden T1-S1 transition (process 9) therefore building
up the concentration of molecules. The spin allowed transition T1-T2 can occur even by the
fluorescence from 5 and can decrease the efficiency of laser. This can be prevented by pulsed
pumping method allowing enough time for S1-S0 relaxation.
Figure 12 shows the structure of the Rhodamine 590 (Rhodamine 6G) dye that was used
in this research, with a lasing maximum at 560 nm.45 The X- is ClO4-. A solution in methanol
was used for the oscillator and amplifier. The concentration of dye in methanol used in the
oscillator was 5.25 × 10⁻⁵ M and amplifier was 7.77 × 10⁻⁵ M. The oscillator operates through
population inversion within the optical cavity. The Amplifier operates through population
inversion without optical oscillation. This means that the beam passes once and the amplifier
cavities amplify the beam power.
O
CO2CH3
H5C2HN
X=Cl-,BF4- or ClO4-
NH2(C2H5)2
CH3
X-
H3C
Figure 12. Structure of Rhodamine 590 dye
Table 3 shows the specifications that includes energy, beam diameter, polarization,
tuning range, etc. for the dye laser pumped by second harmonic of Nd:YAG laser.46

65
Table 3. Specifications of tunable dye laser
Fundamental wavelength (560 nm) Energy 300 mJ/pulse Tuning range 380-980 nm Beam diameter 3-6 mm Efficiency >30% Pump energy 532 nm 100-1000 mJ 355 nm 85-400 mJ Polarization Output with 532 nm pumping vertical Output with 355 nm pumping vertical With high resolution single grating Tuning range in the UV region 380-590 nm Tuning range with wavelength extension 206-980 nm
2.3.3 Photomultilier Tube (PMT)
A photomultiplier tube is a photo-sensitive device or photodetector that has extremely
high sensitivity (low-light-level detection). A photomultiplier tube consists of a photocathode,
focusing electrodes, dynodes or electron multipliers, and an electron collector or anode in a
vacuum tube. It works by external photoelectric effect and provides ultra-fast response. As light
strikes the photocathode, it emits photoelectrons. These electrons are focused using set of
electrodes and multiplied by dynodes or electron multipliers through secondary electron-
emission. The multiplied photoelectrons are collected by an anode or electron collector. The
secondary emission electron multiplication is responsible for the extremely high sensitivity. The
photomultiplier tube has a very fast time response, very low noise and works in UV, visible, and
near IR regions.47,48
The photomultiplier tube used in this research had a side-on configuration (R928,
Hamamatsu) and was operated at 500-850 V. Side-on configuration implies that the

66
photocathode lies on the side and receives light unlike head-on configuration where
photocathode lies on top and receives light from the top part. A side-on PMT has a reflection
mode photocathode or opaque photocathode reflecting the ejected photoelectrons to the first
dynode. A head-on PMT operates according to a transmission mode (semi-transparent)
photocathode which transmits the ejected photoelectrons in to the vacuum.47 Figure 13 shows the
opaque or reflection mode photocathode in a circular cage used in side-on PMT. When light
strikes the photocathode, photoelectrons make their way to the first dynode.
Figure 13. Reflection mode photocathode in a circular cage in side-on photomultiplier
tube47
In a side-on configuration, the PMT has a circular cage multiplier resulting in high
sensitivity (cathode sensitivity ranges from 18-3.5 mA/W at 194-852 nm and anode sensitivity
ranges from 1.8×10⁵-3.5×10⁴ A/W at 194-852 nm) and amplification at low voltage.47 Circular
cage multiplier is compact and provides fast time response (anode pulse time rise is 2.2 ns) but
are limited by dark currents.47 Dark current is produced even if the PMT is operated in
completely dark place. One of the main reasons for dark current is the thermionic emission from
photocathode and dynodes due to their very low work functions. This can be avoided by
decreasing the temperature.47

67
The photocathode in a side-on configuration is made of alkali metals of low work
functions. The multialkali (Na-K-Sb-Cs) photocathode results in wide spectral response ranging
from UV to near IR region (185-900 nm). The window placed before the photocathode acts as
the wavelength filter that transmits UV and visible light up to 185 nm.48,49
2.4 Kinetic Measurements
2.4.1 LIF Measurements
The reactions of hydroxyl radicals with polycyclic aromatic hydrocarbons were studied
by laser spectroscopy using two kinds of lasers (Nd:YAG and tunable dye). The output of laser
beam from the Nd:YAG was directed to the reaction chamber using highly reflecting mirrors of
25 mm diameter and 5 mm thickness. For 355 nm, NB1-K08 mirrors from Thorlabs were used
whereas for 266 nm NB1-K04 mirrors were used. The frequency doubled dye laser beam (282
nm) was directed to the reaction chamber using UV right angle prism of 20 mm diameter
(Thorlabs PS608). The fluorescence from the hydroxyl radicals was detected using the
photomultiplier tube (Hamamtsu R928) orthogonal to the laser beams. Before the PMT, two
uncoated fused silica plano convex lenses of diameter 25.4 mm and focal length of 25 mm
(LA4663) from Thorlabs were used to image the fluorescence signal to the PMT photocatode. In
addition, a bandpass filter at 310 nm (fwhm ±10 nm) was placed just before the PMT to collect
fluorescence signal.
The kinetic measurements of the reaction of the hydroxyl radicals with polycyclic
aromatic hydrocarbons occur in the microsecond time-scale. The time available for reaction was
varied by delaying the probe laser relative to the pump laser. The timing scheme and the details
of the kinetic measurements are discussed in the following sub-sections.

68
2.4.2 Pump-Probe Timing
Figure 14. Timing between the pump and probe lasers
Figure 14 shows the timing of the pump and probe lasers employed to measure the
kinetics of the bimolecular reactions. The pump and probe lasers trigger 240 μs after the
flashlamps lamp (Q-switch time). The triggering of the pump (Nd:YAG) laser corresponds to the
formation of the hydroxyl radicals whereas the triggering of probe (dye) laser corresponds to
their detection. The timing is controlled by a delay generator (DG 535) with an internal time
trigger reference. In the experiments, the trigger of the dye laser flash lamp was fixed relatively
to the trigger origin. The trigger of the Nd:YAG pump laser was varied relative to the dye laser
flash lamp trigger. A negative delay time corresponded to the Nd:YAG laser firing before the
dye laser. A positive delay corresponded to the dye laser firing first. The available time for the
reaction to occur was therefore the opposite of the laser delay-time. During the experiments, the
probe laser was initially set to trigger before the pump laser to observe the baseline. The data
were usually taken for reaction times ranging from -100μs to 500μs. Reaction times between -
100 to 0 μs corresponded to baseline, as no radicals were generated before the probe laser. At 0
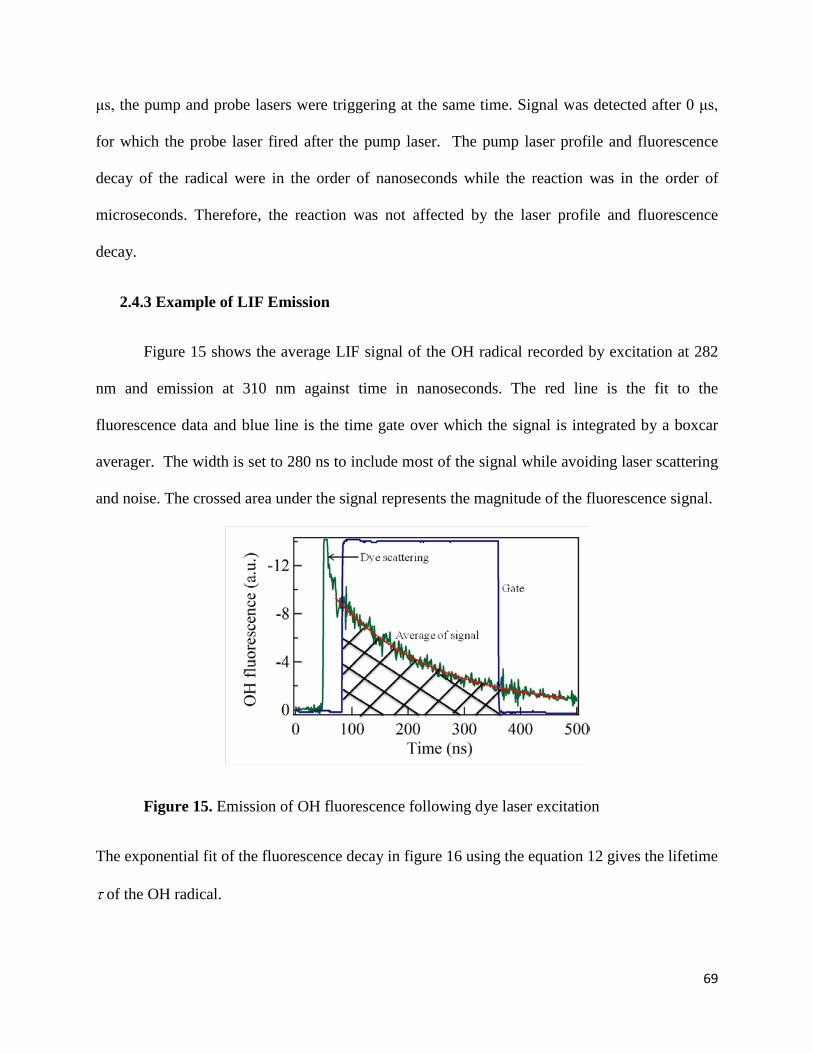
69
μs, the pump and probe lasers were triggering at the same time. Signal was detected after 0 μs,
for which the probe laser fired after the pump laser. The pump laser profile and fluorescence
decay of the radical were in the order of nanoseconds while the reaction was in the order of
microseconds. Therefore, the reaction was not affected by the laser profile and fluorescence
decay.
2.4.3 Example of LIF Emission
Figure 15 shows the average LIF signal of the OH radical recorded by excitation at 282
nm and emission at 310 nm against time in nanoseconds. The red line is the fit to the
fluorescence data and blue line is the time gate over which the signal is integrated by a boxcar
averager. The width is set to 280 ns to include most of the signal while avoiding laser scattering
and noise. The crossed area under the signal represents the magnitude of the fluorescence signal.
Figure 15. Emission of OH fluorescence following dye laser excitation
The exponential fit of the fluorescence decay in figure 16 using the equation 12 gives the lifetime
τ of the OH radical.

70
τ−
=t
0 e]A[]A[ Eq. (12)
[A]0 is the concentration of radical in the ground electronic state. The fit in Figure 15 yields a
lifetime for the OH radical of 179 ns.
After getting the optimum OH fluorescence signal, the radical number density temporal
profiles were obtained by averaging 20 laser shots per point while changing the delay time
between the lasers using a delay generator (Stanford research systems, DG535). A GPIB
interface paired to a PC running LabView was used to average, store and analyze the data for the
reaction of OH radical with propene, butene, acetaldehyde, and benzene.
2.4.4 Pseudo First Order Approximation
The reaction of hydroxyl radical with polycyclic aromatic hydrocarbon precursor is
overall a second order reaction. To avoid the complexity of measuring the reactant
concentrations of both species simultaneously, the experiments were performed under pseudo-
first order approximation. In this case, one of the reactants is introduced in large excess and can
be assumed constant relative to the concentration of the other reactant. Hydroxyl radical reacts
with the gaseous reactant (A) to give products with a second order rate coefficient k which is to
be determined. Hydroxyl radicals also react with other molecules such as its precursor or with
other OH radicals to give products with rate coefficient k' as shown below.
AOHk Products
(R3)
k'OHOther molecules Products (R4)

71
The rate law equation of the above two reactions R3 and R4 can be written as
[OH]molecules][Otherk'k[OH][A]dt
d[OH]−−= Eq. (13)
}dtmolecules][Otherk'k[A]{[OH]d[OH]
+−= Eq. (14)
Applying pseudo first order approximation, the concentrations of the reactant A and other
molecules are assumed to be independent on reaction time i.e. the concentrations of A and other
molecules is very large compared to the concentration of hydroxyl radical.
[A] and [Other molecules] >> [OH]
Integrating the above rate law equation 14
[ ] [ ] [ ]{ }∫∫ +−=t
0
t
0dtmoleculesOther'kAk
dtOHd Eq. (15)
tk]OH[]OH[ln st10
−= Eq. (16)
where st1k = {k[A]+k'[Other molecules]
k1st is the pseudo first order rate coefficient. The concentration of the OH radicals in the cell as a
function of the delay between the two lasers ∆t can be written as:
tk0t
st1e]OH[]OH[ ∆−= Eq. (17)
The relative concentration of hydroxyl radical as a function of reaction time is obtained
by plotting the LIF signal intensity as a function of laser delay time:

72
Δtk0
st1eLIFLIF −= Eq. (18)
The values of k1st can then be determined by fitting the experimental data to an
exponential decay. Experimentally, the temporal profiles of the relative OH concentration are
recorded for multiple concentration of the co-reactant A.
The second order rate coefficient k is determined by plotting the k1st values as a function
of various number densities of the reactant (PAH precursor) and fitted to a straight line. The
slope of this straight line gives the rate coefficient of the reaction of hydroxyl radical with the
reactant. Figure 16 shows the k1st vs the concentration of propene at 5 Torr and room
temperature, one of the reactants used to validate the experimental set up. The slope of the linear
fit is equal to the second-order rate coefficient (k2nd).
Figure 16. A plot of k1st vs number density of propene at 5 Torr. The line is obtained
using a linear fit to the data and k2nd values are presented with 2σ precision
2.5 Experimental Validation
The experimental set up to measure the kinetics of hydroxyl radicals with polycyclic
aromatic hydrocarbon precursors in the laboratory was validated by measuring the reaction

73
kinetics of hydroxyl radical with propene,50 butene,51 acetaldehyde,52 and benzene53 that are well
known in the literature.
2.5.1 OH + Propene, Butene, Acetaldehyde, and Benzene
Validation of the experimental setup is achieved by measuring the rates of reaction of OH
+ propene (C3H6), trans-2-butene (C4H8), acetaldehyde (CH3CHO), and benzene (C6H6). Propene
and trans-2-butene were purchased from Matheson Tri Gas and used without further purification.
Propene was regulated using Harris compressed gas regulator (model no. 25-15C) and trans-2-
butene was regulated using Matheson regulator (model no. 3320B) to inject into the reaction
chamber. Benzene was purchased from Sigma Aldrich (HPLC grade, >99.9% pure) and put
inside the bubbler. It was carried to the reaction chamber using helium carrier gas. Acetaldehyde
was purchased from Sigma Aldrich (anhydrous, GC grade >99.9% pure). It was placed in the
bubbler contained in ice-water bath. Then it was evaporated and collected in cylinders to make
5%, 10%, and 15% mixture in helium buffer gas. The measured rates coefficients listed in Tables
4a and 4b agree well with published literature.52,54 The high temperature setup was tested and
validated by measuring rates of reaction of OH + propene over a temperature range of 293-450
K. The observed inverse temperature dependence of the rate constant (see table 4b) is consistent
with trends in published literature.55
Table 4a. Rate coefficients (cm3 s-1) of the validation reactions compared to published literature
Reaction This work Literature reviews Reaction rate Experimental
conditions Reaction Rate Experimental
conditions OH + propene 2.13(±0.40).10-11 T=296 K, P=5 Torr 2.74.10-11 50 T=296 K; P=30 Torr OH + butene 5.2(±0.11).10-11 T=296 K, P=5 Torr 6.99(±0.70).10-11
51 T=296 K; P=50 Torr
OH + acetaldehyde 1.56(±0.40).10-11 T=296 K, P=5 Torr 1.52(±0.15).10-11
52 T=296 K; P=100 Torr
OH + benzene 1.30(±0.23).10-12 T=296 K, P=5 Torr 1.36(±0.09).10-12 53 T=296 K; P=20 Torr
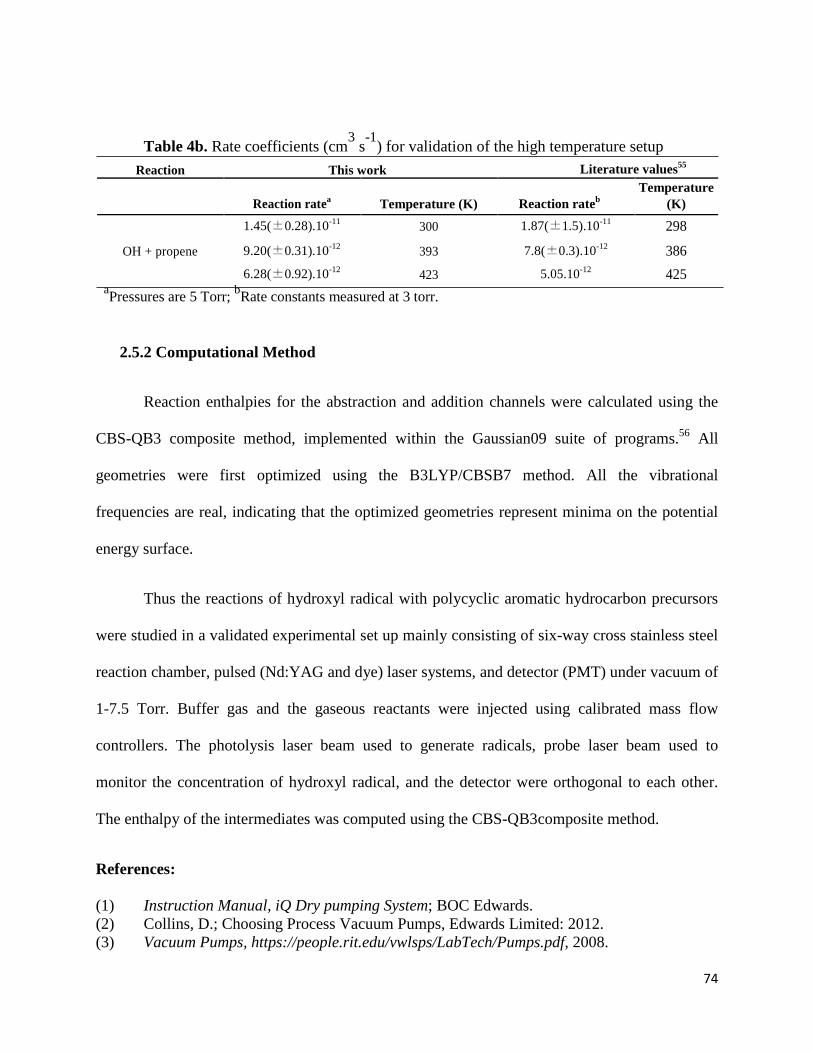
74
Table 4b. Rate coefficients (cm3 s-1) for validation of the high temperature setup Reaction This work Literature values55
Reaction ratea Temperature (K) Reaction rateb Temperature
(K)
1.45(±0.28).10-11 300 1.87(±1.5).10-11 298 OH + propene 9.20(±0.31).10-12 393 7.8(±0.3).10-12 386
6.28(±0.92).10-12 423 5.05.10-12 425 aPressures are 5 Torr; bRate constants measured at 3 torr.
2.5.2 Computational Method
Reaction enthalpies for the abstraction and addition channels were calculated using the
CBS-QB3 composite method, implemented within the Gaussian09 suite of programs.56 All
geometries were first optimized using the B3LYP/CBSB7 method. All the vibrational
frequencies are real, indicating that the optimized geometries represent minima on the potential
energy surface.
Thus the reactions of hydroxyl radical with polycyclic aromatic hydrocarbon precursors
were studied in a validated experimental set up mainly consisting of six-way cross stainless steel
reaction chamber, pulsed (Nd:YAG and dye) laser systems, and detector (PMT) under vacuum of
1-7.5 Torr. Buffer gas and the gaseous reactants were injected using calibrated mass flow
controllers. The photolysis laser beam used to generate radicals, probe laser beam used to
monitor the concentration of hydroxyl radical, and the detector were orthogonal to each other.
The enthalpy of the intermediates was computed using the CBS-QB3composite method.
References:
(1) Instruction Manual, iQ Dry pumping System; BOC Edwards. (2) Collins, D.; Choosing Process Vacuum Pumps, Edwards Limited: 2012. (3) Vacuum Pumps, https://people.rit.edu/vwlsps/LabTech/Pumps.pdf, 2008.

75
(4) Fundamentals of Vacuum Technology; Umrath, W., Ed.; Oerlikon Leybold Vacuum, 2007.
(5) Dillon, T. J.; Tucceri, M. E.; Sander, R.; Crowley, J. N. Physical Chemistry Chemical Physics 2008, 10, 1540.
(6) Herbert, L. B.; Sims, I. R.; Smith, I. W. M.; Stewart, D. W. A.; Symonds, A.; Canosa, A.; Rowe, B. R. Journal of Physical Chemistry 1996, 100, 14928.
(7) Dejuan, J.; Smith, I. W. M.; Veyret, B. Journal of Physical Chemistry 1987, 91, 69. (8) Dejuan, J.; Smith, I. W. M.; Veyret, B. Chemical Physics Letters 1986, 132, 108. (9) Perry, R. A. Journal of Chemical Physics 1985, 82, 5485. (10) Onel, L.; Blitz, M. A.; Breen, J.; Rickardcd, A. R.; Seakins, P. W. Physical Chemistry
Chemical Physics 2015, 17, 25342. (11) Onel, L.; Blitz, M. A.; Seakins, P. W. Journal of Physical Chemistry Letters 2012, 3, 853. (12) Wollenhaupt, M.; Carl, S. A.; Horowitz, A.; Crowley, J. N. Journal of Physical
Chemistry A 2000, 104, 2695. (13) Dillon, T. J.; Crowley, J. N. Atmospheric Chemistry and Physics 2008, 8, 4877. (14) Baasandorj, M.; Ravishankara, A. R.; Burkholder, J. B. Journal of Physical Chemistry A
2011, 115, 10539. (15) Rajakumar, B.; Burkholder, J. B.; Portmann, R. W.; Ravishankara, A. R. Physical
Chemistry Chemical Physics 2005, 7, 2498. (16) Bocherel, P.; Herbert, L. B.; Rowe, B. R.; Sims, I. R.; Smith, I. W. M.; Travers, D.
Journal of Physical Chemistry 1996, 100, 3063. (17) Vakhtin, A. B.; Heard, D. E.; Smith, I. W. M.; Leone, S. R. Chemical Physics Letters
2001, 344, 317. (18) Goulay, F.; Leone, S. R. Journal of Physical Chemistry A 2006, 110, 1875. (19) Robertshaw, J. S.; Smith, I. W. M. Journal of Physical Chemistry 1982, 86, 785. (20) Blitz, M. A.; Pesa, M.; Pilling, M. J.; Seakins, P. W. Journal of Physical Chemistry A
1999, 103, 5699. (21) Rudich, Y.; Talukdar, R.; Burkholder, J. B.; Ravishankara, A. R. Journal of Physical
Chemistry 1995, 99, 12188. (22) Porter, G. Science 1968, 160, 1299. (23) Smith, I. W. M. Berichte Der Bunsen-Gesellschaft-Physical Chemistry Chemical Physics
1982, 86, 395. (24) Bach, R. D.; Ayala, P. Y.; Schlegel, H. B. Journal of the American Chemical Society
1996, 118, 12758. (25) Amaral, G.; Xu, K. S.; Zhang, J. S. Journal of Physical Chemistry A 2001, 105, 1465. (26) Reiche, F.; Abel, B.; Beck, R. D.; Rizzo, T. R. Journal of Chemical Physics 2000, 112,
8885. (27) Brust, A. S.; Becker, K. H.; Kleffmann, J.; Wiesen, P. Atmospheric Environment 2000,
34, 13. (28) Ning, C. L.; Pfab, J. Journal of Physical Chemistry A 1997, 101, 6008. (29) Schiffman, A.; Nelson, D. D.; Nesbitt, D. J. Journal of Chemical Physics 1993, 98, 6935. (30) Mishra, D. P. Experimental combustion : an introduction, 2014. (31) German, K. R. Journal of Chemical Physics 1975, 63, 5252. (32) German, K. R. Journal of Chemical Physics 1975, 62, 2584. (33) Hogan, P.; Davis, D. D. Chemical Physics Letters 1974, 29, 555.

76
(34) Goulay, F.; Rebrion-Rowe, C.; Le Garrec, J. L.; Le Picard, S. D.; Canosa, A.; Rowe, B. R. Journal of Chemical Physics 2005, 122.
(35) Goulay, F.; Rebrion-Rowe, C.; Biennier, L.; Le Picard, S. D.; Canosa, A.; Rowe, B. R. J. Phys. Chem. A 2006, 110, 3132.
(36) Trevitt, A. J.; Goulay, F.; Taatjes, C. A.; Osborn, D. L.; Leone, S. R. J. Phys. Chem. A 2010, 114, 1749.
(37) Sappey, A. D.; Crosley, D. R.; Copeland, R. A. Applied Physics B-Photophysics and Laser Chemistry 1990, 50, 463.
(38) Kiefer, J.; Li, Z. S.; Seeger, T.; Leipertz, A.; Alden, M. Proc. Comb. Inst. 2009, 32, 921. (39) Klein-Douwel, R. J. H.; Luque, J.; Jeffries, J. B.; Smith, G. P.; Crosley, D. R. Appl. Opt.
2000, 39, 3712. (40) Hollas, J. M. Modern spectroscopy; J. Wiley: Chichester; Hoboken, NJ, 2004. (41) Nd:YAG Laser Specifications, Continuum, The High Energy Laser Company. (42) Kazakevicius, A.; Peckus, D.; Boiko, O.; Valkunas, L.; Leonenko, E.; Telbiz, G.;
Gulbinas, V. Journal of Physical Chemistry C 2015, 119, 19126. (43) Wiedmann, J.; Penzkofer, A. Nuovo Cimento Della Societa Italiana Di Fisica B-General
Physics Relativity Astronomy and Mathematical Physics and Methods 1981, 63, 459. (44) Kubin, R. F.; Fletcher, A. N. Journal of Luminescence 1982, 27, 455. (45) Zehentbauer, F. M.; Moretto, C.; Stephen, R.; Thevar, T.; Gilchrist, J. R.; Pokrajac, D.;
Richard, K. L.; Kiefer, J. Spectrochimica Acta Part a-Molecular and Biomolecular Spectroscopy 2014, 121, 147.
(46) Dye Laser Specifications, Continuum, The High Energy Laser Company. (47) Hamamatsu Photonics, Photomultiplier Tubes, Construction and Operating
Characteristics, Connections to External Circuits; Photonics, H., Ed.; Hamamatsu Photonics.
(48) Skoog, D. A.; Holler, F. J.; Crouch, S. R. Principles of instrumental analysis, 2007. (49) K.K., H. P. Photomultiplier Tubes-Basics and Applications; Third ed.; Hamamatsu
Photonics K.K., 2007. (50) Tully, F. P.; Goldsmith, J. E. M. Chemical Physics Letters 1985, 116, 345. (51) Atkinson, R.; Pitts, J. N. Journal of Chemical Physics 1975, 63, 3591. (52) Zhu, L.; Talukdar, R. K.; Burkholder, J. B.; Ravishankara, A. R. International Journal of
Chemical Kinetics 2008, 40, 635. (53) Davis, D. D.; Bollinger, W.; Fischer, S. Journal of Physical Chemistry 1975, 79, 293. (54) Vakhtin, A. B.; Murphy, J. E.; Leone, S. R. Journal of Physical Chemistry A 2003, 107,
10055. (55) Smith, R. H. Journal of Physical Chemistry 1983, 87, 1596. (56) Frisch, M. J. T., G. W.; Schlegel, H. B.; Scuseria, G. E.; Robb, M. A.; Cheeseman, J. R.;
Scalmani, G.; Barone, V.; Mennucci, B.; Petersson, G.A. et.al. Gaussian 09 2009

77
Chapter 3: Reaction of the OH Radical with Phenylacetylene
3.1 OH Radical Reaction with Aromatic Molecules
The OH radical is one of the most abundant radical in combustion flames. Its reaction
with benzene and substituted benzene molecules has been extensively studied both
experimentally1-13 and theoretically.14,15 At room9,12 temperature and intermediate11 temperatures
the dominant reaction entrance channel is predicted to be governed by electrophilic attack of the
radical onto the aromatic ring to form a Van der Waals association complex. This pre-reactive
complex isomerizes to a more stable addition intermediate which may decompose back to the
reactants, be stabilized by collisional quenching, or decompose to give the final products.9 In the
case of a long-lived addition intermediate the decomposition back to the reactants leads to bi-
exponential decays of the OH radical concentration as observed for reactions with benzene,
bromobenzene, toluene and its derivative.2,11 The presence of a substituent on the aromatic ring
will affect the reaction rate by decreasing (electron donating or electron releasing or activating)
or increasing (electron withdrawing or deactivating groups) the Gibbs free energy for the
formation of the initial complex relatively to that of the OH–benzene complex.11 Witte et al.11
expressed this correlation using the Hammett equation16 that describes the electrophilic attack,
specifically the addition to the aromatic ring. This equation relates the logarithm of the ratio of
the rate coefficient for reaction of OH with a given molecule over that for benzene as a function
of substituent constants as shown in equation 1.11
σρ=)kklog(
0
Eq. (1)
where σ is the substituent constant that relates the observed electronic (inductive or resonance)
effect that a particular substituent imparts to the aromatic ring. Electron withdrawing substituents
(e.g. -NO2) have positive σ and electron donating substituents (e.g. -NH2) have negative σ. The
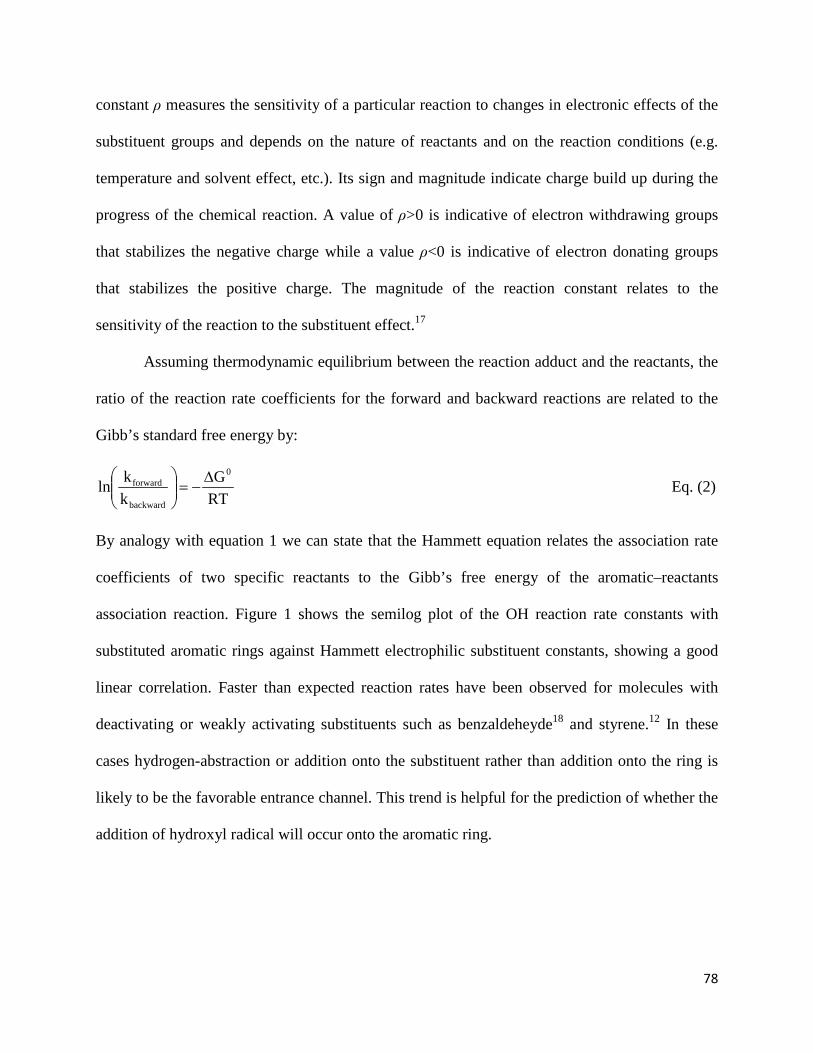
78
constant ρ measures the sensitivity of a particular reaction to changes in electronic effects of the
substituent groups and depends on the nature of reactants and on the reaction conditions (e.g.
temperature and solvent effect, etc.). Its sign and magnitude indicate charge build up during the
progress of the chemical reaction. A value of ρ>0 is indicative of electron withdrawing groups
that stabilizes the negative charge while a value ρ<0 is indicative of electron donating groups
that stabilizes the positive charge. The magnitude of the reaction constant relates to the
sensitivity of the reaction to the substituent effect.17
Assuming thermodynamic equilibrium between the reaction adduct and the reactants, the
ratio of the reaction rate coefficients for the forward and backward reactions are related to the
Gibb’s standard free energy by:
RTG
kkln
0
backward
forward ∆−=
Eq. (2)
By analogy with equation 1 we can state that the Hammett equation relates the association rate
coefficients of two specific reactants to the Gibb’s free energy of the aromatic–reactants
association reaction. Figure 1 shows the semilog plot of the OH reaction rate constants with
substituted aromatic rings against Hammett electrophilic substituent constants, showing a good
linear correlation. Faster than expected reaction rates have been observed for molecules with
deactivating or weakly activating substituents such as benzaldeheyde18 and styrene.12 In these
cases hydrogen-abstraction or addition onto the substituent rather than addition onto the ring is
likely to be the favorable entrance channel. This trend is helpful for the prediction of whether the
addition of hydroxyl radical will occur onto the aromatic ring.

79
Figure 1. Plot of OH radical reaction rate coefficients against electrophilic substituent
constants for monosubsituted aromatic compounds.11 The red dot is for phenylacetylene19
3.2 Phenylacetylene in Combustion
Phenylacetylene has been detected in the fuel rich premixed flames of monocyclic
aromatic hydrocarbons20, the pyrolysis of cyclohexane21 and is believed to contribute to the
formation of polycyclic aromatic hydrocarbon (PAH)22. Spectroscopic evidence has suggested
that phenylacetylene is one of the dissociative product of naphthalene.23 In addition,
phenylacetylene along with naphthalene have been observed by photoionization mass
spectrometry under combustion like conditions.24 As seen in Chapter 1, phenylacetylene is likely
to be formed in combustion by the initial steps of the HACA mechanism, following the
formation of benzene and/or the phenyl radical. Alternatively, benzene may react with the
ethynyl radical (C2H) to form phenylacetylene through an addition/H-loss mechanism.25-27 The
mostly likely reactions leading to phenylacetylene formation in combustion are summarized in
scheme 1.

80
C2H2
CCH
H
C C H
CCH
H
Scheme 1. Phenyl radical reacts with gaseous acetylene to form phenylacetylene or
benzene reacts with ethynyl radical to form phenylacetylene
Once formed, consecutive reactions of phenylacetylene with atomic hydrogen and
acetylene (scheme 2) may lead to the formation of the first PAH, naphthalene (C10H8).28,29
H- H2
CCH
C2H2
CCH
Scheme 2. Phenylacetylene radical formed from phenylacetylene reacts with gaseous
acetylene to form naphthalene
Despite its crucial importance in combustion, there is limited information about the OH +
phenyl acetylene reaction30 and no kinetic information is available. Combustion models assume
the reaction to mostly proceed through abstraction with a reaction rate slower than that of OH +
benzene.29,31 Indeed, the deactivating effect of the ethynyl group (-C2H) is expected to decrease
the rate of association with the aromatic ring. Electron delocalization effects and interaction of
the radical with the π-electrons of the triple bonds are however, likely to lead to a rate that does
not follow the empirical rule provided by Witte et al.11 The reaction rate coefficient of the OH +

81
phenylacetylene reaction was measured over the 300–430 K temperature range in order to
investigate the most likely reaction mechanism.
3.3 Number Density of Phenylacetylene
Phenylacetylene was purchased from Sigma Aldrich (98%) and used without further
purification. It is a yellow liquid at room temperature with 17.6 Torr vapor pressure at 37.7 ºC.
Approximately 5mL of phenylacetylene was placed inside a bubbler contained in a regulated
temperature bath (ISOTEMP 1016S). The bath was filled with water and cooled to 15 ºC to
prevent excess vaporization of phenylacetylene. It was completely degassed before use and the
pressure was monitored using a baratron pressure gauge. A flow of 100 sccm of helium was
passed through the liquid to carry the phenylacetylene vapors. The fraction of phenylacetylene
vapors in the flow was controlled using a needle valve placed just after the bubbler. Its vapor was
introduced into a UV absorption cell used to measure the number density of phenylacetylene
before mixing with buffer gas (helium) and OH radical precursor in a mixing cylinder.
Figure 2. Schematic of experimental set up to determine the cross-section of
phenylacetylene at 266 nm
The number density of phenylacetylene was measured prior to its injection into the

82
reaction chamber using UV-light absorption. Figure 2 displays a schematic of the experimental
setup used for the light absorption measurements. The UV absorption cell is a ~19 cm long
stainless steel tube cylinder terminated by two 1ʺ quartz windows, and maintained at room
temperature. The transmitted intensities of a 254 nm mercury pen ray lamp after absorption by
phenylacetylene were measured using a photo diode (Thorlabs–DET10A, Si Detector, 200–1100
nm). The phenylacetylene absorption cross-section at 254 nm is σ254nm=3.82×10⁻¹⁸ cm2.41
Capacitance manometers were used to measure the pressures in both the absorption cell and the
bubbler. The number density of phenylacetylene in the absorption cell, nabs, were regulated by
varying the total pressure in the bubbler at a constant bath temperature.
The transmitted lamp intensity was measured first without phenylacetylene and then
again after the introduction of phenylacetylene. The number density of phenylacetylene were
inferred from the value of the intensity ratios, absorption cross-section and path length using
equation 3.
abs0
nIIln σ−= Eq. (3)
where 0Ι is the initial intensity (zero absorption); Ι the intensity after absorption; σ the cross-
section of phenylacetylene and the length of the absorption cell, and nabs is the number density
in the absorption cell. With the number density in the absorption cell known, the number density
of phenylacetylene in the reaction cell, phan was calculated using the relationship of equation 4:
abs
reaction
Total
absabspha P
P.QQnn = Eq. (4)
where Qabs is the flow rate through the bubbler/absorption cell, Qtotal is the total volumetric flow
rate of gases in the reaction cell, Preaction and Pabs are pressure in the reaction vessel and
absorption cell respectively. Figure 3 shows the number densities in the reaction cell as a

83
function of bubbler pressure (Torr) together with a fit of the experimental data. The equation
generated from the fit was used for all experimental cases to determine the number density of
phenylacetylene in the experiment. Experiments were repeated at a given bubbler pressure
multiple times resulting in a total of 24 data points, to evaluate measurement errors.
Figure 3. Bubbler pressure vs number density of phenyl acetylene in the reaction cell.
The solid line represents the fit relating the bubbler pressure to the number density of
phenylacetylene, given by the equation. A, B and C are constants from the fit and Pbubb is the
bubbler pressure in Torr
3.4 Determination of the Phenylacetylene Absorption Cross-Section at 266 nm
Because the photolysis of the reactant by the pump laser may change its number density,
it is important to obtain an order of magnitude of the phenylacetylene absorption cross section at
266 nm. The experimental setup for the cross section measurements is identical to the one
depicted in Figure 2. During the experiments, the pressure in the bubbler was increased using a
needle valve to reach a pressure of around 500 Torr. At this time the bubbler was isolated from
the inlet gas and absorption cell. The absorption cell was then evacuated in order to measure the
initial intensity (I0) using either the Mercury/Neon pen-ray lamp at 254 nm or the Nd:YAG laser
beam at 266 nm. The cell was then isolated from the vacuum pump and connected to the bubbler.

84
After reaching a constant pressure, the absorption cell was isolated from the bubbler and the
transmitted intensity was recorded. The pressure was then decreased using needle valve and four
to six readings are recorded at each wavelength. The absorption cell was evacuated again to
record the initial intensity.
The cross-section of phenylacetylene was determined using the Beer’s law equation as shown in
equation 5.
kT
Pσy
IIln cellabs
0
−= Eq. (5)
I is the transmitted intensity, I0 is the initial intensity, σ is the cross-section of phenylacetylene, y
is the molar fraction of phenylacetylene in helium, Pabscell is the pressure in the absorption cell, k
is the Boltzmann constant, T is the absolute temperature in Kelvin, is the length of absorption
cell. Figure 4 shows the typical plot of 0IIln vs. pressure in the absorption cell in Torr at 254
nm. Using the above equation of Beer’s law and the known value of the phenylacetylene cross-
section of at 254 nm (3.82 x 10⁻¹⁸ cm2),32 the molar fraction of phenylacetylene in helium was
obtained from the slope of the data.

85
Figure 4. Typical plot of 0IIln vs Pabscell (Torr) at 254 nm
Figure 5 shows a typical plot of 0IIln vs. pressure in the absorption cell at 266 nm. For known y
values, the phenylacetylene cross-section at 266 nm is inferred from the slope of the data.
Figure 5. Typical plot of 0IIln vs Pabscell (Torr) at 266 nm
The uncertainty on the phenylacetylene cross-section at 266 nm is calculated using the formula
of equation 6.

86
.σy
Δys
ΔsΔσ22
+
= Eq. (6)
where Δσ is the cross-section uncertainty, and Δy the molar fraction uncertainty obtained from
the plot at 254 nm, S is the slope obtained from fit to the data at 266 nm and Δs is its uncertainty.
The uncertainty in the cross-section was calculated for each experiment and reported as two
standard deviations. Table 1 shows all the cross-section values, 2σ standard deviation and molar
fraction of phenylacetylene in helium.
Table 1. Cross-section of phenylacetylene at 266 nm, molar fraction of phenylacetylene
in helium and standard deviation for each set of experiment
Molar fraction of phenylacetylene
Cross-section at 266 nm (cm2)
Δσ (cm2)
0.025 1.42 × 10⁻¹⁷ 2.71 × 10⁻¹⁸ 0.030 1.85 × 10⁻¹⁷ 1.40 × 10⁻¹⁸ 0.049 1.03 × 10⁻¹⁷ 9.24 × 10⁻¹⁹ 0.033 1.03 × 10⁻¹⁷ 2.66 × 10⁻¹⁸ 0.021 1.08 × 10⁻¹⁷ 2.20 × 10⁻¹⁸ 0.039 7.42 × 10⁻¹⁸ 1.17 × 10⁻¹⁸ 0.034 1.42 × 10⁻¹⁷ 1.16 × 10⁻¹⁸ 0.039 1.54 × 10⁻¹⁷ 2.62 × 10⁻¹⁸
Figure 6 shows all the cross-section values plotted against molar fraction of
phenylacetylene in helium. The average of all the values is reported as the cross-section of
phenylacetylene at 266 nm with 2σ standard deviation and is 1.29 x 10⁻¹⁷ ± 7.11 x 10⁻¹⁸ cm2. The
red line is the average value of the cross-section of phenylacetylene at 266 nm. The upper black
line is the average cross-section plus 2σ standard deviation and the lower black line is the
average cross-section minus 2σ standard deviation.

87
Figure 6. Plot of cross-section of phenylacetylene at 266 nm vs molar fraction of
phenylacetylene in helium
3.5 OH Radical Precursor
3.5.1 Hydrogen Peroxide
For the initial kinetic experiments, hydrogen peroxide (H2O2, 30% by weight in H2O)
was purchased from Sigma Aldrich and used as the hydroxyl radical precursor. H2O2 was placed
inside a bubbler at room temperature. Its vapor was carried using 100 sccm of helium and mixed
with phenylacetylene and the main helium buffer gas in the mixing cylinder before injection into
the reaction chamber. H2O2 was photolysed at 266 nm using:
OH2)nm266(hOH 22 →n+
3.5.2 Nitrous Acid (HONO)
Because of the high absorption cross-section of phenylacetylene at 266 nm an OH radical
precursor at a longer wavelength had to be used. Nitrous acid readily photolyzes to OH and NO
at λ<390nm.33,34 HONO has an absorption maximum at 354.2 nm, with an absorption cross-

88
section of 2.98×10⁻¹⁹ cm-2.33 The photolysis reaction is outlined below, with corresponding
quantum yields φ.35
HONO + hν (355 nm) → OH + NO (φ=99%) (R1a)
→ H + NO2 (φ=1%) (R1b)
At this wavelength, the relative OH concentration in the reaction chamber was estimated to be on
the order of ~1011 cm-3, based on the 355-nm absorption cross-section, laser fluence and
concentration of HONO. HONO gas was prepared by reaction of NaNO2 salt with concentrated
H2SO4 acid following the reaction R2:
2NaNO2 (aq) + H2SO4 (aq) → 2HONO (g) + Na2SO4 (aq) (R2)
Figure 7. Schematic of experimental setup used for synthesis of HONO
The synthesis was based on a procedure outlined by Ning et. al. and Bagot et al.34,36
Figure 7 displays a schematic representation of the HONO synthesis set up. Aqueous solution of
sodium nitrite (NaNO2) (400 ml, 2M) was placed in a 1000 mL-three necked flask, maintained at
-16°C using a methanol-ice bath Sulfuric acid (2M, 200 ml) was held in a 250-mL pressure
equalizing dropping funnel connected to the three-necked flask via a standard ground glass joint.
A capacitance manometer was used to monitor the pressure in the setup. The synthesis began

89
with the evacuation of the setup to <20 Torr. After evacuation, 50 sccm of helium was
continuously passed through the setup via a needle valve and monitored using a mass flow
controller. Reaction was initiated by adding sulfuric acid at a rate of 0.25 drops/second from the
dropping funnel into the 3-neck flask. The reactants were stirred continuously using a magnetic
stirrer. The products of the reaction were carried by the helium through a stainless steel lines
resulting in a total regulated flow of 150 sccm. The reaction proceeded for approximately 2 hours
with a constant output flowrate. The stability and constant HONO output was ascertained by
monitoring the OH fluorescence signal over a 2-hour period, which was longer than the time
required to obtain a full kinetic data set. NO2 gas may also form due to the dissociation of
HONO, and be in equilibrium with HONO (R3).
NO2 + NO + H2O ↔ 2HONO (R3)
Preparation of HONO by the salt acid method in other studies34-36 monitored the concentrations
of NO2 and detected negligible amounts. To further ensure that no NO2 was formed, the entire
synthesis was conducted at low pressures (<200 Torr).
3.6 Protection of the Laser Windows
In order to minimize the deposition of photolytically decomposed reactants
(phenylacetylene in our case) onto the windows, one of the four arms (photolysis beam entry
arm) had a smaller cross-section (ID=0.4ʺ) with length of 8". Deposition on the widows was
avoided by countering the diffusion of phenylacetylene using a small flow (50 sccm) of helium
adjacent to the window face. Figure 8 shows the modified long arm window used in the
experiment of hydroxyl radical with phenylacetylene. It has 1/4" stainless steel tube for qcounterflow
of helium to prevent the diffusion of phenylacetylene towards the quartz window.

90
Figure 8. Long arm window to prevent the diffusion of phenylacetylene
The helium counterflow velocity was estimated using Fick’s first law of diffusion.37 It relates the
diffusion flux (J), amount of substance per unit area per unit time, to the number density gradient
dn/dx
dxdnDJ −= Eq. (7)
where D is the diffusion coefficient (units m2/s)
By definition,
nvdt.S
dt.v.S.ndt.Sdl.S.n
dt.SdV.nJ −=−=−=−= Eq. (8)
n is the number density, S the surface area, v the velocity, and l the length.
We infer that
nvdxdnD = Eq. (9)
Over a characteristic length l, the equation can be approximated to:
nvlnD = Eq. (10)
resulting in
lDv ≅ Eq. (11)
The diffusion of phenylacetylene in He is unknown. Here it was approximated to that of a He-O2

91
mixture, 0.697 cm2/s38,39 at 1 atm. As the diffusion coefficient is inversely proportional to the
pressure, the diffusion coefficient at 5 Torr is 0.0106 m2 s-1. For a characteristic length l of the
order of 1 cm the velocity is 1 m s-1.The corresponding flow rate in a tube of 0.4" diameter is 30
sccm. All the experiments were performed with a He counter flow 50 sccm. With this flow, there
was no significant deposition of phenylacetylene on the windows.
3.7 Kinetic Measurements.
3.7.1 Pseudo-First Order Kinetics Within the pseudo first order approximation, corresponding to phenylacetylene (PAH
precursor) being in large excess relative to the OH radical, the OH decay signal due to its
reaction with phenylacetylene can be expressed using the following equations:
[OH](t) = [OH](t = 0)e−k1stt Eq. (12)
k1st = k2nd [ phenylacetylene ] + k1'st Eq. (13)
where k2nd represents the second order rate constant of the OH + phenylacetylene and k1'st is the
first order rate constant due to OH reaction with precursor molecules and other contaminants
such as NO and NO2 produced during the photolysis and synthesis of HONO, respectively. The
integrated LIF signal is plotted against delay time for a known reactant number density and fitted
using equation 12 to determine the corresponding k1st.
Figure 9 shows typical decay traces plotted as a function of laser delay time for different
phenylacetylene number densities.

92
Figure 9. Typical traces of OH decays for varying concentrations of Phenyl acetylene at
photolysis laser fluence of 147 mJ/cm2. Plots are generated as a function of decay signal as a
function of delay time between the probe laser and photolysis laser, fit to a single exponential
function with corresponding residuals and k1st values.
Figure 9 also includes exponential fits for three selected number densities of phenylacetylene and
corresponding residuals at a photolysis laser power of 147 mJ cm-2. The data are fit 80 µs after
the pump laser pulse in order to avoid any effect from collisional relaxation of initially excited
OH radicals. The experiments were repeated for different concentrations of phenylacetylene.
Figure 10 shows a typical plot of k1st vs. concentration of reactant (phenylacetylene), for one data
set. The slope of the linear fit is equal to the second order rate constant (k2nd).

93
Figure 10. Typical traces of OH decays for varying concentrations of Phenyl acetylene at
photolysis laser fluence of 147 mJ/cm2. Plots are generated as a function of decay signal as a
function of delay time between the probe laser and photolysis laser, fit to a single exponential
function with corresponding residuals and k1st values.
3.7.2 Laser Power Dependence of Phenylacetylene
Rate coefficients were measured at laser fluences ranging from 30 to 147 mJ cm-2. The
laser power of the photolysis laser were tuned by changing the Q-Switch time delay in the pump
(Nd:YAG) laser. By increasing the delay time (µs) the output power can be reduced.

94
Figure 11. Power dependence of the second order rate constant (k2nd) plotted as a
function of fluence of photolysis laser at 266 nm. The error bars for individual k2nd values are 2σ
precision.
Figure 11 shows results from 266-nm experiments demonstrating a positive fluence
dependence of the second order rate constant (k2nd). The high 266-nm absorption cross-section of
phenyl acetylene possibly induces single and/or multiphoton phenomena and is likely to be
responsible for the observed fluence dependence. Since the cross-section of phenyl acetylene at
266 nm is not available in the literature, it was measured and reported in section 3.4. The
measured absorption cross-section of phenyl acetylene at 266 nm with 2σ standard deviation is
reported to be 1.29×10⁻¹⁷ ± 7.1×10⁻¹⁸ cm2. For comparison the absorption cross section of
benzene at 266 nm is 2.15 × 10⁻²⁰ cm2.40 This large absorption cross-section of phenylacetylene is
consistent with the deposition of photolytically decomposed products onto the laser windows
within few minutes of experiment. This high absorption cross-section was also likely to be
responsible for the observed power dependence of the second order rate constant (k2nd) measured
at 266 nm.

95
3.7.3 HONO as OH Precursor
The observed fluence dependence of the rate constant required an alternative source of
OH radical at a wavelength greater than 266 nm. HONO is an attractive option as its photolysis
at 355 nm results in OH radicals and NO. The absorption cross-section of phenyl acetylene at
355 nm is negligible. All further kinetic experiments were performed using 355-nm photolysis of
HONO (Nitrous acid) to produce the OH radicals.
Figure 12 displays the measured rate against laser fluence at 355 nm. The error bars are a
result of weighted averaging over the multiple experimental runs. At this wavelength and within
the experimental error bars, there is no fluence dependence of the rate constant.
Figure 12. Plot of second order rate constant (k2nd) a function of laser fluence using HONO
as radical source at 355 nm.
Figure 13 shows the first order rate constant (k1st) plotted against phenyl acetylene
number density.

96
Figure 13. First order rate constants (k1st) obtained from OH decay profiles plotted
against concentrations of phenyl acetylene. The second order rate constant (k2nd) is the slope of
the solid line obtained from a linear least-squares fit with 2σ standard deviation.
The straight line obtained from a linear least-squares fit yields the second order rate
constant (k2nd). The horizontal error bars are due to differences in set bubbler pressures values as
the experiments were conducted over numerous days. The vertical error bars for the first order
rate constant are weighted averages of the respective measured k1st values obtained from single
exponential fits with 2σ precision similar to figure 9.
3.8 Pressure and Temperature Dependence of Phenylacetylene + OH Kinetics
The pressure dependence of the OH + Phenyl acetylene reaction rate constants was
studied over the 1-7.5 Torr pressure range. Figure 14 shows that the rate constants are pressure
independent over the tested pressure ranges. Vertical error bars correspond to averaged values of
k2nd at a given pressure.

97
Figure 14. Plot of second order rate constant (k2nd) of the reaction of OH from HONO
photolysis at 355 nm with phenyl acetylene plotted against pressure of reaction cell. Each data
point represents weighted averaged k2nd value with 2σ precision values obtained from multiple
runs (minimum 5)
Figure 15 shows the temperature dependence of the reaction rates over the 293-423 K
temperature range. Vertical error bars correspond to weighted averaged values of k2nd for each
temperature with 2σ precision.
Figure 15. Second order rate constants (k2nd) for the reaction of OH from HONO
photolysis at 355 nm with phenyl acetylene plotted against temperature of reaction cell (293 -
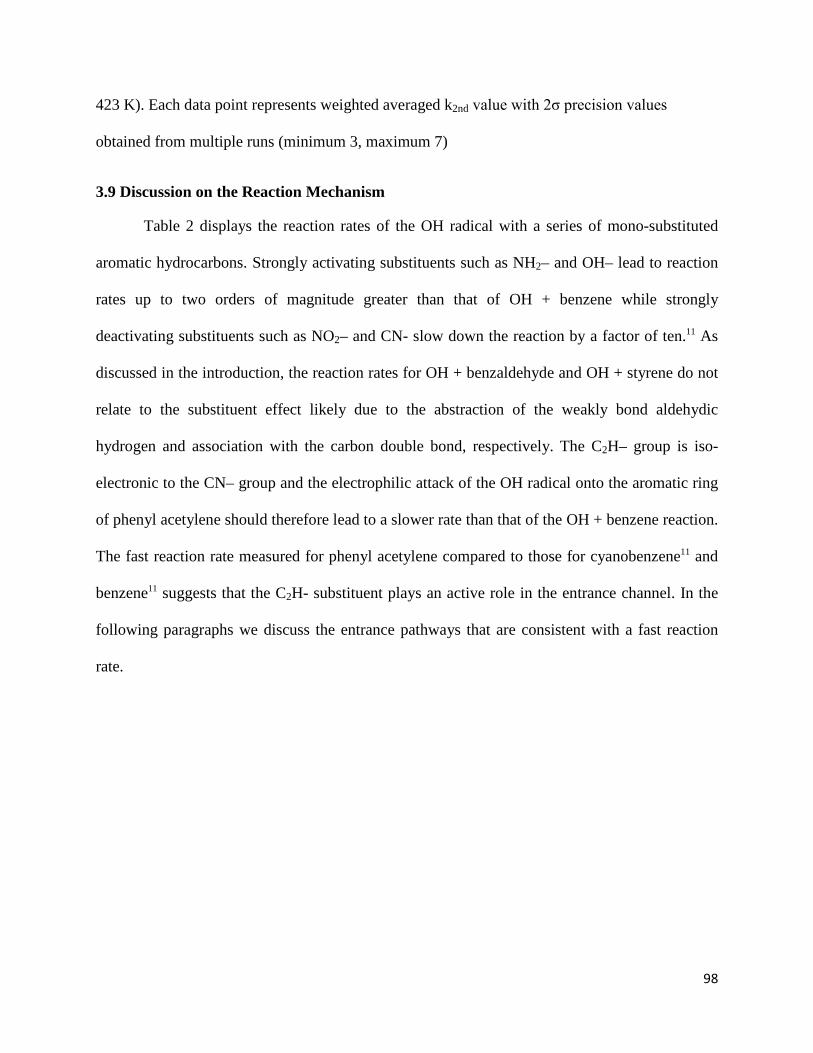
98
423 K). Each data point represents weighted averaged k2nd value with 2σ precision values
obtained from multiple runs (minimum 3, maximum 7)
3.9 Discussion on the Reaction Mechanism
Table 2 displays the reaction rates of the OH radical with a series of mono-substituted
aromatic hydrocarbons. Strongly activating substituents such as NH2– and OH– lead to reaction
rates up to two orders of magnitude greater than that of OH + benzene while strongly
deactivating substituents such as NO2– and CN- slow down the reaction by a factor of ten.11 As
discussed in the introduction, the reaction rates for OH + benzaldehyde and OH + styrene do not
relate to the substituent effect likely due to the abstraction of the weakly bond aldehydic
hydrogen and association with the carbon double bond, respectively. The C2H– group is iso-
electronic to the CN– group and the electrophilic attack of the OH radical onto the aromatic ring
of phenyl acetylene should therefore lead to a slower rate than that of the OH + benzene reaction.
The fast reaction rate measured for phenyl acetylene compared to those for cyanobenzene11 and
benzene11 suggests that the C2H- substituent plays an active role in the entrance channel. In the
following paragraphs we discuss the entrance pathways that are consistent with a fast reaction
rate.

99
Table 2. Rate coefficients (cm3 s-1) for the OH reaction with various mono-substituted aromatic rings Reactant Reaction rate Aniline11 T=239-358 K, P=100 Torr
Phenyl acetylenea
T=293-423 K, P=5 Torr k=8.87(±.734)×10-11
Styrene12 T=295 K, P=4.5 Torr k=4.3(±0.4)×10-11
Phenol41 T=298 K, P=760 Torr k=2.81(±0.2)×10-11
Toluene42b T=276 - 383 K, P=760 Torr
Benzene9 T=298-330 K, P=92 Torr
Cyanobenzene11 Temperature and pressure not available k=3.3×10⁻¹³
Nitrobenzene11 T=239-362 K, P=100 Torr
Table 3 displays the computed enthalpies for the abstraction and H-loss products for the
OH + phenyl acetylene reaction. The heat of formation of reactants, products, and reaction
intermediates are calculated using the CBS-QB3 composite method implemented within the
Gaussian0943 suite of programs. All the ring abstraction channels are found to be exoenergetic

100
while the abstraction of the acetyleneic hydrogen is endoenergetic by 70.60 kJ.mol-1. In the case
of the OH reaction with benzene, the direct interaction of the radical singly occupied p-orbital
with a C–H σ-bond of the ring leads to a transition state 19.94 kJ.mol-1 above the energy of the
reactants.14 The transition state for abstraction of a hydrogen atom from the aromatic ring of
phenyl acetylene is likely to be comparable to that for abstraction from benzene. The fast and
temperature independent measured reaction rate suggests that direct abstraction of a hydrogen
atom from phenyl acetylene is likely to be a negligible reaction pathway over the experimental
293-423 K temperature range.
Table 3. Enthalpy of reaction for the abstraction and H-loss channels of OH + Phenylacetylene
Products ∆rH(298 K) (kJ.mol-1)
Products ∆rH(298 K) (kJ.mol-1)
o-ethynylphenyl + H2O
-9.56 m-ethynylphenol + H
+1.35
m-ethynylphenyl + H2O
-14.89 p-ethynylphenol + H
+1.12
p-ethynylphenyl + H2O
-13.39 Phenylethynol + H
+41.97
Benzoethynyl + H2O
+70.60 Phenylketene + H
-83.42
o-ethynylphenol + H
+4.98 Benzofurane
+ H -133.64
The association of the OH radical with the π-electrons of either the aromatic ring or the
triple bond of the acetyl group is likely to proceed through the barrier-less formation of a Van
der Waals complex as predicted for benzene14 and diacetylene.44 The association pre-reactive
complex may either decompose back to the reactants and/or further isomerize through different
transition states to give more stable addition intermediates. Figure 16 displays the structure and
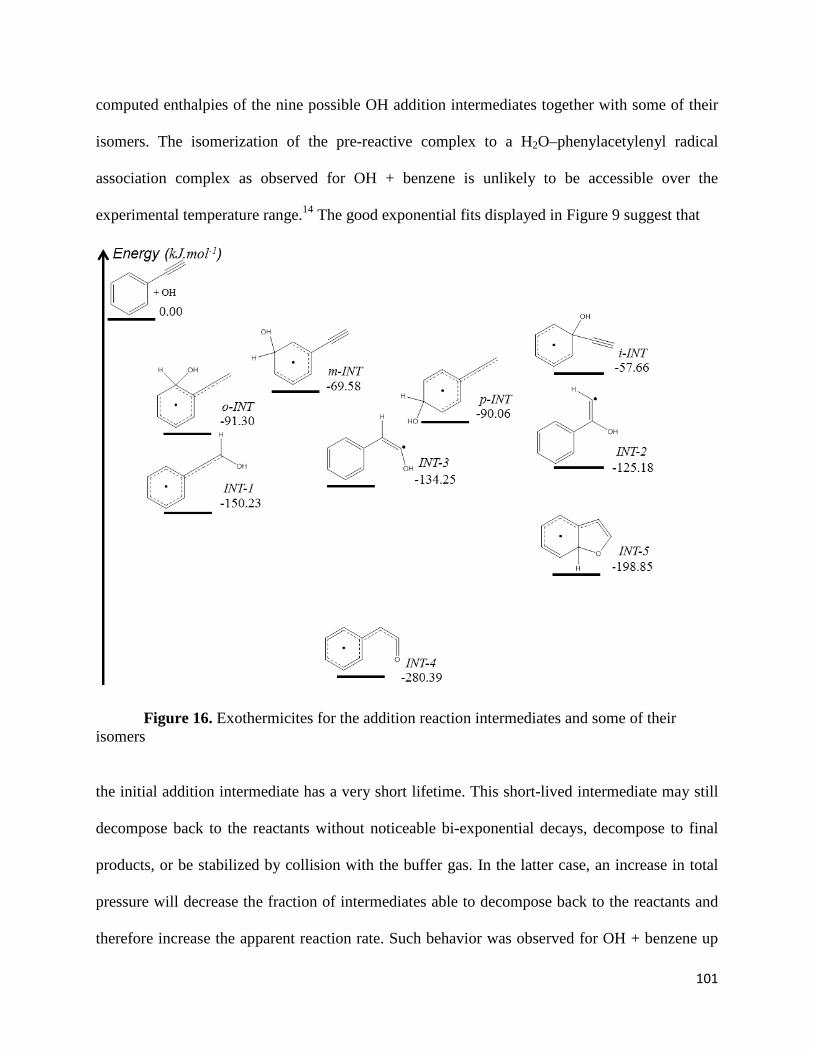
101
computed enthalpies of the nine possible OH addition intermediates together with some of their
isomers. The isomerization of the pre-reactive complex to a H2O–phenylacetylenyl radical
association complex as observed for OH + benzene is unlikely to be accessible over the
experimental temperature range.14 The good exponential fits displayed in Figure 9 suggest that
Figure 16. Exothermicites for the addition reaction intermediates and some of their isomers
the initial addition intermediate has a very short lifetime. This short-lived intermediate may still
decompose back to the reactants without noticeable bi-exponential decays, decompose to final
products, or be stabilized by collision with the buffer gas. In the latter case, an increase in total
pressure will decrease the fraction of intermediates able to decompose back to the reactants and
therefore increase the apparent reaction rate. Such behavior was observed for OH + benzene up

102
to 40 Torr9 and OH + styrene up to 2 Torr.12 The lack of pressure dependence in Figure 9
suggests that the reaction already proceeds within the high-pressure limit at 1 Torr. Any initially
formed association complex is therefore likely to isomerize to a more stable addition-like
intermediate that is either stabilized by collisional quenching or decompose to the products
without significantly decomposing back to the reactants. Although the kinetics data do not
provide any further indications about its possible structure or fate, additional information may be
inferred from the comparison with OH + benzene14 and OH + diacetylene reactions.44
In Figure 16, the ortho (o-Add), meta (m-Add), para (p-Add), and ipso (i-Add) ring-
addition intermediates may be formed by association with the aromatic ring while the Add-1 and
Add-2 intermediates may be formed by attack onto the triple bond. The direct addition onto the
inner acetylenic carbon is likely to proceed through a transition state above the energy of the
reactants as observed for the OH + diacetylene reaction.44 The resonantly stabilized INT-1 is
therefore the most probable addition intermediate resulting from the radical association with the
triple bond. The energy of the transition state corresponding to the conversion of the pre-reactive
complex into INT-1 is likely to be decreased due to resonance and therefore to be below the
transition state energy predicted for the terminal addition onto diacetylene (about 3 kJ.mol-1).44
In the case of benzene, the formation of addition intermediates from the initial association
complex proceeds through a transition state 7 kJ.mol-1 above the energy of the reactants.14 Within
the 2σ standard deviations, the OH + phenyl acetylene reaction is likely to proceed without or
with an activation barrier below 2 kJ.mol-1. Combined with the deactivating effect of the C2H–
substituent, and over the experimental temperature and pressure ranges, the measured rates for
the OH + phenyl acetylene reaction are consistent with the formation of the resonantly stabilized
INT-1. The lack of pressure dependence suggests that collisional quenching with the buffer may

103
stabilize a significant amount of INT-1. INT-1 has a mass of 119, and this mass has been
detected as a long-lived product in reaction of OH + phenyl acetylene using a quadrupole mass
spectrometer.30
3.10 Conclusion
The reaction of hydroxyl radical (OH) with phenylacetylene was investigated using
pulsed laser photolysis (PLP) and laser induced fluorescence (LIF). Absolute reaction rates were
obtained over the 293 – 423 K temperature range and 1-7.5 Torr pressure range. The OH radicals
were formed in the gas phase using either H2O2 at 266 nm or HONO at 355 nm. The reaction
rates measured at 355-nm photolysis wavelength were found to be independent of laser fluence
and much faster than the OH + benzene reaction. The most likely reaction entrance channel and
structure of the initially formed intermediates were discussed based on high-level calculations of
the reaction intermediate energies as well as previous theoretical data on the OH + benzene14 and
OH + diacetylene44 reactions.
The rate of the OH + phenyl acetylene reaction was measured over a wide range of
pressures, temperatures, and laser fluences. At 266-nm photolysis wavelength single photon
and/or multiphoton effects were found to significantly affect the measured rate. This
demonstrated the importance of ensuring the possibility of fluence dependence on the kinetic
study of certain aromatic molecules. At 355-nm photolysis wavelength, within the experimental
error bars, the rate was found to be independent of fluence, pressure and temperature. The
average value was greater than expected based solely on the electrophilic attack of the radical
onto the aromatic ring. Together with high-level calculations of the entrance pathways
exothermicities, these results were consistent with the formation of an association pre-reactive
complex involving the ethynyl group. The Van der Waals intermediate was then likely to evolve

104
without or with a small activation energy to a resonantly stabilized addition intermediate, INT-1
(see Figure 16). The good exponential fits of the OH temporal decays and the lack of pressure
dependence suggested that this intermediate did not decompose back to the reactants but was
stabilized by collisional quenching.
The OH + phenylacetylene reaction rate was measured to be several order of magnitude greater
than the values currently used in combustion models and might therefore play a significant role
in phenylacetylene removal and formation of oxidation products.18 Under flame conditions
(higher pressures and higher temperatures), other addition intermediates displayed in Figure 16
may become accessible. Abstraction of a hydrogen atom from the ring will also compete with the
association/addition mechanism. Abstraction of the acetylenic hydrogen is likely to still be
negligible. H-loss channels from the addition intermediates may become significant compared to
collisional quenching of the intermediate. Table 3 displays the enthalpy of formation for several
of the possible H-loss co-products. The most stable products are found to be phenylketene and
benzofurane. All the ring substitution products are found to be above the energy of the reactants,
although they will be accessible at high temperatures. Formation of phenylethynol is
thermodynamically strongly disfavored. The formation of phenol from OH addition onto
benzene is predicted to have a transition state 53.14 kJ.mol-1 above the energy of the reactants
while the substitution products and ketene-like products from OH + diacetylene are expected to
proceed with submerge transition states.40 Products from the addition onto the acetyl group of
phenylacetylene are therefore likely to be more favorable at high temperature that the substituted
phenol molecules.
The formation of phenylketene would require the formation of INT-3 (see Figure 16)
through a 1,2-hydrogen shift followed by H-loss of the hydrogen initially from the radical. The

105
formation of benzofurane through H-loss would require a second H-shift from INT-3 to INT-4
followed by attack of the oxygen atom onto the ring to form the stable cyclic intermediate INT-5.
Theoretical calculations on the C8H7O potential energy surface are necessary in order to predict
if phenylketene and benzofurane will be significant reaction products at high temperatures.
Nevertheless, our data set provide important information for combustion modeling and provides
a detailed set of observables for future theoretical studies.
References:
(1) Aschmann, S. M.; Arey, J.; Atkinson, R. Journal of Physical Chemistry A 2013, 117, 2556.
(2) Bohn, B.; Zetzsch, C. Physical Chemistry Chemical Physics 2012, 14, 13933. (3) Wang, L.; Arey, J.; Atkinson, R. Environmental Science & Technology 2006, 40, 5465. (4) Loison, J.-C.; Rayez, M.-T.; Rayez, J.-C.; Gratien, A.; Morajkar, P.; Fittschen, C.;
Villenave, E. Journal of Physical Chemistry A 2012, 116, 12189. (5) Colomb, A.; Jacob, V.; Kaluzny, R.; Baussand, R. International Journal of Chemical
Kinetics 2004, 36, 367. (6) Kramp, F.; Paulson, S. E. Journal of Physical Chemistry A 1998, 102, 2685. (7) Thiault, G.; Mellouki, A.; Le Bras, G. Physical Chemistry Chemical Physics 2002, 4,
2194. (8) Goumri, A.; Pauwels, J. F.; Devolder, P. Canadian Journal of Chemistry-Revue
Canadienne De Chimie 1991, 69, 1057. (9) Lorenz, K.; Zellner, R. Berichte Der Bunsen-Gesellschaft-Physical Chemistry Chemical
Physics 1983, 87, 629. (10) Berndt, T.; Boge, O. Physical Chemistry Chemical Physics 2006, 8, 1205. (11) Witte, F.; Urbanik, E.; Zetzsch, C. Journal of Physical Chemistry 1986, 90, 3251. (12) Baulch, D. L.; Campbell, I. M.; Saunders, S. M.; Louie, P. K. K. Journal of the Chemical
Society-Faraday Transactions Ii 1989, 85, 1819. (13) Taylor, S. E.; Goddard, A.; Blitz, M. A.; Cleary, P. A.; Heard, D. E. Physical Chemistry
Chemical Physics 2008, 10, 422. (14) Hollman, D. S.; Simmonett, A. C.; Schaefer, H. F. Physical Chemistry Chemical Physics
2011, 13, 2214. (15) Chen, C. C.; Bozzelli, J. W.; Farrell, J. T. Journal of Physical Chemistry A 2004, 108,
4632. (16) Brown, H. C.; Okamoto, Y. Journal of the American Chemical Society 1958, 80, 4979. (17) March, J. Advanced organic chemistry : reactions, mechanisms, and structure; Wiley:
New York, 1985. (18) Niki, H.; Maker, P. D.; Savage, C. M.; Breitenbach, L. P. Journal of Physical Chemistry
1978, 82, 132. (19) Kailasanathan, R. K. A.; Thapa, J.; Goulay, F. Journal of Physical Chemistry A 2014,
118, 7732.
106
(20) Li, Y.; Zhang, L.; Yuan, T.; Zhang, K.; Yang, J.; Yang, B.; Qi, F.; Law, C. K. Combustion and Flame 2010, 157, 143.
(21) Wang, Z.; Cheng, Z.; Yuan, W.; Cai, J.; Zhang, L.; Zhang, F.; Qi, F.; Wang, J. Combustion and Flame 2012, 159, 2243.
(22) Richter, H.; Benish, T. G.; Mazyar, O. A.; Green, W. H.; Howard, J. B. Proceedings of the Combustion Institute 2000, 28, 2609.
(23) Bouwman, J.; de Haas, A. J.; Oomens, J. Chemical Communications 2016, 52, 2636. (24) Parker, D. S. N.; Kaiser, R. I.; Troy, T. P.; Ahmed, M. Angewandte Chemie-International
Edition 2014, 53, 7740. (25) Goulay, F.; Leone, S. R. Journal of Physical Chemistry A 2006, 110, 1875. (26) Woon, D. E. Chemical Physics 2006, 331, 67. (27) Landera, A.; Mebel, A. M.; Kaiser, R. I. Chemical Physics Letters 2008, 459, 54. (28) Anderson, H.; McEnally, C. S.; Pfefferle, L. D. Proceedings of the Combustion Institute
2000, 28, 2577. (29) Wang, H.; Frenklach, M. Combustion and Flame 1997, 110, 173. (30) Sloane, T. M.; Brudzynski, R. J. Journal of the American Chemical Society 1979, 101,
1495. (31) Frenklach, M.; Warnatz, J. Combustion Science and Technology 1987, 51, 265. (32) Talrose, V. Y., A.A.; Usov,A.A.; Goncharova, A.N.; Leskin, N.A.;Messineva, N.V.
UV/VIS Spectra UV/VIS Spectra in NIST Chemistry WebBook, NIST Standard Reference Database Number 69.
(33) Brust, A. S.; Becker, K. H.; Kleffmann, J.; Wiesen, P. Atmospheric Environment 2000, 34, 13.
(34) Ning, C. L.; Pfab, J. Journal of Physical Chemistry A 1997, 101, 6008. (35) Wollenhaupt, M.; Carl, S. A.; Horowitz, A.; Crowley, J. N. Journal of Physical
Chemistry A 2000, 104, 2695. (36) Bagot, P. A. J.; Waring, C.; Costen, M. L.; McKendrick, K. G. Journal of Physical
Chemistry C 2008, 112, 10868. (37) Paul, A. 2014. (38) Marrero, T. R.; Mason, E. A. J. Phys. Chem. Ref. Data 1972, 1. (39) Kestin, J., et.al. J .Phys.Chem. Ref. Data 1984, 13. (40) Keller-Rudek, H.; Moortgat, G. K.; Sander, R.; Sörensen, R. Earth Syst. Sci. Data 2013,
5, 365. (41) Rinke, M.; Zetzsch, C. Berichte Der Bunsen-Gesellschaft-Physical Chemistry Chemical
Physics 1984, 88, 55. (42) Anderson, P. N.; Hites, R. A. Environmental Science & Technology 1996, 30, 1756. (43) Frish, M. J. T., G.W.; Schlegel, H.B.; Scuseria, G.E.; Robb, M.A.; Cheeseman, J.R.;
Scalmani, G.; Barone, V.; Mennucci, B.; Peterson, G.A.; et.al. Gaussian 09 2009. (44) Senosiain, J. P.; Klippenstein, S. J.; Miller, J. A. Proceedings of the Combustion Institute
2007, 31, 185.

107
Chapter 4: Reaction of the OH Radical with Fulvenallene
4.1 Fulvenallene in Combustion Environments
C
CHH
Figure 1. Fulvenallene
Fulvenallene (figure 1) is predicted to be an important intermediate in combustion
environment. It is detected in cyclopentene (C5H10) flame1 and is a primary unimolecular
decomposition product of the benzyl radical (C7H7)2-5 which in turn is a primary unimolecular
decomposition product of toluene (C7H8)4,6-16 and a photolysis product of benzyl radical.17,18 Da
Silva and Bozzelli19 investigated the hydrogen-abstraction mechanisms from fulvenallene by H-
atoms, OH, and CH3 radicals. In the case of the OH radical, the abstraction of a hydrogen atom
from the CH2 group has a negative or no activation barrier, while the abstraction of a hydrogen
atom from the carbon ring has an activation barrier of 9.6 kJ mol-1. This information, combined
with the fact that the terminal C–H bond of fulvenallene is 143.5 kJ mol-1 weaker than the ring
C–H bond,19 leads to fulvenallenyl being predicted as the most energetically and kinetically
favorable abstraction product. The calculated room temperature abstraction rate coefficient kAbs is
1.45×10⁻¹² cm3 s-1 and is predicted to increase with temperature from 300 to 2000 K following
the expression cm3 s-1.19 However,
association of the OH radical with the π-electron system of unsaturated molecules is usually fast

108
and likely to compete with the abstraction mechanism at low and intermediate temperatures.20-22
In the case of OH + allene (CH2CCH2), at low temperatures the reaction proceeds through the
formation of a van der Waals complex that can either isomerize into a reaction intermediate, or
decompose back to the reactants.21,22 At temperatures above 600 K, the reaction adduct formed
by addition of the radical onto the allene is predicted to mainly dissociate back to OH + allene.22
Overall, the OH + allene reaction rate coefficient is expected to decrease with temperature up to
600 K, and to increase at higher temperatures, due to the increasingly favorable abstraction
mechanism to form C3H3 + H2O.21,22 The presence of an allene and a cyclopentadiene group in
fulvenallene suggests that the OH + fulevenallene reaction may proceed through similar
competitive association/abstraction mechanisms as those predicted for the OH + allene reaction.
For this reason the contribution of the OH + fulvenallene reaction to fulvenallenyl formation is
likely to change with temperature and to be different in the interstellar medium or in combustion.
This chapter presents the experimental investigation of the OH + fulvenallene reaction within the
298-450 K temperature range at 5 Torr starting with the synthesis and characterization of
fulvenallene.
4.2 Fulvenallene Synthesis and Characterization
4.2.1 Properties of Fulvenallene and its Precursor
Table 1 shows the physical properties of the precursor homophthalic anhydride,
intermediate product benzocyclobutenone and the main product fulvenallene. The physical
properties of fulvenallene are unknown. Its vapor pressure is estimated to be approximately 30
Torr from the following experiment. Its melting and boiling points are still unknown. The vapor
pressure of solid homophthalic anhydride at room temperature is estimated to be less than 1 Torr
from the experiment. The vapor pressure of benzocyclobutenone is also unknown.

109
Table 1. Physical properties of the reactant and products
Homophthalic anhydride Benzocyclobutenone Fulvenallene
Molecular weight (g mol-1) 162.14 118.13 90.12 Melting point (˚C) 140-142 1423 No data available Boiling point (˚C) No data available 71-72 (2 Torr)23 No data available Vapor pressure at room temperature (Torr) <1a No data available ∼30a
afrom present experiments
4.2.2 Fulvenallene Synthesis
Fulvenallene was synthesized by flash vacuum pyrolysis of homophthalic
anhydride (C9H6O3) as reported by Spangler et.al.24,25, likely following a mechanism
proposed by Sakaizumi et al.26 in scheme 1.
Homophthalic Anhydride Benzocyclobutenone Fulvenallene
Scheme 1. Proposed mechanism of fulvenallene formation
Figure 2 shows the experimental set up used to synthesize fulvenallene. The synthesis
was performed in a 3-neck Pyrex flask containing a coiled 22-gauge 24-inch-long nichrome wire.
The flask was connected to a 30-cm long water-cooled condensing column. All the ground glass
joints and Teflon corks were sealed using high temperature grease. The outlet of the condenser
was connected to a glass bubbler through 20 cm of 1/4"-PTFE tubing. About 2 to 3 g of
homophthalic anhydride were mixed with sand and placed in the reaction flask. The flask,
condensing column, and bubbler were pumped out by a rotary-valve pump for at least 2 hours
O
O
O
-CO2OC
CH2
O
-CO
CH2
C CH2

110
(final pressure<0.1Torr). The set-up was checked for leaks, after which the glass bubbler was
submerged in liquid nitrogen.
Figure 2. Experimental set up for the synthesis of Fulvenallene
The set-up was then isolated from the pump, and the reactor temperature was increased
using a heating mantle, and subsequently monitored using a type-K thermocouple placed
between the heating mantle and the flask. When the measured temperature exceeded
approximately 110°C, condensation of the starting material was observed on the uppermost
sections of the flask, which was not being heated by the heating mantle. To reduce condensation,
the upper part of the three-necked flask was isolated with heating tape. The condenser
temperature was maintained at 75°C in order to avoid transfer of the reactant to the cold trap.
Keeping the mantle temperature between 100°C and 110°C was found minimizing contamination
by the homophthalic anhydride reactant in the final sample.

111
When sufficient sublimation of the starting material was observed, the nichrome wire was
resistively heated using a variable AC controller, resulting in a red-hot glow. This heating of the
wire resulted in a fast increase of the temperature and pressure in the flask. To avoid overheating
of the reactant, the heating mantle temperature was lowered to maintain a constant temperature
between 110 and 155°C. The bubbler trap was kept in liquid nitrogen (-196°C) throughout the
process. After 5 minutes of reaction, yellow product was observed on the inside wall of the inner
bubbler tube, and the initial sand–reactant mixture inside the flask turned yellow, and eventually
dark brown. The reaction was run for 30 to 60 minutes. The final pressure in each experiment
varied from 45 Torr to 75 Torr. The pressure rise was likely to come from gas formation and
possible leaking of the experimental setup at high temperatures.
After completion, the bubbler was isolated, and the liquid nitrogen bath was replaced by
an acetone–liquid nitrogen slush (-94 °C). The bubbler was connected to the vacuum pump and
evacuated to a pressure below 1 Torr. At this temperature, fulvenallene was expected to have a
negligible vapor pressure while CO2 and CO were solid with high vapor pressures. Finally the
acetone–liquid nitrogen slush was replaced by an ice-water bath to trap the reactant and
benzocyclobutenone impurities. The solid yellow product turned into a liquid, with a typical
increase of the pressure to ∼30 Torr.
The bubbler was then connected to two room temperature 1-L stainless steel cylinders,
initially under vacuum. After equilibration, the total pressure in the bubbler and stainless steel
cylinders reached 10 to 15 Torr depending on how much product was formed. The cylinders
were isolated from the glass bubbler, and pressurized with helium to reach a total pressure of
1000 Torr. The cylinders were then isolated, and used for IR characterization of the gas mixture
or for the kinetics experiments.

112
4.2.3 Liquid Phase NMR Spectroscopy
After synthesis, a fraction of the liquid product in the bubbler was extracted, dissolved in
CDCl3, and analyzed by NMR spectroscopy. Formation of fulvenallene from phthalide or
homophthalic anhydride thermal cracking was confirmed by comparing the experimental spectra
to predicted ones. All the NMR spectra are in the appendix. As benzene was a co-product of
phthalide cracking, and as it was not separable from fulvenallene, homophthalic anhydride was
used as the reactant for all the experiments. The NMR spectra of the fulvenallene product were
identical for both precursors. The 1H NMR spectrum showed the presence of fulvenallene,
benzocyclobutenone and homophthalic anhydride NMR analysis of liquid after collection and re-
condensation of gas mixture from the stainless steel cylinder showed mostly fulvenallene with
traces of the reactants. Benzocyclobutenone was not observed after condensation of the cylinder
mixture.
Even though fulvenallene was synthesized in the 1970s, its NMR data was neither
documented nor found in the literature. For the 1st time the 1H and 13C NMR spectra were
obtained using a 600 MHz INOVA NMR machine and its structure was confirmed by
calculations (DT/GIAO and iterative simulation). 1D and 2D NMR, 1H/13C, selective-decoupled
1H NMR spectrum, and proton coupled carbon NMR, NOESY, HSQC (heteronuclear single
quantum coherence) and HMBC (heteronuclear multiband coherence) experiments are
performed to assign all 1H and 13C NMR chemical shifts.
Spin-restricted density functional theory calculations were performed with the Gaussian 09
(G09) program.27 Geometry optimization and normal mode analysis was performed using the
B3LYP functional and the 6-31+G(d) basis set to identify the ground state geometry of

113
fulvenallene.28,29 The identified stationary point met or exceeded all default G09 convergence
criteria. Using the same functional and the larger 6-311+G(d,p) and 6-311+G(3df,2p) basis sets,
NMR chemical shift and spin-spin coupling constant calculations were performed using the
GIAO method within G09. Isotropic chemical shifts were referenced relative to that of
tetramethylsilane. The total energy, lowest frequencies, and the optimized coordinates for
fulvenallene using 6-31+G(d,p) basis sets are given in the appendix.
Figure 3 shows the back to back representations of the calculated and experimental
multiplicity patterns for H1, H5/H6 and H4/H7 protons of fulvenallene dissolved in CDCl3. The
calculated coupling constants matched well with the experimental ones (see table 1 in annex).
Figure 3. (a) Experimental and (b) simulated 1H NMR spectrum of the liquid fulvenallene dissolved in CDCl3

114
The upfield signal at 5.32 belongs to C1 protons. It shows three peaks due to the spin-
spin interactions between 1-CH2 and H4/H7 protons. The number of expected peaks or lines is
determined by the following equation 1.
1nI2N += Eq. (1)
Where n is the number of neighboring H nuclei and I is the spin quantum number=1/2
For H1 (C1) protons, there are 2 neighboring nuclei (H4/H7). So N=3 peaks as shown in the figure 3.
H5/H6 and H4/H7 protons exhibit complex splitting pattern. In other words the splitting
patterns are not first order. This means the coupling constant values cannot be calculated for
these protons. In order to determine coupling constants for these protons, simulation procedure
(g-NMR software) are used that give all J values between protons of all three spin systems (H1,
H4/H7, and H5/H6). See annex for the NMR spectra.
4.2.4 Gas Phase FTIR Spectroscopy
The composition of the gas mixture was determined using a 25-cm3 double-pass gas cell
(Mettler Toledo), coupled to a FTIR spectrometer (Mettler Toledo, ReactIR ic 15). Preliminary
to the measurements, the gas cell was evacuated to a pressure below 1 Torr, and all the mirrors
were flushed with dry nitrogen. A background spectrum was recorded by accumulating 1024
interferograms. The gas cell was then connected to the stainless steel cylinder containing the
fulvenallene/He mixture. The total pressure in the absorption cell was set to 800 Torr. Spectra
were recorded by accumulating 1024 interferograms with a resolution of 4 cm-1 or 8 cm-1. Figure
4 displays the average of 12 spectra recorded with a resolution of 4 cm-1. The spectra are baseline
subtracted by fitting a 5th-order polynomial through the region displaying no significant signal.

115
Figure 4. Baseline subtracted IR absorption spectra of the gas mixture recorded with 4
cm-1 resolution
Figure 5 displays the absorption spectrum of the gaseous mixture (0.75% of fulvenallene
in Helium at 800 Torr) with a 8 cm-1 spectral resolution, together with vibrational assignments
according to Angell et al.30 The same procedure as for Figure 4 is used to baseline subtract the
spectrum in Figure 5. The feature at 1983 cm-1 (labeled 2ν10 in Figure 5) was identified as
coming from fulvenallene, although it was not assigned to a specific vibrational mode.30 The

116
observed fundamental vibrational modes of fulvenallene are also in agreement with the simulated
spectrum obtained using the B3LYP/CBSB7 method.
Figure 5. Baseline subtracted absorption spectrum with 8 cm-1 resolution of the
synthesized liquid vapors in helium. The fulvenallene vibrational bands are assigned according
to Angell et al.30
Table 2 shows the vibrational assignments used in Figures 4 and 5. The rotational
structures observed in Figure 4 are all in agreement with the measurements by Angell et al.30

117
Table 2. Vibrational assignments of the observed gas phase fulvenallene absorption bands
Mode Assignment Observed (cm-1) Angell 1971 (cm-1) A1 ν1 CH stretching 3135 A1 ν2 CH stretching 3092 A1 ν3 CH2 sym. stretching 2966 A1 ν4 C=C sym. stretching 1488 1486 A1 ν5 CH bending 1372 1362 A1 ν6 CH bending 1320 1320 A1
ν7 CH2 scissoring 1435 1432
A1 ν8 C=C=C sym. stretching 1074 1073 A1 ν9 C=C=C asym. stretching 1935 1935 A1 ν10 C–C stretching 991 985 A1 ν11 C–C–C stretching 887 886 A1 ν12 Ring breathing A2 ν13 CH2 twisting A2 ν14 CH bending A2 ν15 CH bending A2 ν16 Ring bending B1 ν17 CH stretching 3122 B1 ν18 CH stretching 3071 B1 ν19 C=C asym. stretching 1653 1655 B1 ν20 CH bending B1 ν21 CH bending 1174 1170 B1 ν22 CH2 wagging 846 844 B1 ν23 C=C=C bending B1 ν24 C=C=C waging B1 ν25 C–C–C stretching 812 810 B1 ν26 Ring bending 530 B2 ν27 CH2 asym. stretching 3010 B2 ν28 CH bending 753 754 B2 ν29 CH bending 729 733 B2 ν30 CH2 rocking 604 B2 ν31 C=C=C bending B2 ν32 C=C=C rocking B2 ν33 Ring bending 2ν10 or ν8 + ν11 1958 1958 2ν22 1700 1700 2ν25 1622 1623

118
Geometry optimization and vibrational frequencies calculations were carried out using
the Gaussian09 package, using the B3LYP/CBSB7 method. All the vibrational frequencies are
real, indicating that the optimized geometries represent minima on the potential energy surface.
Figure 6 compares (a) the simulated spectrum of fulvenallene with (b) the spectrum of the
gaseous mixture. The simulated spectra are scaled by a factor 0.952 to match the observed
normal modes wavenumbers of fulvenallene. Over the experimental wavenumber range, all the
normal modes of fulvenallene are observed. The difference between the calculated and
experimental spectrum is mostly due to overtone and combination vibrational bands30 (see Table
3).
Figure 6. (a) Simulated spectrum (B3LYP/CBSB7 method) of fulvenallene and (b)
baseline subtracted absorption spectrum of the gas mixture. The calculated spectrum is scaled by
a factor 0.952 to match the observed normal modes of fulvenallene.
4.2.5 Fulvenallene Purity
In Figure 5, the absorption band at 1808 cm-1 may be attributed to the presence of
impurities in the gas sample. Figure 7 displays the IR spectrum of homophthalic anhydride and

119
benzocyclobutenone, obtained using the B3LYP/CBSB7 method. By comparison with liquid
phase (NIST) and simulated spectra the observed band is likely to be due to the presence of small
quantities of carbonyl containing molecules such as homophthalic anhydride and
benzocyclobutenone.
Figure 7. Simulated absorption spectra of homophthalic anhydride and
benzocyclobutenone using the B3LYP/CBSB7 method. The calculated spectra are scaled by a
factor 0.952.
Figure 8 displays routine IR absorption spectra of one of the gas mixtures used for the
kinetic experiments. Additional absorption bands are observed at 1270 cm-1, 1037 cm-1 and 820

120
cm-1. Based on the comparison with the simulated spectrum from Figure 7, the additional
absorption bands are likely to come from the presence of homophthalic anhydride.
Figure 8. Baseline subtracted absorption spectrum (8 cm-1 resolution) of a gaseous
sample, showing additional absorption bands at 1264 cm-1, 1037 cm-1 and 820 cm-1.
The purity of gaseous fulvenallene samples was estimated from the ratio of the band
maximum normalized by the computed oscillator strength following the equation:
Eq. (2)
where ν1 and ν2 are proportional to the absorption from molecules 1 and 2 at wavenumbers
and , f1 and f2 the corresponding oscillator strengths, and y1/y2 the ratio of the molar fractions.
D1 and D2 are the dipole strengths obtained from the B3LYP/CBSB7 method. Equation 1
assumes similar broadening for both absorption bands. Table 3 displays the wavenumber and
computed dipole strengths Di for fulvenallene and homophthalic anhydride. The measured

121
absorbance values are from two different spectra. Spectrum 1 is displayed in Figure 5 of the
manuscript while spectrum 2 is displayed in Figure 8.
Table 3. Wavenumber, calculated dipole strength, and measured intensity for
fulvenallene and homophthalic absorption bands. The ratio of the molar fractions is calculated
using equation 2.
Molecule (cm-1) D (10-40 esu2 cm2)
Measured intensity y1/y2
Spectrum 1 Fulvenallene 1935 408.17 0.56 0.06 homophthalic anhydride 1808 952.89 0.07
Spectrum 2 Fulvenallene 1492 130.23 0.16 0.09 homophthalic anhydride 1037 1335.11 0.11
Absorption spectra were not recorded for all of the samples used for the kinetics
measurements. Figures 5 and 8 are characteristic of the purest and most contaminated recorded
samples, respectively. Based on these two spectra, the purity of the fulvenallene gas samples
used for the kinetics study are estimated to be between 90% and 94%.
4.3 Kinetic Measurements
4.3.1 Fulvenallene Number Density
The fraction of gaseous fulvenallene collected in the 2L cylinders stored under
pressurized helium buffer gas was used to determine the number density of fulvenallene in all the
experiments by using the following equation 3.
Eq. (3)
Where is the number density of fulvenallene in the reaction chamber, is the volumetric
flow rate of fulvenallene through the calibrated mass flow controllers, is the total volumetric

122
flow rate of fulvenallene and the helium buffer gas, is the fraction of fulvenallene in the 2L
cylinders used for all the experiments, is the pressure of the experiment in the reaction
chamber, is the Boltzmann constant and is the temperature at which the experiment were
conducted in Kelvin.
4.3.2 Pseudo-First Order Kinetics
Within the pseudo first order approximation, corresponding to fulvenallene (PAH
precursor) being in large excess relative to the OH radical, the OH decay signal due to its
reaction with fulvenallene can be expressed using the following equations:
Eq. (4)
where and are the OH radical number densities at delaytime t and t=0, respectively. The
pseudo-first order rate coefficient is given by:
Eq. (5)
where is the second order rate coefficient for the OH + fulvenallene reaction, nFA is the
fulvenallene number density, and is the first order rate constant due to OH diffusion and OH
reaction with its precursor. The integrated LIF signal is plotted against delay time for a known
reactant number density and fitted using equation 1 to determine the corresponding k1st.
Figure 9(a) displays the OH radical decay measured by laser-induced fluorescence at 282
nm following the pulsed-laser photolysis of H2O2 in the presence of fulvenallene with a
calculated number density of 4.29 × 1013 cm-3 and (b) the pseudo-first order decay rate as a
function of fulvenallene number density at 298 K and 5 Torr. The integrated LIF signals are

123
fitted using equation 4 to determine the corresponding . Figure 9(b) shows a typical plot of
k1st vs. concentration of reactant (fulvenallene), for one data set at room temperature. The slope
of the linear fit is equal to the second order rate constant (k2nd). The uncertainties in Figure 9(b)
are 2σ from the least-squares regression. Due to the low fulvenallene number density, the change
in OH decay rate with increasing reactant concentration is relatively small. Nonetheless, the
increase observed in Figure 9 is statistically significant and leads to a rate coefficient of
9.43(±1.42)×10-12 cm3 s-1, where the error is 2σ from the linear fit. The main source of error on
the measurements of is the purity of the fulvenallene gas sample. In order to account for
these uncertainties, the rate coefficients are measured using at least three independent
experiments, each using different fulvenallene samples. The reaction rate coefficient obtained by
averaging three measurements is 8.75(±1.64)×10-12 cm3 s-1 at 298K. The error is 1σ around the
mean value. The rate coefficient is found to be independent of cell pressure over the 5-10 Torr
range.

124
Figure 9 (a) Temporal profile of the OH radical and (b) pseudo first-order decay as a
function of fulvenallene number density recorded at 298 K and 5 Torr. The red lines are (a) an
exponential and (b) a linear fit to the data. The error bars are 2σ from the least-squared
exponential fits.
4.3.3 Temperature Dependence of the Rate Coefficient
The collected fulvenallene sample was employed to measure the temperature dependence
of the OH + fulvenallene reaction rate coefficient from 298 K to 450 K at 5 Torr in helium buffer
gas. Table 4 displays all the temperatures of the experiments, number density of fulvenallene and

125
rate coefficient values of OH + fulvenallene reaction, the average values of k2nd and their average
at the corresponding temperatures.
Table 4. Rate coefficient and fulvenallene number density for single kinetic
measurements, and averages values. Symbols refer to the experiments performed with the same
gaseous mixture.
Figure 10 displays the average OH + fulvenallene reaction rate coefficients from 298 K to
450 K, together with the calculated abstraction rate coefficient by da Silva and Bozzelli.19 The
error bars are 1σ around the mean value, and are obtained by averaging at least three independent
data sets, all of which were obtained using different fulvenallene gas samples. Because of the
uncertainty of the purity of the gaseous samples, the error in the absolute values of the rate
coefficient is larger than reported by the error bars in Figure 10. Nonetheless, reaction rates
Temperature (K)
Number density range (1013 cm-
3)
k2nd (10-12 cm3 s-1)
k2nd average (10-12 cm3 s-1)
1σ (10-12 cm3 s-1)
298 1.15–7.07 6.88# 8.8 1.7 298 1.48–7.54 9.94*
298 1.05–5.37 9.43• 350 1.27–6.46 9.04*
5.1 3.0 350 0.90–4.61 5.79• 350 1.08–5.52 2.14˚ 350 1.21–7.44 3.38▪ 400 1.11–5.65 6.13*
3.2 2.0 400 0.95–6.77 4.25˚ 400 0.42–5.30 1.93# 400 1.06-6.51 1.93▪ 400 1.21-7.44 1.50♦ 450 0.80–4.93 1.27♦
1.9 0.7 450 1.95–5.89 2.59 450 2.00–6.04 1.74

126
measured at different temperatures with the same fulvenallene sample systematically shows a
negative temperature dependence. Within the 298–450 K temperature range, the average data can
be fit by the expression (red line in Figure 10).
( ) ( )( ) ( )
−
±−
×±=
±−−
K2981
T1
RkJ03.372.8exp
K298T107.18.8Tk
1.16.612 cm3 s-1
Figure 10. Second-order rate coefficients (k2nd) as a function of reaction cell temperature
from 298 to 450 K. Each data point is averaged k2nd with 1σ precision values from multiple runs
(3 to 5 runs). The red line is the fit to our experimental data and the black dotted line is the
abstraction rate constants calculated by da Silva et.al.19 as a function of temperature (K).
4.4 Discussion on the Mechanism
The negative temperature dependence observed in Figure 10 is likely due to the
barrierless formation of a van der Waals complex between the OH radical and the π-electron
system of fulvenallene as observed for the OH + allene reaction. The adduct decomposition back
to the reactant is likely to become more favorable at high temperatures, leading to an apparent
slower rate coefficient. At room temperature, the large rate coefficient (almost one order of

127
magnitude larger than that predicted for abstraction) is indicative of a relatively stable adduct
which may further isomerize into one of the five C7H6–OH addition isomers. Table 5 displays
the optimized product structures and enthalpies for the formation of abstraction and association
products calculated using the CBS-QB3 method. The 2–C7H6OH isomer is found to be the most
stable association product due to the delocalization of the unpaired electron over the entire
molecule. In the case of association of the OH with allene, Zador and Miller predict that the
addition is more favorable onto the molecule’s central carbon relatively to the terminal carbons.22
This information combined with the calculated reaction enthalpies in Table 5, suggests that 2–
C7H6OH is the most likely product formed by association of the OH with the C=C=CH2 group of
fulvenallene at room temperature. Association with the ring could lead to the formation of one of
the three ring-addition isomers, with 4–C7H6OH being the most stable one. To our knowledge,
there is no information available on the interaction of the OH radical with the cyclopentadiene
ring. Without theoretical calculation of the full C7H6OH potential energy surface, it is not
possible to predict if the OH radical will predominantly interact with the allene- or
cyclopentadiene-like structure of fulvenallene.
In the case of a long-lived van der Waals intermediate, the competition between
formation, decomposition, and isomerization of the initial complex leads to bi-exponential decay
of the OH concentration.31 Because of the low fulvenallene concentration in our experiments, it
is not possible to make conclusions about the mono- or bi-exponential behavior of the OH
temporal profiles. A non-exponential decay would bias the absolute value of the measured rates
and increase the uncertainty of the association rate measurement. As the temperature increases,
the van der Waals complex is likely to have a shorter lifetime, leading OH mono-exponential
decays.

128
Table 5. Reaction enthalpy for the abstraction and addition channels of OH +
Fulvenallene calculated using the CBSQB3 method.
At 450 K the measured rate is similar to that predicted for abstraction of the –CH–H
hydrogen suggesting rapid dissociation of the OH–fulvenallene adduct back to the reactants. At
this temperature and higher, C7H5-formation through water elimination is likely to be the
dominant mechanism. The reaction enthalpies for the abstraction channels displayed in Table 5
are consistent with the weak –CH–H fulvenallene bond calculated at a higher level of theory by
da Silva and Bozzelli.19 Thermodynamically, the formation of the fulvenallene + H2O is the most
favorable abstraction channel, as displayed in Table 5.
4.5 Conclusion
The reaction of hydroxyl radical with fulvenallene was studied over 298-450 K at 5 Torr
(667 Pa) using pulsed laser photolysis-laser induced fluorescence (PLP-LIF) technique. The
room temperature reaction rate is found to be 8.8(±1.7)×10-12 cm3s-1. The rate coefficients
Products ΔH (298 K) (KJmol-1) Products ΔH (298 K)
(KJmol-1)
H2O + 1–C7H5
-157.036 2–C7H6OH
-277.479
H2O + 4–C7H5
-6.740 3–C7H6OH
-85.696
H2O + 5–C7H5
-14.485 4–C7H6OH
-172.842
1–C7H6OH
-97.104 5–C7H6OH
-145.917

129
measured from 298 to 450 K show the negative temperature dependence over the experimental
range suggesting the formation of barrierless Van der Waals complex between OH and
fulvenallene. The enthalpies for the abstraction and addition intermediates of OH + fulvenallene
using CBS-QB3 method32 suggest that the addition product (2-C7H6OH) is favorable (See table
5). At room temperature, the experimental rate coefficient is larger than the calculated
abstraction rate coefficient (see figure 10) suggesting that the formation of fulvenallenyl radical
is likely. At 450 K and higher, the experimental room temperature is comparable with the
calculated abstraction rate coefficient (see figure 10) suggesting that the formation of
fulvenallenyl radical at combustion environment is likely.
References: (1) Hansen, N.; Kasper, T.; Klippenstein, S. J.; Westmoreland, P. R.; Law, M. E.; Taatjes, C.
A.; Kohse-Hoeinghaus, K.; Wang, J.; Cool, T. A. Journal of Physical Chemistry A 2007, 111, 4081.
(2) da Silva, G.; Cole, J. A.; Bozzelli, J. W. Journal of Physical Chemistry A 2009, 113, 6111.
(3) Derudi, M.; Polino, D.; Cavallotti, C. Physical Chemistry Chemical Physics 2011, 13, 21308.
(4) Cavallotti, C.; Derudi, M.; Rota, R. Proceedings of the Combustion Institute 2009, 32, 115.
(5) Buckingham, G. T.; Ormond, T. K.; Porterfield, J. P.; Hemberger, P.; Kostko, O.; Ahmed, M.; Robichaud, D. J.; Nimlos, M. R.; Daily, J. W.; Ellison, G. B. Journal of Chemical Physics 2015, 142.
(6) Polino, D.; Famulari, A.; Cavallotti, C. Journal of Physical Chemistry A 2011, 115, 7928. (7) Zhang, T.; Zhang, L.; Hong, X.; Zhang, K.; Qi, F.; Law, C. K.; Ye, T.; Zhao, P.; Chen, Y.
Combustion and Flame 2009, 156, 2071. (8) Li, Y.; Zhang, L.; Tian, Z.; Yuan, T.; Wang, J.; Yang, B.; Qi, F. Energy & Fuels 2009,
23, 1473. (9) Alexiou, A.; Williams, A. Combustion and Flame 1996, 104, 51. (10) Andrae, J. C. G.; Bjornbom, P.; Cracknell, R. F.; Kalghatgi, G. T. Combustion and Flame
2007, 149, 2. (11) Bounaceur, R.; Da Costa, I.; Fournet, R.; Billaud, F.; Battin-Leclerc, F. International
Journal of Chemical Kinetics 2005, 37, 25. (12) Dagaut, P.; Pengloan, G.; Ristori, A. Physical Chemistry Chemical Physics 2002, 4,
1846. (13) Emdee, J. L.; Brezinsky, K.; Glassman, I. Journal of Physical Chemistry 1992, 96, 2151.

130
(14) Oehlschlaeger, M. A.; Davidson, D. F.; Hanson, R. K. Combustion and Flame 2006, 147, 195.
(15) Sivaramakrishnan, R.; Tranter, R. S.; Brezinsky, K. Combustion and Flame 2004, 139, 340.
(16) Sivaramakrishnan, R.; Tranter, R. S.; Brezinsky, K. Proceedings of the Combustion Institute 2005, 30, 1165.
(17) Shapero, M.; Cole-Filipiak, N. C.; Haibach-Morris, C.; Neumark, D. M. Journal of Physical Chemistry A 2015, 119, 12349.
(18) Song, Y.; Zheng, X.; Lucas, M.; Zhang, J. Physical Chemistry Chemical Physics 2011, 13, 8296.
(19) da Silva, G.; Bozzelli, J. W. Journal of Physical Chemistry A 2009, 113, 12045. (20) Kailasanathan, R. K. A.; Thapa, J.; Goulay, F. Journal of Physical Chemistry A 2014,
118, 7732. (21) Daranlot, J.; Hickson, K. M.; Loison, J.-C.; Mereau, R.; Caralp, F.; Forst, W.; Bergeat, A.
Journal of physical chemistry A 2012, 116, 10871. (22) Zador, J.; Miller, J. A. Proceedings of the Combustion Institute 2015, 35, 181. (23) Cava, M. P.; Muth, K. Journal of the American Chemical Society 1960, 82, 652. (24) Spangler, R. J.; Kim, J. H. Tetrahedron Letters 1972, 1249. (25) Spangler, R. J.; Beckmann, B. G.; Kim, J. H. Journal of Organic Chemistry 1977, 42,
2989. (26) Sakaizumi, T.; Katoh, F.; Ohashi, O.; Yamaguchi, I. Journal of Molecular Spectroscopy
1993, 159, 112. (27) Frisch, M. J. T., G. W.; Schlegel, H. B.; Scuseria, G. E.; Robb, M. A.; Cheeseman, J. R.;
Scalmani, G.; Barone, V.; Mennucci, B.; Petersson, G.A. et.al. Gaussian 09 2009 (28) Lee, C. T.; Yang, W. T.; Parr, R. G. Phys. Rev. B 1988, 37, 785. (29) Becke, A. D. J. Chem. Phys. 1993, 98, 1372. (30) Angell, C. L. Journal of Molecular Structure 1971, 10, 265. (31) Bohn, B.; Zetzsch, C. Physical Chemistry Chemical Physics 2012, 14, 13933. (32) Frish, M. J. T., G.W.; Schlegel, H.B.; Scuseria, G.E.; Robb, M.A.; Cheeseman, J.R.;
Scalmani, G.; Barone, V.; Mennucci, B.; Peterson, G.A.; et.al. Gaussian 09 2009.

131
Chapter 5: Conclusion and Future Directions
Internal combustion engines operate using the energy released from complex chemical
transformation of fuel molecules. Due to incomplete combustion in engines the process still
emits various unwanted byproducts such as NOx, SOx, CO, CO2, unburned hydrocarbons (HCs),
and particulate matters (smoke, soot and its precursors-PAHs). The fuel efficiency of modern
gasoline engines is only about 14-30%.1 It is therefore important to better understand the
fundamental chemistry of combustion intermediates in order to develop combustion strategies
with increased engine efficiency and lower pollutants.
Soot is one of the major pollutants and owing to its environmental (e.g., its deposition
melting polar ice due to radiative forcing2,3 and regional warming by forming brown clouds3)
and health (e.g., eye and skin irritations,4 pulmonary effects (respiratory diseases),5 etc.)
concerns. Soot particles generated by transportation devices such as trucks, cars, planes, ships,
etc. or power stations have been drawn much research attention. Its formation mechanism is not
well understood. Experimental and modelling research studies suggest that soot forms via
condensation or agglomeration of polycyclic aromatic hydrocarbons (PAHs). These molecules
are stable in the combustion environment at high temperatures.6 Examples of PAHs are
naphthalene, anthracene, phenanthrene, pyrene, etc. PAHs also have several health effects such
as eye and skin irritation7, nausea7, vomiting and diarrhea (high concentration)7, skin, lung,
bladder, and gastrointestinal cancers.8,9 These PAHs can either form via the benzene route
followed by hydrogen-abstraction-acetylene-addition (HACA) mechanism6,10,11 or via self or
cross combination of resonance-stabilized radicals such as cyclopentadienyl,12-15 fulvenallenyl,16
etc. The resonance stabilized radicals are predicted to be formed from the reaction of radicals

132
(e.g. hydroxyl radical) with molecules such as phenylacetylene and fulvenallene, which are
observed in combustion environments.
In this dissertation, the reaction of hydroxyl radical was investigated with
phenylacetylene and fulvenallene using pulsed laser photolysis-laser induced fluorescence
technique (PLP-LIF) - a well-known laser spectroscopic technique to study combustion
reactions. For OH + phenylacetylene reaction, absolute reaction rates coefficients were obtained
over the 293 – 423 K temperature range and 1-7.5 Torr pressure range. The OH radicals were
formed in the gas phase using either H2O2 at 266 nm or HONO at 355 nm. The reaction rates
measured as a function of laser fluence at 266 nm photolysis wavelength were found to be laser-
power dependent, while they are laser-power independent at 355 nm. For this reason, all the
experiments were performed at 355 nm photolysis wavelength. The room temperature reaction
rate was measured to be several orders of magnitude greater than the values currently used in
combustion models and may therefore play a significant role in phenylacetylene removal and
formation of oxidation products.18 At this wavelength, within the experimental error bars, the
reaction rate was found to be independent of pressure and temperature also. The temperature
independence of reaction rate, high level calculations (CBS-QB3 method17) of the entrance
pathway exothermicities, and previous theoretical data on the OH + benzene18 and OH +
diacetylene19 reactions suggested the formation of an association pre-reactive complex involving
the ethynyl (-C2H) group of phenylacetylene. The Van der Waals intermediate is then likely to
evolve without or with a small activation energy to a resonantly stabilized addition intermediate,
INT-1 (see chapter 3, figure 16).
Due to the importance of resonance-stabilized radicals in combustion, the reaction of OH
radical with fulvenallene was studied over 298-450 K temperature range at 5 Torr using PLP-LIF
133
technique and hydrogen peroxide (H2O2) as OH radical source at 266 nm. This reaction was
predicted to form the fulvenallenyl radical.16 The room temperature reaction rate was found to be
8.8(±1.7)×10-12 cm3s-1. The rate coefficients measured from 298 to 450 K showed the negative
temperature dependence over the experimental range suggesting the formation of barrierless Van
der Waals complex between OH and fulvenallene. The enthalpies for the abstraction and addition
intermediates of OH + fulvenallene using CBS-QB3 method17 suggest that the addition product
(2-C7H6OH) is favorable (See chapter 4 table 5). At room temperature, the experimental rate
coefficient is larger than the calculated abstraction rate coefficient (see chapter 4 figure 10)
suggesting that the formation of fulvenallenyl radical is likely. At 450 K and higher, the
experimental room temperature is comparable with the calculated abstraction rate coefficient
(see chapter 4 figure 10) suggesting that the formation of fulvenallenyl radical at combustion
environment is likely.
Studying the OH + fulvenallene reaction at higher temperatures will help investigate the
formation of fulvenallenyl radical. Furthermore, it is also very important to study the self and
cross combination of fulvenallenyl radical and other resonance-stabilized radicals to investigate
the formation of polycyclic aromatic hydrocarbons. Since it is not possible to heat the six-way
cross reaction cell higher than 450 K, due to heating of the optics, higher temperature reactions
will be studied in a wall-free subsonic pulsed fast flow reactor. Figure 1 shows the schematic of
the high temperature subsonic pulsed fast flow reactor. It consists of a quasi-static heated double-
walled gas reservoir at 100 Torr, a rotating chopper, a laval nozzle and a tube connected to the
vacuum pump. The chopper opens for approximately 4-5 ms to provide pulsed flow while the
nozzle regulates the instantaneous mass flow rate. Due to expansion within the nozzle the gas
cools down. The presence of the vertical shock wave at the exit of the nozzle restores the

134
temperature of the gas reservoir and maintains the subsonic flow. This fast flow reactor
developed in the laboratory is a prototype that has the temperature range of 300-750 K and
pressure range of 1-10 Torr. The flow velocity for 3-5 milliseconds time is approximately 100
m/s for this set up.
Figure 1. Schematic of high temperature pulsed fast flow reactor
The kinetics experimental set up has a six-way cross arrangement (not shown here) just
right to the room temperature tube of the figure 1. The photolysis laser (Nd:YAG) enters
opposite the flow of the gas and synchronized with the pulsed chopper at 10 Hz to generate
radicals. The probe laser (tunable dye) enters perpendicular to the photolysis laser that monitors
the concentration of the free radicals. Both photolysis and probe lasers enter the reaction
chamber through Brewster angle windows. The photomultiplier tube is placed orthogonal to the
photolysis and probe lasers to collect the fluorescence signal of free radicals. The fluorescence
signal is collected by changing the delay (reaction) time between photolysis and probe lasers
using delay generator. This signal is integrated using a boxcar averager and stored in the
computer for analysis.
References:
(1) Where the Energy Goes: Gasoline Vehicles, https://www.fueleconomy.gov/feg/atv.shtml; Department of Energy.
(2) Jacobson, M. Z. Journal of Geophysical Research-Atmospheres 2004, 109.

135
(3) Ramanathan, V.; Carmichael, G. Nature Geoscience 2008, 1, 221. (4) Sydbom, A.; Blomberg, A.; Parnia, S.; Stenfors, N.; Sandstrom, T.; Dahlen, S. E.
European Respiratory Journal 2001, 17, 733. (5) Nel, A. Science 2005, 308, 804. (6) Frenklach, M. Physical Chemistry Chemical Physics 2002, 4, 2028. (7) Unwin, J.; Cocker, J.; Scobbie, E.; Chambers, H. Annals of Occupational Hygiene 2006,
50, 395. (8) Naeher, L. P.; Brauer, M.; Lipsett, M.; Zelikoff, J. T.; Simpson, C. D.; Koenig, J. Q.;
Smith, K. R. Inhalation Toxicology 2007, 19, 67. (9) Smith, K. R.; Frumkin, H.; Balakrishnan, K.; Butler, C. D.; Chafe, Z. A.; Fairlie, I.;
Kinney, P.; Kjellstrom, T.; Mauzerall, D. L.; McKone, T. E.; McMichael, A. J.; Schneider, M. In Annual Review of Public Health, Vol 34; Fielding, J. E., Ed. 2013; Vol. 34, p 159.
(10) Miller, J. A.; Pilling, M. J.; Troe, E. Proceedings of the Combustion Institute 2005, 30, 43.
(11) Richter, H.; Howard, J. B. Progress in Energy and Combustion Science 2000, 26, 565. (12) Cavallotti, C.; Polino, D. Proceedings of the Combustion Institute 2013, 34, 557. (13) Knyazev, V. D.; Popov, K. V. Journal of Physical Chemistry A 2015, 119, 7418. (14) Mebel, A. M.; Kislov, V. V. Journal of Physical Chemistry A 2009, 113, 9825. (15) Melius, C. F.; Colvin, M. E.; Marinov, N. M.; Pitz, W. J.; Senkan, S. M. Reaction
mechanisms in aromatic hydrocarbon formation involving the C5H5 cyclopentadienyl moiety, 1996.
(16) da Silva, G.; Bozzelli, J. W. Journal of Physical Chemistry A 2009, 113, 12045. (17) Frish, M. J. T., G.W.; Schlegel, H.B.; Scuseria, G.E.; Robb, M.A.; Cheeseman, J.R.;
Scalmani, G.; Barone, V.; Mennucci, B.; Peterson, G.A.; et.al. Gaussian 09 2009. (18) Hollman, D. S.; Simmonett, A. C.; Schaefer, H. F. Physical Chemistry Chemical Physics
2011, 13, 2214. (19) Senosiain, J. P.; Klippenstein, S. J.; Miller, J. A. Proceedings of the Combustion Institute
2007, 31, 185.

136
Appendix
The total energy, lowest frequencies, and optimized coordinates for fulvenallene using 6-
31+G(d,p) basis sets.
Total Energy (6-31+G(d)) = -270.268552602 A.U.
Lowest three frequencies = 138.5, 157.8, 376.4 cm-1
Optimized coordinates (6-31+G(d)):
H -0.115060 -0.083823 0.082525
C -0.142466 -0.055764 1.171253
H 0.814103 -0.083823 1.691882
C -1.271213 0.008658 1.822935
C -2.416265 0.074173 2.484031
C -3.129571 1.300019 2.895859
C -3.231591 -1.063569 2.954760
C -4.321818 -0.551464 3.584202
H -2.971212 -2.103525 2.804430
H -5.120268 -1.122724 4.045188
C -4.258498 0.915717 3.547645
H -2.780750 2.304841 2.694466
H -5.003798 1.575824 3.977944

137
Table 1 and Figures 1 to 6 display the results from the 1H and 13C NMR analysis, confirming the
synthesis of fulvenallene.
Table 1. Experimental and calculated 1H shift (top table), coupling constants (middle
table), and 13C shifts (bottom table) of fulvenallene in CDCl3.

138
Figure 1. 1H NMR spectrum of the liquid product dissolved in CDCl3.
Figure 2. (a) Control 1H NMR spectrum, (b) selective decoupled 1H NMR spectrum,
and (c) expanded portion of the NOESY spectrum.
6.5 6.4 6.3 6.2 6.1 6.0 5.9 5.8 5.7 5.6 5.5 5.4 5.3 5.2
6.48 6.47 6.46 6.45 6.44 6.43 6.42 6.41 6.40
6.48 6.47 6.46 6.45 6.44 6.43 6.42 6.41 6.40
H
H
HH
HH
123
7
5
6
4 1-CH2
H5/H6H4/H7
Selective decoupled 1H NMR spectrum (b); Control 1H NMR spectrum (a) and expanded portion of the NOESY spectrum (c) irradiation
6.45 6.40
5.15
5.20
5.25
5.30
5.35
5.40
(a)
(b)
(c)
NOESY
H1
nOe
H4/H7 H5/H6

139
Figure 3. 13C NMR spectrum of the liquid product dissolved in CDCl3.
Figure 4. Proton coupled 13C NMR spectrum of the liquid product dissolved in CDCl3.

140
Figure 5. Two-dimensional gHSQCAD one bond correlation NMR of the fulvenallene
dissolved in CDCl3.
Figure 6. Two-dimensional long-range gHMBCAD correlation NMR of the fulvenallene
dissolved in CDCl3.