reactivation of intrabasement structures during rifting… · 1 reactivation of intrabasement...
TRANSCRIPT

1
Reactivation of intrabasement structures during rifting: A case study from 1
offshore Norway 2
Thomas B. Phillips 1*, Christopher A-L. Jackson
1, Rebecca E. Bell
1, Oliver B. Duffy
2, 3
Haakon Fossen 3
4
*Corresponding author: [email protected] 5
1 Basins Research Group (BRG), Department of Earth Science and Engineering, Imperial 6
College, South Kensington Campus, Prince Consort Road, London, SW7 2BP, UK 7
2 Bureau of Economic Geology, Jackson School of Geosciences, The University of Texas at 8
Austin, University Station, Box X, Austin, TX 78713-8924, USA 9
3Department of Earth Science/Natural History Collections, University of Bergen, Allégaten 10
41, 5008 Bergen, Norway 11
Abstract 12
Pre-existing structures within crystalline basement may exert a significant influence over the 13
evolution of rifts. However, the exact manner in which these structures reactivate and thus 14
their degree of influence over the overlying rift is poorly understood. Using borehole-15
constrained 2D and 3D seismic reflection data from offshore Southern Norway we identify 16
and constrain the three-dimensional geometry of a series of enigmatic intrabasement 17
reflections. Through 1D waveform modelling and 3D mapping of these reflection packages, 18
we correlate them to the onshore Caledonian thrust belt and Devonian shear zones. Based on 19
the seismic-stratigraphic architecture of the post-basement succession we identify several 20
phases of reactivation of the intrabasement structures associated with multiple tectonic 21
events. Reactivation preferentially occurs along relatively thick (c. 1km), relatively steeply 22

2
dipping (c. 30°) structures, with three main styles of interactions observed between them and 23
overlying faults: (i) faults exploiting intrabasement weaknesses represented by intra-shear 24
zone mylonites; (ii) faults that initiate within the hangingwall of the shear zones, inheriting 25
their orientation and merging with said structure at depth; or (iii) faults that initiate 26
independently from and cross-cut intrabasement structures. We demonstrate that large-scale 27
discrete shear zones act as a long-lived structural template for fault initiation during multiple 28
phases of rifting. 29
1. Introduction 30
Continental rifting is often considered in terms of extension of relatively homogeneous 31
lithosphere (Gupta et al., 1998; Cowie et al., 2000; Gawthorpe and Leeder, 2000). However, 32
continental lithosphere is considerably more complex than envisaged in these idealised 33
models, typically containing a range of structures imparted by previous tectonic events. These 34
structures span a range of scales; from large-scale crustal sutures and orogenic belts (Daly et 35
al., 1989; Mogensen and Korstgård, 2003; Paton and Underhill, 2004; Bird et al., 2014; 36
Bladon et al., 2015), pre-existing fault populations and outcrop-scale fault and fracture 37
networks (Kirkpatrick et al., 2013; Whipp et al., 2014; Duffy et al., 2015), to structures 38
formed at the grain- and even micro-scale. Such pre-existing heterogeneities may; i) 39
reactivate during later tectonic events; ii) act as nucleation sites for later rift-related faults; 40
and iii) localise and modify the regional stress field, thus fundamentally modifying the 41
physiography and evolution of overlying rifts. Field, seismic and potential field data indicate 42
that the reactivation of intrabasement structures may influence the development of rift 43
systems (Daly et al., 1989; Fraser and Gawthorpe, 1990; Maurin and Guiraud, 1993; Ring, 44
1994; Færseth, 1996; Clemson et al., 1997; Morley et al., 2004; Paton and Underhill, 2004; 45
Gontijo-Pascutti et al., 2010; Bellahsen et al., 2013; Bird et al., 2014; Whipp et al., 2014; 46
Salomon et al., 2015; Scheiber et al., 2015), an observation further supported by numerical 47

3
and analogue modelling (Huyghe and Mugnier, 1992; Faccenna et al., 1995; Bellahsen and 48
Daniel, 2005; Henza et al., 2011; Autin et al., 2013; Chattopadhyay and Chakra, 2013; Tong 49
et al., 2014). However, many of these relationships between intrabasement structure and rift 50
systems are simply based on plan-view correlations, with little consideration given to their 51
three-dimensional geometric relationships or kinematic interactions, primarily due to 52
difficulties in imaging and constraining the 3D geometry of the intrabasement structure. For 53
instance, in seismic reflection data, crystalline basement often appears acoustically 54
transparent due to typically low internal impedance contrasts and large burial depths. 55
Although intrabasement structures have previously been imaged using deep seismic reflection 56
data (Chadwick et al., 1983; Choukroune, 1989; Abramovitz and Thybo, 2000; Hedin et al., 57
2012; Fossen et al., 2014), these studies have sparse data coverage and are unable to resolve 58
the required detail and 3D geometry of said strucutres, particularly at upper crustal levels. In 59
addition, interpretations based upon potential field data may be non-unique and of relatively 60
low resolution, with these data typically unable to image discrete structures. In contrast, 61
discrete structures can be analysed in some detail in the field, although these data may not be 62
of sufficient extent to permit truly three-dimensional analysis of large-scale structure. 63
Recent advances in the quality of seismic data have allowed for the detailed mapping of 64
intrabasement structures on both 2D (Bird et al., 2014) and 3D (Reeve et al., 2013; Bird et al., 65
2014) seismic reflection data, and it has been demonstrated that these structures can both 66
influence (Bird et al., 2014) or not influence (Reeve et al., 2013) the structural style and 67
evolution of later rift systems. Therefore, the selective reactivation of intrabasement 68
structures may depend on physical and geometric properties related to their formation and 69
composition, as well as their relation to regional stress fields imposed during later tectonic 70
events. A detailed understanding of the overall 3D geometry and internal architecture of 71

4
intrabasement structures is therefore vital to determine the controls on their selective 72
reactivation and how this affects the geometry and evolution of the overlying rift. 73
In this study we use closely spaced 2D and 3D seismic reflection data from offshore SW 74
Norway (Figure 1, 2) to constrain the 3D geometry of a series of enigmatic reflection 75
packages within crystalline basement, along with key stratigraphic horizons in the overlying 76
rift. Being located close to the margin of the North Sea rift basin and having experienced a 77
complex tectonic history (Figure 3), crystalline basement in the study area is located at 78
relatively shallow depths (<4.5 km) and is highly heterogeneous, containing a series of 79
prominent coherent reflections that can be mapped across large parts of the seismic data. We 80
observe two types of discrete reflection packages within crystalline basement: i) thin (c. 100 81
m) reflection packets displaying a concave-upwards geometry (Figure 4); and ii) thicker (c. 82
1.5 km) reflection packages of inclined reflectivity that dip at c. 30° (Figure 4). Through 1D 83
waveform modelling, we show that these reflections originate from a layered sequence, 84
which we propose are layered intra-shear zone mylonites. Furthermore, because the study 85
area is located close to the Norwegian coastline (Figure 1), we are able to confidently link 86
these reflections to the previously mapped and established onshore geology, specifically 87
shear zones associated with the Caledonian Orogeny and the Devonian orogenic collapse 88
(Morley, 1986; Pedersen and Hertogen, 1990; Fossen and Rykkelid, 1992; Gabrielsen et al., 89
2002; Fossen, 2010; Roffeis and Corfu, 2013; Corfu et al., 2014). 90
Based upon our seismic interpretation of both the cover and the basement, we observe a range 91
of interactions between the intrabasement structures and the overlying rift-related faults 92
throughout multiple tectonic events. In some instances reactivation of intrabasement 93
structures has a profound effect on the later rift; whereas in others, rift-related faults form 94
independently of intrabasement structure. As such, we investigate the factors controlling this 95

5
selective reactivation of the intrabasement structures and offer insights into the mechanisms 96
of their reactivation. 97
2. Geological Setting 98
2.1 Regional setting 99
This study focuses on a 20,000 km2 area located offshore SW Norway, encompassing the 100
WNW- trending Egersund Basin, the N-trending Åsta Graben (Figure 1), and the Stavanger 101
Platform (Figure 1). The major basement-involved faults in the study area are the Åsta Fault, 102
and the Stavanger and Sele High Fault Systems, bounding the Åsta Graben, Stavanger 103
Platform and Sele High respectively (Figure 1). The Stavanger Fault System (SFS) consists 104
of two NW-to-NNW striking fault segments (Figure 1). The Åsta fault strikes N-S along the 105
eastern margin of the Åsta Graben. Between the Åsta and Stavanger fault systems, the south-106
western margin of the Stavanger Platform is bordered by a shallowly dipping ramp, herein 107
termed the Stavanger Ramp (Figure 1). The N-S striking Sele High Fault System (SHFS) 108
forms the western boundary to the Åsta Graben and the Egersund Basin (Figure 1). 109
2.2 Geological History 110
The present day crystalline basement of the North Sea largely formed during the Late 111
Ordovician-Early Devonian Caledonian orogeny (McKerrow et al., 2000) (Figure 3), with 112
older Proterozoic basement remnant to the east of the study area. The Scandian phase of the 113
Caledonian orogeny involved continent-continent collision between Laurentia to the west and 114
Baltica in the east. During this collision, allochthonous material was transported ESE onto the 115
margin of Baltica along a basal zone of mechanically weak Cambrian shales and phyllites 116
overlain by a package of highly sheared rocks of Baltican origin, collectively referred to as 117
the basal décollement zone (Figure 1) (Fossen, 1992; Milnes et al., 1997). The Caledonian 118

6
Deformation Front (CDF) represents the easternmost limit of Caledonian allocthonous 119
material. The in-situ CDF is preserved along eastern Norway, whereas post Caledonian 120
erosion across large parts of southern Norway results in the westward translation of the CDF 121
as observed today (Huuse, 2002; Japsen et al., 2002). Hence, the original CDF can only 122
approximately be located in the area covered by Figure 1. In this study, we refer to the CDF 123
as the present, erosional boundary between Caledonian allochthonous material and 124
Proterozoic autochthonous crystalline basement (Figure 1). 125
Caledonian shortening was succeeded by Devonian orogen-scale extension (McClay et al., 126
1986; Dewey, 1988; Fossen, 1992)(Figure 3). Extension was initially accommodated by the 127
reactivation of pre-existing Caledonian structures (Mode I reactivation of Fossen et al., 128
1992), most notably the basal décollement, as indicated onshore by asymmetric mylonitic 129
fabrics and the overprinting of top-to-SE by top-to-NW shear sense indicators (Fossen, 1992). 130
This reversal of shear along Caledonian structures accounted for 20-30 km of extension 131
across Norway before these structures became locked at low angles. Subsequent extension 132
was accommodated by the formation of large-scale through-going extensional shear zones 133
(Mode II reactivation of Fossen et al., 1992) and a series of Devonian basins (Fossen, 2010; 134
Vetti and Fossen, 2012). The extensional shear zones are mapped onshore across southern 135
Norway to the northern margin of the study area along the present coastline (Pedersen and 136
Hertogen, 1990; Fossen, 2010; Bøe et al., 2011). These shear zones are typically 1-2 km 137
thick, with some up to 5 km (Fossen and Hurich, 2005). 138
Extension in the Carboniferous-Early Permian, potentially in response to post-Variscan 139
orogenic collapse (Ziegler, 1992), resulted in the formation of a number of major faults, 140
notably the Sele High and Stavanger fault systems (Sørensen et al., 1992; Jackson and 141
Lewis, 2013; Jackson and Lewis, 2015) (Figure 1). Subsequent post-rift thermal subsidence 142
led to the formation of the North and South Permian basins, which, during the Late Permian 143

7
were filled with the evaporite-dominated Zechstein Supergroup (Ziegler, 1992). During the 144
Mesozoic, the North Sea experienced two main rift phases, the first occurring during the Late 145
Permian-Early Triassic in response to the breakup of Pangea. E-W-directed extension 146
(Coward et al., 2003; Fossen et al., 2016) led to the development of a predominately N-147
trending rift (Ziegler, 1992; Odinsen et al., 2000), the formation of the Åsta fault, and the 148
reactivation of other major faults within the study area (Sørensen et al., 1992; Jackson and 149
Lewis, 2013; Jackson and Lewis, 2015). A second rift phase lasted from the Late Jurassic into 150
the Early Cretaceous, with previous studies suggesting an extension direction of either E-W 151
(Bartholomew et al., 1993; Brun and Tron, 1993; Bell et al., 2014) or WNW-ESE to NW-SE 152
(Færseth, 1996; Doré et al., 1997; Færseth et al., 1997). Rifting resulted in the initiation of 153
new faults and the reactivation of some pre-existing faults (Bell et al., 2014), including a 154
number of those located within the study area (Figure 3). This rift phase occurred in response 155
to the collapse of a Middle Jurassic Mid-North Sea Dome (Underhill and Partington, 1993), 156
which broadly coincided with the opening of the Norwegian Sea - North Atlantic rift system 157
(Ziegler, 1992). Following Late Jurassic-to-Early Cretaceous rifting, a protracted period of 158
post-rift thermal subsidence was interrupted during the Late Cretaceous by mild inversion 159
related to the Alpine orogeny (Figure 3) (Biddle and Rudolph, 1988; Cartwright, 1989; 160
Jackson et al., 2013). 161
3. Dataset and methodology 162
Key horizons and structures were mapped on a closely spaced (maximum 5 km spacing) grid 163
of 2D seismic reflection data (imaging to 7-9 s two-way-travel time, TWT), and a 3600 km2 164
3D dataset with 25 m line spacing (imaging to 5 s TWT) (Figure 2). Seismic reflection data 165
are zero-phase and displayed following the SEG reverse polarity convention; i.e. a downward 166
increase in acoustic impedance is represented by a trough (red) and a downward decrease in 167
acoustic impedance is represented by a peak (black) (Figure 5). The ages of key seismic 168

8
horizons were constrained using 17 boreholes, three of which penetrate crystalline basement 169
(Figure 3). Checkshot data from these wells were used to create a velocity model to convert 170
structural measurements from the time to depth domain. 171
The dominant intrabasement frequency within the 2D seismic data is c. 20 Hz; using an 172
interval velocity of 6100 ms-1
for crystalline basement (Abramovitz and Thybo, 2000), we 173
estimate an intrabasement vertical resolution of c. 80 m. The quality of imaging within 174
basement is generally very good, although it deteriorates towards the SE due to thicker 175
Zechstein salt in the eastern Egersund Basin. Intrabasement reflections were mapped, where 176
possible, within the 3D volume and across individual closely spaced 2D lines. The distinct 177
seismic expression of the larger intrabasement features (Figure 5, 6) allowed for correlation 178
between individual 2D lines, allowing them to be mapped over a larger area and to greater 179
depths than permitted by the 3D volume alone (Figure 3). 180
Seismic-scale variations in crystalline basement lithology typically produce small impedance 181
contrasts, due to minor differences in seismic velocity and density, and do not produce 182
prominent reflections in seismic reflection data. Therefore, in conjunction with the typically 183
large burial depths of crystalline basement beneath rifts, intrabasement structures are often 184
poorly resolved on seismic reflection data (Torvela et al., 2013). However, imaging of 185
crystalline basement may be improved within areas of shallow basement. In addition, 186
intrabasement reflectivity may be enhanced through constructive interference within layered 187
sequences, such as those observed between highly strained mylonite zones and less deformed 188
country rock (Fountain et al., 1984; Wang et al., 1989). 189
1D waveform modelling was used to test the geological origin of the characteristic reflection 190
patterns observed within the intrabasement structures. We make no attempt to model the 191
absolute or relative amplitudes of the data, instead focussing on the interference between 192

9
reflections and the first-order reflection patterns. In addition, we do not account for 193
attenuation of the seismic wave with depth. Reflection co-efficients of +1 and -1 were 194
assumed for increases and decreases in acoustic impedance respectively. Taking into account 195
the reverse data polarity, we use an incident negative ricker wavelet of 20 Hz, assuming an 196
intrabasement velocity of 6100 ms-1
. Wavelet responses were calculated from horizons at 197
varying depths and then convolved to produce the overall model reflection pattern. 198
199
4. Interpretation of intrabasement structure 200
4.1 Offshore intrabasement reflectivity 201
We observe two types of prominent reflections within crystalline basement: i) relatively thin 202
(c. 80-100 m), concave-upwards, high-amplitude reflection packets that dip 0-10° and are 203
characterised by a trough-peak-trough wavetrain (Figure 4a); and ii) relatively thick (c. 1-2 204
km) packages of high-amplitude reflectivity dipping at c. 30°, which are herein termed 205
intrabasement packages (IP) (Figure 4a). In detail, the IP comprise an anastomosing network 206
of high-amplitude, sub-parallel reflections (Figure 4a, 5). Although the overall geometry of 207
the IP, i.e. the top and base of the packages, can be mapped across multiple 2D seismic 208
sections (Figure 6, 7), we are unable to map individual internal reflections as they are often 209
laterally discontinuous (Figure 6). 210
Basement-penetrating wells (Figure 2) sample Caledonian and Proterozoic crystalline 211
basement, confirming that the mapped deep reflectivity is within crystalline basement. The 212
geometry and extent of the reflections do not mimic that of any reflections in the overlying 213
cover, thus we argue they are not multiples (Figure 5). Furthermore, the intrabasement 214

10
reflections are visible across independent seismic datasets, suggesting that they represent real 215
geological boundaries rather than an acquisition- or processing-related geophysical artefact. 216
4.2 Waveform modelling of intrabasement reflections 217
Later in this paper, we correlate the large scale intrabasement packages described above to 218
discrete basement shear zones that are mapped onshore southern Norway. However, we first 219
here use 1D waveform modelling to demonstrate that the observed reflection patterns 220
resemble the general internal geometries of shear zones described elsewhere. 221
1D waveform modelling allows us to recreate first-order reflection patterns observed in the 222
data. First, we find that the observed first-order reflection pattern, the characteristic trough-223
peak-trough wavetrain, cannot be generated using a single interface, instead forming through 224
constructive interference between reflections generated within a layered sequence (Figure 225
4b). We therefore produce a series of layered models with different layer and interlayer 226
thicknesses (Fountain et al., 1984) and compare these to the observed reflection patterns 227
(Figure 4b). A reflection coefficient of -1 was used to define the top of a layer, and +1 used to 228
define the base (Figure 4b). 229
Our analyses show that reflections produced by closely spaced (c. 100 m) layers 230
constructively interfere to create a trough-peak-trough wavetrain, similar to the thin reflection 231
packets observed within the data (Figure 4a,b). We find that the observed intrabasement 232
reflection patterns are best represented by c. 100 m thick layers of material with a lower 233
acoustic impedance (AI) separated by 50-100 m of higher acoustic impedance material. In the 234
example shown in Figure 4b, 100 m thick low-AI layers, separated by 50 m thick, high-AI 235
layers best fit the upper segment of the observed reflection pattern, whereas a high-AI layer 236
thickness of 100 m best fits the lower part. Furthermore, we find that continually adding 237
similarly spaced layers to the sequence acts to increase the number of cycles present in, and 238

11
therefore the overall thickness of, the overall reflection package, resembling the observed IPs 239
(Figure 4a,b). As the spacing between layers increases, the degree of constructive 240
interference decreases until two distinct reflections can be resolved. At a spacing of >150 m, 241
layers begin to produce two distinct reflection events (Figure 4b), as opposed to 242
constructively interfering within one another. Slight variations in layer and interlayer 243
thicknesses result in differing degrees of interference, causing variations in the imaging of 244
individual layered sequences. Prominent reflections within the package may represent areas 245
displaying the optimal spacing (c. 50-100 m) for constructive interference, with less distinct 246
reflections generated at non-optimal layer and interlayer thicknesses. 247
Based on our modelling results we propose that the observed intrabasement structures most 248
likely represent intra-shear zone mylonites. Previous studies have also correlated similar 249
structures observed in seismic reflection data, showing the characteristic trough-peak-trough 250
wavetrain, to mylonite zones as observed onshore (Fountain et al., 1984; Hurich et al., 1985; 251
Reeve et al., 2013), with some offering direct control through outcrop and well data (Wang et 252
al., 1989; Hedin et al., 2012; Lorenz et al., 2015). In addition, our observed thicknesses of c. 253
100 m are of a similar scale to those proposed in previous modelling studies (Fountain et al., 254
1984; Reeve et al., 2013), and the internal structure of these intra-shear zone mylonites 255
display a similar anastomosing geometry to those observed elsewhere; for example, onshore 256
Norway (Boundy et al., 1992; Scheiber et al., 2015), the central alps (Choukroune and 257
Gapais, 1983), the Cap de Creus shear zone network (Druguet et al., 1997; Carreras, 2001; 258
Carreras et al., 2010; Ponce et al., 2013) and southern Africa (Goscombe et al., 2003; 259
Goscombe and Gray, 2008; Rennie et al., 2013). However, we must also consider that the 260
observed 100 m scale mylonites only reflect one scale of localisation present within shear 261
zones (Carreras, 2001); the top and base of thicker mylonite zones may not constructively 262
interfere and produce a prominent seismic reflection, whereas thinner mylonite zones may 263

12
not be resolved in our seismic data. The modelled mylonite zones may actually represent a 264
high concentration of thinner mylonite layers, at thicknesses below seismic resolution and 265
therefore producing the same reflection pattern as a thicker mylonite zone (Carreras, 2001). 266
4.3 Geometry of offshore intrabasement structures 267
Having modelled the reflection patterns within the intrabasement reflection packages and 268
having argued that these may be linked to intra-shear zone mylonites (Figure 4b), we now 269
provide a more detailed description of the overall geometry of the discrete reflection 270
packages in order to link them explicitly to specific basement structures mapped onshore. A 271
series of thin reflection packets are observed above a shallowly dipping intrabasement 272
package, termed IP1 (Figure 5, 6). IP1 is in turn is cross-cut by other intrabasement packages, 273
termed IP2 and IP3 (Figure 5). A further intrabasement package, IP4 is observed further to 274
the south (Figure 6, 7).We now describe the 3D geometry of these intrabasement packages. 275
IP1 is 0.5-1 s TWT (c. 1 km) thick and is the lowermost intrabasement package mappable 276
within the study area. IP1 predominately dips 0° to 11° W, although it may locally dip 277
shallowly to the east, and is truncated by the top basement unconformity beneath the 278
Stavanger Platform (Figure 5, 6). To the north of the study area, beneath the Stavanger 279
Platform, IP1 is cross-cut by intrabasement structures IP2 and IP3 (Figure 5). IP1 is not 280
visible to the west and in the hanging wall of IP2. To the south, IP1 is mapped beneath the 281
Egersund Basin and Flekkefjord High (Figure 1), within the hanging wall of the Sele High 282
Fault System, where it is slightly offset by IP4 (Figure 7, 8). Across the Stavanger platform, a 283
series of relatively thin (100 ms or c. 100 m) reflection packets are locally mapped (over c. 284
750 km2; Figure 9). These reflections sole-out onto IP1, strike N-S and dip westwards at 0-285
10°, displaying a concave-upwards geometry. When viewed collectively they exhibit a flat-286
ramp style geometry (Figure 6). 287

13
IP2 is 1-1.5s TWT (c. 2 km) thick. Along the western margin of the Stavanger Platform it is 288
truncated along the top basement unconformity, where it strikes N-S and dips c. 30° W 289
(Figure 5). Here, IP1 is present in the footwall but not the hangingwall of IP2. Further south, 290
beneath the Stavanger ramp and Egersund Basin, IP2 strikes NE-SW before being offset by c. 291
2 s TWT by the N-S striking Sele High Fault System (Figure 9). Along the northern part of 292
the Sele High Fault System, IP2 is truncated by the top basement unconformity in the 293
hanging wall of the fault; whereas in the centre it is offset and is present on both sides of the 294
fault, and in the south it is only present within the footwall (Figure 8). In the south, where IP2 295
is only present in the footwall of the Sele High Fault System, IP1 is not offset, and is present 296
within the hanging wall of IP2 and the hanging wall of the Sele High Fault System. 297
IP3 is 1-1.5 s TWT (c. 2 km) thick and is truncated at the top basement unconformity across 298
the Stavanger Platform (Figure 5). IP3 strikes roughly N-S, dips c. 30° W, and also offsets 299
IP1 (Figure 5). A local basin, herein termed the Stavanger Basin, is present above the 300
structure (Figure 5). Limited data coverage across the Stavanger Platform does not allow for 301
detailed mapping of the package, although it is observed along strike further to the south 302
along the southern margin of the Stavanger Platform and the Stavanger Fault System (Figure 303
7). 304
A further intrabasement structure, IP4, splays-off southwards from IP2, beneath the Egersund 305
Basin and Flekkefjord High. This IP is 0.5-1 s (0.5-1 km) thick, strikes 010° N and dips 30° 306
W (Figure 6, 7, 8). IP4 also offsets IP1 and may merge with IP2 at depth (Figure 6) and along 307
strike to the north (Figure 9). East of IP4, several other IPs are observed in, and possibly 308
splay off from, the hanging wall of the larger structure (Figure 8). These may represent 309
additional IPs splaying from IP4, mirroring the geometric relationship of IP2 and IP4 further 310
to the north (Figure 7); or alternatively, a segment of IP1 within the footwall of IP4. 311

14
4.5. Onshore-offshore correlation of intrabasement structures 312
Based on our waveform modelling showing that the intrabasement reflections represent intra-313
shear zone mylonites (Figure 4), and combined with their overall 3D geometry, we now link 314
our offshore intrabasement structures to specific shear zones mapped onshore. In particular, 315
we link them to the CDF and Devonian extensional shear zones that have previously been 316
studied and mapped in great detail (Figure 1) (Fossen, 1992; Fossen and Dunlap, 1998; 317
Gabrielsen et al., 2002; Olesen et al., 2004; Bingen et al., 2008; Bøe et al., 2011; Lundmark 318
et al., 2013; Roffeis and Corfu, 2013). 319
The subcrop of IP1 at top crystalline basement correlates along strike northwards to the CDF 320
onshore. In addition, basement-penetrating wells (18/11-1; Figure 9) sample Caledonian 321
crystalline basement (Sørensen et al., 1992) west of IP1, and a Proterozoic granite to the east 322
(10/5-1; Figure 9), indicating that the CDF must lie between these locations (Figure 9). Based 323
on our seismic mapping of IP1, and supported by these observations and the 1D waveform 324
modelling, we interpret IP1 to represent the offshore continuation of the basal décollement 325
zone of the Caledonian thrust belt, with the subcrop at top basement level representing the 326
CDF itself. To the south, our interpretation of the CDF correlates along strike to the location 327
of the CDF in the Central North Sea as mapped using deep regional seismic data (Abramovitz 328
and Thybo, 1999; Abramovitz and Thybo, 2000), overall extending the mapped extent of this 329
structure over 100 km into the Central North Sea (Figure 9). A number of thin intra-shear 330
zone mylonites are observed above the basal décollement (Figure 10). Based on their low dip 331
(0-10°) and overall flat-ramp geometry, we infer that these structures initially formed as 332
mylonitic Caledonian thrusts (cf. Reeve et al. (2013)). 333
A series of intrabasement packages (IP2-4), dipping at c. 30°, cross-cut the shallowly dipping 334
basal décollement of the Caledonian thrust belt (Figure 5, 6, 9). IP2 correlates along-strike to 335

15
the Devonian-aged extensional Karmøy Shear Zone (KSZ) observed onshore. The KSZ forms 336
a southwards splay from the Hardangerfjord Shear Zone to the north (Fossen, 2010). IP3 is 337
confidently correlated c. 30 km along-strike to the onshore Stavanger Shear Zone (SSZ). 338
These interpretations are further constrained locally by interpretations of the deep regional 339
ILP seismic data (Fossen et al., 2014). IP4 however, does not correlate to any structures 340
mapped onshore or on deep seismic reflection data; we thus propose that this represents a 341
previously undefined structure that we hereby term the Flekkefjord Shear Zone (FSZ; Figure 342
9). We infer that the FSZ splays southwards from the footwall of the KSZ, showing a similar 343
relationship to that observed between the KSZ and the Hardangerfjord Shear Zone further 344
north (Figure 9, 11). 345
We have constrained the 3D geometry of a series of intrabasement structures associated with 346
the Caledonian thrust belt and Devonian extensional shear zones (Figure 9). Caledonian 347
allocthons and the associated basal décollement are observed within the hanging walls of 348
later (i.e. cross-cutting) Devonian extensional shear zones. A number of these shear zones 349
splay southwards, potentially merging at depth and initially originating from the HSZ to the 350
north (Figure 9). 351
5. Reactivation of intrabasement structures 352
Using our detailed 3D framework of intrabasement structure, combined with seismic-353
stratigraphic analysis of the sedimentary cover, we now investigate the reactivation of these 354
structures during post-Devonian tectonic events and examine how this has affected the 355
geometry and evolution of the superposed rift. 356
5.1. Reactivation of Caledonian thrust structures 357

16
We map a series of thin intra-shear zone mylonites, previously interpreted as Caledonian 358
thrusts (Figure 6), above the basal décollement and beneath a series of Lower Permian 359
depocentres (Figure 6, 10). These structures are only mapped locally on the Stavanger 360
Platform (Figure 9); further north, these thin structures are very difficult to identify and map 361
across rather sparse, relatively widely spaced 2D seismic profiles (Figure 2). 362
Two seismic facies, defining an upper and lower set of depocentres, are observed within the 363
hanging wall of some of the interpreted Caledonian thrusts (Figure 10), indicating some 364
extensional reactivation along these structures. The upper depocentres are typically 2-4 km 365
in diameter and around 100 ms thick (c. 130 m). They display higher amplitudes than the 366
lower depocentres and surrounding seismic facies (Figure 10). The upper depocentres are 367
truncated by the overlying Base Cretaceous Unconformity (BCU) and internal reflections 368
onlap onto the underlying strata (Figure 10). The lower depocentres are truncated and 369
separated from the upper depocentres by an unconformity of unknown age. The lower 370
depocentres are typically of lower amplitude than those above, forming a unit c. 200 ms (c. 371
300 m) thick, although the boundary with the underlying basement is often unclear (Figure 372
10). Wedge-shaped stratal geometries are observed locally, thickening towards the 373
Caledonian thrusts (Figure 10). 374
We interpret that the lower depocentres formed during an early phase of extensional 375
reactivation along the Caledonian thrusts. The age of the strata flanking these structures and 376
therefore the timing of the extensional reactivation of the Caledonian thrusts is unknown due 377
to a lack of well penetration and erosion associated with the BCU (Figure 10). However, 378
these structures may have undergone extensional reactivation during the initial stages of 379
Devonian orogenic collapse (Mode I), when extension was accommodated through 380
backsliding of the orogenic wedge and reactivation of Caledonian structures (Fossen, 1992). 381
During this extension, the mylonitic shear zones may have formed weaknesses within the 382

17
nappe sequence, acting to localise strain and preferentially reactivating; leading to the 383
development of the lower depocentres. We speculate that the high-amplitude upper 384
depocentres may have formed during a later period of brittle extension, with the bounding 385
structures, the extensionally reactivated Caledonian thrusts, having been weakened during the 386
first phase of reactivation. 387
A later phase of reverse reactivation is observed along some of the structures, as indicated by 388
the presence of a raised depocentre bounded by two Caledonian thrusts and an accompanying 389
inversion monocline (Figure 10). The BCU is gently folded across this monocline, indicating 390
the structure is post-Cretaceous in age. We suggest that the causal compressional event may 391
have occurred during the Upper Cretaceous, potentially related to the Alpine inversion 392
(Figure 5) (Biddle and Rudolph, 1988; Cartwright, 1989; Jackson et al., 2013). 393
As described above, we observe extensional and compressional reactivation of individual 394
Caledonian thrusts. However, the depocentres resulting from this reactivation are relatively 395
minor compared to the main rift-related faults and do not affect the large-scale rift 396
morphology. It appears that Mode I Devonian extension had a negligible impact on the 397
overall evolution of the rift, especially in comparison to the formation of the large-scale 398
Devonian Shear Zones during subsequent Mode II extension, as described below. 399
5.2. Reactivation of Devonian shear zones 400
In addition to that described in the previous section, we also observe multiple phases of 401
reactivation of Devonian extensional shear zones. Along the KSZ we observe Triassic strata 402
that thicken across a series of faults rooted into internal planes within the shear zone (Figure 403
7, 11). In addition, across-fault thickening and wedge-shaped stratal geometries are observed 404
in Triassic strata in the hanging wall of the Flekkefjord Shear Zone (FSZ) (Figure 11). This 405
indicates that both structures underwent extensional reactivation during the Triassic. 406

18
Furthermore, a series of salt walls are located above the intrabasement structures in the south 407
(Figure 8); Triassic extensional reactivation of the underlying intrabasement structures may 408
have led to salt mobilisation and the formation of overlying salt walls (Koyi and Petersen, 409
1992). Jurassic and Lower Cretaceous strata also thicken across the FSZ, though they are 410
largely isopachous across the KSZ. Slight thickening of Lower Cretaceous strata is observed 411
across the KSZ in the Stavanger Ramp area (Figure 11), although the majority of extension in 412
this area was accommodated by the FSZ rather than the KSZ. The KSZ accommodates large 413
amounts of extension in the north beneath the Åsta Graben where the FSZ is not present 414
(Figure 12), whereas to the south extension is initially distributed between the KSZ and FSZ 415
(Figure 7, 11), and then solely accommodated by the FSZ (Figure 8). Bøe et al. (2011) 416
propose further evidence for the Jurassic extensional reactivation of the KSZ, with the 417
Karmsundet Basin, offshore Karmøy island, formed through extensional reactivation of the 418
KSZ. 419
A NE-facing, NW-SE-striking monocline is observed above the FSZ (Figure 11). Upper 420
Cretaceous strata onlap the forelimb of the monocline, indicating it formed during the Late 421
Cretaceous. Similarly oriented structures are observed in this part of the North Sea (Biddle 422
and Rudolph, 1988; Cartwright, 1989; Thybo, 2000; Jackson et al., 2013). For example, 423
Jackson et al. (2013) observe inversion-related anticlines directly along-strike to the south, 424
above the Stavanger Fault System (Figure 7). These folds initiated during the latest Turonian-425
to-earliest Coniacian and the Santonian, and were caused by NE-directed compression 426
resulting from the Alpine Orogeny (Jackson et al., 2013). The observed monocline above the 427
FSZ forms a continuation of this structure to the NW, with reactivation occurring along a 428
fault related to the FSZ as opposed to the Stavanger Fault System. 429
6. Relationships between intrabasement structures and rift-related faults 430

19
We note a strong plan-view correlation between the location and orientation of the 431
intrabasement structures at top basement level and the location and orientation of the later 432
rift-related faults (Figure 9). For example, the Stavanger Fault System and the Lista fault 433
blocks follow the same trend as the underlying SSZ and CDF respectively (Figure 9); 434
likewise, the Åsta Fault shares the orientation and polarity of the underlying KSZ (Figure 9). 435
Similar correlations between basement structures and rift-related faults have previously been 436
noted in plan-view (Younes and McClay, 2002; Bellahsen et al., 2013; Fossen et al., 2016), 437
with faults inheriting pre-existing structures that are oriented oblique to the regional stress 438
field. Examining these relationships in cross section, we observe a range of interaction styles 439
between the intrabasement structures and the later rift-related faults: i) ‘merging faults’ that 440
join along the margin of the shear zone at depth (e.g. between the KSZ and the Åsta fault; 441
Figure 12); ii) ‘exploitative faults’ that root into internal planes at the underlying shear zone 442
subcrops (e.g. above the FSZ; see Figure 11; and above the SSZ; see Figure 5); and iii) 443
‘cross-cutting faults’ that form independently from and are unaffected by any underlying 444
basement structure (e.g. where the Sele High Fault System cross-cuts the KSZ; Figure 13). 445
We here provide detailed descriptions of these three interaction styles between the 446
intrabasement structure and rift-related faults. 447
6.1 Faults merging along the margin of shear zones at depth 448
Some rift-related faults are located within the hangingwall of intrabasement structures, 449
following their orientation and dip direction in map view (Figure 9), and merging along the 450
margins of these structures at depth (Figure 12). The upper part of the shear zone subcrops 451
within the footwall of the younger rift-related fault. For example, the Åsta fault is situated 452
above the KSZ, soling down into the margin of the structure at c. 3 s TWT (c. 4 km). Triassic 453
strata are largely restricted to the hanging wall of the Åsta fault, indicating that this structure 454
may have been active during the Permo-Triassic rift event. Jurassic and Lower Cretaceous 455

20
strata also thicken across the Åsta fault, indicating that the fault was also active during the 456
Jurassic and Early Cretaceous, and that the KSZ was reactivated during Late Jurassic-Early 457
Cretaceous rifting (Figure 12). In addition, a wedge-shaped package of reflections occurs 458
within the Åsta Graben, with this package truncated along the base Triassic along at its top 459
(Figure 12). We infer this package records a pre-Triassic, potentially Carboniferous-Permian 460
period of extension (Sørensen et al., 1992; Ziegler, 1992). 461
6.2 Faults exploiting internal planes within shear zones 462
Some rift-related faults link downward into discrete planes within the intrabasement shear 463
zones, as observed in association with IP4 (Figure 7), the KSZ (Figure 11) and the SSZ 464
(Figure 5). In these instances we infer that reactivation occurs internally within the shear 465
zone, potentially exploiting weak internal mylonite zones, forming a fault that then 466
propagates upwards into the cover. Furthermore, in the locations where the shear zones are 467
truncated at top basement a number of minor depocentres and extensional top-basement 468
offsets are observed, suggesting extension along internal planes within the shear zone (Figure 469
5, 12). 470
As previously described, the Stavanger Basin is located within the Stavanger Platform 471
(Figure 1), directly above the Stavanger Shear Zone (Figure 5, 9). Due to a lack of well 472
control across the Stavanger Platform we are unable to directly determine the age of the 473
contained sediments, although a Permo-Triassic rift age seems likely, which is consistent 474
with the Stavanger Fault System along strike to the south (Figure 9). The shear zones offset 475
the basal décollement of the Caledonian thrust belt. A series of faults bound the overlying 476
depocentre and exploit internal planes within the underlying shear zone. In addition, two 477
large lozenge-shaped reflection packages are observed within the shear zone, bound by faults 478
(Figure 5). 479

21
To the south, a similar exploitative interaction is proposed for the relationship between the 480
Stavanger Fault System and the SSZ (Figure 9), although this is not as well imaged in our 481
seismic data (Figure 7). The Stavanger Fault System has previously been interpreted to 482
represent a reactivated Caledonian thrust (Sørensen et al., 1992); however, based on our 483
interpretation and mapping of the structure (Figure 9), along with similar relationships 484
observed to the north (Figure 5), we take to be the basal décollement of the Caledonian thrust 485
belt for the southern fault segment (Figure 9), and the SSZ for the northern segment (Figure 486
6). The presence of Permian Zechstein salt in the area often complicates the stratal 487
geometries; however, where salt is largely absent, we observe that Triassic strata thicken 488
towards the faults, indicating that they were active at this time (Figure 7). In addition, 489
Jackson et al. (2013), observe the formation of an inversion-related anticline above the fault 490
(Figure 7), indicating that the fault, and therefore potentially the SSZ, underwent reverse 491
reactivation during Late Cretaceous compression. 492
6.3 Faults cross-cutting intrabasement structure 493
Although many intrabasement structures and rift-related cover structures are often 494
geometrically and kinematically linked, as described in the previous two sections, we also 495
observe instances where the two are seemingly unrelated, with the latter cross-cutting the 496
former. The Sele High Fault System is situated between the subcrops of the KSZ to the east 497
and the HSZ to the northwest. This fault system strikes N-S, and dips c. 60°E. At c. 5 s TWT 498
the fault cross-cuts the underlying KSZ, offsetting the structure by c. 2 s TWT (c. 3.5 km) 499
(Figure 13). A further fault is observed within the footwall of the Sele High Fault System, 500
offsetting an earlier formed, potentially Carboniferous basin (Sørensen et al., 1992), and 501
appearing to terminate at the KSZ (Figure 13). 502
7. Discussion 503

22
7.1 3D Geometry and inter-relationships between intrabasement structures 504
The Caledonian thrust belt was cross-cut by extensional Devonian shear zones during 505
orogenic collapse of the Caledonides (Fossen, 2010). We observe similar relationships within 506
our data, with the basal décollement of the Caledonian thrust belt being extensionally offset 507
across the SSZ and KSZ, although it is not imaged in the downthrown hanging wall of the 508
latter (Figure 5). Distributed ductile deformation across the Stavanger Shear Zone during its 509
formation resulted in the monoclinal folding of the basal décollement and overlying 510
Caledonian nappes (sensu Fossen and Hurich, 2005). Subsequently, during a later, most 511
likely Permo-Triassic rift phase, the SSZ was reactivated in a brittle manner, forming the 512
Stavanger Basin (Figure 5). The Stavanger Basin is bound by faults that exploit internal 513
planes within the shear zone. Contrary to the distributed strain associated with folding of the 514
basal décollement during the Devonian, the brittle faults exploit discrete internal planes 515
within the shear zone; this results in shearing of the basal décollement between these faults, 516
and the development of lozenge-shaped reflection packages (Figure 5) that indicate 517
extensional, sinistral shear (Ponce et al., 2013). Similar relationships are observed onshore; 518
Fossen and Hurich (2005) observe that formation of the Devonian-aged HSZ folded the 519
overlying Caledonian thrust belt. This was later exploited by the overlying brittle Lærdel-520
Gjende fault system. 521
The newly defined FSZ forms a southward splay from the KSZ (Figure 9), mirroring the 522
relationship between the latter and the HSZ further to the north. In addition the FSZ merges 523
with the KSZ at depth (Figure 11). Fossen and Hurich (2005) propose that the HSZ represents 524
the boundary between thick-skinned to the north and thin-skinned tectonics towards the south 525
and is associated with a major Moho offset (Fossen et al., 2014). Based on our observations 526
we may speculate that the southwards splaying KSZ and FSZ join the HSZ at mid-crustal 527
depths representing a more thin-skinned component of Devonian orogenic collapse. 528

23
7.2 Selective reactivation of intrabasement structure 529
Using the 3D framework of intrabasement structure along with the seismic stratigraphic 530
architecture of the overlying rift, we are able to examine in detail the interactions between the 531
intrabasement structures and later rift-related faults throughout multiple tectonic events. Our 532
data suggest that thinner (c. 100 m) structures (i.e. Caledonian thrusts) are less likely to 533
interact with later rift-related faults than thicker (1-2 km) structures. Although we do observe 534
minor reactivation of Caledonian thrusts (Figure 10), we suggest this is linked to Mode I 535
Devonian, rather than subsequent Permo-Triassic or Jurassic-Cretaceous extension (Fossen 536
and Rykkelid, 1992), and does not affect the overall geometry and evolution of the 537
superposed rift. Reeve et al. (2013) identify similar reflection packets to the north in the 538
northern North Sea, also interpreting them as Caledonian thrusts, and find that rift-related 539
faults cross-cut and are unaffected by their presence. Similarly, Kirkpatrick et al. (2013) 540
suggest a degree of scale-dependency on the reactivation of intrabasement structures, with 541
large-scale structures preferentially reactivated and smaller structures cross-cut. We argue 542
that thicker structures are preferentially reactivated because they are more likely to contain a 543
layer weak or several weak layers, in this instance represented by intra-shear zone mylonites, 544
that may be reactivated during later rift events (White et al., 1986; Salomon et al., 2015). 545
Although the mapped intrabasement structures are all relatively low-angle (<30 °), we also 546
note, notwithstanding Devonian mode I extension, a lack of reactivation of the relatively 547
shallow-dipping (c. 10 °), albeit relatively thick (c. 1-2 km) intrabasement structures, such as 548
the basal décollement. Conversely, we observe multiple phases of reactivation along the 549
steeper (c. 30°), relatively thick (c. 1-2 km) Devonian shear zones (Figure 5, 12). Therefore, 550
in addition to thicker structures being preferentially reactivated, we suggest that steeper 551
structures are also preferentially reactivated over shallow ones, in accordance with 552
theoretical considerations (Sibson, 1985). The orientation of intrabasement structures relative 553

24
to the regional stress field may also play a role in their selective reactivation (Ring, 1994; 554
Morley et al., 2004; Henza et al., 2011), although we are unable to assess this factor as the 555
studied intrabasement structures all roughly trend N-S and dip westward. 556
Finally, we find that previously reactivated structures are consequently weakened and 557
therefore more likely to reactivate during a later tectonic event. For example, IP4 initially 558
formed as an extensional structure during the Devonian, underwent extensional reactivation 559
during Permo-Triassic rifting, was further extensionally reactivated during the Late Jurassic-560
Early Cretaceous rift phase, and finally underwent reverse reactivation in response to Late 561
Cretaceous compression (Figure 6, 11). 562
7.3 Fault-intrabasement structure interactions 563
We observe three main styles of interaction between rift-related faults and underlying 564
Devonian shear zones (e.g. ‘merging’, ‘exploitative’, and ‘cross-cutting’ faults; see Figure 565
14). 566
Exploitative faults are observed along IP4, the KSZ and the SSZ (Figure 5, 8, 9), rooting into 567
internal reflection planes interpreted as layered sequences of highly strained mylonites and 568
relatively undeformed rock. The mylonitic foliation, along with the overall layering, mean the 569
shear zone is strongly mechanically anisotropic, with the mylonite zones being weaker than 570
the surrounding relatively undeformed rocks (White et al., 1980; Chattopadhyay and Chakra, 571
2013). This strong heterogeneity may be preferentially exploited during later brittle 572
reactivation of the shear zones (Gontijo-Pascutti et al., 2010; Salomon et al., 2015; Scheiber 573
et al., 2015). In addition, varying thicknesses of mylonite zones and the degree of strain 574
experienced may have different strengths, providing multiple potential sites for later faults to 575
exploit during brittle reactivation of the shear zones. 576

25
The Åsta fault is an example of a merging fault interaction, joining along the margin of the 577
KSZ at depth (Figure 5, 12). What is less clear is where the rift-related fault initiates and how 578
it subsequently propagates, does it initiate at and grow upwards from the shear zone; or 579
nucleate within the hanging wall of the shear zone, before propagating downwards and 580
joining the structure at depth? In the former situation, extension may be accommodated by 581
ductile reactivation of the shear zone at depth, with the formation of a steeper fault becoming 582
preferential at shallower levels (Huyghe and Mugnier, 1992); whilst theoretically possible we 583
note that, at least within the study area, the KSZ does not reach the depths of the ductile 584
regime. In the latter situation, the shear zone acts as an intrabasement heterogeneity, acting to 585
perturb the regional stress field and localise strain, causing fault nucleation within its hanging 586
wall, with these faults inheriting the orientation and dip direction of the underlying structure. 587
Subsequent growth would then cause the faults to physically link with the underlying 588
structure. Furthermore, previous studies have shown that the dip of later rift-related faults 589
may be influenced by the dip of underlying shear zones (Ring, 1994; Salomon et al., 2015), 590
with initial fractures coalescing to produce a steeper through-going fault. Due to the reasons 591
outlined above, we prefer the latter scenario, where faults initiate above and ultimately link 592
downward with the intrabasement structures. 593
The Devonian shear zones often show rugose top basement subcrops, with minor extensional 594
exploitative faults present (Figure 9). The weak, low-angle shear zone may initially 595
accommodate small amounts of extension, forming exploitative faults (Figure 5, 13). Upon 596
further extension, the low-angle shear zone may become locked, resulting in the formation of 597
a steeper fault within the hanging wall, inheriting the geometric properties of the underlying 598
shear zone, which eventually displays a ‘merging’ relationship (Figure 9). 599
Cross-cutting faults, such as the Sele High Fault System (Figure 13), form in areas where 600
large intrabasement structures are lacking. Therefore they initiate in a manner similar to faults 601

26
forming within homogeneous material (Cowie et al., 2000; Gawthorpe and Leeder, 2000). 602
Such faults form in response to the regional stress field, perpendicular to the extension 603
direction and at typical dips of c. 60°, as opposed to in response to local perturbations 604
surrounding intrabasement structures (Figure 15). As they propagate laterally and vertically 605
the faults are at a high angle to and therefore cross-cut underlying, low-angle intrabasement 606
structures. 607
7.4 Effects of intrabasement structure on rift geometry and evolution 608
Rifts forming within relatively pristine (i.e. homogenous) crust are typically characterised by 609
regularly spaced, sub-parallel faults that strike perpendicular to the regional extension 610
direction (Gupta et al., 1998; Cowie et al., 2000; Gawthorpe and Leeder, 2000). However, the 611
geometry and evolution of rift basins in areas of more heterogeneous (i.e. ‘non-pristine’) 612
crust, such as those containing pre-existing, discrete intrabasement structures, differ from and 613
thus cannot be adequately described using established models of rift evolution. For example, 614
we show that large-scale Devonian shear zones act as heterogeneities within this otherwise 615
‘pristine’ crust and, being prone to reactivation, act to locally modify the regional stress field 616
(Figure 15). These structures form a ‘template’ for fault development and thus the subsequent 617
basin structure associated with later extensional and contractional tectonic events. In addition, 618
the spacing between the reactivated intrabasement structures can also control the degree of 619
faulting that occurs. Closely spaced shear zones are able to host a wider zone of exploitative 620
faulting, with each fault rooted in an individual intra-shear zone mylonite zone. Strain is 621
therefore distributed over a wider area, leading to an overall more gently dipping rift margin 622
(Figure 11). Such a scenario is observed across the Stavanger Ramp (Figure 9), where strain 623
is distributed across a series of relatively low displacement exploitative faults atop the closely 624
spaced KSZ and FSZ (Figure 11). Due to their close-spacing within the overall shear zones, 625
not all of the intra-shear zone mylonites host an exploitative fault. This observation is in 626

27
agreement with Sassi et al. (1993), who observe that only selected structures are reactivated 627
when closely spaced. 628
Where large intrabasement structures are absent, rift-related faults form in response to the 629
regional stress field and cross-cut smaller intrabasement structures (Figure 14). A lack of 630
large, discrete intrabasement structures may help to explain the lack of fault-intrabasement 631
structures relationships observed in areas where the intrabasement structure is cross-cut 632
(Kirkpatrick et al., 2013; Reeve et al., 2013). Alternatively, such structures may be present in 633
other rifts, but are not imaged in seismic reflection data or resolved in potential field data. 634
8. Conclusions 635
Using closely spaced 2D and 3D seismic data we have resolved the 3D geometry of a series 636
of spectacularly imaged structures within crystalline basement over a 10,000 km2
area 637
offshore southern Norway. These structures are correlated onshore, and are analysed in 638
context to the evolution and geometry of the overlying rift. Throughout this study, we have 639
shown that: 640
1. The characteristic reflection geometries of the intrabasement structures cannot be 641
generated by a single interface within crystalline basement. 1D waveform modelling suggests 642
that this forms through constructive interference between layers roughly 100 m thick 643
separated by 50-100 m. These layers may represent anastomosing mylonite zones separated 644
by relatively undeformed material, as observed in shear zones onshore. 645
2. Through along-strike correlations to established onshore structures, the observed 646
intrabasement structures represent the offshore continuations of the Caledonian thrust belt 647
and a series of Devonian extensional shear zones. The locations and 3D geometry of these 648
structures are constrained for over 100 km offshore beneath the North Sea rift. A further 649

28
shear zone, the Flekkefjord Shear Zone is newly defined and mapped offshore. The Devonian 650
shear zones offset the Caledonian thrust belt and in some cases are linked in 3D. 651
3. Selective reactivation of intrabasement structures occurs during later tectonic events, 652
exerting a strong influence over the evolution and geometry of the overlying rift. Thicker, 653
steeper structures, such as the Devonian shear zones, are preferentially reactivated at the 654
expense of thinner, more gently-dipping structures. Previously reactivated, and therefore 655
weaker, structures are then preferentially reactivated during later tectonic events. 656
4. We observe a number of interactions between the reactivated Devonian shear zones and 657
the later rift-related faults: i) Faults that form within the hanging wall of intrabasement shear 658
zones due to local stress perturbations and merge with the structures at depth; ii) faults that 659
exploit internal weaknesses, i.e. mechanical anisotropies exhibited by mylonites, within the 660
shear zones; and iii) faults that form independently away from intrabasement structure in 661
response to the regional stress field, and cross-cut underlying structure. Close proximity 662
between intrabasement structures allows strain to be distributed over a wider area, resulting in 663
multiple, low-displacement faults, and an overall gentler rift margin. 664
5. The presence of large-scale intrabasement structures acts to locally modify the regional 665
stress field, and exhibits a first-order control on the location of later rift-related faults, with 666
basin-bounding faults inheriting this pre-existing framework. Rift-related faults form in 667
response to the regional stress field in areas where this pre-existing framework is not present. 668
Characteristics such as anomalous fault geometries and local areas of distributed faulting may 669
be used to infer the presence of an underlying complexity, such as a discrete intrabasement 670
structure, especially in areas where crystalline basement is poorly imaged. 671
The geometry and distribution of underlying basement heterogeneities dictates the location of 672
many basin margins, determining the initial rift physiography and size (Figure 14). In 673
29
addition, the repeated reactivation of these structures shows how they play a long-lived role 674
in the evolution of the rift system throughout multiple tectonic events. 675
Acknowledgments 676
The authors would like to thank PGS and TGS for allowing us to show the seismic data used 677
in this study, along with Schlumberger for providing academic licences for use of Petrel 678
software. This contribution forms part of the MultiRift Project funded by the Research 679
Council of Norway’s PETROMAKS programme (Project number 215591) and Statoil to the 680
University of Bergen and partners Imperial College, University of Manchester and University 681
of Oslo. 682
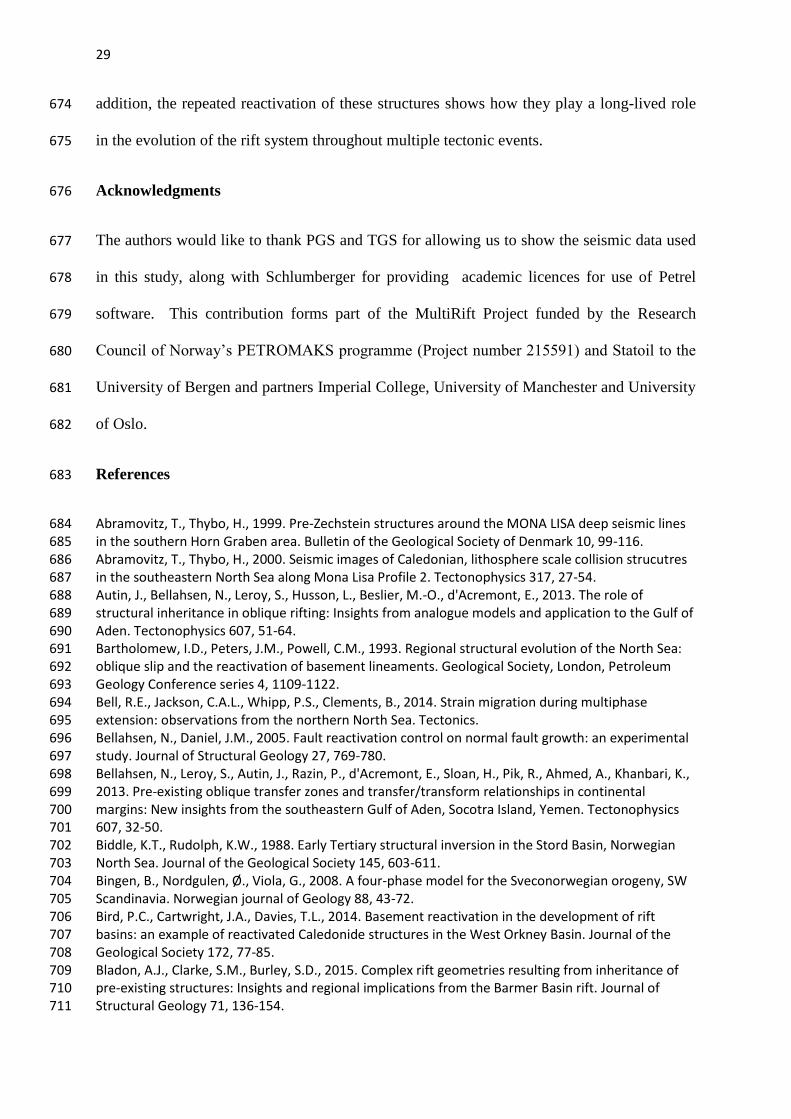
References 683
Abramovitz, T., Thybo, H., 1999. Pre-Zechstein structures around the MONA LISA deep seismic lines 684 in the southern Horn Graben area. Bulletin of the Geological Society of Denmark 10, 99-116. 685 Abramovitz, T., Thybo, H., 2000. Seismic images of Caledonian, lithosphere scale collision strucutres 686 in the southeastern North Sea along Mona Lisa Profile 2. Tectonophysics 317, 27-54. 687 Autin, J., Bellahsen, N., Leroy, S., Husson, L., Beslier, M.-O., d'Acremont, E., 2013. The role of 688 structural inheritance in oblique rifting: Insights from analogue models and application to the Gulf of 689 Aden. Tectonophysics 607, 51-64. 690 Bartholomew, I.D., Peters, J.M., Powell, C.M., 1993. Regional structural evolution of the North Sea: 691 oblique slip and the reactivation of basement lineaments. Geological Society, London, Petroleum 692 Geology Conference series 4, 1109-1122. 693 Bell, R.E., Jackson, C.A.L., Whipp, P.S., Clements, B., 2014. Strain migration during multiphase 694 extension: observations from the northern North Sea. Tectonics. 695 Bellahsen, N., Daniel, J.M., 2005. Fault reactivation control on normal fault growth: an experimental 696 study. Journal of Structural Geology 27, 769-780. 697 Bellahsen, N., Leroy, S., Autin, J., Razin, P., d'Acremont, E., Sloan, H., Pik, R., Ahmed, A., Khanbari, K., 698 2013. Pre-existing oblique transfer zones and transfer/transform relationships in continental 699 margins: New insights from the southeastern Gulf of Aden, Socotra Island, Yemen. Tectonophysics 700 607, 32-50. 701 Biddle, K.T., Rudolph, K.W., 1988. Early Tertiary structural inversion in the Stord Basin, Norwegian 702 North Sea. Journal of the Geological Society 145, 603-611. 703 Bingen, B., Nordgulen, Ø., Viola, G., 2008. A four-phase model for the Sveconorwegian orogeny, SW 704 Scandinavia. Norwegian journal of Geology 88, 43-72. 705 Bird, P.C., Cartwright, J.A., Davies, T.L., 2014. Basement reactivation in the development of rift 706 basins: an example of reactivated Caledonide structures in the West Orkney Basin. Journal of the 707 Geological Society 172, 77-85. 708 Bladon, A.J., Clarke, S.M., Burley, S.D., 2015. Complex rift geometries resulting from inheritance of 709 pre-existing structures: Insights and regional implications from the Barmer Basin rift. Journal of 710 Structural Geology 71, 136-154. 711
30
Bøe, R., Fossen, H., Smelror, M., 2011. Mesozoic sediments and structures onshore Norway and in 712 the coastal zone. Norges geologiske undersøkelse Bulletin 450. 713 Boundy, T.M., Fountain, D.M., Austrheim, H., 1992. Structural development and petrofabrics of 714 eclogite facies shear zones, Bergen Arcs, western Norway: implications for deep crustal 715 deformational processes. Journal of Metamorphic Geology 10, 127-146. 716 Brun, J.-P., Tron, V., 1993. Development of the North Viking Graben: inferences from laboratory 717 modelling. Sedimentary Geology 86, 31-51. 718 Carreras, J., 2001. Zooming on Northern Cap de Creus shear zones. Journal of Structural Geology 23, 719 1457-1486. 720 Carreras, J., Czeck, D.M., Druguet, E., Hudleston, P.J., 2010. Structure and development of an 721 anastomosing network of ductile shear zones. Journal of Structural Geology 32, 656-666. 722 Cartwright, J.A., 1989. The kinematics of inversion in the Danish Central Graben. Geological Society, 723 London, Special Publications 44, 153-175. 724 Chadwick, R.A., Kenolty, N., Whittaker, A., 1983. Crustal structure beneath southern England from 725 deep seismic reflection profiles. Journal of the Geological Society 140, 893-911. 726 Chattopadhyay, A., Chakra, M., 2013. Influence of pre-existing pervasive fabrics on fault patterns 727 during orthogonal and oblique rifting: An experimental approach. Marine and Petroleum Geology 728 39, 74-91. 729 Choukroune, P., 1989. The ECORS Pyrenean deep seismic profile reflection data and the overall 730 structure of an orogenic belt. Tectonics 8, 23-39. 731 Choukroune, P., Gapais, D., 1983. Strain Patterns in Rocks Strain pattern in the Aar Granite (Central 732 Alps): Orthogneiss developed by bulk inhomogeneous flattening. Journal of Structural Geology 5, 733 411-418. 734 Clemson, J., Cartwright, J., Booth, J., 1997. Structural segmentation and the influence of basement 735 structure on the Namibian passive margin. Journal of the Geological Society 154, 477-482. 736 Corfu, F., Andersen, T.B., Gasser, D., 2014. The Scandinavian Caledonides: main features, conceptual 737 advances and critical questions. Geological Society, London, Special Publications. 738 Coward, M.P., Dewey, J.F., Hempton, M., Holroyd, J., 2003. Tectonic evolution, in: Evans, D., 739 Graham, C., Armour, A., Bathurst, P. (Eds.), The Millenium Atlas: petroleum geology of the central 740 and northern North Sea, Geological Society of London. 741 Cowie, P.A., Gupta, S., Dawers, N.H., 2000. Implications of fault array evolution for synrift depocetre 742 development: insights from a numerical fault growth model. Basin Research 12, 241-261. 743 Daly, M.C., Chorowicz, J., Fairhead, J.D., 1989. Rift basin evolution in Africa: the influence of 744 reactivated steep basement shear zones. Geol Soc London, Special Publication 44, 309-334. 745 Dewey, J.F., 1988. Extensional collapse of orogens. Tectonics 7, 1123-1139. 746 Doré, A.G., Lundin, E.R., Fichler, C., Olesen, O., 1997. Patterns of basement structure and 747 reactivation along the NE Atlantic margin. Journal of the Geological Society 154, 85-92. 748 Druguet, E., Passchier, C.W., Carreras, J., Victor, P., den Brok, S., 1997. Analysis of a complex high-749 strain zone at Cap de Creus, Spain. Tectonophysics 280, 31-45. 750 Duffy, O.B., Bell, R.E., Jackson, C.A.L., Gawthorpe, R.L., Whipp, P.S., 2015. Fault growth and 751 interactions in a multiphase rift fault network: Horda Platform, Norwegian North Sea. Journal of 752 Structural Geology 80, 99-119. 753 Faccenna, C., Nalpas, T., Brun, J.-P., Davy, P., Bosi, V., 1995. The influence of pre-existing thrust faults 754 on normal fault geometry in nature and in experiments. Journal of Structural Geology 17, 1139-1149. 755 Færseth, R.B., 1996. Interaction of Permo-Triassic and Jurassic extensional fault-blocks during the 756 development of the northern North Sea. Journal of the Geological Society 153, 931-944. 757 Færseth, R.B., Knudsen, B.E., Liljedahl, T., Midbøe, P.S., Søderstrøm, B., 1997. Oblique rifting and 758 sequential faulting in the Jurassic development of the northern North Sea. Journal of Structural 759 Geology 19, 1285-1302. 760 Fossen, H., 1992. The role of extensional tectonics in the Caledonides of south Norway. Journal of 761 Structural Geology 14, 1033-1046. 762
31
Fossen, H., 2010. Extensional tectonics in the North Atlantic Caledonides: a regional view. Geological 763 Society, London, Special Publications 335, 767-793. 764 Fossen, H., Dunlap, J.W., 1998. Timing and kinematics of Caledonian thrusting and extensional 765 collapse, southern Norway: evidence from 40Ar/39Ar thermochronology. Journal of Structural 766 Geology 20, 765-781. 767 Fossen, H., Gabrielsen, R.H., Faleide, J.I., Hurich, C.A., 2014. Crustal stretching in the Scandinavian 768 Caledonides as revealed by deep seismic data. Geology 42, 791-794. 769 Fossen, H., Hurich, C.A., 2005. The Hardangerfjord Shear Zone in SW Norway and the North Sea: a 770 large-scale low-angle shear zone in the Caledonian crust. Journal of the Geological Society 162, 675-771 687. 772 Fossen, H., Khani, H.F., Faleide, J.I., Ksienzyk, A.K., Dunlap, W.J., 2016. Post-Caledonian extension in 773 the West Norway–northern North Sea region: the role of structural inheritance. Geological Society, 774 London, Special Publications 439. 775 Fossen, H., Rykkelid, E., 1992. Postcollisional extension of the Caledonide orogen in Scandinavia: 776 Structural expressions and tectonic significance. Geology 20, 737. 777 Fountain, D.M., Hurich, C.A., Smithson, S.B., 1984. Seismic reflectivity of mylonite zones in the crust. 778 Geology 12, 195. 779 Fraser, A.J., Gawthorpe, R.L., 1990. Tectono-stratigraphic development and hydrocarbon habitat of 780 the Carboniferous in northern England. Geological Society, London, Special Publications 55, 49-86. 781 Gabrielsen, R.H., Braathen, A., Dehls, J., Roberts, D., 2002. Tectonic Lineaments of Norway. 782 Norwegian journal of Geology 82, 153-174. 783 Gawthorpe, R.L., Leeder, M.R., 2000. Tectono-sedimentary evolution of active extensional basins. 784 Basin Research 12, 195-218. 785 Gontijo-Pascutti, A., Bezerra, F.H.R., Terra, E.L., Almeida, J.C.H., 2010. Brittle reactivation of mylonitic 786 fabric and the origin of the Cenozoic Rio Santana Graben, southeastern Brazil. Journal of South 787 American Earth Sciences 29, 522-536. 788 Goscombe, B., Hand, M., Gray, D., 2003. Structure of the Kaoko Belt, Namibia: progressive evolution 789 of a classic transpressional orogen. Journal of Structural Geology 25, 1049-1081. 790 Goscombe, B.D., Gray, D.R., 2008. Structure and strain variation at mid-crustal levels in a 791 transpressional orogen: A review of Kaoko Belt structure and the character of West Gondwana 792 amalgamation and dispersal. Gondwana Research 13, 45-85. 793 Gupta, S., Cowie, P.A., Dawers, N.H., Underhill, J.R., 1998. A mechanism to explain rift-basin 794 subsidence and stratigraphic patterns through fault-array evolution. Geology 26, 595-598. 795 Hedin, P., Juhlin, C., Gee, D.G., 2012. Seismic imaging of the Scandinavian Caledonides to define ICDP 796 drilling sites. Tectonophysics 554–557, 30-41. 797 Henza, A.A., Withjack, M.O., Schlische, R.W., 2011. How do the properties of a pre-existing normal-798 fault population influence fault development during a subsequent phase of extension? Journal of 799 Structural Geology 33, 1312-1324. 800 Hurich, C.A., Smithson, S.B., Fountain, D.M., Humphreys, M.C., 1985. Seismic evidence of mylonite 801 reflectivity and deep structure in the Kettle dome metamorphic core complex, Washington. Geology 802 13, 577-580. 803 Huuse, M., 2002. Cenozoic uplift and denudation of southern Norway: insights from the North Sea 804 Basin. Geological Society, London, Special Publications 196, 209-233. 805 Huyghe, P., Mugnier, J.-L., 1992. The influence of depth on reactivation in normal faulting. Journal of 806 Structural Geology 14, 991-998. 807 Jackson, C.A.L., Chua, S.T., Bell, R.E., Magee, C., 2013. Structural style and early stage growth of 808 inversion structures: 3D seismic insights from the Egersund Basin, offshore Norway. Journal of 809 Structural Geology 46, 167-185. 810 Jackson, C.A.L., Lewis, M.M., 2013. Physiography of the NE margin of the Permian Salt Basin: new 811 insights from 3D seismic reflection data. Journal of the Geological Society 170, 857-860. 812

32
Jackson, C.A.L., Lewis, M.M., 2015. Structural style and evolution of a salt-influenced rift basin 813 margin; the impact of variations in salt composition and the role of polyphase extension. Basin 814 Research, n/a-n/a. 815 Japsen, P., Bidstrup, T., Lidmar-Bergström, K., 2002. Neogene uplift and erosion of southern 816 Scandinavia induced by the rise of the South Swedish Dome. Geological Society, London, Special 817 Publications 196, 183-207. 818 Kirkpatrick, J.D., Bezerra, F.H.R., Shipton, Z.K., Do Nascimento, A.F., Pytharouli, S.I., Lunn, R.J., Soden, 819 A.M., 2013. Scale-dependent influence of pre-existing basement shear zones on rift faulting: a case 820 study from NE Brazil. Journal of the Geological Society 170, 237-247. 821 Koyi, H., Petersen, K., 1992. Influence of basment faults on the development of salt structures in the 822 Danish Basin. Marine and Petroleum Geology 10, 82-94. 823 Lorenz, H., Rosberg, J.E., Juhlin, C., Bjelm, L., Almqvist, B.S.G., Berthet, T., Conze, R., Gee, D.G., 824 Klonowska, I., Pascal, C., Pedersen, K., Roberts, N.M.W., Tsang, C.F., 2015. COSC-1 – drilling of a 825 subduction-related allochthon in the Palaeozoic Caledonide orogen of Scandinavia. Sci. Dril. 19, 1-11. 826 Lundmark, A.M., Saether, T., Sorlie, R., 2013. Ordovician to Silurian magmatism on the Utsira High, 827 North Sea: implications for correlations between the onshore and offshore Caledonides. Geological 828 Society, London, Special Publications. 829 Maurin, J.-C., Guiraud, R., 1993. Basement control in the development of the Early Cretaceous West 830 and Central African Rift System. Tectonophysics 228, 81-95. 831 McClay, Norton, M.G., Coney, P., Davis, G.H., 1986. Collapse of the Caledonian orogen and the Old 832 Red Sandstone. Nature 323, 147-149. 833 McKerrow, W.S., MacNiocaill, C., Dewey, J.F., 2000. The Caledonian Orogeny redefined. Journal of 834 the Geological Society, London 157, 1149-1154. 835 Milnes, A.G., Wennberg, O.P., Skår, Ø., Koestler, A.G., 1997. Contraction, extension and timing in the 836 South Norwegian Caledonides: the Sognefjord transect. Geol Soc London, Special Publication 121, 837 123-148. 838 Mogensen, T.E., Korstgård, J.A., 2003. Triassic and Jurassic transtension along part of the Sorgenfrei-839 Tornquist Zone in the Danish Kattegat. Geological Survey of Denmark and Greenland Bulletin 1, 439-840 458. 841 Morley, C.K., 1986. The Caledonian thrust front and palinspastic restorations in the southern 842 Norwegian Caledonides. Journal of Structural Geology 8, 753-765. 843 Morley, C.K., Haranya, C., Phoosongsee, W., Pongwapee, S., Kornsawan, A., Wonganan, N., 2004. 844 Activation of rift oblique and rift parallel pre-existing fabrics during extension and their effect on 845 deformation style: examples from the rifts of Thailand. Journal of Structural Geology 26, 1803-1829. 846 Odinsen, T., Reemst, P., Beek, P.V.D., Faleide, J.I., Gabrielsen, R.H., 2000. Permo-Triassic and Jurassic 847 extension in the northern North Sea: results from tectonostratigraphic forward modelling. 848 Geological Society, London, Special Publications 167, 83-103. 849 Olesen, O., Smethurst, M.A., Torsvik, T.H., Bidstrup, T., 2004. Sveconorwegian igneous complexes 850 beneath the Norwegian–Danish Basin. Tectonophysics 387, 105-130. 851 Paton, D.A., Underhill, J.R., 2004. Role of crustal anisotropy in modifying the structural and 852 sedimentological evolution of extensional basins: the Gamtoos Basin, South Africa. Basin Research 853 16, 339-359. 854 Pedersen, R.B., Hertogen, J., 1990. Magmatic evolution of the Karmøy Ophiolite Complex, SW 855 Norway: relationships between MORB-IAT-boninitic-calc-alkaline and alkaline magmatism. 856 Contributions to Mineralogy and Petrology 104, 277-293. 857 Ponce, C., Druguet, E., Carreras, J., 2013. Development of shear zone-related lozenges in foliated 858 rocks. Journal of Structural Geology 50, 176-186. 859 Reeve, M.T., Bell, R.E., Jackson, C.A.L., 2013. Origin and significance of intra-basement seismic 860 reflections offshore western Norway. Journal of the Geological Society. 861 Rennie, S.F., Fagereng, Å., Diener, J.F.A., 2013. Strain distribution within a km-scale, mid-crustal 862 shear zone: The Kuckaus Mylonite Zone, Namibia. Journal of Structural Geology 56, 57-69. 863

33
Ring, U., 1994. The influence of preexisting structure on the evolution of the Cenozoic Malawi rift 864 (East African rift system). Tectonics 13, 313-326. 865 Roffeis, C., Corfu, F., 2013. Caledonian nappes of southern Norway and their correlation with 866 Sveconorwegian basement domains. Geological Society, London, Special Publications. 867 Salomon, E., Koehn, D., Passchier, C., 2015. Brittle reactivation of ductile shear zones in NW Namibia 868 in relation to South Atlantic rifting. Tectonics 34, 70-85. 869 Sassi, W., Colletta, B., Balé, P., Paquereau, T., 1993. The origin of sedimentary basins: Inferences 870 from quantitative modelling and basin analysis Modelling of structural complexity in sedimentary 871 basins: The role of pre-existing faults in thrust tectonics. Tectonophysics 226, 97-112. 872 Scheiber, T., Viola, G., Bingen, B., Peters, M., Solli, A., 2015. Multiple reactivation and strain 873 localization along a Proterozoic orogen-scale deformation zone: The Kongsberg-Telemark boundary 874 in southern Norway revisited. Precambrian Research 265, 78-103. 875 Sibson, R.H., 1985. A note on fault reactivation. Journal of Structural Geology 7, 751-754. 876 Sørensen, S., Morizot, H., Skottheim, S., 1992. A tectonostratigraphic analysis of the southeast 877 Northern North Sea Basin, in: Larsen, R.M., Brekke, H., Larsen, B.T., Talleraas, E. (Eds.), Structural and 878 Tectonic modelling and its application to Petroleum Geology. Elsevier, Amsterdam, pp. 19-42. 879 Thybo, H., 2000. Crustal structure and tectonic evolution of the Tornquist Fan region as revealed by 880 geophysical methods. Bulletin of the Geological Society of Denmark 46, 145-160. 881 Tong, H., Koyi, H., Huang, S., Zhao, H., 2014. The effect of multiple pre-existing weaknesses on 882 formation and evolution of faults in extended sandbox models. Tectonophysics 626, 197-212. 883 Torvela, T., Moreau, J., Butler, R.W.H., Korja, A., Heikkinen, P., 2013. The mode of deformation in the 884 orogenic mid-crust revealed by seismic attribute analysis. Geochemistry, Geophysics, Geosystems. 885 Underhill, J.R., Partington, M.A., 1993. Jurassic thermal doming and deflation in the North Sea: 886 implications of the sequence stratigraphic evidence. 337-345. 887 Vetti, V.V., Fossen, H., 2012. Origin of contrasting Devonian supradetachment basin types in the 888 Scandinavian Caledonides. Geology 40, 571-574. 889 Wang, C.-Y., Okaya, D.A., Ruppert, C., Davis, G.A., Guo, T.-S., Zhong, Z., Wenk, H.-R., 1989. Seismic 890 reflectivity of the Whipple Mountain shear zone in southern California. Journal of Geophysical 891 Research 94, 2989. 892 Whipp, P.S., Jackson, C.A.L., Gawthorpe, R.L., Dreyer, T., Quinn, D., 2014. Normal fault array 893 evolution above a reactivated rift fabric; a subsurface example from the northern Horda Platform, 894 Norwegian North Sea. Basin Research. 895 White, S.H., Bretan, P.G., Rutter, E.H., 1986. Fault-Zone Reactivation: Kinematics and Mechanisms. 896 Philosophical Transactions of the Royal Society of London A: Mathematical, Physical and Engineering 897 Sciences 317, 81-97. 898 White, S.H., Burrows, S.E., Carreras, J., Shaw, N.D., Humphreys, F.J., 1980. Shear zones in rocks On 899 mylonites in ductile shear zones. Journal of Structural Geology 2, 175-187. 900 Younes, A.I., McClay, K., 2002. Development of accommodation zones in the Gulf of Suez-Red Sea 901 rift, Egypt. AAPG Bulletin 86, 1003-1026. 902 Ziegler, P.A., 1992. North Sea Rift System. Tectonophysics 208, 55-75. 903
904
Figure Captions 905
Figure 1 - Figure showing the location of the study area (white box) in relation to offshore 906
structural domains within the south eastern North Sea, as established through seismic 907
interpretation. Structural domains are based upon the base Zechstein surface. Also shown is 908

34
the mapped onshore geology, taken from Fossen et al. (2014). The locations of major 909
Devonian shear zones onshore are shown in green. 910
Figure 2 - Map showing the available datasets for use throughout this study; including 2D 911
and 3D seismic data, along with borehole data. 912
Figure 3 - Stratigraphic framework within the study area showing the key seismic horizons 913
interpreted throughout this study, along with the major tectonic events to have affected the 914
region. Horizon colours are consistent and referred to throughout the text. 915
Figure 4 – A) Panels showing the observed types of intrabasement reflectivity. 1) Shows the 916
observed thin intrabasement reflections packets, and 2) shows the thicker (Km-scale) 917
intrabasement packages. B) 1D waveform models of the observed reflection patterns. 918
Multiple models of layered sequences of varying thicknesses are created and then 919
subsequently compared to the observed reflection wavetrain. Individual layer thicknesses of 920
100 m, separated by 50-100 m produce the best match to the observed data. 921
Figure 5 - Interpreted seismic section showing the large-scale structure and inter-922
relationships between intrabasement structures. A series of steeply dipping structures can be 923
observed to cross-cut a relatively flat-lying structure. Inset – close-up of the cross-cutting 924
relationship observed in the centre of the image. See figure 1 for location. 925
Figure 6 - Uninterpreted and interpreted seismic sections showing intrabasement structure 926
throughout the area. Larger intrabasement packages are shown in light grey with individual 927
thin intrabasement reflection packets highlighted by black dashed lines. Intrabasement 928
packages are mapped across the area, and linked along-strike to those shown in Figures 5, 7 929
and 8. A close-up of the right side of the image is shown in figure 10. Colours within the 930
sedimentary cover correspond to ages shown within the stratigraphic column (Figure 3) See 931
figure 1 for location. 932

35
Figure 7 - Uninterpreted and interpreted regional seismic sections showing the geometry and 933
reactivation of intrabasement structure within the region. Intrabasement structures are 934
mapped across the area, and linked along-strike to those shown in Figures 5, 6 and 8. See 935
figure 1 for location. 936
Figure 8 - Uninterpreted and interpreted seismic sections showing the regional intrabasement 937
structure in the south of the study area. A series of splays can be observed originating from 938
the base of IP4. See section 5 for details on the reactivation of these structures. See figure 1 939
for location. 940
Figure 9 - Map showing the location of intrabasement structures across the study area. 941
Surface shown is the top acoustic basement time-structure map, highlighting the major 942
structural elements within the region, see figure 1 for more details. Also shown are the 943
locations of the structures as constrained by Fossen et al. (2014) (onshore and immediate 944
offshore locations), and Abramovitz and Thybo (2000) (Central North Sea). Note the 945
similarities in location between the intrabasement structures and the later rift-related faults. 946
Figure 10 - Uninterpreted and interpreted seismic sections showing the location of the basal 947
décollement and associated Caledonian thrusts. A series of depocentres are observed in the 948
hangingwall of these structures, indicating extensional reactivation; some of which are 949
uplifted, indicative of later reverse reactivation. See figure 1 for location. 950
Figure 11 - Uninterpreted and interpreted seismic sections highlighting multiple stages of 951
reactivation along the KSZ and FSZ beneath the Stavanger ramp area and. Seismic 952
stratigraphic relationships are used to constrain the timing of reactivation. See figure 1 for 953
location. 954
Figure 12 - Uninterpreted and interpreted seismic sections showing the relationship between 955
the Åsta fault and the underlying KSZ, displaying a ‘merging’ type fault relationship. The 956

36
Åsta fault can be observed to sole onto the margin of the KSZ at depth. See figure 1 for 957
location. 958
Figure 13 - Uninterpreted and interpreted seismic sections highlighting the interaction 959
between the Sele High Fault System and the KSZ, displaying a ‘cross-cutting’ relationship. 960
The SHFS can be observed to cross-cut the underlying KSZ. See figure 1 for location. 961
Figure 14 - Schematic models showing the 3 major types of interactions between 962
intrabasement structures and rift-related faults. From left to right; Merging faults, 963
Exploitative faults and cross-cutting faults. 964
Figure 15 - Synoptic figure showing how the presence of discrete intrabasement structures 965
may modify the geometry and evolution of overlying rift systems. Upper panel shows pre-rift 966
framework of structures within crystalline basement. Upon later extension these act to create 967
localised perturbations in the regional stress field, producing a range of interactions with the 968
rift-related faults. 969
970
971
972
973
974
975
976
977
978

37
Figure 1 979
980
981
982
983
984
985
986
987
988
989
990

38
Figure 2 991
992
993
994
995
996
997
998
999

39
Figure 3 1000
1001
1002
1003
1004
1005
1006
1007
1008
1009
1010
1011
1012
1013
1014
1015
1016
1017
1018
1019
1020
1021
1022
1023
1024
1025

40
Figure 4 1026
1027
1028

41
Figure 5 1029
1030
Figure 6 1031
1032
1033
1034
1035
1036
1037

42
Figure 7 1038
1039
Figure 8 1040
1041
1042
1043
1044
1045
1046

43
Figure 9 1047
1048
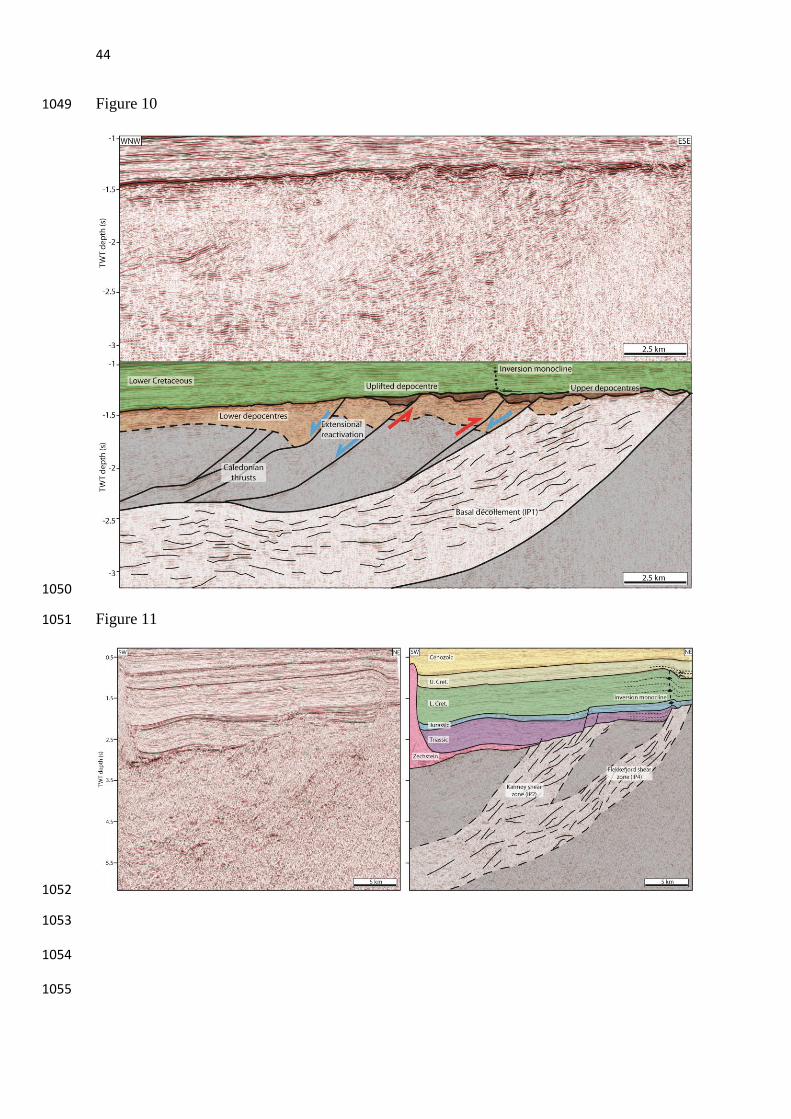
44
Figure 10 1049
1050
Figure 11 1051
1052
1053
1054
1055

45
Figure 12 1056
1057
1058
1059

46
Figure 13 1060
1061
1062
1063
1064
1065
1066
1067
1068

47
Figure 14 1069
1070

48
Figure 15 1071

49
1072
1073
1074