reactivity of aluminum-based mixtures with early ... · reactivity of aluminum-based mixtures ......
TRANSCRIPT

Reactivity of Aluminum-Based Mixtures with Early Transition Metals
by Laszlo J Kecskes and Kenneth F Plunkett
ARL-TR-7027 August 2014 Approved for public release; distribution is unlimited.

NOTICES
Disclaimers The findings in this report are not to be construed as an official Department of the Army position unless so designated by other authorized documents. Citation of manufacturer’s or trade names does not constitute an official endorsement or approval of the use thereof. Destroy this report when it is no longer needed. Do not return it to the originator.

Army Research Laboratory Aberdeen Proving Ground, MD 21005-5069
ARL-TR-7027 August 2014
Reactivity of Aluminum-Based Mixtures with Early Transition Metals
Laszlo J Kecskes and Kenneth F Plunkett
Weapons and Materials Research Directorate, ARL
Approved for public release; distribution is unlimited.
ii
REPORT DOCUMENTATION PAGE Form Approved OMB No. 0704-0188
Public reporting burden for this collection of information is estimated to average 1 hour per response, including the time for reviewing instructions, searching existing data sources, gathering and maintaining the data needed, and completing and reviewing the collection information. Send comments regarding this burden estimate or any other aspect of this collection of information, including suggestions for reducing the burden, to Department of Defense, Washington Headquarters Services, Directorate for Information Operations and Reports (0704-0188), 1215 Jefferson Davis Highway, Suite 1204, Arlington, VA 22202-4302. Respondents should be aware that notwithstanding any other provision of law, no person shall be subject to any penalty for failing to comply with a collection of information if it does not display a currently valid OMB control number. PLEASE DO NOT RETURN YOUR FORM TO THE ABOVE ADDRESS. 1. REPORT DATE (DD-MM-YYYY) August 2014
2. REPORT TYPE Final
3. DATES COVERED (From - To) May 2012–August 2012
4. TITLE AND SUBTITLE
Reactivity of Aluminum-Based Mixtures with Early Transition Metals 5a. CONTRACT NUMBER
5b. GRANT NUMBER 5c. PROGRAM ELEMENT NUMBER
6. AUTHOR(S)
Laszlo J Kecskes and Kenneth F Plunkett 5d. PROJECT NUMBER
5e. TASK NUMBER
5f. WORK UNIT NUMBER
7. PERFORMING ORGANIZATION NAME(S) AND ADDRESS(ES)
U.S. Army Research Laboratory ATTN: RDRL-WMM-F Aberdeen Proving Ground, MD 21005-5069
8. PERFORMING ORGANIZATION REPORT NUMBER ARL-TR-7027
9. SPONSORING/MONITORING AGENCY NAME(S) AND ADDRESS(ES)
10. SPONSOR/MONITOR’S ACRONYM(S)
11. SPONSOR/MONITOR'S REPORT NUMBER(S)
12. DISTRIBUTION/AVAILABILITY STATEMENT Approved for public release; distribution is unlimited.
13. SUPPLEMENTARY NOTES
14. ABSTRACT Equiatomic powder mixtures of Al and the early transition metals in Groups IV and V (i.e., titanium [Ti], zirconium [Zr], and hafnium [Hf]; and vanadium [V], niobium [Nb], and tantalum [Ta]) were prepared by high-energy mechanical alloying. Blends were subjected to microscopy and differential thermal analysis to systematically investigate the efficiency of conversion from reactants to products. Each of the aluminum (Al)-X blends was created by mechanically milling pure elemental powders with 1.5 weight-percent stearic acid to prevent cold welding to the milling vial’s internal walls during the blending process. The as-milled powders were analyzed via Scanning Electron Microscopy (SEM), Energy Dispersive X-ray Spectroscopy (EDS), X-ray Diffraction Analysis (XRD), and Differential Scanning Calorimetry (DSC) to determine the effect of milling time on the total heat released. These analyses were performed prior and after DSC to compare the morphologies of the reactants and products, as well as to identify the bulk phases present in the product as they relate to the equilibrium phase diagram for that particular mixture. The DSC analysis was performed to measure and determine the total energy released from the mixtures while being heated to 1,000 °C at 10 K/min. 15. SUBJECT TERMS aluminum, titanium, zirconium, hafnium, vanadium, niobium, tantalum, intermetallic, reactive, energetic
16. SECURITY CLASSIFICATION OF: 17. LIMITATION OF ABSTRACT
UU
18. NUMBER OF PAGES
90
19a. NAME OF RESPONSIBLE PERSON Laszlo J Kecskes
a. REPORT Unclassified
b. ABSTRACT Unclassified
c. THIS PAGE Unclassified
19b. TELEPHONE NUMBER (Include area code) 410-306-0811
Standard Form 298 (Rev. 8/98) Prescribed by ANSI Std. Z39.18

iii
Contents
List of Figures v
Acknowledgments ix
1. Introduction 1
2. Experimental Procedures 2
3. Results 4
3.1 Equilibrium Phase Relationships for the Binary Al-Group IV and Al-Group V Systems .....................................................................................................................................4
3.2 Differential Thermal Analysis of the Al-X Powder Mixtures .......................................10 3.2.1 Al-Ti System .....................................................................................................11 3.2.2 Al-Zr System .....................................................................................................13 3.2.3 Al-Hf System .....................................................................................................15 3.2.4 Al-V System ......................................................................................................16 3.2.5 Al-Nb System ....................................................................................................18 3.2.6 Al-Ta System .....................................................................................................20
3.3 X-ray Diffraction Analysis of the Al-X Powder Mixtures ............................................21 3.3.1 Al-Ti System .....................................................................................................22 3.3.2 Al-Zr System .....................................................................................................25 3.3.3 Al-Hf System .....................................................................................................28 3.3.4 Al-V System ......................................................................................................30 3.3.5 Al-Nb System ....................................................................................................32 3.3.6 Al-Ta System .....................................................................................................35
3.4 SEM Analysis of the Al-X Powder Mixtures ................................................................38 3.4.1 Al-Ti System .....................................................................................................38 3.4.2 Al-Zr System .....................................................................................................40 3.4.3 Al-Hf System .....................................................................................................42 3.4.4 Al-V System ......................................................................................................44 3.4.5 Al-Nb System ....................................................................................................46 3.4.6 Al-Ta System .....................................................................................................49
4. Discussion 50

iv
5. Summary and Conclusions 53
6. References 55
Appendix. Scanning Electron Micrographs of the As-Milled Powders at 1-, 5-, and 10-min Milling Times 57
List of Symbols, Abbreviations, and Acronyms 76
Distribution List 77
v
List of Figures
Fig. 1 Binary equilibrium phase diagram of Al and Ti ..................................................................5
Fig. 2 Binary equilibrium phase diagram of Al and Zr ..................................................................6
Fig. 3 Binary equilibrium phase diagram of Al and Hf ..................................................................7
Fig. 4 Binary equilibrium phase diagram of Al and V ..................................................................8
Fig. 5 Binary equilibrium phase diagram of Al and Nb ................................................................9
Fig. 6 Binary equilibrium phase diagram of Al and Ta ...............................................................10
Fig. 7 DSC thermograms of the equiatomic Al-Ti alloy powder at 3 and 15 min of milling time ..........................................................................................................................................12
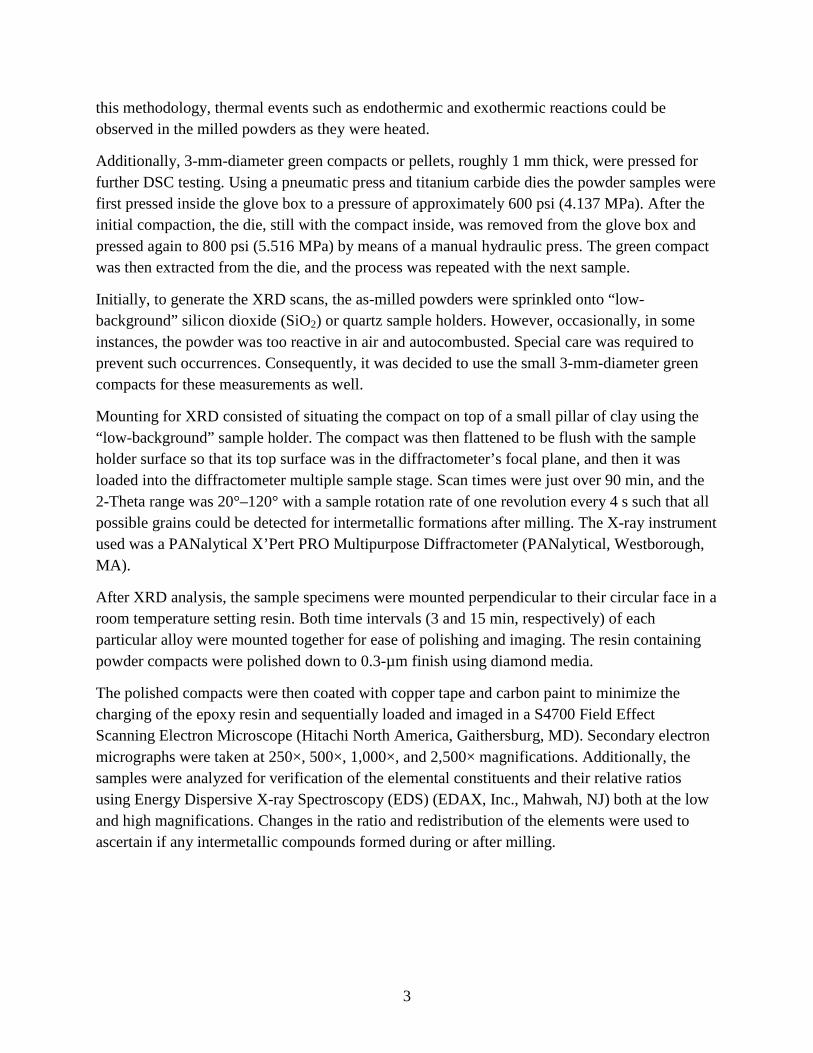
Fig. 8 DSC thermograms showing the effect of increasing milling time for the equiatomic Al-Ti alloy powder formed into pellets ...................................................................................13
Fig. 9 DSC thermograms of the equiatomic Al-Zr alloy powder at 3 and 15 min of milling time ..........................................................................................................................................14
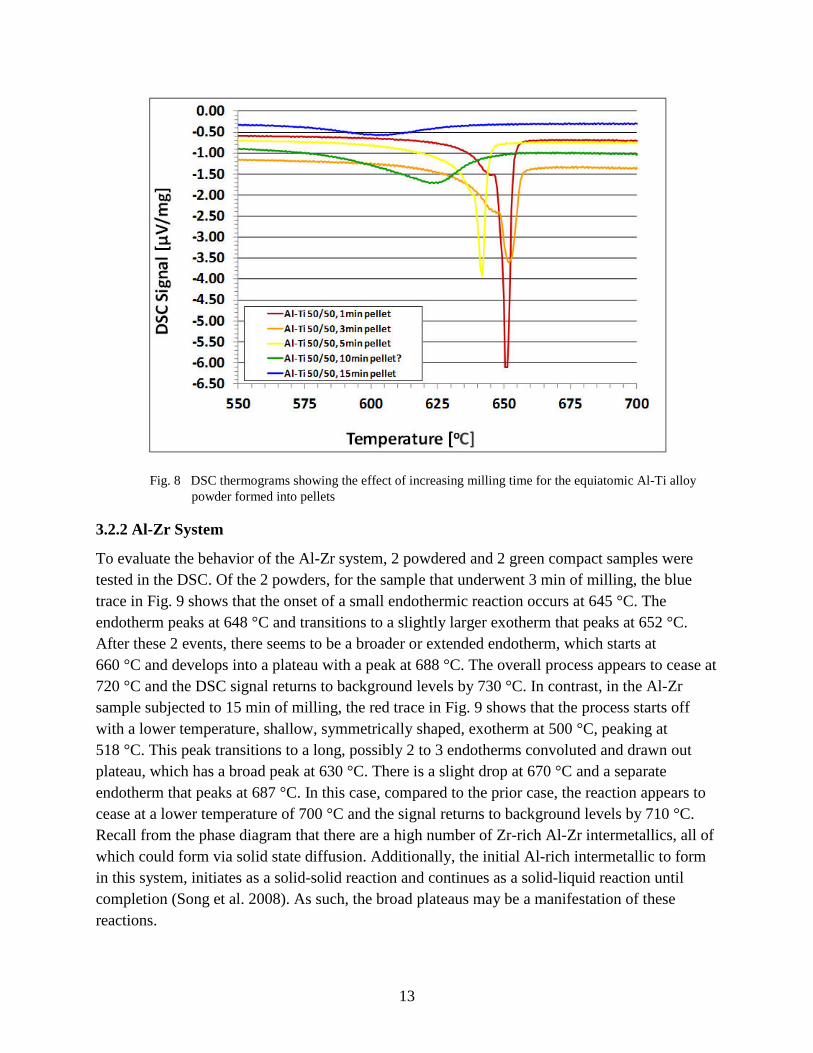
Fig. 10 DSC thermograms showing the effect of increasing milling time for the equiatomic Al-Zr alloy powder formed into pellets ...................................................................................15
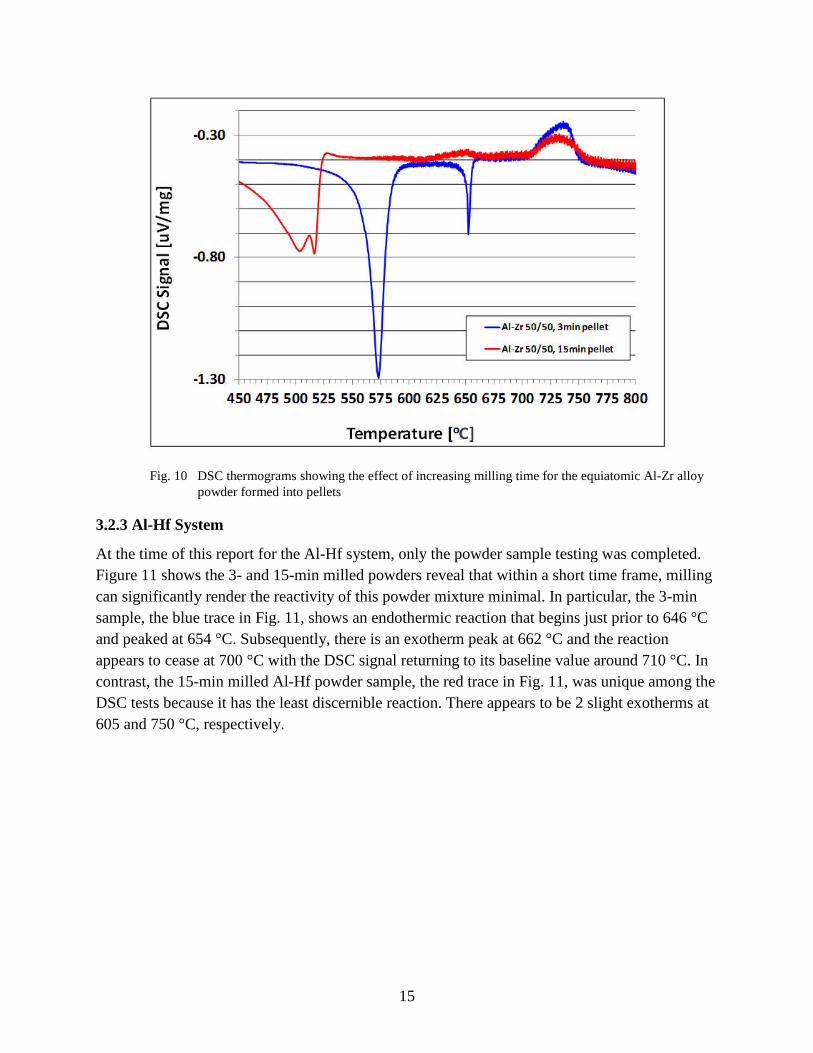
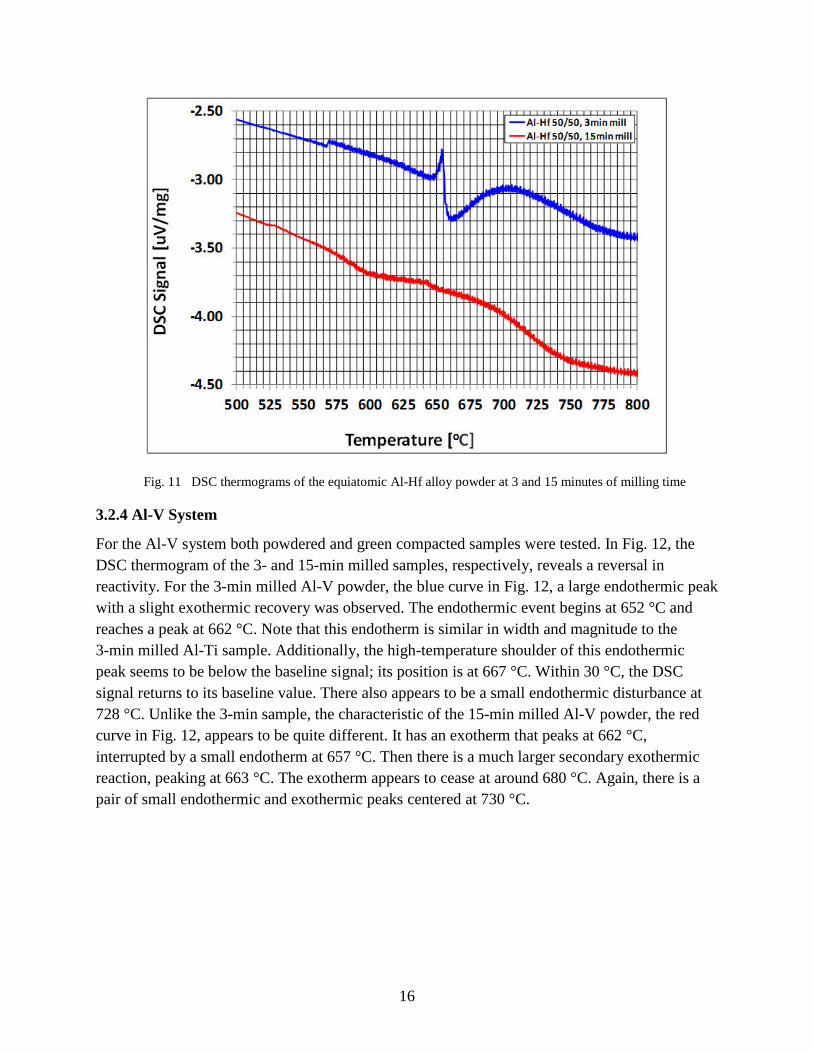
Fig. 11 DSC thermograms of the equiatomic Al-Hf alloy powder at 3 and 15 minutes of milling time ..............................................................................................................................16
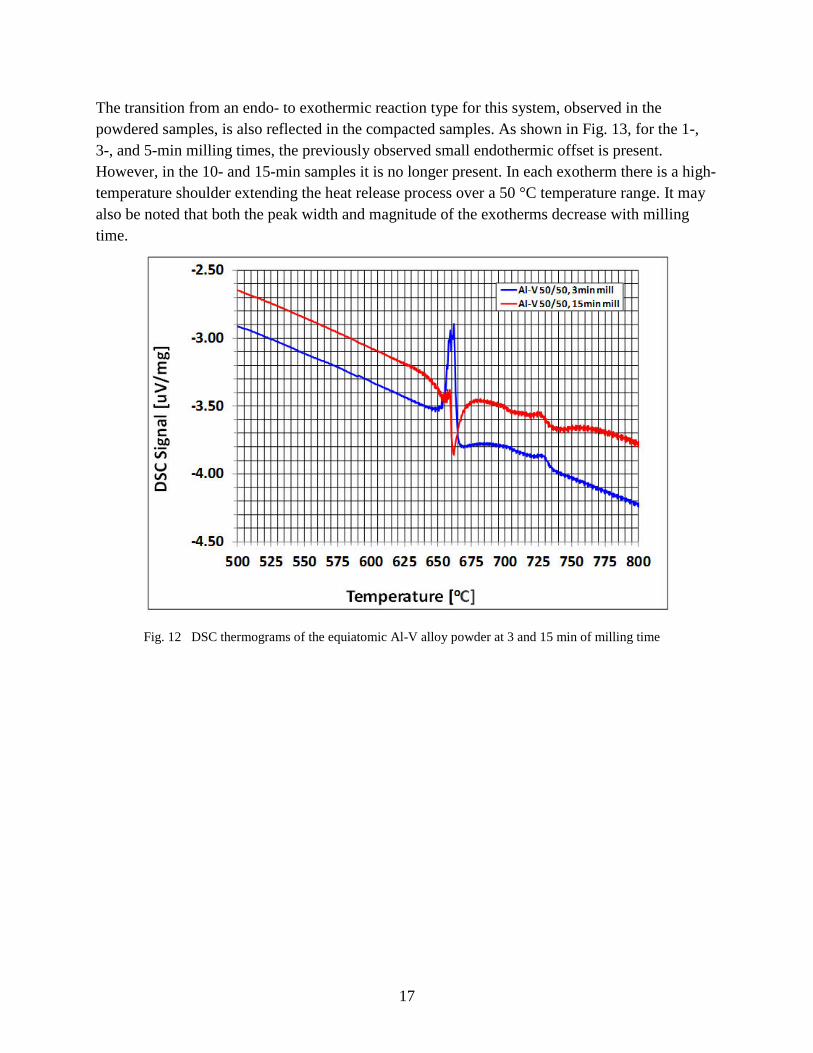
Fig. 12 DSC thermograms of the equiatomic Al-V alloy powder at 3 and 15 min of milling time ..........................................................................................................................................17
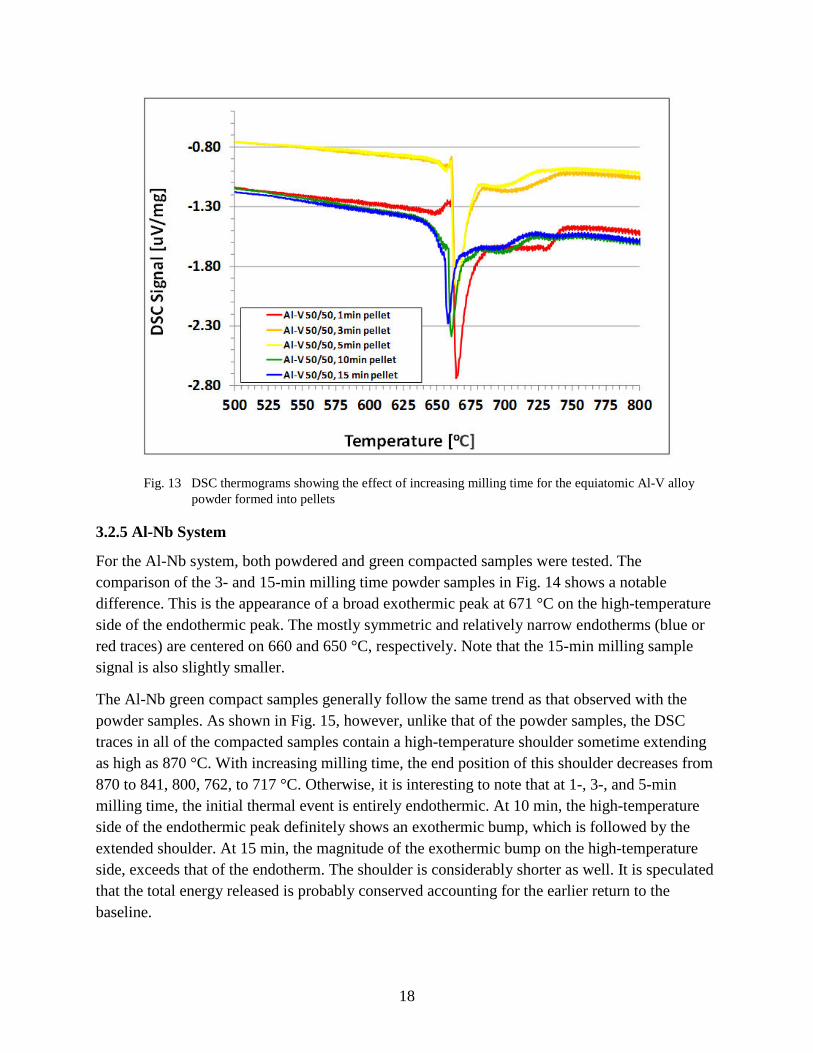
Fig. 13 DSC thermograms showing the effect of increasing milling time for the equiatomic Al-V alloy powder formed into pellets ....................................................................................18
Fig. 14 DSC thermograms of the equiatomic Al-Nb alloy powder at 3 and 15 minutes of milling time ..............................................................................................................................19
Fig. 15 DSC thermograms showing the effect of increasing milling time for the equiatomic Al-Nb alloy powder formed into pellets ..................................................................................19
Fig. 16 DSC thermograms of the equiatomic Al-Ta alloy powder at 3 and 15 minutes of milling time. .............................................................................................................................20
Fig. 17 DSC thermograms showing the effect of increasing milling time for the equiatomic Al-Ta alloy powder formed into pellets ...................................................................................21
Fig. 18 XRD scan of the equiatomic Al-Ti alloy pellets with increasing milling time. The anticipated Bragg reflections from the constituent elements are included in the figure for reference. ..................................................................................................................................23
Fig. 19 Enlarged view of the XRD scans of the equiatomic Al-Ti alloy pellets with increasing milling time. The anticipated Bragg reflections from the constituent elements are included in the figure for reference. ...................................................................................24

vi
Fig. 20 Enlarged view of the most intense Bragg peaks, Ti(002), Al(111), and Ti(011), respectively, from the equiatomic Al-Ti alloy pellets with increasing milling time. The nominal positions of the Ti(002), Al(111), and Ti(011) peaks appear at 38.40°, 38°, 47°, and 40.16°, respectively. ..........................................................................................................24
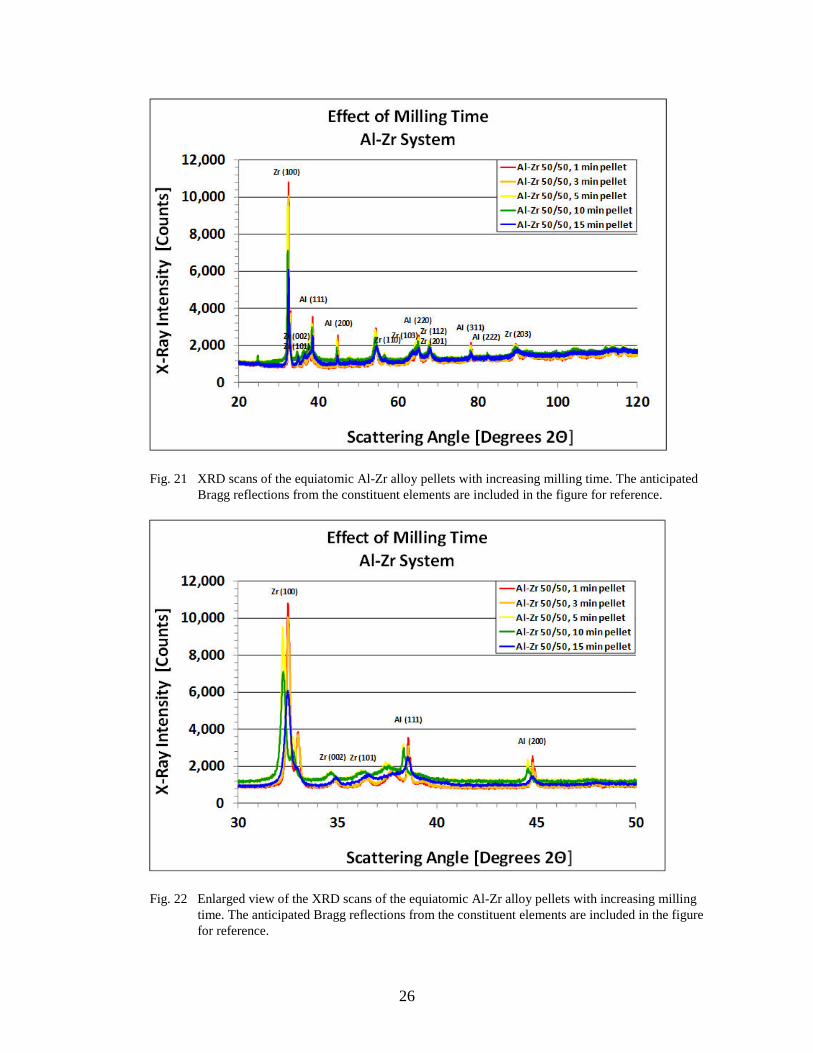
Fig. 21 XRD scans of the equiatomic Al-Zr alloy pellets with increasing milling time. The anticipated Bragg reflections from the constituent elements are included in the figure for reference. ..................................................................................................................................26
Fig. 22 Enlarged view of the XRD scans of the equiatomic Al-Zr alloy pellets with increasing milling time. The anticipated Bragg reflections from the constituent elements are included in the figure for reference. ...................................................................................26
Fig. 23 Enlarged view of the first of the 3 most intense Zr Bragg peaks, corresponding to the Zr(001) reflection, from the equiatomic Al-Zr alloy pellets with increasing milling time. The nominal position of this peak appears at 31.96°. .....................................................27
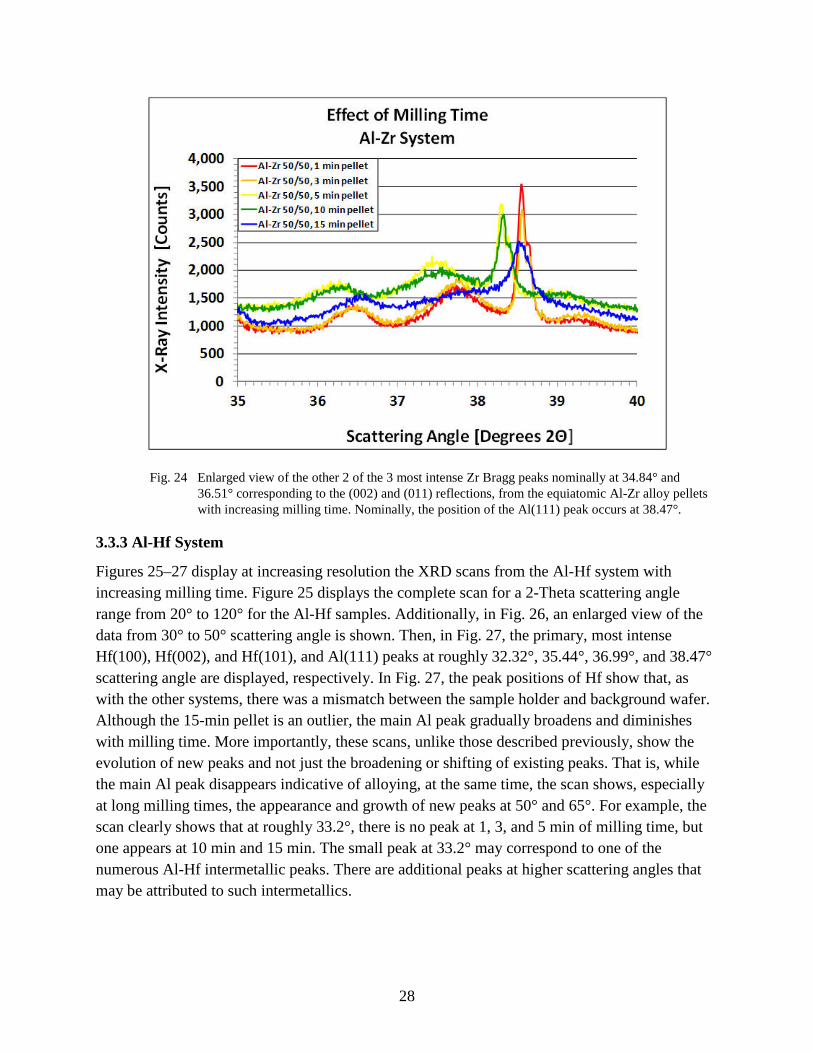
Fig. 24 Enlarged view of the other 2 of the 3 most intense Zr Bragg peaks nominally at 34.84° and 36.51° corresponding to the (002) and (011) reflections, from the equiatomic Al-Zr alloy pellets with increasing milling time. Nominally, the position of the Al(111) peak occurs at 38.47°. ..............................................................................................................28
Fig. 25 XRD scans of the equiatomic Al-Hf alloy pellets with increasing milling time. The anticipated Bragg reflections from the constituent elements are included in the figure for reference. ..................................................................................................................................29
Fig. 26 Enlarged view of the XRD scans of the equiatomic Al-Hf alloy pellets with increasing milling time. The anticipated Bragg reflections from the constituent elements are included in the figure for reference. ...................................................................................29
Fig. 27 Enlarged view of the first of the 3 most intense Hf Bragg peaks Hf(100), Hf(002), and Hf(101), from the equiatomic Al-Hf alloy pellets with increasing milling time. The nominal positions of these peaks appear at 32.32°, 35.44°, and 36.99°. Nominally, the position of the Al(111) peak occurs at 38.47°. ........................................................................30
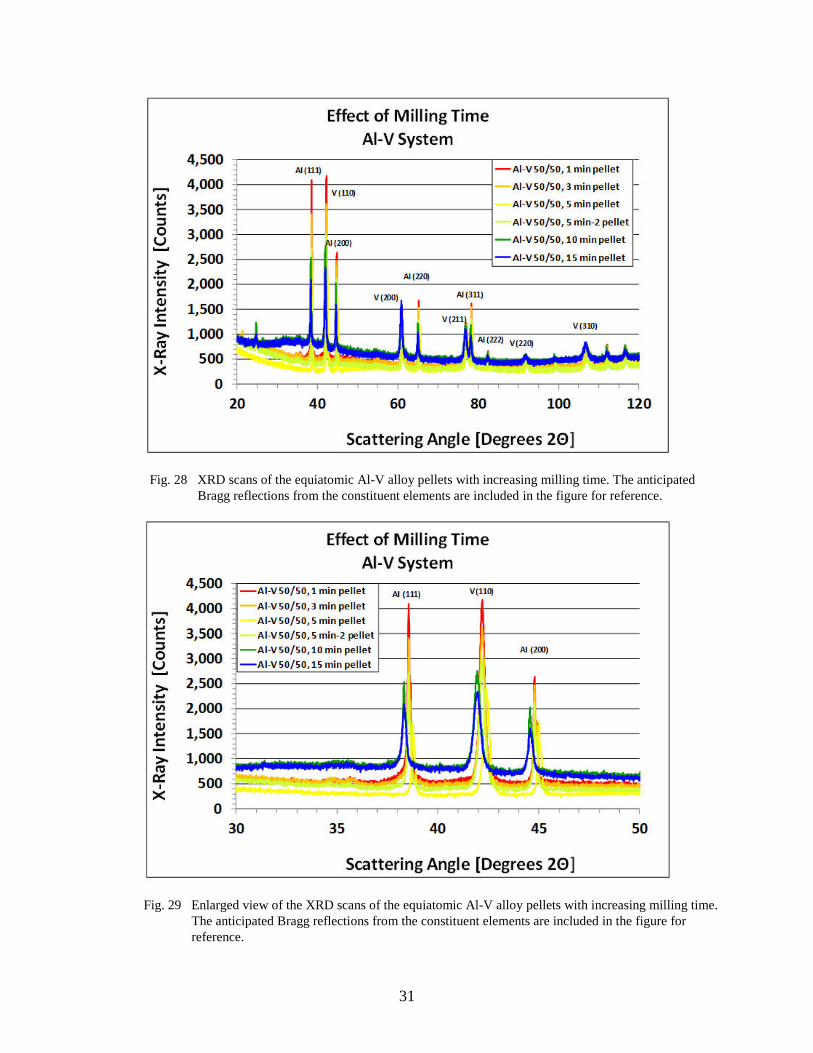
Fig. 28 XRD scans of the equiatomic Al-V alloy pellets with increasing milling time. The anticipated Bragg reflections from the constituent elements are included in the figure for reference. ..................................................................................................................................31
Fig. 29 Enlarged view of the XRD scans of the equiatomic Al-V alloy pellets with increasing milling time. The anticipated Bragg reflections from the constituent elements are included in the figure for reference. ...................................................................................31
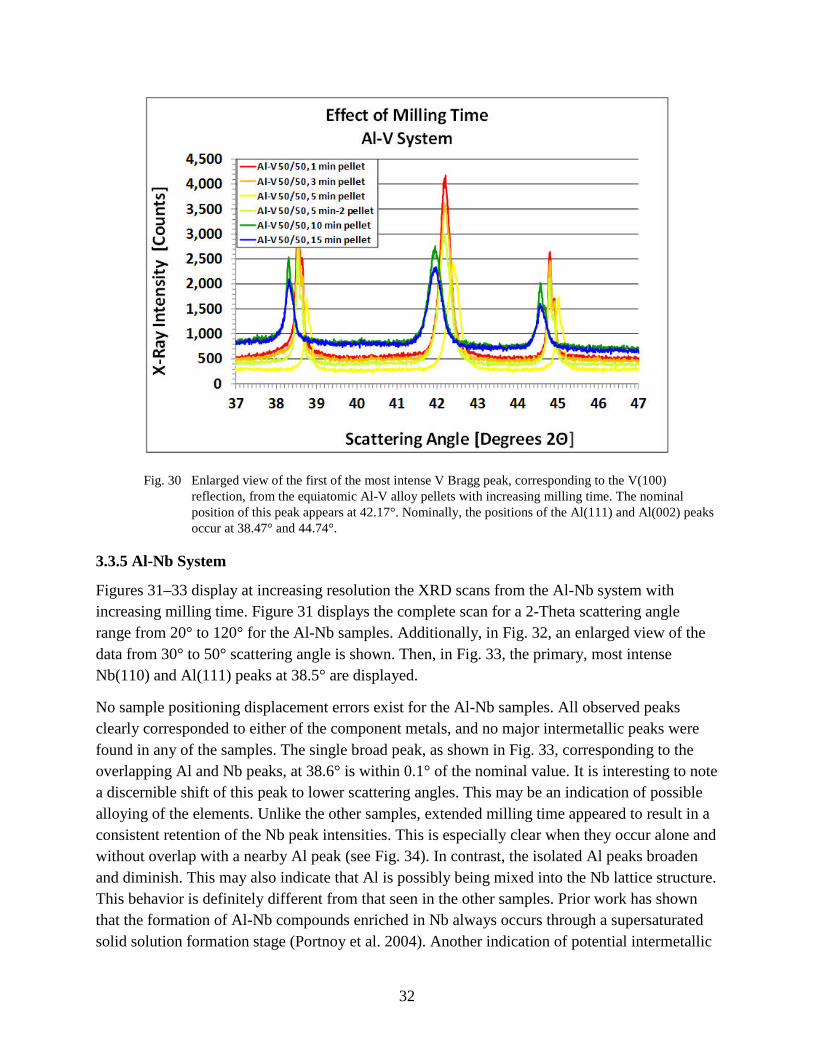
Fig. 30 Enlarged view of the first of the most intense V Bragg peak, corresponding to the V(100) reflection, from the equiatomic Al-V alloy pellets with increasing milling time. The nominal position of this peak appears at 42.17°. Nominally, the positions of the Al(111) and Al(002) peaks occur at 38.47° and 44.74°. ..........................................................32
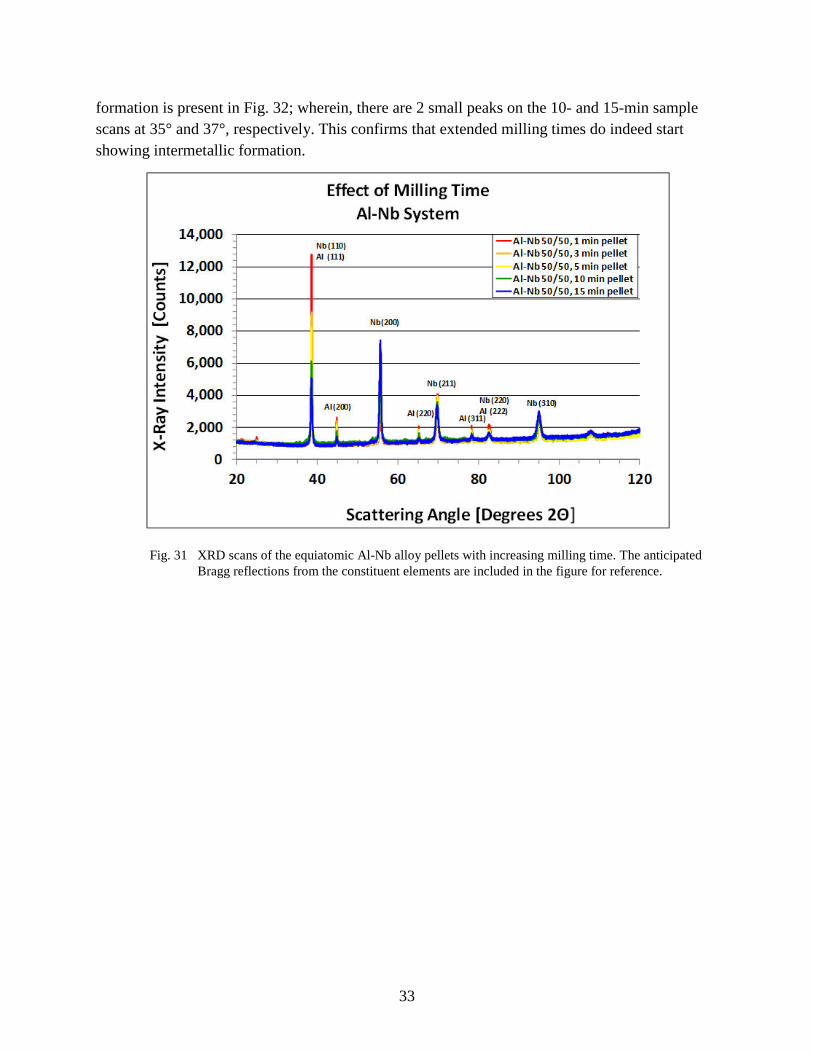
Fig. 31 XRD scans of the equiatomic Al-Nb alloy pellets with increasing milling time. The anticipated Bragg reflections from the constituent elements are included in the figure for reference. ..................................................................................................................................33
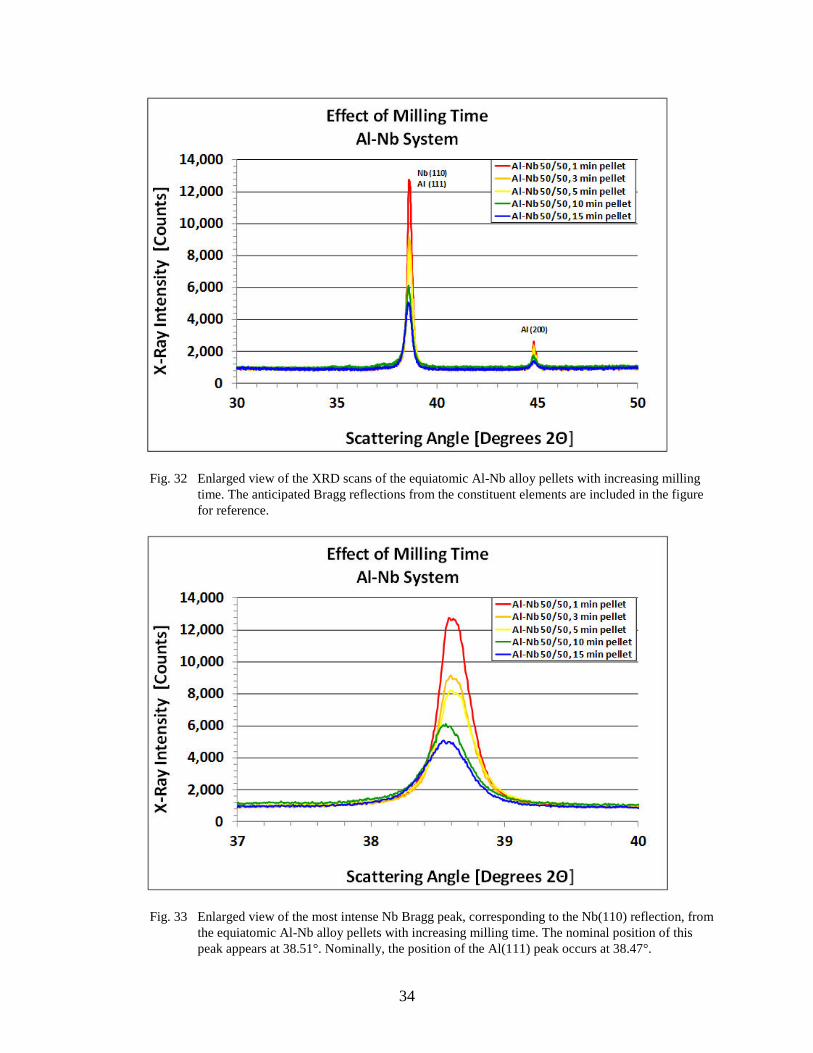
Fig. 32 Enlarged view of the XRD scans of the equiatomic Al-Nb alloy pellets with increasing milling time. The anticipated Bragg reflections from the constituent elements are included in the figure for reference. ...................................................................................34
vii
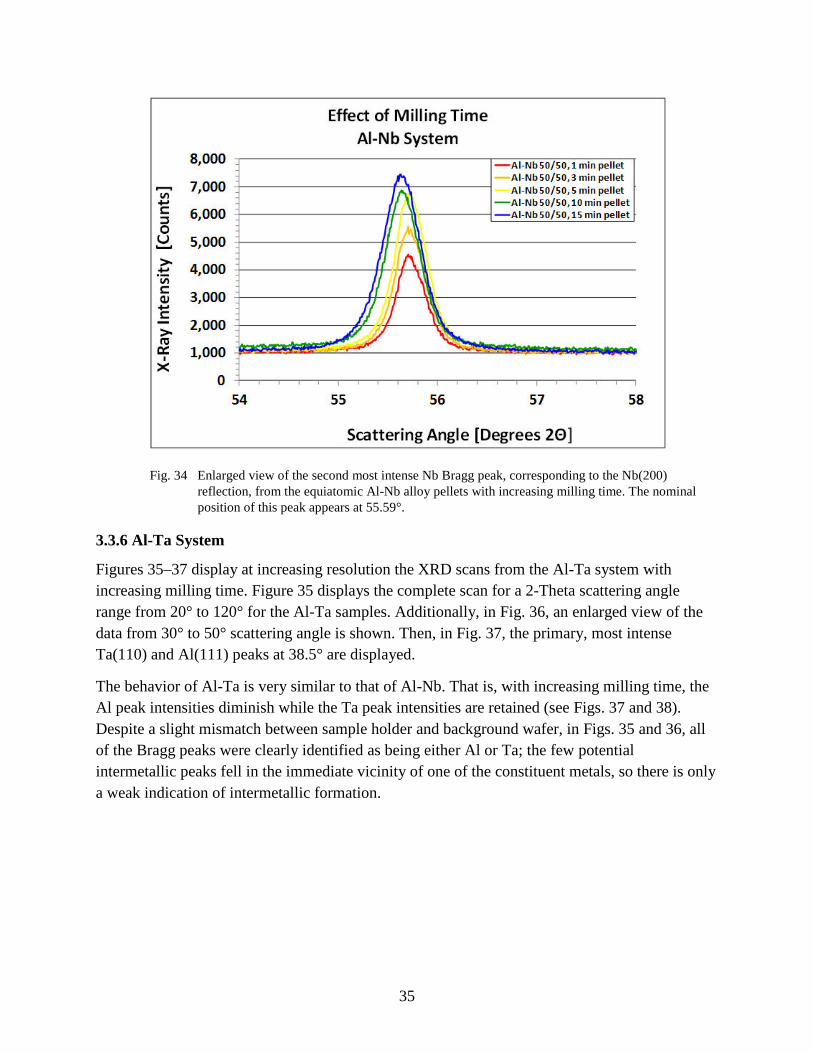
Fig. 33 Enlarged view of the most intense Nb Bragg peak, corresponding to the Nb(110) reflection, from the equiatomic Al-Nb alloy pellets with increasing milling time. The nominal position of this peak appears at 38.51°. Nominally, the position of the Al(111) peak occurs at 38.47°. ..............................................................................................................34
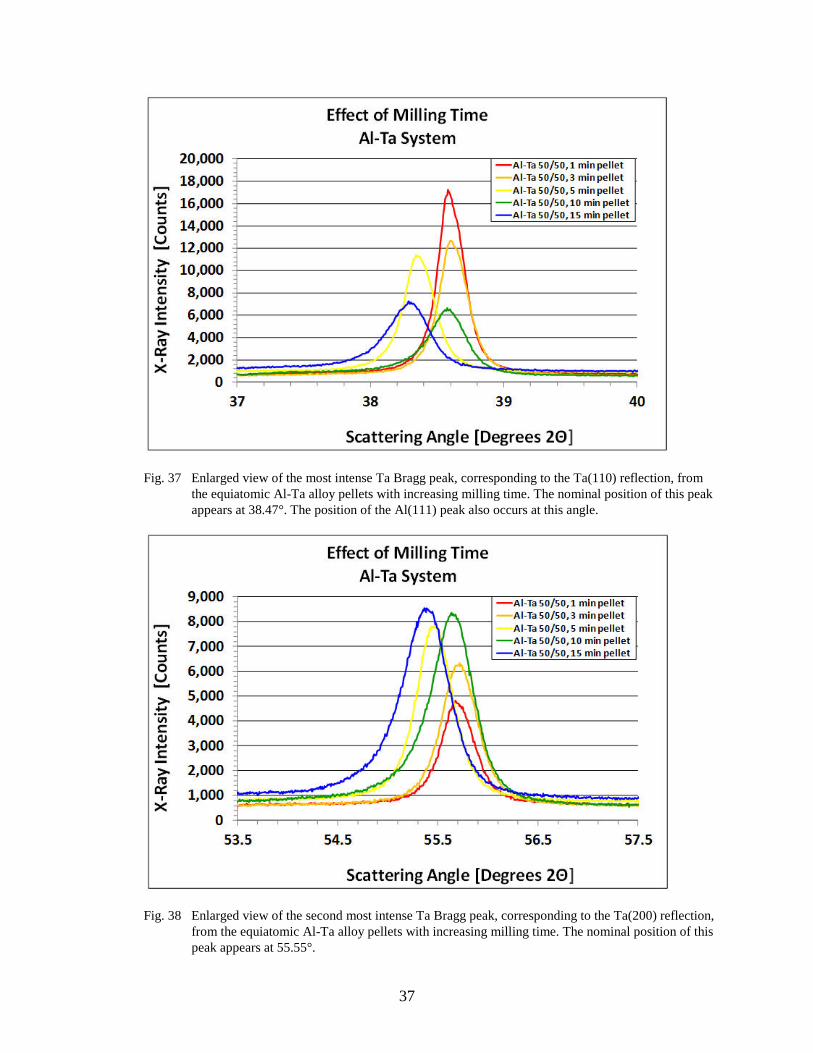
Fig. 34 Enlarged view of the second most intense Nb Bragg peak, corresponding to the Nb(200) reflection, from the equiatomic Al-Nb alloy pellets with increasing milling time. The nominal position of this peak appears at 55.59°. ..............................................................35
Fig. 35 XRD scans of the equiatomic Al-Ta alloy pellets with increasing milling time. The anticipated Bragg reflections from the constituent elements are included in the figure for reference. ..................................................................................................................................36
Fig. 36 Enlarged view of the XRD scans of the equiatomic Al-Ta alloy pellets with increasing milling time. The anticipated Bragg reflections from the constituent elements are included in the figure for reference. ...................................................................................36
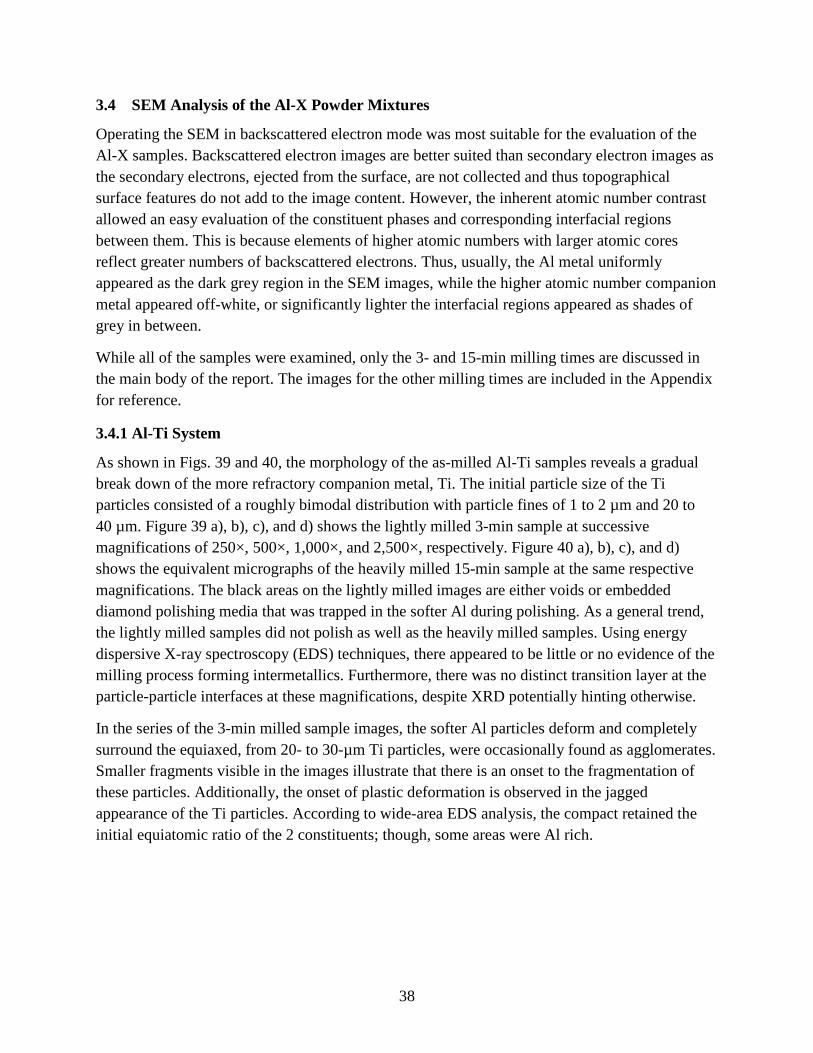
Fig. 37 Enlarged view of the most intense Ta Bragg peak, corresponding to the Ta(110) reflection, from the equiatomic Al-Ta alloy pellets with increasing milling time. The nominal position of this peak appears at 38.47°. The position of the Al(111) peak also occurs at this angle. ..................................................................................................................37
Fig. 38 Enlarged view of the second most intense Ta Bragg peak, corresponding to the Ta(200) reflection, from the equiatomic Al-Ta alloy pellets with increasing milling time. The nominal position of this peak appears at 55.55°. ..............................................................37
Fig. 39 SEM images of compacted Al-Ti powder pellets after 3 min of milling time: a) 250× magnification micrograph, b) 500× magnification micrograph, c) 1,000× magnification micrograph, and d) 2,500× magnification micrograph. Pellet compaction axis is along the horizontal. ................................................................................................................................39
Fig. 40 SEM images of compacted Al-Ti powder pellets after 15 min of milling time: a) 250× magnification micrograph, b) 500× magnification micrograph, c) 1,000× magnification micrograph, and d) 2,500× magnification micrograph. Pellet compaction axis is along the vertical. ..........................................................................................................40
Fig. 41 SEM images of compacted Al-Zr powder pellets after 3 min of milling time: a) 250× magnification micrograph, b) 500× magnification micrograph, c) 1,000× magnification micrograph, and d) 2,500× magnification micrograph. Pellet compaction axis cannot be determined from the micrographs. ...................................................................41
Fig. 42 SEM images of compacted Al-Zr powder pellets after 15 min of milling time: a) 250× magnification micrograph, b) 500× magnification micrograph, c) 1,000× magnification micrograph, and d) 2,500× magnification micrograph. Pellet compaction axis cannot be determined from the micrographs. ...................................................................42
Fig. 43 SEM images of compacted Al-Hf powder pellets after 3 min of milling time: a) 250× magnification micrograph, b) 500× magnification micrograph, c) 1,000× magnification micrograph, and d) 2,500× magnification micrograph. Pellet compaction axis along the horizontal. .........................................................................................................43
Fig. 44 SEM images of compacted Al-Hf powder pellets after 15 min of milling time: a) 250× magnification micrograph, b) 500× magnification micrograph, c) 1,000× magnification micrograph, and d) 2,500× magnification micrograph. Pellet compaction axis along a diagonal. ...............................................................................................................44

viii
Fig. 45 SEM images of compacted Al-V powder pellets after 3 min of milling time: a) 250× magnification micrograph, b) 500× magnification micrograph, c) 1,000× magnification micrograph, and d) 2,500× magnification micrograph. Pellet compaction axis is most likely along the horizontal. ......................................................................................................45
Fig. 46 SEM images of compacted Al-V powder pellets after 15 min of milling time: a) 250× magnification micrograph, b) 500× magnification micrograph, c) 1,000× magnification micrograph, and d) 2,500× magnification micrograph. Pellet compaction axis along the horizontal. .........................................................................................................46
Fig. 47 SEM images of compacted Al-Nb powder pellets after 3 min of milling time: a) 250× magnification micrograph, b) 500× magnification micrograph, c) 1,000× magnification micrograph, and d) 2,500× magnification micrograph. Pellet compaction axis is along a diagonal. ...........................................................................................................47
Fig. 48 SEM images of compacted Al-Nb powder pellets after 15 min of milling time: a) 250× magnification micrograph, b) 500× magnification micrograph, c) 1,000× magnification micrograph, and d) 2,500× magnification micrograph. Pellet compaction axis is most likely along the vertical. .......................................................................................48
Fig. 49 SEM images of compacted Al-Ta powder pellets after 3 min of milling time: a) 250× magnification micrograph, b) 500× magnification micrograph, c) 1,000× magnification micrograph, and d) 2,500× magnification micrograph. Pellet compaction axis is along a diagonal. ...........................................................................................................49
Fig. 50 SEM images of compacted Al-Ta powder pellets after 15 min of milling time: a) 250× magnification micrograph, b) 500× magnification micrograph, c) 1,000× magnification micrograph, and d) 2,500× magnification micrograph. Pellet compaction axis is along a diagonal. ...........................................................................................................50

ix
Acknowledgments
The second author wishes to thank his mentor Laszlo Kecskes and extend his thanks to Kristopher Darling, Anthony Roberts, Brady Butler, and Suveen Mathaudhu, all civilian or contract employees at the US Army Research Laboratory (ARL) for their support during his stay as a student intern in the summer of 2012.

x
INTENTIONALLY LEFT BLANK.

1
1. Introduction
The material combinations reviewed in this report are intrinsically energetic and reactive, which, in turn, could be formed into intermetallic compounds in a pyrophoric manner. This is to say that, on a thermodynamic basis, the heats of mixing are negative, and the formation of the product phases is favored over those of the reactants. If the nominal threshold energy could be reduced for the conversion to take place, the reactive synthesis process of the terminal intermetallic compound(s) could occur at an accelerated reaction rate that would result in a remarkably rapid increase in temperature. Such a condition would exist if the particle size of these materials is reduced from the coarse to the fine or ultrafine scale. As a general rule, finer powders react faster and reach higher temperatures while coarser powders react over longer periods of time, peaking at lower temperatures (Merzbacher 2002). Under these circumstances, exposure to oxygen or nitrogen can also introduce secondary reactions, which could readily overtake the primary reaction. As such, due to this potentially accelerated reaction rate, these materials can easily or spontaneously ignite and burn upon exposure to air even at room temperature. In this capacity, these pyrophoric precursor systems create an opportunity in which a great amount of stored potential energy could be released with a little input energy.
A convenient method to alter and manipulate the size and extent of the intermixing of dissimilar particulate materials is by milling and mechanical alloying. Milling reduces the size of the particles and alloying reduces the interspacing of the species. The materials investigated in this cursory study are a series of equiatomic aluminum (Al)-X mixtures that have been subjected to high-energy milling and subsequently heated under controlled conditions. Namely, these consist of the Group IVA and VA elements of titanium (Ti), zirconium (Zr), and hafnium (Hf), and vanadium (V), niobium (Nb), and tantalum (Ta). Typically, the conversion from reactants to the intermetallic product(s) results in a refractory material that, most likely, will be rendered with good thermal and wear resistance. The formation reactions of these refractory compounds are exothermic in nature, similar to those seen in Self-Propagating High-Temperature Synthesis (SHS) or Combustion Synthesis. In this method, the intimately mixed reactant powders are point initiated, starting the exothermic reaction process in which a heat wave spreads through the unreacted material, converting the reactants into products. A specific mode of SHS, referred to as Thermal Explosion, occurs when the reactants are uniformly heated, such as those conditions that exist during analysis using a Differential Scanning Calorimeter (DSC).
The objective of this research effort was to systematically characterize the series of aforementioned binary alloy systems for their exothermic heat output and the ease and/or extent of intermetallic formation/conversion. Specifically, powder mixtures were milled for increasing lengths of time. The resultant powder mixtures were then examined with X-ray Diffraction (XRD) analysis, Scanning Electron Microscopy (SEM), and subjected to DSC analysis. It was
2
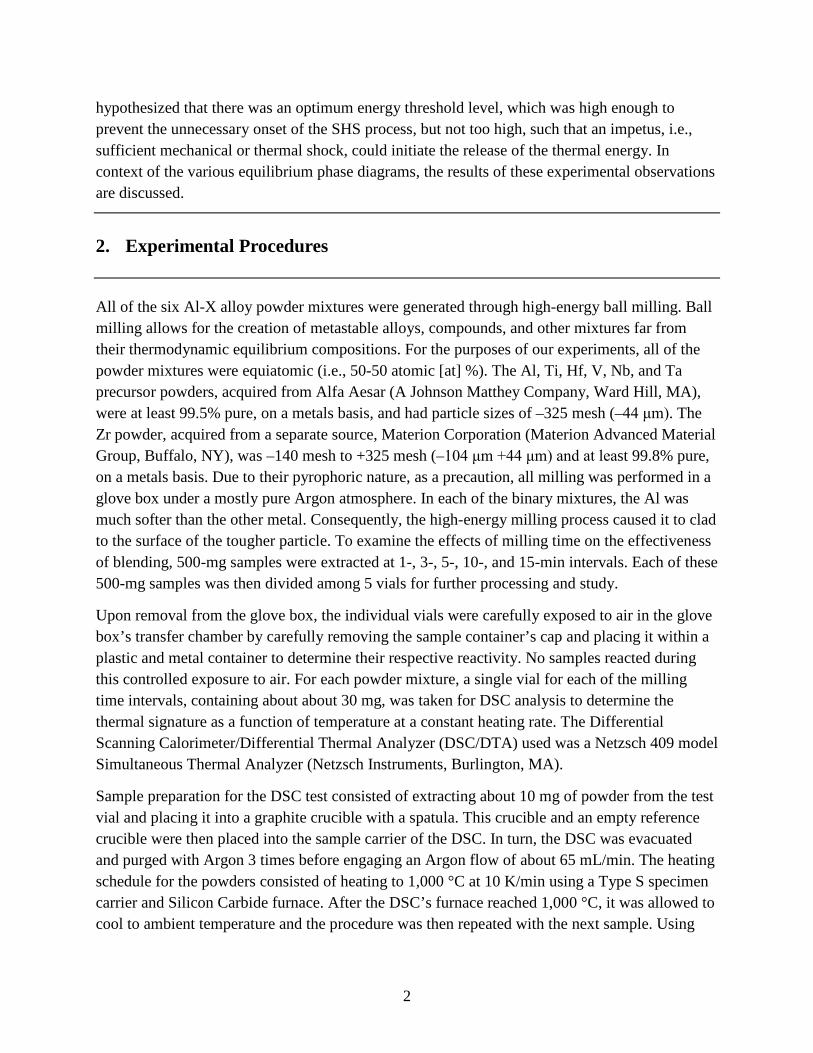
hypothesized that there was an optimum energy threshold level, which was high enough to prevent the unnecessary onset of the SHS process, but not too high, such that an impetus, i.e., sufficient mechanical or thermal shock, could initiate the release of the thermal energy. In context of the various equilibrium phase diagrams, the results of these experimental observations are discussed.
2. Experimental Procedures
All of the six Al-X alloy powder mixtures were generated through high-energy ball milling. Ball milling allows for the creation of metastable alloys, compounds, and other mixtures far from their thermodynamic equilibrium compositions. For the purposes of our experiments, all of the powder mixtures were equiatomic (i.e., 50-50 atomic [at] %). The Al, Ti, Hf, V, Nb, and Ta precursor powders, acquired from Alfa Aesar (A Johnson Matthey Company, Ward Hill, MA), were at least 99.5% pure, on a metals basis, and had particle sizes of –325 mesh (–44 μm). The Zr powder, acquired from a separate source, Materion Corporation (Materion Advanced Material Group, Buffalo, NY), was –140 mesh to +325 mesh (–104 μm +44 μm) and at least 99.8% pure, on a metals basis. Due to their pyrophoric nature, as a precaution, all milling was performed in a glove box under a mostly pure Argon atmosphere. In each of the binary mixtures, the Al was much softer than the other metal. Consequently, the high-energy milling process caused it to clad to the surface of the tougher particle. To examine the effects of milling time on the effectiveness of blending, 500-mg samples were extracted at 1-, 3-, 5-, 10-, and 15-min intervals. Each of these 500-mg samples was then divided among 5 vials for further processing and study.
Upon removal from the glove box, the individual vials were carefully exposed to air in the glove box’s transfer chamber by carefully removing the sample container’s cap and placing it within a plastic and metal container to determine their respective reactivity. No samples reacted during this controlled exposure to air. For each powder mixture, a single vial for each of the milling time intervals, containing about about 30 mg, was taken for DSC analysis to determine the thermal signature as a function of temperature at a constant heating rate. The Differential Scanning Calorimeter/Differential Thermal Analyzer (DSC/DTA) used was a Netzsch 409 model Simultaneous Thermal Analyzer (Netzsch Instruments, Burlington, MA).
Sample preparation for the DSC test consisted of extracting about 10 mg of powder from the test vial and placing it into a graphite crucible with a spatula. This crucible and an empty reference crucible were then placed into the sample carrier of the DSC. In turn, the DSC was evacuated and purged with Argon 3 times before engaging an Argon flow of about 65 mL/min. The heating schedule for the powders consisted of heating to 1,000 °C at 10 K/min using a Type S specimen carrier and Silicon Carbide furnace. After the DSC’s furnace reached 1,000 °C, it was allowed to cool to ambient temperature and the procedure was then repeated with the next sample. Using
3
this methodology, thermal events such as endothermic and exothermic reactions could be observed in the milled powders as they were heated.
Additionally, 3-mm-diameter green compacts or pellets, roughly 1 mm thick, were pressed for further DSC testing. Using a pneumatic press and titanium carbide dies the powder samples were first pressed inside the glove box to a pressure of approximately 600 psi (4.137 MPa). After the initial compaction, the die, still with the compact inside, was removed from the glove box and pressed again to 800 psi (5.516 MPa) by means of a manual hydraulic press. The green compact was then extracted from the die, and the process was repeated with the next sample.
Initially, to generate the XRD scans, the as-milled powders were sprinkled onto “low-background” silicon dioxide (SiO2) or quartz sample holders. However, occasionally, in some instances, the powder was too reactive in air and autocombusted. Special care was required to prevent such occurrences. Consequently, it was decided to use the small 3-mm-diameter green compacts for these measurements as well.
Mounting for XRD consisted of situating the compact on top of a small pillar of clay using the “low-background” sample holder. The compact was then flattened to be flush with the sample holder surface so that its top surface was in the diffractometer’s focal plane, and then it was loaded into the diffractometer multiple sample stage. Scan times were just over 90 min, and the 2-Theta range was 20°–120° with a sample rotation rate of one revolution every 4 s such that all possible grains could be detected for intermetallic formations after milling. The X-ray instrument used was a PANalytical X’Pert PRO Multipurpose Diffractometer (PANalytical, Westborough, MA).
After XRD analysis, the sample specimens were mounted perpendicular to their circular face in a room temperature setting resin. Both time intervals (3 and 15 min, respectively) of each particular alloy were mounted together for ease of polishing and imaging. The resin containing powder compacts were polished down to 0.3-µm finish using diamond media.
The polished compacts were then coated with copper tape and carbon paint to minimize the charging of the epoxy resin and sequentially loaded and imaged in a S4700 Field Effect Scanning Electron Microscope (Hitachi North America, Gaithersburg, MD). Secondary electron micrographs were taken at 250×, 500×, 1,000×, and 2,500× magnifications. Additionally, the samples were analyzed for verification of the elemental constituents and their relative ratios using Energy Dispersive X-ray Spectroscopy (EDS) (EDAX, Inc., Mahwah, NJ) both at the low and high magnifications. Changes in the ratio and redistribution of the elements were used to ascertain if any intermetallic compounds formed during or after milling.
4
3. Results
Since all powders were milled as equiatomic mixtures, it is probable that a wide range of distinct intermetallic compounds formed during the milling process. It was presumed that solid solutions and intermetallics containing high relative amounts of one or the other primary element should tend to form at low milling times, whereas progressively longer millings ought to result in intermetallics that approach an equiatomic mixture of the constituents. Due to the Al being the more ductile component in all of the examined systems, the milling process caused it to clad around the tougher metal particles of the other element. It was further presumed that as the milling continued, the 2 elements began to better intermix, and the intermetallics, if any, would be found at the particle boundaries.
3.1 Equilibrium Phase Relationships for the Binary Al-Group IV and Al-Group V Systems
The binary equilibrium phase diagrams, Figs. 1–3 for Group IV and Figs. 4–6 for Group V, of the tested systems illustrate the discrete nature of the potential intermetallic compounds. In turn, a review of each of the system will assist in a better appreciation of the differences and similarities that exists.
The Al-Ti system, Fig. 1, contains 3 primary intermetallic phases. These are TiAl3, TiAl, and Ti3Al. The most refractory of these intermetallics is TiAl. Note that this intermetallic is stable for a wide range of Ti:Al ratios. Thus, it was expected that with shorter milling times, an initially Al-rich solid solution would convert to TiAl3 first, then with further milling convert to TiAl. Similarly, from the Ti-rich end, it was expected that Ti3Al would form first then convert into the equimolar TiAl.

5
Fig. 1 Binary equilibrium phase diagram of Al and Ti
The Al-Zr system, Fig. 2, contains a great number of intermetallic compounds. The most refractory is ZrAl2. Among these, on the Al-rich side, ZrAl3 and ZrAl2 were expected to form first as Al is enriched by Zr. Conversely, on the Zr-rich side, Zr3Al is expected to form first as Zr is enriched by Al; of course, after extended milling time, the compositions closer to the equiatomic ratio were expected, e.g., Zr2Al3, Zr2Al, or ZrAl.

6
Fig. 2 Binary equilibrium phase diagram of Al and Zr
The Al-Hf system, Fig. 3, contains 7 highly refractory intermetallics. On the Al-rich side, the 3 congruently melting intermetallics are HfAl3, HfAl2, and Hf2Al3. On the Hf-rich side, there are 2 congruently melting intermetallics, HfAl and Hf3Al2. It is suspected that milling will shift the compositions to the center of the phase diagram; however, because of the refractory nature of the intermetallic, it was expected that there would be a high-energy barrier to overcome once a refractory compound is formed.

7
Fig. 3 Binary equilibrium phase diagram of Al and Hf
The Al-V system, Fig. 4, contains 5 incongruently melting intermetallics, 2 of which are highly refractory, namely Al3V and Al3V5. The other intermetallics, Al21V2, Al45V7, and Al23V4 were expected to form at considerably lower temperatures. As such, they were not expected to impede the alloying process toward the equimolar composition.

8
Fig. 4 Binary equilibrium phase diagram of Al and V
The Al-Nb system, Fig. 5, had comparatively fewer intermetallic phases; these are Nb3Al, Nb2Al, and NbAl3. The former 2 melt incongruently and are highly refractory. Note that there is no equimolar intermetallic in the Al-V system. Therefore, it was expected that the Nb3Al and NbAl3 intermetallics would form after light milling. It was also likely that Nb3Al may be enriched with further milling and convert into Nb2Al.

9
Fig. 5 Binary equilibrium phase diagram of Al and Nb
The Al-Ta system, Fig. 6, contains 4 intermetallic phases all of which melt incongruently with Ta2Al being the most refractory. As such, while with light milling TaAl3 may easily form, it is more likely that after extensive milling, the more refractory Ta2Al and/or TaAl phases would be present.

10
Fig. 6 Binary equilibrium phase diagram of Al and Ta
3.2 Differential Thermal Analysis of the Al-X Powder Mixtures
As was stated previously, during the milling process, with Al being the softer of the 2 powdered precursors, generally, it was found that Al readily adheres to and clads to the more refractory metal. Consequently, after some elapsed time, the 2 elements were in intimate contact with one another. With increasing milling time, the level of mixing became more extensive and conceivably some atomic level diffusion may have taken place. Our intent was to evaluate the effect of this intermixing on the magnitude of the anticipated exothermic output under controlled heating.
During milling, the milling time was adjusted (i.e., sufficiently shortened) such that none of the binary mixtures underwent spontaneous combustion. Thus, while the milling process imparted cladding, and possibly some forced solid-solid diffusion between the elements, it was expected that only once a threshold temperature was exceeded during heating in the DSC/DTA, a more rapid, liquid-solid combustion reaction took place. That is, unless it was partially or completely alloyed with its companion metal in any of the binary mixtures, any unalloyed Al, having a lower nominal melting temperature of 660 °C, was expected to melt during the DTA analysis. Under such circumstances, it was expected that the intermetallic products would form via precipitation from an Al-rich melt. Furthermore, because a reaction would be more rapid between a liquid and a solid than between 2 solids, it was also expected that the DSC/DTA thermograms would reflect such changes, if any, in varying mechanisms. (The thermal signature of a liquid-solid reaction

11
would be sharp, occurring over a narrow temperature range; whereas, a solid-solid reaction would be broader, occurring over a wider temperature range.)
Figures 7–17 show the data generated by the DSC/DTA. The changing Y-intercept of the various thermograms is believed to be an artifact of the slightly changing positional height of the crucible platform at the onset of each test in conjunction with the quality of surface/thermal contact between the crucible and its housing platform. On the ordinate axis, the DSC units, represented in microvolts/milligrams (µV/mg), correlate the energy input/output of the sample relative to a reference standard to the temperature of an internal thermocouple. Therefore, the DSC figures are qualitative, not quantitative, due to problems with the device’s sensitivity calibration file. Initially, there were also problems with the calibration of the temperature; however, this was resolved by melting high-purity elements and then using their nominal melting point data to manually establish a calibration between the measured and nominal temperature values. Specifically, the measured and nominal temperature data were subjected to a linear least squares fit. Once the linear coefficients were obtained, the measured temperatures were adjusted to calculate the expected temperature. All thermograms have been plotted over an equivalent temperature range; thus, all figures are proportional to each other as they are displayed.
Collectively, the DSC data revealed that high-energy ball milling can impart a different thermal characteristic to the various binary Al-based mixtures. Milling reduces the interspecies diffusion distance and, consequently, the reactivity of the powders significantly increased with milling time, changing a nominally endothermic to an exothermic behavior. It was observed that the behavior of some of the systems are relatively easily modified (e.g., Al-Hf); whereas, other systems (e.g., Al-Nb) require very long milling times to facilitate a change in reactive behavior. There was also a notable difference between the reactivities of the powdered and green compacted samples. Unlike those of the powdered samples, intimate contact between particles translates into faster mass and heat transport and, as such, endotherms seen in the loose powders are either reduced or eliminated in the compacts. In turn, specific aspects and results from each system are reviewed.
3.2.1 Al-Ti System
Two powdered and 5 green compacted Al-Ti samples were reacted in the DSC. In the Al-Ti powder sample that underwent 3 min of milling, the blue trace in Fig. 7, shows an onset temperature of 655 °C wherein an endothermic reaction starts. This is slightly less than the nominal melting point of Al. As such, it is surmised that it corresponds to the onset of melting of Al; thus, this event would initiate a reaction process between the molten Al with neighboring Ti particles. Note that actually there are 2 endothermic peaks at 660 °C and 665 °C, respectively. At a slightly higher temperature the melting process ends and an exothermic peak begins. The peak is asymmetric with a shoulder on its low-temperature side, a maximum at 686 °C, and an approximate end point around 720 °C. Analysis of the first derivative indicates that the asymmetry is attributed to the rapid transition from the endo- to exothermic peak. In contrast, for

12
the 15-min milled Al-Ti powder sample, the red curve in Fig. 7, there is no apparent endotherm present, indicative of Al melting. Instead, there is a single very broad shallow exothermic reaction that begins around 575 °C peaking at 630 °C. The reaction appears to end at around 680 °C.
Corresponding to the results obtained from the as-milled powders, Fig. 8 displays the DSC results for the green compacts at various milling times. For each milling time, the traces show a single exothermic peak. Additionally, there are 3 major trends in the data; in the first, the endothermic peak seen for the powder samples is not present in any of the temperature traces from the compact samples; in the second, the peaks diminish in magnitude and become broader; and, in the third, the peak positions shift to lower temperatures. Specifically, at 1-min milling time there is a single narrow exothermic peak, centered at about 650 °C; note that there is a shoulder on the low-temperature side at 644 °C. (The fact that this low-temperature peak is convoluted, it is realized that the actual subsidiary peak is at a slightly lower temperature.) At 3-min milling time, the exotherm and its low-temperature subsidiary remains roughly at the same temperatures; though, its magnitude is about one half of that of the 1-min sample. The 5-min milled sample exotherm peaks at 642 °C with its subsidiary appearing more like an inflection point on the low-temperature side. In contrast to the shorter mill time samples, the 2 longer 10- and 15-min milled samples no longer have sharp exotherms. Instead, they exhibit broad peaks centered at 625 and 605 °C, respectively.
Fig. 7 DSC thermograms of the equiatomic Al-Ti alloy powder at 3 and 15 min of milling time
13
Fig. 8 DSC thermograms showing the effect of increasing milling time for the equiatomic Al-Ti alloy powder formed into pellets
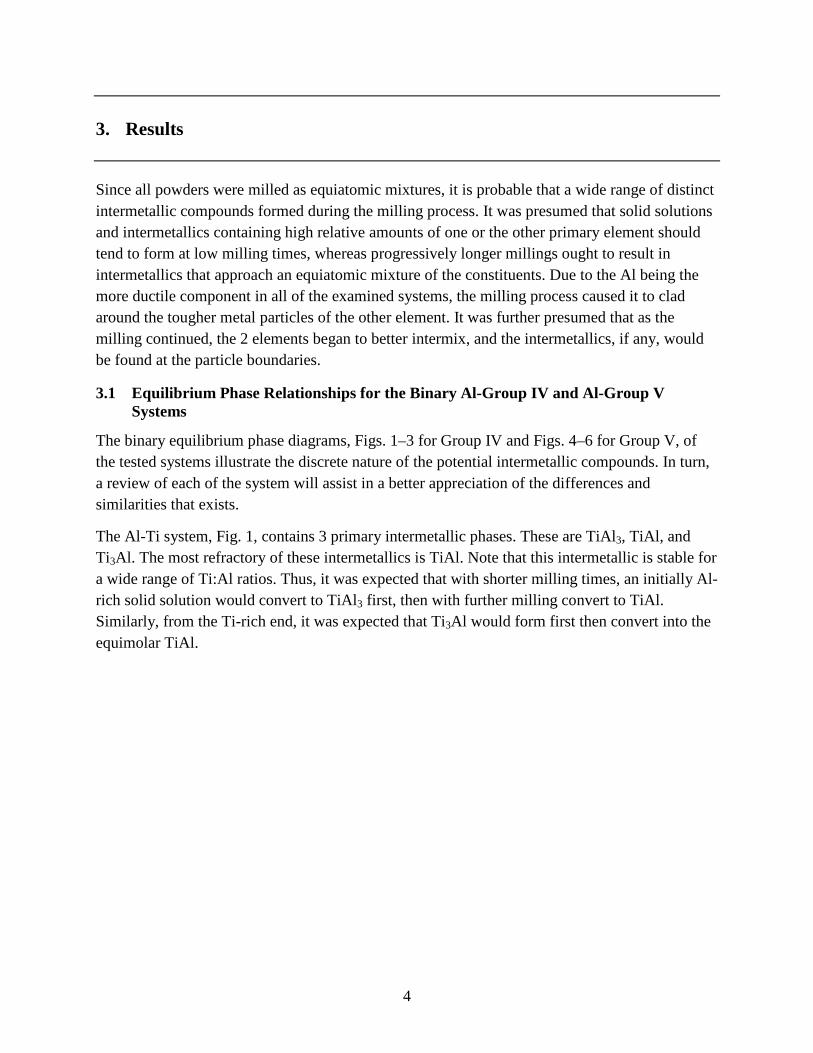
3.2.2 Al-Zr System
To evaluate the behavior of the Al-Zr system, 2 powdered and 2 green compact samples were tested in the DSC. Of the 2 powders, for the sample that underwent 3 min of milling, the blue trace in Fig. 9 shows that the onset of a small endothermic reaction occurs at 645 °C. The endotherm peaks at 648 °C and transitions to a slightly larger exotherm that peaks at 652 °C. After these 2 events, there seems to be a broader or extended endotherm, which starts at 660 °C and develops into a plateau with a peak at 688 °C. The overall process appears to cease at 720 °C and the DSC signal returns to background levels by 730 °C. In contrast, in the Al-Zr sample subjected to 15 min of milling, the red trace in Fig. 9 shows that the process starts off with a lower temperature, shallow, symmetrically shaped, exotherm at 500 °C, peaking at 518 °C. This peak transitions to a long, possibly 2 to 3 endotherms convoluted and drawn out plateau, which has a broad peak at 630 °C. There is a slight drop at 670 °C and a separate endotherm that peaks at 687 °C. In this case, compared to the prior case, the reaction appears to cease at a lower temperature of 700 °C and the signal returns to background levels by 710 °C. Recall from the phase diagram that there are a high number of Zr-rich Al-Zr intermetallics, all of which could form via solid state diffusion. Additionally, the initial Al-rich intermetallic to form in this system, initiates as a solid-solid reaction and continues as a solid-liquid reaction until completion (Song et al. 2008). As such, the broad plateaus may be a manifestation of these reactions.

14
Unlike the powdered samples, the 2 Al-Zr pellets, possibly due to a more intimate contact between the Al and Zr precursors, exhibit a stronger thermal response. Figure 10 shows that the 3-min pellet contains 2 fairly large exotherms with peaks at 572 and 652 °C, respectively. Additionally, there is an asymmetric endotherm centered around 735 °C. After 15 min of milling, the thermal response changes, similar to that observed in the 15-min powder sample. Specifically, there are 2 partially convoluted peaks, at 510 °C; each peak is located at 503 or 515 °C, respectively. There are 2 endotherms at 650 and 730 °C, respectively. Note that the first endotherm is rather small.
Fig. 9 DSC thermograms of the equiatomic Al-Zr alloy powder at 3 and 15 min of milling time
15
Fig. 10 DSC thermograms showing the effect of increasing milling time for the equiatomic Al-Zr alloy powder formed into pellets
3.2.3 Al-Hf System
At the time of this report for the Al-Hf system, only the powder sample testing was completed. Figure 11 shows the 3- and 15-min milled powders reveal that within a short time frame, milling can significantly render the reactivity of this powder mixture minimal. In particular, the 3-min sample, the blue trace in Fig. 11, shows an endothermic reaction that begins just prior to 646 °C and peaked at 654 °C. Subsequently, there is an exotherm peak at 662 °C and the reaction appears to cease at 700 °C with the DSC signal returning to its baseline value around 710 °C. In contrast, the 15-min milled Al-Hf powder sample, the red trace in Fig. 11, was unique among the DSC tests because it has the least discernible reaction. There appears to be 2 slight exotherms at 605 and 750 °C, respectively.
16
Fig. 11 DSC thermograms of the equiatomic Al-Hf alloy powder at 3 and 15 minutes of milling time
3.2.4 Al-V System
For the Al-V system both powdered and green compacted samples were tested. In Fig. 12, the DSC thermogram of the 3- and 15-min milled samples, respectively, reveals a reversal in reactivity. For the 3-min milled Al-V powder, the blue curve in Fig. 12, a large endothermic peak with a slight exothermic recovery was observed. The endothermic event begins at 652 °C and reaches a peak at 662 °C. Note that this endotherm is similar in width and magnitude to the 3-min milled Al-Ti sample. Additionally, the high-temperature shoulder of this endothermic peak seems to be below the baseline signal; its position is at 667 °C. Within 30 °C, the DSC signal returns to its baseline value. There also appears to be a small endothermic disturbance at 728 °C. Unlike the 3-min sample, the characteristic of the 15-min milled Al-V powder, the red curve in Fig. 12, appears to be quite different. It has an exotherm that peaks at 662 °C, interrupted by a small endotherm at 657 °C. Then there is a much larger secondary exothermic reaction, peaking at 663 °C. The exotherm appears to cease at around 680 °C. Again, there is a pair of small endothermic and exothermic peaks centered at 730 °C.
17
The transition from an endo- to exothermic reaction type for this system, observed in the powdered samples, is also reflected in the compacted samples. As shown in Fig. 13, for the 1-, 3-, and 5-min milling times, the previously observed small endothermic offset is present. However, in the 10- and 15-min samples it is no longer present. In each exotherm there is a high-temperature shoulder extending the heat release process over a 50 °C temperature range. It may also be noted that both the peak width and magnitude of the exotherms decrease with milling time.
Fig. 12 DSC thermograms of the equiatomic Al-V alloy powder at 3 and 15 min of milling time
18
Fig. 13 DSC thermograms showing the effect of increasing milling time for the equiatomic Al-V alloy powder formed into pellets
3.2.5 Al-Nb System
For the Al-Nb system, both powdered and green compacted samples were tested. The comparison of the 3- and 15-min milling time powder samples in Fig. 14 shows a notable difference. This is the appearance of a broad exothermic peak at 671 °C on the high-temperature side of the endothermic peak. The mostly symmetric and relatively narrow endotherms (blue or red traces) are centered on 660 and 650 °C, respectively. Note that the 15-min milling sample signal is also slightly smaller.
The Al-Nb green compact samples generally follow the same trend as that observed with the powder samples. As shown in Fig. 15, however, unlike that of the powder samples, the DSC traces in all of the compacted samples contain a high-temperature shoulder sometime extending as high as 870 °C. With increasing milling time, the end position of this shoulder decreases from 870 to 841, 800, 762, to 717 °C. Otherwise, it is interesting to note that at 1-, 3-, and 5-min milling time, the initial thermal event is entirely endothermic. At 10 min, the high-temperature side of the endothermic peak definitely shows an exothermic bump, which is followed by the extended shoulder. At 15 min, the magnitude of the exothermic bump on the high-temperature side, exceeds that of the endotherm. The shoulder is considerably shorter as well. It is speculated that the total energy released is probably conserved accounting for the earlier return to the baseline.

19
Fig. 14 DSC thermograms of the equiatomic Al-Nb alloy powder at 3 and 15 minutes of milling time
Fig. 15 DSC thermograms showing the effect of increasing milling time for the equiatomic Al-Nb alloy powder formed into pellets

20
3.2.6 Al-Ta System
The Al-Ta system results were similar to those of the Al-Nb results. Both powdered and green compacted samples were tested. For the 3-min milled Al-Ta, the blue trace in Fig. 16, the endothermic reaction begins at 644 °C and peaks at 652 °C. There is no apparent exotherm or further reaction and the signal returns to its baseline level rapidly. The Al-Ta powder that received 15 min of milling time, the red trace in Fig. 16, has a small endothermic reaction with an onset temperature of about 645 °C. The peak, located at 652 °C, transitions to a shallow exotherm that ceases at 700 °C.
For the compacted Al-Ta samples, see Fig. 17, the DSC traces reveal a similar trend to what was observed with the Al-Nb samples. In each case, there is primarily an endothermic peak, which has an extended high-temperature exothermic shoulder. The width of this relatively flat shoulder decreases with increasing milling time. The end point of this shoulder for 1 min of milling is at 820 °C, 3 min of milling is at 800 °C, 5 min of milling is at 790 °C, 10 min of milling is around 760 °C, and 15 min of milling is at 738 °C. Additionally, superimposed on the shoulder, starting with the 3-min milled sample, an extra exothermic peak centered at 678 °C appears. The magnitude of this exotherm increases with milling time while the magnitude of the endothermic peak decreases.
Fig. 16 DSC thermograms of the equiatomic Al-Ta alloy powder at 3 and 15 minutes of milling time.

21
Fig. 17 DSC thermograms showing the effect of increasing milling time for the equiatomic Al-Ta alloy powder formed into pellets
3.3 X-ray Diffraction Analysis of the Al-X Powder Mixtures
As initially conceived, the XRD analysis was to be performed on the as-milled powders. However, this approach was revised in favor of working with 3-mm-diameter compacted specimens when the 15-min milled Al-V sample reacted during the mounting preparation. Specifically, the sample began to smoke shortly after 250 mg of powder was poured out onto a “low background” silicon (Si) wafer. Once smoking began, the sample started to glow increasingly bright, reaching a white-hot appearance, indicating a very high-surface temperature, approaching 1,300 °C. This reaction occurred in a time span of about 15 s.
After the reaction, analysis of this sample indicated that the entire sample did not react; from a visual inspection it seemed that the reaction was limited to the surface and only to a slight depth. The smoke was presumed to be from the ignition of stearic acid in the sample. Most likely the ultrafine powder, with a much larger surface area and being more sensitive to oxidation, had an increased reactivity. In turn, because of the presence of such a side oxidation reaction, the reactant-to-product conversion threshold was thus also lowered causing the easier formation of the product intermetallics as well.
The observed peaks in an XRD scan are directly related to the long-range translational symmetry and orientation of the crystalline structure of grains in such a way that they satisfy the Bragg equation. Typically, texturing, that is, a nonuniform distribution of certain crystallographic orientations was not expected to be introduced during the short-duration light ball milling or the

22
pellet forming compaction procedure. As such, all nominal peaks from the constituent elements in each mixture were expected to appear. Also, some of the product phases were expected be detected unless they did not form during the milling process.
However, it must be noted that in a mechanically alloyed powdered sample, there are many, sufficiently small grains that no longer have long-range periodicity. Consequently, it is expected that such disordered grains will cause deviations from the ideal diffraction condition, resulting in a broadening of each Bragg peak. Furthermore, all of these grains have been refined in size and subjected to extensive deformation and may contain considerable residual strain. If any of the atoms are forced into another crystal lattice during mechanical alloying, there will be a distortion in the lattice and a consequent change in the lattice parameter causing a shift in the Bragg peak positions. Thus, a combination of these factors will lead to not only a broadening, but also to a potential shift of each Bragg peak. Though, since the various Al-X elemental powders were milled for the same length of time, it was assumed that the amount of strain built up in all of the samples would also be roughly the same and the extent of broadening would be similar across each of the systems.
For each system, a series of 3 graphs are displayed, plotted at increasing resolution to reveal the broadening and shifting of peaks indicative of alloying and the possible formation of intermetallics, if any. Note that due to some alignment and positioning of the top surface of the green compact on the XRD stage, there may occasionally be a systemic shift in the background level and peak positions. That is, an occasional outlier data set should not be misinterpreted from the general behavioral trend for each system.
3.3.1 Al-Ti System
Prior work on the Al-Ti system has indicated that relatively light milling creates disordered intermetallic phases while lengthy milling induces a transformation into solid solution phases, and that the formation of the metastable intermetallics is driven by further chemical disordering, i.e., mixing (Klassen et al.1997). Note that the absence of additional peaks with appreciable intensities is indicative that there is no significant presence of intermetallics; however, minor interfacial alloying between the constituent elements cannot be ruled out.
Figure 18 displays the complete scan for a 2-Theta scattering angle range from 20° to 120° for the Al-Ti samples. Additionally, in Fig. 19 an enlarged view of the data from 30° to 50° scattering angle are shown. In Fig. 20 the primary and most intense Ti and Al peaks at roughly 38.5° and 40.2° scattering angle are displayed. Actually, at 38.5° there is an overlap of peaks from Al and Ti. In the overall scan, with increasing milling time, the individual Bragg peaks become broader and less intense. It is also apparent that the 5- and 15-min pellets have a higher baseline. Note that they are slightly shifted to a lower scattering angle. These shifts are most likely attributed to a displacement error between 2 different types of sample holders used (a plain quartz and a Si “low-background” wafer); the corresponding change in the average background

23
count was due to the difference between mounting platform thicknesses. (With the peak shift and background change accounted for, the 2 samples can be safely compared.)
Even though it is known that the Al and Ti peaks essentially overlap, in Fig. 20, it is obvious that with increasing milling time, the peaks undergo a definite broadening indicative of a strain build up as well as a concomitant reduction of the grain size of the constituents.
Fig. 18 XRD scan of the equiatomic Al-Ti alloy pellets with increasing milling time. The anticipated Bragg reflections from the constituent elements are included in the figure for reference.

24
Fig. 19 Enlarged view of the XRD scans of the equiatomic Al-Ti alloy pellets with increasing milling time. The anticipated Bragg reflections from the constituent elements are included in the figure for reference.
Fig. 20 Enlarged view of the most intense Bragg peaks, Ti(002), Al(111), and Ti(011), respectively, from
the equiatomic Al-Ti alloy pellets with increasing milling time. The nominal positions of the Ti(002), Al(111), and Ti(011) peaks appear at 38.40°, 38°, 47°, and 40.16°, respectively.

25
3.3.2 Al-Zr System
Figures 21–24 display, at increasing resolution, the XRD scans from the Al-Zr system with increasing milling time. Figure 21 displays the complete scan for a 2-Theta scattering angle range from 20° to 120° for the Al-Zr samples. Additionally, in Fig. 22, an enlarged view of the data from 30° to 50° scattering angle is shown. In Figs. 23 and 24, the primary, most intense Zr and Al peaks at roughly 32°, 34.8°, 36.5° and 38.5° scattering angle are displayed. Generally, similar effects are observed as those noted for the Al-Ti system. These include an overall peak broadening with milling time as well as decreasing peak intensity. However, unlike that in the Al-Ti system, in the Al-Zr system there is clear evidence that there are additional peaks present that are not attributed to the primary constituent elements. Similarly, with time, especially at 15 min, individual peaks attributed to each species appear to broaden and converge. This may be indicative of the onset of solid solution or intermetallic formation with the extreme reduction of the interspacing between species.
The 3 primary Zr Bragg peaks occur at 31.96°, 34.84°, and 36.51°; these correspond to the (100), (002), and (011) planes, respectively. The nominal position of the primary (111) Al peak is expected at 38.47° and, as seen in the figures, it does not overlap. But, more specifically, as shown in Figs. 21 and 22, both sets of peaks broaden with milling time. There is a clearly noticeable peak shift with milling time that should be disregarded. Most likely, this is attributed to the inconsistent position of the specimen holder from one sample to another. That is, if it was always in the proper position, the (111) Al peak should appear at roughly at 38.5°, but it appears for the 1- and 3-min pellets at 38.5°, and at 38.3° for the 5- and 10-min pellets. Corresponding peak shifts for Zr peaks are considerably greater. Unfortunately, taking this effect into consideration prevents the ability to identify a systematic peak shifts, and therefore, evidence of alloying between Al and Zr. However, there is a definite broadening with milling time indicative of a gradual size reduction of the powder particles.
26
Fig. 21 XRD scans of the equiatomic Al-Zr alloy pellets with increasing milling time. The anticipated Bragg reflections from the constituent elements are included in the figure for reference.
Fig. 22 Enlarged view of the XRD scans of the equiatomic Al-Zr alloy pellets with increasing milling time. The anticipated Bragg reflections from the constituent elements are included in the figure for reference.

27
Fig. 23 Enlarged view of the first of the 3 most intense Zr Bragg peaks, corresponding to the Zr(001) reflection, from the equiatomic Al-Zr alloy pellets with increasing milling time. The nominal position of this peak appears at 31.96°.
28
Fig. 24 Enlarged view of the other 2 of the 3 most intense Zr Bragg peaks nominally at 34.84° and 36.51° corresponding to the (002) and (011) reflections, from the equiatomic Al-Zr alloy pellets with increasing milling time. Nominally, the position of the Al(111) peak occurs at 38.47°.
3.3.3 Al-Hf System
Figures 25–27 display at increasing resolution the XRD scans from the Al-Hf system with increasing milling time. Figure 25 displays the complete scan for a 2-Theta scattering angle range from 20° to 120° for the Al-Hf samples. Additionally, in Fig. 26, an enlarged view of the data from 30° to 50° scattering angle is shown. Then, in Fig. 27, the primary, most intense Hf(100), Hf(002), and Hf(101), and Al(111) peaks at roughly 32.32°, 35.44°, 36.99°, and 38.47° scattering angle are displayed, respectively. In Fig. 27, the peak positions of Hf show that, as with the other systems, there was a mismatch between the sample holder and background wafer. Although the 15-min pellet is an outlier, the main Al peak gradually broadens and diminishes with milling time. More importantly, these scans, unlike those described previously, show the evolution of new peaks and not just the broadening or shifting of existing peaks. That is, while the main Al peak disappears indicative of alloying, at the same time, the scan shows, especially at long milling times, the appearance and growth of new peaks at 50° and 65°. For example, the scan clearly shows that at roughly 33.2°, there is no peak at 1, 3, and 5 min of milling time, but one appears at 10 min and 15 min. The small peak at 33.2° may correspond to one of the numerous Al-Hf intermetallic peaks. There are additional peaks at higher scattering angles that may be attributed to such intermetallics.

29
Fig. 25 XRD scans of the equiatomic Al-Hf alloy pellets with increasing milling time. The anticipated Bragg reflections from the constituent elements are included in the figure for reference.
Fig. 26 Enlarged view of the XRD scans of the equiatomic Al-Hf alloy pellets with increasing milling time. The anticipated Bragg reflections from the constituent elements are included in the figure for reference.

30
Fig. 27 Enlarged view of the first of the 3 most intense Hf Bragg peaks Hf(100), Hf(002), and Hf(101), from the equiatomic Al-Hf alloy pellets with increasing milling time. The nominal positions of these peaks appear at 32.32°, 35.44°, and 36.99°. Nominally, the position of the Al(111) peak occurs at 38.47°.
3.3.4 Al-V System
Figures 28–30 display at increasing resolution the XRD scans from the Al-V system with increasing milling time. Figure 28 displays the complete scan for a 2-Theta scattering angle range from 20° to 120° for the Al-V samples. Additionally, in Fig. 29, an enlarged view of the data from 30° to 50° scattering angle is shown. Then, in Fig. 30, the primary most intense V(110), Al(111), and Al(200) peaks at roughly 42.17°, 38.47°, and 44.74° scattering angle are displayed, respectively. The Ti Group metals all have hexagonal close-packed crystal structures, the Nb Group metals are all body-centered cubic. As such, in these systems there are fewer Bragg peaks. In Figs. 28–30, the peak positions of the 5-min pellet for V show that, as with the other systems, occasionally there was a mismatch between the sample holder and background wafer. For the 5-min pellet this mismatch was so large, the scan was repeated.
In Fig. 30, both the single V and the 2 Al peaks nicely illustrate the monotonic decrease of both sets of peak intensities and concomitant broadening with milling times. The rates of decrease seem to be similar. A careful examination of the scans also show no additional peaks, which may be caused by the formation and presence of intermetallics.
31
Fig. 28 XRD scans of the equiatomic Al-V alloy pellets with increasing milling time. The anticipated Bragg reflections from the constituent elements are included in the figure for reference.
Fig. 29 Enlarged view of the XRD scans of the equiatomic Al-V alloy pellets with increasing milling time. The anticipated Bragg reflections from the constituent elements are included in the figure for reference.
32
Fig. 30 Enlarged view of the first of the most intense V Bragg peak, corresponding to the V(100) reflection, from the equiatomic Al-V alloy pellets with increasing milling time. The nominal position of this peak appears at 42.17°. Nominally, the positions of the Al(111) and Al(002) peaks occur at 38.47° and 44.74°.
3.3.5 Al-Nb System
Figures 31–33 display at increasing resolution the XRD scans from the Al-Nb system with increasing milling time. Figure 31 displays the complete scan for a 2-Theta scattering angle range from 20° to 120° for the Al-Nb samples. Additionally, in Fig. 32, an enlarged view of the data from 30° to 50° scattering angle is shown. Then, in Fig. 33, the primary, most intense Nb(110) and Al(111) peaks at 38.5° are displayed.
No sample positioning displacement errors exist for the Al-Nb samples. All observed peaks clearly corresponded to either of the component metals, and no major intermetallic peaks were found in any of the samples. The single broad peak, as shown in Fig. 33, corresponding to the overlapping Al and Nb peaks, at 38.6° is within 0.1° of the nominal value. It is interesting to note a discernible shift of this peak to lower scattering angles. This may be an indication of possible alloying of the elements. Unlike the other samples, extended milling time appeared to result in a consistent retention of the Nb peak intensities. This is especially clear when they occur alone and without overlap with a nearby Al peak (see Fig. 34). In contrast, the isolated Al peaks broaden and diminish. This may also indicate that Al is possibly being mixed into the Nb lattice structure. This behavior is definitely different from that seen in the other samples. Prior work has shown that the formation of Al-Nb compounds enriched in Nb always occurs through a supersaturated solid solution formation stage (Portnoy et al. 2004). Another indication of potential intermetallic
33
formation is present in Fig. 32; wherein, there are 2 small peaks on the 10- and 15-min sample scans at 35° and 37°, respectively. This confirms that extended milling times do indeed start showing intermetallic formation.
Fig. 31 XRD scans of the equiatomic Al-Nb alloy pellets with increasing milling time. The anticipated Bragg reflections from the constituent elements are included in the figure for reference.
34
Fig. 32 Enlarged view of the XRD scans of the equiatomic Al-Nb alloy pellets with increasing milling time. The anticipated Bragg reflections from the constituent elements are included in the figure for reference.
Fig. 33 Enlarged view of the most intense Nb Bragg peak, corresponding to the Nb(110) reflection, from the equiatomic Al-Nb alloy pellets with increasing milling time. The nominal position of this peak appears at 38.51°. Nominally, the position of the Al(111) peak occurs at 38.47°.
35
Fig. 34 Enlarged view of the second most intense Nb Bragg peak, corresponding to the Nb(200) reflection, from the equiatomic Al-Nb alloy pellets with increasing milling time. The nominal position of this peak appears at 55.59°.
3.3.6 Al-Ta System
Figures 35–37 display at increasing resolution the XRD scans from the Al-Ta system with increasing milling time. Figure 35 displays the complete scan for a 2-Theta scattering angle range from 20° to 120° for the Al-Ta samples. Additionally, in Fig. 36, an enlarged view of the data from 30° to 50° scattering angle is shown. Then, in Fig. 37, the primary, most intense Ta(110) and Al(111) peaks at 38.5° are displayed.
The behavior of Al-Ta is very similar to that of Al-Nb. That is, with increasing milling time, the Al peak intensities diminish while the Ta peak intensities are retained (see Figs. 37 and 38). Despite a slight mismatch between sample holder and background wafer, in Figs. 35 and 36, all of the Bragg peaks were clearly identified as being either Al or Ta; the few potential intermetallic peaks fell in the immediate vicinity of one of the constituent metals, so there is only a weak indication of intermetallic formation.

36
Fig. 35 XRD scans of the equiatomic Al-Ta alloy pellets with increasing milling time. The anticipated Bragg reflections from the constituent elements are included in the figure for reference.
Fig. 36 Enlarged view of the XRD scans of the equiatomic Al-Ta alloy pellets with increasing milling time. The anticipated Bragg reflections from the constituent elements are included in the figure for reference.
37
Fig. 37 Enlarged view of the most intense Ta Bragg peak, corresponding to the Ta(110) reflection, from the equiatomic Al-Ta alloy pellets with increasing milling time. The nominal position of this peak appears at 38.47°. The position of the Al(111) peak also occurs at this angle.
Fig. 38 Enlarged view of the second most intense Ta Bragg peak, corresponding to the Ta(200) reflection, from the equiatomic Al-Ta alloy pellets with increasing milling time. The nominal position of this peak appears at 55.55°.
38
3.4 SEM Analysis of the Al-X Powder Mixtures
Operating the SEM in backscattered electron mode was most suitable for the evaluation of the Al-X samples. Backscattered electron images are better suited than secondary electron images as the secondary electrons, ejected from the surface, are not collected and thus topographical surface features do not add to the image content. However, the inherent atomic number contrast allowed an easy evaluation of the constituent phases and corresponding interfacial regions between them. This is because elements of higher atomic numbers with larger atomic cores reflect greater numbers of backscattered electrons. Thus, usually, the Al metal uniformly appeared as the dark grey region in the SEM images, while the higher atomic number companion metal appeared off-white, or significantly lighter the interfacial regions appeared as shades of grey in between.
While all of the samples were examined, only the 3- and 15-min milling times are discussed in the main body of the report. The images for the other milling times are included in the Appendix for reference.
3.4.1 Al-Ti System
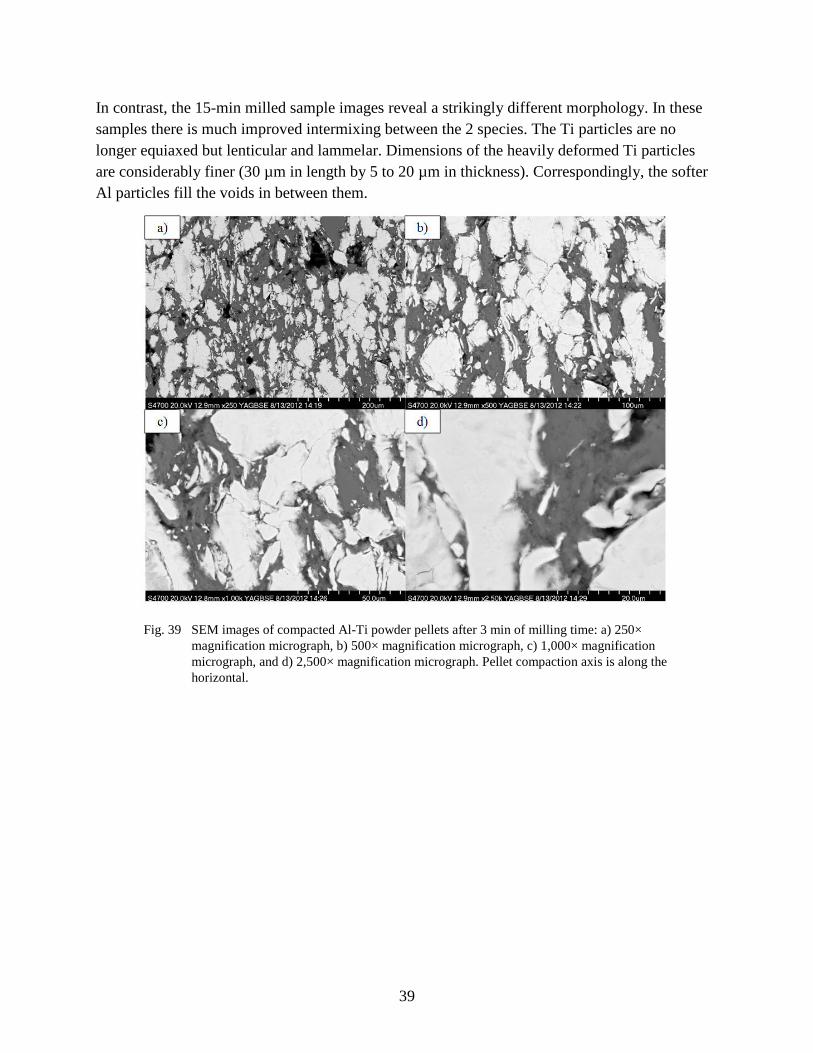
As shown in Figs. 39 and 40, the morphology of the as-milled Al-Ti samples reveals a gradual break down of the more refractory companion metal, Ti. The initial particle size of the Ti particles consisted of a roughly bimodal distribution with particle fines of 1 to 2 µm and 20 to 40 µm. Figure 39 a), b), c), and d) shows the lightly milled 3-min sample at successive magnifications of 250×, 500×, 1,000×, and 2,500×, respectively. Figure 40 a), b), c), and d) shows the equivalent micrographs of the heavily milled 15-min sample at the same respective magnifications. The black areas on the lightly milled images are either voids or embedded diamond polishing media that was trapped in the softer Al during polishing. As a general trend, the lightly milled samples did not polish as well as the heavily milled samples. Using energy dispersive X-ray spectroscopy (EDS) techniques, there appeared to be little or no evidence of the milling process forming intermetallics. Furthermore, there was no distinct transition layer at the particle-particle interfaces at these magnifications, despite XRD potentially hinting otherwise.
In the series of the 3-min milled sample images, the softer Al particles deform and completely surround the equiaxed, from 20- to 30-µm Ti particles, were occasionally found as agglomerates. Smaller fragments visible in the images illustrate that there is an onset to the fragmentation of these particles. Additionally, the onset of plastic deformation is observed in the jagged appearance of the Ti particles. According to wide-area EDS analysis, the compact retained the initial equiatomic ratio of the 2 constituents; though, some areas were Al rich.
39
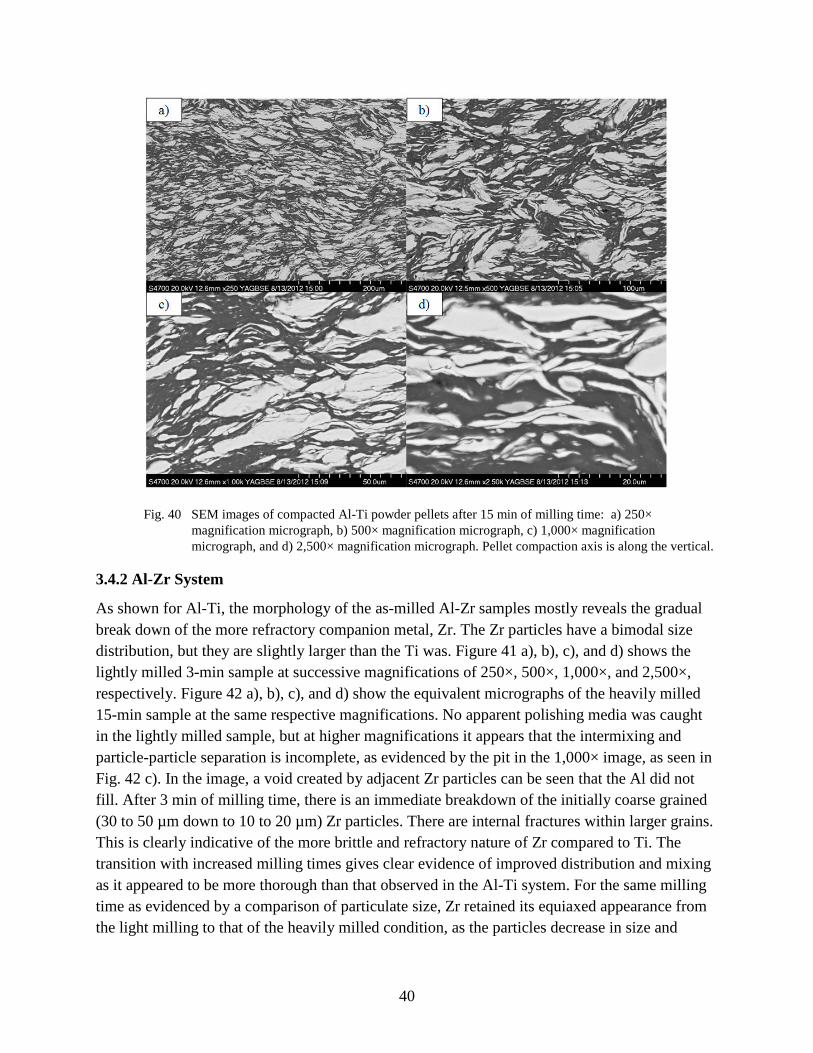
In contrast, the 15-min milled sample images reveal a strikingly different morphology. In these samples there is much improved intermixing between the 2 species. The Ti particles are no longer equiaxed but lenticular and lammelar. Dimensions of the heavily deformed Ti particles are considerably finer (30 µm in length by 5 to 20 µm in thickness). Correspondingly, the softer Al particles fill the voids in between them.
Fig. 39 SEM images of compacted Al-Ti powder pellets after 3 min of milling time: a) 250× magnification micrograph, b) 500× magnification micrograph, c) 1,000× magnification micrograph, and d) 2,500× magnification micrograph. Pellet compaction axis is along the horizontal.
40
Fig. 40 SEM images of compacted Al-Ti powder pellets after 15 min of milling time: a) 250× magnification micrograph, b) 500× magnification micrograph, c) 1,000× magnification micrograph, and d) 2,500× magnification micrograph. Pellet compaction axis is along the vertical.
3.4.2 Al-Zr System
As shown for Al-Ti, the morphology of the as-milled Al-Zr samples mostly reveals the gradual break down of the more refractory companion metal, Zr. The Zr particles have a bimodal size distribution, but they are slightly larger than the Ti was. Figure 41 a), b), c), and d) shows the lightly milled 3-min sample at successive magnifications of 250×, 500×, 1,000×, and 2,500×, respectively. Figure 42 a), b), c), and d) show the equivalent micrographs of the heavily milled 15-min sample at the same respective magnifications. No apparent polishing media was caught in the lightly milled sample, but at higher magnifications it appears that the intermixing and particle-particle separation is incomplete, as evidenced by the pit in the 1,000× image, as seen in Fig. 42 c). In the image, a void created by adjacent Zr particles can be seen that the Al did not fill. After 3 min of milling time, there is an immediate breakdown of the initially coarse grained (30 to 50 µm down to 10 to 20 µm) Zr particles. There are internal fractures within larger grains. This is clearly indicative of the more brittle and refractory nature of Zr compared to Ti. The transition with increased milling times gives clear evidence of improved distribution and mixing as it appeared to be more thorough than that observed in the Al-Ti system. For the same milling time as evidenced by a comparison of particulate size, Zr retained its equiaxed appearance from the light milling to that of the heavily milled condition, as the particles decrease in size and

41
become more uniformly distributed among the Al easily deformable Al particles. The heavily milled Al-Zr sample had a more mixed appearance based on resultant particle size and homogeneity. The uniform dispersion makes the compaction direction difficult to distinguish. EDS analysis indicated that both samples retained roughly the equiatomic ratio within the samples. Once again, there was no observable evidence of a milling induced intermetallic boundary layer between the elemental constituents.
Fig. 41 SEM images of compacted Al-Zr powder pellets after 3 min of milling time: a) 250× magnification micrograph, b) 500× magnification micrograph, c) 1,000× magnification micrograph, and d) 2,500× magnification micrograph. Pellet compaction axis cannot be determined from the micrographs.

42
Fig. 42 SEM images of compacted Al-Zr powder pellets after 15 min of milling time: a) 250× magnification micrograph, b) 500× magnification micrograph, c) 1,000× magnification micrograph, and d) 2,500× magnification micrograph. Pellet compaction axis cannot be determined from the micrographs.
3.4.3 Al-Hf System
As shown for the other systems, the morphology of the as-milled Al-Hf samples mostly reveals the gradual break down of the more refractory companion metal, Zr. Even by the 1- to 3-min mark, the Hf particles develop a bimodal size distribution, but they are slightly larger than the Ti was. Mechanically alloying induced internal fissures and cracks within the large particles create smaller fragments that separate and disperse in the softer Al. Figure 43 a), b), c), and d) are of the lightly milled 3-min sample at successive magnifications of 250×, 500×, 1,000×, and 2,500×, respectively. Figure 44 a), b), c), and d) shows the equivalent micrographs of the heavily milled 15-min sample at the same respective magnifications.
Occasional polishing defects are evident in the micrograph, Fig. 43 a), of the lightly milled sample as evidenced by the diamond media trapped in the sample, the black spots and the particle pull-out that appears in the same. The Hf particles look coarse under light milling and attain a more lenticular appearance with heavy milling. There is large-scale mixing in this system, but it does not look as refined as that in the Al-Zr system. SEM-based inspection of the

43
Al-Hf interface did not reveal an intermetallic boundary layer; though, XRD clearly indicated otherwise in the heavily milled sample. Energy Dispersive X-ray Spectroscopic (EDS) analysis showed that the samples retain their equiatomic distribution of the elements.
Fig. 43 SEM images of compacted Al-Hf powder pellets after 3 min of milling time: a) 250× magnification micrograph, b) 500× magnification micrograph, c) 1,000× magnification micrograph, and d) 2,500× magnification micrograph. Pellet compaction axis along the horizontal.

44
Fig. 44 SEM images of compacted Al-Hf powder pellets after 15 min of milling time: a) 250× magnification micrograph, b) 500× magnification micrograph, c) 1,000× magnification micrograph, and d) 2,500× magnification micrograph. Pellet compaction axis along a diagonal.
3.4.4 Al-V System
The Al-V system was also examined under light and heavy milling conditions, respectively. Figure 45 a), b), c), and d) shows the lightly milled 3-min sample at successive magnifications of 250×, 500×, 1,000×, and 2,500×, respectively. Figure 46 a), b), c), and d) shows the equivalent micrographs of the heavily milled 15-min sample at the same respective magnifications. Once again, polishing defects are observed in the lightly milled sample evidenced by the diamond media that remained caught on the sample surface. Additionally, there are a few higher atomic number particles in the mixture, most likely, either Ta or N. Unlike Zr or Hf, the V particles do not look as particularly jagged after being lightly milled; they also appear softer after heavy milling. Specifically, once they break down into fines the V particles in the heavily milled sample deform, elongate or stretch into lamella, then they align perpendicular to the compaction force. Energy dispersive X-ray analysis of selected areas showed a shift from the equiatomic toward an Al-rich composition; though, the micrographs in the figures do not confirm that.

45
Fig. 45 SEM images of compacted Al-V powder pellets after 3 min of milling time: a) 250× magnification micrograph, b) 500× magnification micrograph, c) 1,000× magnification micrograph, and d) 2,500× magnification micrograph. Pellet compaction axis is most likely along the horizontal.

46
Fig. 46 SEM images of compacted Al-V powder pellets after 15 min of milling time: a) 250× magnification micrograph, b) 500× magnification micrograph, c) 1,000× magnification micrograph, and d) 2,500× magnification micrograph. Pellet compaction axis along the horizontal.
3.4.5 Al-Nb System
The Al-Nb system was also examined under light and heavy milling conditions, respectively. Figure 47 a), b), c), and d) shows the lightly milled 3-min sample at successive magnifications of 250×, 500×, 1,000×, and 2,500×, respectively. Figure 48 a), b), c), and d) shows the equivalent micrographs of the heavily milled 15-min sample at the same respective magnifications. Polishing defects were seen in the lightly milled sample; this is likely the low atomic number contrast diamond polishing medium (appearing as black areas) that was trapped in the sample. The coarse Nb particles in the lightly milled sample readily break down and deform, behaving more like soft inclusions; with heavy milling, these Nb particles develop into a fibrous texture with thin ribbon-like lamella with very high-aspect ratios. There are still a few large particles intermixed that have not been completely deformed by the action of the milling balls. A direct consequence of this layering process is that the initially nonuniformly dispersed equiaxed Al particles also align themselves along these layers and become uniformly interspersed. As with the preceding systems, interfacial boundary layers are not observed; but, note that in this case, XRD clearly indicated that there were no intermetallics present.
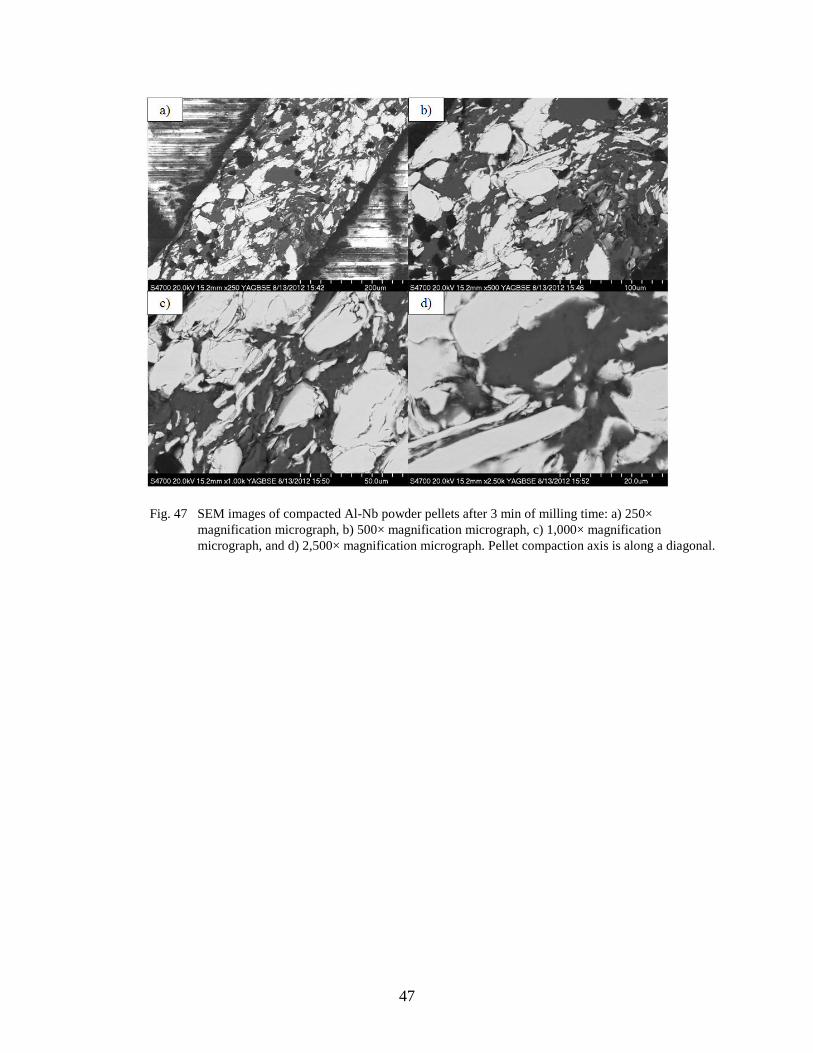
47
Fig. 47 SEM images of compacted Al-Nb powder pellets after 3 min of milling time: a) 250× magnification micrograph, b) 500× magnification micrograph, c) 1,000× magnification micrograph, and d) 2,500× magnification micrograph. Pellet compaction axis is along a diagonal.

48
Fig. 48 SEM images of compacted Al-Nb powder pellets after 15 min of milling time: a) 250× magnification micrograph, b) 500× magnification micrograph, c) 1,000× magnification micrograph, and d) 2,500× magnification micrograph. Pellet compaction axis is most likely along the vertical.
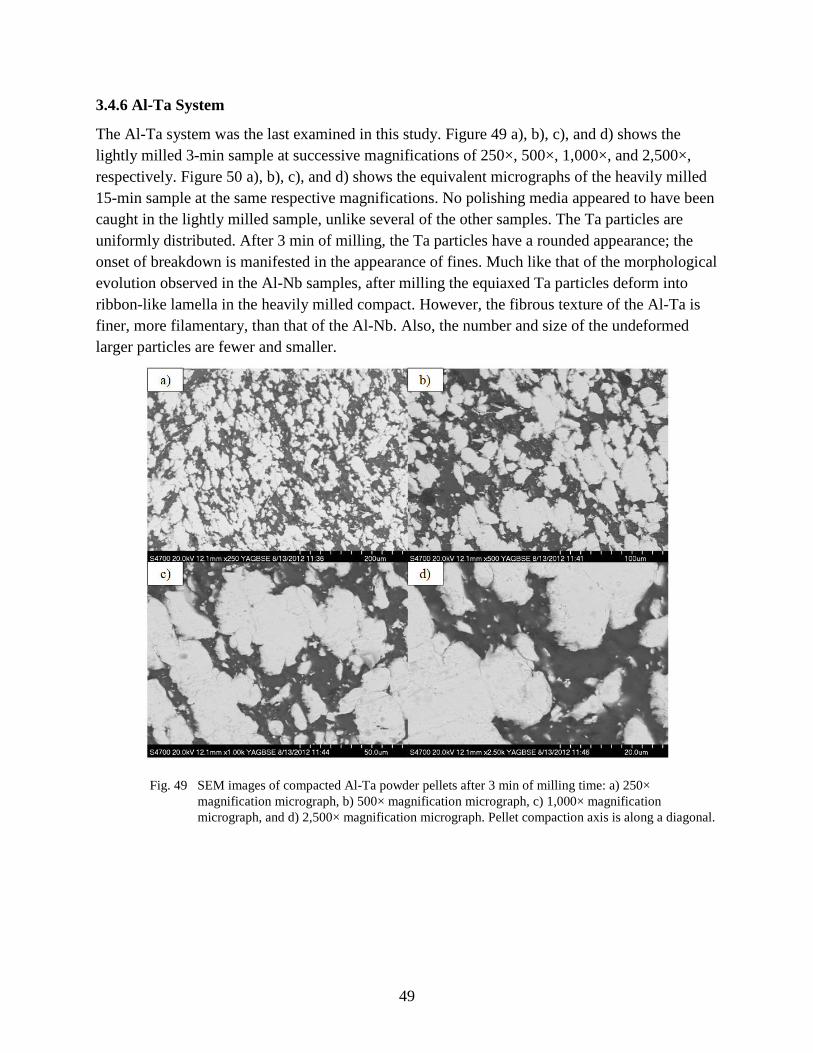
49
3.4.6 Al-Ta System
The Al-Ta system was the last examined in this study. Figure 49 a), b), c), and d) shows the lightly milled 3-min sample at successive magnifications of 250×, 500×, 1,000×, and 2,500×, respectively. Figure 50 a), b), c), and d) shows the equivalent micrographs of the heavily milled 15-min sample at the same respective magnifications. No polishing media appeared to have been caught in the lightly milled sample, unlike several of the other samples. The Ta particles are uniformly distributed. After 3 min of milling, the Ta particles have a rounded appearance; the onset of breakdown is manifested in the appearance of fines. Much like that of the morphological evolution observed in the Al-Nb samples, after milling the equiaxed Ta particles deform into ribbon-like lamella in the heavily milled compact. However, the fibrous texture of the Al-Ta is finer, more filamentary, than that of the Al-Nb. Also, the number and size of the undeformed larger particles are fewer and smaller.
Fig. 49 SEM images of compacted Al-Ta powder pellets after 3 min of milling time: a) 250× magnification micrograph, b) 500× magnification micrograph, c) 1,000× magnification micrograph, and d) 2,500× magnification micrograph. Pellet compaction axis is along a diagonal.
50
Fig. 50 SEM images of compacted Al-Ta powder pellets after 15 min of milling time: a) 250× magnification micrograph, b) 500× magnification micrograph, c) 1,000× magnification micrograph, and d) 2,500× magnification micrograph. Pellet compaction axis is along a diagonal.
4. Discussion
Our combined DSC, XRD, and SEM investigations revealed that it is possible to control the reaction sensitivity of binary Al-based mixtures with Group IV and V elements by increasing the duration of how long the precursors are milled. Particularly, milling improved the level of intermixing between the constituent elements, wherein continued high energy induced size attrition caused the selective breakdown of the more refractory, brittle precursor. In combination with the more compliant deformation of the softer Al, this effect resulted in a significant change in the powder morphology. In turn, the changing spatial distribution of the reactants, more specifically, the reduction of the required diffusion distance, shortened the relative time scale for reaction initiation. That is, when a sufficient impetus was provided, the onset of an exothermic reaction could ensue more rapidly.
Scanning Electron Microscopy (SEM) analysis revealed that longer milling times result in layered to filamentary microstructures with a reduced interspecies spacing by at least an order of magnitude. In the initial stages of milling, the larger refractory metal grains fragmented into

51
smaller pieces. Subsequently, these smaller particles flattened and pancaked and, as they combined with the softer Al particles, a duplex, mostly two-dimensional structure was developed. Consistent with the observed morphological changes, XRD peak profiles became less intense and broader; this was reflective of the effects of alloying (i.e., the incorporation of one species in the other) and reduced crystallite dimensions. The absence of new Bragg peaks was indicative that, for most of the precursor combinations, the chosen milling times did not initiate a run-away in situ reaction. In other words, no clearly identifiable intermetallic species were formed; though, it could still be possible that along the interface there were small concentrations of intermetallics present.
The most intriguing aspect of the collected data was the changing DSC response of the binary combinations. (Note that the DSC responses were collected under controlled heating conditions, which would probably not exist under a run-away scenario, such as that occurring on impact.) In most cases, for the as-blended coarse grained mixtures, the DSC thermograms revealed an endotherm indicative of the Al component melting first, which was then followed by a relatively sharp exothermic response. This could be interpreted as a stepwise process, essentially, being controlled by the liquid-solid reaction front moving between the 2 species. However, it was noted that, with milling, the initial endotherm became less and less pronounced to disappearing completely and usually resulting in a broad exotherm, corresponding to a solid-solid reaction directly forming the product phases. That is, the exothermic heat release was no longer instantaneous but became more representative of a diffusion limited process, occurring more slowly over a much wider temperature range.
The transition from one reaction mode to another is rather important. Not only does it imply that the rate of energy release mechanism is different, but it also implies that there may be an optimum length scale for maximizing the energy output from each binary combination. That is, neither the under-milled nor the over-milled powder blends would be preferable under ideal circumstances. Specifically, an under-milled blend would take too much energy to initiate, while an over-milled blend would not release sufficient energy. (This of course assumes that the main source of energy is from the intermetallic formation reaction and no side reactions [e.g., oxidation] contribute during the heat release.)
Despite these general trends observed in the milling process from 3 to 15 min, SEM comparisons between the binary systems revealed several significant differences as well. Whereas the Group IV elements of Ti, Zr, and Hf tended to be more brittle, more often leading to an equiaxed morphology, the Group V elements of V, Nb, and Ta were considerably softer giving rise to a layered to filamentary morphology. Aside from the ease of breakdown and fragmentation, the tendency to develop an elongated, layered, or filamentary morphology increased down each column or group; though, some of the binary combinations did not follow this trend. For example, blends with Zr or V remained more equiaxed than the others. In turn, it may be noted that the inability to reduce the interspecies spacing could possibly result in a less effective control of the reactivity of that blend. That is, it is conceivable that a more equiaxed morphology
52
is not as reactive as a two-dimensional layered structure wherein one dimension for interdiffusion is significantly shorter than any other.
Additionally, several specific correlations may be made between the DSC and XRD tests regarding the effectiveness of milling time on the mixture reactivity and potential formation of various intermetallics. Usually, the reactivity of the binary mixture increased moving down in a group. Also, as indicated by the decrease of the endothermic peak height or, conversely, the increase of the exothermic peak height, the reactivity of Group IV binary compositions was greater than that of Group V. However, the exothermic reactions of Group V binary compositions were broader and tended to extend to higher temperatures.
The data generated by the Al-Ti samples indicated that increasing levels of milling initially result in fragmentation then later in the elongation of the Ti particles. The changing and growing aspect ratio effectively reduces and removes the endothermic reaction as well as broadens the exothermic reaction while lowering its onset temperature.
Milling of the Al-Zr system resulted in transforming the endothermic and exothermic reaction profile as well. During milling, this metal mostly fragmented without developing a lamellar microstructure. As such, the heavily milled morphology was highly isotropic. Compared to Al-Ti, the shift of the exotherm to a lower temperature was considerably greater for Zr. Potentially, because of its greater reactivity, it is conceivable that during milling this composition was more susceptible to the formation of intermetallics; though, XRD analysis was inconclusive in identifying these species.
In the Al-Hf system, the initial pair of distinct endothermic and exothermic peaks was effectively milled away at longer milling times. The heavily milled mixture displays a nearly flat DSC thermogram, which is indicative that little or no reaction took place during heating. Further substantiating this fact is the appearance of new unidentified peaks in the XRD data; though, the primary peaks, attributable to the Al and Hf precursors, represent the plurality of the sample. Thus, overall, it is likely that the heavily milled composition partially reacted to form some intermetallics.
For the Al-V system, the lightly milled mixture presents a primarily endothermic profile, which transitions into a pair of small endothermic and notable exothermic peaks. The thermograms from the intermediate milling times illustrate a gradual transition from a powder blend that is essentially not reactive to one that is sustainable over a broad temperature range. While the deformation of the V particles is not significant, the deformation and breakdown is sufficient to affect a change in the reactivity. Perhaps, this reactivity is entirely a result of the increased number of finer particles in the blend.
Similar to the Al-V system, in the Al-Nb system, the size of the initially observed endothermic peak decreases, and a complementary exothermic peak and shoulder develops with increasing milling times. However, in this case, the shoulder is considerably broader and extends to much

53
higher temperatures. The evolution of the filamentary or lamellar Nb particle morphologies, with an implied decrease in diffusion distances, supports this change in behavior. The XRD data, as a function of milling time indicating decreasing peak amplitudes while becoming broader, also imply that perhaps the Al is preferentially being incorporated in a distorted Nb crystal structure that is reducing the necessary threshold for the reaction to proceed. Prior work done on this system indicates that there is an activation energy associated with the formation of the AlNb2 intermetallic from an amorphous-like elemental mixture that reduces with milling time from 176 to 155 kJ/mol. The activation energy for the transition from AlNb2 to Al3Nb does not change with milling time and stays constant at 242 kJ/mol (Kawanishi et al. 1993).
The appearance and characteristics of the Al-Ta system were rather similar to those of the Al-Nb system. Once again, there is a marked transition from an equiaxed to a filamentary or lamellar morphology for the Ta particles. In turn, this morphological change translates into a shift from an endothermic and exothermic peak pair profile to one that has an extremely broad shoulder extending to high temperatures. The changed DSC profiles are supported by the XRD data, which also show the reduction and disappearance of the Al peaks at the expense of the roughly constant amplitude of the Ta peaks indicative of the preferential mixing of the Al into Ta.
From the aforementioned general observations of the binary mixtures using the Group IV elements, it may be concluded that perhaps only the Al-Ti system offers the desired flexibility in being able to modulate the reactivity of the mixture. The other combinations are intrinsically too reactive and, therefore, do not lend themselves to a significant latitude in adjusting the reactivity. In contrast, initially, the Group V elements indicate little potential in producing the desired reactive effect; however, with milling there is a possibility to improve it. In fact, both Nb and Ta offer significant latitude in adjusting both the magnitude and duration of the heat release.
5. Summary and Conclusions
High-energy ball milling was performed on a series of binary powdered Al mixtures with Group IV or V transition metal elements. Based on milling time, the constituent elements of the binary alloy system were either lightly or heavily dispersed. The nature of the ball milling process was expected to result in a partially mechanically alloyed product resulting in the potential formation of trace quantities of intermetallic compounds. However, little or no evidence of intermetallics was found in the as-milled powders.
Thermal analysis of the powdered and compacted samples indicated that milling time influenced the reactivity and behavior of the samples. Specifically, for lightly milled samples DSC thermograms displayed an initial endotherm followed by exotherm, while heavy milling reduced the size of the initial endotherm, it also reduced the magnitude the exotherm and shifted the latter’s position to lower temperatures. Typically, the initial endotherm corresponding to the
54
melting of Al was a necessary step for the exothermic reaction to begin. The use of compacts instead of loose powders improved the particle-particle contiguity; therefore, the heat transfer between particles resulted in smaller endotherms and more rapid exothermic reactions.
Of the various systems examined, Al mixtures with Group IV elements of Ti, Zr, or Hf were found to be more reactive, wherein an initial endotherm was followed by a narrow exothermic peak. With increasing milling time, the endotherm entirely disappeared and the remaining exotherm became so broad and shifted to lower reaction threshold temperatures that it was hard to see if a reaction took place. This effect was more notable in some of the heavily milled samples. In contrast, the Al mixtures with Group V elements of V, Nb, or Hf were found to be less reactive, wherein the milling time reduced the magnitude of the initial endotherm but it did not completely eliminate it. Additionally, the exothermic reactions were not as strong (smaller peak amplitudes) but occurred over a much wider temperature range.
Microscopy revealed a continuous refinement of the initially equiaxed microstructure. No intermetallic formation was observed at the interface; though, it is quite possible that some intermetallics could have formed. XRD analysis confirmed that no run-away reaction initiation took place during milling. For short milling times, only Bragg peaks that attributed to the 2 primary elements could be identified. For longer milling times, the Bragg peaks reflected a general tendency to broaden, shift, and diminish in magnitude; but still, only the 2 precursor elements were identifiable. The broadening was attributed to the breakdown of the initial microstructure and atomic level mixing (i.e., solid solution formation) of the 2 elements. For these samples, other smaller peaks observed in the XRD scans could not be definitely correlated with a specific intermetallic species. In the Al-V, Al-Nb, or Al-Ta systems, the V, Nb, or Ta peaks retained their intensity more so than in the Al-Ti, Al-Zr, or Al-Hf system, the Ti, Zr, or Hf, respectively.
Future work on these systems should examine a greater range of initial milling times and the behavior of compacts when reacted in the DSC. Also, post-reaction SEM images and XRD scans should to be able to determine the extent of the reaction and the type of intermetallics that may have formed.

55
6. References
Kawanishi S, Isonishi K, Okazaki K. Formation of nanophase niobium aluminide by mechanical alloying. Materials Transactions Japan Institute of Metals 1993;34(1):43–48.
Klassen T, Oehring M, Bormann R. Microscopic mechanisms of metastable phase formation during ball milling of intermetallic TiAl phases. Acta Materialia 1997;45(9):3935–3948.
Merzbacher C. Materials that emit light by chemical reactions. Series A: Mathematical, Physical and Engineering Sciences. Philosophical Transactions of the Royal Society of London 2002;360(1730):89–96.
Portnoy V, Tret K, Logacheva A, Logunov A, Razumovskii I. Method of mechanochemical synthesis for the production of nanocrystalline Nb-Al alloys. Physics of Metals and Metallography 2004;97(2):193–198.
Song M, Zhang M, Huang B, Zhang S, Li J. Reactions synthesis of ZrAl3 intermetallic compound and its nucleation behavior. Rare Metal Materials and Engineering 2008;37(9):1570–1574.

56
INTENTIONALLY LEFT BLANK.
57
Appendix. Scanning Electron Micrographs of the As-Milled Powders at 1-, 5-, and 10-min Milling Times

58
Al-Ti Micrographs
1 min:

59
5 min:
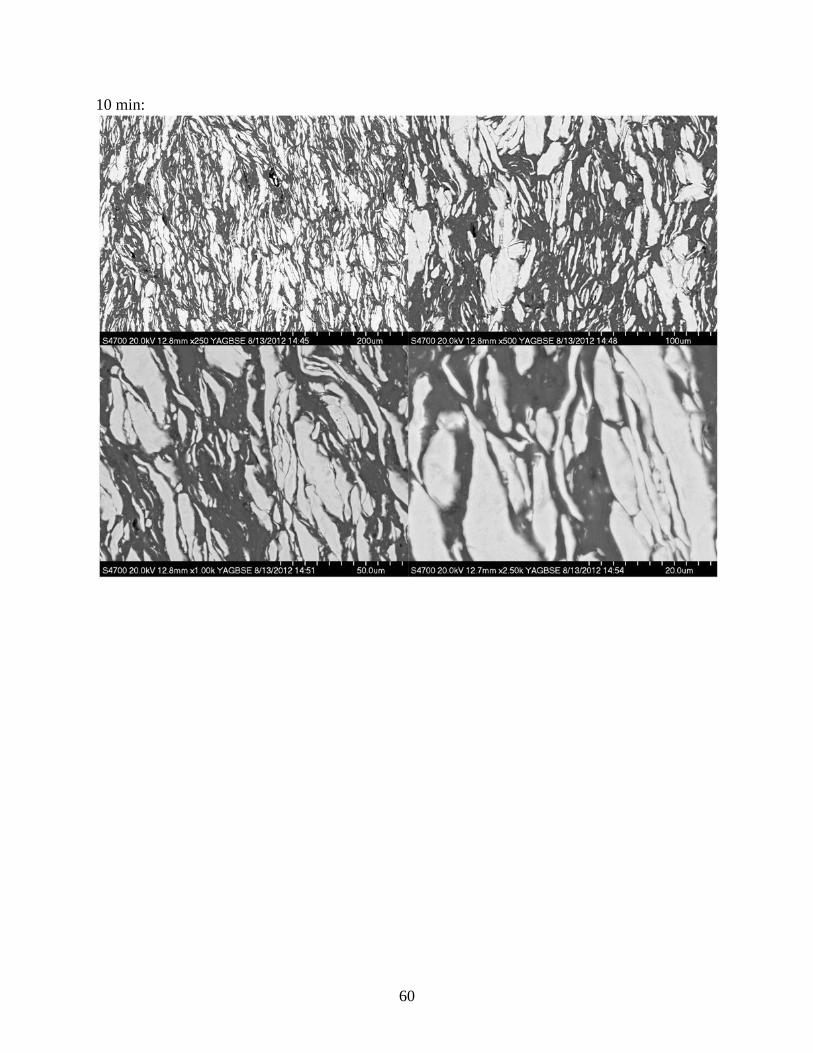
60
10 min:
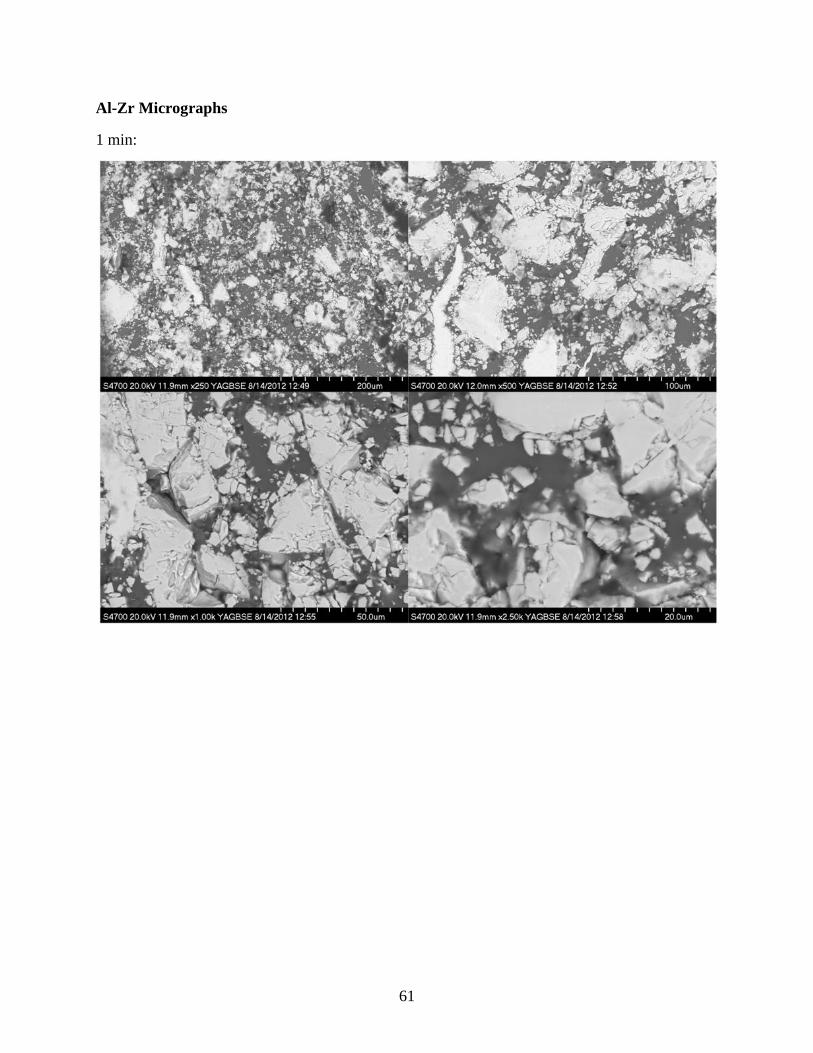
61
Al-Zr Micrographs
1 min:

62
5 min:
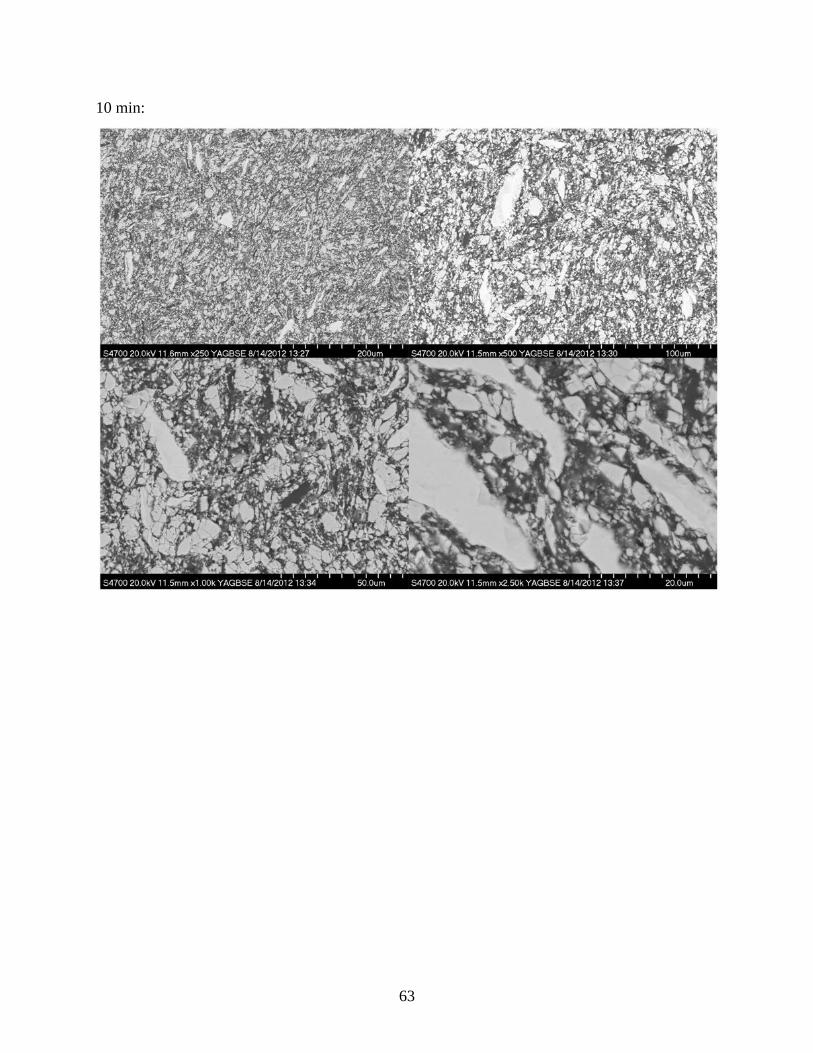
63
10 min:
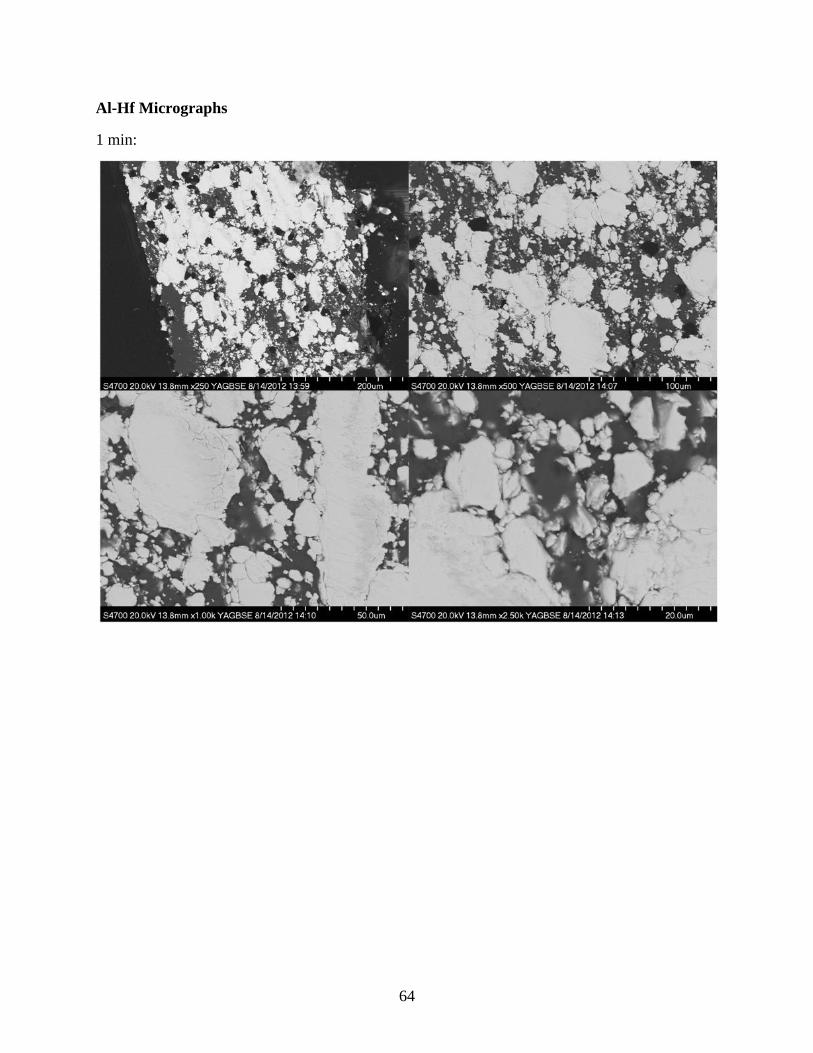
64
Al-Hf Micrographs
1 min:

65
5 min:
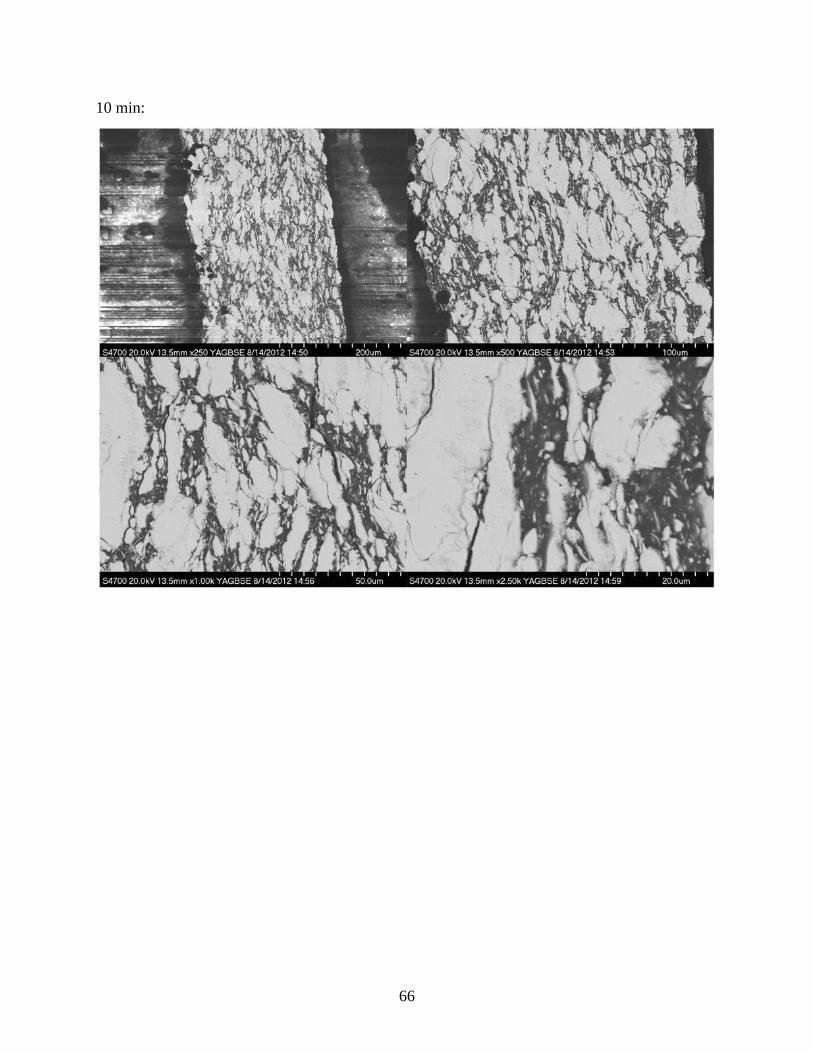
66
10 min:

67
Al-V Micrographs
1 min:

68
5 min:

69
10 min:
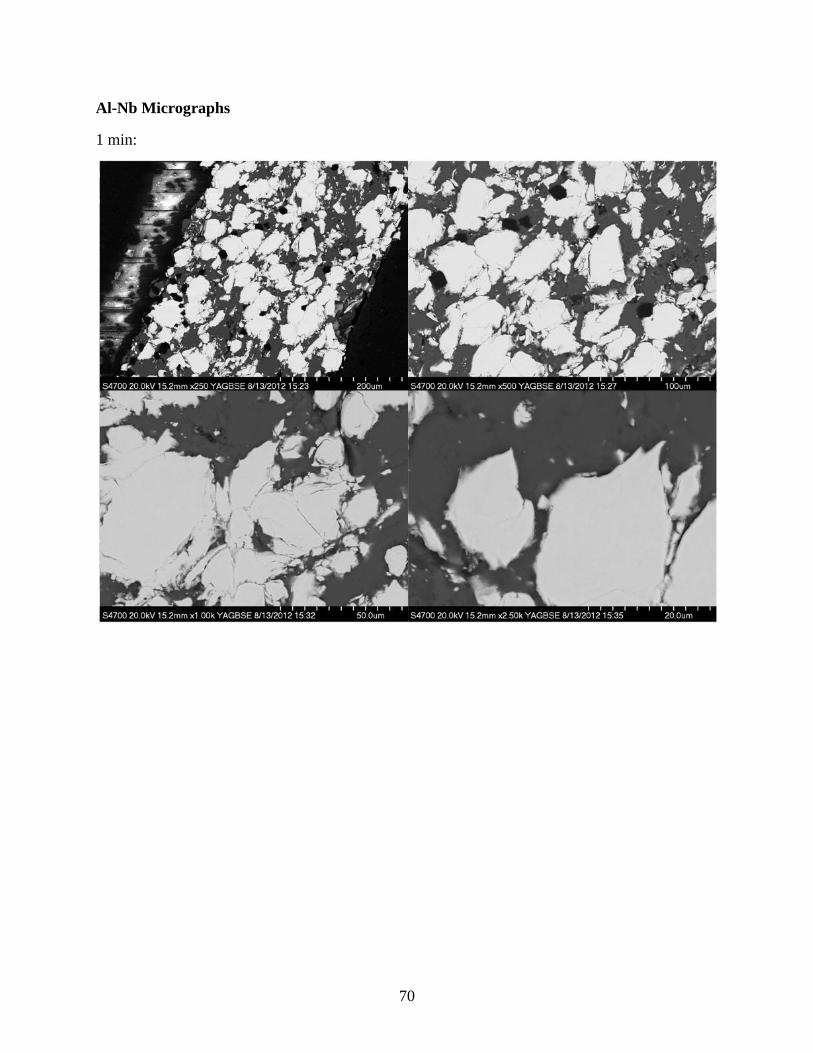
70
Al-Nb Micrographs
1 min:
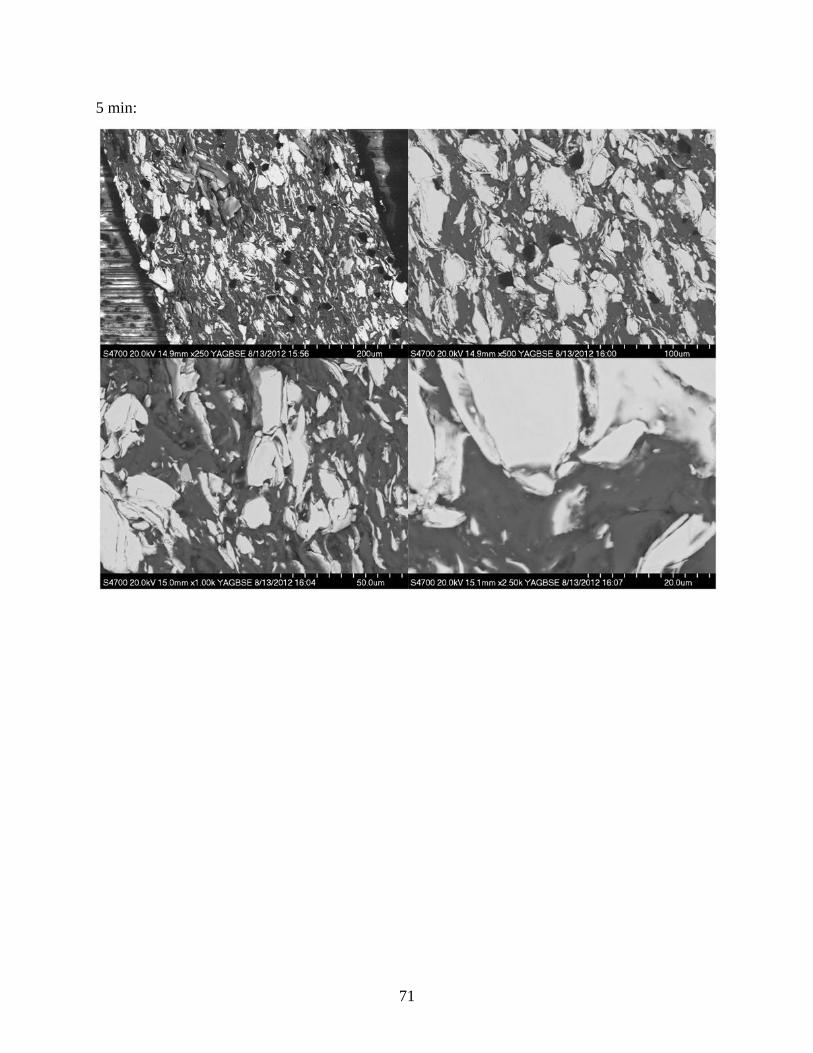
71
5 min:
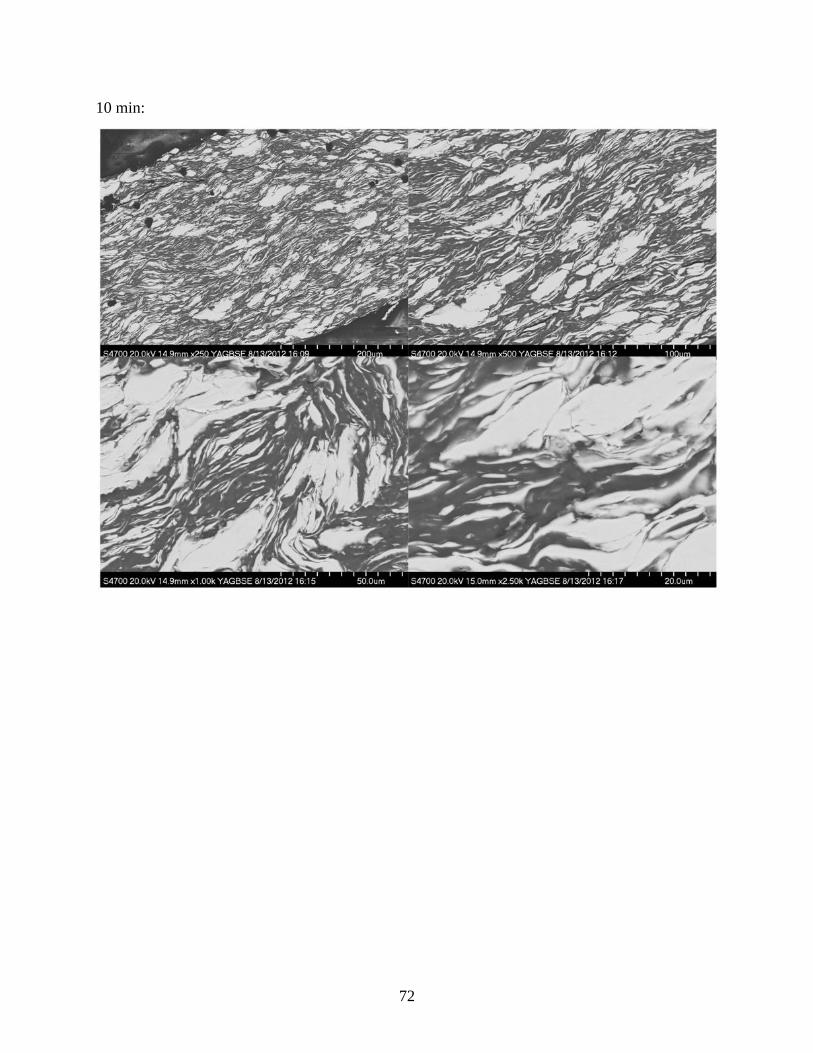
72
10 min:
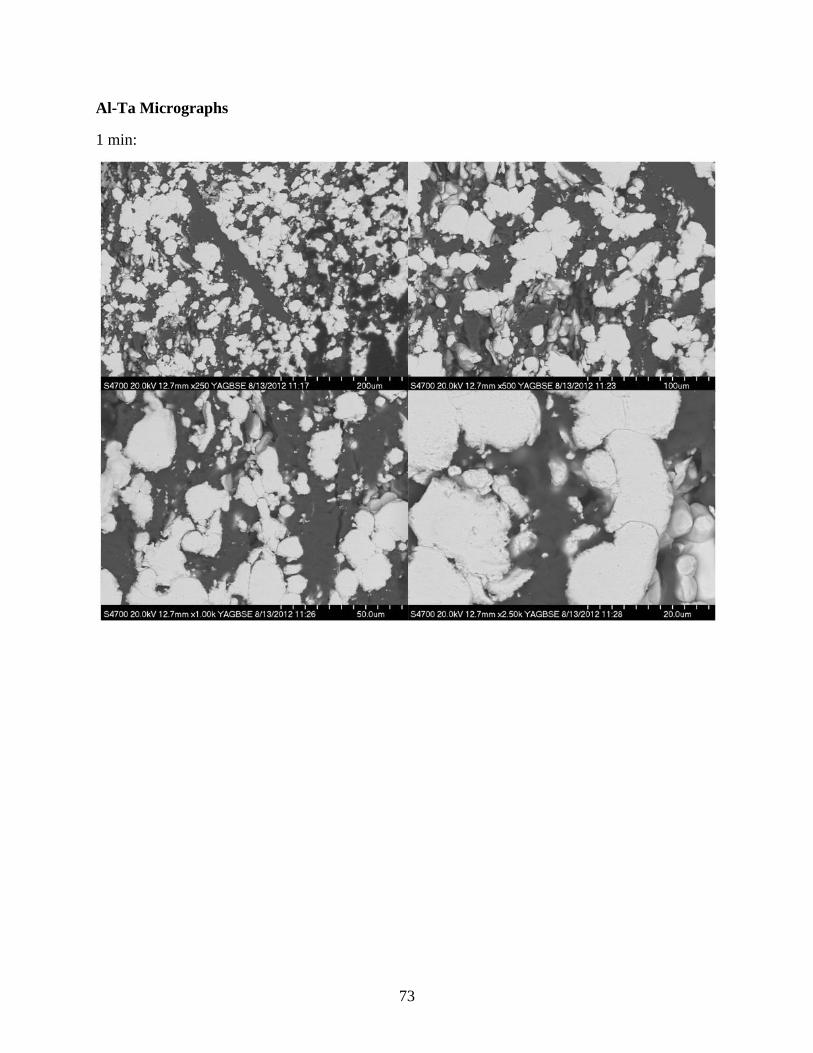
73
Al-Ta Micrographs
1 min:
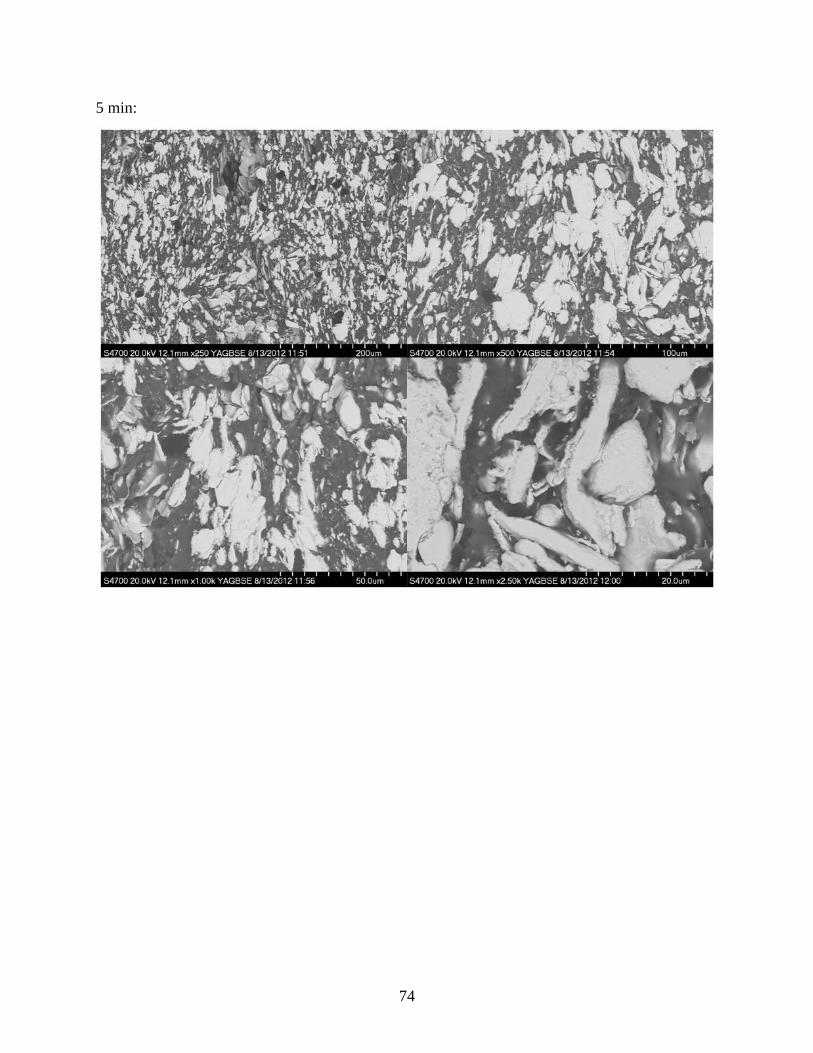
74
5 min:
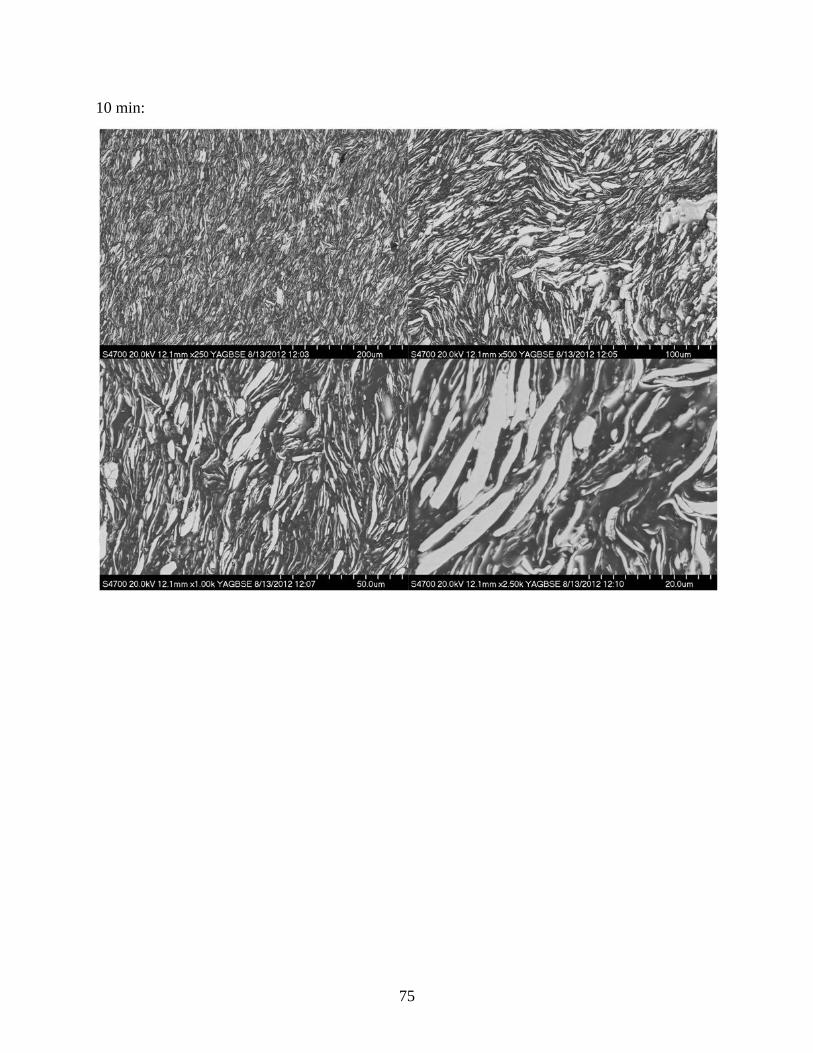
75
10 min:
76
List of Symbols, Abbreviations, and Acronyms
µV/mg microvolts/milligrams
Al aluminum
DSC Differential Scanning Calorimetry
DSC/DTA Differential Scanning Calorimeter/Differential Thermal Analyzer
EDS Energy Dispersive X-ray Spectroscopy
Hf hafnium
Nb niobium
SEM Scanning Electronic Microscopy
SHS Self-Propagating High-Temperature Synthesis
Si silicon
SiO2 silicon dioxide
Ta tantalum
Ti titanium
V vanadium
XRD X-ray Diffraction
Zr zirconium

77
1 DEFENSE TECHNICAL (PDF) INFORMATION CTR DTIC OCA 2 DIRECTOR (PDF) US ARMY RSRCH LAB RDRL CIO LL IMAL HRA MAIL & RECORDS MGMT 1 GOVT PRINTG OFC (PDF) A MALHOTRA 31 DIRECTOR (PDF) RDRL WM P BAKER R EHLERS B FORCH L J KECSKES J MCCAULEY RDRL WMP D LYON RDRL WMP C T BJERKE RDRL WMP G N ELDREDGE B HOMAN S KUKUCK RDRL WML M ZOLTOSKI RDRL WML B N TRIVEDI R PESCE-RODRIQUEZ RDRL WML C S AUBERT B ROOS T PIEHLER K MCNESBY RDRL WML H J NEWILL T FARRAND M FERMEN-COKER RDRL WMM J ZABINSKI R DOWDING J BEATTY RDRL WMM A J SANDS RDRL WMM B P BARNES RDRL WMM C J LA SCALA RDRL WMM D R CARTER RDRL WMM E J SINGH
RDRL WMM G A RAWLETT RDRL WMM F H MAUPIN K DARLING

78
INTENTIONALLY LEFT BLANK.