reading assessment in thesecondaryclassroom: washback … frotscher.pdf · reading assessment in...
TRANSCRIPT

Reading assessment
in the secondary classroom:
washback by a national exam
Doris Froetscher
Lancaster University / BIFIE Vienna
1

Context: Austrian school-leaving exam
• „Matura“
• high-stakes– entry into higher education
• standardized national exam– obligatory by 2015
• pilot phase– started 2008
– schools participate voluntarily
– increasing number (2013: 90% of schools/ >12,000 test takers)
• before reform: teacher-made Matura
2

The new Matura
• English: B2 level
– Reading, Listening, Language in Use, Writing
• Reading paper
– 4 independent tasks
– 6-10 items each
– developed by teachers trained as item writers
– field tested and standard set
3

Class tests
• 2-3 times per school year
• usually 50% of final grade
• make-up not regulated until Oct12
– but in final year traditionally aligned with Matura
4

Research Question
What is the washback of the standardized Matura for English in Austria on how reading is assessed in class tests?
• important to research the ways in which external tests affect assessment in the classroom – Wall and Alderson, 1993; Wall and Horak, 2006; Watanabe,
2000
5

Research into
Washback of standardized tests
on classroom-based assessment
• few studies
• general education– Abrams et al., 2003; Mabry et al, 2003; McMillan et al., 1999;
Mertler, 2010; Stecher et al., 1998; Tierney, 2006
• language testing– Tsagari, 2009; Wesdorp, 1982; Wall and Alderson, 1993
• main methods used
– surveys
– interviews
6

This studyaddresses research gap in terms of• focus
– washback of an external exam on classroom assessment
• method– analysis of actual class test tasks
tools used• specially developed instrument IART
– Instrument for analysis of reading tasks
• statistical analyses– crosstabulations
– Chi-Square statistic
– Mann-Whitney-U Test
7

Participants and data
• 22 teachers
• 132 class tests from year 12 (final year, 18 year-olds)
– pre 2008: n=60
– post 2008: n=72
• containing 173 reading tasks
– pre 2008: n=54 (31%)
– post 2008: n=119 (69%)
• containing 1075 items
– pre 2008: n=207 (19,3%)
– post 2008: n=868 (80,7%)
8
Instrument: IART
Instrument for the analysis of reading tests
• 32 judgement questions
– text, task, item characteristics
• pilot studies
– Inter-judge agreement
– Intra-judge agreement
9

Example questions
• Are there instructions on how to do the task?
a. yes
b. no
• How clearly is the item worded?
a. clear
b. rather clear
c. rather unclear
d. very unclear
10

What‘s new?
• EALTA 2013 Istanbul
– global analysis
– analysis with instrument: 74 tasks
– preliminary results
• EALTA 2014 Warwick
– all 173 tasks
– more differences found
– final results
11

Analyses and comparisons
• pre /post 2008
• pre/ post / past papers
– 68 tasks in the post data
– from past papers of the new Matura (57%)
– second layer of analyses
• in pilot phase / not in pilot phase
• teachers‘ training in TEA
12

RESULTS TEXT LEVEL
13

CEFR domains – pre/ post
two domains differ pre/post
• public
• occupational
14

Topics – pre/ post
less frequent post 2008
• society and politics*
• relationships and social life
more frequent post 2008
• work and professional life
15
vaster variety of topics post 2008
• 12 categories pre versus 22 categories post

Topics
16
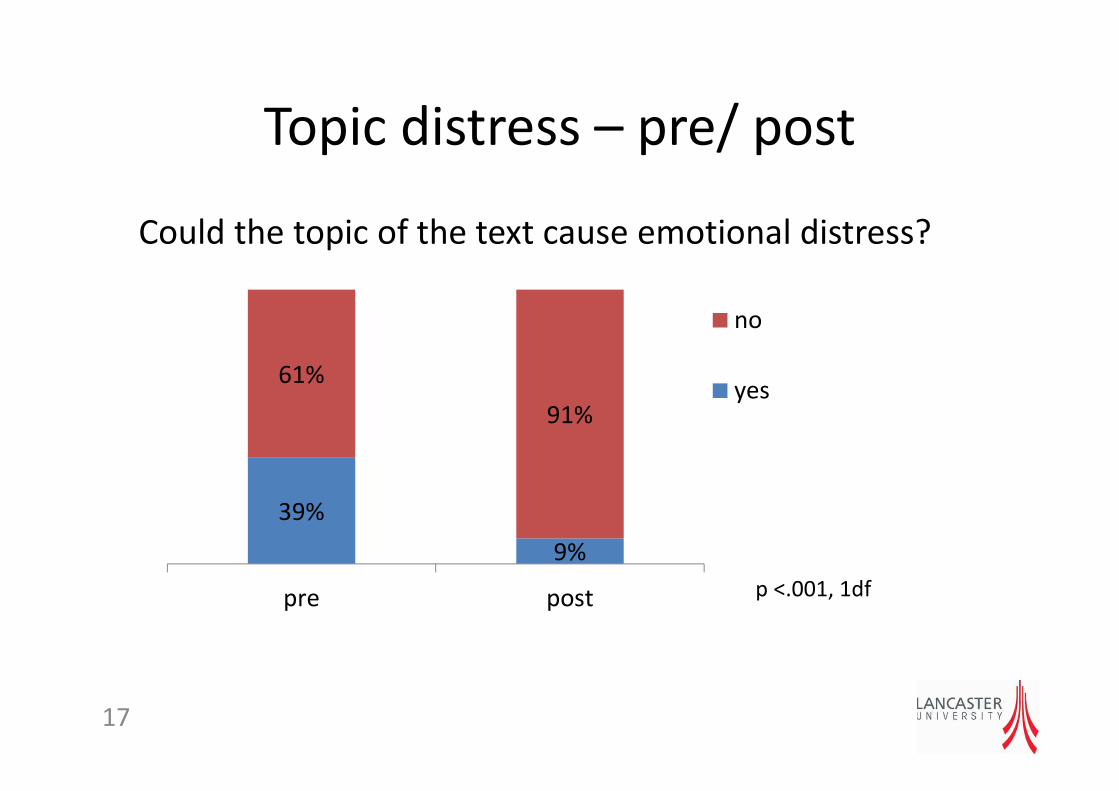
Could the topic of the text cause emotional distress?
39%
9%
61%
91%
pre post
no
yes
Topic distress – pre/ post
17
p <.001, 1df

RESULTS TASK LEVEL
18

Test methods used – pre/ post
19
67%
17%11%
2% 0%3% 0%
45%
28%
20%
longer answer summary matching multiple
choice
short answer
pre
post
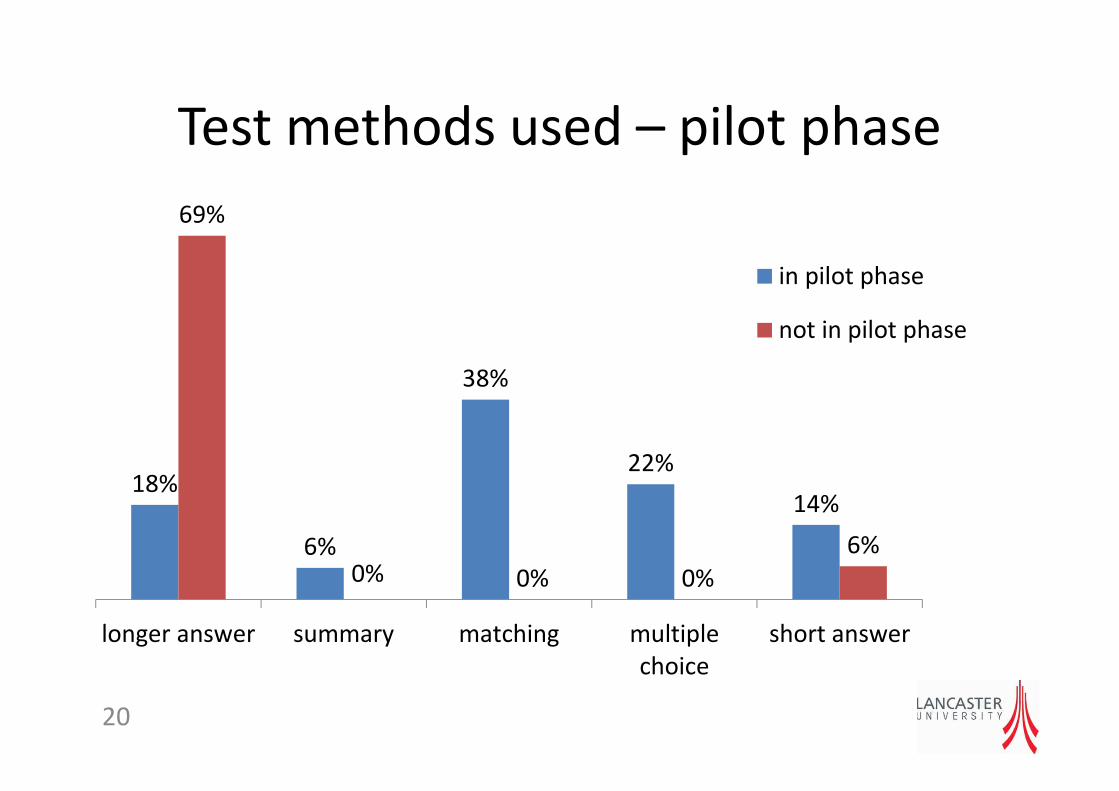
Test methods used – pilot phase
20
18%
6%
38%
22%
14%
69%
0% 0% 0%
6%
longer answer summary matching multiple
choice
short answer
in pilot phase
not in pilot phase

Number of items – pre/ post
21
57,4%
35,2%
1,9%5,6%1,7%
35,3%
54,6%
8,4%
1-3 items 4-6 items 7-10 items 11-16 items
pre
post

Presence of instructions
- pre/ post
- training/ no training
22p <.001, 1df
76%
98%
24%
3%
pre post
93%
60%
7%
40%
training no training
no instructions
instructions
p =.001, 1df

Are the instructions clear?
Clarity of instructions – pre/ post
23
p <.001,
U=1392
58%
100%
37%
0%5%
0%
pre post
not at all clear
partly clear
fully clear

Length of expected response – pre/ post
24
p <.001, 1df
36%
85%
64%
15%
pre post
not given
given

Is there an example?
Example item – pre/ post
23%
79%
77%
21%
pre post
no
yes
25
p <.001, 1df
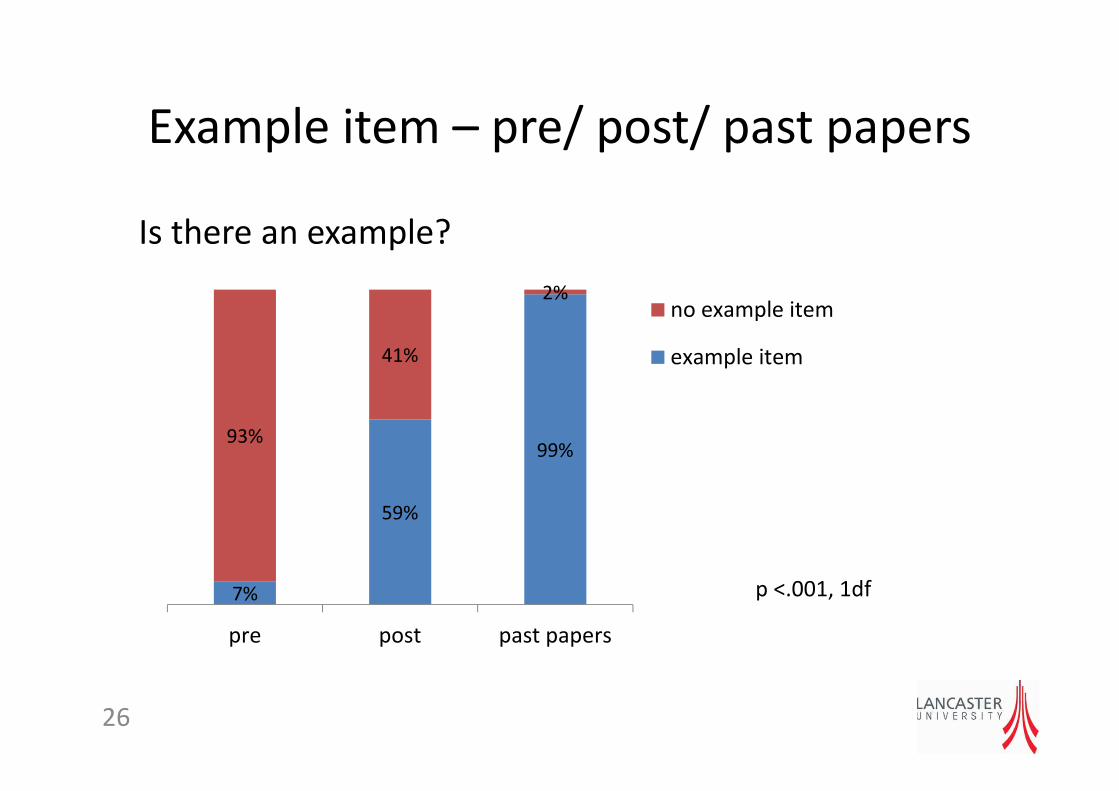
Is there an example?
Example item – pre/ post/ past papers
26
7%
59%
99%93%
41%
2%
pre post past papers
no example item
example item
p <.001, 1df

Is there an example?
Example item – pilot phase
27
p <.001, 1df
0%
65%
100%
35%
not in pilot phase in pilot phase
no example item
example item

Item sequence – pre/ post
28
p <.001, 1df
62%
98%
39%
2%
pre post
item sequence
different from text
item sequence as in
text

24%20%
78%
76% 80%
22%
pre post past papers
no picture
picture
Pictures used – pre/ post / past papers
29

RESULTS ITEM LEVEL
30

Reading behaviours tested – pre / post
31
74%
12%
5% 4%2% 1% 1% 0%
79%
2%
9%
1% 1% 2% 3% 3%
reading for main
ideas and
supporting details
reading to infer
propositional
meaning
reading for
specific
information and/
or important
details
reading to deduce
the meaning of a
word/ phrase
identifying the
author's attitude
gist search reading identifying the
topic of a text
pre
post

Explicit and implicit information
targeted in items
32
75% 79%
94%
25%21%
6%
pre post past papers
implicit
explicit

Item clarity – pre/ post
33
76%
90%
12%
4%7%
3%
5% 3%
pre post
unclear
rather unclear
rather clear
clear
U=77224, p<.001

Item clarity – pre/ post/ past papers
34
76%84%
95%
12%6%
3%7% 5%
1%5% 5%1%
pre post past papers
unclear
rather unclear
rather clear
clear

0% 2%
77%
90%
23%
8%
pre post
weak
good
too strong
How would you classify the distracters for this item?
Distracters – pre/ post
35
p<.001, 2 df
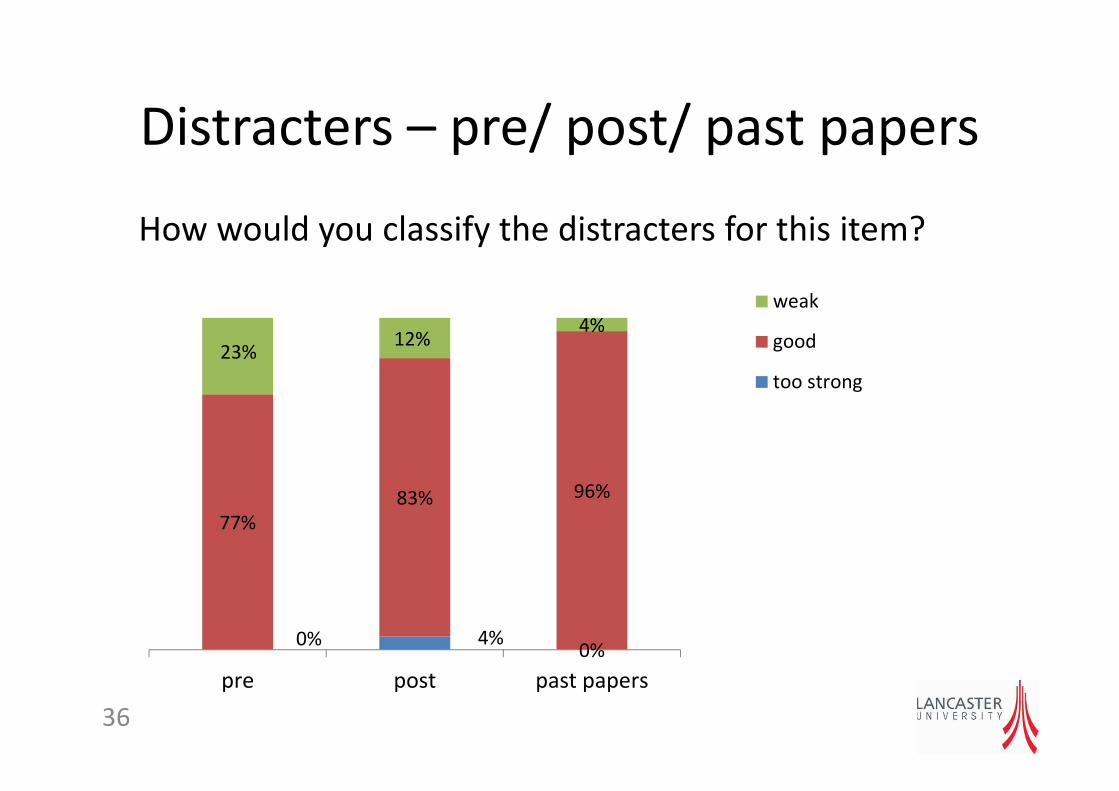
How would you classify the distracters for this item?
Distracters – pre/ post/ past papers
36
0% 4%0%
77%
83% 96%
23%12%
4%
pre post past papers
weak
good
too strong

Item CEFR level – pre/ post
37
19%25%
62%
71%
19%
4%
pre post
C1
B2
B1
U=74966.5; p<.001

19%
24%26%
62%68%
73%
19%
8%0%
pre post past papers
C1
B2
B1
Item CEFR level – pre/ post / past papers
38

Item CEFR level – pilot phase
39
25%
10%
70%
63%
6%
27%
pilot phase not pilot phase
C1
B2
B1
p<.001; 2df

54%
1%
15%
17%
34%
83%
pre post
not at all
so some extent
to a great extent
Extent of testing other linguistic skills
(than reading) – pre/ post
40
U=36145; p<.001
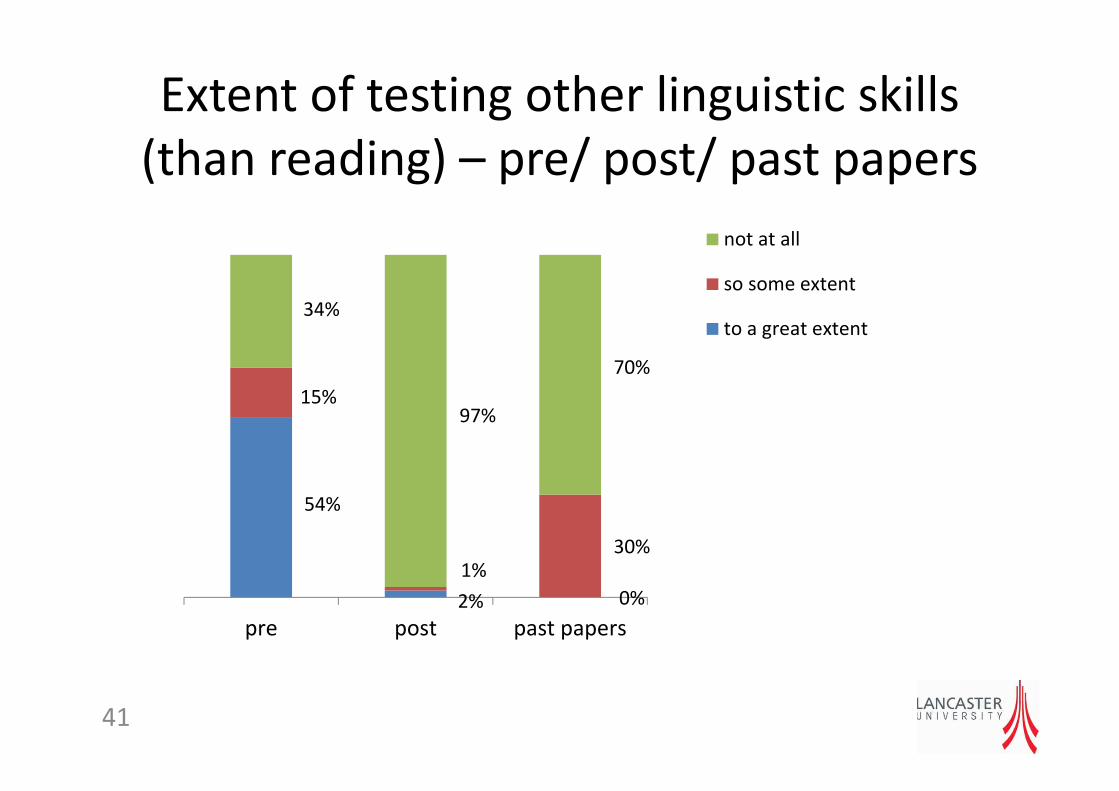
Extent of testing other linguistic skills
(than reading) – pre/ post/ past papers
41
54%
2% 0%
15%
1%30%
34%
97%
70%
pre post past papers
not at all
so some extent
to a great extent

Characteristics where no difference was found
• authenticity of texts
• grammatical complexity of texts
• reading behaviours targeted (R. Green, 2000)
• CEFR level of texts
• item spread or overlap
42

Limitations
• restricted number of tasks
• limited sample
• unbalanced data set, particularly at the item level
• data based on judgement
– possible researcher bias
43

Conclusions
• positive washback
– practice students‘ familiarity with test methods
– increased “usefulness“of class tests (Bachman & Palmer,
1996)
• unproblematic topics, clear instructions, example item,
meaningful item sequence, better distracters, less
construct irrelevance (writing)
• use of past papers = professionally developed tasks
44

Conclusions
• negative washback
– narrowing down of task types
– teaching to the test?
– lowering of the level?
45

Conclusions
• factors possibly enforcing washback
– participation in pilot phase• test methods
• example item
• CEFR level of items
– training of teachers in TEA• instructions
– past papers in post 2008 class tests• picture presence
• example items
• item clarity
• distracters
• CEFR level of items
46
Methodological recommendations
• analysis of classroom tests useful for washback
research
• applying an instrument like IART seems suitable
– develop instrument which captures all relevant
features of the tests analyzed
– pilot instrument thoroughly
– consider data entry and analysis at design stage
47

References
Abrams, L. M., Pedulla, J. J., & Madaus, G. F. (2003). Views from the classroom:
Teachers' opinions of statewide testing programs. Theory Into Practice, 42(1), 18-29.
Alderson, J. C., & Wall, D. (1993). Does washback exist? Applied linguistics, 14(2), 115.
ALTE (n.d.). Individual Component Checklists (Reading). retrieved rom:
http://events.alte.org/projects/analysis.php
Bachman, L. F., & Palmer, A. S. (1996). Language testing in practice (Vol. 377): Oxford
University Press.
Council of Europe (2001). Common European Framework of Reference for Languages:
learning, teaching, assessment. Cambridge: Cambridge University Press.
Green, R. (2000). An empirical investigation of the componentiality of E.A.P. reading
and E.A.P. listening through language test data. PhD thesis, University of Reading.
Gwet, K. (2011). AgreeStat (Version 2011.2): Advanced Analytics, LLC.
Mabry, L., Poole, J., Redmond, L., & Schultz, A. (2003). Local impact of state testing in
southwest Washington. Education Policy Analysis Archives, 11, n22.
McMillan, J., Myran, S., & Workman, D. (1999). The impact of mandated statewide
testing on teachers’ classroom assessment and instructional practices.48

References
Mertler, C. A. (2010). Teachers' perceptions of the influence of No Child Left Behind on classroom
practices. Current Issues in Education, 13(3).
Stecher, B., Barron, S., Kaganoff, T., & Goodwin, J. (1998). The effects of standards-based
assessment on classroom practices: Results of the 1996-1997 RAND survey of Kentucky
teachers of mathematics and writing. University of California, National Center for Research on
Evaluation, Standards, and Student Testing (CRESST), Los Angeles.
Tierney, R. (2006). Changing practices: influences on classroom assessment. Assessment in
Education: Principles, Policy & Practice, 13(3), 239-264. doi: 10.1080/09695940601035387
Tsagari, D. (Ed.). (2009). The complexity of test washback (Vol. 15). Frankfurt am Main: Peter
Lang.
Wall, D., & Alderson, J. C. (1993). Examining washback: the Sri Lankan impact study. Language
Testing, 10(1), 41.
Wall, D., & Horák, T. (2006). The impact of changes in the TOEFL ® examination on teaching and
learning in Central and Eastern Europe: Phase 1, the baseline study. RESEARCH REPORT-
EDUCATIONAL TESTING SERVICE PRINCETON RR, 6.
Watanabe, Y. (2000). Washback effects of the English section of the Japanese university entrance
examinations on instruction in pre-college level EFL. Language Testing Update, 27, 42-47.
49
