real performance of buses - network for transport … · the complete vehicle is tested ... e85 (ts...
TRANSCRIPT
NTM annual member meeting 2014:Increasing the credibility of transport
environmental performance
Nils-Olof Nylund 29.4.2014VTT Technical Research Centre of Finland
Real performance of buses

230/04/2014 2
Outline
Defining environmental performance
Test methodology to assess the performance of buses
National bus monitoring programme
Alternative energieswhat do fuel standards say?OPTIBIO renewable diesel fuelIEA Bus project (several alternative fuels)electric buses
Summary
330/04/2014 3
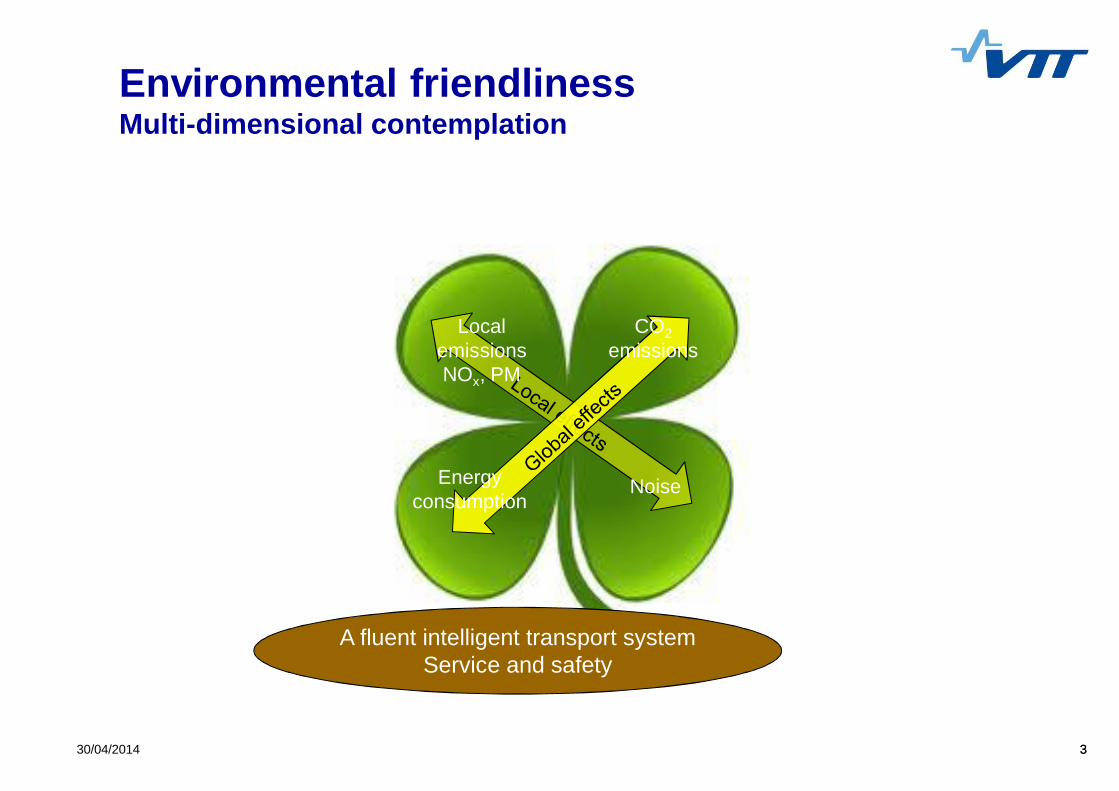
Environmental friendlinessMulti-dimensional contemplation
A fluent intelligent transport systemService and safety
LocalemissionsNOx, PM
CO2emissions
Energyconsumption
Noise

430/04/2014 4
Well-to-wheel (WTW)
530/04/2014 5
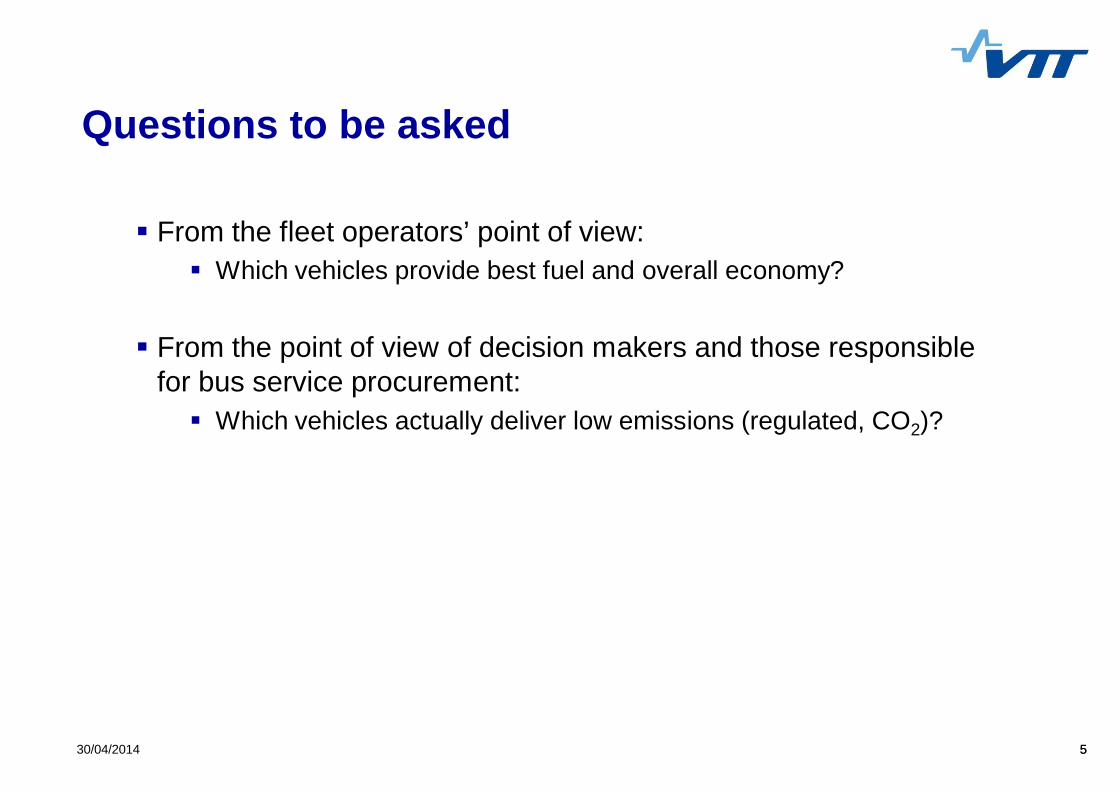
Questions to be asked
From the fleet operators’ point of view:Which vehicles provide best fuel and overall economy?
From the point of view of decision makers and those responsiblefor bus service procurement:
Which vehicles actually deliver low emissions (regulated, CO2)?

630/04/2014 6
The complete vehicle is tested
Fuel consumption and CO2 emissions have to be declared
Energy efficiency marking on its way
Emission data (regulated emissions) can be found
Lifetime mileage 15 * 20,000 km= 300,000 km~24,000 litres of petrol or ~18,000 litres of diesel
For passenger cars:

730/04/2014 7
http://ec.europa.eu/clima/policies/transport/vehicles/index_en.htm

830/04/2014 8
For buses:
The manufacturer is only obliged to state the emission certificationclass of the engine itself
No official regulations for the measurement and reporting of fuelconsumption or emissions of the complete vehicle
The manufacturer might state fuel consumption for the vehicle inaccordance with UITP’s SORT (Standardised On-Road Test Cycles)methodology
Lifetime mileage 15 * 80,000 km= 1,200,000 km~500,000 litres of diesel~25 times higher than for a passenger car
http://www.uitp.org/publications/pics/bonus/SORT2.pdf

9
Why test complete HD vehicles?
There is a clear need for a test method to determine emissions and fuelconsumption that takes into account the properties of the completevehicle
"real-life" emission and fuel consumption figures (g/km based)effects of payload and driving cyclevehicle-to-vehicle comparisons, checking of in-use vehicles
Chassis dynamometer testing can meet all these needsaccuracy for fuel consumption measurements + 1 %accuracy for emission measurements + 15 %
Directive 2009/33/EC calls for distance based performance figuresoperational lifetime cost of the energy consumption, CO2 emissions and forpollutant emissions

10
Accuracy:• Fuel consumption +1 %• Emissions +15 %
VTT’s chassis dynamometer
The Finnish Centre for Metrology and Accreditationgranted accreditation for VTT’s measurements in 2003
Some 350 buses measured already!
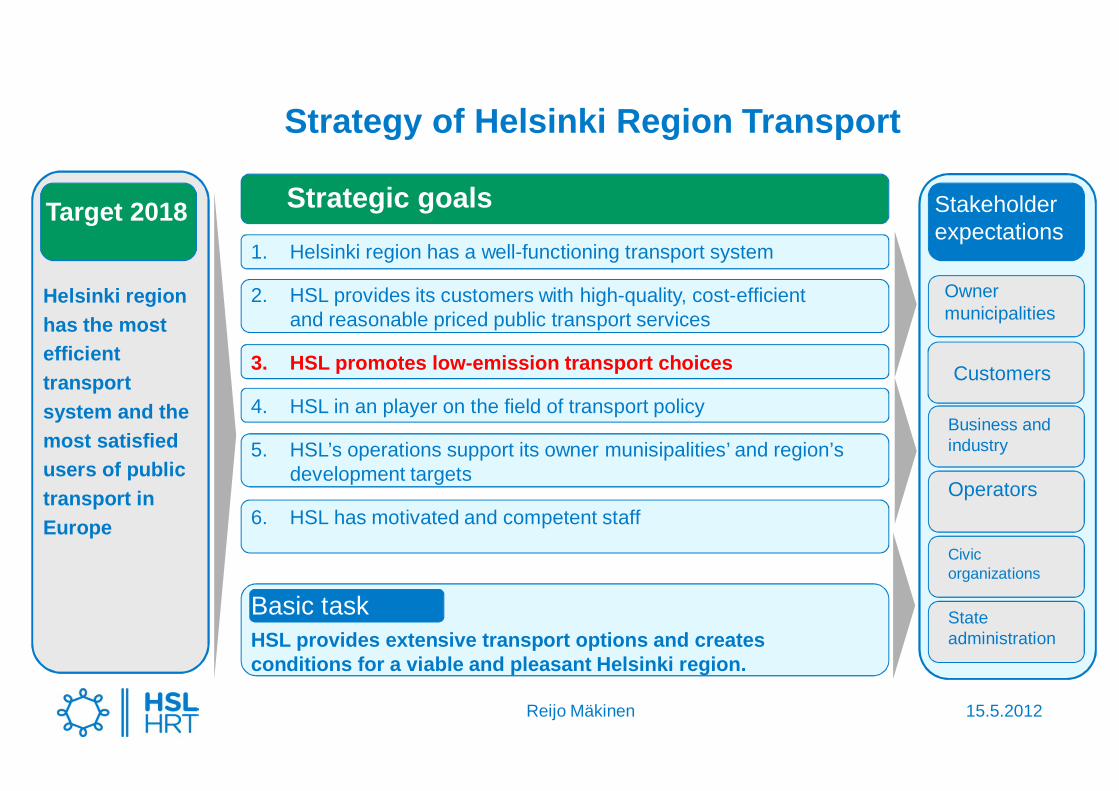
Strategy of Helsinki Region Transport
1. Helsinki region has a well-functioning transport system
2. HSL provides its customers with high-quality, cost-efficientand reasonable priced public transport services
3. HSL promotes low-emission transport choices
4. HSL in an player on the field of transport policy
5. HSL’s operations support its owner munisipalities’ and region’sdevelopment targets
6. HSL has motivated and competent staff
Helsinki regionhas the mostefficienttransportsystem and themost satisfiedusers of publictransport inEurope
Target 2018 Strategic goals
HSL provides extensive transport options and createsconditions for a viable and pleasant Helsinki region.
Basic task
Stakeholderexpectations
Customers
Business andindustry
Operators
Civicorganizations
Stateadministration
Ownermunicipalities
15.5.2012Reijo Mäkinen

12
VTT’s bus databaseCooperation with Helsinki Region Transport
Braunschweig Countn
MileageMin
MileageMax
COg/km
HCg/km
CH 4 *g/km
NOxg/km
PMg/km
CO 2
g/km
CO 2
eqv**g/km
FCkg/100k
m
FCMJ/km
2 - axleDiesel Euro I 2 555025 672700 1,39 0,32 15,59 0,436 1220 1220 38,6 16,6Diesel Euro II 13 160500 1125674 1,60 0,21 12,86 0,213 1286 1286 40,7 17,5Diesel Euro III 14 15934 786164 0,85 0,12 8,48 0,209 1213 1213 38,4 16,6Diesel Euro IV 8 6105 474152 2,96 0,10 8,36 0,112 1207 1207 38,2 16,5Diesel Euro V*** 2,96 0,10 7,51 0,089 1207 1207 38,2 16,5Diesel EEV 23 1020 696931 1,07 0,04 6,38 0,080 1167 1167 36,9 15,9Ethanol EEV 1 98032 98032 0,43 5,58 0,037 1150 1150 65,3 16,5Diesel Hyb, EEV 4 2602 44620 0,98 0,02 5,70 0,039 844 844 26,7 11,5CNG Euro II 2 211000 672946 4,32 7,12 6,76 16,92 0,009 1068 1224 42,1 20,7CNG Euro III 2 37600 237189 0,05 2,64 2,51 9,44 0,019 1111 1168 43,7 21,5CNG EEV 8 1824 640252 2,78 1,28 1,21 3,17 0,008 1196 1224 47,1 23,22 - axle, lightweightDiesel**** 4 993 26436 0,88 0,03 6,70 0,047 953 953 30,17 13,03 - axleDiesel Euro V 4 1400 232494 6,68 0,03 3,16 0,089 1414 1414 44,8 19,3Diesel EEV 6 5444 94910 1,41 0,04 5,50 0,077 1461 1462 46,2 19,9CNG EEV 5 121773 651529 10,96 1,69 1,61 6,37 0,010 1319 1356 51,9 25,5*For CNG vehicles CH4 = THC * 0.95, For diesels CH4 = 0** CO2 eqv = CO2 + 23 * CH4
*** Euro V results are interpolated from Euro IV and EEV results**** Includes results from emission classes Euro III, Euro IV ja EEV
Braunschweig citybus cycle
0
10
20
30
40
50
60
70
0 500 1000 1500Time (s)
Driv
ing
spee
d(k
m/h
)

1330/04/2014 13
Limit values vs. true diesel performance
True relative NOx & PM performance
83
54
38
14
5554
4645
26
20
100
0
10
20
30
40
50
60
70
80
90
100
Euro I Euro II Euro III Euro IV Euro V EEV
NOx act. relPM act. rel

14
NOx & PM emissions


1. Legislated• European directives, regulations• national regulations
2. Standardized• prepared by technical experts in CEN Working Groups
• oil industry, automotive industry, biofuel industry people• commented and balloted by national standard bodies (EU + other European countries)
• Finnish Petroleum Federation, Standardization group 1• in principle voluntary since not prepared by authorities and not formally accepted by political
processes• EN 14214 FAME standard legislated by EU
3. Fit for purpose• cars, vans, trucks, buses, non-road mobile machinery, vessels• different climatic conditions
Specification drivers
Internal for fuel specialists

1. LegislatedDirective 2009/30/EC “FQD”• exhaust and volatile emissions related properties
• diesel: cetane number, density, 95 % point,polyaromatics, sulfur, biodiesel (FAME max 7 %), MMT
• diesel: free use of renewable hydrocarbons (HVO, BTL)• gasoline: vapor pressure, octanes, distillation, aromatics, olefins, benzene, oxygenates, MMT,
sulfur, lead, labeling of metallic additives (=> can not be used)• in force at retail points where vehicles refueled
• minimum GHG reduction; can be pooled between batches and suppliers
Directive 2009/28/EC “RED”• minimum bioenergy content; can be pooled between batches and suppliers
Other regulations• minimum flash point for safety• distillation points in custom’s CN codes
Internal for fuel specialists

2. StandardizedE.g. EN 590:2013 (B7)• requirements from FQD and regulations copied 1:1• vehicle operability and durability related limits
• cetane index, carbon residue, ash, water, contamination,copper corrosion, oxidation stability, lubricity, viscosity,distillation, cloud point, CFPP , additives in FAME
• free use of HVO and co-feed as biocomponents, GTLas fossil component (provided that final blend meets EN 590)
• in force at retail points where vehicles refueled• if not met, warranties of vehicles not in force, shortened vehicle service intervals may be
required• vehicle owner has to trust on quality since he can not analyze fuel by himself
Internal for fuel specialists


Gasoline(otto enginesincl. FFV)
Diesel(diesel enginesincl. E95-modifications)
LPG
E10+ (EN xxxxx) Quick
2013 2015 2020 2025
E5 (EN 228), in Finland decision: at least till 2018
Note! Schedules based on estimations or planned CEN schedules and FQD review
E10 (EN 228), at least till 2025
or slow implementation (TR 16514)
E85 (TS 15293) E85 (EN 15293) for FFV cars
B7 (EN 590), at least till 2020
B10 (EN xxxxx, 0-10% FAME)
B20 (EN yyyyy, 15-20% FAME) for dedicated fleets
B30 (EN yyyyy, 25-30% FAME) for dedicated fleets
ED95 (CWA xxxxx) for dedicated fleets proposed but not proceeding
XTL/HVO (TS) XTL/HVO (EN 15940) for dedicated fleets
LPG (EN 589) automotive use
CEN = European Committee for Standardization, CWA = CEN Workshop Agreement, E10+ = 20-25% ethanol or corresponding biocontent, EN = EuropeanStandard, LPG = Liquefied Petroleum Gas, TS = Technical Specification, TR = Technical Report , XTL/HVO = paraffinic diesel
Small-engine gasoline (CWA xxxxx) discussed but not decided
Estimated schedules in Europe

Paraffinic Diesel FuelXTL/HVOTS 15940
Max % free in EN 590diesel fuel
BTL*Bioto
Liquids
Diesel fuel components in Europe
BiodieselFatty Acid Methyl Ester
FAMEEN 14214
Max 7.0 vol-% in EN 590diesel fuel
RMERapeseed
MethylEster
SMESoybean
MethylEster
PMEPalmMethylEster
UCOMEUsed
CookingOil Methyl
Ester
Renewable DieselHydrotreatedVegetable Oil
HVO
Synthetic DieselFuelXTL
GTLGasto
Liquids
CTLCoal
toLiquids
Bio-originated
Fossil
TMETallowMethylEster
AFMEAnimal
FatMethylEster
xxMEetc.
MethylEsters
FAEE*Fatty Acid Ethyl Ester
Sub groups like with FAME
*) BTL and FAEE not commercially available

Bus Fleet Operation on RenewableParaffinic Diesel Fuel
Reijo Mäkinen, Helsinki Region TransportNils-Olof Nylund & Kimmo Erkkilä, VTT
Pirjo Saikkonen, Neste OilArno Amberla, Proventia Emission Control
JSAE20119172 SAE 2011-01-1965

JSAE20119172 SAE 2011-01-1965
Objective of the project
The goal of the “OPTIBIO” project was to verify thefeasibility of high quality, high concentration “drop-in”biofuels as fuels for urban bus fleets
general functionalitycold-weather performancecompatibility with existing infrastructure and existingvehiclesemission benefits
In this case, the fuel was paraffinic renewable diesel fuelmade by hydrotreatment of vegetable oils and animalwaste fats (HVO)

JSAE20119172 SAE 2011-01-1965
Work program
Field test with 300 buses
Engine and vehicle tests in laboratory conditions
Analysis of fuels, lubricants and diesel injectionequipment

JSAE20119172 SAE 2011-01-1965
Emissions – summaryFor details see JSAE 20119239
NOx and PM emissions over the Braunschweig city bus -cycle
0
2
4
6
8
10
12
14
0,00 0,05 0,10 0,15 0,20 0,25 0,30PM g/km
NO
xg/
km
Euro II
Euro IV
EEV
Euro III
Average reductions(fuel effect):•PM -30 %•NOx -10 %

JSAE20119172 SAE 2011-01-1965
Conclusions..High quality HVO is the fast track to biofuels implementation
a 30 % HVO blend fulfils all current diesel fuel standardsa CEN Technical Specification is in place for 100 % HVO
HVO can be implemented without any “blending wall” limitationsin existing refuelling infrastructure and vehicles over night,delivering significant emission reductions especially for particulatematter, PAH and exhaust toxicity
The buses of the OPTIBIO project travelled some 50 millionkilometers on HVO fuels, of which some 1.5 million kilometers on100 % HVO, without any problems in the field

JSAE20119172 SAE 2011-01-1965
..Conclusions
Based on the results of the OPTIBIO project, Scania hasdecided to allow the use of 100 % HVO (NExBTL) in itsengines
announcement 26.8.2011
Helsinki Region Transport now has confidence in thesuitability of HVO for bus services
the procurement process for bus services now takes into accountservices provided running on biofuels (special bonus)
The door for HVO (and BTL) is now fully open!

IEA Technology Network Cooperation:Fuel and Technology Alternatives for Buses
Overall energy efficiency and emission performance
SAE 2012 Commercial Vehicle Engineering CongressOctober 2-3, 2012
Rosemont, Illinois USAKati Koponen & Nils-Olof Nylund
VTT Technical Research Centre of Finland
SAE 2012-01-1981
3030/04/2014
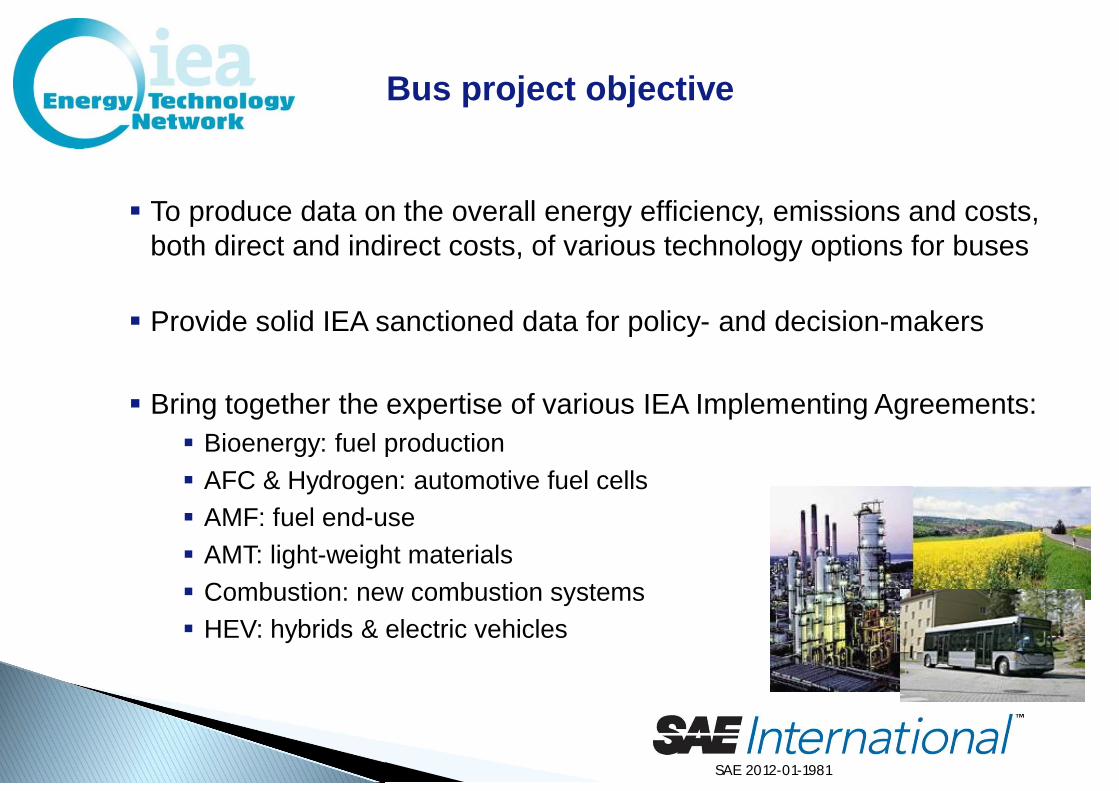
Bus project objective
To produce data on the overall energy efficiency, emissions and costs,both direct and indirect costs, of various technology options for buses
Provide solid IEA sanctioned data for policy- and decision-makers
Bring together the expertise of various IEA Implementing Agreements:Bioenergy: fuel productionAFC & Hydrogen: automotive fuel cellsAMF: fuel end-useAMT: light-weight materialsCombustion: new combustion systemsHEV: hybrids & electric vehicles
SAE 2012-01-1981

3130/04/2014
Contents
Well-to-tank analysisbased on existing data for various fuel optionsranges depending on feedstock and process
Tank-to-wheel analysisactual testing of the most relevant technology and fuel optionsfuel efficiency and exhaust emissionseffects of driving conditionsnew vehicles as well as fuel switches for older vehicles
Well-to-wheel analysissynthesis of WTT and TTW
Cost estimatesdirect costs (infrastructure, fuel and vehicle)external costs (valuation of exhaust emissions)
SAE 2012-01-1981

3230/04/2014
Elements of the project
Well-to-tank•ANL•NRCan•VTT
Overall assessment of energy, emissions,externalities and costs•ADEME•ANL•EC•NRCan•VTT
OutlookAFC
OutlookAMF
OutlookAMT
OutlookHEV
OutlookCombustion
OutlookBiofuels
OutlookHydrogen
Task and cost sharing Task sharing
Tank-to-wheel•EC•VTT•AVL MTC (on-board)•vTI (engine tests)

3330/04/2014
Example of emission factorsaccording to the RED
Sources:RED, Directive of the European Parliament of the council on the promotion of the use of energy from renewable sources. 2009/28/ECEdwards et al. Well-to-wheels analysis of future automotive fuels and powertrains in the European context.Kirkinen et al. Greenhouse impact of fossil, forest residues and jatropha diesel: a static and dynamic assessment.

3430/04/2014
Environment Canada test matrix
Vehicles5 diesel vehicles with conventional powertrain, EPA 1998 - 2010 certification2 diesel hybrid vehicles, EPA 2007 certification
FuelsULSD (commercial, oil-sands derived and certification fuel)biodiesel blends with FAME from canola, soy and tallowin addition, EC tested HVO as a blending component and as such
Test cycles7 different test cycles (UDDS, MAN, CBD, OCTA, BRA, ADEME, JE05)
Total number of combinations evaluated at EC was 68
SAE 2012-01-1981

3530/04/2014
VTT test matrix
Vehicles6 diesel vehicles with conventional power train, Euro II – EEV certification4 diesel hybrid vehicles4 alternative fuel vehicles: 2 CNG, 1 ethanol, 1 prototype DME vehicle
Fuelsconventional diesel, paraffinic GTL and HVO, FAME from Jatropha and FAMEfrom rapeseed, straight and blended fuelsmethane, additive treated ethanol, DME
Test cycles6 different test cycles (ADEME, BRA, UDDS, JE05, NYBUS, WTVC)
Total number of combinations evaluated at VTT was 112
SAE 2012-01-1981

3630/04/2014
Regulated emissionsNorth-American vehicles, Manhattan cycle
8.0
12.8
16.418.1
1.5
17.2
5.0
1.40.9 0.02.1
0.50.7 0.5 0.4 0.51.0 1.4 0.3 0.90
5
10
15
20
25
CO*10 THC*100 NOx PM*100
g/km
Regulated Emissions - Diesel Plaforms - Manhattan
EPA 1998 8.3 L EPA 2007 8.9 L EPA 2010 8.9 L (1)
EPA 2010 8.9 L (2) EPA 2010 8.9 L (3)

3730/04/2014
NOx emissions of European vehiclesBraunschweig cycle
10.1
7.7 7.45.8 6.3
4.66.0
3.9
8.3
4.3
0.8
8.6
5.5 5.1
0
2
4
6
8
10
12
g/km
NOx Emission - Braunschweig

3830/04/2014
Energy consumption of European vehiclesBraunschweig cycle
18.815.8 16.4
14.9 15.212.6 12.7
11.3 10.9 10.7
21.1 20.0
16.4 15.6
0
5
10
15
20
25
MJ/
km
Energy Consumption - Braunschweig

3930/04/2014
Fuel savings through hybridizationEuropean vehicles
103
5844
31 3529
64
36 3226
32 2738 37
2718
8 8
0
20
40
60
80
100
120
NYBUS ADEME BRA JE05 UDDS WHVC
FCl/
100
km,F
uels
avin
gs%
Conventional Vehicles vs. Hybrids
AVG EEV AVG HYBRID FUEL SAVINGS %

4030/04/2014
Fuel effects on emissions
37,7
0,2
5,8 4,6
42,9
0,1 5,6 2,4
40,2
0,1 5,5 2,2
13,3
0,0
8,5
1,10
5
10
15
20
25
30
35
40
CO*10 THC*10 NOx PM*100
g/km
EEV SCR - Fuel Effects - Braunschweig
EN590 100% GTL 100% HVO 100% RME

4130/04/2014
WTW GHG emissions - GHGenius
2 959
1 590 1 564 1 473
751
24
1 489
195 1240
5001000150020002500300035004000
gCO
2eqv
/km
WTW GHG - GHGENIUS

4230/04/2014
Summary - Vehicle
Old vs. new diesel vehicles10:1 and even more for regulated emissions100:1 for particulate numbersclose to neutral for fuel efficiency
Hybridization and light-weighting20 - 30 % reduction in fuel consumptionnot automatically beneficial for regulated emissionsenergy consumption ratio between the least fuel efficient vehicle withconventional power train and the most efficient hybrid 2:1
Effect of driving cycle5:1 for fuel consumption and regulated emissions
SAE 2012-01-1981

4330/04/2014
Summary – Fuel performance
Coal-based synthetic diesel vs. best biofuel for WTW CO2eqv120:1
Fuel effects on tailpipe emissions (when replacing regular diesel)2.5:1 at maximum for regulated emissions (particulates)4:1 for unregulated emissions
Alternative fuels (in dedicated vehicles)low PM emissions but not automatically low NOx emissionsfuel efficiency depends on combustion system (compression or spark-ignition)diesel vs. spark-ignited CNG roughly equivalent for tailpipe CO2
SAE 2012-01-1981

4430/04/2014
Final report available
http://www.vtt.fi/inf/pdf/technology/2012/T46.pdfhttp://www.iea-amf.vtt.fi/8annexreports.html
Some 400 pages including a 20-pageExecutive Summary
SAE 2012-01-1981

From well to wheel.Ett helhetsperspektiv på buss och miljö
Energieffektiv kollektivtrafik och elbussarStockholm 9.10.2013
Nils-Olof Nylund & Kimmo ErkkiläVTT Technical Research Centre of Finland
Reijo MäkinenHelsinki Region Transport
Sami OjamoVeolia Transport Finland

4630/04/2014 46
Will the future be electric?
RATP will be fully electric in 10 years!

47
The Metropolitan Helsinki eBUS project
The vehicle
How do electric buses perform?• Veolia, VTT• Bus manufacturers (BYD, Caetano,
others to follow)• Component manufacturers
(European Batteries, Vacon)• Transport Safety Agency
The transport system
How do electric buses fit into thepublic transport system?• Ministry of Transport• Helsinki Region Transport• City of Espoo• Veolia, Aalto University
The energy supply
How can electric buses berecharged and how is the grid affected?• Smart grid and smart bus depot• Fortum• Veolia, Metropolia Polytechnic, VTT
GreenPublic
E-Mobility
Public sectorPrivate sectorBus operatorResearch organization
48
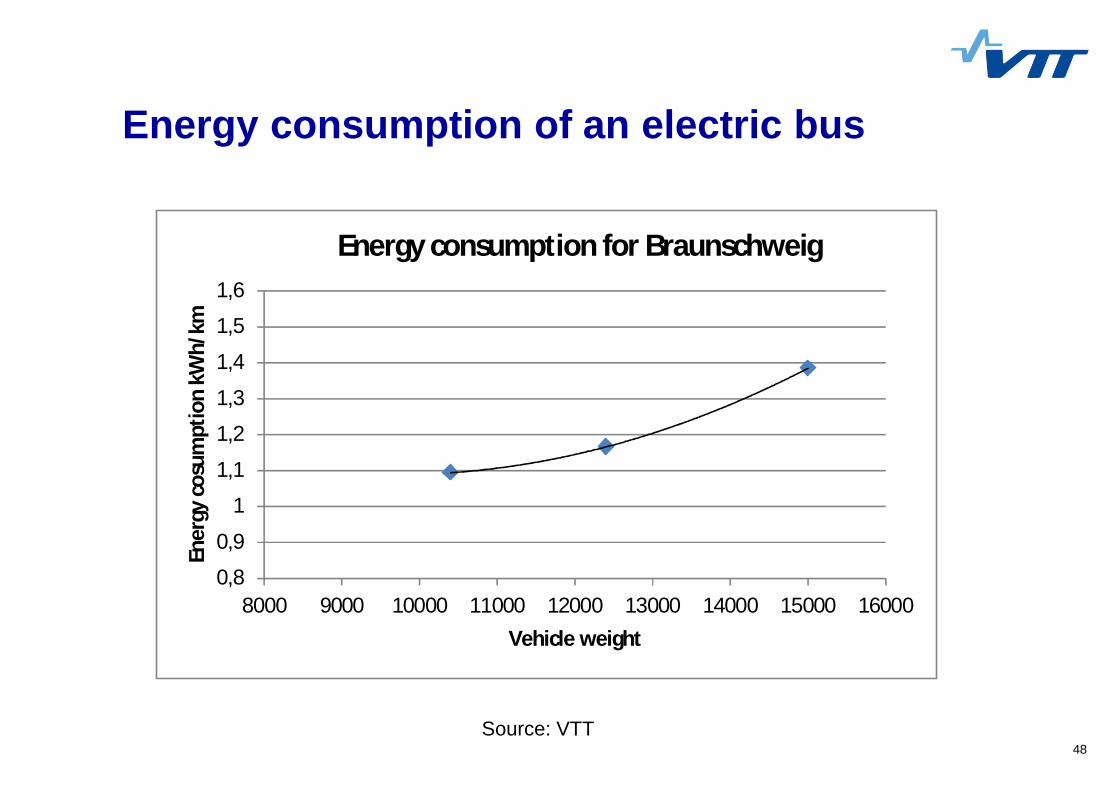
Energy consumption of an electric bus
Source: VTT
0,8
0,9
1
1,1
1,2
1,3
1,4
1,5
1,6
8000 9000 10000 11000 12000 13000 14000 15000 16000
Ener
gyco
sum
ptio
nkW
h/km
Vehicle weight
Energy consumption for Braunschweig

49
JEC WTW 2013
WTT MJ/MJ WTT g CO2eq/MJ final fuelDiesel 0,2 15,4CNG EU mix 0,16 13CBG mun. waste 0,99 14,8BTL waste wood/BL 0,91 2,5

50
So what does all this mean?

51
WTW energy use
For a given amount of gas or solid biomass,you get 1,5 – 2,5 times more mileage going the electric route!
*) 2,1 ~ 48 % eff., 2,6 ~ 38 % eff.
Diesel BTL Hybrid Hybrid BTL CNG CBG BEV ren. el. BEV NG BEV biogas BEV solid bio conv.Final energy (MJ/km, VTT) 15 15 11 11 21 21Final energy (kWh/km, VTT) 4,2 4,2 3,1 3,1 5,8 5,8 1,4 1,4 1,4 1,4WTW factor (JEC 2013) 1,2 1,91 1,2 1,91 1,16 1,99Power genetation 1/n (Ecofys, JEC 2013)*) 1 2,1 2,1 2,6Gas production & transport (JEC 2013) 1,09Gas production % clean-up (derived JEC 2013) 1,5Transmission factor (est.) 1,05 1,05 1,05 1,05Total WTW energy (kWh/km) 5,0 8,0 3,7 5,8 6,8 11,6 1,5 3,4 4,6 3,8Total WTW energy (MJ/km) 18 29 13 21 24 42 5 12 17 14

52
WTW GHG
ICE vehicles Electric vehicles

53
Summary
VTT carries out multidimensional assessment on bus performancein cooperation with Helsinki Region Transport (HRT)
HRT uses the data to formulate policies and to develop thetendering systems for bus service procurement
Over the last 15 years, tightening emission regulations andimproved engine and exhaust after-treatment technology havereduced regulated emissions dramatically
however, the reductions in real-life emissions are smaller thanindicated by the emission certification classesEuro VI looks promising
On the engine side the improvements in fuel efficiency have notbeen that spectacular, but hybridization and light-weighting canreduce fuel consumption

54
Summary
The largest variations and also uncertainties can be found forWTW CO2eqv emissions, or in fact the WTT part of the CO2eqvemissions
The most effective way to reduce regulated emissions is to replaceold vehicles with new ones
The most effective way to cut GHG emissions is to switch fromfossil fuels to efficient biofuels or low-carbon electricity in electricbuses

5530/04/2014

TECHNOLOGY FOR BUSINESS