real-time disease surveillance using twitter data...
TRANSCRIPT

Real-Time Disease Surveillance using Twitter Data:Demonstration on Flu and Cancer
Kathy Lee Ankit Agrawal Alok ChoudharyEECS Department
Northwestern UniversityEvanston, IL USA
{kml649, ankitag, choudhar}@eecs.northwestern.edu
ABSTRACTSocial media is producing massive amounts of data on an un-precedented scale. Here people share their experiences andopinions on various topics, including personal health issues,symptoms, treatments, side-effects, and so on. This makespublicly available social media data an invaluable resourcefor mining interesting and actionable healthcare insights.In this paper, we describe a novel real-time flu and can-cer surveillance system that uses spatial, temporal, and textmining on Twitter data. The real-time analysis results arereported visually in terms of US disease surveillance maps,distribution and timelines of disease types, symptoms, andtreatments, in addition to overall disease activity timelineson our project website. Our surveillance system can be veryuseful not only for early prediction of seasonal disease out-breaks such as flu, but also for monitoring distribution ofcancer patients with different cancer types and symptomsin each state and the popularity of treatments used. Theresulting insights are expected to help facilitate faster re-sponse to and preparation for epidemics and also be veryuseful for both patients and doctors to make more informeddecisions.
Categories and Subject DescriptorsH.3.3 [Information Storage and Retrieval]: Informa-tion Search and Retrieval—Information filtering, Selectionprocess
General TermsAlgorithms, Experimentation.
KeywordsInfluenza, Cancer, Disease Detection, Public Health, DiseaseSurveillance, Epidemics, Social Media, Twitter
1. INTRODUCTIONThe Internet is usually the first place people turn for healthinformation. People search for a specific disease, symptoms,and appropriate medical treatments, and often make de-cisions whether they should go see a doctor based on thesearch results. Healthcare portal sites and the social mediaare popular online health information resources among USInternet users [5]. Disease surveillance is the monitoring ofclinical syndromes such as flu and cancer that have a signifi-cant impact on medical resource allocation and health policy.Disease surveillance plays an important role in minimizingthe harm caused by the outbreaks by constantly observing
!"#$
%&'()*$
+&,&$-,.*&/)$$
&'0$
1)&"2345)$6'&"78(9$
:)./*&;<4(&"$=4'4'/$
3)5;.*&"$=4'4'/$
3)>,$=4'4'/$
Figure 1: Real-Time Disease Surveillance Sys-tem continuously downloads flu and cancer relatedtweets and applies geographical, temporal, and textmining. The real-time analysis data is visually re-ported as U.S. disease activity map, timelines, andpie charts on our project website [1][2].
the disease spread. The traditional approach employed bythe Centers for Disease Control and Prevention (CDC) [4]for flu surveillance includes the collection of Influenza-likeIllness (ILI) patients’ data from sentinel medical practices.The main drawback of this method is the 1-2 weeks time lagbetween the time of medical diagnosis and the time whenthe data becomes available. Early detection of a disease out-break is critical because it would allow faster communicationbetween health agencies and the public, and provide moretime to prepare a response. We built a novel real-time dis-ease surveillance system that uses twitter data to track USinfluenza and cancer activities. Twitter1 is a popular micro-blogging service where users can post short messages. Twit-
1https://twitter.com/
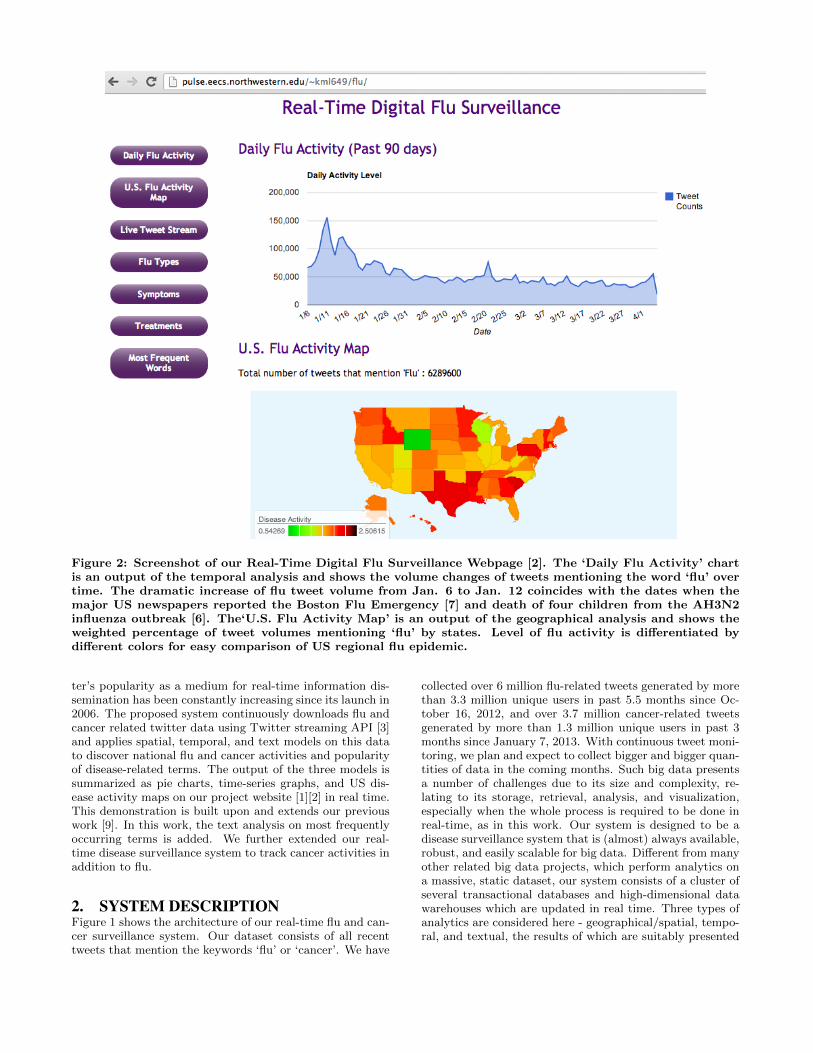
Figure 2: Screenshot of our Real-Time Digital Flu Surveillance Webpage [2]. The ‘Daily Flu Activity’ chartis an output of the temporal analysis and shows the volume changes of tweets mentioning the word ‘flu’ overtime. The dramatic increase of flu tweet volume from Jan. 6 to Jan. 12 coincides with the dates when themajor US newspapers reported the Boston Flu Emergency [7] and death of four children from the AH3N2influenza outbreak [6]. The‘U.S. Flu Activity Map’ is an output of the geographical analysis and shows theweighted percentage of tweet volumes mentioning ‘flu’ by states. Level of flu activity is differentiated bydifferent colors for easy comparison of US regional flu epidemic.
ter’s popularity as a medium for real-time information dis-semination has been constantly increasing since its launch in2006. The proposed system continuously downloads flu andcancer related twitter data using Twitter streaming API [3]and applies spatial, temporal, and text models on this datato discover national flu and cancer activities and popularityof disease-related terms. The output of the three models issummarized as pie charts, time-series graphs, and US dis-ease activity maps on our project website [1][2] in real time.This demonstration is built upon and extends our previouswork [9]. In this work, the text analysis on most frequentlyoccurring terms is added. We further extended our real-time disease surveillance system to track cancer activities inaddition to flu.
2. SYSTEM DESCRIPTIONFigure 1 shows the architecture of our real-time flu and can-cer surveillance system. Our dataset consists of all recenttweets that mention the keywords ‘flu’ or ‘cancer’. We have
collected over 6 million flu-related tweets generated by morethan 3.3 million unique users in past 5.5 months since Oc-tober 16, 2012, and over 3.7 million cancer-related tweetsgenerated by more than 1.3 million unique users in past 3months since January 7, 2013. With continuous tweet moni-toring, we plan and expect to collect bigger and bigger quan-tities of data in the coming months. Such big data presentsa number of challenges due to its size and complexity, re-lating to its storage, retrieval, analysis, and visualization,especially when the whole process is required to be done inreal-time, as in this work. Our system is designed to be adisease surveillance system that is (almost) always available,robust, and easily scalable for big data. Different from manyother related big data projects, which perform analytics ona massive, static dataset, our system consists of a cluster ofseveral transactional databases and high-dimensional datawarehouses which are updated in real time. Three types ofanalytics are considered here - geographical/spatial, tempo-ral, and textual, the results of which are suitably presented

Figure 3: Flu Symptoms Timeline. The timeline displays tweet volume changes mentioning different flusymptoms from January through March 2013. ‘Cough’ (green line) and ‘fever’ (dark orange line) reach theirhighest level in mid January and decrease as the actual national ILI level by CDC decreases.
pictorially, as described next.
2.1 Geographical AnalysisThe goal of geographical analysis is to track the diseasespread in US states by measuring the volume of flu/cancertweets generated in the region. For our experiments, weuse user’s home location in his/her Twitter profile. Thedataset for geographic analysis is all users who mention ‘flu’or ‘cancer’ and have a valid US state info (e.g., ‘Evanston,IL’, ‘somewhere in NY’) in their home location field. Weexclude tweets generated from outside the US (i.e.,tweetsfrom foreign location) and those with invalid location infor-mation (e.g., ‘travelling’, ‘Wherever the wind blows me’).In our current flu dataset, there are 458,828 users with validUS state information, and in current cancer dataset, thereare 193,797 users with valid US state information. The USFlu Activity Map is shown in Figure 2. The tweet volumementioning ‘flu’ generated in each state is normalized by thepopulation of the state.
2.2 Temporal AnalysisThe goal of temporal analysis is to track the volume changesof tweets mentioning the disease and related terms over time.
2.2.1 Disease Daily Activity TimelineAs shown in Figure 2, Daily Flu Activity chart shows thetweet volume changes of flu-related tweets over three monthsperiod from January through March 2013. The data forflu/cancer timeline is created by counting the number oftweets mentioning ‘flu’ or ‘cancer’ generated daily. Our as-sumption is that people talk more about ‘flu’ when theythemselves or people around them (family or friends) haveflu symptoms and there are more frequent news feeds whenthe epidemic is wide spread. Achrekar et al. [8] reportedthat the volume of flu-related tweets is highly correlatedwith the number of reported ILI cases by the CDC. In theflu timeline, the number of flu related tweets start increas-ing on January 6 and reaches its peak on January 12, whichcoincides with the date when The Huffington Post reported
the death of four children from the outbreak of AH3N2 in-fluenza [6]. This shows how our temporal analysis effectivelyreflects the wide spread of the epidemics.
2.2.2 Types, Symptoms, Treatments TimelineWe not only track the overall flu and cancer activities, butalso monitor disease types, symptoms, and treatments overtime. Figure 3 shows daily tweet volume changes for variousflu symptoms. From the timeline chart, we can easily tellthe types and levels of flu symptoms in the general popu-lation at a specific point in time. Cough and fever are thetwo most dominant symptoms throughout all flu season, andheadache and sore throat are the next two most common flusymptoms. The actual US national influenza activity level(percentage weighted Influenza-like Illness by the CDC) isplotted as red squares for reference. Tweet volumes men-tioning flu symptoms reach their highest point around midJanuary and decrease as the actual flu activity level fromthe CDC decreases.
2.3 Text AnalysisIn text analysis, we reveal deep health insights by examiningthe content of the tweets.
2.3.1 Disease Types, Symptoms & TreatmentsWe are interested in investigating the popularity of termsused in three categories: (1) disease types (2) symptoms (3)treatments, and have created a keyword list for each cate-gory. For example, the keyword list for cancer types is alist of breast cancer, lung cancer, skin cancer, brain cancer,etc., the keyword list for cancer symptoms is a list of lump,cough, fatigue, weight loss, etc, and the keyword list forcancer treatments is a list of surgery, radiation, chemother-apy, Emend, Xeloda, etc. We also have similar keyword listsfor ‘flu’. For ‘flu’, we have 9 flu types, 15 symptoms, and31 treatments. For ‘cancer’, we have 58 cancer types, 21symptoms, and 63 treatments. Figure 4, 5, and 6 show thedistribution of tweets mentioning a keyword in cancer types,symptoms, and treatments keyword lists.

Figure 4: Cancer Types.
Figure 5: Cancer Symptoms.
Figure 6: Cancer Treatments.
2.3.2 Most Frequent WordsWe are interested in investigating which words frequently co-occur with a disease name. After tokenizing tweet texts andremoving all stop words, we count the number of occurrenceof each unique word. Our current flu dataset (6,097,406tweets) consists of 83,896,915 words and 4,001,445 uniquewords. Figure 7 shows the top 20 most frequent words inour entire flu dataset.
Figure 7: Most Frequent Words in Flu Tweets.
3. CONCLUSIONWe built a real-time disease surveillance system that usestwitter data to automatically track flu and cancer activities.The experiments show that our disease detection system canmap US regional influenza and cancer activity levels nearreal-time, discover and compare popularity of terms relatedto flu/cancer types, symptoms, and treatments. The systemcan also effectively track daily flu/cancer activities and thevolume changes of tweets mentioning disease related termsover time. All of the output data is visualized as interac-tive maps, pie charts, and time series graphs on our projectwebsite [1][2]. Our system is highly scalable and can be eas-ily extended to track other diseases. Because the system iscompletely automated, it would be a very low-cost alterna-tive to replace the traditional high-cost disease surveillancesystem that collects public health data from sentinel medicalpractices. In the future, we are interested in using the socialnetwork information (e.g., friends and followers network) topredict the disease outbreak.
4. REFERENCES[1] Real-time digital cancer surveillance.
http://pulse.eecs.northwestern.edu/~kml649/cancer/.
[2] Real-time digital flu surveillance.http://pulse.eecs.northwestern.edu/~kml649/flu/.
[3] Twitter streaming api.https://dev.twitter.com/docs/streaming-apis.
[4] Centers for Disease Control and Prevention, seasonalinfluenza (flu). http://www.cdc.gov/flu, 2012.
[5] World of DTC Marketing.com, web first place people go forhealth information. but you knew that already didn’t you.http://worldofdtcmarketing.com, 2012.
[6] The Huffington Post, michigan flu season 2013: Fourchildren die in influenza outbreak of ah3n2.http://www.huffingtonpost.com/2013/01/12/michigan-flu-season-2013-ah3n2_n_2458916.html, 2013.
[7] USA Today, 700 cases of flu prompt boston to declareemergency. http://www.usatoday.com/story/news/nation/2013/01/09/boston-declares-flu-emergency/1820975,2013.
[8] H. Achrekar, A. Gandhe, R. Lazarus, S.-H. Yu, and B. Liu.Predicting flu trends using twitter data. In ComputerCommunications Workshops (INFOCOM WKSHPS), 2011IEEE Conference on, 2011.
[9] K. Lee, A. Agrawal, and A. Choudhary. Real-time digital flusurveillance using twitter data. In Proceedings of the 2ndWorkshop on Data Mining for Medicine and Healthcare,2013.