real-time gis for 2d and 3d mapping - esri...predictions are that 25 billion devices will be...
TRANSCRIPT

March 8–11, 2016 | Palm Springs, CA
Esri Developer Summit
Real-Time GIS for 2D and
3D MappingMorakot Pilouk, Ph.D

Agenda
• Real-Time GIS
• 2D and 3D Mapping in ArcGIS
• Authoring static Map and Scene
• Making Maps and Scenes Come Alive
• Real-Time 2D and 3D Visualization
• Conclusions
1
2
3
4
5
6

Real-Time GIS1

Real-Time GISConcepts
• Awareness of events at the same rate or at the same time as they unfold
• No significant delay
• Real time in one scenario may not be real time to another
• Real-Time is often confused with frequency or interval
• Frequency is “temporal resolution”
- Vary from one application to another
• A continuous stream of events flowing from sensors or data feeds
• Each event represents the latest state, e.g.:
- Position, temperature, pressure, voltage, concentration, etc.

Real-Time GIS and The Internet of ThingsEnable real-time spatial reasoning
• Spatial reasoning is needed amongst the Internet of Things (sensors)
• Performing continuous analytics closer to the things can improve their ability to sense
• When meaningful patterns are found things can send updates to those who need it
Gateways
GeoEvent
ArcGIS Server
ws://
Connected Cars
Connected Buildings
Connected Environment
Wearables
Smart Agriculture
Connected Retail
Connected Schools

Observation DataDefined
• An observation is a recording of states of real world objects at a location and a specific
moment in time.
- Observations are immutable, they happen and are not editable
- Observations can be replayed over space & time
- Moving observations are identifiable by a unique attribute, known as a TRACK_ID
Space & Time
AM
Observations can be
shown at a specific time
PM
Moving observations can
be identified by a unique attribute
Tracks
1
1
1
2
22
3
3
3
Observations are like
actors in a filmstrip
Moving observation illustration for two tracks
over space (x, y) and time (t)

Real-Time GISIntegration and exploitation of streaming data
• Integrates real-time
streaming data
into ArcGIS
• Performs continuous
processing and
real-time analytics
• Sends updates and alerts
to those who need it
where they need it
ArcGIS Server
GeoEvent
Extension
DesktopWeb Device

Real-Time GISArcGIS 10.4
10s of thousands of e/s
ArcGIS Spatiotemporal
Big Data Store
DesktopWeb Device
ArcGIS Server
4,000
e/s
Ingestion
GeoEvent
4,000
e/sVisualization
Live and Historic
Aggregates & Features
Spatiotemporal
Big Data Store
Enhanced Map and
Feature Service
• Can ingest higher velocity
real-time data into ArcGIS.
• Observations CAN now be
stored in a Big Data Store.
• Can visualize high
velocity and volume data
- as an AGGREGATION,
- as discrete FEATURES,
- live & HISTORICALLY.
• Visualization CAN scale.
Stream Service
Stream Layer
3,000
e/s
Live Features
KML

2D and 3D Mapping in ArcGIS2


Smart CitiesSmart Dubai

2D Mapping
• Traditionally done on a desktop app like ArcMap
• Map is a container layers of different types
- Feature Layer
- Raster Layer
- …
• Layer encapsulates a dataset with a renderer
• Renderer contains symbols
• Representing views from above

3D Mapping
• Traditionally done on desktop apps like ArcScene and ArcGlobe
• Scene is a container layers of different types
- Feature Layer
- Raster Layer
- …
• Layer encapsulates a dataset with a renderer
• Renderer contains symbols
• Not limiting to views from above

Problems with Traditional 2D and 3D Mapping
• Too many apps to learn
• Lack of synchronization between 2D maps and scenes
• Limited reusability of layers, renderers, and symbols

Combine 2D and 3D Mapping
• ArcGIS Pro
• ArcGIS Online/Portal WebMap and WebScene
• ArcGIS Explorer (Desktop)
• 2D and 3D in one environment
• Approaching seamless transition between
- Map
- 3D Flat Earth
- 3D Round Earth
• Supports synchronization of views

ArcGIS Pro Powerful 2D/3D desktop authoring and data management
3D Analyst Rich analysis for advanced 3D workflows
CityEngine Advanced editing tool for Urban Designers
ArcGIS for Server Scalable 2D/3D enterprise content distribution and geoprocessing
ArcGIS Online Content and services for sharing ideas in 2D and 3D
ArcGIS Earth Easy-to-use 3D data exploration for Enterprise users
ArcGIS Runtime Developer tools for 2D and 3D custom solutions
ArcGIS
Marketplace3rd party geospatial apps and data for the enterprise
3D across the Esri product family
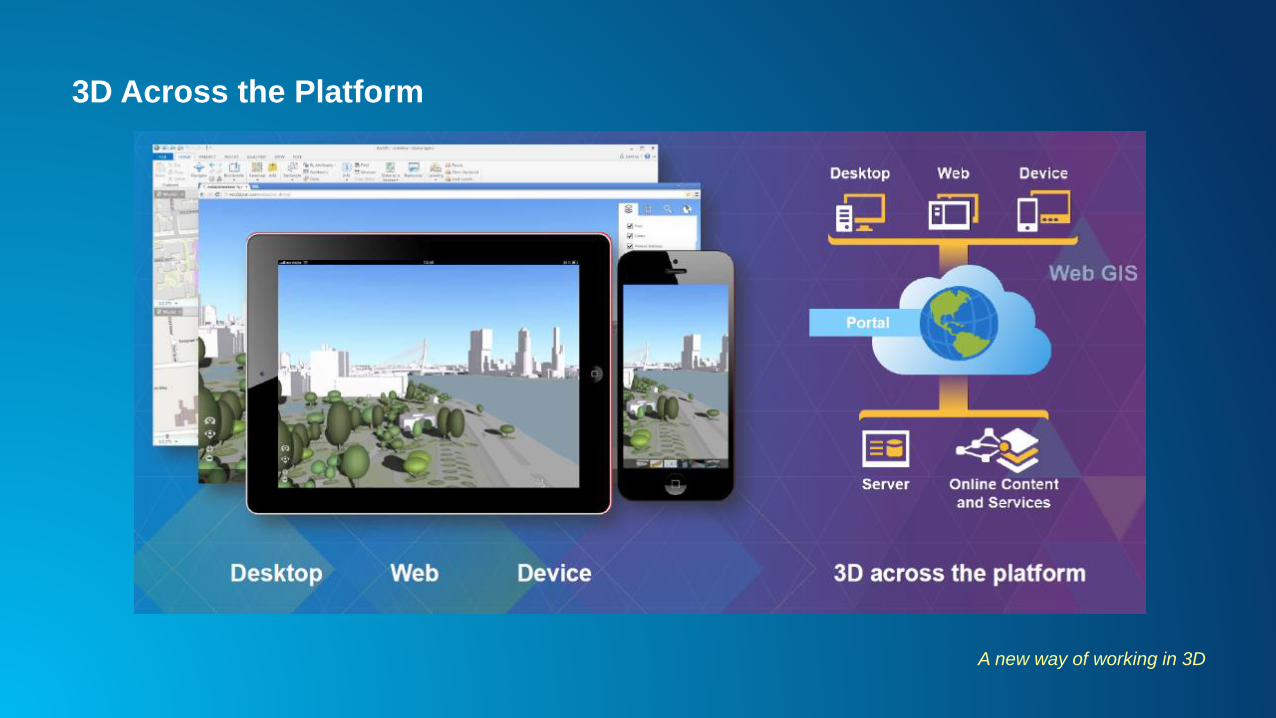
3D Across the Platform
A new way of working in 3D

ArcGIS 3D Components

3D Application Development
3D Runtime SDK
• Full 3D Runtime functions
• High performance
• Large data set
• Machine Native code
• Mobile and desktop
• Multiple codebases
JavaScript (WebGL)
• Pure browser-based
• No plugin
• Rapidly maturing
• Acceptable performance
• Works on most platforms
• One codebase

ArcGIS API for JavaScript 4.0
• One API for 2D and 3D
• Elevation
• 3D symbology
• Camera manipulation
• Animation
• Lighting/shadow

Supported Real-Time Data
• StreamLayer (from GeoEvent Stream Service) – JavaScript API 4.0
• KML
• Other data streamings (custom code)
- REST
- WebSocket
- WebRTC

Authoring Static Map and
Scene3

Creating Map/Scene Services

Publishing a Map/Scene Service

Making Maps and Scenes
Come Alive4

Making Our Virtual World Smart

Geo-smart/Geo-intelligence
• Sensors
• Internet of Things
• Smart home/office
• Connected car
• Smart airport
• …
Predictions are that 25 billion devices will be connected by 2015, and 50 billion by 2020.

Smartphones
• Accelerometer
• Gyroscope
• Magnetometer
• Proximity sensor
• Light sensor
• Barometer
• Pedometer
• Heart rate monitor
• Camera
• …

Microsoft Hololens

Two patterns of Real-time GIS
Stream services vs. traditional feature services
• Feature layers pull from feature services
- Web apps poll to get periodic updates
- Data is persisted, last known snapshots are always available for retrieving
• Stream layers subscribe to stream services
- Web apps subscribe to immediately receive data
- Low latency and high throughput
- Need to wait for the data flow after connection
GeoEvent Extension
ArcGIS Server
Your
Applications
Stream Layer
Map Services
Feature Services
Feature Layer
feature layers
Update a Feature
Add a Feature
EGDB
Polling
(Pull)
Stream Services
Send Features to a Stream Service

Two patterns, two important differences
Stream services vs. traditional feature services
• Feature services persist their data in a Geodatabase
• Stream services broadcast their data without first persisting the data
GeoEvent Extension
ArcGIS Server Your
Applications
Stream Layer
Map Services
Feature Services
Feature Layer
feature layers
Update a Feature
Add a Feature
EGDB
Polling
(Pull)
Stream Services
Send Features to a Stream Service

• ArcGIS Online and Portal for ArcGIS Web Maps
• ArcGIS Online and Portal for ArcGIS web application templates
• Web applications built using Web AppBuilder
• Your own web apps that use the ArcGIS API for JavaScript
What can I use to consume stream services?
Support for stream services (since the 10.3 product release)

• Not available out-of-box!
• Obtain the KML Connector for GeoEvent on GeoEvent Gallery (10.2.x)
http://www.arcgis.com/home/item.html?id=8ddf65e2d9894d37ae19856671392c45
• Obtain source code from GitHub (updated to 10.4) and build it
https://github.com/Esri/kml-for-geoevent
• Deploy the jar to GeoEvent\deploy folder
• Create Output
How to enable KML service
KML Service

Demo Publishing
Real-Time Services

Real-Time GISIntegration & exploitation of high velocity & volume data
DesktopWeb Device
GeoEvent
Extension
GeoAnalytics
Extension
A
ArcGIS Server
“Continuous”
Analytics
“Batch”
Analytics
tens of
thousands e/s
Ingestion
high velocity and
volume data
Visualization• Integrates real-time high
velocity & volume data
into ArcGIS
• Performs continuous
processing &
real-time analytics
• Sends updates & alerts
to those who need it
where they need it
ArcGIS
Big Data Store
Storage

High Velocity AnalyticsContinuous Analytics
10.4

Real-Time 2D and 3D
Visualization5

• 3D scene contains continuous scale
- depending on the positions of viewer and target
• Use high LOD 3D symbol to represent objects close to the viewer
• Use low LOD symbol for objects that are further away from the viewer
- Billboard 2D graphics
- Simple geometric shape (e.g. spheres)
• Remove objects that are too close or too far from the scene
- Use view volume culling
- Use fog (particle system)
Keeping up the 3D display performance
3D Visualization Techniques

Demo Visualization
Techniques

KML on ArcGIS Explorer

KML on ArcGIS Earth (1.2)

Demo 3D Seattle
Buses

Demo Esri Real-
Time 3D Apps

Conclusions6
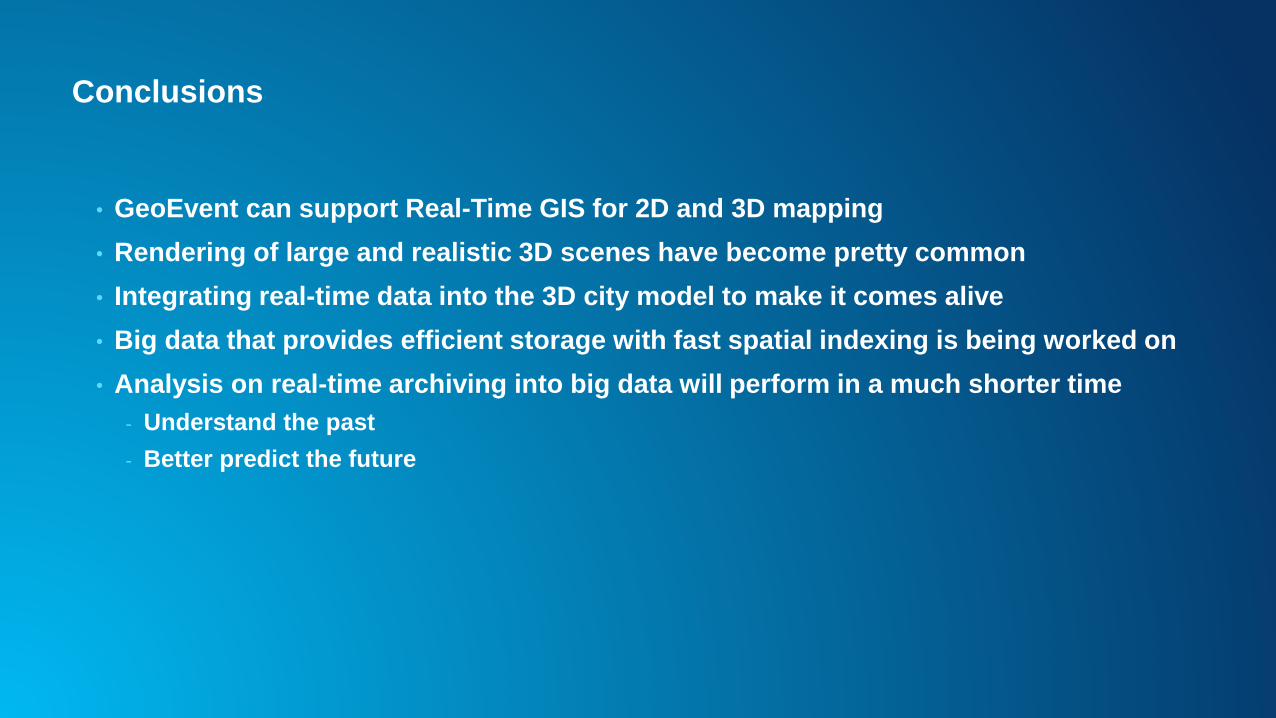
Conclusions
• GeoEvent can support Real-Time GIS for 2D and 3D mapping
• Rendering of large and realistic 3D scenes have become pretty common
• Integrating real-time data into the 3D city model to make it comes alive
• Big data that provides efficient storage with fast spatial indexing is being worked on
• Analysis on real-time archiving into big data will perform in a much shorter time
- Understand the past
- Better predict the future

Who do you want to be?

Questions / Feedback?
http://links.esri.com/geoevent
https://links.esri.com/geoevent-forum
To learn more:
Morakot Pilouk, Ph.D.Senior Software Developer, Esri
@mpEsri
