real-world emissions in china · · 2018-02-09real-world emissions in china: ... and an anonymous...
TRANSCRIPT

FEBRUARY 2018WHITE PAPER
REAL-WORLD EMISSIONS IN CHINA:A META-STUDY OF PEMS EMISSIONS DATA FROM CHINA 0
TO CHINA 5/V LIGHT- AND HEAVY-DUTY VEHICLES
Liuhanzi Yang
BEIJING | BERLIN | BRUSSELS | SAN FRANCISCO | WASHINGTON
www.theicct.org

ACKNOWLEDGMENTS
The author acknowledges Michael Walsh, Dagang Tang, Dr. Yan Ding (Vehicle Emission Control Center, China Ministry of Environmental Protection), Dr. Ye Wu (Tsinghua University), Dr. Jingnan Hu (China Research Academy of Environmental Sciences), Dr. Vicente Franco (Directorate-General for the Environment, European Commission), Dr. Shaojun Zhang (Cornell University), Tonny Xie (Innovation Center for Clean-Air Solutions), Dr. Xuan Zheng (Tsinghua University), Liqiang He (Tsinghua University), and an anonymous reviewer for their guidance and constructive comments. We thank our ICCT colleagues John German, Rachel Muncrief, Hui He, Yoann Bernard, Fanta Kamakaté, Ray Minjares, and Francisco Posada for their valuable input and support for the project. This study was funded through the generous support of the Joshua and Anita Bekenstein Charitable Fund.
International Council on Clean Transportation 1225 I Street NW, Suite 900Washington, DC 20005 USA
[email protected] | www.theicct.org | @TheICCT
© 2018 International Council on Clean Transportation
i
META-STUDY OF PEMS DATA FROM LIGHT- AND HEAVY-DUTY VEHICLES IN CHINA
TABLE OF CONTENTS
Executive summary .................................................................................................................. iii
Abbreviations ............................................................................................................................ vi
1. Introduction ............................................................................................................................1
2. Background .......................................................................................................................... 2
2.1 The real-world emissions problem ...............................................................................................2
2.2 Current development of PEMS regulations in China ...........................................................3
2.3 Emissions control technologies for compliance with standards .................................... 7
3. Data sources and analysis ...................................................................................................9
3.1 Data sources .........................................................................................................................................9
3.2 Data analysis method .................................................................................................................... 10
4. Results ..................................................................................................................................12
4.1 Results for LDVs ...............................................................................................................................12
4.2 Results for HDVs .............................................................................................................................23
5. Discussion ...........................................................................................................................27
5.1 Discussion of LDVs ...........................................................................................................................27
5.2 Discussion of HDVs ........................................................................................................................30
6. Conclusions and recommendations ...............................................................................33
6.1 Conclusions and recommendations for LDVs ...................................................................... 33
6.2 Conclusions and recommendations for HDVs ..................................................................... 34
References ...............................................................................................................................35
Appendix ................................................................................................................................ 40

ii
ICCT WHITE PAPER
LIST OF TABLES
Table 1. Comparison of China 6 and Euro 6 RDE requirements ................................................... 4
Table 2. Comparison of requirements under supplemental China V, proposed China VI, and Euro VI PEMS standards .............................................................................................. 6
Table 3. Emissions control technologies for China 1 to China 5 gasoline cars ........................7
Table 4. NOX emissions control technologies for China I to China V HDVs ............................. 8
Table 5. Overview of gasoline LDVs included in the study ............................................................ 9
Table 6. Overview of diesel HDVs included in the study ................................................................ 9
Table 7. Emissions and trip summary of PC 22, 25, and 47........................................................... 17
Table 8. Emissions and trip summary of PC 49 and PC 52 ..........................................................20
Table 9. Emissions and trip summary of Truck 53, Bus 3, and Bus 9 .......................................26
LIST OF FIGURES
Figure 1. In-use fleet breakdown from China 0 to China 5/V LDVs and HDVs in China in 2016.............................................................................................................................................2
Figure 2. Real-world NOX, CO and THC emissions factors for gasoline cars, by emissions standard and vehicle category .................................................................................. 13
Figure 3. Real-world NOX, CO, and THC emissions of gasoline cars, by vehicle .................. 15
Figure 4. Average NOX, CO, and THC CFs of China 4 taxis with removed, high-mileage, normal, and new TWCs ............................................................................................... 16
Figure 5. Situation-specific emissions analysis of PC 22 (removed TWC), PC 25 (high-mileage TWC) and PC 47 (new TWC) ..................................................................... 18
Figure 6. Instantaneous NOX emissions and velocity profiles of PC 22, 25, and 47............ 19
Figure 7. Situation-specific emissions analysis of PC 49 and PC 52 ..........................................21
Figure 8. Instantaneous NOX and CO emissions and velocity profiles of PC 49 and PC 52 ........................................................................................................................................22
Figure 9. Average real-world NOX/CO2 emissions of HDVs, by emissions standard and vehicle category ............................................................................................................ 23
Figure 10. Real-world NOX/CO2 emissions of diesel HDVs, by vehicle .................................... 24
Figure 11. Overview of CO2 and NOX emissions factors of diesel buses, by vehicle........... 25
Figure 12. Situation-specific emissions analysis of Truck 53, Bus 3, and Bus 9 .................. 26
Figure 13. Real-world NOX and CO emissions factors of China 4 taxis of same model with different mileage readings ............................................................................................ 28
Figure 14. CO and THC emissions factors of all gasoline cars tested in this study ............ 29

iii
META-STUDY OF PEMS DATA FROM LIGHT- AND HEAVY-DUTY VEHICLES IN CHINA
EXECUTIVE SUMMARY
Although vehicle emissions standards have been progressively tightened over time, emissions under real-world driving conditions are in some instances found to be substantially higher than laboratory-certified levels. A previous ICCT study based on portable emissions measurement system (PEMS) measurements in Europe and the United States showed that on-road nitrogen oxides (NOX) emissions from modern diesel passenger cars can exceed the certified emissions limit by a factor of more than 25, with average on-road emissions factors of seven times the Euro 6 limit (Franco et al., 2014). A series of studies based on PEMS measurements in China showed that China III and IV heavy-duty vehicles failed to show a significant reduction in NOX compared with China 0 vehicles (Wu et al., 2012; Zhang, 2013). The real-world emissions problem is widely attributed to deficiencies of the current type-approval protocols for light- and heavy-duty vehicles (LDVs and HDVs), which include unrepresentative test cycles and procedures, and to weak in-use compliance programs. In response, a new test procedure modeled on the European Real Driving Emissions (RDE) regulation has been introduced in the China 6 LDV emissions standard, and a new full-vehicle real-world emissions testing procedure is likely to be included in the China VI HDV standard. Under the new test protocols, vehicles will have to pass not only the chassis/engine dynamometer emissions test in the laboratory but also an on-road emissions test using a PEMS.
In this meta-study, existing real-world emissions data from multiple sources of vehicle tests in China were collected and analyzed. The data include emissions of NOX, carbon monoxide (CO), and total hydrocarbons (THC) from 55 LDVs and 67 HDVs tested using PEMS. The vehicle sample covers a wide range of emissions standards—from China 0 to China 5/V—and vehicle types—gasoline private cars, gasoline taxis, diesel heavy-duty trucks, and diesel urban buses. The results add to the growing evidence that vehicle emissions, especially of NOX, are not properly controlled under real-world driving conditions in China.
For LDVs, emissions standards have played an important role in reducing vehicle emissions in China. NOX, CO, and THC emissions have declined significantly as vehicle technology has improved since China 4 (see Figure ES1 for NOX findings). Therefore, accelerating the phase-out of old, high-emitting vehicles would bring a substantial reduction of overall vehicle emissions in China. For some modern China 4 and China 5 gasoline cars, real-world NOX emissions significantly exceed type-approval limits, while some other models have extremely low NOX emissions. Some taxis appeared to have removed three-way catalysts (TWCs, the main gasoline exhaust aftertreatment technology). Tests show that average NOX emissions from these taxis was 72 times that of taxis with functioning TWCs.

iv
ICCT WHITE PAPER
1 2 3 4 5 6 7 8 9 10 11 12 13 14 15 16 17 18 19 20 21 22 23 24 25 26 27 28 29 30 31 32 33 34 35 36 37 38 39 40 41 42 43 44 45 46 47 48 49 50 51 52 53 54 55 56 57 58 59
Passenger Car No.
0
0.5
1
1.5
2
2.5
3
3.5
NO
X (
g/k
m)
China 5 limitChina 4 limitChina 3 limit
Private car
Taxi
China 4
China 2
China 0
China 5
China 3
China 1
Removed TWC
New TWC
Figure ES1. Real-world NOX emissions from gasoline cars, by vehicle.
Different colors indicate emissions standards from China 0 to China 5. Solid bars are private cars and open bars are taxis. Stars indicate vehicles with removed TWC. Triangles indicate cars with newly replaced TWC.
For HDVs, no significant improvement in the average ratio of NOX to CO2 emissions—a measure of tailpipe NOX emissions relative to fuel consumption—can be observed as the emissions standard improves (see Figure ES2). Even though NOX limits decreased by 56% on paper from the China I to the China IV standard, real-world NOX emissions from modern HDVs are not following the reduction pattern set by the standards. While some of the China III/IV trucks are better than others, even the best trucks are not significantly improved from the best China I truck. Unlike diesel trucks, remarkable differences can be observed in the performance of buses. Surprisingly, some of the best and worst bus performers are from the same model produced by the same manufacturer. This suggests widespread failure to refill urea tanks in use or the removal of selective catalytic reduction (SCR) systems, the aftertreatment device equipped on HDVs since China IV.
v
META-STUDY OF PEMS DATA FROM LIGHT- AND HEAVY-DUTY VEHICLES IN CHINA
1 2 3 4 5 6 7 8 9 10 11 12 13 14 15 16 17 18 19 20 21 22 23 24 25 26 27 28 2930 31 32 33 34 35 36 37 38 3940 41 424344454647484950 51 52 53
Truck No.
0
5
10
15
20
25
30
35
g N
OX/k
g C
O2
1 2 3 4 5 6 7 8 9 10 11 12 13 14
Bus No.
Estimated China V limit
Estimated China IV limit
Estimated China III limit
Truck
Bus
China IV
China II
China V
China III
China I
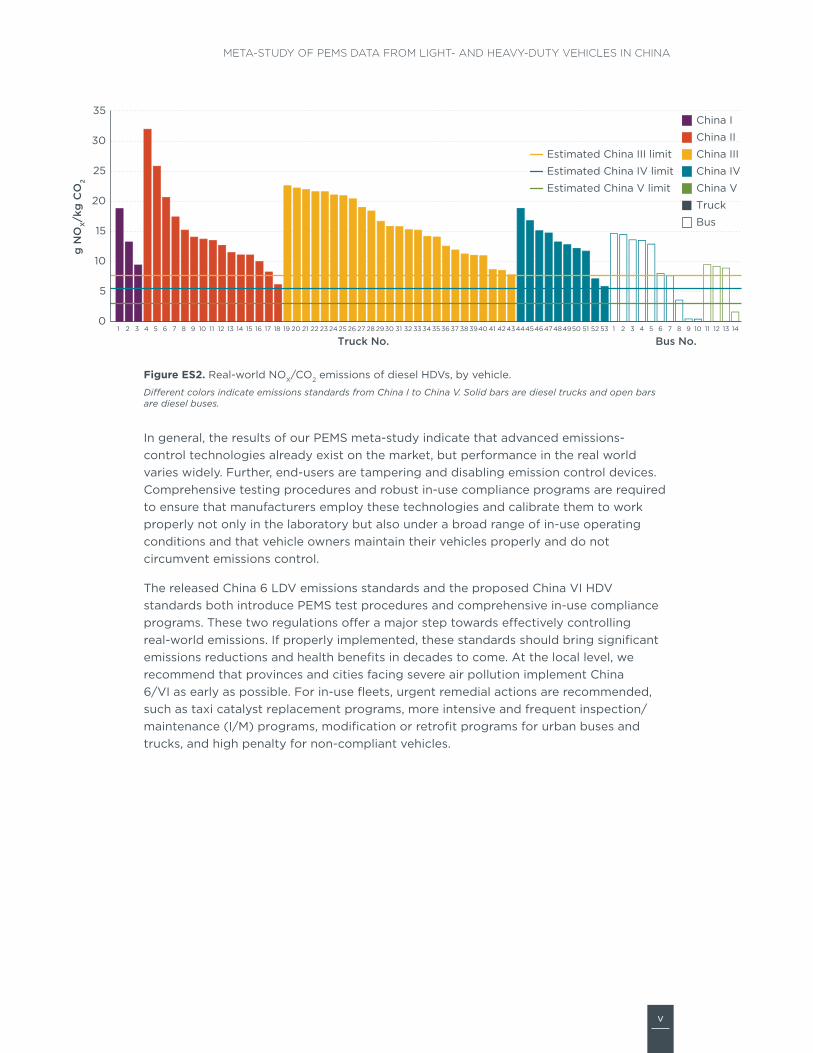
Figure ES2. Real-world NOX/CO2 emissions of diesel HDVs, by vehicle.
Different colors indicate emissions standards from China I to China V. Solid bars are diesel trucks and open bars are diesel buses.
In general, the results of our PEMS meta-study indicate that advanced emissions-control technologies already exist on the market, but performance in the real world varies widely. Further, end-users are tampering and disabling emission control devices. Comprehensive testing procedures and robust in-use compliance programs are required to ensure that manufacturers employ these technologies and calibrate them to work properly not only in the laboratory but also under a broad range of in-use operating conditions and that vehicle owners maintain their vehicles properly and do not circumvent emissions control.
The released China 6 LDV emissions standards and the proposed China VI HDV standards both introduce PEMS test procedures and comprehensive in-use compliance programs. These two regulations offer a major step towards effectively controlling real-world emissions. If properly implemented, these standards should bring significant emissions reductions and health benefits in decades to come. At the local level, we recommend that provinces and cities facing severe air pollution implement China 6/ VI as early as possible. For in-use fleets, urgent remedial actions are recommended, such as taxi catalyst replacement programs, more intensive and frequent inspection/maintenance (I/M) programs, modification or retrofit programs for urban buses and trucks, and high penalty for non-compliant vehicles.

vi
ICCT WHITE PAPER
ABBREVIATIONS
v*a Velocity times accelerationBJEPB Beijing Municipal Environmental Protection BureauCF Conformity FactorCO Carbon monoxideCO2 Carbon dioxideEGR Exhaust Gas Recirculation EPB Environmental Protection BureauETC European Transient CycleEU the European UnionI/M Inspection/maintenanceHDV Heavy-duty vehicleLDV Light-duty vehicleMEP Ministry of Environmental Protection of ChinaMPFI Multi Point Fuel Injection NEDC New European Driving CycleNO Nitric oxideNOX Nitrogen oxidesNTE Not-to-exceedOBD On Board Diagnostics PC Passenger carPEMS Portable Emissions Measurement System PN Particle number RDE Real-Driving EmissionsSCR Selective Catalytic Reduction THC Total HydrocarbonsTWC Three-way catalyst U.S. United States of AmericaWHTC World Harmonized Transient CycleWLTC Worldwide Harmonized Light Vehicles Test Cycle

1
META-STUDY OF PEMS DATA FROM LIGHT- AND HEAVY-DUTY VEHICLES IN CHINA
1. INTRODUCTION
Following a series of rapid economic developments, China has been the world’s largest vehicle market for the eight years since 2009 (CAAM, 2017). As a result, motor vehicles have become one of the most significant sources of air pollution in China. In some mega-cities, such as Beijing and Shenzhen, vehicle emissions are the greatest local contributor to ambient fine particulate matter pollution (BJEPB, 2014; GDEP, 2015). In response to the severe air pollution problem, China has implemented a series of comprehensive vehicle emissions control measures, including adoption of increasingly stringent emissions standards for new vehicles, scrappage and driving restrictions on high-emitting, in-use vehicles, and improvements in fuel quality requirements. Studies based on emissions inventories have demonstrated that, in general, the vehicle emissions control programs in China have resulted in considerable progress, mainly attributed to the uptake of emissions control technologies driven by increasingly stringent standards as well as improved fuel quality (Wu et al., 2016). Nevertheless, challenges remain regarding the compliance with emissions standards for in-use vehicles under real-world driving conditions. A growing number of studies in China has shown that real-world emissions can be significantly higher than the corresponding certification levels as tested in the laboratory (Huo et al., 2012; Wu et al., 2012; Zhang et al., 2014). In particular, the real-world NOX emissions from the heavy-duty sector did not improve under real-world operating conditions with more stringent emissions standards (Wu et al., 2012).
There have been plenty of on-road PEMS measurement campaigns deployed in China since 2005 (Chen et al., 2007; Wang et al., 2011; Liu et al., 2011; Huo et al., 2012; Wu et al., 2012; Huang et al., 2013; Zhang et al., 2014; Guo et al., 2015; He et al., 2017, etc.). But those tests were conducted by different research groups, and the data were usually processed using different analysis methodologies. The objective of this project is to collect PEMS data from existing measurement campaigns in China and perform a meta-study using a consistent analytical method. We intend the findings to provide useful information for regulatory agencies in support of the development of future emissions standards, test protocols, and in-use compliance programs. In this study, PEMS emissions data from 55 LDVs and 67 HDVs were collected and analyzed. The data covers more than 210 hours and 6,300 km of second-by-second data. This data also incorporates some recent PEMS test results from China 5/V vehicles tested in 2016 that have not been published before.
The report is organized as follows: Section 2 provides background information on the real-world emissions problem, current regulatory developments around PEMS in China, and the emissions control technologies required for compliance with standards. Section 3 describes the data sources and data analysis methods applied in this study. A detailed analysis of the test results is presented in Section 4, followed by a discussion in Section 5 of the implications of the test findings. The final Section 6 summarizes key findings and provides high-level regulatory recommendations on next steps to establish a robust vehicle emissions compliance program in China.

2
ICCT WHITE PAPER
2. BACKGROUND
2.1 THE REAL-WORLD EMISSIONS PROBLEMStarting in the 1960s, countries around the world introduced and gradually tightened emissions standards for new motor vehicles. Emissions certification tests are typically carried out under laboratory conditions, either on a vehicle chassis dynamometer for LDVs or engine dynamometer for HDVs. China implemented its first vehicle emissions standard in 2000 (China 1/I, equivalent to Euro 1/I), and progressively strengthened the standards following the European regulatory template. Figure 1 shows the in-use fleet breakdown from China 0 (pre-China 1/I) to China 5/V LDVs and HDVs in China in 2016 (MEP, 2017a).
China 0,1.0%
China 1/I,5.4%
China 2/II,6.4%
China 3/III,24.3%
China 4/IV,52.4%
China5/V,
10.5%
Figure 1. In-use fleet breakdown from China 0 to China 5/V LDVs and HDVs in China in 2016
As new-vehicle standards are tightened over time, the emissions and health benefits can truly materialize only if the emissions control technologies are effective not only in the lab but also in real-world driving throughout the vehicles’ useful life. However, emerging studies from the United States and Europe have shown that on-road emissions can diverge significantly from laboratory results. A previous ICCT study based on PEMS measurements in Europe and the United States showed that on-road NOX emissions from modern diesel passenger cars can exceed the certified emissions limit by a factor of more than 25, with average on-road emissions factors of seven times the Euro 6 limit (Franco et al., 2014). For HDVs, New Euro IV and V heavy-duty trucks and buses equipped with SCR systems recorded significantly elevated NOX emissions in real-world operation compared with laboratory test results, especially in urban driving (Lowell & Kamakaté, 2012).
Similar results are also found in China. A series of studies based on PEMS measurements in China showed that China II and III trucks and buses failed to show a reduction in NOX compared with China 0 HDVs (Zhang, 2013). NOX emissions from China IV buses equipped with SCR systems were similar to those of China III buses (Wu et al., 2012). For gasoline LDVs, the average CO, THC, and NOX emissions were reduced significantly from China 1 to China 4, whereas a few old gasoline taxis were identified as having emissions equivalent to those of China 0 LDVs (Huo et al., 2012).

3
META-STUDY OF PEMS DATA FROM LIGHT- AND HEAVY-DUTY VEHICLES IN CHINA
High real-world emissions are mostly attributed to shortcomings in the current type-approval protocols for LDVs and HDVs. For LDVs, one major reason is that the New European Driving Cycle (NEDC) test applied at type-approval from China 1 to China 5 does not capture the full range of driving conditions in the real world (Kågeson, 1998; Mellios et al., 2011). For HDVs, the European Transient Cycle (ETC) applied from China III to China V has a higher average engine load and power and less idling time, which does not represent real driving conditions (Lowell & Kamakaté, 2012). This bias would be more significant for urban buses (Wu et al., 2012). In addition, for both LDVs and HDVs, the lack of in-use conformity provisions and enforcement is another major cause for high real-world emissions from in-use vehicles.
2.2 CURRENT DEVELOPMENT OF PEMS REGULATIONS IN CHINAIn the past, vehicles were typically tested in laboratories. In a chassis dynamometer laboratory for light vehicles, a driver operates the auto to match a predetermined time-speed profile and gear change pattern while the exhaust gas is collected in sampling bags for later analysis or processed by on-line chemical analyzers. Because of its high repeatability and reproducibility, laboratory testing is the standard technology for vehicle emissions measurements for regulatory purposes worldwide. However, growing evidence indicates that the chassis/engine dynamometer test does not fully represent real driving situations because of limitations on driving cycles and test procedure, such as road load determination and ambient temperature.
PEMS is a complete set of emissions measurement equipment that can be carried out on a vehicle while driving on normal roads. On-line analyzers can be directly connected to the tailpipe to measure exhaust emissions in real time. The most important advantage of PEMS testing is that it can measure tailpipe emissions during a wide variety of real-world driving conditions (Mock & German, 2015). PEMS has proven to be an effective tool for measuring real-world vehicle emissions, and it has been adopted around the world for research purposes for more than a decade (Franco et al., 2014). In recent years, PEMS has also been introduced for regulatory purposes for both LDVs and HDVs in the United States, the EU, and China.
In January 2011, the European Commission established a working group involving all interested stakeholders to develop a new testing procedure to better control on-road emissions (Mock, 2017). In May 2015, after three years of research and discussion, the European Commission approved the new Real Driving Emissions (RDE) test procedure for type approval of Euro 6 light passenger and commercial vehicles, taking effect in September 2017 (European Commission, 2016a, 2016b). With the new RDE test procedure, LDVs will have to pass not only the chassis dynamometer test in the laboratory but also an on-road test using PEMS. In the EU, RDE is first being used for new vehicle type approval and will eventually be used for in-service conformity testing (Mock, 2017).
The China LDV emissions regulations follow EU regulatory pathways, with the implementation dates of the China LDV standards generally lagging behind the equivalent EU standard by five to eight years. The China 6 standard, first proposed in May 2016 and finalized in December 2016, introduced RDE testing for vehicle type-approval and in-use compliance (MEP, 2016a). The China 6 RDE regulation is primarily based on the Euro 6 RDE Package 2 passed in April 2016 (European Commission, 2016b), with a few enhancements and modifications for the Chinese context. For NOX

4
ICCT WHITE PAPER
and particle number (PN), only monitoring and recording are required before July 2023, and conformity factors (CF, defined as the ratio of measured on-road emissions factors over the regulated limits) will be enforced starting in July 2023. The CFs of NOX and PN are temporarily set at 2.1 and will be re-evaluated and determined by July 2022. For passenger cars, for example, this leads to not-to-exceed (NTE) limits of 0.0735 g/ km for NOX and 1.26 x 10¹² #/km for PN. Although no CF has been set for CO, it will be monitored in RDE tests.
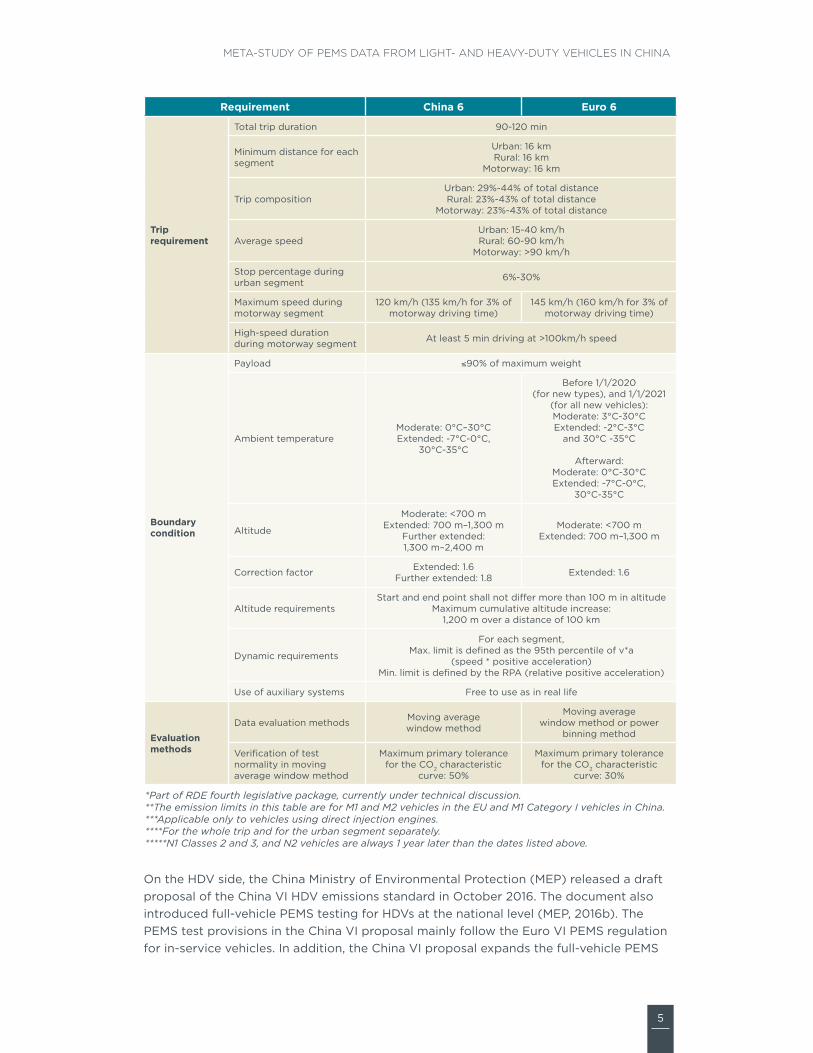
Even though RDE testing is conducted on public roads open to traffic, boundary conditions and criteria have been set to define a valid RDE trip. For instance, the total trip duration, composition of urban, rural, and motorway driving as defined by speed bins, average and maximum speed, ambient temperature, altitude, and dynamic requirements are specified in the RDE regulation. Compared with the EU RDE, China 6 extends the maximum altitude boundary to 2,400 m from 1,300 m, introduces a correction factor of 1.8 for extended high-altitude driving at 1,300-2,400 m, and reduces the maximum speed during motorway driving to 120 km/h from 145 km/h. The data processing method in China 6 follows the moving average window method developed in the EU RDE regulation, and the power binning method in EU RDE is removed. Table 1 provides a detailed comparison of the China 6 and Euro 6 RDE Package 3 requirements. 1
Table 1. Comparison of China 6 and Euro 6 RDE requirements
Requirement China 6 Euro 6
Application Type Test1/Approval Yes Yes
In-service test Yes Yes*
Emission standard
Regulated pollutants NOX and PN after monitoring periodMonitoring for CO
Binding limits in Type I Test**
Fuel-neutralNOX: 0.035 g/kmPN: 6 x 10¹¹ #/km
NOX:Diesel: 0.08 g/km
Gasoline: 0.06 g/kmPN***: 6 x 10¹¹ #/km
Conformity factors****(effective date)
NOX and PN:All new vehicles: 2.1 (7/1/2023)
NOX:New types: 2.1 (9/1/2017)
All new vehicles: 2.1 (9/1/2019)New types: 1.5 (1/1/2020)
All new vehicles: 1.5 (1/1/2021)*****
PN:New types: 1.5 (9/1/2017)
All new vehicles: 1.5 (9/1/2018)*****
Cold starts Excluded Included
1 Per requirements in China’s newly amended Air Pollution and Control Law, starting from the China 6/VI regulation, the regulatory agency no longer type approves new vehicle models. The Chinese MEP used to have a procedure of issuing certification to new vehicle models that are tested to comply with emission standards. This procedure was referred to as vehicle type approval. Under the new law, vehicle manufacturers self-test and self-certify their new vehicle models and need to report to the regulatory agency and publish required information to the public. MEP still establishes the test protocols and emission limits for all required tests. The set of tests are referred to as type tests.
5
META-STUDY OF PEMS DATA FROM LIGHT- AND HEAVY-DUTY VEHICLES IN CHINA
Requirement China 6 Euro 6
Trip requirement
Total trip duration 90-120 min
Minimum distance for each segment
Urban: 16 kmRural: 16 km
Motorway: 16 km
Trip composition Urban: 29%-44% of total distanceRural: 23%-43% of total distance
Motorway: 23%-43% of total distance
Average speed Urban: 15-40 km/hRural: 60-90 km/h
Motorway: >90 km/h
Stop percentage during urban segment 6%-30%
Maximum speed during motorway segment
120 km/h (135 km/h for 3% of motorway driving time)
145 km/h (160 km/h for 3% of motorway driving time)
High-speed duration during motorway segment At least 5 min driving at >100km/h speed
Boundary condition
Payload ≤90% of maximum weight
Ambient temperatureModerate: 0°C–30°CExtended: -7°C-0°C,
30°C-35°C
Before 1/1/2020 (for new types), and 1/1/2021
(for all new vehicles):Moderate: 3°C-30°CExtended: -2°C-3°C
and 30°C -35°C
Afterward:Moderate: 0°C-30°CExtended: -7°C-0°C,
30°C-35°C
Altitude
Moderate: <700 mExtended: 700 m–1,300 m
Further extended: 1,300 m–2,400 m
Moderate: <700 mExtended: 700 m–1,300 m
Correction factor Extended: 1.6Further extended: 1.8 Extended: 1.6
Altitude requirementsStart and end point shall not differ more than 100 m in altitude
Maximum cumulative altitude increase:1,200 m over a distance of 100 km
Dynamic requirements
For each segment,Max. limit is defined as the 95th percentile of v*a
(speed * positive acceleration)Min. limit is defined by the RPA (relative positive acceleration)
Use of auxiliary systems Free to use as in real life
Evaluation methods
Data evaluation methods Moving average window method
Moving average window method or power
binning method
Verification of test normality in moving average window method
Maximum primary tolerance for the CO2 characteristic
curve: 50%
Maximum primary tolerance for the CO2 characteristic
curve: 30%
*Part of RDE fourth legislative package, currently under technical discussion.**The emission limits in this table are for M1 and M2 vehicles in the EU and M1 Category I vehicles in China.***Applicable only to vehicles using direct injection engines.****For the whole trip and for the urban segment separately. *****N1 Classes 2 and 3, and N2 vehicles are always 1 year later than the dates listed above.
On the HDV side, the China Ministry of Environmental Protection (MEP) released a draft proposal of the China VI HDV emissions standard in October 2016. The document also introduced full-vehicle PEMS testing for HDVs at the national level (MEP, 2016b). The PEMS test provisions in the China VI proposal mainly follow the Euro VI PEMS regulation for in-service vehicles. In addition, the China VI proposal expands the full-vehicle PEMS

6
ICCT WHITE PAPER
test to both type test and in-service test. Similar to the LDV RDE, there are specific trip validity criteria in the China VI proposal. For diesel HDVs, the CFs for CO and NOX, are set at 1.5 and for PN at 2. This leads to NTE limits of 6,000 mg/kWh for CO, 690 mg/ kWh for NOX, and 1.2 x 10¹² #/kWh for PN. The China VI standard was proposed to be implemented starting January 1, 2020, for all sales and registrations. In addition, MEP released a supplemental PEMS testing standard for China V HDVs in September 2017 (MEP, 2017b). The standard is a supplement to all requirements under the existing China V standard. It requires additional on-road PEMS testing for new and in-use China V HDVs. As the China VI HDV standard is not likely to be implemented nationwide until 2020, the supplemental PEMS standard is designed to curb excess NOX emissions from China V HDVs. In doing so, China became the first country in the world to attempt to solve a known deficiency in the Euro V type-approval process by requiring additional PEMS testing for newly produced vehicles and in-use compliance testing. The standard took effect October 1, 2017. Table 2 provides a detailed comparison of emissions limits and test requirements under the supplemental China V, proposed China VI, and Euro VI PEMS standards.
Table 2. Comparison of requirements under supplemental China V, proposed China VI, and Euro VI PEMS standards
Supplemental China V Proposed China VI Euro VI
Implementation year 2017 2020 for China VI a2023 for China VI b* 2014
Vehicle tested Newly produced and in-use
Type test, newly produced and in-use Type approval and in-use
Mandated test frequency Every two years with minimum of 10,000 km
18 months with minimum of 10,000 km and then
every two years
18 months with minimum of 25,000 km and then
every two years
Emission limits for diesel
NOX4 g/kWh(CF=2.0)
0.69 g/kWh(CF=1.5)
0.69 g/kWh(CF=1.5)
PN NoNo limit for China VI a
1.2x10¹² #/kWh for China VI b (CF=2.0)
No
Cold start included No No No
Driving shares (% of time duration)
Urban 10%-70% 20%-70% 20%-70%
Rural 10%-30% 25%-33% 25%-33%
Motorway 0%-80% 0%-55% 0%-55%
Test length
5x work of WHTC (for urban vehicles)
3x work of ETC (for other categories)
4x-7x work of WHTC5x work of WHTC
(4x-7x work of WHTC beginning 2018)
Payload 50%-100% for bus75%-100% for truck
China VI a: 50%-100%China VI b: 10%-100%
50%-60%(10%-100%
beginning 2018)
Ambient temperature 2 °C ~ 38 °C -7 °C ~ 38 °C -7 °C ~ 38 °C
Altitude <1,000 m <1,700 m in China VI a <2,400 m in China VI b <1,700 m
Minimum power threshold 15% 10% 15%
(10% beginning 2018)
*The China VI HDV standard is proposed to be implemented in two phases nationwide—China VI a in January 2020 and China VI b in January 2023.
7
META-STUDY OF PEMS DATA FROM LIGHT- AND HEAVY-DUTY VEHICLES IN CHINA
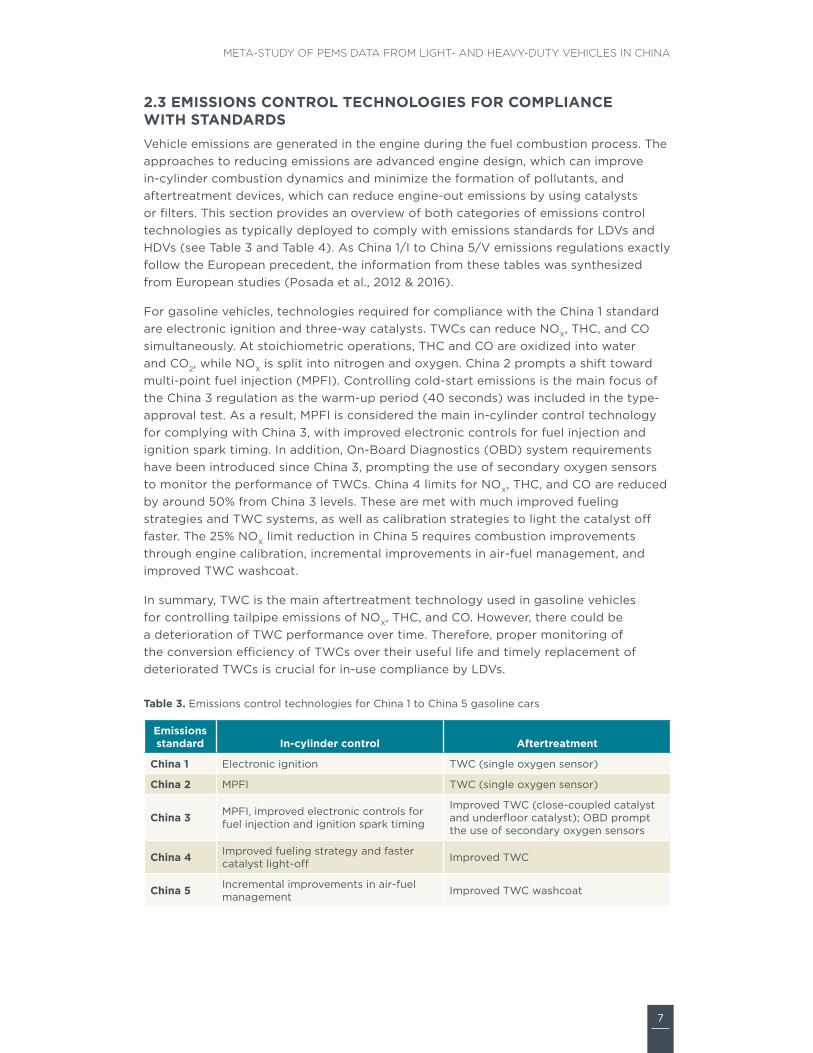
2.3 EMISSIONS CONTROL TECHNOLOGIES FOR COMPLIANCE WITH STANDARDSVehicle emissions are generated in the engine during the fuel combustion process. The approaches to reducing emissions are advanced engine design, which can improve in-cylinder combustion dynamics and minimize the formation of pollutants, and aftertreatment devices, which can reduce engine-out emissions by using catalysts or filters. This section provides an overview of both categories of emissions control technologies as typically deployed to comply with emissions standards for LDVs and HDVs (see Table 3 and Table 4). As China 1/I to China 5/V emissions regulations exactly follow the European precedent, the information from these tables was synthesized from European studies (Posada et al., 2012 & 2016).
For gasoline vehicles, technologies required for compliance with the China 1 standard are electronic ignition and three-way catalysts. TWCs can reduce NOX, THC, and CO simultaneously. At stoichiometric operations, THC and CO are oxidized into water and CO2, while NOX is split into nitrogen and oxygen. China 2 prompts a shift toward multi-point fuel injection (MPFI). Controlling cold-start emissions is the main focus of the China 3 regulation as the warm-up period (40 seconds) was included in the type-approval test. As a result, MPFI is considered the main in-cylinder control technology for complying with China 3, with improved electronic controls for fuel injection and ignition spark timing. In addition, On-Board Diagnostics (OBD) system requirements have been introduced since China 3, prompting the use of secondary oxygen sensors to monitor the performance of TWCs. China 4 limits for NOX, THC, and CO are reduced by around 50% from China 3 levels. These are met with much improved fueling strategies and TWC systems, as well as calibration strategies to light the catalyst off faster. The 25% NOX limit reduction in China 5 requires combustion improvements through engine calibration, incremental improvements in air-fuel management, and improved TWC washcoat.
In summary, TWC is the main aftertreatment technology used in gasoline vehicles for controlling tailpipe emissions of NOX, THC, and CO. However, there could be a deterioration of TWC performance over time. Therefore, proper monitoring of the conversion efficiency of TWCs over their useful life and timely replacement of deteriorated TWCs is crucial for in-use compliance by LDVs.
Table 3. Emissions control technologies for China 1 to China 5 gasoline cars
Emissions standard In-cylinder control Aftertreatment
China 1 Electronic ignition TWC (single oxygen sensor)
China 2 MPFI TWC (single oxygen sensor)
China 3 MPFI, improved electronic controls for fuel injection and ignition spark timing
Improved TWC (close-coupled catalyst and underfloor catalyst); OBD prompt the use of secondary oxygen sensors
China 4 Improved fueling strategy and faster catalyst light-off Improved TWC
China 5 Incremental improvements in air-fuel management Improved TWC washcoat

8
ICCT WHITE PAPER
Table 4 summarizes the strategies for compliance with the China HDV standards. As particle emissions were not measured in this meta-study, only NOX control technologies are listed in Table 4. For China I and II, mechanical injection is deployed in heavy-duty engines. To meet the China III standard, in-cylinder combustion improvements such as electronic control and variable injection timing are required.
The major factors that influence the combustion process include air temperature and fuel injection timing and strategy. Electronic injection allows for a more precise and variable fuel injection strategy, which improves combustion efficiency and reduces engine-out emissions.
The China III standard is the last one that can be met without the use of aftertreatment systems. Starting with China IV, HDVs have to be equipped with SCR systems to achieve stringent NOX emissions reductions. SCR is a catalyst that reduces NOX to nitrogen and water using ammonia stored on the vehicle in the form of urea as a reductant. SCR systems usually employ a vanadium- or zeolite-based catalyst, and each has its own merits and demerits. SCR has been proven as an effective method for HDV NOX emissions control, with high NOX conversion efficiency of as much as 95%. In addition, OBD requirements have been introduced since China IV, intended to identify malfunctions in the emission control system. A few manufacturers rely solely on exhaust gas recirculation (EGR) systems for China IV compliance, recirculating a fraction of exhaust gas to the cylinder to lower the combustion temperature and the formation of engine-out NOX. Under the China V standard, NOX reductions can be achieved with improved SCR systems along with enhanced OBD systems to monitor urea level and quality. In 2015, 55% of new rigid trucks and 70% of new tractor-trailers in China were equipped with SCR systems (Rodríguez et al., 2017). Those models relying only on EGR must be supplemented with SCR systems to comply with the China V standard.
Table 4. NOX emissions control technologies for China I to China V HDVs
Emission standard In-cylinder control NOX Aftertreatment
China I No (mechanical injection) No control
China II No (mechanical injection) No control
China III Electronic injection No control
China IV Electronic injectionSCR (OBD requirements) (a few manufacturers solely use EGR)
China V Electronic injection Improved SCR (enhanced OBD requirements)

9
META-STUDY OF PEMS DATA FROM LIGHT- AND HEAVY-DUTY VEHICLES IN CHINA
3. DATA SOURCES AND ANALYSIS
3.1 DATA SOURCESThe PEMS data in this study were collected from different research institutes in China. The data includes 122 vehicles, including 55 China 0 to China 5 gasoline cars and 67 China I to China V diesel HDVs. The vehicle sample covers a wide range of emissions standards and vehicle types, including private cars, taxis, heavy-duty trucks, and urban buses.2 Taxis were analyzed separately because they usually operate more extensively than private cars and record as much as 10 times more vehicle kilometers traveled annually. Each vehicle was tested over one PEMS trip, except for two China 5 private cars, which were tested three times. A total of 126 PEMS trips were analyzed in this study. The data covers more than 210 hours and 6,300 km of second-by-second data and incorporates some more recent PEMS test results from modern China 5/V vehicles. The tests were conducted in Beijing, Tianjin, Guangzhou, Zhuhai, Xiamen, Chongqing, and Macau from 2008 to 2016. When tested, the average ages of China 0 to China 5 LDVs were 14 years, six years, three years, two years, two years, and less than one year, respectively. Table 5 and Table 6 give an overview of LDVs and HDVs included in this study.
Table 5. Overview of gasoline LDVs included in the study
Private cars Taxis Total
China 0 3 0 3
China 1 3 0 3
China 2 5 7 12
China 3 1 1 2
China 4 2 26 28
China 5 6 1 7
Total 20 35 55
Table 6. Overview of diesel HDVs included in the study
Trucks Buses Total
China I 3 0 3
China II 15 0 15
China III 25 0 25
China IV 10 10 21
China V 0 4 4
Total 53 14 67
Three sets of PEMS equipment were employed in this study: SEMTECH-DS gas analyzer, SEMTECH-Ecostar, and AVL M.O.V.E. Second-by-second emission rates of NOX, CO, THC, and CO2 were collected, and vehicle speed was recorded via GPS. Particle emissions were not measured in this study because of the limitations of PEMS equipment. The
2 The Gross Vehicle Weight of heavy-duty trucks included in this study ranged from 12 to 31 tonnes.

10
ICCT WHITE PAPER
vehicles were driven in normal, real-world conditions following actual traffic. Cold starts were not included, and OBD data was not available. Trip duration, distance, average speed, and raw emissions factors can be found in the Appendix.
3.2 DATA ANALYSIS METHODIn the China 6 LDV standard and China VI HDV standard proposal, the moving average window method is applied for PEMS data analysis. With this method, the emissions data are integrated over a series of windows. The size of the windows is equivalent to half of the CO2 emitted over the Worldwide Harmonized Light Vehicles Test Cycle (WLTC) or the total work done by the engine over the transient engine test cycle (World Harmonized Transient Cycle, WHTC). For both LDVs and HDVs, there are some specific requirements for determining whether a window is valid, and only valid windows are included in the emissions calculation. For LDVs, the final CF over a trip is weighted by a given share of urban/rural/motorway. For HDVs, the final CF is the result at the 90th percentile of all the valid windows.
However, the moving average window method is not applicable to this study. This is because, 1) the vehicles were not tested on chassis or engine dynamometer over standard cycle WLTC or WHTC, making the window size difficult to determine; and 2) OBD data including engine power data is not available in this study to calculate brake-specific emissions factors in g/kWh. Therefore, the final emissions factors in this study were calculated directly by dividing the raw cumulative mass emissions by the total distance. For LDVs, emissions factors are directly shown in g/km. For HDVs, NOX mass emitted per kg of CO2 mass (g NOX/kg CO2, a measure of tailpipe NOX emissions in proportion to fuel consumption) is used as an additional reference parameter to eliminate the effects of engine size among the HDVs and as a surrogate for the HDV standards, which are in grams per kilowatt hour. Assuming a constant average engine efficiency and fuel consumption, the CO2-specific emissions factors in g/kg CO2 can be converted into brake-specific emissions factors in g/kWh. In this study, we apply a typical engine efficiency of 40% (brake specific fuel consumption of 210g/kWh, Vermeulen et al., 2014) to convert the emissions limits in g/kWh into g/kg CO2. For example, the China V NOX emission limit of 2.0 g/kWh would be equal to 3.0 g NOX/kg CO2.
The experimental data in this report was collected from different institutes, so the test routes and driving conditions may differ from each other. They also could vary greatly in various cities. As on-road emissions are affected by velocity, acceleration, road gradient, and other driving conditions, it is good practice to report the trip profile, such as the time-speed profile, and to develop situation-specific emissions when comparing two trips. Besides reporting raw emissions factors, we applied the same situation-specific emissions analysis method used in the ICCT’s PEMS meta-study for the EU and the United States (Franco et al., 2014). The emissions data of each second was binned using instantaneous velocity times acceleration (v*a), which is an approximation of instantaneous mass-specific power. This method allows us to analyze the impact of driving conditions on emissions rates and to compare the emissions performance of two trips with different compositions.
When identifying the causes of high emissions events, it is also useful to look into the second-by-second instantaneous emissions and driving profiles of the vehicle. For example, by plotting the instantaneous emissions rates against the instantaneous velocity, one can easily observe when the emissions peaks occur and the corresponding

11
META-STUDY OF PEMS DATA FROM LIGHT- AND HEAVY-DUTY VEHICLES IN CHINA
driving conditions. Also, it can be observed whether the emissions peaks occur only under aggressive driving conditions, such as strong acceleration, or throughout the trip.
In summary, three methods of reporting test results are used in this study: 1) average raw emissions factors of the whole trip; 2) situation-specific emissions analysis; 3) instantaneous emissions analysis.

12
ICCT WHITE PAPER
4. RESULTS
In this section, we present the test results from LDVs and HDVs separately. The final emissions factors by emission standard and by vehicle will be discussed. For situation-specific emissions analysis and instantaneous emissions analysis, we do not report the results for each vehicle. Rather, we focus only on a few representative trips and carefully compare the differences between good and bad performers.
4.1 RESULTS FOR LDVS
4.1.1 Real-world NOX, CO, and THC emissions by standard and by vehicleIn Figure 2, we show the real-world NOX, CO, and THC emissions factors for each vehicle by emissions standard and vehicle category. Blue and yellow dots indicate the emissions factor of each vehicle, and the red dots indicate the average number for each emissions standard and vehicle category. Overall, the average emissions factors of the three pollutants decreased from China 0 to China 5. China 0 to China 2 cars had significantly higher NOX, CO, and THC emissions than China 3 to China 5 cars. Emissions control technologies have evolved significantly since China 3, mainly because the warm-up period of 40 seconds has been included in the type-approval test since China 3.
For THC, the average real-world emissions from China 3 to China 5 private cars and taxis were below the corresponding limits. This indicates that tailpipe THC emissions from gasoline cars have been effectively controlled since China 3. However, it should be noted that cold starts were not included in the PEMS tests in this study. It is widely known that most THC emissions are generated in the first 300 seconds of cold starts. Therefore, the actual real-world tailpipe THC emissions are most likely higher than the results shown in Figure 2 if cold-starts are considered.
For each standard, NOX, CO, and THC from taxis were always significantly higher than from private cars, with China 5 as the only exception. In this study, the average mileage of old China 2 and 3 taxis when tested was 380,000 km, four times the average mileage of private cars of comparable ages. Therefore, TWCs of these old taxis had more significant deterioration and may lack maintenance, which would lead to the high NOX, CO, and THC emissions. Anecdotal evidence points to some taxi drivers renting TWCs for annual I/M tests to avoid paying maintenance costs for the catalyst (Beijing Youth Daily, 2015). The daily rental fee for a TWC converter was around 100-300 CNY, much lower than the 2,000-3,000 CNY cost of a replacement converter (Beijing Daily, 2015). Another reason for the taxi drivers to remove the deteriorated TWC is to reduce fuel consumption in real-world driving (Zheng et al., 2017). Generally, TWC converters should not affect fuel economy when working properly, but a clogged or damaged converter can increase fuel consumption. In this study, TWCs from three China 4 taxis were confirmed to have been removed by the drivers. A detailed comparison of emissions by taxis with and without TWCs is in the following section.

13
META-STUDY OF PEMS DATA FROM LIGHT- AND HEAVY-DUTY VEHICLES IN CHINA
0
10
20
30
40
50
60
70
CO
(g
/km
)
China 0Private
car
China 1Private
car
China 2Private
car
China 3Private
car
China 4Private
car
China 5Private
car
China 2Taxi
China 3Taxi
China 4Taxi
China 5Taxi
0
0.5
1
1.5
2
2.5
3
3.5
NO
X (
g/k
m)
China 0Private
car
China 1Private
car
China 2Private
car
China 3Private
car
China 4Private
car
China 5Private
car
China 2Taxi
China 3Taxi
China 4Taxi
China 5Taxi
China 0Private
car
China 1Private
car
China 2Private
car
China 3Private
car
China 4Private
car
China 5Private
car
China 2Taxi
China 3Taxi
China 4Taxi
China 5Taxi
0
0.5
1
1.5
2
2.5
3
3.5
4
4.5
TH
C (
g/k
m)
Private carTaxiAverageChina 3 limit
China 5 limitChina 4 limit
Figure 2. Real-world NOX, CO and THC emissions factors for gasoline cars, by emissions standard and vehicle category
14
ICCT WHITE PAPER
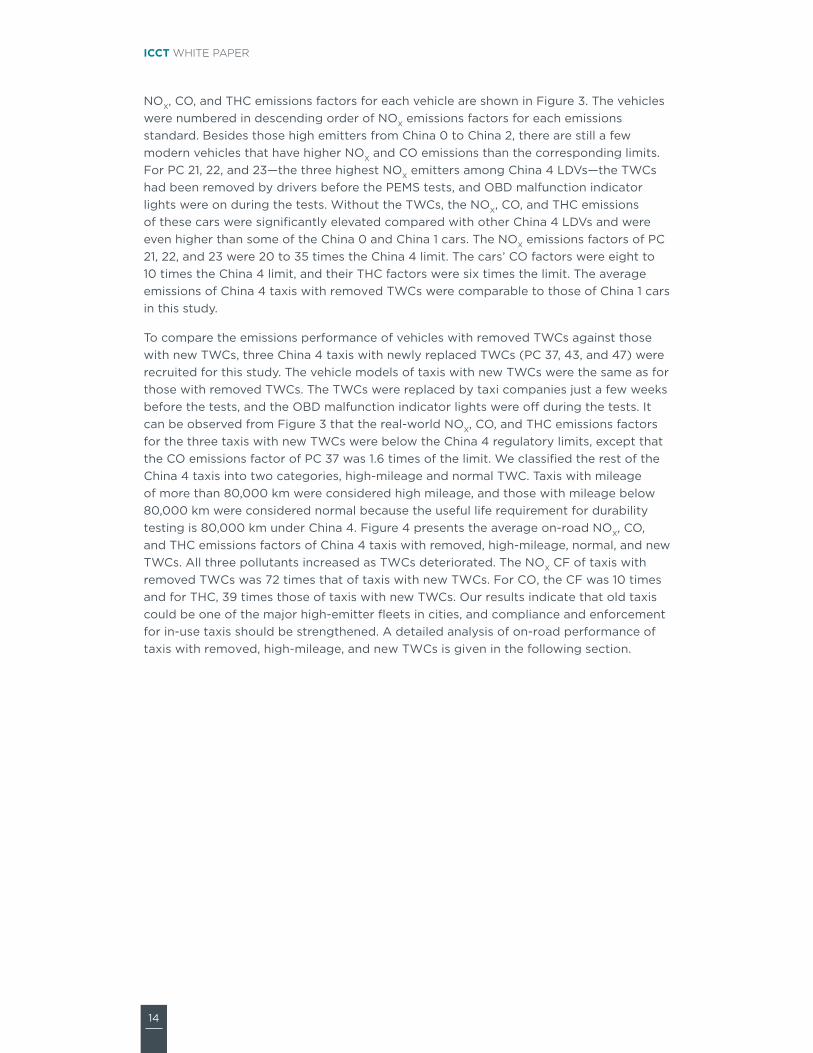
NOX, CO, and THC emissions factors for each vehicle are shown in Figure 3. The vehicles were numbered in descending order of NOX emissions factors for each emissions standard. Besides those high emitters from China 0 to China 2, there are still a few modern vehicles that have higher NOX and CO emissions than the corresponding limits. For PC 21, 22, and 23—the three highest NOX emitters among China 4 LDVs—the TWCs had been removed by drivers before the PEMS tests, and OBD malfunction indicator lights were on during the tests. Without the TWCs, the NOX, CO, and THC emissions of these cars were significantly elevated compared with other China 4 LDVs and were even higher than some of the China 0 and China 1 cars. The NOX emissions factors of PC 21, 22, and 23 were 20 to 35 times the China 4 limit. The cars’ CO factors were eight to 10 times the China 4 limit, and their THC factors were six times the limit. The average emissions of China 4 taxis with removed TWCs were comparable to those of China 1 cars in this study.
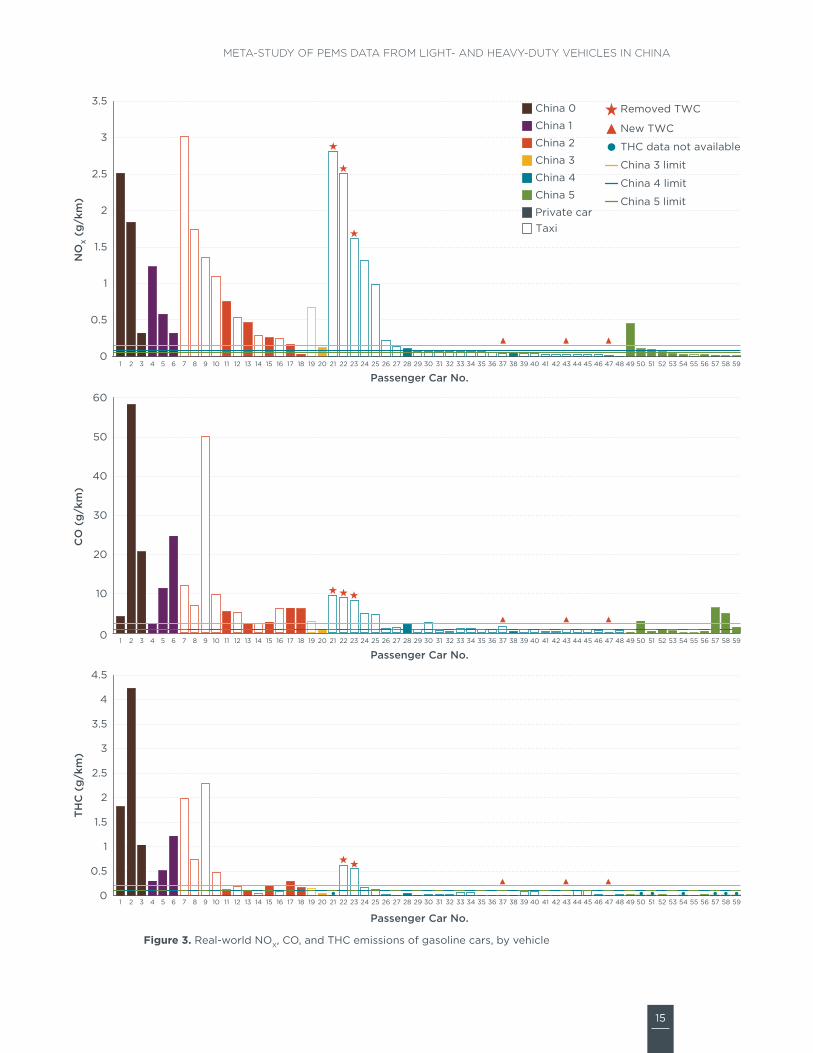
To compare the emissions performance of vehicles with removed TWCs against those with new TWCs, three China 4 taxis with newly replaced TWCs (PC 37, 43, and 47) were recruited for this study. The vehicle models of taxis with new TWCs were the same as for those with removed TWCs. The TWCs were replaced by taxi companies just a few weeks before the tests, and the OBD malfunction indicator lights were off during the tests. It can be observed from Figure 3 that the real-world NOX, CO, and THC emissions factors for the three taxis with new TWCs were below the China 4 regulatory limits, except that the CO emissions factor of PC 37 was 1.6 times of the limit. We classified the rest of the China 4 taxis into two categories, high-mileage and normal TWC. Taxis with mileage of more than 80,000 km were considered high mileage, and those with mileage below 80,000 km were considered normal because the useful life requirement for durability testing is 80,000 km under China 4. Figure 4 presents the average on-road NOX, CO, and THC emissions factors of China 4 taxis with removed, high-mileage, normal, and new TWCs. All three pollutants increased as TWCs deteriorated. The NOX CF of taxis with removed TWCs was 72 times that of taxis with new TWCs. For CO, the CF was 10 times and for THC, 39 times those of taxis with new TWCs. Our results indicate that old taxis could be one of the major high-emitter fleets in cities, and compliance and enforcement for in-use taxis should be strengthened. A detailed analysis of on-road performance of taxis with removed, high-mileage, and new TWCs is given in the following section.
15
META-STUDY OF PEMS DATA FROM LIGHT- AND HEAVY-DUTY VEHICLES IN CHINA
1 2 3 4 5 6 7 8 9 10 11 12 13 14 15 16 17 18 19 20 21 22 23 24 25 26 27 28 29 30 31 32 33 34 35 36 37 38 39 40 41 42 43 44 45 46 47 48 49 50 51 52 53 54 55 56 57 58 59
Passenger Car No.
0
0.5
1
1.5
2
2.5
3
3.5
NO
X (
g/k
m)
01 2 3 4 5 6 7 8 9 10 11 12 13 14 15 16 17 18 19 20 21 22 23 24 25 26 27 28 29 30 31 32 33 34 35 36 37 38 39 40 41 42 43 44 45 46 47 48 49 50 51 52 53 54 55 56 57 58 59
Passenger Car No.
10
20
30
40
50
60
CO
(g
/km
)
1 2 3 4 5 6 7 8 9 10 11 12 13 14 15 16 17 18 19 20 21 22 23 24 25 26 27 28 29 30 31 32 33 34 35 36 37 38 39 40 41 42 43 44 45 46 47 48 49 50 51 52 53 54 55 56 57 58 59
Passenger Car No.
0
0.5
1
1.5
2
2.5
3
3.5
4
4.5
TH
C (
g/k
m)
Private carTaxi
China 4
China 5
China 2
China 3
China 0
China 1
China 3 limit
China 4 limit
China 5 limit
THC data not available
Removed TWC
New TWC
Figure 3. Real-world NOX, CO, and THC emissions of gasoline cars, by vehicle
16
ICCT WHITE PAPER
Removed TWC High mileage TWC (mileage>80,000km)
Normal TWC (mileage<80,000km) New TWC
0
5
10
15
20
25
30
35
40
CF
NOX
72 times
13 times
0
5
10
15
CF
CO
10 times
2.5 times
0
2
4
6
8
CF
THC
39 times
5 times
Figure 4. Average NOX, CO, and THC CFs of China 4 taxis with removed, high-mileage, normal, and new TWCs
Error bars indicate standard deviation
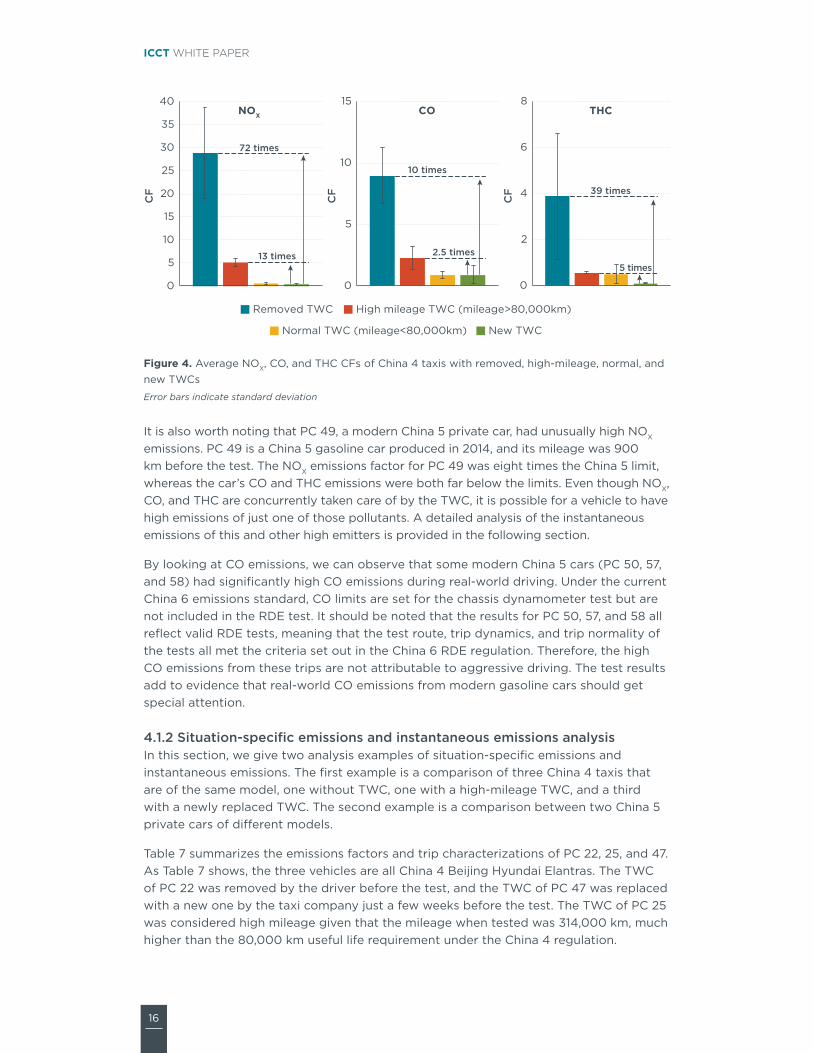
It is also worth noting that PC 49, a modern China 5 private car, had unusually high NOX emissions. PC 49 is a China 5 gasoline car produced in 2014, and its mileage was 900 km before the test. The NOX emissions factor for PC 49 was eight times the China 5 limit, whereas the car’s CO and THC emissions were both far below the limits. Even though NOX, CO, and THC are concurrently taken care of by the TWC, it is possible for a vehicle to have high emissions of just one of those pollutants. A detailed analysis of the instantaneous emissions of this and other high emitters is provided in the following section.
By looking at CO emissions, we can observe that some modern China 5 cars (PC 50, 57, and 58) had significantly high CO emissions during real-world driving. Under the current China 6 emissions standard, CO limits are set for the chassis dynamometer test but are not included in the RDE test. It should be noted that the results for PC 50, 57, and 58 all reflect valid RDE tests, meaning that the test route, trip dynamics, and trip normality of the tests all met the criteria set out in the China 6 RDE regulation. Therefore, the high CO emissions from these trips are not attributable to aggressive driving. The test results add to evidence that real-world CO emissions from modern gasoline cars should get special attention.
4.1.2 Situation-specific emissions and instantaneous emissions analysisIn this section, we give two analysis examples of situation-specific emissions and instantaneous emissions. The first example is a comparison of three China 4 taxis that are of the same model, one without TWC, one with a high-mileage TWC, and a third with a newly replaced TWC. The second example is a comparison between two China 5 private cars of different models.
Table 7 summarizes the emissions factors and trip characterizations of PC 22, 25, and 47. As Table 7 shows, the three vehicles are all China 4 Beijing Hyundai Elantras. The TWC of PC 22 was removed by the driver before the test, and the TWC of PC 47 was replaced with a new one by the taxi company just a few weeks before the test. The TWC of PC 25 was considered high mileage given that the mileage when tested was 314,000 km, much higher than the 80,000 km useful life requirement under the China 4 regulation.

17
META-STUDY OF PEMS DATA FROM LIGHT- AND HEAVY-DUTY VEHICLES IN CHINA
Table 7. Emissions and trip summary of PC 22, 25, and 47
PC 22 PC 25 PC 47
Emission standard China 4
Model Beijing Hyundai Elantra
Production year 2009 2011 2012
Mileage 653,000 km 314,000 km 195,000 km
Aftertreatment Removed TWC High mileage TWC New TWC
Average NOX EF 2.5 g/km 0.98 g/km 0.014 g/km
Average CO EF 9.0 g/km 4.8 g/km 0.12 g/km
Average THC EF 0.6 g/km 0.13 g/km 0.008 g/km
Average CO2 EF 182 g/km 165 g/km 178 g/km
Average speed 34 km/h 38 km/h 37 km/h
Total trip distance 50 km 52 km 48 km
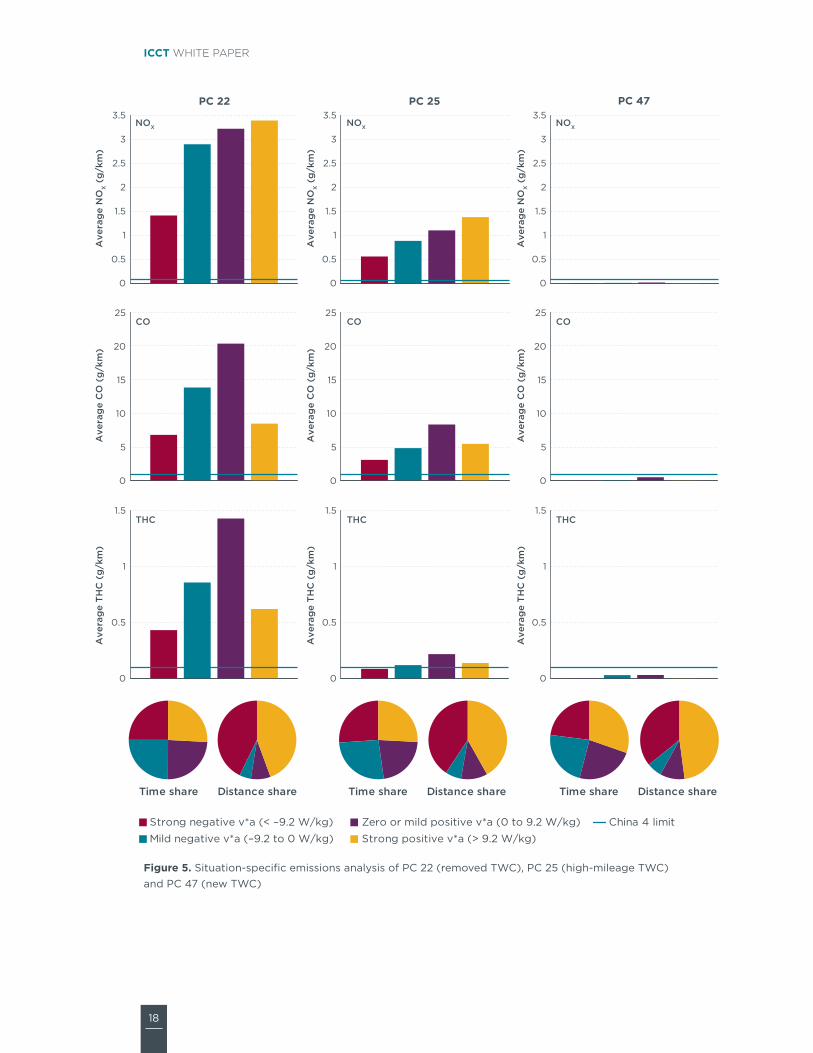
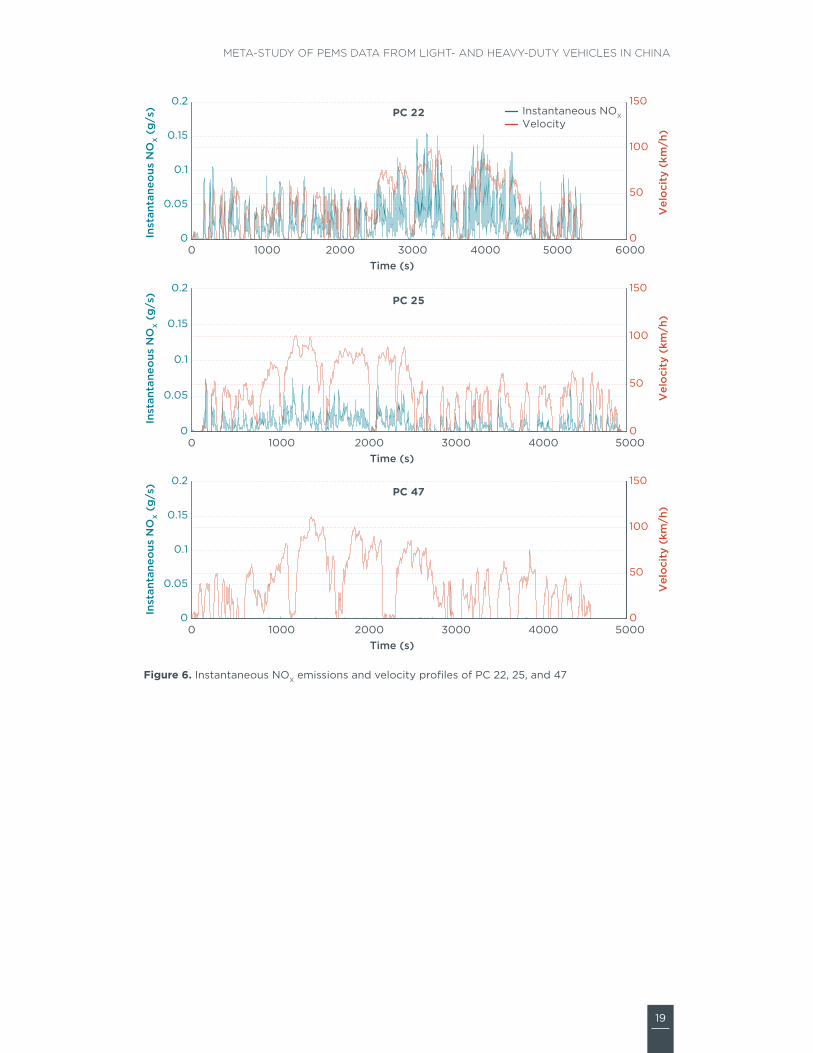
As Table 7 presents, the average NOX, CO, and THC emissions factors of PC 22 with removed TWC were significantly higher than for PC 25 and 47. Emissions from PC 47 with a new TWC were excellently controlled in real driving conditions. In Figure 5, we compare the situation-specific emissions categorized by v*a (velocity times acceleration, a common approximation of the power demands on the engine). We classified v*a into four categories: strong negative, mild negative, zero or mild positive, and strong positive. We selected 9.2 W/kg as a threshold between mild and strong v*a because it is the maximum v*a value for the standard NEDC. As Figure 5 illustrates, the trip composition, or the time share and distance share of four driving categories, was similar. However, the NOX emissions factors of PC 22 were significantly higher than those of PC 25 and 47 at all four situation categories. By looking at the instantaneous NOX emission rates and velocities of these three vehicles (Figure 6), it is apparent that PC 22 emitted more NOX than PC 25 and 47 under all circumstances. It is also worth pointing out that all three pollutants from PC 47, with a new TWC, stayed below the laboratory limits, especially under aggressive v*a. The results provide further evidence that TWC plays an important role in controlling emissions from gasoline cars, and gasoline emissions can stay at very low levels under real-world driving as long as the TWC is working effectively.
18
ICCT WHITE PAPER
23%
23%24%
30% 36%
6%10%
48%25%
25% 24%
26%41%
7% 11%
42%43%
5% 8%
44%26%
26% 22%
26%
0
5
10
15
25
20
0
5
10
15
20
25
0
5
10
15
20
25
Ave
rag
e C
O (
g/k
m)
Ave
rag
e C
O (
g/k
m)
Ave
rag
e C
O (
g/k
m)
CO CO CO
0
0.5
1
1.5
0
0.5
1
1.5
Ave
rag
e T
HC
(g
/km
)
0
0.5
1
1.5
Ave
rag
e T
HC
(g
/km
)
Ave
rag
e T
HC
(g
/km
)THC THC THC
Strong negative v*a (< –9.2 W/kg)
Mild negative v*a (–9.2 to 0 W/kg)
Zero or mild positive v*a (0 to 9.2 W/kg)
Strong positive v*a (> 9.2 W/kg)
China 4 limit
Time share Distance share Time share Distance share Time share Distance share
0
0.5
1
1.5
2
2.5
3
3.5
0
0.5
1
1.5
2
2.5
3
3.5
Ave
rag
e N
OX (
g/k
m)
0
0.5
1
1.5
2
2.5
3
3.5
Ave
rag
e N
OX (
g/k
m)
Ave
rag
e N
OX (
g/k
m)
NOX NOX NOX
PC 22 PC 25 PC 47
Figure 5. Situation-specific emissions analysis of PC 22 (removed TWC), PC 25 (high-mileage TWC) and PC 47 (new TWC)
19
META-STUDY OF PEMS DATA FROM LIGHT- AND HEAVY-DUTY VEHICLES IN CHINA
Instantaneous NOXVelocity
0 1000 2000 3000 4000 5000 6000Time (s)
0
0.05
0.1
0.15
0.2
Inst
anta
neo
us N
OX (
g/s
)
0
50
100
150
Vel
oci
ty (
km/h
)
Inst
anta
neo
us N
OX (
g/s
)
0 1000 2000 3000 4000 5000Time (s)
0
0.05
0.1
0.15
0.2
0
50
100
150
Vel
oci
ty (
km/h
)
Inst
anta
neo
us N
OX (
g/s
)
0 1000 2000 3000 4000 5000Time (s)
0
0.05
0.1
0.15
0.2
0
50
100
150
Vel
oci
ty (
km/h
)
PC 22
PC 25
PC 47
Figure 6. Instantaneous NOX emissions and velocity profiles of PC 22, 25, and 47

20
ICCT WHITE PAPER
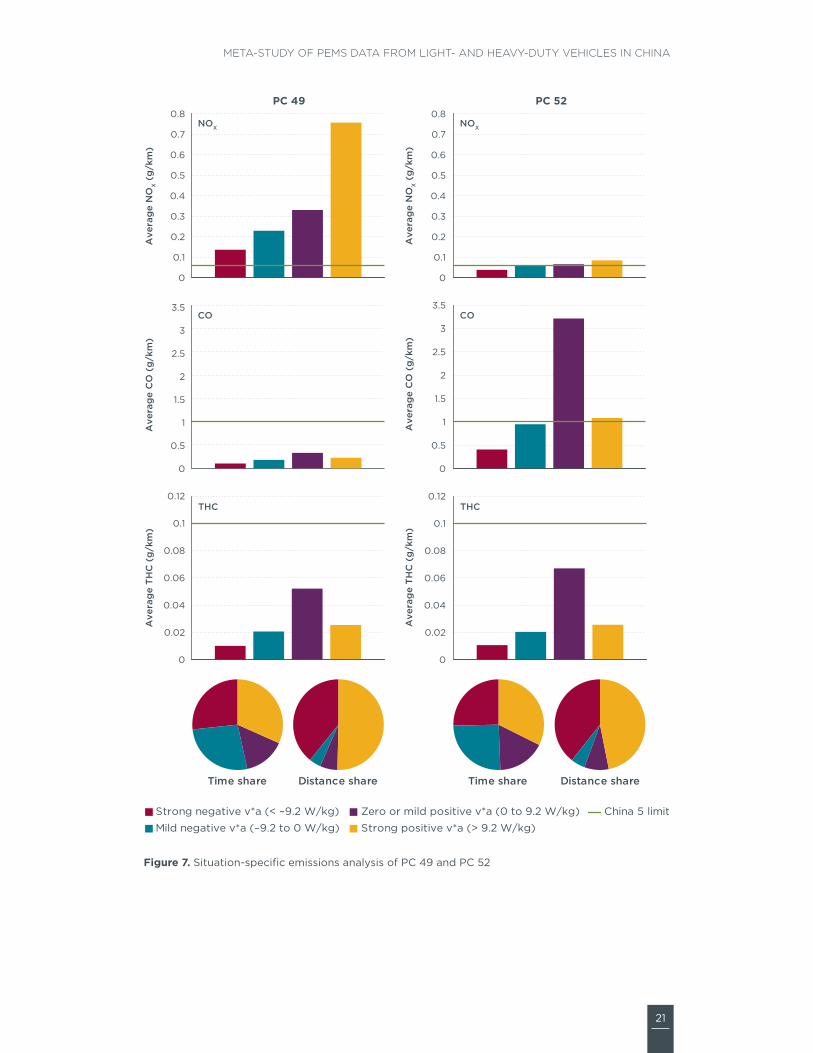
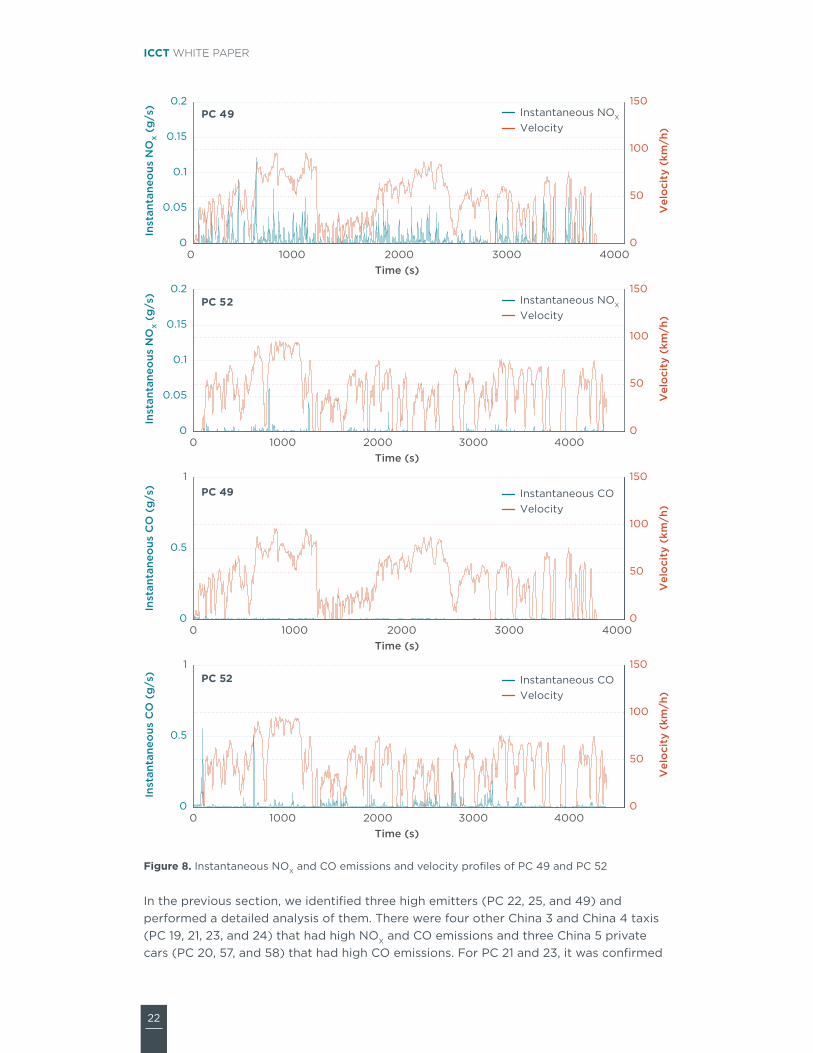
In the second example, we compared the situation-specific and instantaneous emissions of two China 5 private cars with port fuel injection. As Table 8 shows, PC 49 was produced in 2014 and PC 52 in 2013. The mileage of PC 52 was more than 22 times that of PC 49. However, the NOX emissions factor of PC 49 was 0.45 g/km, eight times the regulated limit, while NOX from PC 52 was below the limit. Figure 7 presents the situation-specific emissions analysis of these two trials. Under all driving circumstances, NOX emissions rates from PC 49 were higher than from PC 52. Unlike the situation in the first example, CO emissions from PC 49 were much lower than the other, which can hardly be seen on the instantaneous emissions profiles (see Figure 8). High NOX but low CO emissions indicate that PC 49 might have been running lean with excess air in the air-fuel mix during the test. In this case, OBD data is not available to further investigate the actual cause of lean operation, but it is likely that the engine calibration or electronic control of PC 49 might not be robust.
Table 8. Emissions and trip summary of PC 49 and PC 52
PC 49 PC 52
Emission standard China 5
Production year 2014 2013
Mileage 900 km 20,000 km
Aftertreatment TWC TWC
Average NOX EF 0.45 g/km 0.06 g/km
Average CO EF 0.19 g/km 0.95 g/km
Average THC EF 0.02 g/km 0.02 g/km
Average CO2 EF 172 g/km 201 g/km
Average speed 42 km/h 40 km/h
Total trip distance 44 km 48 km
21
META-STUDY OF PEMS DATA FROM LIGHT- AND HEAVY-DUTY VEHICLES IN CHINA
25%
25%
32%
17%
39%
4% 6%
50%
27%
27% 15%
32%39%
5%9%
47%
0
0.5
1
1.5
2
2.5
3
3.5
Ave
rag
e C
O (
g/k
m)
0
0.5
1
1.5
2
2.5
3
3.5
Ave
rag
e C
O (
g/k
m)
CO CO
0
0.02
0.04
0.06
0.08
0.1
0.12
Ave
rag
e T
HC
(g
/km
)
0
0.02
0.04
0.06
0.08
0.1
0.12
Ave
rag
e T
HC
(g
/km
)
THC THC
Strong negative v*a (< –9.2 W/kg)
Mild negative v*a (–9.2 to 0 W/kg)
Zero or mild positive v*a (0 to 9.2 W/kg)
Strong positive v*a (> 9.2 W/kg)
China 5 limit
Time share Distance share Time share Distance share
0
0.1
0.2
0.3
0.4
0.5
0.6
0.7
0.8
Ave
rag
e N
OX (
g/k
m)
0
0.1
0.2
0.3
0.4
0.5
0.6
0.7
0.8
Ave
rag
e N
OX (
g/k
m)
NOX NOX
PC 49 PC 52
Figure 7. Situation-specific emissions analysis of PC 49 and PC 52
22
ICCT WHITE PAPER
0 1000 2000 3000 4000Time (s)
0
0.05
0.1
0.15
0.2Instantaneous NOX
Velocity
0
50
100
150
Vel
oci
ty (
km/h
)
Inst
anta
neo
us N
OX (
g/s
)
0 1000 2000 3000 4000Time (s)
0
0.05
0.1
0.15
0.2
0
50
100
150
Vel
oci
ty (
km/h
)
Instantaneous NOX
Velocity
Inst
anta
neo
us N
OX (
g/s
)
0 1000 2000 3000 4000Time (s)
0
0.5
1
0
50
100
150
Vel
oci
ty (
km/h
)
Instantaneous COVelocity
Inst
anta
neo
us C
O (
g/s
)
Instantaneous COVelocity
0 1000 2000 3000 4000Time (s)
0
0.5
1
0
50
100
150V
elo
city
(km
/h)
Inst
anta
neo
us C
O (
g/s
)
PC 49
PC 52
PC 49
PC 52
Figure 8. Instantaneous NOX and CO emissions and velocity profiles of PC 49 and PC 52
In the previous section, we identified three high emitters (PC 22, 25, and 49) and performed a detailed analysis of them. There were four other China 3 and China 4 taxis (PC 19, 21, 23, and 24) that had high NOX and CO emissions and three China 5 private cars (PC 20, 57, and 58) that had high CO emissions. For PC 21 and 23, it was confirmed
23
META-STUDY OF PEMS DATA FROM LIGHT- AND HEAVY-DUTY VEHICLES IN CHINA
that TWCs were removed by drivers, which led to high on-road emissions. For PC 19, the mileage when tested was nearly 80,000 km and for PC 24, almost 350,000 km. The TWCs were confirmed as installed on these vehicles, so it is likely that the high emissions were due to deterioration of the TWCs. PC 50, 57, and 58 had high CO but relatively low NOX emissions, which might be attributed to poor engine calibration or control.
4.2 RESULTS FOR HDVSIn this section, we present the results for HDVs. The operating characteristics of heavy-duty trucks and urban buses are significantly different, so we report the results for trucks and buses separately. Engine size is one of the major factors affecting emissions levels, so the standards are set as a function of engine energy output (g/kWh). We use NOX mass emitted per kg mass of CO2 (g NOX/kg CO2) to eliminate the effects of engine size among the HDVs.
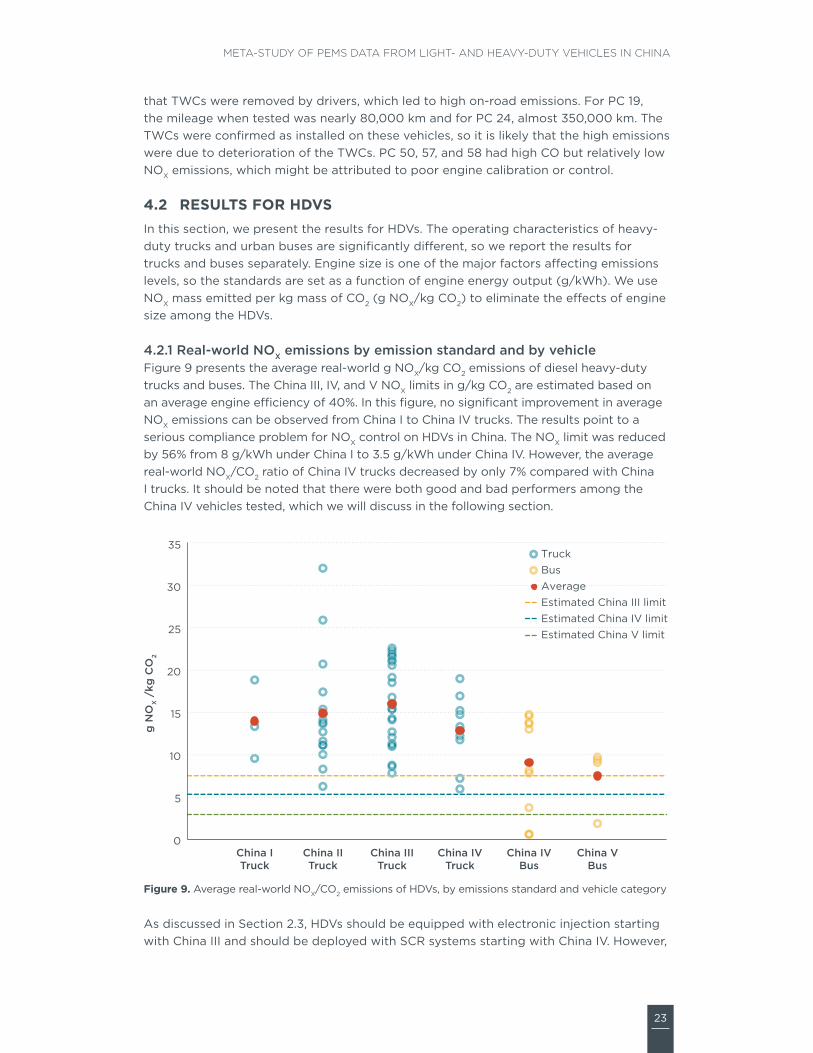
4.2.1 Real-world NOX emissions by emission standard and by vehicleFigure 9 presents the average real-world g NOX/kg CO2 emissions of diesel heavy-duty trucks and buses. The China III, IV, and V NOX limits in g/kg CO2 are estimated based on an average engine efficiency of 40%. In this figure, no significant improvement in average NOX emissions can be observed from China I to China IV trucks. The results point to a serious compliance problem for NOX control on HDVs in China. The NOX limit was reduced by 56% from 8 g/kWh under China I to 3.5 g/kWh under China IV. However, the average real-world NOX/CO2 ratio of China IV trucks decreased by only 7% compared with China I trucks. It should be noted that there were both good and bad performers among the China IV vehicles tested, which we will discuss in the following section.
0
5
10
15
20
25
30
35
g N
OX /
kg C
O2
TruckBusAverageEstimated China III limit
Estimated China V limitEstimated China IV limit
China ITruck
China IITruck
China IIITruck
China IVTruck
China IVBus
China VBus
Figure 9. Average real-world NOX/CO2 emissions of HDVs, by emissions standard and vehicle category
As discussed in Section 2.3, HDVs should be equipped with electronic injection starting with China III and should be deployed with SCR systems starting with China IV. However,

24
ICCT WHITE PAPER
fake China III/IV HDVs were reportedly widespread in the market in 2014 (Economic Information, 2014). Some vehicles manufactured under the China III/IV standard actually used technologies typical for China I/II trucks. In addition, China Central Television (CCTV) reported that in some truck sales markets in Hebei, Guangdong, and Shanghai, newly produced China IV trucks offered for sale were not equipped with SCR systems (CCTV, 2014).
In this study, not all institutes checked the engine type and aftertreatment devices before the tests, so it is possible that some of the China III/IV trucks included in this study were not in compliance with the corresponding standards. Moreover, a previous ICCT study of urban off-cycle NOX emissions from Euro IV/V HDVs found that Euro IV/V trucks and buses in the EU equipped with SCR had significantly elevated NOX emissions during urban driving (Lowell & Kamakaté, 2012). This is mainly attributed to the fact that the NOX conversion efficiency of SCR systems is poor when exhaust temperature is low. The root causes are the unrepresentative test cycle and the weak in-use conformity provisions in Euro IV/V standards. As China followed the European precedent before China V, this further explains why no significant real-world NOX improvement for China IV trucks can be observed in Figure 9. In this study, China IV buses are observed to have lower average NOX emissions than China IV trucks. This is mainly because a few buses performed extremely well under real driving conditions, as discussed in detail in the following section.
Figure 10 gives an overview of the real-world g NOX/kg CO2 ratio of diesel HDVs by vehicle. It can be observed that a range of performance can be found for each emissions standard. Truck 53, a China IV truck, was the best NOX performer among the 53 trucks tested, whereas another China IV truck, Truck 44, emitted even more NOX than some China I and II trucks.
1 2 3 4 5 6 7 8 9 10 11 12 13 14 15 16 17 18 19 20 21 22 23 24 25 26 27 28 2930 31 32 33 34 35 36 37 38 3940 41 424344454647484950 51 52 53
Truck No.
0
5
10
15
20
25
30
35
g N
OX/k
g C
O2
1 2 3 4 5 6 7 8 9 10 11 12 13 14
Bus No.
Estimated China V limit
Estimated China IV limit
Estimated China III limit
Truck
Bus
China IV
China II
China V
China III
China I
Figure 10. Real-world NOX/CO2 emissions of diesel HDVs, by vehicle
Unlike the diesel trucks, remarkable differences can be observed in the performance of buses, with a few buses of China IV and China V that performed substantially better than the others. As presented in Figure 10, the NOX/CO2 ratios from Buses 9, 10, and 14 were much lower than from the other buses—and were an order of magnitude lower than the NOX/CO2 ratio of all of the HD trucks. It is worth noting that Buses 3, 9, and

25
META-STUDY OF PEMS DATA FROM LIGHT- AND HEAVY-DUTY VEHICLES IN CHINA
10 are of the same China IV bus model registered in 2007-2008 with similar odometer readings, but the emissions performances were completely different.
As Figure 11 shows, Buses 3, 9, and 10 emitted almost the same amount of CO2 in each trip, but the NOX emissions factor from Bus 3 was 26 times the levels of Buses 9 and 10. The results clearly indicate that the SCR system of Bus 3 was not working properly during the test, whereas the SCR of Buses 9 and 10 were effectively reducing on-road NOX emissions. Similarly, Bus 14, a China V bus produced in 2013, performed substantially better than other China V buses. To further study the cause of elevated NOX emissions, a detailed comparison of situation-specific and instantaneous emissions of Buses 3 and 9 follows.
0 200 400 600 800 1000 1200 1400
Average CO2 (g/km)
0
2
4
6
8
10
12
14
16
18China IV
China V
20
Ave
rag
e N
OX (
g/k
m)
1 2
3
45
67
8
910
11 1213
14
Figure 11. Overview of CO2 and NOX emissions factors of diesel buses, by vehicle
4.2.2 Situation-specific emissions and instantaneous emissions analysisIn this section, we chose Truck 53, the best performer among China IV trucks, and Buses 3 and 9, the good and bad performers among the same bus model, as examples and conducted a comparison. Technicians carefully checked the vehicle specifications and aftertreatment devices before the tests. They confirmed that these three HDVs were all equipped with SCR. Table 9 gives a summary of emissions and trip comparisons of Truck 53, Bus 3, and Bus 9. As Table 9 shows, the CO2 emissions factors of these two trips were almost the same (~1300 g/km), whereas the NOX emissions factor of Bus 3 was 24 times higher than that of Bus 9. In situation-specific emissions analysis, we classified velocity into four categories, idling (<1.6 km/h), urban (1.6-40 km/h), rural (40-80 km/h), and motorway (>80 km/h). As Figure 12 illustrates, NOX emissions factors from Bus 3 were substantially higher than those from Bus 9 under all driving situations.
26
ICCT WHITE PAPER
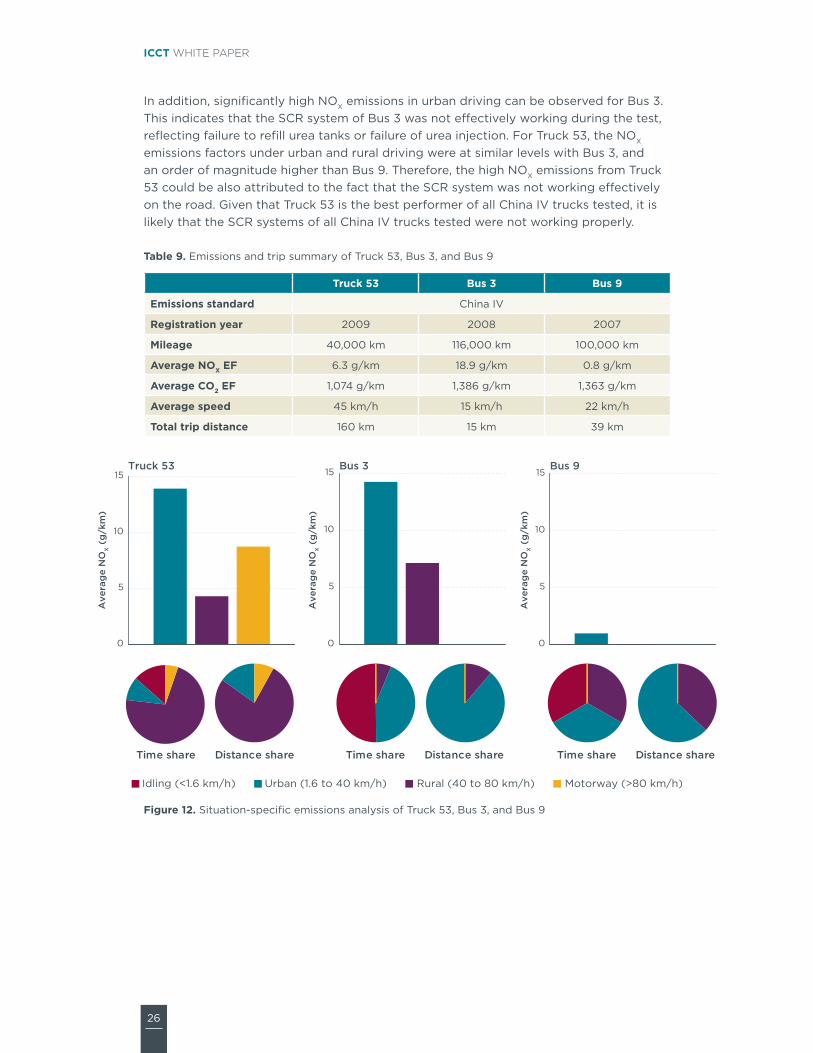
In addition, significantly high NOX emissions in urban driving can be observed for Bus 3. This indicates that the SCR system of Bus 3 was not effectively working during the test, reflecting failure to refill urea tanks or failure of urea injection. For Truck 53, the NOX emissions factors under urban and rural driving were at similar levels with Bus 3, and an order of magnitude higher than Bus 9. Therefore, the high NOX emissions from Truck 53 could be also attributed to the fact that the SCR system was not working effectively on the road. Given that Truck 53 is the best performer of all China IV trucks tested, it is likely that the SCR systems of all China IV trucks tested were not working properly.
Table 9. Emissions and trip summary of Truck 53, Bus 3, and Bus 9
Truck 53 Bus 3 Bus 9
Emissions standard China IV
Registration year 2009 2008 2007
Mileage 40,000 km 116,000 km 100,000 km
Average NOX EF 6.3 g/km 18.9 g/km 0.8 g/km
Average CO2 EF 1,074 g/km 1,386 g/km 1,363 g/km
Average speed 45 km/h 15 km/h 22 km/h
Total trip distance 160 km 15 km 39 km
0
5
10
15
0
5
10
15
0
5
10
15
Ave
rag
e N
OX (
g/k
m)
Ave
rag
e N
OX (
g/k
m)
Ave
rag
e N
OX (
g/k
m)
Idling (<1.6 km/h) Urban (1.6 to 40 km/h) Rural (40 to 80 km/h) Motorway (>80 km/h)
Truck 53 Bus 3 Bus 9
Time share Distance share Time share Distance share Time share Distance share
Figure 12. Situation-specific emissions analysis of Truck 53, Bus 3, and Bus 9
27
META-STUDY OF PEMS DATA FROM LIGHT- AND HEAVY-DUTY VEHICLES IN CHINA
5. DISCUSSION
This report provides an in-depth analysis of real-world emissions from gasoline LDVs and diesel HDVs in China. Second-by-second on-road PEMS data from 122 vehicles, including 55 LDVs and 67 HDVs, were collected and analyzed. The results point out a serious noncompliance issue for LDVs and HDVs in China: Real-world emissions are not sufficiently controlled in real driving conditions.
5.1 DISCUSSION OF LDVSThe results indicate that vehicle emissions standards played an important role in reducing emissions in China. NOX, CO, and THC emissions declined significantly as vehicle technology improved since China 4. The high emitters are mostly China 0 to China 2 cars. According to our results, the average on-road NOX emissions from China 0 private gasoline cars are 19 times those from modern China 5 gasoline cars, while NOX emissions from China 1 autos are eight times as high and from China 2 cars, four times as high. In 2016, pre-China 3 vehicles still accounted for 13% of the vehicle population in China (MEP, 2017a), yet they contribute significantly to total emissions. Accelerating the phase-out of these high emitters would bring substantial benefit in reducing vehicle emissions in China. In March 2017, Beijing implemented a vehicle banning policy whereby pre-China 3 light-duty gasoline vehicles are barred from entering the area enclosed by Beijing’s fifth ring on weekdays (BJEPB, 2016). Beijing EPB estimated that this measure will reduce vehicle NOX emissions from LDVs by 15% and volatile organic compounds by 12% in Beijing (People’s Daily, 2016).
TWCs can effectively control NOX emissions from gasoline cars. This exhaust aftertreatment technology has been successfully improved since China 3. In this study taxis are observed to have higher emissions factors than private cars of comparable ages, mainly because intensive operation of taxis may cause TWC deterioration. The average odometer reading of old taxis (China 2 and 3) is 380,000 km, four times the average odometer reading of private cars of comparable ages. As a result, the NOX emissions factors of these old taxis average five times that of comparably aged private cars. Combining these two factors of very high per kilometer emissions and much more mileage driven per day, taxis make a disproportionate contribution to local emissions.
Figure 13 presents the real-world NOX and CO emissions factors of 17 China 4 taxis. Those taxis are of the same model from the same manufacturer but had different mileage readings when tested. The figure shows that NOX and CO emissions spiked at around 300,000 km. This is probably because TWC or other components such as oxygen sensors deteriorate and cause emissions to rise sharply after 300,000 km. The OBD system was designed to identify which components need maintenance. For older taxis that do not have OBD systems, the results suggest that TWCs of taxis should be replaced at least every three years given that the typical number of annual vehicle kilometers traveled for taxis in China is around 100,000 km (Wang et al., 2010). For any taxi with an effective OBD system, it would be helpful to mandate OBD checks every year or two to identify deteriorated components and maintain or replace them.
In 2016, the Beijing government initiated a substantial effort to control high emissions from taxis by implementing a TWC replacement program for old taxis. By April 2017, the TWCs from 50,000 old taxis in Beijing were replaced, with all costs covered by the government (BJEPB, 2017). In this study, three taxis with newly replaced TWCs

28
ICCT WHITE PAPER
and three taxis with no TWCs were recruited and tested in Beijing. The on-road NOX, CO, and THC emissions of taxis with new TWCs were all below the China 4 laboratory limits, except one taxi with a CO CF of 1.6. The NOX CF of taxis with removed TWCs was 72 times that of taxis with new TWCs. The CO CF was 10 times as high, and the THC CF, 39 times.
The results further demonstrate that the TWC replacement policy will bring substantial benefits in urban air quality in Beijing. For other local cities facing severe air pollution, we strongly encourage local governments to consider urgent actions such as TWC replacement programs for old taxis. Also, much more intensive and frequent I/M programs and random inspections with high penalties for catalyst removal are also necessary.
NO
X (
g/k
m)
Mileage (1000km) Mileage (1000km)
CO
(g
/km
)
0
0.2
0.4
0.6
0.8
1
1.2
1.4
0 100 200 300 4000
1
2
3
4
5
6
0 100 200 300 400
Figure 13. Real-world NOX and CO emissions factors of China 4 taxis of same model with different mileage readings
In addition to the high emissions from old cars, NOX from modern China 4 and 5 gasoline autos are still unsatisfactory. Some modern vehicles that have passed the type-approval test emitted seven to 35 times the NOX limits in real-world driving. This does not mean that technologies are not available to meet the increasingly stringent standards. Instead, we found that some China 5 models had extremely low NOX emissions in a valid RDE test—as low as a third of the China 6b NOX limit. It further proves that advanced technologies are already available and applicable in the current market for the next phase of emissions standards. The most critical problems now are how to ensure that manufacturers deploy these technologies, calibrate them, and make sure they work properly and that maintenance issues are detected early and addressed quickly throughout useful vehicle life.
The China 6 emissions standard finalized in 2016 will be a great step in the right direction for reducing real-world emissions. China 6 is the first emissions regulation in China to introduce RDE test requirements for both type test and in-service test. Moreover, China 6 introduced the most comprehensive compliance program in China, including a number of manufacturer-run and agency-run emissions tests from prototype throughout useful vehicle life. Under the new testing framework, manufacturers will have to demonstrate that vehicle emissions stay low not only in the lab but also in real driving conditions.

29
META-STUDY OF PEMS DATA FROM LIGHT- AND HEAVY-DUTY VEHICLES IN CHINA
The China 6 RDE regulation will take effect for all new vehicles beginning July 1, 2023. However, no CO limit has been set in the current China 6 RDE regulation. The experimental results of this study indicate that CO from gasoline cars can be significantly high in real-world driving. Even though CO is not a major pollutant for urban air quality, it is toxic and affects human health. In addition, THC and CO are often emitted together (see Figure 14, the correlation between CO and THC emissions for gasoline cars). Given that on-road THC is difficult to measure with LDV PEMS testing, limiting on-road CO emissions would also indirectly limit THC emissions from gasoline cars and further reduce the semi-volatiles that contribute to secondary PM in the atmosphere.
y = 0.0608x + 0.0094R2 = 0.80
0
1
2
3
4
5
0 20 40 60
TH
C (
g/k
m)
CO (g/km)
Figure 14. CO and THC emissions factors of all gasoline cars tested in this study
In this study, particle emissions were not measured because of the limitations of the PEMS equipment. For the most recent tests of China 5 gasoline cars, we measured PN emissions in RDE tests. The results indicate that PN emissions from gasoline direct injection vehicles were four to eight times the China 5 limit for diesel cars,3 so PN emissions from gasoline cars should also be paid special attention.
Emissions data from the cold start period were not collected in the PEMS trips in this study. It is widely accepted that NOX, CO, and THC emissions are mostly generated in the first 300 seconds of cold starts, when the temperature of the catalyst is not high enough. A previous PEMS study on three China 4 taxis illustrated that THC emissions during the first 300 seconds of cold starts were 10 times those in a hot start, and CO emissions, six times (Wang et al., 2010). In northern China where residents experience terrible winter smog events, the issue of catalyst light-off can be critical. Therefore, further research should be done to investigate the impacts of cold starts on real-world emissions.
3 There is no PN limit for GDI vehicles in the China 5 standard.

30
ICCT WHITE PAPER
Finally, evaporative hydrocarbon emissions are not covered in this report. Studies have shown that evaporative hydrocarbon is one of the major pollutants from gasoline cars and plays an important role in degrading urban air quality (Liu et al., 2015). Therefore, further study of evaporative hydrocarbon emissions factors is much needed to evaluate real-world THC emission levels in China.
5.2 DISCUSSION OF HDVSFor HDVs, we focused only on NOX because CO and THC emissions are not major concerns for diesel vehicles (Bonnel et al., 2011). In 2016, diesel vehicles accounted for only 10.2% of the total vehicle population in China, but they emitted 68.7% of total vehicular NOX (MEP, 2017a). What we observed from this study added to the growing evidence that NOX emissions from the heavy-duty sector are not properly controlled under the current testing framework in China. Even though NOX limits decreased by 56% on paper from China I to China IV standards, real-world NOX emissions from modern China IV trucks do not follow the reduction pattern set by the standards. In this study, the average China IV truck’s emissions factor is 12.8 g NOX/kg CO2, 30% higher than the European result of 9.7 g NOX/kg CO2 (Muncrief, 2015).4 However, the high average NOX emissions from China IV HDVs do not mean that all vehicles would fail the PEMS test. In fact, a few of the best-performing buses had extremely low NOX emissions under real-world driving conditions. What surprised us most was that the worst performers and best performers were of the same model produced by the same manufacturer. Therefore, it is likely that the SCR system, the NOX aftertreatment device equipped on HDVs since China IV, was not working properly to reduce NOX emissions on some of the vehicles tested.
Previous studies (Lowell & Kamakaté, 2012) have shown that heavy-duty trucks and buses that are certified to Euro IV and V emissions standards and equipped with SCR systems have significantly higher NOX emissions during real-world driving, especially during urban driving. As China exactly followed the EU regulatory template in vehicle emissions standards, similar results were found in China on China IV/V heavy-duty trucks and buses. This is mainly because the NOX conversion efficiency of SCR systems is poor when exhaust temperature is low during urban driving. The root cause, however, is that the current type approval and in-use compliance framework is insufficient to ensure that aftertreatment technologies work effectively throughout a vehicle’s useful life. The current type-approval framework requires only that manufacturers demonstrate emissions compliance with a few predefined test cycles, such as the European Stationary Cycle and the ETC, which are not fully representative of the range of real-world engine conditions. In addition to the noncompliance issue on newly produced vehicles, some consumers take measures to stop SCR from working in real-world driving to reduce the costs of urea. A so-called “urea controller” which can reduce or stop urea injection, was sold by online shops in China before 2017 (The Economic Observer, 2017).5 The in-use noncompliance issue seriously threatens China’s efforts to achieve its goals on NOX emissions reductions and improve urban air quality.
Recently, the government has made substantial efforts on vehicle emissions compliance and enforcement. China’s new Air Pollution Prevention and Control Law, which took effect January 1, 2016, gave MEP clear authority to enforce the emissions standards and
4 Estimated by assuming an average engine efficiency of 40%.5 MEP is looking into this issue and has taken some steps. Such controllers are banned from sales online.
31
META-STUDY OF PEMS DATA FROM LIGHT- AND HEAVY-DUTY VEHICLES IN CHINA
penalize noncompliance. Moreover, the new air law shifts the focus from pre-production to in-use emissions controls. New provisions were created to address various aspects of in-use emissions control. These include recall authority, a requirement for releasing repair technology information on emissions control components, consumer obligations to repair or scrap high-emissions vehicles, and prohibitions on in-use tampering with emissions control systems and defeat devices. Before the new air law, drivers were not penalized for removing TWCs because of the lack of clear legal authority prohibiting tampering. The new air law also cleared up certain grey areas of authority with regard to implementation of emissions standards. For example, the old law barred the production and sale of vehicles and engines not in compliance with emissions standards but did not specify which agency had the authority to implement the provision. The new air law authorizes MEP and EPB to play leading roles in conducting conformity tests. The clearly defined roles of various agencies will increase the practicability of vehicle emissions standards and policy implementation.
MEP released a draft proposal of the China VI emissions standard for HDVs in October 2016. The China VI proposal shifts from European Stationary Cycle and ETC to the more representative cycles, the World Harmonized Stationary Cycle and WHTC, and introduces additional off-cycle emissions tests, the World Harmonized Not-To-Exceed test and full-vehicle PEMS test. For the first time in China, newly produced China VI vehicles will have to show compliance with emissions limits not only on an engine dynamometer but also on the road using a PEMS. Moreover, the on-road PEMS test applies to both type test and in-service compliance test, meaning manufacturers must ensure that emissions levels stay below limits throughout the useful life of the vehicles.
In addition, the China VI proposal introduced enhanced OBD requirements such as anti-tampering and remote emissions management. With the enhanced OBD provisions, when low urea level, low urea consumption, bad urea quality, or other malfunctions are detected and not fixed in a timely way, the torque/speed limiter will be activated, forcing the vehicle to drive only at a low speed. For the first time in vehicle regulation around the world, vehicles must be equipped with on-board terminals for remote emissions management. With the help of these stringent provisions on OBD and NOX control systems, it could be ensured that SCR systems work effectively to reduce real-world NOX emissions from HDVs. A recent ICCT study also shows that real-world NOX emissions from Euro VI diesel HDVs stay at an extremely low level, even lower than NOX from Euro 6 LDVs (Muncrief, 2016). This further indicates that proper real-world NOX control is technically possible. We believe that the China VI proposal is a significant improvement over the existing standards and with proper implementation will bring significant reductions in emissions and health benefits in decades to come. We recommend that provinces and cities facing severe air pollution implement China VI standard as early as possible.
However, the China VI standard is not likely to be put into effect nationwide until 2020. Before then, urgent remedial actions are needed to reduce excess NOX emissions from the existing HDV fleet. In 2013, Beijing EPB released two local standards specifically designed to prevent excess NOX emissions from China IV and China V HDVs (BJEPB, 2013a, 2013b). The first standard requires China IV and V engines to be tested over the WHTC in addition to the current European Transient Cycle. The second standard established in-use complete vehicle PEMS testing requirements for China IV and V HDVs. The Beijing EPB estimates that implementation of these standards will reduce
32
ICCT WHITE PAPER
NOX emissions from China IV/V diesel vehicles by as much as 60% during urban driving (BJEPB, 2015).
At the national level, China MEP issued a supplemental standard in 2014 that requires China IV and V heavy-duty engines for use in urban vehicles to be tested over the WHTC (MEP, 2014). For in-use buses, Beijing EPB implemented a modification program for 8,800 China IV/V diesel buses in 2015 (BJEPB, 2015). It was estimated that the modification program in Beijing will reduce NOX emissions by 2,800 tonnes per year. Beijing’s urban bus modification program would be a good example for other mega-cities facing severe air pollution to follow. MEP released China’s first national PEMS testing standard for HDVs in September 2017 (MEP, 2017b). The standard, a supplement to all requirements under the existing China V standard, requires additional on-road PEMS testing for new and in-use China V HDVs. The supplemental PEMS testing standard for China V HDVs is a step forward that will further control excess NOX emissions from HDVs in China.
For in-use vehicles, remote sensing is an effective way for authorities to identify high emitters on the road. Compared with laboratory testing and PEMS testing, the advantage of remote sensing is that emissions data from a large sample of vehicles can be collected in a short period. In July 2017, MEP released its first national regulation on remote sensing (MEP, 2017c). This regulation applies to light-duty and heavy-duty diesel vehicles, with a goal of eliminating 5% of noncompliant and high-emitting vehicles. Also, the standard introduces measurement methods for remote sensing and sets emissions limits for opacity, Ringelmann blackness, and nitric oxide (NO)6 for diesel vehicles. A vehicle is determined to be noncompliant if it is caught exceeding remote sensing emissions limits for the same pollutant in two or more consecutive remote sensing tests in six months.
It should be noted that particle emissions are major pollutants from the HDV fleet. In 2016, PM emissions from diesel vehicles accounted for more than 99% of total vehicular PM emissions (MEP, 2017a). In this study, particle emissions were not collected for all trips because of the limitations of PEMS equipment. Particle emissions for five trucks equipped with mechanical fuel injection (MI) engines and another five trucks equipped with electronically-controlled fuel injection (EI) engines were measured by electrical low pressure impactor. The average PM emissions factor for MI engines was 674 ± 239 mg/km and for EI engines, 63 ± 48 mg/km. MI is a typical engine technology for pre-China III HDVs, and EI is widely employed in China III and IV HDVs. Compared with MI engines, the 91% reduction in PM emissions of EI engines was quite close to the reduction set in the standard (Zheng et al., 2016). More measurements of real-world PM and PN emissions from HDVs should be conducted to gain a better understanding of real-world particle emissions in China.
6 NO is used only for screening high-emitting vehicles. High-emitting vehicles typically are vehicles that are forbidden from entering a city or a low-emissions zone set by the local government.
33
META-STUDY OF PEMS DATA FROM LIGHT- AND HEAVY-DUTY VEHICLES IN CHINA
6. CONCLUSIONS AND RECOMMENDATIONS
This report presents an in-depth analysis of real-world emissions from 55 LDVs and 67 HDVs in China. On-road PEMS testing results from LDVs and HDVs add to the empirical evidence that NOX emissions are not properly controlled under the current testing framework. For gasoline LDVs, real-world NOX performance varies widely for different vehicle models. The average NOX emissions for China 4 taxis with TWCs removed were 72 times those of taxis with new TWCs, and for taxis with high-mileage TWCs, NOX emissions were 13 times as high. Among diesel HDVs, on-road NOX emissions performance didn’t improve as much as it should have as emission standards became more stringent. It has been widely known that advanced emissions control technologies already exist in the market, so the most important problem now is ensuring that those technologies are deployed on vehicles and work effectively not only in laboratory but also in real driving conditions.
6.1 CONCLUSIONS AND RECOMMENDATIONS FOR LDVSThe China 6 LDV emissions standard, which will take effect July 1, 2020, is a significant step toward solving the noncompliance issue. We applaud the adoption of RDE testing and requirements in China 6, although there are still some limitations in the current RDE regulation.
Firstly, cold starts are excluded from the data evaluation process. It is widely accepted that most NOX, CO, and THC emissions are generated in the first 300 seconds of cold starts, when the temperature of the catalyst is not high enough. Cold-start operations were included in the data evaluation process in the EU RDE regulation Package 3 passed in December 2016. The inclusion of cold starts will be essential for ensuring the use of improved emissions control technologies, which already exist in the market. We recommend further study of the impacts of cold starts on emissions in future RDE testing projects, and full inclusion of cold starts in the final China 6 RDE regulation, as is currently done in the European RDE regulation.
Secondly, the current China 6 RDE regulation doesn’t set a CO limit. The experimental results in this study suggest that CO from gasoline cars could be substantial in real-world driving. THC and CO are often emitted together. Therefore, limiting on-road CO emissions would also indirectly limit THC emissions from gasoline cars and further reduce the semi-volatiles that contribute to secondary particulate matter in the atmosphere. CO limits were not introduced in the EU RDE regulation mainly because CO emissions are mostly generated from gasoline cars, and diesel cars account for more than 50% of the European passenger vehicle market (ICCT, 2017).7 Considering that more than 99% of passenger cars in China are powered by gasoline, we recommend further exploration of real-world CO emissions of gasoline cars in China and introduction of a CO limit in the final China 6 RDE regulation.
Thirdly, our test results demonstrate that TWCs play an important role in emissions control for gasoline cars. Taxis are observed to have higher emissions factors than private cars of comparable ages, mainly because intensive operation of taxis may cause TWC deterioration. Therefore, we strongly recommend that local governments consider urgent actions such as TWC replacement programs for old taxis as well as much more
7 From communication with European Commission Joint Research Center.
34
ICCT WHITE PAPER
intensive and frequent I/M programs and random inspections with high penalties for catalyst removal.
In the China 6 final rule, it clearly indicates that the CFs of NOX and PN are set as temporary limits and will be re-evaluated and determined by July 2022. In theory, there are still opportunities to fix the limitations in the China 6 regulation by 2022. Currently, the research on RDE testing procedure and emissions results remains very limited in China. To increase the stringency of the China 6 RDE regulation and address severe urban air pollution in China, we encourage authorities and research organizations to conduct further RDE testing campaigns, and we recommend that authorities adjust RDE requirements based on the actual situation in China.
6.2 CONCLUSIONS AND RECOMMENDATIONS FOR HDVSTest results for three buses demonstrate that on-road NOX emissions can be well controlled if SCR systems work effectively in real-world driving. However, most of the trucks and buses tested had very high NOX emissions, illustrating widespread problems with implementing standards. Specifically, no significant improvement in real-world NOX emissions can be observed for China IV trucks. The proposed China VI HDV standard, which is likely to be implemented starting January 1, 2020, introduces new off-cycle engine tests and full-vehicle PEMS tests, comprehensive in-use compliance programs, and stringent OBD provisions and remote emissions management systems. We believe the China VI HDV standard will bring significant emissions reductions and health benefits to China with proper implementation.
Similarly to LDVs, cold starts are not included in the PEMS tests in the China VI proposal. The latest Euro VI amendatory regulation includes a requirement for monitoring emissions performance in a warm-up period in the PEMS tests (European Commission, 2016c). We recommend further study of the impacts of cold starts and addition of a monitoring phase for cold starts in the China VI regulation.
High-emitting HDVs make a major contribution to air pollution in urban areas. Before the new HDV standard is implemented in 2020, urgent remedial actions are essential to address the high NOX emissions problem from the in-use HDV fleet. We strongly recommend the management measures carried out by Beijing EPB. We encourage other local governments to learn from Beijing’s experience and take urgent actions such as modification or retrofit programs for urban buses and trucks. In addition, developing technical regulations of retrofitting in-use diesel vehicles would contribute to effective implementation of retrofit programs.
The new air law, which took effect January 1, 2016, cleared up certain grey areas of authority and gave MEP and EPBs authority to enforce the emissions standards and penalize noncompliance. A robust in-use surveillance program heavily relies on implementation and enforcement at the local level. We recommend local EPBs put a strong focus on in-use surveillance programs, conduct regular in-use testing and issue penalties for non-compliance.

35
META-STUDY OF PEMS DATA FROM LIGHT- AND HEAVY-DUTY VEHICLES IN CHINA
REFERENCES
Beijing Daily. (2015). Three-way catalyst for rent (in Chinese). Retrieved from http://news.ifeng.com/a/20150530/43869144_0.shtml
Beijing Municipal Environmental Protection Bureau (BJEPB). (2013a). Limits and measurement methods for exhaust pollutants from compression ignition and gas fueled positive ignition engines of vehicles (Bench mode methods). Retrieved from http://www.bjepb.gov.cn/eportal/fileDir/oldfile/bjepb/resource/cms/2015/05/2015052009193199166.pdf
Beijing Municipal Environmental Protection Bureau (BJEPB). (2013b). Limits and measurement method of emissions from heavy-duty vehicle (PEMS method). Retrieved from http://www.bjepb.gov.cn/eportal/fileDir/oldfile/bjepb/resource/cms/2015/05/2015052009170974110.pdf
Beijing Municipal Environmental Protection Bureau (BJEPB). (2014). Beijing PM2.5 source apportionment was officially released (in Chinese). Retrieved from http://www.bjepb.gov.cn/bjhrb/xxgk/jgzn/jgsz/jjgjgszjzz/xcjyc/xwfb/607219/index.html
Beijing Municipal Environmental Protection Bureau (BJEPB). (2015). China IV/V diesel buses emissions modification program in Beijing was completed (in Chinese). Retrieved from www.bjepb.gov.cn/bjhrb/xxgk/jgzn/jgsz/jjgjgszjzz/xcjyc/xwfb/607579/index.html
Beijing Municipal Environmental Protection Bureau (BJEPB). (2016). Heavy air pollution emergency plan was released. China 1 and China 2 light-duty gasoline cars are barred from entering the area enclosed by Beijing’s fifth ring on weekdays (in Chinese). Retrieved from http://www.bjepb.gov.cn/bjhrb/xxgk/jgzn/jgsz/jjgjgszjzz/xcjyc/xwfb/607947/index.html
Beijing Municipal Environmental Protection Bureau (BJEPB). (2017). TWC replacement program for taxis was completed this year (in Chinese). Retrieved from http://www.bjepb.gov.cn/bjhrb/xxgk/jgzn/jgsz/jjgjgszjzz/xcjyc/xwfb/812398/index.html
Beijing Youth Daily. (2015). TWCs for rent helped high-emitting cars pass the inspection (in Chinese). Retrieved from http://epaper.ynet.com/html/2015-03/22/content_122933.htm?div=-1
Bonnel, P., Kubelt, J., & Provenza, A. (2011). Heavy-duty engines conformity testing based on PEMS. Lessons learned from the European pilot program. JRC Scientific and Technical Reports. Publications Office of the European Union, European Union. Retrieved from http://publications.jrc.ec.europa.eu/repository/bitstream/JRC66031/reqno_jrc66031_lbna24921enn.pdf
Carslaw, D. C., Beevers, S. D., Tate, J. E., Westmoreland, E. J., & Williams, M. L. (2011). Recent evidence concerning higher NOX emissions from passenger cars and light duty vehicles. Atmospheric Environment, 45(39), 7053–7063. https://doi.org/10.1016/j.atmosenv.2011.09.063
Carslaw, D. C., & Rhys-Tyler, G. (2013). New insights from comprehensive on-road measurements of NOX, NO2 and NH3 from vehicle emission remote sensing in London, UK. Atmospheric Environment, 81, 339–347. https://doi.org/10.1016/j.atmosenv.2013.09.026

36
ICCT WHITE PAPER
CCTV. (2014). Dealers of JAC motors cheated: China III vehicles were sold as China IV vehicles (in Chinese). Retrieved from http://finance.sina.com.cn/consume/puguangtai/20140516/233219137181.shtml
Chen, C., Huang, C., Jing, Q., Wang, H., Pan, H., Li, L., … Streets, D. G. (2007). On-road emission characteristics of heavy-duty diesel vehicles in Shanghai. Atmospheric Environment, 41(26), 5334–5344. https://doi.org/10.1016/j.atmosenv.2007.02.037
China Association of Automobile Manufacturers (CAAM). (2017). 2016 automobile industry economic operations (in Chinese). Retrieved from http://www.caam.org.cn/xiehuidongtai/20170112/1505203997.html
Department of Environmental Protection of Guangdong Province (GDEP). (2015). Shenzhen PM2.5 source apportionment was officially released (in Chinese). Retrieved from http://www.gdep.gov.cn/news/hbxw/201504/t20150428_201065.html
Economic Information. (2014). Fake China III diesel vehicles are widespread because of poor enforcement (in Chinese). Retrieved from http://dz.jjckb.cn/www/pages/webpage2009/html/2014-03/27/content_88270.htm?div=-1
European Commission. (2016a). Commission Regulation (EU) 2016/427 of 10 March 2016 amending Regulation (EC) No 692/2008 as regards emissions from light passenger and commercial vehicles (Euro 6). Retrieved from http://eur-lex.europa.eu/legal-content/EN/TXT/PDF/?uri=CELEX:32016R0427&from=EN
European Commission. (2016b). Commission Regulation (EU) 2016/646 of 20 April 2016 amending Regulation (EC) No 692/2008 as regards emissions from light passenger and commercial vehicles (Euro 6). Retrieved from http://eur-lex.europa.eu/legal-content/EN/TXT/PDF/?uri=CELEX:32016R0646&from=EN
European Commission. (2016c). Commission Regulation (EU) 2016/1718 of 20 September 2016 amending Regulation (EU) No 582/2011 with respect to emissions from heavy-duty vehicles as regards the provisions on testing by means of portable emission measurement systems (PEMS) and the procedure for the testing of the durability of replacement pollution control devices. Retrieved from http://eur-lex.europa.eu/legal-content/EN/TXT/?uri=CELEX:32016R1718
Franco, V., Posada Sánchez, F., German, J., & Mock, P. (2014). Real-world exhaust emissions from modern diesel cars. International Council on Clean Transportation. Retrieved from http://www.theicct.org/real-world-exhaust-emissions-modern-diesel-cars
Guo, J., Ge, Y., Hao, L., Tan, J., Peng, Z., & Zhang, C. (2015). Comparison of real-world fuel economy and emissions from parallel hybrid and conventional diesel buses fitted with selective catalytic reduction systems. Applied Energy, 159, 433–441. https://doi.org/10.1016/j.apenergy.2015.09.007
Huang, C., Lou, D., Hu, Z., Feng, Q., Chen, Y., Chen, C., … Yao, D. (2013). A PEMS study of the emissions of gaseous pollutants and ultrafine particles from gasoline- and diesel-fueled vehicles. Atmospheric Environment, 77, 703–710. https://doi.org/10.1016/j.atmosenv.2013.05.059
He, L., Hu, J., Zhang, S., Wu, Y., Guo, X., Guo, X., … Bao, X. (2017). Investigating real-world emissions of China’s heavy-duty diesel trucks: Can SCR effectively mitigate NOX emissions for highway trucks? Aerosol and Air Quality Research, 17, 2585-2594. https://doi.org/10.4209/aaqr.2016.12.0531
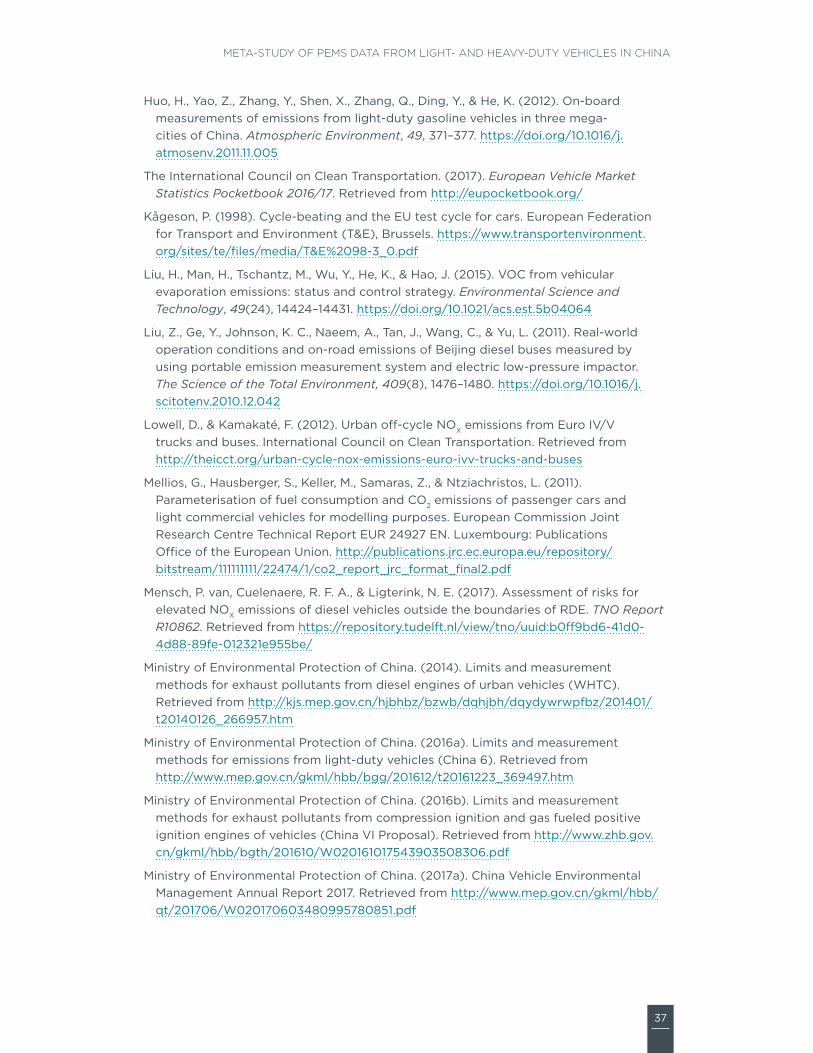
37
META-STUDY OF PEMS DATA FROM LIGHT- AND HEAVY-DUTY VEHICLES IN CHINA
Huo, H., Yao, Z., Zhang, Y., Shen, X., Zhang, Q., Ding, Y., & He, K. (2012). On-board measurements of emissions from light-duty gasoline vehicles in three mega-cities of China. Atmospheric Environment, 49, 371–377. https://doi.org/10.1016/j.atmosenv.2011.11.005
The International Council on Clean Transportation. (2017). European Vehicle Market Statistics Pocketbook 2016/17. Retrieved from http://eupocketbook.org/
Kågeson, P. (1998). Cycle-beating and the EU test cycle for cars. European Federation for Transport and Environment (T&E), Brussels. https://www.transportenvironment.org/sites/te/files/media/T&E%2098-3_0.pdf
Liu, H., Man, H., Tschantz, M., Wu, Y., He, K., & Hao, J. (2015). VOC from vehicular evaporation emissions: status and control strategy. Environmental Science and Technology, 49(24), 14424–14431. https://doi.org/10.1021/acs.est.5b04064
Liu, Z., Ge, Y., Johnson, K. C., Naeem, A., Tan, J., Wang, C., & Yu, L. (2011). Real-world operation conditions and on-road emissions of Beijing diesel buses measured by using portable emission measurement system and electric low-pressure impactor. The Science of the Total Environment, 409(8), 1476–1480. https://doi.org/10.1016/j.scitotenv.2010.12.042
Lowell, D., & Kamakaté, F. (2012). Urban off-cycle NOX emissions from Euro IV/V trucks and buses. International Council on Clean Transportation. Retrieved from http://theicct.org/urban-cycle-nox-emissions-euro-ivv-trucks-and-buses
Mellios, G., Hausberger, S., Keller, M., Samaras, Z., & Ntziachristos, L. (2011). Parameterisation of fuel consumption and CO2 emissions of passenger cars and light commercial vehicles for modelling purposes. European Commission Joint Research Centre Technical Report EUR 24927 EN. Luxembourg: Publications Office of the European Union. http://publications.jrc.ec.europa.eu/repository/bitstream/111111111/22474/1/co2_report_jrc_format_final2.pdf
Mensch, P. van, Cuelenaere, R. F. A., & Ligterink, N. E. (2017). Assessment of risks for elevated NOX emissions of diesel vehicles outside the boundaries of RDE. TNO Report R10862. Retrieved from https://repository.tudelft.nl/view/tno/uuid:b0ff9bd6-41d0-4d88-89fe-012321e955be/
Ministry of Environmental Protection of China. (2014). Limits and measurement methods for exhaust pollutants from diesel engines of urban vehicles (WHTC). Retrieved from http://kjs.mep.gov.cn/hjbhbz/bzwb/dqhjbh/dqydywrwpfbz/201401/t20140126_266957.htm
Ministry of Environmental Protection of China. (2016a). Limits and measurement methods for emissions from light-duty vehicles (China 6). Retrieved from http://www.mep.gov.cn/gkml/hbb/bgg/201612/t20161223_369497.htm
Ministry of Environmental Protection of China. (2016b). Limits and measurement methods for exhaust pollutants from compression ignition and gas fueled positive ignition engines of vehicles (China VI Proposal). Retrieved from http://www.zhb.gov.cn/gkml/hbb/bgth/201610/W020161017543903508306.pdf
Ministry of Environmental Protection of China. (2017a). China Vehicle Environmental Management Annual Report 2017. Retrieved from http://www.mep.gov.cn/gkml/hbb/qt/201706/W020170603480995780851.pdf

38
ICCT WHITE PAPER
Ministry of Environmental Protection of China. (2017b). Measurement method and technical specification for PEMS test of exhaust pollutants from heavy-duty diesel and gas fueled vehicles. Retrieved from http://kjs.mep.gov.cn/hjbhbz/bzwb/dqhjbh/dqydywrwpfbz/201709/W020170921587147401788.pdf
Ministry of Environmental Protection of China. (2017c). Measurement method and specifications for exhaust pollutants from in-use diesel vehicles by remote sensing method. Retrieved from http://kjs.mep.gov.cn/hjbhbz/bzwb/dqhjbh/dqydywrwpfbz/201708/W020170802605590990126.pdf
Mock, P., & German, J. (2015). The future of vehicle emissions testing and compliance. International Council on Clean Transportation. Retrieved from http://www.theicct.org/future-of-vehicle-testing
Mock, P. (2017). Real-driving emissions test procedure for exhaust gas pollutant emissions of cars and light commercial vehicles in Europe. International Council on Clean Transportation. Retrieved from http://www.theicct.org/RDE-test-procedure-exhaust-gas-pollutant-emissions-cars-and-LCVs
Muncrief, R. (2015). Comparison of real-world off-cycle NOX emissions control in Euro IV, V, and VI. International Council on Clean Transportation. Retrieved from http://www.theicct.org/publications/comparing-real-world-cycle-nox-emissions-control-euro-iv-v-and-vi
Muncrief, R. (2016). NOX emissions from heavy-duty and light-duty diesel vehicles in the EU: Comparison of real-world performance and current type-approval requirements. International Council on Clean Transportation. Retrieved from http://www.theicct.org/publications/nox-emissions-heavy-duty-and-light-duty-diesel-vehicles-eu-comparison-real-world
People’s Daily. (2016). China 1 and China 2 light-duty gasoline cars are barred from entering the area enclosed by Beijing’s fifth ring (in Chinese). Retrieved from http://paper.people.com.cn/rmrb/html/2016-11/22/nw.D110000renmrb_20161122_1-16.htm
Posada, F., Bandivadekar, A., & German, J. (2012). Estimated cost of emission reduction technologies for LDVs. International Council on Clean Transportation. Retrieved from http://www.theicct.org/estimated-cost-emission-reduction-technologies-ldvs
Posada, F., Chambliss, S., & Blumberg, K. (2016). Costs of emission reduction technologies for heavy-duty diesel vehicles. International Council on Clean Transportation. Retrieved from http://theicct.org/costs-emission-reduction-tech-hdvs
Rodríguez, F., Muncrief, R., Delgado, O., & Baldino, C. (2017). Market penetration of fuel-efficiency technologies for heavy-duty vehicles in the European Union, the United States, and China. International Council on Clean Transportation. Retrieved from http://www.theicct.org/market-penetration-HDV-fuel-efficiency-technologies
The Economic Observer. (2017). Tampering devices are sold on Taobao. Emissions cheating of commercial vehicles is increasing (in Chinese). Retrieved from http://www.eeo.com.cn/2017/0216/298238.shtml
Vermeulen, R., Spreen, J., Ligterink, N., & Vonk, W. (2014). The Netherlands in-service emissions testing programme for heavy-duty 2011-2013. TNO report. TNO 2014 R10641. Retrieved from https://www.tno.nl/media/3443/hdv_in_service_testing_tno_2014_r10641.pdf
Wang, A., Ge, Y., Tan, J., Fu, M., Shah, A. N., Ding, Y., … Liang, B. (2011). On-road pollutant emission and fuel consumption characteristics of buses in Beijing. Journal of Environmental Sciences, 23(3), 419–426. https://doi.org/10.1016/S1001-0742(10)60426-3

39
META-STUDY OF PEMS DATA FROM LIGHT- AND HEAVY-DUTY VEHICLES IN CHINA
Wang H., Hu J., Bao X., Wu Y., Xie S., & Li Z. (2010). Emission characteristics of gasoline taxi cabs complying with China IV emission standards during cold and hot starts. Journal of Automotive Safety and Energy, 1(2), 146-151. Retrieved from http://en.cnki.com.cn/Article_en/CJFDTotal-QCAN201002012.htm
Wu, X., Wu, Y., Zhang, S., Liu, H., Fu, L., & Hao, J. (2016). Assessment of vehicle emission programs in China during 1998-2013 : Achievement, challenges and implications. Environmental Pollution, 214, 556–567. https://doi.org/10.1016/j.envpol.2016.04.042
Wu, Y., Zhang, S. J., Li, M. L., Ge, Y. S., Shu, J. W., Zhou, Y., … Hao, J. M. (2012). The challenge to NOX emission control for heavy-duty diesel vehicles in China, 12(19), 9365–9379. https://doi.org/10.5194/acp-12-9365-2012
Zhang, Q. (2013). Investigation of diesel emissions in China. International Council on Clean Transportation. Retrieved from http://www.theicct.org/investigation-diesel-emissions-china
Zhang, S., Wu, Y., Hu, J., Huang, R., Zhou, Y., Bao, X., … Hao, J. (2014). Can Euro V heavy-duty diesel engines, diesel hybrid and alternative fuel technologies mitigate NOX emissions? New evidence from on-road tests of buses in China. Applied Energy, 132(2), 118–126. https://doi.org/10.1016/j.apenergy.2014.07.008
Zheng, X., Wu, Y., Zhang, S., Baldauf, R. W., Zhang, K. M., Hu, J., … Hao, J. (2016). Joint measurements of black carbon and particle mass for heavy-duty diesel vehicles using a portable emission measurement system. Atmospheric Environment, 141, 435–442. https://doi.org/10.1016/j.atmosenv.2016.07.013
Zheng, X., Wu, Y., Zhang, S., He, L., & Hao, J. (2017). Evaluating real-world emissions of light-duty gasoline vehicles with deactivated three-way catalyst converters. Atmospheric Pollution Research, https://doi.org/10.1016/j.apr.2017.08.001

40
ICCT WHITE PAPER
APPENDIX
Table A1. Trip information and raw emissions factors for LDVs
PC No.
Emissions standard
Trip duration
(hr) Type
Trip distance
(km)
Average trip velocity
(km/h)Average CO2
(g/km)Average CO
(g/km)Average NOX
(g/km)Average THC
(g/km)
1 China 0 0:58 PC 36.0 37.2 322.5 4.17 2.51 1.82
2 China 0 1:3 PC 28.6 27.5 396.7 58.27 1.84 4.23
3 China 0 1:2 PC 31.1 30.4 212.2 20.71 0.32 1.03
4 China 1 0:28 PC 13.4 28.6 338.5 2.45 1.23 0.30
5 China 1 1:17 PC 28.2 21.9 352.2 11.43 0.58 0.51
6 China 1 1:17 PC 36.6 28.4 219.4 24.73 0.32 1.21
7 China 2 1:5 Taxi 31.4 29.2 237.6 12.09 3.01 1.98
8 China 2 1:11 Taxi 31.1 26.2 199.1 6.94 1.74 0.74
9 China 2 1:2 Taxi 31.1 30.3 206.2 50.22 1.35 2.28
10 China 2 0:53 Taxi 31.1 35.2 206.2 9.83 1.09 0.48
11 China 2 1:7 PC 36.0 32.4 248.7 5.49 0.75 0.12
12 China 2 0:55 Taxi 30.5 33.1 214.3 5.19 0.53 0.18
13 China 2 1:7 PC 36.5 32.9 246.3 2.36 0.46 0.10
14 China 2 1:10 Taxi 31.0 26.4 232.7 2.50 0.28 0.05
15 China 2 0:55 PC 36.9 40.4 263.1 2.80 0.26 0.21
16 China 2 1:0 Taxi 31.0 31.0 218.0 6.32 0.25 0.09
17 China 2 1:27 PC 36.6 25.4 326.5 6.36 0.16 0.29
18 China 2 1:6 PC 27.6 25.2 417.5 6.19 0.03 0.17
19 China 3 1:16 Taxi 30.1 23.7 325.7 3.05 0.67 0.14
20 China 3 0:58 PC 35.8 37.3 171.0 0.65 0.12 0.05
21 China 4 2:19 Taxi 70.3 30.3 231.5 9.54 2.81 N.A.
22 China 4 1:30 Taxi 50.4 33.7 182.0 9.00 2.51 0.62
23 China 4 1:41 Taxi 53.2 31.5 197.2 8.30 1.62 0.55
24 China 4 1:37 Taxi 52.6 32.7 122.3 4.86 1.31 0.16
25 China 4 1:22 Taxi 52.3 38.1 165.3 4.80 0.99 0.13
26 China 4 1:15 Taxi 52.8 42.2 187.8 1.12 0.22 0.02
27 China 4 1:19 Taxi 53.8 40.6 213.3 1.34 0.13 0.01
28 China 4 1:41 PC 52.5 31.3 237.6 2.24 0.10 0.05
29 China 4 1:10 Taxi 52.8 45.0 200.8 0.78 0.07 0.01
30 China 4 1:42 Taxi 54.9 32.2 187.4 2.77 0.07 0.02
31 China 4 1:18 Taxi 52.8 40.9 190.2 0.61 0.07 0.02
32 China 4 1:18 Taxi 53.1 40.6 188.5 0.40 0.07 0.02
33 China 4 1:14 Taxi 45.6 36.9 238.5 1.19 0.07 0.06
34 China 4 1:14 Taxi 45.6 36.9 238.4 1.19 0.07 0.06
35 China 4 1:4 Taxi 49.0 45.9 197.0 0.95 0.07 0.01
36 China 4 1:15 Taxi 52.8 42.4 192.5 0.95 0.05 0.01
37 China 4 1:31 Taxi 52.2 34.5 204.2 1.60 0.05 0.01
38 China 4 1:17 PC 52.9 41.1 205.1 0.34 0.04 0.01

41
META-STUDY OF PEMS DATA FROM LIGHT- AND HEAVY-DUTY VEHICLES IN CHINA
PC No.
Emissions standard
Trip duration
(hr) Type
Trip distance
(km)
Average trip velocity
(km/h)Average CO2
(g/km)Average CO
(g/km)Average NOX
(g/km)Average THC
(g/km)
39 China 4 1:1 Taxi 41.3 40.6 194.7 0.99 0.04 0.09
40 China 4 1:1 Taxi 41.3 40.6 194.7 0.99 0.04 0.09
41 China 4 1:20 Taxi 52.8 39.7 189.1 0.43 0.03 0.01
42 China 4 1:20 Taxi 52.8 39.7 189.1 0.43 0.03 0.01
43 China 4 1:18 Taxi 48.2 36.9 195.9 0.98 0.03 0.01
44 China 4 1:19 Taxi 43.7 33.4 219.2 0.97 0.02 0.10
45 China 4 1:19 Taxi 43.7 33.4 219.1 0.97 0.02 0.10
46 China 4 2:9 Taxi 55.1 25.6 202.5 0.52 0.02 0.03
47 China 4 1:16 Taxi 47.8 37.5 178.0 0.12 0.01 0.01
48 China 4 1:46 Taxi 53.8 30.4 167.3 0.57 0.01 0.02
49 China 5 1:3 PC 44.0 42.2 172.5 0.19 0.45 0.02
50 China 5 1:40 PC 82.5 49.6 250.3 3.05 0.10 N.A.
51 China 5 1:38 PC 82.1 50.3 225.8 0.44 0.10 N.A.
52 China 5 1:12 PC 48.3 40.3 201.2 0.95 0.06 0.02
53 China 5 1:26 PC 52.3 36.4 214.4 0.52 0.04 0.00
54 China 5 1:39 PC 82.9 50.2 157.4 0.03 0.03 N.A.
55 China 5 1:23 Taxi 50.2 36.5 177.8 0.17 0.02 0.01
56 China 5 1:34 PC 52.7 33.8 142.4 0.44 0.02 0.03
57 China 5 1:35 PC 82.6 52.2 337.7 6.40 0.02 N.A.
58 China 5 1:34 PC 82.4 52.4 328.9 4.96 0.01 N.A.
59 China 5 1:37 PC 82.9 51.2 245.6 1.47 0.01 N.A.
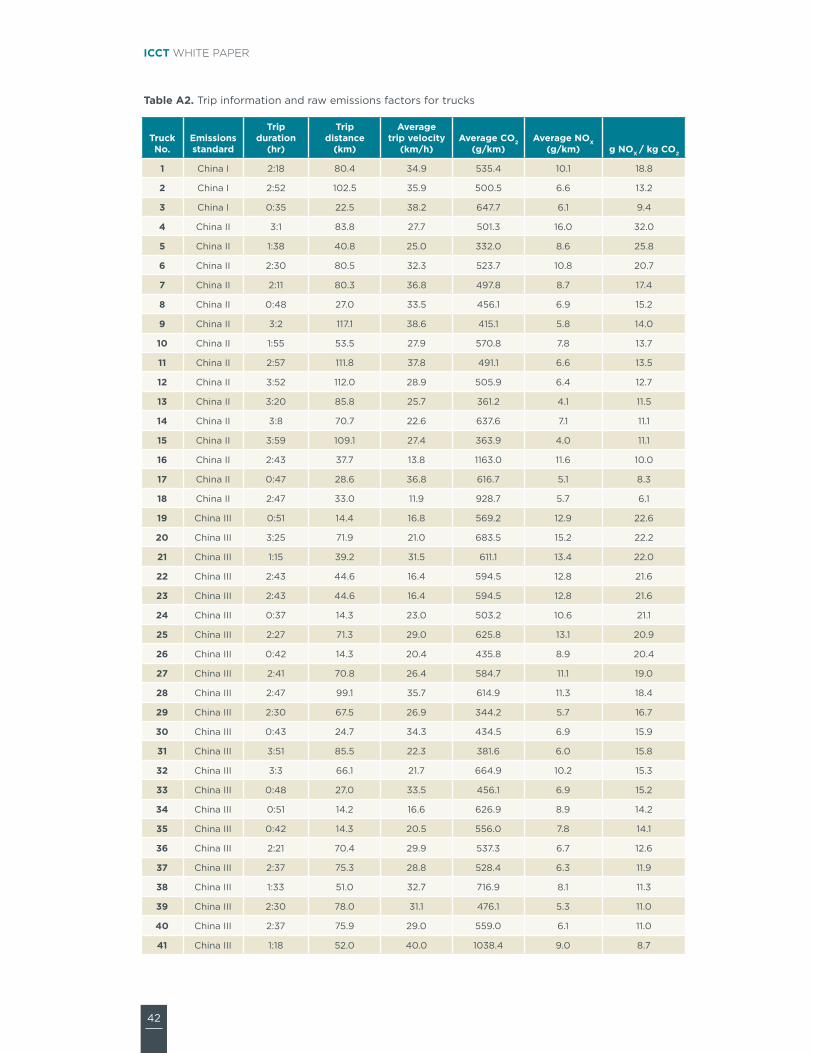
42
ICCT WHITE PAPER
Table A2. Trip information and raw emissions factors for trucks
Truck No.
Emissions standard
Trip duration
(hr)
Trip distance
(km)
Average trip velocity
(km/h)Average CO2
(g/km)Average NOX
(g/km) g NOX / kg CO2
1 China I 2:18 80.4 34.9 535.4 10.1 18.8
2 China I 2:52 102.5 35.9 500.5 6.6 13.2
3 China I 0:35 22.5 38.2 647.7 6.1 9.4
4 China II 3:1 83.8 27.7 501.3 16.0 32.0
5 China II 1:38 40.8 25.0 332.0 8.6 25.8
6 China II 2:30 80.5 32.3 523.7 10.8 20.7
7 China II 2:11 80.3 36.8 497.8 8.7 17.4
8 China II 0:48 27.0 33.5 456.1 6.9 15.2
9 China II 3:2 117.1 38.6 415.1 5.8 14.0
10 China II 1:55 53.5 27.9 570.8 7.8 13.7
11 China II 2:57 111.8 37.8 491.1 6.6 13.5
12 China II 3:52 112.0 28.9 505.9 6.4 12.7
13 China II 3:20 85.8 25.7 361.2 4.1 11.5
14 China II 3:8 70.7 22.6 637.6 7.1 11.1
15 China II 3:59 109.1 27.4 363.9 4.0 11.1
16 China II 2:43 37.7 13.8 1163.0 11.6 10.0
17 China II 0:47 28.6 36.8 616.7 5.1 8.3
18 China II 2:47 33.0 11.9 928.7 5.7 6.1
19 China III 0:51 14.4 16.8 569.2 12.9 22.6
20 China III 3:25 71.9 21.0 683.5 15.2 22.2
21 China III 1:15 39.2 31.5 611.1 13.4 22.0
22 China III 2:43 44.6 16.4 594.5 12.8 21.6
23 China III 2:43 44.6 16.4 594.5 12.8 21.6
24 China III 0:37 14.3 23.0 503.2 10.6 21.1
25 China III 2:27 71.3 29.0 625.8 13.1 20.9
26 China III 0:42 14.3 20.4 435.8 8.9 20.4
27 China III 2:41 70.8 26.4 584.7 11.1 19.0
28 China III 2:47 99.1 35.7 614.9 11.3 18.4
29 China III 2:30 67.5 26.9 344.2 5.7 16.7
30 China III 0:43 24.7 34.3 434.5 6.9 15.9
31 China III 3:51 85.5 22.3 381.6 6.0 15.8
32 China III 3:3 66.1 21.7 664.9 10.2 15.3
33 China III 0:48 27.0 33.5 456.1 6.9 15.2
34 China III 0:51 14.2 16.6 626.9 8.9 14.2
35 China III 0:42 14.3 20.5 556.0 7.8 14.1
36 China III 2:21 70.4 29.9 537.3 6.7 12.6
37 China III 2:37 75.3 28.8 528.4 6.3 11.9
38 China III 1:33 51.0 32.7 716.9 8.1 11.3
39 China III 2:30 78.0 31.1 476.1 5.3 11.0
40 China III 2:37 75.9 29.0 559.0 6.1 11.0
41 China III 1:18 52.0 40.0 1038.4 9.0 8.7
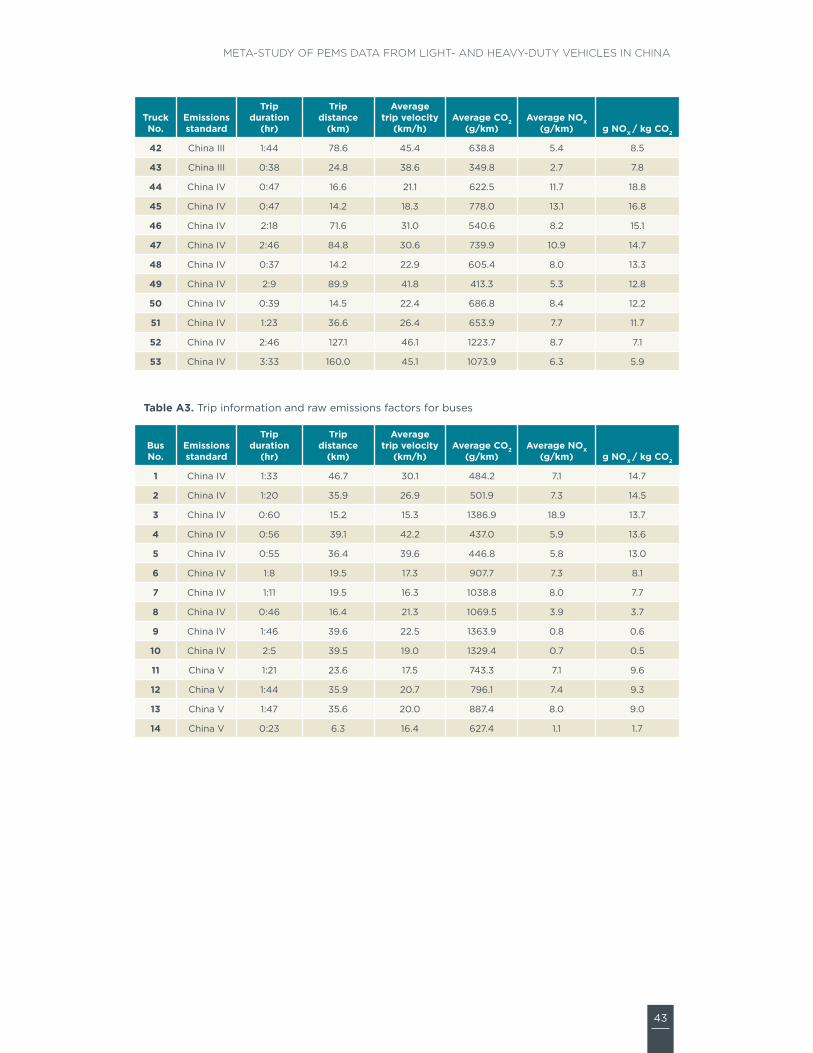
43
META-STUDY OF PEMS DATA FROM LIGHT- AND HEAVY-DUTY VEHICLES IN CHINA
Truck No.
Emissions standard
Trip duration
(hr)
Trip distance
(km)
Average trip velocity
(km/h)Average CO2
(g/km)Average NOX
(g/km) g NOX / kg CO2
42 China III 1:44 78.6 45.4 638.8 5.4 8.5
43 China III 0:38 24.8 38.6 349.8 2.7 7.8
44 China IV 0:47 16.6 21.1 622.5 11.7 18.8
45 China IV 0:47 14.2 18.3 778.0 13.1 16.8
46 China IV 2:18 71.6 31.0 540.6 8.2 15.1
47 China IV 2:46 84.8 30.6 739.9 10.9 14.7
48 China IV 0:37 14.2 22.9 605.4 8.0 13.3
49 China IV 2:9 89.9 41.8 413.3 5.3 12.8
50 China IV 0:39 14.5 22.4 686.8 8.4 12.2
51 China IV 1:23 36.6 26.4 653.9 7.7 11.7
52 China IV 2:46 127.1 46.1 1223.7 8.7 7.1
53 China IV 3:33 160.0 45.1 1073.9 6.3 5.9
Table A3. Trip information and raw emissions factors for buses
Bus No.
Emissions standard
Trip duration
(hr)
Trip distance
(km)
Average trip velocity
(km/h)Average CO2
(g/km)Average NOX
(g/km) g NOX / kg CO2
1 China IV 1:33 46.7 30.1 484.2 7.1 14.7
2 China IV 1:20 35.9 26.9 501.9 7.3 14.5
3 China IV 0:60 15.2 15.3 1386.9 18.9 13.7
4 China IV 0:56 39.1 42.2 437.0 5.9 13.6
5 China IV 0:55 36.4 39.6 446.8 5.8 13.0
6 China IV 1:8 19.5 17.3 907.7 7.3 8.1
7 China IV 1:11 19.5 16.3 1038.8 8.0 7.7
8 China IV 0:46 16.4 21.3 1069.5 3.9 3.7
9 China IV 1:46 39.6 22.5 1363.9 0.8 0.6
10 China IV 2:5 39.5 19.0 1329.4 0.7 0.5
11 China V 1:21 23.6 17.5 743.3 7.1 9.6
12 China V 1:44 35.9 20.7 796.1 7.4 9.3
13 China V 1:47 35.6 20.0 887.4 8.0 9.0
14 China V 0:23 6.3 16.4 627.4 1.1 1.7