recap of fy04 -...
TRANSCRIPT

©2008 ModusLink Global Solutions. All Rights Reserved
Investor Presentation
October, 2008
SEC Safe Harbor Statement
2
This presentation contains forward-looking statements which address a variety of subjects including, for example, the expected growth of markets in which ModusLink Global Solutions and ModusLink operate, expected industry expansion, expected growth in annual revenue, expected reduction in SG&A, expected improvement in gross margins and operating income, the further execution of ModusLink’s strategic business plan, the development and implementation of business strategies in our target markets and through our venture capital business, and the assessment of the companies within the venture capital portfolio. The following important factors and uncertainties, among others, could cause actual results to differ materially from those described in these forward-looking statements: ModusLink Global Solutions' success, including its ability to improve its cash position, expand its operations and revenues, reduce its costs, improve its gross margins and sustain profitability, depends on its ability to execute on its business strategy and the continued and increased demand for and market acceptance of its products and services; ModusLink Global Solutions' management may face strain on managerial and operational resources as they try to oversee the expanded operations; ModusLink Global Solutions may not be able to expand its operations in accordance with its business strategy; ModusLink Global Solutions' cash balances may not be sufficient to allow ModusLink Global Solutions to meet all of its business and investment goals; Potential acquisitions and investments may not be available at all or on favorable terms; ModusLink Global Solutions may experience difficulties integrating technologies, operations and personnel in accordance with its business strategy; ModusLink Global Solutions sells to its clients on a purchase order basis, rather than pursuant to contracts with minimum purchase requirements and therefore revenue and financial results are subject to demand variability; ModusLink Global Solutions derives a significant portion of its revenue from a small number of customers and the loss of any of those customers could significantly damage ModusLink Global Solutions' financial condition and results of operations; risks inherent in conducting international business the mergers and acquisitions and IPO markets are inherently unpredictable and liquidity events for companies in the venture capital portfolio may not occur; and increased competition and technological changes in the markets in which ModusLink Global Solutions competes. This presentation contains certain non-GAAP financial measures. A reconciliation of the non-GAAP financial measures to the most directly comparable GAAP measures is included herein. This presentation includes estimates which may not be indicative of future results. For a detailed discussion of cautionary statements that may affect ModusLink Global Solutions' future results of operations and financial results, please refer to ModusLink Global Solutions' filings with the Securities and Exchange Commission, including ModusLink Global Solutions' most recent Annual Report on Form 10-K and Quarterly Report on Form 10-Q. Forward-looking statements represent management's current expectations and are inherently uncertain. We do not undertake any obligation to update forward-looking statements made by us.

Investor Highlights
$1.1B revenue company moving from a transformational phase to a growth phaseFocusing operations in the high growth Business Process Outsourcing (BPO) market Strong and growing customer base: • More than 70% of revenues from Fortune 500 companies
Strong balance sheet: • No Debt; Cash of $162M; NOL’s of $2.0B
Seasoned management team
3

What is our story?
4
Changed name to ModusLink Global
Solutions, Inc.Network of Companies & Venture Capital
Multiple Operating Businesses
Search Portals Infrastructure
Interactive Mkt. Prof. Services
Venture CapitalSupply Chain
Acquired Open Channel Solutions and PTS
Electronics
Acquired Modus Media
Focused Operating Company
Supply Chain BPO
Venture Capital
1995 2000 2005 20102008

What is Business Process Outsourcing (BPO)?
The outsourcing of non-core business functions:
5
ModusLink Focus
Finance and Accounting
Sales and Marketing
Logistics and
DistributionCustomer Services
Procurement
Training
Human Resources
Core Company

ModusLink Supply Chain BPO Processes
6
Plan Source Make Deliver Return
Supply Chain Optimization Consulting Global Inventory Planning
Supply Base ManagementInbound Logistics
Content/ Materials ManagementOptimized Product Configuration
Outbound LogisticsDirect to Retail/ ConsumereBusinessWireless ActivationEntitlement Management
Returns ManagementAsset Recovery and RepairWarranty and RecallFinancial Management Services

What solutions do we provide?Four examples of our many supply chain solutions are:
Computing Software Communications Storage Consumer Electronics
Factory Feed X X X
After-Market Services X X X X X
Optimized Configuration/ Postponement X X X
E-Business X X X X X
7
Target Markets

How do we compete against the ODM’s and CM’s?
ODMs + CM’s
8
Strengths:
• Long run production
• Low cost manufacturing geographies
• Procurement leverage
• Product design capabilities
ModusLink coordinates multi-vendor requirements across the entire supply chain
Make
Weaknesses:
• Product & package complexity
• Far away from consumer markets
• Changes in demand drive packaging rework
• Clients prefer multiple key suppliers
SourcePlan Deliver Return

Why is BPO Important for the Supply Chain?
Shorter product lifecycles
Higher cost/shrinking margins
Product customization
Longer supply chains
Geographically diverse suppliers
Global inventory pools
9

What is the Size and Growth of the BPO Market?
10
Business Process Outsourcing Spending 2006 – 2011 ($Billions)
Source: IDC – Sept 2007
10% CAGR

0.2%0.4% 0.4%
0.7%0.9%
1.4%1.7%
4.6%
Globalware Shin Shin MentorMedia
ATC Zomax Arvato RRDonnelley
ModusLink
How Big is our Addressable Market?
11
ODM / Contract Manufacturers
10%
Source: Dataquest, Company Estimates
In-House providers &
other 77%
Outsourced Supply Chain
13%
The Supply Chain BPO Market is a $25 Billion and can be broken out into three distinct sectors – the Outsourced Supply Chain sector comprises 13% of the total market:

What value do we provide?
Geographic expertise linked with global executionManage flow of goods across multiple suppliers and manufacturersSupport multiple product configurations with minimum investment in inventoryFlexible operational footprint that can change with market conditionsAn extension of Client OperationsStandard and customized solutions that meet customer needs
12
ModusLink delivers on the key drivers for outsourcing Supply Chain processes, specifically we provide:

ModusLink Supply Chain Footprint
13
Waltham, MA HQRaleigh, NCNashville, TNLindon, UTBloomington, INIndianapolis, INOntario, CAMiami, FLMonterrey, MexicoGuadalajara, Mexico
Apeldoorn, NetherlandsOrléans, FranceAngers, FranceKildare, IrelandBrno, Czech RepublicBudapest, Hungary
Atsugi, JapanShanghai, ChinaPudong, ChinaKunshan, ChinaSongjiang, China Taipei, TaiwanShenzhen, ChinaFutian, ChinaPenang, MalaysiaSingapore
Footprint Focus: Low Cost Supply and Major Markets for Consumption

Computing
Software
Storage
16 Core Solutionssuch as:
Factory Feed
After‐Market Services
OPC/Postponement
E‐Business
Global Standardization
Continuous Improvement
Facility Optimization
What is our Strategy?
14
Focus on Target Markets
Expand Client Relationships
through Innovative Solutions
Invest to Drive Operational Efficiencies
Focus on Target
Markets
Expand Client
Relationships through
Innovative Solutions
Invest to Drive
Operational Efficiencies
Communications
Consumer Electronics

Financial Review
15
Financial Highlights
Positioned for revenue growth in fiscal 2009 and beyond
Steadily improving gross margin
Investing to support future profitability
Maintaining a strong balance sheet providing foundation for growth strategy
16

Transitioning to a Growth Phase
$600
$700
$800
$900
$1,000
$1,100
$1,200
$1,300
FY06 FY07 FY08 FY09 Guidance**
Rev
enue
(in
$M)
GAAP Rev. Adj. Rev.*
17
Revenue Trend
* Adjusted for two previously announced discontinued programs.See appendix for reconciliation to closest GAAP measure.
** Midpoint of latest (9/29/2008) guidance revenue range.
Revenue Growth Drivers:
1) Increased Penetration of Existing Customers
2) New customers
3) New Solutions
4) Acquisitions

Improving Gross Margins
6%
8%
10%
12%
14%
16%
FY06 FY07 FY08
Full Year
18
Gross Margin as a % of Revenue Trend
Gross Profit Drivers:
1) Reduce Low Margin Programs
2) Improve mix to higher profit solutions
3) Increase sales to new verticals
4) Lean Sigma Focus
5) ERPTarget Operating Model

Making investments to drive future cost savings
0%
2%
4%
6%
8%
10%
12%
FY06 FY07 FY08
Full Year
19
SG&A as a % of Revenue
SG&A Investments:
1) Sales & Marketing
2) Global Footprint Restructuring
3) ERP/IT
4) Shared Services Consolidation
* SG&A excludes non-cash goodwill impairment charge of $14M in FY08.
Target Operating Model

Balance Sheet and Other Highlights
($ in millions) FY06 FY07 FY08
Cash Balance 228.8$ 282.4$ 162.1$ Outstanding Debt (24.8) (24.8) -
Net Cash Position 204.0 257.6 162.1
@Ventures Investment (6.8) (11.2) (4.6) @Ventures Proceeds 36.5 35.0 19.1
Net Cash from @Ventures 29.7 23.8 14.5
Net Operating Loss Carryforwards 2,000.0 2,000.0 2,000.0
20
In 2008 we strengthened our Balance Sheet:
•$53M for Acquisitions•$35M Stock Repurchase•$25M Debt Repayment
Venture capital investments have returned net cash of $68M over
past three years
US‐generated income can be offset for a long period
Year-End

@Ventures V
Established in 199570 internet, software and IT company investmentsMost recent fund formed in 2004Up to $50 million capital• Approximately $30 million
invested to dateClean technology focus: • Alternative energy• Energy efficiency• Water purification & management
21
Leverage deep experiencewith emerging technology
companies to foster development and
encourage liquidity events

Profile of Management TeamExecutive Title Yrs. Exp. Experience
Joe Lawler Chairman, President and CEO 30 RR Donnelley, Gander Mountain, Fingerhut
Companies, CML Group, Gillette
Steve Crane Chief Financial Officer 28 Interactive Data Corp.,Pepsi Cola Int’l, Chase Manhattan Bank
Matt Dattilo Chief Information Officer 23 PerkinElmer, General ElectricPeter Gray General Counsel 15 Hale and DorrJim Herb SVP, Human Resources 36 RR Donnelley
Mark Kelly President, Aftermarket Services 21 Modus Media, RR Donnelley
Bill McLennan President, Global Operations 26 Onyx Capital Ventures, RR Donnelley, FMC
Corporation, Paction Corporation
David Riley EVP, Corporate Development 14 Towermarc Corporation, Ernst & Young
Scott Smith President, Sales and Marketing, ModusLink
25IBM, Lenovo Group
Peter Mills Managing Director 31@ Ventures, US Display Consortium, Sematech, Softrend, BPI, Digital Equipment, Ford
22

Investor Highlights
$1.1B revenue company moving from a transformational phase to a growth phaseFocusing operations in the high growth Business Process Outsourcing (BPO) market Strong and growing customer base: • More than 70% of revenues from Fortune 500 companies
Strong balance sheet: • No Debt; Cash of $162M; NOL’s of $2.0B
Seasoned management team
23

24
Thank You

25
Appendix
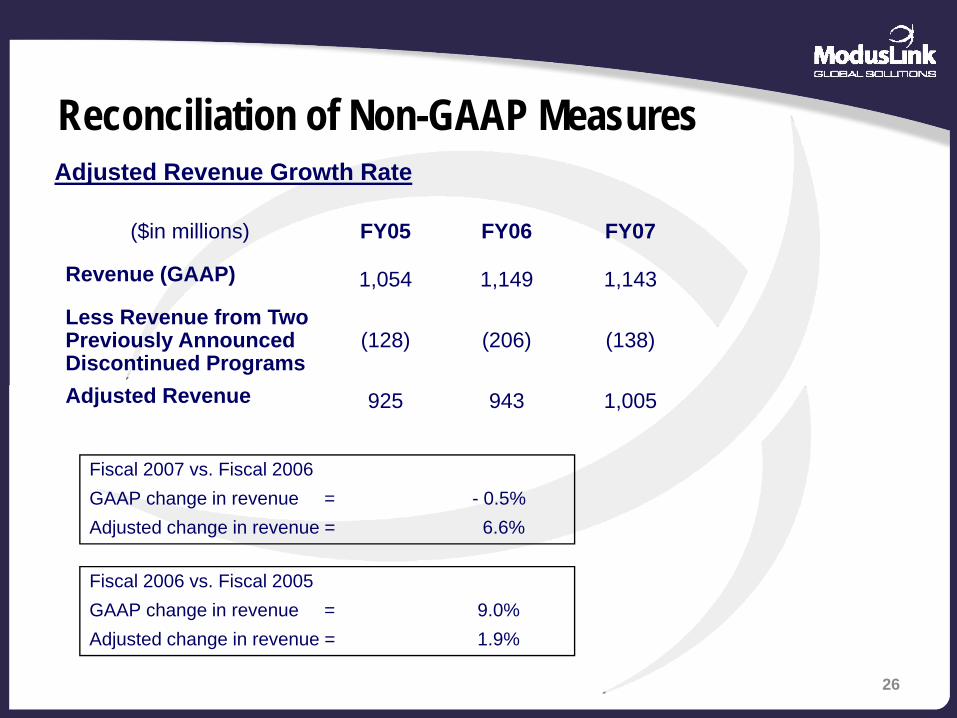
Reconciliation of Non-GAAP Measures
($in millions) FY05 FY06 FY07
Revenue (GAAP) 1,054 1,149 1,143
Less Revenue from Two Previously Announced Discontinued Programs
(128) (206) (138)
Adjusted Revenue 925 943 1,005
26
Adjusted Revenue Growth Rate
Fiscal 2007 vs. Fiscal 2006GAAP change in revenue = - 0.5%Adjusted change in revenue = 6.6%
Fiscal 2006 vs. Fiscal 2005GAAP change in revenue = 9.0%Adjusted change in revenue = 1.9%