recidivism reduction - arizona management systemproblem statement and scope problem statement:...
TRANSCRIPT

Recidivism ReductionGOAL COUNCIL 4:
SAFE COMMUNITIES
ARIZONA MANAGEMENT SYSTEM28

Actions Taken to Date
• Historical data regarding releases and returns has been gathered
• Causations have been explored• Programs have been implemented to focus efforts on those inmates at risk of recidivating– Reentry Centers
ARIZONA MANAGEMENT SYSTEM29

AZ Recidivism2005 – 2013
Source: Department of Corrections
12,828 13,781
14,669 15,307
16,115 15,526
14,441 14,237 13,941
5,546 6,016 6,299 6,013 6,294 5,987 5,605 5,649 5,496
43% 44%43%
39%39% 39% 39%
40% 39%
20%
25%
30%
35%
40%
45%
‐
5,000
10,000
15,000
20,000
2005 2006 2007 2008 2009 2010 2011 2012 2013
Total Releases Releases that Recidivate Recidivism %
ARIZONA MANAGEMENT SYSTEM30

DefineProblem Statement
◦ Since 2011, about 5,500 Arizonans have returned to the adult corrections system annually (about 39%) within three years of their prior release. These recidivists take up bed space, require the continued expansion of the system, result in additional public spending, and fail to return to society as a productive citizen. The system cannot continue to grow sustainably and is already stretched to maximum capacity.
Scope◦ Primary scope and direct influence on technical violators who recidivate their term of Community Supervision.
◦ Secondary scope and indirect influence on all members of the adult corrections system, based in 3‐year cohorts, who may recidivate within AZ.
ARIZONA MANAGEMENT SYSTEM31

DefineGoal Statement
◦ In FY2015 3,318 individuals recidivated as a result of a technical violation within one year from their prior release. Two thirds of these are from Maricopa County alone.
2‐year (12/31/2018)
2‐year stretch (12/31/2018)
5‐year (12/31/2021)
5‐year stretch (12/31/2021)
15% (3,318 to 2,820)
20% (3,318 to 2,655)
20% (3,318 to 2,655)
25% (3,318 to 2,489)
ARIZONA MANAGEMENT SYSTEM32

Next Steps
• Near‐Term (30 Days)– Collect additional data– Assemble cross‐functional project team– Identify projects that may already be underway
• Near‐Term (60 Days)– Analyze data– Focus efforts to align with goal– Develop list of action items and subprojects across multiple agencies
ARIZONA MANAGEMENT SYSTEM33

Foster Care Safe ReductionGOAL COUNCIL 4:
SAFE COMMUNITIES
ARIZONA MANAGEMENT SYSTEM34

Why is Foster Care Reduction a Safety Initiative?
When volume exceeds capacity, safety is compromised and poor outcomes prevail(Time, Quality, Cost translates to Faster, Better, Cheaper)
Funding and resources move to the foster care crisis; creating vulnerabilities system wide.
Children and families suffer trauma when government forces separation. Citizens’ 4th Amendment rights can be violated by knee jerk, imprudent decision
making.(“Would you feel your child, or grandchild was safe if unjustifiably taken into the state’s foster care system?”)
Children spending extended periods of time in foster care have poorer outcomes. Children who age out of foster care have higher prevalence of: Homelessness, Joblessness, Victimization, Incarceration, Addiction, Etc.
Therefore, having the correct amount of children in the foster care system is imperative and makes Arizona communities safer.
ARIZONA MANAGEMENT SYSTEM35

(History) Increased Demands on System
Reports of child abuse/neglect increased over 60% since 2009; >52000 investigations in 2015.
The Perfect Storm hit in 2009:
Increased volume
Legislative changes
Tool changes
Absence of management system
Decreased resources (recession)
System wide impacts (courts, providers, attorneys, etc.)
ARIZONA MANAGEMENT SYSTEM36
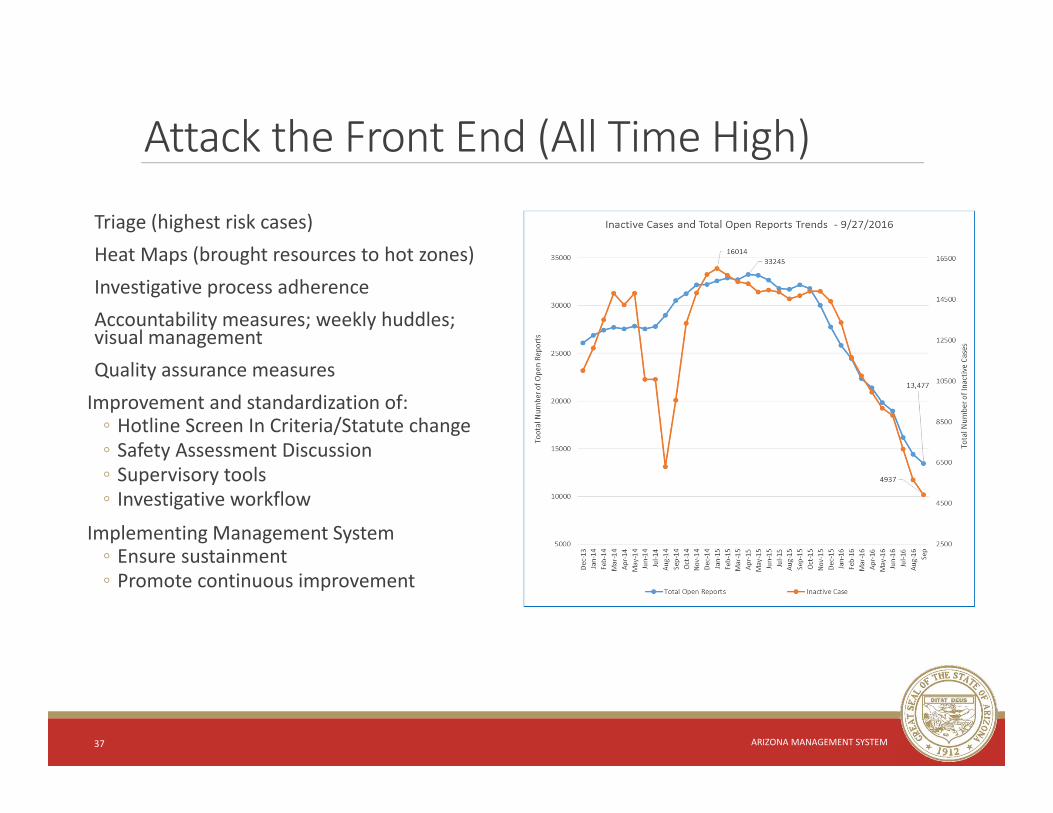
Attack the Front End (All Time High)
Triage (highest risk cases)Heat Maps (brought resources to hot zones)Investigative process adherenceAccountability measures; weekly huddles; visual managementQuality assurance measuresImprovement and standardization of:◦ Hotline Screen In Criteria/Statute change◦ Safety Assessment Discussion◦ Supervisory tools ◦ Investigative workflow
Implementing Management System◦ Ensure sustainment ◦ Promote continuous improvement
ARIZONA MANAGEMENT SYSTEM37

Growth in Foster Care
85% Increase in Foster Care (2009 to 2015)
Last in nation (2005‐2015)
ARIZONA MANAGEMENT SYSTEM38

Removals per 1000 Arizona Children
Arizona’s Entry Rate has been double the national average
ARIZONA MANAGEMENT SYSTEM39

Foster Care per 1,000 Arizona Children
(Children under 18)
National Average 3.6
Arizona 8.7 2013
Arizona is double the national average
Mar 2016
ARIZONA MANAGEMENT SYSTEM40

Problem Statement and Scope Problem Statement:
◦ Arizona’s foster care population has grown 92% in the 10.5 year period ranging from 9/30/2005 through 3/31/2016, which is the largest growth nationally. Recent improvements (Feb 2016 ‐current) has demonstrated a reduction of 4% of total population.
◦ Overburdened workers are limited in their time to engage with families and have defaulted to removals out of fear and lack of real time mitigating factors.
◦ All systems are overloaded (Courts, attorneys, providers, DCS, Behavioral Health) ◦ Fiscal burdens continue rising: Placement $164M ($71M GF); OOH Service $175M ($50M GF)
◦ Children who grow up in and/or age out of the foster care have statistically shown poorer outcomes.
Scope◦ All processes supported by all state agencies and/or policy affecting the foster care population are within the scope of the project.
ARIZONA MANAGEMENT SYSTEM41

Recent Progress
Arizona 3%National Average 4%
Based on 7 yr trend –Population would have been 20,100
ARIZONA MANAGEMENT SYSTEM42

Safe Interventions
# of Children being served has remained the same for last 12 months
# of children in OOH Population has decreased 4% over this time
Same demands; different approach. Fiscal game changer
ARIZONA MANAGEMENT SYSTEM43

Goal – Out of Home Population Projection
2yr Conservative – 16,200
2yr Stretch – 15,200
Assumptions:
# of reports received remain constant at ~50K◦ Assumes that increased call volume will be offset by improvements in the screen in %
Resource provisions remain constant
Existing Constraints remain constant and/or improve
5yr Conservative – 13,200
5yr Stretch – 10,500
ARIZONA MANAGEMENT SYSTEM44

Progress through PartnershipsPartnering with Prevention Service (Fast Pass Initiative)◦ Child Care – Active◦ AHCCCS Data Sharing ‐ Active◦ SNAP, TANF and Medicaid enrollment (DES) – Oct 2016◦ Home Visits and WIC – Jan 2017
Private Contractor Partnerships – Jan 2017◦ Staff Augmentation supporting Ongoing Case reviews and Family Finding Process
Increase Engagement with Community and Faith‐based Partners◦ CARE Portal ‐ Active
Young Adult Program (YAP) Initiative – Nov 2016◦ Securing subsidized housing◦ Mentorship Program
Juvenile Court Collaboration ‐ Active◦ Safe Reduction work group (5 sub groups)◦ Court Improvement Project addressing training and coaching for court staff around judicial review of child welfare cases.
ARIZONA MANAGEMENT SYSTEM45

Continuing Progress/Ensuring Fidelity
Closely monitoring two areas for unwanted outcomes:1. Re‐reports of abuse/neglect involving
the same child(ren)2. Re‐entry into foster care post
reunification or adoption
• Continue with technical assistance to improve the safety model, improve decision making ‐ Active
• Statewide review of all cases to identify recurring barriers requiring resolution ‐ Active
• Family Finding to Reduce Congregate Care‐ Active• Increased use of In‐Home Services• Launch of multiple prevention initiatives
ARIZONA MANAGEMENT SYSTEM46