recognition of posture and gait disturbances in patients
TRANSCRIPT

12
Recognition of Posture and Gait Disturbances in Patients with Normal Pressure
Hydrocephalus Using a Posturography and Computer Dynography Systems
L. Czerwosz1, E. Szczepek1,2, B. Sokołowska1, J. Jurkiewicz1,2 and Z. Czernicki1,2
1Mossakowski Medical Research Centre, Polish Academy of Sciences, Warsaw, 2Warsaw Medical University, Warsaw,
Poland
1. Introduction
There are great difficulties in clinical practice to differentiate between normal pressure
hydrocephalus (NPH) and brain atrophy (Tans 1979, Galia at al. 2005). The consequences of
inaccurate diagnosis are serious therefore we observe steady searching of new non-invasive
or minimal-invasive diagnostic methods.
The purpose of this study is to quantify the characteristics of the postural sway and locomotion in NPH patients in two states: before and after shunt implantation and to compare posture and gait features among: NPH, brain atrophy patients and healthy persons.
Assessment of stability and balance system consist in quantitatively measuring and
analysing movements of the centre of foot pressure (COP). Position of COP steadily changes
due to the so called postural sways, and of course due to voluntary moves. Enlarged sways,
observed in normal pressure hydrocephalus, are not however specific and cannot give
simple diagnosis. Postural balance can be impaired due to pathology in various organs
including vestibular and cerebellar disorders and various forms of ataxia (Mohan at al.
2009), Parkinsonism (Bloem at al. 1995, Stolze at al. 2001, Jagielski at al. 2006), multiple
sclerosis (Kessler at al. 2011) and even alcohol dependence (Wöber at al. 1998) and muscle
fatigue or aging (Błaszczyk and Michalski 2006).
Evaluation of gait relates to postural stability in standing upright position. The gait
disturbance is probably the most prominent clinical feature of NPH and it is often the first
NPH symptom to develop (Radvin 2008). Gait disturbances are part of so called Hakim triad
(Hakim & Adams 1965). NPH gait disturbances are very characteristic and rely on shuffling
manner of walking, without raising the feet as if they were glued to the floor. This kind of
gait is called also magnetic. Gait disturbances are still not fully described quantitatively due
to lack of reliable, specific parameters measuring most typical features of gait in NPH.
www.intechopen.com

Hydrocephalus
190
Some papers related to postural stability and gait evaluation in NPH have already been
published by Szczepek and Czerwosz (Szczepek at al. 2008, Czerwosz at al. 2008, 2009). The
current study is trying to summarize some of our results.
2. Methods
Recently rapid development of precise methods of quantitative measurements of body
position while standing or walking has been observed. Two techniques used by us in our
investigations should be discussed here:
1. static posturography – measurement of body sways while standing on a force plate, 2. dynography – measurement of gait.
In both systems the resultant force – feet pressure acting on the horizontal surface (XY) is
calculated on the basis of some number of pressure sensors. The most important is the point
of application of this force. This point is called Centre of foot/feet Pressure (COP). In static
conditions the COP point is a projection of the Centre of Gravity (COG) position – on the XY
horizontal plane. COM and COG signals are highly correlated (Błaszczyk 2008). It has been
documented that COG signal can be extracted from COP by low-pass filtering (Benda et al.
1994). The high frequency component comes in dynamic and realistic conditions from
inertia forces that influence COP instantaneous location. Inertia forces arise from
accelerations of the body while it is swaying or moving – losing and recovering balance
(Newton’s second law of motion).
2.1 Posturography
The instantaneous COP xy position can be calculated on the basis of instantaneous values of
p1(t), p2(t), p3(t), p4(t) forces measured on four corners of the square plate; d is a length of it’s
side. In case of our device: d= 40 cm.
1 2 3 4 1 2 3 4
1 2 3 4 1 2 3 4
dx(t) ( p (t) p (t) p (t) p (t)) /(p (t) p (t) p (t) p (t))
2d
y(t) ( p (t) p (t) p (t) p (t)) /(p (t) p (t) p (t) p (t))2
(1)
To obtain the exact position of COP, the pn forces must be reduced by tare weights
measured independently on each corner. The real force plate is shown on Figure 1; pn forces
are pointed and orientation of xy plane is given by X and Y axes. All pn(t) values, and
therefore x(t) and y(t) change in time. In practice we collect them in 0.01 seconds intervals
(sampling frequency 100 Hz) in digital form with 12 bit accuracy. Data were low-pass
filtered (15 Hz cut-off frequency). Trajectory can be observed on-line and off-line in an
analogue way on a chart called posturogram or stabilogram.
A single measurement on a force plate takes usually 30-60 seconds. The resultant time had
to be reduced due to some artefacts related to unsolicited activity of the patient such as his
movement or speaking influencing the outcomes. Removing artefacts is still an unresolved
problem in posturography due to questionable difference between unsolicited movement
and essential balance restoration, especially in case of large sways.
www.intechopen.com

Recognition of Posture and Gait Disturbances in Patients with Normal Pressure Hydrocephalus Using a Posturography and Computer Dynography Systems
191
Fig. 1. Force plate. There are four sensors measuring forces on each corner: p1, p2, p3, p4. Y represents forward-backward, anterior-posterior sways, in sagittal plane, X represents left-right, mediolateral sways, in frontal plane.
2.2 Examples of posturographic measurements
Figure 2 shows six examples of posturographic measurements with eyes open (EO) or closed (EC). The two first trajectories belong to NPH patient in acute state, before shunt
Fig. 2. Examples of measurements – from top: NPH BEFORE – NPH patient before shunt implantation measured with eyes open (EO – left) and closed (EC- right), NPH AFTER – NPH patient after surgery. CONTROL – healthy person.
www.intechopen.com
Hydrocephalus
192
implantation. The next two were measured after surgery; the last two belong to a healthy person. As one can see, there are big differences in the shapes of the trajectories, especially NPH patient before surgery demonstrates very large sways – both, with eyes open and closed. Sways of the NPH patient are very large both for EO and EC. After surgery sways are reduced but they are still larger than in a healthy person.
2.3 Posturography parameters
COP trajectory represents sways of an object standing in upright position for some time. There is some number of various metrics developed that evaluate average or typical “behaviour” of the curve in many aspects (Baratto at al. 2002, Raymakers at al. 2005).
The starting point of our analysis was to define the global parameters expressing the “size” of sways. We have taken into consideration:
- R – average COP sway Radius, - A – Area of developed surface of COP trajectory, AS – Area Speed - L – Length of COP trajectory, V – Velocity.
An average Radius of sway is a simple average of distances between curve samples and (0,0) point on XY plane – coordinate origin. Actually all points of the curve have been shifted by ( , )x y vector beforehand and thus (0,0) turns into the “centre of gravity” of all samples ( x denotes average value of all xi). This simple way of calculating R has been applied by Czerwosz and Szczepek in their papers (Czerwosz at al. 2008, 2009, Szczepek at al. 2008) and also Mraz at al. 2007, Bosek at al. 2005, Kubisz at al. 2011.
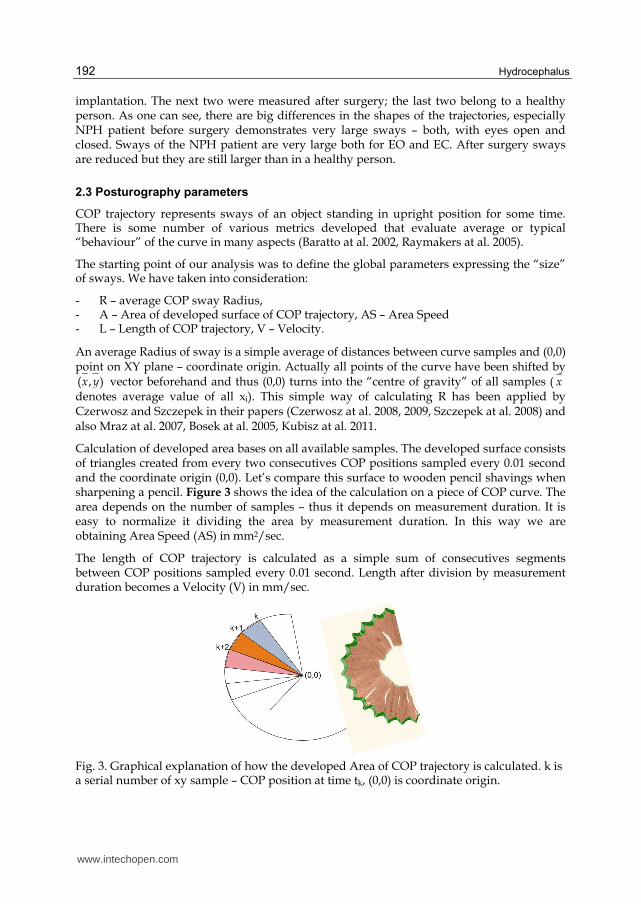
Calculation of developed area bases on all available samples. The developed surface consists of triangles created from every two consecutives COP positions sampled every 0.01 second and the coordinate origin (0,0). Let’s compare this surface to wooden pencil shavings when sharpening a pencil. Figure 3 shows the idea of the calculation on a piece of COP curve. The area depends on the number of samples – thus it depends on measurement duration. It is easy to normalize it dividing the area by measurement duration. In this way we are obtaining Area Speed (AS) in mm2/sec.
The length of COP trajectory is calculated as a simple sum of consecutives segments between COP positions sampled every 0.01 second. Length after division by measurement duration becomes a Velocity (V) in mm/sec.
Fig. 3. Graphical explanation of how the developed Area of COP trajectory is calculated. k is a serial number of xy sample – COP position at time tk, (0,0) is coordinate origin.
www.intechopen.com

Recognition of Posture and Gait Disturbances in Patients with Normal Pressure Hydrocephalus Using a Posturography and Computer Dynography Systems
193
Each parameter can relate to two measurement conditions: eyes either open (EO) or closed (EC). In order to express change in value of some parameters due to different conditions one can use simple difference (2). For computational reasons in advanced statistical analysis sum of the same parameters (3) has been introduced.
EOECx XXD (2)
EOECx XXS (3)
where X can be R, A, AS, L, or V.
A derived parameter – the vision index (4) has been developed on the basis of Radius, Area, Area speed, Length or Speed to express difference of chosen parameter in relation to its mean value. Index is an absolute, dimensionless number with theoretical range [-100%, 100%]. Zero means no difference. One should notice that Ix is bigger for bigger Dx and smaller Sx and vice versa: Ix gets smaller for smaller Dx and bigger Sx. A similar index related to the parameters measured in two different conditions have been introduced by Mraz as ICOP (Mraz at al. 2007).
100%*)X)/(XX(XI EOECEOECx (4)
where X can be R, A, AS, L, or V. EC means „eyes closed“, EO – „eyes open “, while measurement has been performed. We have made use of vision indices related to radius, area and length. Notice that the index related to area is equal to the index related to area speed (IAS = IA) and the index related to length is equal to the index related to velocity (IV = IL).
Let’s take sight index of radius as an example. Exact way of calculation IR is given below:
100%*)R)/(RR(RI EOECEOECR (5)
2.4 Dynography
Computerized dynography (Infotronic 2007) is a gait analysis system which consists of two soles containing sensors sensible to a foot pressure acting on the ground. These sensors measure the vertical ground reaction forces and their distribution during walking. It’s a good alternative to much less quantitative gait scale – for measuring gait impairment of NPH patients (Boon at al. 2007). Another alternative is camera based system but then the only information that is provided are body parts positions and angles without any data related to forces. Walking on a treadmill gives just the speed of gait; to measure more gait features some extra instrumentation should be added. In this study we don’t take advantage of forces explicitly, but our system (see below) uses them internally to determine gait phases. Other alternative method of gait evaluation can be performed on two or more joined force plates. This method limits gait to only few steps because of size. It can easily be used for gait analysis in small animals (Voss at al. 2007).
Special boot for dynography is presented in Figure 4 (on the left side). There are eight sensors inside each sole located as shown in the middle picture. Actually eight histograms are shown here on the sole, not sensors, but they are distributed just as sensors. Histogram height expresses instantaneous or average force acting on a sensor. The picture on the right
www.intechopen.com

Hydrocephalus
194
shows how the point of application of the resultant ground reaction force is being displaced while stance phase of gait cycle. This point is the Centre of foot/feet Pressure (COP) and its position changes during each step. The overall load, the value of resultant ground reaction changes due to inertia forces as well.
Fig. 4. Left: A boot for dynography with eight sensors inside its sole. Middle: Histograms express instantaneous or average force acting on each sensor. Right: displacement of resultant ground reaction force along a foot. (Pictures from Ultraflex system – Infotronic Company 2007).
The displacement of COP presented in Figure 4 relates to single foot only. In this case COP position is calculated on the basis of eight sensors. Figure 5 presents so called gait-lines where successive COP positions of each step are drawn overlapped. Gait-lines of each foot are calculated independently. Pictures on the right side are averaged over all gait cycles of 20 seconds walking. Gait-line represents stance phase of gait from initial contact, while a heel touches the ground till toe off moment (Perry & Burnfield 2010). COP can also be calculated on the basis of 16 sensors enclosed in two soles – from both feet. Cyclogram arises if connecting successive COP positions of each step and drawing the lines overlapped. They are presented in Figure 6. Pictures on the right side are averaged over all gait cycles. During double support the COP position lies somewhere between the feet depending on the load ratio and its position changes from one side to another. During single support COP is located within single foot boundary.
Let there be N sensors. N = 8 or N = 16. Let i be the number of a sensor: 1 ≤ i ≤ N. Let the position of sensor i be (xi, yi). Let Fi(t) be the force at moment t acting on sensor i.
Coordinates of the COP at moment t can be calculated from equations (6) – see Jeleń at al. 2008.
N N
i i i
i i
N N
i i i
i i
x(t) F (t) * x / F (t)
y(t) F (t) * y / F (t)
(6)
Equations (6) are very similar to (1) related to force plate, only the number of sensors (N = 4) and its positions are different. The gait-lines and cyclograms are normalised and related to dimensionless foot length, therefore all distances and speed can be calculated only if the
www.intechopen.com

Recognition of Posture and Gait Disturbances in Patients with Normal Pressure Hydrocephalus Using a Posturography and Computer Dynography Systems
195
total distance that the person has walked has been entered. Data is sampled with the frequency equal to 100 Hz.
2.5 Examples of dynography measurements
Pictures in Figure 5 show examples of gait-lines; pictures in Figure 6 – cyclograms obtained for NPH patient before and after shunt implantation and for healthy person. Gait-lines and cyclograms show gait in compact way. The symmetry of gait and regularity of cycles can
Fig. 5. Examples of gait-lines. The left pictures show overlapping gait cycles measured by 8 sensors in each foot. Pictures on the right side are averaged. The upper gait-lines represent NPH patient before shunt implantation (NPH BEFORE). Gait-lines in the middle belong to NPH patient after surgery (NPH AFTER). Lower gait-lines have been measured in healthy person (CONTROL). Lines representing the Stance gait phase are annotated in the bottom picture.
Fig. 6. Examples of cyclograms. The left pictures show overlapping gait cycles measured by 16 sensors in both feet. Pictures on the right side are averaged. Successive panels are: NPH patient before shunt implantation (NPH BEFORE), NPH patient after surgery (NPH AFTER), healthy person (CONTROL). Lines representing the Single and Double Support gait phases are annotated in the bottom picture.
www.intechopen.com

Hydrocephalus
196
easily be observed. One can notice shuffling gait of NPH patient (before surgery) – there is almost no single support phase – the patient only slightly rises his feet. The whole stance phase is consisting of double support.
2.6 Dynography parameters
After data collection CDG software recognizes gait phases and calculates gait parameters. Gait was described in our research as a duration of a single (SSUP) and double support (DSUP) and duration of a stance phase (STANCE). These measures relate to the left and right leg independently. The phases are shown in Figure 7.
Fig. 7. Phases of gait cycle.
2.7 Hardware and software usage
For posturographic measurements Pro-Med (Poland) force plate (Olton & Czerwosz 2006) was used by us. The software for data collection and analysis has been written by the author (Leszek Czerwosz).
For measurement of ground reaction forces in walking we used the Ultraflex Computer
DynoGraphy system from Infotronic Company (Netherlands). Applications of CDG system
in NPH are not aware. Explanations of usefulness of this system are provided by Bhargava
at al. 2007, Majumdar at al. 2008, Jeleń at al. 2008.
2.8 Statistical methods
Wilcoxon matched pairs test for intragroup and Mann-Whitney U test for between-group
comparisons were performed in our studies (Czerwosz at al. 2008, 2009, Szczepek at al.
2008). Non-parametric ANOVA Kruskal-Wallis test (Kruskal & Wallis 1952) was used while
comparing more cohorts and then Bonferroni correction (Dunn 1961) for post-hoc comparisons.
There is much confusion related to the application of corrections if performing post-hoc
comparisons, especially if testing schema is a priori established. It is hard to accept the fact
that the result of one statistical test, i.e. while comparing statistically the NPH and
CONTROL groups, can be influenced by other tests, while collecting some extra data, for
example ataxia group and by performing other comparisons. We will of course change the
level of significance required for rejection the null hypothesis to p<0.016 in case of three
group analysis that we perform in this study. And we are introducing pattern recognition
methods for differentiation of groups to avoid purely academic arguments.
www.intechopen.com

Recognition of Posture and Gait Disturbances in Patients with Normal Pressure Hydrocephalus Using a Posturography and Computer Dynography Systems
197
All the nonparametric analyses were conducted using Origin software (OriginLab Corporation) and PASW Statistics (IBM-SPSS Statistics).
We applied pattern recognition algorithms – two advanced statistical methods: Dicriminant Analysis (DA) and k-Nearest Neighbour method (K-NN) (Devijver and Kittler 1982, Duda at al. 2001). DA calculations were performed by means of PASW Statistics. For K-NN calculations (Jóźwik at al. 2011, Sokołowska at al. 2009) a computer programme developed by Adam Jóźwik was used.
The K-NN classifier is a pattern recognition algorithm for recognizing classes of objects. Objects are just vectors of features which values can be measured in patients. Thus an object represent a patient in n-dimensional space, where n is a number of features – measured parameters for each patient. The k-NN algorithm requires a reference set of objects with known class membership. Class means the same as patient group. Any new object, from outside the reference set, is assigned to the class most frequently represented among its k nearest neighbours, searched in the reference set. The leave-one-out method is used to experimentally establish the best value of k giving minimal misclassification rate.
The DA and K-NN methods differ absolutely because DA is a strictly parametric method related closely to the analysis of variance (ANOVA) and produces, among other, linear combination of features (parameters or variables). There is a fundamental assumption that all independent variables have to be normally distributed. In our case – there is no proof for normal distributions, therefore DA outcomes may not be reliable. For the K-NN method it is not important whether distributions are normal.
Pattern recognition methods have already been used in relation to some gait parameters (Bertrani at al. 1999). They should not be mixed with the pattern recognition of gait (Maduko). Discriminant analysis and neural networks were used for gait classification (Kaczmarczyk at al. 2009).
3. Material
After ethical approval by a local Ethics Committee, posturographic and dynographic recordings were taken from NPH patients and from healthy volunteers. Patients with brain atrophy were also recorded to obtain a comparison group to test the power of calculated parameters and statistical methods in differentiation NPG and atrophy (Tans 1979, Galia at al. 2005).
NPH diagnosis was based on the following criteria
1. Enlargement of brain ventricles seen on CT or MR – Evans’ ratio above 0.3 (Evans 1942), 2. Neurological symptoms (Hakim triad – minimum two of three symptoms), 3. Mean intracranial pressure ≥ 10 cmH2O, 4. Resorption resistance R ≥ 11mmHg/ml/min.
Infusion test (Śliwka at al. 1984, Czernicki at al. 1984, Czosnyka at al. 1988) is performed on the basis of cerebrospinal intracranial fluid pressure measurement with simultaneous infusion of physiological saline in L4, L5, and S1 regions. Infusion test seems to be the most important and limitative qualification for shunt implantation.
In all cases balance disturbances and impairment of gait was observed.
www.intechopen.com

Hydrocephalus
198
The ATROPHY group has been formed according to the following inclusion criteria:
1. Enlargement of brain ventricles seen on CT or MR (Evans’ ratio above 0.3), 2. Both subcortical and cortical atrophy, 3. No characteristic neurological symptoms, 4. Mean intracranial pressure < 10 cmH2O, 5. Resorption resistance R < 11 mmHg/ml/min.
Balance disturbances and some impairment of gait were observed in atrophy patients.
Posturography and dynography evaluations were performed in NPH cases before shunt implantation and shortly after the surgery (within seven days).
3.1 Subjects for posturography study
There were 18 NPH diagnosed patients with spontaneous postural sways measured (9 males and 9 females, range: 32-82 y. o., mean: 64.1 ± 13.2 y. o.). The same group was evaluated twice: before and after shunt implantation forming two cohorts: NPH BEFORE and NPH AFTER.
CONTROL group consisted of 47 healthy subjects, aged 60-69, mean: 59.9 ± 7.0 y. o. The data have been collected by Katarzyna Dmitruk (doctor thesis 2005, partially published in Czerwosz at al. 2009).
ATROPHY group was composed from 36 patients (32-75 y. o., mean: 57.0 ± 14.1 y. o.)
3.2 Subjects for dynography study
CDG measurement was performed in 15 patients with the NPH (8 males and 7 females, age range: 32-82 y. o., mean: 63.1 ± 14.3 y. o.) The same group was evaluated twice: before and after shunt implantation forming two cohorts: NPH BEFORE and NPH AFTER but they are not identical with posturography groups, only 11 patients were examined by two methods.
CONTROL group consisted of 24 healthy subjects (5 males, 19 females).
ATROPHY group was composed from 35 patients (21 males, 14 females, range: 32-79 y. o., mean: 64.1 ± 12.3 y. o.).
4. Results
A number of results have been obtained in the posture and gait study. Posturography and dynography results will be reported separately because so far no joined analysis has been made.
4.1 Simultaneous comparison of three groups – posturography
To compare three groups: NPH BEFORE, ATROPHY, and CONTROL non-parametric ANOVA Kruskal-Wallis test was used. The results are in Table 1. The groups differ significantly for all parameters. This allows post-hoc comparisons in pairs of groups, applying Bonferroni correction.
www.intechopen.com

Recognition of Posture and Gait Disturbances in Patients with Normal Pressure Hydrocephalus Using a Posturography and Computer Dynography Systems
199
NPH AFTER group was not taken into account in above comparison because it is the same group as NPH BEFERE but evaluated in different condition and it should be compared to NPH BEFERE group by means of paired test.
Parameter 2 K-W p
Radius
Radius – eyes open REO 55.9 < 0.001
Radius – eyes closed REC 45.2 < 0.001
Sum of radiuses SR 55.0 < 0.001
Difference of radiuses DR 9.8 < 0.007
Vision index related to radius IR 10.5 < 0.005
Area speed
Area speed – eyes open ASEO 59.9 < 0.001
Area speed – eyes closed ASEC 48.0 < 0.001
Sum of area speeds SAS 56.8 < 0.001
Difference of area speeds DAS 7.7 < 0.021
Vision index related to area IA 10.2 < 0.006
Velocity
Velocity – eyes open VEO 57.5 < 0.001
Velocity – eyes closed VEC 41.3 < 0.001
Sum of velocities VL 50.6 < 0.001
Difference of velocities DV 8.6 < 0.014
Vision index related to velocity IV 11.6 < 0.003
Table 1. Results of non-parametric ANOVA Kruskal-Wallis test for three groups: NPH BEFORE, ATROPHY, and CONTROL. The significance p was reported as <0.000 in the original SPSS results meaning that only subsequent, not displayed decimal digits can differ from zero; to avoid confusion the true outcome has been approximated to 0.001.
Similar three-group analysis was done for NPH AFTER, ATROPHY, and CONTROL. These
groups differ significantly for parameters provided in Table 2. There are no significant
differences for DR, DA, and DL differences as well as for the vision indices: IR, IA, IL. This is
quite obvious if you compare left and right columns in each pair of columns in CONTROL,
ATROPHY, and NPH AFTER groups in Figure 8 – in the upper column chart. Only one
chart – the radius chart is presented here. The lower column chart shows vision indices.
Indeed CONTROL, ATROPHY, and NPH AFTER columns are very similar.
Parameter 2 K-W p
Radius Radius – eyes open REO 38.0 < 0.001 Radius – eyes closed REC 26.9 < 0.001 Sum of radiuses SR 32.8 < 0.001
Area speed
Area speed – eyes open ASEO 42.5 < 0.001 Area speed – eyes closed ASEC 32.2 < 0.001
Sum of area speeds SAS 38.1 < 0.001
Velocity Velocity – eyes open VEO 42.8 < 0.001 Velocity – eyes closed VEC 33.2 < 0.001 Sum of velocities VL 38.0 < 0.001
Table 2. Results of non-parametric ANOVA Kruskal-Wallis test for three groups: NPH AFTER, ATROPHY, and CONTROL. Other parameters differentiate not significantly.
www.intechopen.com

Hydrocephalus
200
4.2 Comparison of groups in pairs – posturography
All collected posturographic data related to the Radius are exhibited in Figure 8. There are four groups here; each one consists of EO and EC measurements. Individual values of the Radius in EO and EC measurements are shown overlapped to respective columns.
Fig. 8. Upper column chart: Sway Radius – R in CONTROL, ATROPHY, and NPH groups – in patients before and after shunting. Individual values of the Radius are also shown – the lines connect measurements performed with eyes open (EO) or closed (EC). The lower chart expresses vision indices related to radius. Columns represent mean values. Standard deviations are shown as vertical lines.
For comparisons among three groups in pairs see Tables 3, 4, 5, 7, and 8. Nonparametric Mann-Whitney U test with Bonferroni correction was used.
One can notice that NPH BEFORE patients reach largest sways, both with EO and EC (see Table 3 and 4 respectively). CONTROL group exhibits the smallest sways, both with EO and EC. The same effect can be observed on sums of corresponding parameters (SX, where X can be R, AS, or V, see Table 5). All tested differences of XEO, XEC, and SX parameters are significant but only VEC and SV parameters do not differentiate NPH BEFORE and ATROHY pair of groups (Tables 4 and 5).
www.intechopen.com

Recognition of Posture and Gait Disturbances in Patients with Normal Pressure Hydrocephalus Using a Posturography and Computer Dynography Systems
201
EO CONTROL ATROPHY NPH BEFORE
Radius REO
AV ± SD mm 4.2 ±1.4 6.6 ± 2.5 13.9 ± 3.8
CONTROL p < 0.001 p < 0.001
ATROPHY p < 0.001
Area speed ASEO
AV ± SD mm2/sec 13.3 ± 10.2 56.1 ± 84.5 159.5 ± 104.65
CONTROL p < 0.001 p < 0.001
ATROPHY p < 0.001
Velocity VEO
AV ± SD mm/sec 9.2 ± 4.4 23.2 ± 23.4 35.5 ± 17.7
CONTROL p < 0.001 p < 0.001
ATROPHY p < 0.001
Table 3. Comparisons among three groups in pairs; measurements were performed with eyes open. Average values(AV) with standard deviations (SD) and significances p of Mann-Whitney U test are given in appropriate table cells. All groups differ in respective pairs of groups.
EC CONTROL ATROPHY NPH BEFORE
Radius REC
AV ± SD mm 4.9 ± 1.7 8.2 ± 3.9 12.4 ± 3.9
CONTROL p < 0.001 p < 0.001
ATROPHY p < 0.008
Area speed ASEC
AV ± SD mm2/sec 22.7 ± 22.6 107.8 ± 175.6 140.8 ± 92.2
CONTROL p < 0.001 p < 0.001
ATROPHY p < 0.011
Velocity VEC
AV ± SD mm/sec 13.5 ± 8.7 33.5 ± 32.0 35.2 ± 17.4
CONTROL p < 0.001 p < 0.001
ATROPHY n.s.
Table 4. Comparisons among three groups in pairs of groups; measurements were performed in eyes closed condition. All EC parameters but one differentiate these groups. Only average velocity VEC is similar in NPH BEFORE and ATROHY groups.
Sums CONTROL ATROPHY NPH BEFORE
Radius SR
AV ± SD mm 9.1 ± 2.9 14.7 ± 5.7 26.4 ± 6.3
CONTROL p < 0.001 p < 0.001
ATROPHY p < 0.001
Area speed SAS
AV ± SD mm2/sec 36.1 ± 30.3 163.8 ± 255.1 300.3 ± 152.9
CONTROL p < 0.001 p < 0.001
ATROPHY p < 0.001
Velocity SV
AV ± SD mm/sec 22.8± 12.6 56.8 ± 54.1 70.7± 31.8
CONTROL p < 0.001 p < 0.001
ATROPHY p < 0.020 =n.s.
Table 5. Comparisons among three groups in pairs of groups. All sums of parameters but one differentiate the groups. Only the sum of average velocities SV is similar in NPH BEFORE and ATROHY groups.
www.intechopen.com

Hydrocephalus
202
4.3 Effect of shunt implantation on posturography parameters
One can see in Figure 9 that radius of sways measured in both conditions: EO and EC in a NPH group before shunt implantation treatment exceeded corresponding values measured in the same patients after surgery.
There is a full set of parameters included in Table 6 – average values, standard deviation and significance level of nonparametric Wilcoxon paired test. The NPH BEFORE and NPH AFTER groups differ in relation to almost all parameters. The most powerful is radius with EO (REO) – see also Figure 9.
Sways with eyes opened before shunting is much bigger than after surgery.
Parameter NPH BEFORE NPH AFTER p
Radius
REO mm 13.9 ± 3.8 6.7 ± 1.7 <0.001 REC mm 12.4 ± 3.9 8.3 ± 2.7 <0.002 SR mm 26.4 ± 6.3 14.9 ± 3.6 <0.001 DR mm -1.49 ± 4.48 1.62 ± 2.78 <0.007 IR % -6.09 ±18.9 9.26 ± 7.3 <0.008
Area speed
ASEO mm2/sec 159.5 ± 104.6 37.9 ± 17.1 <0.001 ASEC mm2/sec 140.8 ± 92.2 79.4 ± 77.9 n.s. SAS mm2/sec 300.3 ± 152.9 117.2 ± 88.4 <0.001 DAS mm2/sec -18.7 ± 124.6 41.5 ± 70.1 <0.043 IAS % -5.2 ± 34.7 15.6 ± 37.7 <0.025
Velocity
VEO mm/sec 35.5 ± 17.7 18.3 ± 7.4 <0.002 VEC mm/sec 35.2 ± 17.4 26.3 ± 17.1 n.s. SV mm/sec 70.7± 31.8 44.6 ± 23.1 <0.011 DV mm/sec -0.3 ± 16.2 8.0 ± 12.5 <0.035 IV % 0.7 ± 21.1 13.3 ± 16.1 <0.035
Table 6. Comparisons between NPH BEFORE and NPH AFTER – all parameters are included. Average values with standard deviations and significances p of nonparametric Wilcoxon paired test are given in appropriate table cells.
Fig. 9. Mean values of the sway Radius measured with eyes open (EO - left) and closed (EC -right) in NPH patients before and after surgery. Individual R values are given, they are connected with lines. CONTROL and ATROPHY groups are also shown to illustrate effect of shunting against wider background.
www.intechopen.com

Recognition of Posture and Gait Disturbances in Patients with Normal Pressure Hydrocephalus Using a Posturography and Computer Dynography Systems
203
4.4 Impact of vision on postural sway characteristics
We introduced EC-EO differences and vision index for explaining in various groups the effect of eye opening or closure on sways. Table 7 shows DX and Table 8 – IX (where X can be R, AS, or V). The interpretation of differences DX can be skipped here.
Most interesting features are the vision indices. They differentiate NPH BEFORE group from NPH AFTER and from any other group. Table 8 shows three comparisons in pairs of groups. The groups NPH BEFORE – ATROPHY significantly differ as well as the NPH BEFORE – CONTROL groups do.
A direct comparison of EO and EC parameters in four groups independently is provided in Table 9. Sways with EO and EC seem to be equal in NPH BEFORE group only. In any other group there are significant changes of sways related to the eyes closure. Enlargement of sways is a normal phenomenon after closing eyes, but not in NPH patients in acute state.
Sways of NPH patients do not depend on the sight, they seem to be the same in EO and EC conditions. This observation is the most important result of this study.
4.5 Two dimension analysis – posturography
Much more insight into the data collected is provided in the two dimensional graph. There is four-group scattergram in Figure 10. One can see a separation of NPH BEFORE cases and the centroid from all other groups. A separation is statistically significant – see tables 5 and 8 for NPH BEFORE – CONTROL and NPH BEFORE – ATROPHY data.
Differences CONTROL ATROPHY NPH BEFORE
Radius DR AV ± SD mm 0.63 ± 1.19 1.67 ± 3.15 -1.49 ± 4.48
CONTROL n.s. p < 0.013 ATROPHY p < 0.008
Area speed DAS
AV ± SD mm2/sec 9.4 ± 17.7 51.7 ± 104.4 -18.7 ± 124.6 CONTROL p < 0.031 = n.s. n.s. ATROPHY p < 0.013
Velocity DV AV ± SD mm/sec 4.3 ± 5.7 10.3 ± 14.7 -0.3 ± 16.2
CONTROL p < 0.035 = n.s. n.s. ATROPHY p < 0.007
Table 7. Comparisons of differences DR, DAS, DV among three groups in pairs of groups.
Indexes CONTROL ATROPHY NPH BEFORE
Radius IR AV ± SD % 6.5 ± 12.1 9.3 ± 19.4 -6.09 ±18.9
CONTROL n.s. p < 0.004 ATROPHY p < 0.005
Area speed IAS
AV ± SD % 19.8 ± 23.5 22.1 ± 28.2 -5.2 ± 34.7 CONTROL n.s. p < 0.004 ATROPHY p < 0.003
Velocity IV AV ± SD % 15.3 ± 13.4 16.3 ± 15.3 0.7 ± 21.1
CONTROL n.s. p < 0.001 ATROPHY p < 0.002
Table 8. Comparisons of vision indices IR, IAS, IV among three groups in pairs of groups.
www.intechopen.com

Hydrocephalus
204
Group parameter EO EC p
CONTROL
R mm 4.2 ±1.4 4.9 ± 1.7 < 0.001
AS mm2/sec 13.3 ± 10.2 22.7 ± 22.6 < 0.001
V mm/sec 9.2 ± 4.4 13.5 ± 8.7 < 0.001
ATROPHY
R mm 6.6 ± 2.5 8.2 ± 3.9 < 0.004
AS mm2/sec 56.1 ± 84.5 107.8 ± 175.6 < 0.001
V mm/sec 23.2 ± 23.4 33.5 ± 32.0 < 0.001
NPH
BEFORE
R mm 13.9 ± 3.8 12.4 ± 3.9 n.s.
AS mm2/sec 159.5 ± 104.6 140.8 ± 92.2 n.s.
V mm/sec 35.5 ± 17.7 35.2 ± 17.4 n.s.
NPH AFTER
R mm 6.7 ± 1.7 8.3 ± 2.7 < 0.035
AS mm2/sec 37.9 ± 17.1 79.4 ± 77.9 < 0.014
V mm/sec 18.3 ± 7.4 26.3 ± 17.1 < 0.004
Table 9. Comparison of R, AS, and V parameters measured with EO and EC in CONTROL, ATROPHY, NPH BEFORE and NPH AFTER groups separately.
Fig. 10. Scattergram presents all cases in four groups: NPH BEFORE, ATROPHY, CONTROL, and NPH AFTER in IR (vision index related to radius) versus SR (sum of REO and REC) coordination system. Centroids of the groups are shown with standard deviations. Notice that ATROPHY and NPH AFTER group centroids do overlap.
Two dimensional statistical analysis was performed by means of methods described in the
following section.
www.intechopen.com

Recognition of Posture and Gait Disturbances in Patients with Normal Pressure Hydrocephalus Using a Posturography and Computer Dynography Systems
205
4.6 k-NN classification of posturografic parameters
All data was analysed by means of two methods: Discrimination Analysis (DA) and k nearest neighbours (K-NN) method. Both methods give similar results for most of classifications.
Feature is a single value of multidimensional vector assigned to any object/case/patient.
Groups of patients are called classes within the “classification world”. There are 15 features
used here as follows: REC, REO, ASEC, ASEO, VEC, VEO, SR, SAS, SV, DR, DAS, DV, IR, IAS, and IV,
exactly as parameters.
The analysis was performed in several sections. At the beginning every feature was used,
one at a time. Then features were grouped into pairs according to the templates: (XEO and
XEC), (sums SX and differences DX), (sums SX and vision indices IX), where X can be R, AS, or
V. Features related to R, AS and V were paired separately. Then clusters consisting of six
features were applied.
We classified groups/classes in two following schemas – like in traditional analysis: 1) NPH BEFORE, ATROPHY and CONTROL 2) NPH BEFORE and NPH AFTER. Briefing of the classification results is presented below.
Single feature applied individually, classes: NPH BEFORE and NPH AFTER:
There were 15 DA classifications of NPH BEFORE and NPH AFTER classes and 15 K-NN
classifications performed. REO demonstrated the best classification - both methods classified
correctly 91.9%/91.9% cases (the first number relates to DA, the second to K-NN). Below
there is a list of some best features with outcome better than 75%:
REO 91.9%/91.9% SR 86.5%/89.2% AEO 86.5%/83.8% REC 78.4%/78.4% SAS 75.7%/78.4% SV 75.7%/75.7%
Classification power of vision indices was rather poor; the best was IR: 67.6%/67.6%.
Two-feature pairs, classes: NPH BEFORE and NPH AFTER:
There were nine DA/K-NN classifications here, the best are:
(REO,REC) 91.9%/94.6% (SR,DR) 91.9%/91.9% (SR,IR) 91.9%/91.9% (ASEO,ASEC) 83.8%/83.8% (SAS,DAS) 83.8%/78.4% (SAS,IAS) 86.5%/83.8%
It is interesting that there are three pairs of features with equal classification power. They
relate to the analysis in two dimensions. Notice that (SAS,IAS) and (SAS,DAS) can be calculated
from (ASEO,ASEC) using formulas (2),(3), and (4). These dimensions are not completely
independent because, for example in the CONTROL group the features REO and REC are
www.intechopen.com

Hydrocephalus
206
correlated (R = 0.73); in other groups the correlation is not as high. An example of two-
dimensional approach is shown in Figure 10.
Six-feature cluster without and with feature selection, classes: NPH BEFORE and NPH AFTER:
Multi-feature classification by K-NN method was also performed with the following
features: SR, SAS, SV, IR, IAS, and IV. Classification without feature selection (all features forced
to enter the analysis) resulted in 89.2% of correctly classified cases. Classification with
automatic selection of “best” features resulted in 94.6%. The selected features: SR and IAS.
Single feature applied individually, classes: NPH BEFORE, ATROPHY, and CONTROL:
Three-group classification (NPH BEFORE, ATROPHY and CONTROL) using single features
cannot be good both in DA and K-NN methods. The best results reached ASEO – 77.4% of
correct classified cases.
Two-feature pairs, classes: NPH BEFORE, ATROPHY, and CONTROL:
There were nine DA/K-NN classifications here, the best are:
(REO,REC) 75.5%/75.5% (SR,DR) 75.5%/76.5% (SR,IR) 73.5%/74.5%
Other pairs of features are worse. Again there is no difference between classification level
among pairs (REC, REO), (SR, DR) and (SR, IR).
Six-feature cluster without and with feature selection, classes: NPH BEFORE, ATROPHY, and CONTROL:
DA/K-NN classifications without feature selection (all features forced to enter the
analysis):
REO, REC, ASEO, ASEC, VEO, VEC 78.4%/73.5% SR, DR, SAS, DAS, SV, DV 78.4%/74.5% SR, IR, SAS, IAS, SV, IV 79.4%/73.5%
Classifications with feature selection – DA only:
REO, VEC 80.4% SR, DR 75.5% SR, IR 73.5%
Features selected automatically during analysis were exactly the same as those selected
manually during previous stages.
Classifications with feature selection – K-NN only:
REO, REC, ASEO, ASEC, VEO 82.3% SR, DR, DAS, SV 81.4% SR, IAS, SV 79.4%
Here better results were obtained.
www.intechopen.com

Recognition of Posture and Gait Disturbances in Patients with Normal Pressure Hydrocephalus Using a Posturography and Computer Dynography Systems
207
Three-class K-NN classifier consist of three two-class sub-classifiers. The results of sub-classification are also interesting. Single feature: SR demonstrates 100% correctly classified cases in NPH BEFORE – CONTROL sub- classifier. Selection of three features: REO, DAS and DV classified correctly 94.6% cases in NPH BEFORE – ATROPHY sub- classifier what proofs the existence of important difference between NPH and atrophy imbalance. This observation is also an important result of the present study.
4.7 Analysis of gait parameters
Evaluation of gait is performed by means of five gait parameters: time of single supper (TSSUP), time of double support (TDSUP), time of stance (TSTANCE), length of single support (DSSUP), and length of double support (DDSUP). Initially ten parameters were involved; they were related to the left and right leg. Average values with standard deviations were plotted in Figure 11. Values of the parameters related to the left and right leg were compared statistically by means of nonparametric Wilcoxon paired test in each group separately. There was no difference found between legs. Therefore the outcomes from the left and right leg were combined – cases are not patients now but legs.
Parameter 2 K-W p
Time of single support (TSSUP) sec 53.3 < 0.001Time of double support (TDSUP) sec 84.2 < 0.001Time of stance (TSTANCE) sec 83.2 < 0.001Length of single support(DSSUP) 107.3 < 0.001Length of double support(DDSUP) 80.9 < 0.001
Table 10. Non-parametric ANOVA Kruskal-Wallis test for three groups: NPH BEFORE, ATROPHY, and CONTROL. n = 148.
Non-parametric ANOVA Kruskal-Wallis test was used again to compare three groups: NPH BEFORE, ATROPHY, and CONTROL. The results are in Table 10. The groups differ significantly for all parameters. This allows making post-hoc comparisons in pairs of groups, applying Bonferroni correction.
One can notice in Table 11 that the TSTANCE is the biggest in NPH BEFORE group. This means slower gait of patients in acute state; time of stance phase TSTANCE is more than 130% longer than in CONTROL group (ratio: 1.61/0.68 = 2.36 of values in NPH BEFORE and CONTROL groups). ATROPHY patients show decreased walking pace compared with healthy people, however they have higher gait velocity than NPH BEFORE.
Duration of single support TSSUP in NPH BEFORE group is 70% longer than in CONTROL group (ratio: 0.65/0.38 = 1.71). Duration of double support in NPH BEFORE group is 180% longer than in CONTROL group (ratio: 0.46/0.16 = 2.87). One can see differences in single and double support distributions. In NPH BEFORE group ratio: TSSUP / TDSUP = 0.65/0.46 = 1.41, in CONTROL group: TSSUP / TDSUP = 0.38/0.16 = 2.37. Double support is much longer not only if measured in seconds, but in relation to single support length. If comparing DSSUP and DDSUP, between NPH and CONTROL groups, one can observe strong reduction of single support length. For single support length DSSUP there is a proportion: 1.64/7.13 = 0.23, for double support length DDSUP: 6.28/11.54 = 0.54. ATROPHY group is always in the middle between NPH BEFORE and ATROPHY.
www.intechopen.com

Hydrocephalus
208
Fig. 11. Average values with standard deviations of times: TSSUP, TDSUP, TSTANCE in four groups.
Parameter CONTROL ATROPHY NPH BEFORE
TSSUP
AV ± SD sec 0.38 ± 0.02 0.45 ± 0.10 0.65 ± 0.33
CONTROL < 0.001 < 0.001
ATROPHY < 0.001
TDSUP
AV ± SD sec 0.16 ± 0.01 0.27 ± 0.14 0.46 ± 0.28
CONTROL < 0.001 < 0.001
ATROPHY < 0.001
TSTANCE
AV ± SD sec 0.68 ± 0.03 0.98 ± 0.31 1.61 ± 0.82
CONTROL < 0.001 < 0.001
ATROPHY < 0.001
DSSUP
AV ± SD cm 7.13 ± 0.53 3.29 ± 1.49 1.64 ± 1.17
CONTROL < 0.001 < 0.001
ATROPHY < 0.001
DDSUP
AV ± SD cm 11.54 ± 1.85 9.54 ± 1.77 6.28 ± 2.88
CONTROL < 0.001 < 0.001
ATROPHY < 0.001
Table 11. Comparisons of TSSUP, TDSUP, TSTANCE, DSSUP, DDSUP parameters in pairs of groups. Average values with standard deviations and significances p of Mann-Whitney U test are given in appropriate table cells. All differences are significant.
www.intechopen.com

Recognition of Posture and Gait Disturbances in Patients with Normal Pressure Hydrocephalus Using a Posturography and Computer Dynography Systems
209
Group parameter BEFORE AFTER P
NPH n= 15
TSSUP sec 0.65 ± 0.33 0.42 ± 0.10 < 0.001
TDSUP sec 0.46 ± 0.29 0.28 ± 0.14 < 0.001
TSTANCE sec 1.61 ± 0.82 1.03 ± 0.83 < 0.001
DSSUP cm 1.64 ± 1.17 3.55 ± 1.31 < 0.001
DSSUP cm 6.28 ± 2.88 8.54 ± 2.96 < 0.001
Table 12. Comparison between NPH BEFORE and NPH AFTER. Average values with standard deviations and significances p of nonparametric Wilcoxon paired test are given in appropriate table cells. All parameters: TSSUP, TDSUP, TSTANCE, DSSUP, and DDSUP differentiate significantly NPH stages. All differences are significant.
Parameter CONTROL n=48 ATROPHY n=35
NPH AFTER n=34
TSSUP
AV ± SD sec 0.38 ± 0.02 0.45 ± 0.10 0.42 ± 0.10
CONTROL < 0.001
ATROPHY n.s.
TDSUP
AV ± SD sec 0.16 ± 0.01 0.27 ± 0.14 0.28 ± 0.13
CONTROL < 0.001
ATROPHY n.s.
TSTANCE
AV ± SD sec 0.68 ± 0.03 0.98 ± 0.31 1.00 ± 0.78
CONTROL < 0.002
ATROPHY n.s.
DSSUP
AV ± SD cm 7.13 ± 0.53 3.29 ± 1.49 3.56 ± 1.28
CONTROL < 0.001
ATROPHY n.s.
DDSUP
AV ± SD cm 11.54 ± 1.85 9.54 ± 1.77 8.46 ± 2.79
CONTROL < 0.001
ATROPHY n.s.
Table 13. Comparisons of TSSUP, TDSUP, TSTANCE, DSSUP, DDSUP parameters in group-pairs. Average values with standard deviations and significances p of Mann-Whitney U test are given in appropriate table cells.
Direct comparison of gait parameters between BEFORE and AFTER states in NPH are given
in Table 12. Because NPH BEFORE and NPH AFTER are paired groups, the Wilcoxon test
was used to compare the gait. Differences of all parameters are statistically significant.
Figure 12 shows average values with standard deviations as well as individual values of
TSSUP, TDSUP, TSTANCE in NPH patients before and after surgery.
After surgery gait of NPH patients resembles gait of patients with atrophy. Table 13 shows
that there is no statistical significant difference between NPH AFTER and ATROPHY
groups.
www.intechopen.com

Hydrocephalus
210
Fig. 12. Mean values of TSSUP, TDSUP, TSTANCE in NPH BEFORE and NPH AFTER groups. Individual values of these parameters are given, they are connected with lines. Values for both legs are combined.
4.8 k-NN classification of dynografic parameters
Dynographic parameters were analysed by means of k-NN method in 2008 (Czerwosz at al. 2008). Now the calculations should be repeated with larger number of subjects. Usage of pattern recognition methods can give chance for better evaluation of multi-parameter data.
5. Discussion and conclusions
There are three main theses that come out from this study:
1. Sways in NPH patients before shunting is much bigger than after surgery. This relates mostly to eyes open (EO) condition.
2. Sways of NPH patients do not depends on the sight, they seem to be the same in EO and EC conditions.
3. NPH and atrophy imbalances differ when evaluate by means of more than one parameter (feature). Pattern recognition methods should be used.
There are many proofs of strong relationship between vision and postural control. Vision has a greater influence on standing postural control, resulting in greater sway when individuals are presented with erroneous or conflicting visual cues (Redfern at al. 2001). In impairment of the vestibular system and possibly other sensing systems and probably in cerebellar ataxias, vision can help in balance recovery. In NPH we do not observe any improvement, there is some probability that vision can disturb maintenance of the balance. Interestingly the vision index was slightly negative in NPH BEFORE group, meaning that with eyes closed sways are smaller. Blomsterwall (Blomsterwall at al. 2000) found that healthy individual had a 29% better postural function with open eyes while NPH patients only improved their balance score by 18% with open eye. The impact of vision should be studied farther due to this discrepancy.
www.intechopen.com

Recognition of Posture and Gait Disturbances in Patients with Normal Pressure Hydrocephalus Using a Posturography and Computer Dynography Systems
211
6. Acknowledgment
We would like to thank Adam Jóźwik for releasing his K-NN software.
This study was partially supported by grant from the Polish Ministry of Education and Science (Grant No. R13 041 02).
Research support was partially provided by the Biocentrum-Ochota project [POIG.02.03.00-00-003/09 - European Regional Development Fund, the Operational Programme “Innovative Economy” 2007-2013].
7. References
Baratto L, Morasso PG, Re C, Spada G. (2002) A new look at posturographic analysis in the
clinical context: sway-density versus other parameterization techniques. Motor Control
6(3): 246-70.
Benda, B. J., Riley, P. O., & Krebs, D. E. (1994) Biomechanical relationship between center of
gravity and center of pressure during standing. IEEE Transactions on Rehabilitation
Engineering 2(1): 3-10.
Bertrani A, Cappello A, Benedetti MG, Simoncini L, Catani F. (1999) Flat foot functional
evaluation using pattern recognition of ground reaction data. Clin Biomech (Bristol,
Avon) 14(7): 484-93.
Bhargava P., Shrivastava P., & Nagariya S.P. (2007) Assessment of changes in gait parameters
and vertical ground reaction forces after total hip arthroplasty. Indian J Orthop 41(2):
158–162.
Bloem B.R., Beckley D.J., Remler M.P. (1995). Postural reflexes in Parkinson's disease during
"resist" and "yield" tasks. J. Neurol Sci 129: 109-119.
Blomsterwall E., Svantesson U., Carlsson U., Tullberg M., Wikkelsö C. (2000) Postural
disturbance in patients with normal pressure hydrocephalus. Acta Neurol Scand 102:
284-291.
Błaszczyk J.W. (2008) Sway ratio - a new measure for quantifying postural stability. Acta
neurobiologiae experimentalis 68 (1): 51-57.
Błaszczyk J.W., Michalski A. (2006). Aging and postural stability. Studies in Physical Culture
and Tourism 13: 11-14.
Boon AJ, Tans JT, Delwel EJ, Egeler-Peerdeman SM, Hanlo PW, Wurzer HA et al. (1999)
Dutch Normal-Pressure Hydrocephalus Study: the role of cerebrovascular disease. J
Neurosurg 90(2):221-226.
Bosek, M., Grzegorzewski, B., Kowalczyk, A., Lubiński, I. (2005) Degradation of postural
control system as a consequence of Parkinson’s disease and ageing. Neuroscience letters
376(3), 215-20.
Czernicki Z., Szewczykowski J., Kunicki A., Śliwka S., Korsak-Śliwka J., Pawłowski G.,
Dziduszko J., Mempel E., Jurkiewicz J., Augustyniak B. (1984) Computerized infusion
test II. Clinical use. Neurol. Neurochir Pol 18 (6): 561-565.
Czerwosz L., Szczepek E., Błaszczyk J.W., Sokołowska B., Dmitruk K., Dudziński K.,
Jurkiewicz J., Czernicki Z. (2009) Analysis of postural sway in patients with normal
www.intechopen.com

Hydrocephalus
212
pressure hydrocephalus: effects of shunt implantation. European Journal of Medical
Research 14 Supl 4: 53-58
Czerwosz L., Szczepek E., Sokołowska B., Jóźwik A., Dudziński K., Jurkiewicz J., Czernicki
Z. (2008) Recognition of gait disturbances in patients with normal pressure hydrocephalus
using the Computer Dynography system. Journal of Physiology and Pharmacology 59,
Supl 6: 201-207.
Czosnyka M., Wollk-Laniewski P., Batorski L., Zaworski W. (1988) Analysis of intracranial
pressure waveform during infusion test. Acta Neurochirurgica (Wien) 93, 3-4: 140-145.
Devijver P.A., Kittler J. (1982) Pattern recognition: A statistical approach. Prentice Hall, London.
Dmitruk K. (2005) Analiza wybranych parametrów posturograficznych u ludzi w różnych grupach
wiekowych. Doctor distertation. Nicolaus Copernicus University, Collegium
Medicum. Bydgoszcz (in Polish).
Duda R.O., Hart P.E., Stork D.G. (2001) Pattern classification. John Wiley & Sons, New York.
Dunn, O.J. (1961) Multiple Comparisons Among Means. Journal of the American Statistical
Association 56, 52-64.
Evans W.A. (1942) An Encephalographic Ratio for Estimating Ventricular Enlargement and
Cerebral Atrophy. Arch. Neurol. and Psych 47 (6): 931-937.
Galia G.L., Rigamonti D., Williams M.A. (2005) The diagnosis and treatment of idiopathic normal
pressure hydrocephalus. Nature Clinical Practice Neurology 2: 375-381.
Hakim S., Adams R.D. (1965). The Special Clinical Problem of Symptomatic Hydrocephalus with
Normal Cerebrospinal Fluid Pressure. J. Neurol. Sci. 2: 307-327.
IBM-SPSS Statistics. (n.d.) PASW Statistics v. 18.(previously SPSS – Statistical Package for the
Social Sciences). http://www-01.ibm.com/software/analytics/spss/products/
statistics.
Infotronic Company (2007) Ultraflex system. Available from: http://www.infotronic.nl/
Brochures/English/Model-English-CEGV2-2007.pdf.
Jagielski J., Kubiczek-Jagielska M., Sobstyl M., Koziara H., Błaszczyk J., Ząbek M., Zaleski M.
(2006). Posturography as objective evaluation of the balance system in Parkinson's disease
patients after neurosurgical treatment. A preliminary report. Neurol Neurochir Pol.
40(2): 127-33. In Polish.
Jeleń P., Wit P., Dudziński K., Nolan L. (2008) Expressing gait-line symmetry in able-bodied gait.
Dynamic Medicine 7:17.
Jóźwik A., Sokołowska B., Nieboj-Dobosz I., Janik P., Kwieciński H. (2011) Extraction of
biomedical traits for patients with amyotrophic lateral sclerosis using parallel and
hierarchical classifiers. International Journal of Biometrics 3, 1: 85-94.
Kaczmarczyk K., Wit A., Krawczyk M., Zaborski J. (2009) Gait classification in post-stroke
patients using artificial neural networks. Gait & Posture 30: 207–210.
Kessler N., Ganança M.M., Ganança C.F. Ganança F.F., Lopes S.C., Serra A.P., Caovilla H.H.
(2011). Balance Rehabilitation Unit (BRUTM) posturography in relapsing-remitting
multiple sclerosis. Arq. Neuro-Psiquiatr. 69, 3: 485-490.
Kruskal and Wallis (1952) Use of ranks in one-criterion variance analysis. Journal of the
American Statistical Association 47 (260): 583–621.
www.intechopen.com

Recognition of Posture and Gait Disturbances in Patients with Normal Pressure Hydrocephalus Using a Posturography and Computer Dynography Systems
213
Kubisz L., Werner H., Bosek M., Weiss W. (2011) Posture Stability Evaluation Using Static
Posturography in Patients after Cruciate Ligament Reconstruction. Acta Physica
Polonica 119: 957-960.
Maduko E. Pattern recognition of human gait signatures. (n.d.) University of Texas at El Paso.
Available from: http://faculty.utep.edu/Portals/1255/Elizabeth.pdf.
Majumdar K., Lenka P.K., Kumar R. (2008) Variability of Gait Parameters of Unilateral Trans-
tibial Amputees in Different Walking Speeds. Indian Journal of Physical Medicine and
Rehabilitation 19 (2): 37-42.
Mohan G., Pal P.K., Sendhil K.R., Thennarasu K., Usha B.R. (2009). Quantitative evaluation of
balance in patients with spinocerebellar ataxia type 1: A case control study. Parkinsonism
and Related Disorders 15 (6): 435-439.
Mraz M., Curzytek M., Mraz M.A., Gawron W., Czerwosz L., Skolimowski T., (2007) Body
balance in patients with systemic vertigo after rehabilitation exercises. J.Physiol
Pharmacol 58 (5): 427-436.
Olton J., Czerwosz L. (2006) Posturograf firmy Pro-Med, Acta Bio-Optica et Informatica
Medica. Inżynieria Biomedyczna 12: 143. (Article in Polish)
Origin Corporation. (n.d.) Origin-pro software v. 8. Available from:
http://www.originlab.com/index.aspx?go=PRODUCTS/OriginPro.
Perry J., Burnfield J.M. (2010) Gait Analysis. Normal and Pathological Function. Slack Inc.,
Thorofare, New Jersey Second Edition.
Raymakers J.A., Samson M.M., Verhaar H.J.J. (2005) The assessment of body sway and the choice
of the stability parameter(s). Gait and Posture 21 48–58.
Ravdin L.D., Heather L. Katzen Anna E. Jackson, Diamanto Tsakanikas, Stephanie Assuras,
and Norman R. Relkin (2008) Features of gait most responsive to tap test in normal
pressure hydrocephalus. Clin Neurol Neurosurg. 110(5): 455–461.
Redfern M.S., Yardley L., Bronstein A.M. (2001) Visual influences on balance. Anxiety
Disorders 15: 81- 94.
Sokołowska B., Jóźwik A., Nieboj-Dobosz I., Janik P., Kwieciński H. (2009) Evaluation of
matrix metalloproteinases in serum of patients with amyotrophic lateral sclerosis with
pattern recognition methods. Journal of Physiology and Pharmacology 60 (suppl 5):
117-120.
Stolze H., Kuhtz-Buschbeck J.P., Drücke H., Jöhnk K., Illert M., Deuschl G. (2001)
Comparative analysis of the gait disorder of normal pressure hydrocephalus and
Parkinson’s disease. J Neurol Neurosurg Psychiatry 70:289–297.
Szczepek E., Czerwosz L., Dąbrowski P., Dudziński K., Jurkiewicz J., Czernicki Z. (2008) Posturography and computerized gait analysis in the Computer Dyno Graphy system as
non-invasive methods for evaluation of normal pressure hydrocephalus progression.
Neurologia i Neurochirurgia Polska 42, 2: 139–152. (Article in polish)
Śliwka S., Pawłowski G., Korsak-Śliwka J., Szewczykowski J., Czernicki Z. (1984)
Computerized infusion test I. The method. Neurol Neurochir Pol, 18 (6): 553-560.
Tans J.T.J. (1979) Differentiation of normal pressure hydrocephalus and cerebral atrophy by
computed tomography and spinal infusion test. Journal of Neurology 222, 2: 109-118.
www.intechopen.com

Hydrocephalus
214
Voss K., Imhof J., Kaestner S., Montavon P.M. (2007) Force plate gait analysis at the walk and
trot in dogs with low-grade hindlimb lameness. Vet Comp Orthop Traumatol, 20: 229-
304.
Wöber C., Wöber-Bingo C., Karwautz A., Nimmerrichter A, Walter H. and Deecke L. (1998).
Aataxia of stance in different types of alcohol dependence — a posturographic study.
Alcohol & Alcoholism 33, 4: 393-402.
www.intechopen.com

HydrocephalusEdited by Dr Sadip Pant
ISBN 978-953-51-0162-8Hard cover, 214 pagesPublisher InTechPublished online 24, February, 2012Published in print edition February, 2012
InTech EuropeUniversity Campus STeP Ri Slavka Krautzeka 83/A 51000 Rijeka, Croatia Phone: +385 (51) 770 447 Fax: +385 (51) 686 166www.intechopen.com
InTech ChinaUnit 405, Office Block, Hotel Equatorial Shanghai No.65, Yan An Road (West), Shanghai, 200040, China
Phone: +86-21-62489820 Fax: +86-21-62489821
Description of hydrocephalus can be found in ancient medical literature from Egypt as old as 500 AD.Hydrocephalus is characterized by abnormal accumulation of cerebrospinal fluid (CSF) in the ventricles of thebrain. This results in the rise of intracranial pressure inside the skull causing progressive increase in the size ofthe head, seizure, tunneling of vision, and mental disability. The clinical presentation of hydrocephalus varieswith age of onset and chronicity of the underlying disease process. Acute dilatation of the ventricular systemmanifests with features of raised intracranial pressure while chronic dilatation has a more insidious onsetpresenting as Adams triad. Treatment is generally surgical by creating various types of cerebral shunts. Roleof endoscopic has emerged lately in the management of hydrocephalus.
How to referenceIn order to correctly reference this scholarly work, feel free to copy and paste the following:
L. Czerwosz, E. Szczepek, B. Sokołowska, J. Jurkiewicz and Z. Czernicki (2012). Recognition of Posture andGait Disturbances in Patients with Normal Pressure Hydrocephalus Using a Posturography and ComputerDynography Systems, Hydrocephalus, Dr Sadip Pant (Ed.), ISBN: 978-953-51-0162-8, InTech, Available from:http://www.intechopen.com/books/hydrocephalus/recognition-of-posture-and-gait-disturbances-in-patients-with-normal-pressure-hydrocephalus-using-a-

© 2012 The Author(s). Licensee IntechOpen. This is an open access articledistributed under the terms of the Creative Commons Attribution 3.0License, which permits unrestricted use, distribution, and reproduction inany medium, provided the original work is properly cited.