recommended actions and planning issues
TRANSCRIPT

Recommended Actions and Planning Issues • 4-1
AAC—Augmentative and Alternative Communication
Add.—Addition
AUT—Autism Spectrum Disorders
BRIDGE—Bridge services
CSR—Class size reduction
DCC—Downcounty Consortium
DHOH—Deaf and Hard of Hearing
ED—Emotional Disabilities Services
ELC—Elementary Learning Center
ESOL—English for Speakers of Other Languages
GT/LD—Gifted and Talented/Learning Disabled
HS—Head Start
HSM–Home school model
LAD—Learning and Academic Disabilities
LANG—Speech/Language Services
LFI—Learning for Independence
LTL—Linkages to Learning
METS—Multidisciplinary Educational Training and Support class (for non-English-speaking students with limited educational experience)
MSMC—Middle School Magnet Consortium
NEC—Northeast Consortium
PD—Physical Disabilities class
PEP—Preschool Education Program
pre-K—# of sessions of prekindergarten
pre-K Lang—Prekindergarten language class
Reg. Sec.—Regular secondary classroom
Reg. Elem.—Regular elementary classroom
Rev/Ex—Revitalization/Expansion
Rm CSR—# of classrooms for class-size reduction initiative
SBHC—School-based Health Center
SCB—School/Community-Based Programs for Students with Intellectual Disabilities
Sup. Rms.—Support rooms, such as art, music, and computer labs
SBWC—Wellness Center
TBD—To be determined
TS—# of Teaching Stations
VIS—Preschool or secondary Vision Services
Chapter 4
Recommended Actions and Planning Issues
Chapter 4 is organized alphabetically by high school cluster and consortia. Each section includes tables that contain enroll-ment, demographic, program capacity, and facilities informa-tion for individual schools. Capital projects recommended for the FY 2019 Capital Budget and the FY 2019–2024 Capital Improvements Program (CIP) are included. It is important to note that although cluster/consortia organization is used for the presentation of information, planning actions often cross cluster/consortia boundaries in order to meet program and facility needs for all students. The maps for each cluster, special education centers, and other educational centers can be found in Appendix Y.
All schools are evaluated based on existing and planned pro-gram capacity. School system enrollment continues to grow. Although temporary overutilization of facilities is accommo-dated with relocatable classrooms, long-term overutilization requires additional capacity to both elementary and secondary schools through various construction projects.
For each cluster and the Downcounty and Northeast consor-tia, information is presented within a common framework. Planning issues of a clusterwide nature are followed by a discussion of individual secondary and elementary schools with recommended capital projects or non-capital actions. All clusters may not have clusterwide planning issues, and only schools with plans are discussed in each cluster section.
Following the narrative discussion of planning activities is a table labeled “Capital Projects” that summarizes all capital projects for that cluster or consortium. Four types of projects are identified under the “Type of Project” column. The types of projects are as follows:
• “Approved”—Project has an FY 2017 or FY 2018 appro-priation approved in the Amended FY 2017–2022 CIP.
• “Programmed”—Project has expenditures programmed in a future year of the CIP for planning and/or construc-tion funds.
• “Proposed”—Project has facility planning funds recom-mended for a feasibility study.
• “Recommended”—Project has an FY 2019 appropriation for planning or construction funds recommended in the FY 2019–2024 CIP.
For each cluster and the two consortia, four summary tables and a bar graph are presented. The bar graph shows the effects of additions to capacity in the calculation of future utilization levels. The “Projected Enrollment and Available Capacity” table reflects the projected enrollment six years into the future for elementary and secondary schools and to the years 2027 and 2032 at the secondary level. Space availability is shown with CIP actions. This table also has a “comments” section that contains a brief explanation of program or facility changes that will impact capacity within any given year. To assist read-ers, a glossary of abbreviations and terms used in the tables

4-2 • Recommended Actions and Planning Issues
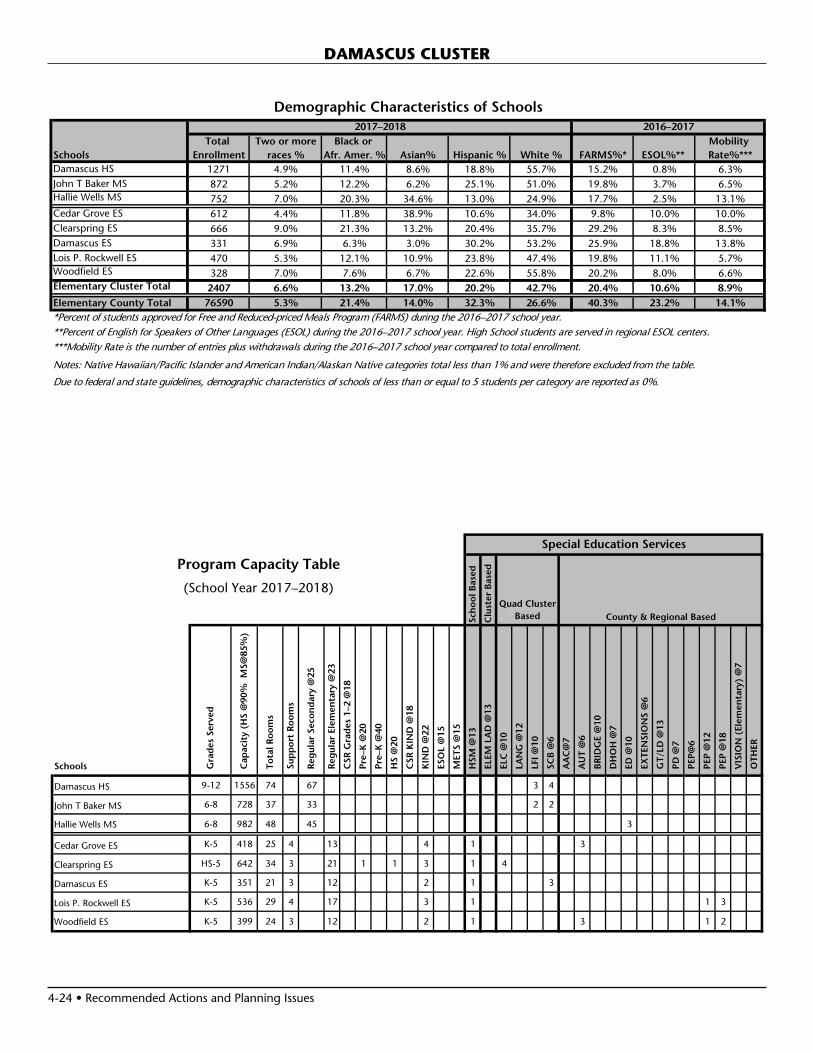
and notes is included on the previous page. A second table, titled “Demographic Characteristics of Schools,” shows the racial and ethnic group composition percentages, the student participation in the Free and Reduced-price Meals System (FARMS) Program, the percentage of English for Speakers of Other Languages (ESOL) and the Mobility Rate for schools.
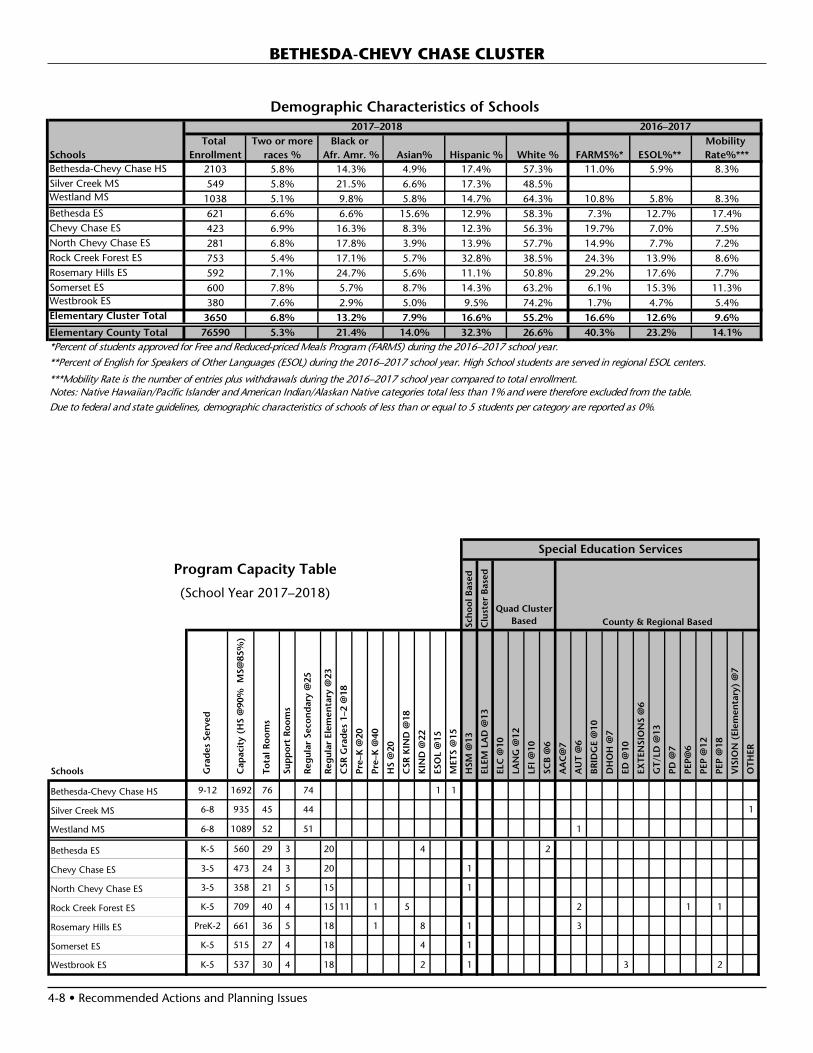
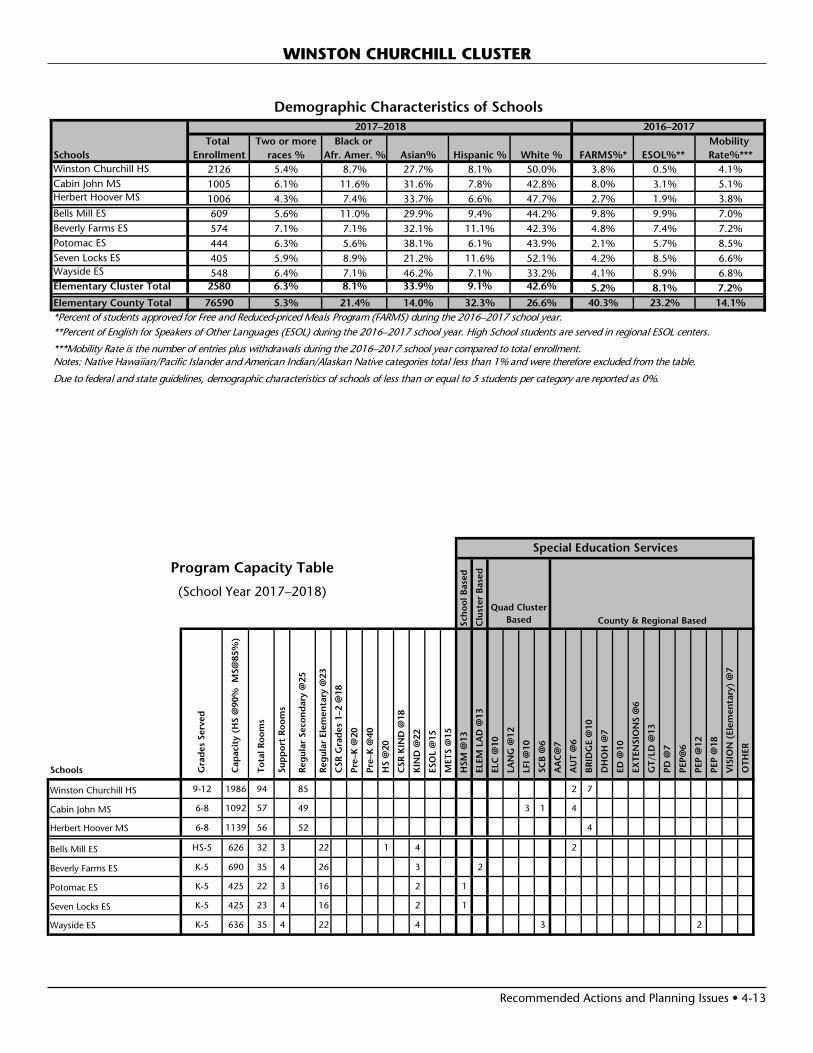
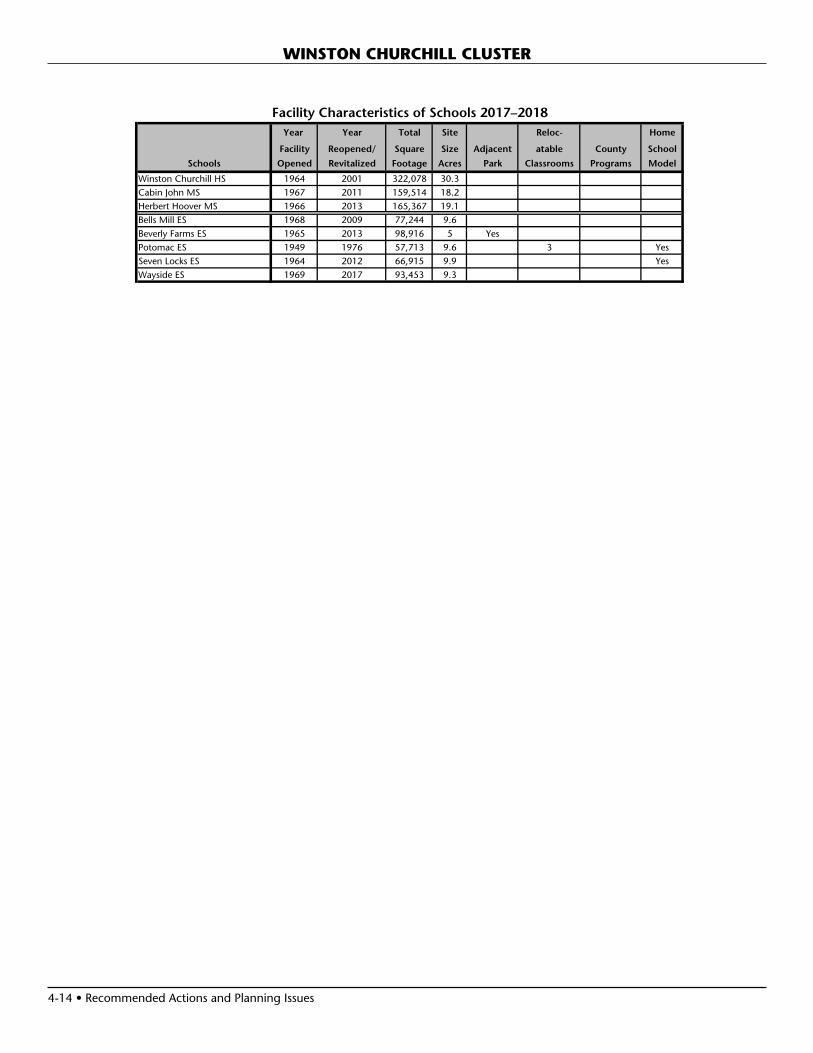
The “Program Capacity Table (School Year 2017–2018)” reflects detailed program capacity information for each school, along with special education program information. The final table, titled “Facilities Characteristics of Schools 2017–2018,” shows facility information for each school.

Recommended Actions and Planning Issues • 4-3
Cluster Articulation for 2017–2018 School YearBETHESDA-CHEVY CHASE CLUSTERBethesda-Chevy Chase HS (9–12) Silver Creek MS (6–7) (8th grade class will be added in school year 2018–2019) Chevy Chase ES (3–5) North Chevy Chase ES (3–5) Rock Creek Forest ES (K–5) (non-Spanish Immersion) Rosemary Hills ES (pre-K–2)* Westland MS (6–8) Bethesda ES (K–5) Rock Creek Forest ES (K–5) (Spanish Immersion) Somerset ES (K–5) Westbrook ES (K–5)
WINSTON CHURCHILL CLUSTERWinston Churchill HS (9–12) Cabin John MS (6–8) (shared with Wootton Cluster)* Bells Mill ES (HS–5) Seven Locks ES (K–5) Herbert Hoover MS (6–8) Beverly Farms ES (K–5) Potomac ES (K–5) Wayside ES (K–5)
CLARKSBURG CLUSTERClarksburg HS (9–12) Neelsville MS (6–8) (shared with Watkins Mill Cluster)* Capt. James E. Daly ES (pre-K–5) Fox Chapel ES (pre-K–5) Rocky Hill MS (6–8) (shared with Damascus Cluster)* Cedar Grove ES (K–5)* Clarksburg ES (K–5) William B. Gibbs, Jr. ES (pre-K–5) Little Bennett ES (K–5) Hallie Wells MS (6–8) (shared with Damascus Cluster)* Cedar Grove ES (K-5)* Wilson Wims ES (K-5)*
DAMASCUS CLUSTERDamascus HS (9–12) John T. Baker MS (6–8) Clearspring ES (HS–5) Damascus ES (K–5) Laytonsville ES (K–5)* Lois P. Rockwell ES (K–5) Woodfield ES (K–5) Rocky Hill MS (6–8) (shared with Clarksburg Cluster)* Cedar Grove ES (K–5)* Hallie Wells MS (6–8) (shared with Clarksburg Cluster)* Cedar Grove ES (K-5)* Wilson Wims ES (K-5)*
DOWNCOUNTY CONSORTIUMMontgomery Blair HS (9–12)Albert Einstein HS (9–12)John F. Kennedy HS (9–12)Northwood HS (9–12)Wheaton HS (9–12) Argyle MS (6–8) A. Mario Loiederman MS (6–8) Parkland MS (6–8) Bel Pre ES (pre-K–2) Brookhaven ES (pre-K–5) Georgian Forest ES (HS and pre-K–5) Harmony Hills ES (HS and pre-K–5) Sargent Shriver ES (pre-K–5) Strathmore ES (3–5) Viers Mill ES (HS and pre-K–5) Weller Road ES (HS and pre-K–5) Wheaton Woods ES (HS and pre-K–5)
Eastern MS (6–8) Montgomery Knolls ES (HS and pre-K–2) New Hampshire Estates ES (HS and pre-K–2) Oak View ES (3–5) Pine Crest ES (3–5) Col. E. Brooke Lee MS (6–8) Arcola ES (HS–5) Glenallan ES (HS–5) Kemp Mill ES (pre-K–5) Newport Mill MS (6–8) Highland ES (HS and pre-K–5) Oakland Terrace ES (pre-K–5) Rock View ES (pre-K–5) Silver Spring International MS (6–8) Forest Knolls ES (HS and pre-K–5) Highland View ES (K–5) Rolling Terrace ES (HS and pre-K–5) Sligo Creek ES (K–5) Sligo MS (6–8) Glen Haven ES (pre-K–5) Flora M. Singer ES (pre-K–5) Woodlin ES (K–5) Takoma Park MS (6–8) East Silver Spring ES (HS and pre-K–5) Piney Branch ES (3–5) Takoma Park ES (pre-K–2)
GAITHERSBURG CLUSTERGaithersburg HS (9–12) Forest Oak MS (6–8) Goshen ES (K–5) Rosemont ES (pre-K–5) Summit Hall ES (HS and pre-K–5) Washington Grove ES (HS and pre-K–5) Gaithersburg MS (6–8) Gaithersburg ES (pre-K–5) Laytonsville ES (K–5)* Strawberry Knoll ES (HS and pre-K–5)
WALTER JOHNSON CLUSTERWalter Johnson HS (9–12) North Bethesda MS (6–8) Ashburton ES (K–5) Kensington Parkwood ES (K–5) Wyngate ES (K–5) Tilden MS (6–8) Farmland ES (K–5) Garrett Park ES (K–5) Luxmanor ES (K–5)
COL. ZADOK MAGRUDER CLUSTERCol. Zadok Magruder HS (9–12) Redland MS (6–8) Cashell ES (pre-K–5) Judith A. Resnik ES (pre-K–5) Sequoyah ES (K–5) Shady Grove MS (6–8) Candlewood ES (K–5) Flower Hill ES (pre-K–5) Mill Creek Towne ES (pre-K–5)
RICHARD MONTGOMERY CLUSTERRichard Montgomery HS (9–12) Julius West MS (6–8) Beall ES (HS and pre-K–5) College Gardens ES (HS–5) Ritchie Park ES (K–5) Twinbrook ES (HS and pre-K–5)

4-4 • Recommended Actions and Planning Issues
NORTHEAST CONSORTIUMJames H. Blake HS (9–12)Paint Branch HS (9–12)Springbrook HS (9–12) Benjamin Banneker MS (6–8) Burtonsville ES (K–5) Fairland ES (HS and pre-K–5)* Greencastle ES (pre-K–5) Briggs Chaney MS (6–8) Cloverly ES (K–5)* Fairland ES (HS and pre-K–5)* Galway ES (pre-K–5) William T. Page ES (pre-K–5)William H. Farquhar MS (6–8) (shared with Sherwood Cluster)* Cloverly ES (K–5)* Sherwood ES (K–5)* Stonegate ES (K–5)* Francis Scott Key MS (6–8) Burnt Mills ES (pre-K–5) Cannon Road ES (K–5) Cresthaven ES (3–5) Dr. Charles R. Drew ES (pre-K–5) Roscoe R. Nix ES (pre-K–2) White Oak MS (6–8) Jackson Road ES (pre-K–5) JoAnn Leleck ES at Broad Acres(HS and pre-K–5) Stonegate ES (K–5)* Westover ES (K–5)
NORTHWEST CLUSTERNorthwest HS (9–12) Kingsview MS (6–8) Great Seneca Creek ES (K–5)* Ronald McNair ES (pre-K–5) Spark M. Matsunaga ES (K–5)Lakelands Park MS (6–8) (shared with Quince Orchard Cluster)* Darnestown ES (K–5) Diamond ES (K–5)*Roberto Clemente MS (6–8) (shared with Seneca Valley Cluster)* Clopper Mill ES (HS and pre-K–5) Germantown ES (K–5) Great Seneca Creek ES (K–5)*
POOLESVILLE CLUSTERPoolesville HS (9–12) John Poole MS (6–8) Monocacy ES (K–5) Poolesville ES (K–5)
QUINCE ORCHARD CLUSTERQuince Orchard HS (9–12)Lakelands Park MS (6–8) (shared with Northwest Cluster)* Brown Station ES (HS and pre-K–5) Rachel Carson ES (pre-K–5) Ridgeview MS (6–8) Diamond ES (K–5)* Fields Road ES (pre-K–5) Jones Lane ES (K–5) Thurgood Marshall ES (K–5)
ROCKVILLE CLUSTERRockville HS (9–12) Earle B. Wood MS (6–8) Lucy V. Barnsley ES (pre-K–5) Flower Valley ES (K–5) Maryvale ES (HS and pre-K–5) Meadow Hall ES (K–5) Rock Creek Valley ES (K–5)
SENECA VALLEY CLUSTERSeneca Valley HS (9–12) Roberto W. Clemente MS (6–8) (shared with Northwest Cluster)* S. Christa McAuliffe ES (HS–5) Dr. Sally K. Ride ES (HS and pre-K–5)* Dr. Martin Luther King, Jr. MS (6–8) Lake Seneca ES (pre-K–5) Dr. Sally K. Ride ES (HS and pre-K–5)* Waters Landing ES (K–5)
SHERWOOD CLUSTERSherwood HS (9–12) Rosa M. Parks MS (6–8) Belmont ES (K–5) Greenwood ES (K–5) Olney ES (K–5) William H. Farquhar MS (6–8) (shared with Northeast Consortium)* Brooke Grove ES (pre-K–5) Sherwood ES (K–5)
WATKINS MILL CLUSTERWatkins Mill HS (9–12) Montgomery Village MS (6–8) Stedwick ES (pre-K–5)* Watkins Mill ES (HS and pre-K–5) Whetstone ES (pre-K–5)Neelsville MS (6–8) (shared with Clarksburg Cluster)* South Lake ES (HS and pre-K–5) Stedwick ES (pre-K–5)*
WALT WHITMAN CLUSTERWalt Whitman HS (9–12) Thomas W. Pyle MS (6–8) Bannockburn ES (K–5) Bradley Hills ES (K–5) Burning Tree ES (K–5) Carderock Springs ES (K–5) Wood Acres ES (K–5)
THOMAS S. WOOTTON CLUSTERThomas S. Wootton HS (9–12)Cabin John MS (6–8) (shared with Churchill Cluster)* Cold Spring ES (K–5) Stone Mill ES (K–5) Robert Frost MS (6–8) DuFief ES (K–5) Fallsmead ES (K–5) Lakewood ES (K–5) Travilah ES (K–5)
OTHER EDUCATIONAL FACILITIESAdditionally, Montgomery County Public Schools operates the following facilities: Thomas Edison High School of Technology Blair G. Ewing Center Stephen Knolls School Longview School RICA—Regional Institute for Children and Adolescents Rock Terrace School Carl Sandburg Learning Center
* Denotes schools with split articulation, i.e., some students feed into one school, while other students feed into another school in the same or different cluster.
Cluster Articulation for 2017–2018 School Year

Recommended Actions and Planning Issues • 4-5
0%
20%
40%
60%
80%
100%
120%
140%
2017ACTUAL
2018 2019 2020 2021 2022 2023
Note: Percent utilization calculated as total enrollment of schools divided by total capacity. Projected capacity factors in capital projects.
Bethesda-Chevy Chase ClusterSchool Utilizations
Elementary Schools Middle School High School
Desired Rate
BETHESDA-CHEVY CHASE CLUSTER
CLUSTER PLANNING ISSUESThe Bethesda-Chevy Chase Cluster includes the adopted Chevy Chase Lake Sector Plan that provides for up to 1,400 new, mostly multi-family residential units. Although the majority of the residential units can move forward at any time, build-out of all the residential units requires funding for the Purple Line to be secured. As with many sector plans in the county, build-out requires the redevelopment of many existing land uses in the area. The pace of construction will be market driven.
In May of 2017, the County Council approved the Bethesda Downtown Plan, which will provide for additional multi-fam-ily residential units in downtown Bethesda and require a larger percentage (15%) of affordable units in new developments.
Student enrollment at all the schools in the Bethesda-Chevy Chase Cluster has increased dramatically over the past few years and several addition projects opened at Bethesda, North Chevy Chase, Rosemary Hills, Somerset, and Westbrook elementary schools. In addition, capacity was added at Rock Creek Elementary School as part of the revitalization/expan-sion project. Silver Creek Middle School opened in September 2017, to address Grades 6–8 enrollment growth in the cluster and to allow the Grade 6 students currently enrolled at Chevy Chase and North Chevy Chase elementary schools to be reassigned to the middle school level. To address the enroll-ment growth at the high school level, a classroom addition is underway at Bethesda-Chevy Chase High School.
SCHOOLSBethesda Chevy Chase High SchoolCapital Project: Enrollment increases at the cluster elemen-tary schools and at Westland Middle School have reached the high school. An addition project is scheduled to accommo-date the space deficit with a completion date of September 2018. An FY 2017 appropriation was approved to construct the addition. An FY 2019 appropriation is recommended to install artificial turf as part of the addition project.
Silver Creek Middle SchoolCapital Project: To address enrollment increases at Westland Middle School and reassign Grade 6 students from Chevy Chase and North Chevy Chase elementary schools to the middle school level, this school opened in September 2017, with Grades 6 and 7. The Board of Education adopted the boundaries for this school on November 17, 2016. The Board of Education action is available on the MCPS website at the following link: http://gis.mcpsmd.org/boundarystudypdfs/BCCMS2_SupplementA_BCCMS2andWestlandMSBoundaries.pdf
Westland Middle SchoolPlanning Issue: Although a six-classroom addition opened in the 2009–2010 school year to accommodate the overutilization at Westland Middle School, student enrollment continued to increase beyond the capacity of the school. The opening of Silver Creek Middle School in September 2017, addressed the overutilization of the school and provided space for the reassignment of Grade 6 students from Chevy Chase and North Chevy Chase elementary school to the middle school level. The Board of Education adopted the boundaries for this school on November 17, 2016. The Board of Education action is available on the MCPS website at the following link: http://gis.mcpsmd.org/boundarystudypdfs/BCCMS2_SupplementA_BCCMS2andWestlandMSBoundaries.pdf
Bethesda Elementary SchoolPlanning Study: Projections indicate that enrollment will exceed capacity by more than 92 seats by the end of the six-year planning period. A study is recommended to explore all possible solutions to add elementary capacity at the elementary school level in the Bethesda-Chevy Chase Cluster. Enrollment will be monitored and relocatable classrooms will be utilized until a permanent solution is identified in a future CIP.
Chevy Chase Elementary SchoolNon-capital Solution: In November 2010, the Board of Education approved to reassign Grade 6 students from Chevy Chase and North Chevy Chase elementary schools to the middle school level when a new middle school opened. With the opening of Silver Creek Middle School in September 2017, the Grade 6 students were reassigned to the school.
North Chevy Chase Elementary SchoolNon-capital Solution: In November 2010, the Board of Education approved to reassign Grade 6 students from Chevy Chase and North Chevy Chase elementary schools to the middle school level when a new middle school opened. With

4-6 • Recommended Actions and Planning Issues
BETHESDA-CHEVY CHASE CLUSTER
the opening of Silver Creek Middle School in September 2017, the Grade 6 students were reassigned to the school.
Rosemary Hills Elementary SchoolCapital Project: Based on the Montgomery County Council Office of Legislative Oversight (OLO) study of the revitaliza-tion/expansion program released in July 2015, this program is under review in order to develop a multi-variable approach to determine the priority order of large-scale renovations of facilities, possibly including programmatic and capacity con-siderations. Recommendations regarding possible changes to this program will be released once the review is complete.
Somerset Elementary SchoolPlanning Study: Projections indicate that enrollment will exceed capacity by more than 92 seats by the end of the six-year planning period. A study is recommended to explore all possible solutions to add elementary capacity at the elementary school level in the Bethesda-Chevy Chase Cluster. Enrollment will be monitored and relocatable classrooms will be utilized until a permanent solution is identified in a future CIP.
CAPITAL PROJECTS
School ProjectProject Status*
Date of Completion
Bethesda-Chevy Chase HS
Classroom addition
Approved Sept. 2018
“Approved”—Project has an FY 2017 or FY 2018 appropriation approved in the Amended FY 2017–2022 CIP.“Programmed”—Project has expenditures programmed in a future year of the CIP for planning and/or construction funds.“Proposed”—Project has facility planning funds recommended for a feasibility study.“Recommended”—Project has an FY 2019 appropriation recommended for planning or construction in the FY 2019–2024 CIP.

Recommended Actions and Planning Issues • 4-7
BETHESDA-CHEVY CHASE CLUSTER
Projected Enrollment and Space AvailabilityEffects of the Recommended FY 2019–2024 CIP and Non–CIP Actions on Space Available
Actual
Schools 17–18 18–19 19–20 20–21 21–22 22–23 23–24 2027 2032Bethesda–Chevy Chase HS Program Capacity 1692 2407 2407 2407 2407 2407 2407 2407 2407
Enrollment 2103 2129 2186 2199 2321 2444 2463 2770 3130Available Space (411) 278 222 208 86 (36) (56) (363) (723)Comments Addition
Complete
Silver Creek MS Program Capacity 935 935 935 935 935 935 935 935 935Enrollment 549 893 950 996 991 960 971 1040 1100Available Space 386 42 (15) (61) (56) (25) (36) (105) (165)Comments
Westland MS Program Capacity 1089 1089 1089 1089 1089 1089 1089 1089 1089Enrollment 1038 806 810 822 833 855 832 880 920Available Space 51 283 279 267 256 234 257 209 169Comments
Bethesda ES Program Capacity 560 560 560 560 560 560 560 Grades (K–5) Enrollment 621 642 654 680 702 696 699
Available Space (61) (82) (94) (120) (142) (136) (139)Comments See text
Chevy Chase ES Program Capacity 473 473 473 473 473 473 473Grades (3–5) Enrollment 423 433 435 429 430 421 425
Paired With Available Space 50 40 38 44 43 52 48Rosemary Hills ES Comments
North Chevy Chase ES Program Capacity 358 358 358 358 358 358 358Grades (3–5) Enrollment 281 280 289 307 307 312 301
Paired With Available Space 77 78 69 51 51 46 57Rosemary Hills ES Comments
Rock Creek Forest ES CSR Program Capacity 709 709 709 709 709 709 709Enrollment 753 730 742 744 740 742 728Available Space (44) (21) (33) (35) (31) (33) (19)Comments
Rosemary Hills ES Program Capacity 661 661 661 661 661 661 661Grades (pre-K–2) Enrollment 592 578 571 547 550 566 552
Paired With Available Space 69 83 90 114 111 95 109Chevy Chase ES Comments
North Chevy Chase ES
Somerset ES Program Capacity 515 515 515 515 515 515 515Enrollment 600 589 605 595 608 621 654Available Space (85) (74) (90) (80) (93) (106) (139)Comments See text
Westbrook ES Program Capacity 537 537 537 537 537 537 537Enrollment 380 361 353 349 331 328 331Available Space 157 176 184 188 206 209 206Comments
Cluster Information HS Utilization 124% 88% 91% 91% 96% 102% 102% 115% 130%HS Enrollment 2103 2129 2186 2199 2321 2444 2463 2770 3130MS Utilization 78% 84% 87% 90% 90% 90% 89% 95% 100%MS Enrollment 1587 1699 1760 1818 1824 1815 1803 1920 2020ES Utilization 96% 95% 96% 96% 96% 97% 97% 98% 100%ES Enrollment 3650 3613 3649 3651 3668 3686 3690 3750 3820
Projections
4-8 • Recommended Actions and Planning Issues
BETHESDA-CHEVY CHASE CLUSTER
Schools Gra
des
Ser
ved
Cap
acit
y (H
S @
90%
MS@
85%
)
To
tal R
oo
ms
Sup
po
rt R
oo
ms
Reg
ular
Sec
on
dar
y @
25
Reg
ular
Ele
men
tary
@23
CSR
Gra
des
1–2
@18
Pre
–K @
20
Pre
–K @
40
HS
@20
CSR
KIN
D @
18
KIN
D @
22
ESO
L @
15
MET
S @
15
HSM
@13
ELE
M L
AD
@13
ELC
@10
LA
NG
@12
LFI
@10
SC
B @
6
AA
C@
7
AU
T @
6
BR
IDG
E @
10
DH
OH
@7
ED
@10
EX
TEN
SIO
NS
@6
GT/
LD @
13
PD
@7
PEP
@6
PEP
@12
PEP
@18
VIS
ION
(El
emen
tary
) @
7
OTH
ER
Bethesda-Chevy Chase HS 9-12 1692 76 74 1 1
Silver Creek MS 6-8 935 45 44 1
Westland MS 6-8 1089 52 51 1
Bethesda ES K-5 560 29 3 20 4 2
Chevy Chase ES 3-5 473 24 3 20 1
North Chevy Chase ES 3-5 358 21 5 15 1
Rock Creek Forest ES K-5 709 40 4 15 11 1 5 2 1 1
Rosemary Hills ES PreK-2 661 36 5 18 1 8 1 3
Somerset ES K-5 515 27 4 18 4 1
Westbrook ES K-5 537 30 4 18 2 1 3 2
County & Regional Based
Special Education Services
Sch
oo
l Bas
ed
Program Capacity Table
Quad Cluster BasedC
lust
er B
ased
(School Year 2017–2018)
Demographic Characteristics of Schools
Total Two or more Black or Mobility Schools Enrollment races % Afr. Amr. % Asian% Hispanic % White % FARMS%* ESOL%** Rate%***Bethesda-Chevy Chase HS 2103 5.8% 14.3% 4.9% 17.4% 57.3% 11.0% 5.9% 8.3%Silver Creek MS 549 5.8% 21.5% 6.6% 17.3% 48.5%Westland MS 1038 5.1% 9.8% 5.8% 14.7% 64.3% 10.8% 5.8% 8.3%Bethesda ES 621 6.6% 6.6% 15.6% 12.9% 58.3% 7.3% 12.7% 17.4%Chevy Chase ES 423 6.9% 16.3% 8.3% 12.3% 56.3% 19.7% 7.0% 7.5%North Chevy Chase ES 281 6.8% 17.8% 3.9% 13.9% 57.7% 14.9% 7.7% 7.2%Rock Creek Forest ES 753 5.4% 17.1% 5.7% 32.8% 38.5% 24.3% 13.9% 8.6%Rosemary Hills ES 592 7.1% 24.7% 5.6% 11.1% 50.8% 29.2% 17.6% 7.7%Somerset ES 600 7.8% 5.7% 8.7% 14.3% 63.2% 6.1% 15.3% 11.3%Westbrook ES 380 7.6% 2.9% 5.0% 9.5% 74.2% 1.7% 4.7% 5.4%Elementary Cluster Total 3650 6.8% 13.2% 7.9% 16.6% 55.2% 16.6% 12.6% 9.6%Elementary County Total 76590 5.3% 21.4% 14.0% 32.3% 26.6% 40.3% 23.2% 14.1%*Percent of students approved for Free and Reduced-priced Meals Program (FARMS) during the 2016–2017 school year.**Percent of English for Speakers of Other Languages (ESOL) during the 2016–2017 school year. High School students are served in regional ESOL centers.
***Mobility Rate is the number of entries plus withdrawals during the 2016–2017 school year compared to total enrollment.Notes: Native Hawaiian/Pacific Islander and American Indian/Alaskan Native categories total less than 1% and were therefore excluded from the table.Due to federal and state guidelines, demographic characteristics of schools of less than or equal to 5 students per category are reported as 0%.
2017–2018 2016–2017

Recommended Actions and Planning Issues • 4-9
BETHESDA-CHEVY CHASE CLUSTER
Year Year Total Site Reloc- Home
Facility Reopened/ Square Size Adjacent atable County SchoolSchools Opened Revitalized Footage Acres Park Classrooms Programs Model
Bethesda-Chevy Chase HS 1934 2001 308,215 16.4 8Silver Creek MS 2017 174,743 13.3Westland MS 1951 1997 146,006 25.1 6Bethesda ES 1952 1999 75,257 8.42 YesChevy Chase ES 1936 2000 70,976 3.8 1 YesNorth Chevy Chase ES 1953 1995 65,982 7.9 5 YesRock Creek Forest ES 1950 2015 98,140 8 YesRosemary Hills ES 1956 1988 86,548 6.1 YesSomerset ES 1949 2005 80,122 3.7 YesWestbrook ES 1939 1990 91,359 12.5 Yes Yes
Facility Characteristics of Schools 2017–2018

Recommended Actions and Planning Issues • 4-11
WINSTON CHURCHILL CLUSTER
SCHOOLSWinston Churchill High SchoolCapital Project: Previous projections indicated that enroll-ment would exceed capacity by 200 seats or more, therefore, an FY 2017 appropriation was approved for facility planning to determine the feasibility, scope, and cost for a capacity study. However projections now indicate enrollment at Win-ston Churchill High School will only exceed capacity by less than 50 seats by the end of the six-year planning period. The enrollment will continue to be monitored and, if needed, an addition will be considered in a future CIP. Relocatable class-rooms will be utilized until additional capacity can be added.
Potomac Elementary School Capital Project: A revitalization/expansion project is scheduled for this school with a completion date of January 2020. An FY 2018 appropriation was approved to begin the construction for the project.
CAPITAL PROJECTS
School ProjectProject Status*
Date of Completion
Potomac ES Revitalization/expansion
Approved Jan. 2020
“Approved”—Project has an FY 2017 or FY 2018 appropriation approved in the Amended FY 2017–2022 CIP.“Programmed”—Project has expenditures programmed in a future year of the CIP for planning and/or construction funds.“Proposed”—Project has facility planning funds recommended for a feasibility study.“Recommended”—Project has an FY 2019 appropriation recommended for planning or construction in the FY 2019–2024 CIP.
0%
20%
40%
60%
80%
100%
120%
2017ACTUAL
2018 2019 2020 2021 2022 2023
Note: Percent utilization calculated as total enrollment of schools divided by total capacity. Projected capacity factors in capital projects.
Winston Churchill ClusterSchool Utilizations
Elementary Schools Middle Schools High School
DesiredRate

4-12 • Recommended Actions and Planning Issues
WINSTON CHURCHILL CLUSTER
Projected Enrollment and Space AvailabilityEffects of the Recommended FY 2019–2024 CIP and Non–CIP Actions on Space Available
Actual
Schools 17–18 18–19 19–20 20–21 21–22 22–23 23–24 2027 2032Winston Churchill HS Program Capacity 1986 1986 1986 1986 1986 1986 1986 1986 1986
Enrollment 2126 2160 2147 2086 2077 2087 2031 1990 1930Available Space (140) (174) (161) (100) (91) (101) (45) (4) 56Comments
Cabin John MS Program Capacity 1092 1092 1092 1092 1092 1092 1092 1092 1092Enrollment 1005 1016 1029 1048 1031 1004 996 993 978Available Space 87 76 63 44 61 88 96 99 114Comments
Herbert Hoover MS Program Capacity 1139 1139 1139 1139 1139 1139 1139 1139 1139Enrollment 1006 970 945 912 859 790 760 670 560Available Space 133 169 194 227 280 349 379 469 579Comments
Bells Mill ES Program Capacity 626 626 626 626 626 626 626Enrollment 609 601 592 590 589 597 597Available Space 17 25 34 36 37 29 29Comments
Beverly Farms ES Program Capacity 690 690 690 690 690 690 690Enrollment 574 570 563 542 544 534 518Available Space 116 120 127 148 146 156 172Comments
Potomac ES Program Capacity 425 425 472 472 472 472 472Enrollment 444 432 427 427 425 431 427Available Space (19) (7) 45 45 47 41 45Comments @ Radnor Rev/Ex
CompleteJan. 2020
Seven Locks ES Program Capacity 425 425 425 425 425 425 425Enrollment 405 387 372 362 361 355 385Available Space 20 38 53 63 64 70 40Comments
Wayside ES Program Capacity 636 636 636 636 636 636 636Enrollment 548 509 467 447 468 448 469Available Space 88 127 169 189 168 188 167Comments
Cluster Information HS Utilization 107% 109% 108% 105% 105% 105% 102% 100% 97%HS Enrollment 2126 2160 2147 2086 2077 2087 2031 1990 1930MS Utilization 90% 89% 88% 88% 85% 80% 79% 75% 69%MS Enrollment 2011 1986 1974 1960 1890 1794 1756 1663 1538ES Utilization 92% 89% 85% 83% 84% 83% 84% 81% 78%ES Enrollment 2580 2499 2421 2368 2387 2365 2396 2305 2220
Projections
Recommended Actions and Planning Issues • 4-13
WINSTON CHURCHILL CLUSTER
Demographic Characteristics of Schools
Total Two or more Black or Mobility Schools Enrollment races % Afr. Amer. % Asian% Hispanic % White % FARMS%* ESOL%** Rate%***Winston Churchill HS 2126 5.4% 8.7% 27.7% 8.1% 50.0% 3.8% 0.5% 4.1%Cabin John MS 1005 6.1% 11.6% 31.6% 7.8% 42.8% 8.0% 3.1% 5.1%Herbert Hoover MS 1006 4.3% 7.4% 33.7% 6.6% 47.7% 2.7% 1.9% 3.8%Bells Mill ES 609 5.6% 11.0% 29.9% 9.4% 44.2% 9.8% 9.9% 7.0%Beverly Farms ES 574 7.1% 7.1% 32.1% 11.1% 42.3% 4.8% 7.4% 7.2%Potomac ES 444 6.3% 5.6% 38.1% 6.1% 43.9% 2.1% 5.7% 8.5%Seven Locks ES 405 5.9% 8.9% 21.2% 11.6% 52.1% 4.2% 8.5% 6.6%Wayside ES 548 6.4% 7.1% 46.2% 7.1% 33.2% 4.1% 8.9% 6.8%Elementary Cluster Total 2580 6.3% 8.1% 33.9% 9.1% 42.6% 5.2% 8.1% 7.2%Elementary County Total 76590 5.3% 21.4% 14.0% 32.3% 26.6% 40.3% 23.2% 14.1%*Percent of students approved for Free and Reduced-priced Meals Program (FARMS) during the 2016–2017 school year.**Percent of English for Speakers of Other Languages (ESOL) during the 2016–2017 school year. High School students are served in regional ESOL centers.
***Mobility Rate is the number of entries plus withdrawals during the 2016–2017 school year compared to total enrollment.Notes: Native Hawaiian/Pacific Islander and American Indian/Alaskan Native categories total less than 1% and were therefore excluded from the table.
Due to federal and state guidelines, demographic characteristics of schools of less than or equal to 5 students per category are reported as 0%.
2017–2018 2016–2017
Schools Gra
des
Ser
ved
Cap
acit
y (H
S @
90%
MS@
85%
)
To
tal R
oo
ms
Sup
po
rt R
oo
ms
Reg
ular
Sec
on
dar
y @
25
Reg
ular
Ele
men
tary
@23
CSR
Gra
des
1–2
@18
Pre
–K @
20
Pre
–K @
40
HS
@20
CSR
KIN
D @
18
KIN
D @
22
ESO
L @
15
MET
S @
15
HSM
@13
ELE
M L
AD
@13
ELC
@10
LA
NG
@12
LFI
@10
SC
B @
6
AA
C@
7
AU
T @
6
BR
IDG
E @
10
DH
OH
@7
ED
@10
EX
TEN
SIO
NS
@6
GT/
LD @
13
PD
@7
PEP
@6
PEP
@12
PEP
@18
VIS
ION
(El
emen
tary
) @
7
OTH
ER
Winston Churchill HS 9-12 1986 94 85 2 7
Cabin John MS 6-8 1092 57 49 3 1 4
Herbert Hoover MS 6-8 1139 56 52 4
Bells Mill ES HS-5 626 32 3 22 1 4 2
Beverly Farms ES K-5 690 35 4 26 3 2
Potomac ES K-5 425 22 3 16 2 1
Seven Locks ES K-5 425 23 4 16 2 1
Wayside ES K-5 636 35 4 22 4 3 2
Program Capacity TableSpecial Education Services
Clu
ster
Bas
ed
Quad Cluster Based County & Regional BasedSc
ho
ol B
ased
(School Year 2017–2018)
4-14 • Recommended Actions and Planning Issues
WINSTON CHURCHILL CLUSTER
Year Year Total Site Reloc- Home
Facility Reopened/ Square Size Adjacent atable County School
Schools Opened Revitalized Footage Acres Park Classrooms Programs Model
Winston Churchill HS 1964 2001 322,078 30.3Cabin John MS 1967 2011 159,514 18.2Herbert Hoover MS 1966 2013 165,367 19.1Bells Mill ES 1968 2009 77,244 9.6Beverly Farms ES 1965 2013 98,916 5 YesPotomac ES 1949 1976 57,713 9.6 3 YesSeven Locks ES 1964 2012 66,915 9.9 YesWayside ES 1969 2017 93,453 9.3
Facility Characteristics of Schools 2017–2018
Recommended Actions and Planning Issues • 4-15
CLUSTER PLANNING ISSUESPlanning Issue: The Clarksburg Master Plan allows for the development of up to 15,000 residential units. The plan includes five future elementary school sites and one future middle school site. A large number of housing units have been constructed. A new cluster of schools was formed in the 2006–2007 school year when Clarksburg High School opened to accommodate the enrollment growth from the new development. Little Ben-nett Elementary School opened in September 2006, William B. Gibbs, Jr. Elementary School opened in September 2009, and Wilson Wims Elementary School opened in September 2014. To address the enrollment growth in the cluster, a high school addition opened in September 2015, and Hallie Wells Middle School opened in September 2016. With continued growth in elementary school enrollment, another new elementary school is approved with an opening date of September 2019, and a site selection is approved to begin the planning for a another new elementary school in the future.
SCHOOLSClarksburg High SchoolPlanning Issue: Although a classroom addition opened in September 2015 to accommodate the overutilization at Clarksburg High School, stu-dent enrollment will continue to exceed capacity by over 800 students by the end of the six-year planning period. Enrollment also is projected to exceed capacity at Northwest High School by nearly 400 students. The Seneca Valley High School service area is adjacent to the Clarksburg and Northwest high school service areas. A revi-talization/expansion project of Seneca Valley High School, scheduled for completion in September 2020, will be designed and constructed with a capacity for 2,400 students. The enrollment at Seneca Valley High School is projected to be 1,499 students by the end of the six-year planning period. With a capacity of 2,400 seats, there will be approximately 900 seats available to accom-modate students from Clarksburg and Northwest high schools when the project is complete.
Planning Study: A boundary study is recom-mended to explore the reassignment of Clarksburg and Northwest high school students to Seneca Valley High School. As part of the boundary study, middle school articulation patterns in the Seneca Valley Cluster will be reviewed in order to evaluate utilizations and articulation patterns, therefore Roberto Clemente and Martin Luther King, Jr. middle schools will participate in the boundary study. The boundary study will begin in September 2018 with Board action scheduled in November 2019.
CLARKSBURG CLUSTERNeelsville Middle SchoolCapital Project: Projections indicate that enrollment at Neelsville Middle School will exceed capacity throughout the six-year planning period. In addition to the space deficit at this school, various building systems need to be addressed. A new approach to address capacity and building infrastructure is under review in order to develop a multi-variable approach to determine the priority order of large-scale renovations of facilities, possibly including programmatic and capacity con-siderations. Recommendations regarding possible changes to this program will be released once the review is complete. Relocatable classrooms will be utilized until additional capac-ity can be added.
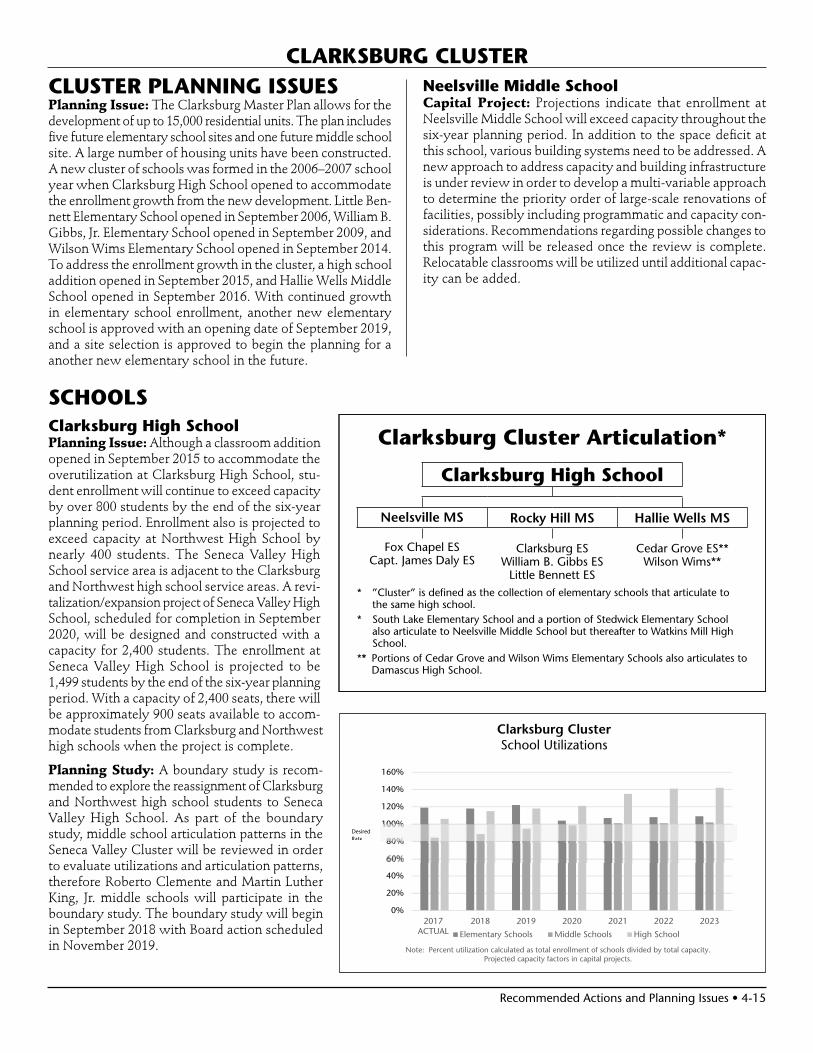
Clarksburg Cluster Articulation*
Clarksburg High School
Neelsville MS Rocky Hill MS Hallie Wells MS
Fox Chapel ESCapt. James Daly ES
Clarksburg ESWilliam B. Gibbs ES
Little Bennett ES
Cedar Grove ES**Wilson Wims**
* ”Cluster” is defined as the collection of elementary schools that articulate to the same high school.
* South Lake Elementary School and a portion of Stedwick Elementary School also articulate to Neelsville Middle School but thereafter to Watkins Mill High School.
** Portions of Cedar Grove and Wilson Wims Elementary Schools also articulates to Damascus High School.
0%
20%
40%
60%
80%
100%
120%
140%
160%
2017ACTUAL
2018 2019 2020 2021 2022 2023
Note: Percent utilization calculated as total enrollment of schools divided by total capacity. Projected capacity factors in capital projects.
Clarksburg ClusterSchool Utilizations
Elementary Schools Middle Schools High School
Desired Rate
4-16 • Recommended Actions and Planning Issues
Cedar Grove Elementary SchoolPlanning Issue: Enrollment is projected to exceed capac-ity by more than 92 seats throughout the six-year planning period. Although the opening of Wilson Wims Elementary School provided some relief, current projections indicate the need for additional elementary schools in the Clarksburg Clus-ter. Relocatable classrooms will be utilized until Clarksburg Cluster Elementary School (Clarksburg Village Site #2) and/or Clarksburg Cluster Elementary School #9 opens.
Capital Project: An FY 2018 appropriation was approved to construct Clarksburg Cluster Elementary School (Clarksburg Village Site #2). The school is scheduled to open in September 2019. An FY 2019 appropriation is recommended for planning to begin the architectural design for Clarksburg Elementary School #9 with a scheduled opening in September 2021. In order for this project to be completed on this schedule, county and state funding must be provided at the levels recommended in this CIP.
Planning Study: A boundary study is recommended for Clarksburg Cluster Elementary School (Clarksburg Village Site #2) to create the service area for the new school. The scope of the study will include Cedar Grove and Wilson Wims elementary schools. The boundary study will begin in spring 2018 with Board of Education action scheduled for November 2018.
Clarksburg Elementary School Planning Issue: Enrollment at Clarksburg Elementary School is projected to exceed capacity by more than 92 seats through-out the six-year planning period. Relocatable classrooms will be utilized until Clarksburg Elementary School #9 opens.
Capital Project: An FY 2019 appropriation is recommended for planning to begin the architectural design for Clarksburg Elementary School #9 with a scheduled opening in September 2021. In order for this project to be completed on this sched-ule, county and state funding must be provided at the levels recommended in this CIP.
Clarksburg Cluster Elementary School (Clarksburg Village Site #2)Capital Project: A new school is approved to open in September 2019 to relieve projected overutilization in the Clarksburg Cluster. An FY 2018 appropriation was approved to construct Clarksburg Cluster Elementary School (Clarksburg Village Site #2).
Planning Study: A boundary study is recommended for Clarksburg Cluster Elementary School (Clarksburg Village Site #2) to create the service area for the new school. The scope of the study will include Cedar Grove and Wilson Wims elementary schools. The boundary study will begin in spring 2018 with Board of Education action scheduled for November 2018.
CLARKSBURG CLUSTER
Clarksburg Elementary School #9Planning Issue: Enrollment continues to grow in the Clarksburg Cluster elementary schools. In order to address the growing space needs in these schools, a site selection study was approved to identify the location for a new elementary school in the cluster.
Capital Project: An FY 2018 appropriation was approved for facility planning to conduct a feasibility study to determine the scope and cost for the new school. An FY 2019 appropriation is recommended for planning to begin the architectural design for the new school with an opening in September 2021. In order for this project to remain on this schedule, county and state funding must be provided at the levels recommended in this CIP.
Capt. James E. Daly Elementary SchoolCapital Project: Previous projections indicated enrollment at Capt. James E. Daly Elementary School would exceed capac-ity by 92 seats or more by the end of the six-year planning period. An FY 2014 appropriation was approved for facility planning to determine the feasibility, scope, and cost for a classroom addition. The current space deficit, is slightly above the minimum threshold of 92 seats or more for consideration of an addition project. Therefore, enrollment will continue to be monitored for consideration of a future CIP project, with relocatable classrooms utilized in the interim.
Wilson Wims Elementary SchoolPlanning Issue: Enrollment at Wilson Wims Elementary School is projected to exceed capacity by 92 seats or more throughout the six-year period. Relocatable classrooms will be utilized until Clarksburg Cluster Elementary School (Clarks-burg Village Site #2) and/or Clarksburg Cluster Elementary School #9 opens.
Capital Project: An FY 2018 appropriation was approved to construct Clarksburg Cluster Elementary School (Clarksburg Village Site #2). The school is scheduled to open in September 2019. An FY 2019 appropriation is recommended for planning to begin the architectural design for Clarksburg Elementary School #9 with a scheduled opening in September 2021. In order for this project to be completed on this schedule, county and state funding must be provided at the levels recommended in this CIP.
Planning Study: A boundary study is recommended for Clarksburg Cluster Elementary School (Clarksburg Village Site #2) to create the service area for the new school. The scope of the study will include Cedar Grove and Wilson Wims elementary schools. The boundary study will begin in spring 2018 with Board of Education action scheduled for November 2018.
Recommended Actions and Planning Issues • 4-17
CLARKSBURG CLUSTER
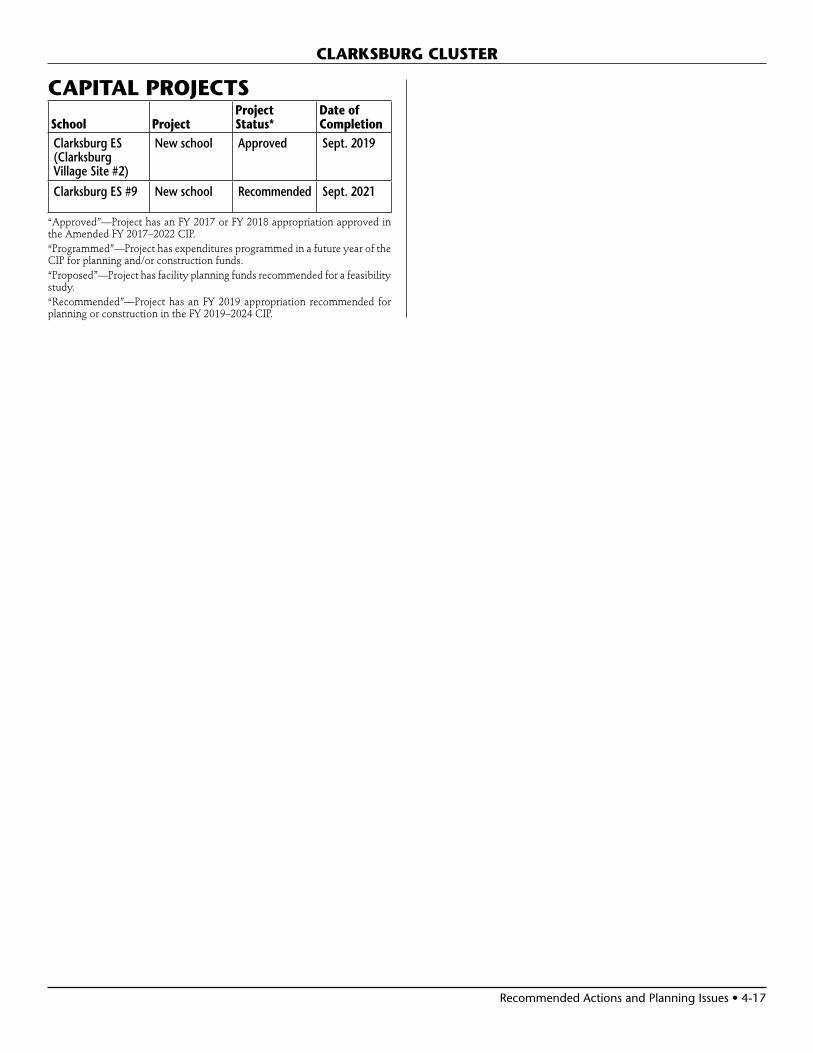
CAPITAL PROJECTS
School ProjectProject Status*
Date of Completion
Clarksburg ES (Clarksburg Village Site #2)
New school Approved Sept. 2019
Clarksburg ES #9 New school Recommended Sept. 2021
“Approved”—Project has an FY 2017 or FY 2018 appropriation approved in the Amended FY 2017–2022 CIP.“Programmed”—Project has expenditures programmed in a future year of the CIP for planning and/or construction funds.“Proposed”—Project has facility planning funds recommended for a feasibility study.“Recommended”—Project has an FY 2019 appropriation recommended for planning or construction in the FY 2019–2024 CIP.

4-18 • Recommended Actions and Planning Issues
CLARKSBURG CLUSTER
Projected Enrollment and Space AvailabilityEffects of the Recommended FY 2019–2024 CIP and Non–CIP Actions on Space Available
Actual
Schools 17–18 18–19 19–20 20–21 21–22 22–23 23–24 2027 2032Clarksburg HS Program Capacity 2034 2034 2034 2034 2034 2034 2034 2034 2034
Enrollment 2153 2334 2399 2459 2739 2858 2896 3440 4080Available Space (119) (300) (365) (425) (705) (824) (862) (1406) (2046)Comments See text
Neelsville Program Capacity 914 914 914 914 914 914 914 914 914Enrollment 926 1006 1080 1089 1081 1068 1054 1100 1130Available Space (12) (92) (166) (175) (167) (154) (140) (186) (216)Comments See text
Rocky Hill Program Capacity 1020 1020 1020 1020 1020 1020 1020 1020 1020Enrollment 804 809 838 890 899 931 969 1090 1250Available Space 216 211 182 130 121 89 51 (70) (230)Comments
Hallie Wells MS Program Capacity 982 982 982 982 982 982 982 982 982Enrollment 752 788 861 915 972 957 960 1130 1300Available Space 230 194 121 67 10 25 22 (148) (318)Comments
Cedar Grove ES Program Capacity 418 418 418 418 418 418 418Enrollment 612 609 598 590 611 622 622Available Space (194) (191) (180) (172) (193) (204) (204)Comments Boundary
Study
Clarksburg ES Program Capacity 312 312 312 312 312 312 312Enrollment 402 410 462 519 550 572 589Available Space (90) (98) (150) (207) (238) (260) (277)Comments
Clarksburg Cluster ES Program Capacity 741 741 741 741 741(Clarksburg Village #2) Enrollment 0 0 0 0 0
Available Space 741 741 741 741 741Comments Planning Opens
for newschool
Clarksburg ES #9 Program Capacity 740 740 740Enrollment 0 0 0Available Space 740 740 740Comments Planning Opens
for newschool
Capt. James E. Daly ES CSR Program Capacity 518 518 518 518 518 518 518Enrollment 615 605 615 597 598 606 616Available Space (97) (87) (97) (79) (80) (88) (98)Comments
Fox Chapel ES CSR Program Capacity 683 683 683 683 683 683 683Enrollment 620 605 620 615 613 624 626Available Space 63 78 63 68 70 59 57Comments
William B. Gibbs, Jr. ES Program Capacity 730 730 730 730 730 730 730Enrollment 705 700 708 707 756 755 754Available Space 25 30 22 23 (26) (25) (24)Comments
Little Bennett ES Program Capacity 624 624 624 624 624 624 624Enrollment 629 614 636 633 635 628 611Available Space (5) 10 (12) (9) (11) (4) 13Comments
Wilson Wims ES Program Capacity 752 752 752 752 752 752 752Enrollment 1208 1220 1273 1311 1332 1359 1399Available Space (456) (468) (521) (559) (580) (607) (647)Comments Boundary
Study
Cluster Information HS Utilization 106% 115% 118% 121% 135% 141% 142% 169% 201%HS Enrollment 2153 2334 2399 2459 2739 2858 2896 3440 4080MS Utilization 85% 89% 95% 99% 101% 101% 102% 114% 126%MS Enrollment 2482 2603 2779 2894 2952 2956 2983 3320 3680ES Utilization 119% 118% 122% 104% 92% 94% 95% 102% 110%ES Enrollment 4791 4763 4912 4972 5095 5166 5217 5610 6050
Projections
Recommended Actions and Planning Issues • 4-19
CLARKSBURG CLUSTER
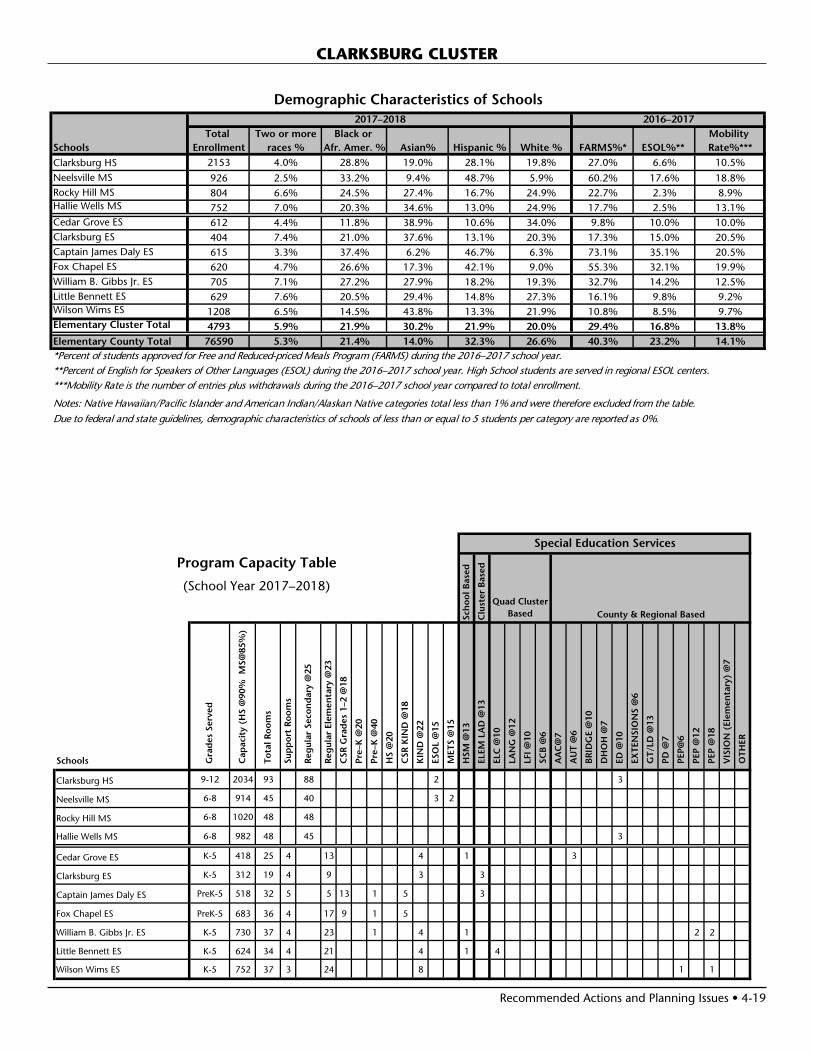
Demographic Characteristics of Schools
Total Two or more Black or Mobility Schools Enrollment races % Afr. Amer. % Asian% Hispanic % White % FARMS%* ESOL%** Rate%***Clarksburg HS 2153 4.0% 28.8% 19.0% 28.1% 19.8% 27.0% 6.6% 10.5%Neelsville MS 926 2.5% 33.2% 9.4% 48.7% 5.9% 60.2% 17.6% 18.8%Rocky Hill MS 804 6.6% 24.5% 27.4% 16.7% 24.9% 22.7% 2.3% 8.9%Hallie Wells MS 752 7.0% 20.3% 34.6% 13.0% 24.9% 17.7% 2.5% 13.1%Cedar Grove ES 612 4.4% 11.8% 38.9% 10.6% 34.0% 9.8% 10.0% 10.0%Clarksburg ES 404 7.4% 21.0% 37.6% 13.1% 20.3% 17.3% 15.0% 20.5%Captain James Daly ES 615 3.3% 37.4% 6.2% 46.7% 6.3% 73.1% 35.1% 20.5%Fox Chapel ES 620 4.7% 26.6% 17.3% 42.1% 9.0% 55.3% 32.1% 19.9%William B. Gibbs Jr. ES 705 7.1% 27.2% 27.9% 18.2% 19.3% 32.7% 14.2% 12.5%Little Bennett ES 629 7.6% 20.5% 29.4% 14.8% 27.3% 16.1% 9.8% 9.2%Wilson Wims ES 1208 6.5% 14.5% 43.8% 13.3% 21.9% 10.8% 8.5% 9.7%Elementary Cluster Total 4793 5.9% 21.9% 30.2% 21.9% 20.0% 29.4% 16.8% 13.8%Elementary County Total 76590 5.3% 21.4% 14.0% 32.3% 26.6% 40.3% 23.2% 14.1%*Percent of students approved for Free and Reduced-priced Meals Program (FARMS) during the 2016–2017 school year.**Percent of English for Speakers of Other Languages (ESOL) during the 2016–2017 school year. High School students are served in regional ESOL centers.***Mobility Rate is the number of entries plus withdrawals during the 2016–2017 school year compared to total enrollment.
Notes: Native Hawaiian/Pacific Islander and American Indian/Alaskan Native categories total less than 1% and were therefore excluded from the table.Due to federal and state guidelines, demographic characteristics of schools of less than or equal to 5 students per category are reported as 0%.
2017–2018 2016–2017
Schools Gra
des
Ser
ved
Cap
acit
y (H
S @
90%
MS@
85%
)
To
tal R
oo
ms
Sup
po
rt R
oo
ms
Reg
ular
Sec
on
dar
y @
25
Reg
ular
Ele
men
tary
@23
CSR
Gra
des
1–2
@18
Pre
–K @
20
Pre
–K @
40
HS
@20
CSR
KIN
D @
18
KIN
D @
22
ESO
L @
15
MET
S @
15
HSM
@13
ELE
M L
AD
@13
ELC
@10
LA
NG
@12
LFI
@10
SC
B @
6
AA
C@
7
AU
T @
6
BR
IDG
E @
10
DH
OH
@7
ED
@10
EX
TEN
SIO
NS
@6
GT/
LD @
13
PD
@7
PEP
@6
PEP
@12
PEP
@18
VIS
ION
(El
emen
tary
) @
7
OTH
ER
Clarksburg HS 9-12 2034 93 88 2 3
Neelsville MS 6-8 914 45 40 3 2
Rocky Hill MS 6-8 1020 48 48
Hallie Wells MS 6-8 982 48 45 3
Cedar Grove ES K-5 418 25 4 13 4 1 3
Clarksburg ES K-5 312 19 4 9 3 3
Captain James Daly ES PreK-5 518 32 5 5 13 1 5 3
Fox Chapel ES PreK-5 683 36 4 17 9 1 5
William B. Gibbs Jr. ES K-5 730 37 4 23 1 4 1 2 2
Little Bennett ES K-5 624 34 4 21 4 1 4
Wilson Wims ES K-5 752 37 3 24 8 1 1
Program Capacity TableSpecial Education Services
Clu
ster
Bas
ed
Quad Cluster Based County & Regional BasedSc
ho
ol B
ased
(School Year 2017–2018)
4-20 • Recommended Actions and Planning Issues
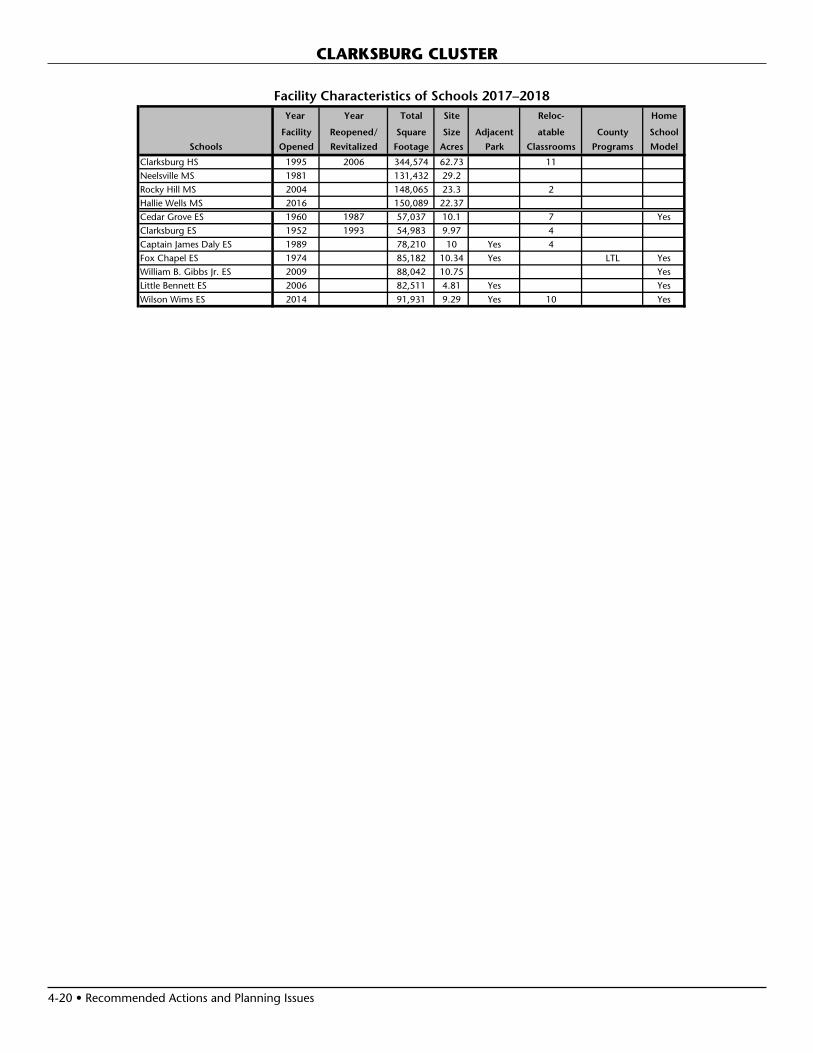
CLARKSBURG CLUSTER
Year Year Total Site Reloc- Home
Facility Reopened/ Square Size Adjacent atable County School
Schools Opened Revitalized Footage Acres Park Classrooms Programs Model
Clarksburg HS 1995 2006 344,574 62.73 11Neelsville MS 1981 131,432 29.2Rocky Hill MS 2004 148,065 23.3 2Hallie Wells MS 2016 150,089 22.37Cedar Grove ES 1960 1987 57,037 10.1 7 YesClarksburg ES 1952 1993 54,983 9.97 4Captain James Daly ES 1989 78,210 10 Yes 4Fox Chapel ES 1974 85,182 10.34 Yes LTL YesWilliam B. Gibbs Jr. ES 2009 88,042 10.75 YesLittle Bennett ES 2006 82,511 4.81 Yes Yes
Wilson Wims ES 2014 91,931 9.29 Yes 10 Yes
Facility Characteristics of Schools 2017–2018

Recommended Actions and Planning Issues • 4-21
SCHOOLSCedar Grove Elementary SchoolPlanning Issue: Enrollment is projected to exceed capac-ity by more than 92 seats throughout the six-year planning period. Although the opening of Wilson Wims Elementary School provided some relief, current projections indicate the need for additional elementary schools in the Clarksburg Clus-ter. Relocatable classrooms will be utilized until Clarksburg Cluster Elementary School (Clarksburg Village Site #2) and/or Clarksburg Cluster Elementary School #9 opens.
Capital Project: An FY 2018 appropriation was approved to construct Clarksburg Cluster Elementary School (Clarksburg Village Site #2). The school is scheduled to open in September 2019. An FY 2019 appropriation is recommended for planning to begin the architectural design for Clarksburg Elementary School #9 with a scheduled opening in September 2021. In order for this project to be completed on this schedule, county and state funding must be provided at the levels recommended in this CIP.
Planning Study: A boundary study is recom-mended for Clarksburg Cluster Elementary School (Clarksburg Village Site #2) to create the service area for the new school. The scope of the study will include Cedar Grove and Wilson Wims elementary schools. The boundary study will begin in spring 2018 with Board of Education action scheduled for November 2018.
Clarksburg Cluster Elementary School (Clarksburg Village Site #2)Capital Project: A new school is approved to open in September 2019 to relieve projected overutilization in the Clarksburg Cluster. An FY 2018 appropriation was approved to construct Clarksburg Cluster Elementary School (Clarksburg Village Site #2).
Planning Study: A boundary study is recom-mended for Clarksburg Cluster Elementary School (Clarksburg Village Site #2) to create the service area for the new school. The scope of the study will include Cedar Grove and Wilson Wims elementary schools. The boundary study will begin in spring 2018 with Board of Education action scheduled for November 2018.
Clarksburg Elementary School #9Planning Issue: Enrollment continues to grow in the Clarksburg Cluster elementary schools. In order to address the growing space needs in these schools, a site selection study was approved to identify the location for a new elementary school in the cluster.
Capital Project: An FY 2018 appropriation was approved for facility planning to conduct a feasibility study to determine the scope and cost for the new school. An FY 2019 appropriation is recommended for planning to begin the architectural design for the new school with an opening in September 2021. In order for this project to remain on this schedule, county and state funding must be provided at the levels recommended in this CIP.
Damascus Elementary SchoolCapital Project: Based on the Montgomery County Council Office of Legislative Oversight (OLO) study of the revitaliza-tion/expansion program released in July 2015, this program is under review in order to develop a multi-variable approach to determine the priority order of large-scale renovations of facilities, possibly including programmatic and capacity con-siderations. Recommendations regarding possible changes to this program will be released once the review is complete.
DAMASCUS CLUSTER
Damascus Cluster Articulation*
Damascus High School
Hallie Wells MS
Cedar Grove ES**Wilson Wims ES**
John T. Baker MS
Clearspring ESDamascus ES
Laytonsville ES***Lois P. Rockwell ES
Woodfield ES* ”Cluster” is defined as the collection of elementary schools that articulate to the
same high school. * Clarksburg Elementary School and Little Bennett Elementary School also
articulate to Rocky Hill Middle School but thereafter to Clarksburg High School.** Portions of Cedar Grove and Wilson Wims Elementary Schools articulate to
Clarksburg High School.***Most of Laytonsville Elementary School articulates to Gaithersburg Middle School
and Gaithersburg High School.
0%
20%
40%
60%
80%
100%
120%
2017ACTUAL
2018 2019 2020 2021 2022 2023
Note: Percent utilization calculated as total enrollment of schools divided by total capacity. Projected capacity factors in capital projects.
Damascus ClusterSchool Utilizations
Elementary Schools Middle Schools High School
DesiredRange

4-22 • Recommended Actions and Planning Issues
CAPITAL PROJECTS
School ProjectProject Status*
Date of Completion
Clarksburg ES (Clarksburg Village Site #2)
New school Approved Sept. 2019
Clarksburg ES #9 New school Recommended Sept. 2021
“Approved”—Project has an FY 2017 or FY 2018 appropriation approved in the Amended FY 2017–2022 CIP.“Programmed”—Project has expenditures programmed in a future year of the CIP for planning and/or construction funds.“Proposed”—Project has facility planning funds recommended for a feasibility study.“Recommended”—Project has an FY 2019 appropriation recommended for planning or construction in the FY 2019–2024 CIP.
CLARKSBURG CLUSTER

Recommended Actions and Planning Issues • 4-23
Projected Enrollment and Space AvailabilityEffects of the Recommended FY 2019–2024 CIP and Non–CIP Actions on Space Available
Actual
Schools 17–18 18–19 19–20 20–21 21–22 22–23 23–24 2027 2032Damascus HS Program Capacity 1556 1556 1556 1556 1556 1556 1556 1556 1556
Enrollment 1271 1291 1320 1345 1329 1355 1324 1370 1410Available Space 285 265 236 211 227 201 232 186 146Comments
John T. Baker MS Program Capacity 728 728 728 728 728 728 728 728 728Enrollment 872 847 820 773 775 770 760 720 680Available Space (144) (119) (92) (45) (47) (42) (32) 8 48Comments
Hallie Wells MS Program Capacity 982 982 982 982 982 982 982 982 982Enrollment 752 788 861 915 972 957 960 1130 1300Available Space 230 194 121 67 10 25 22 (148) (318)Comments
Cedar Grove ES Program Capacity 418 418 418 418 418 418 418Enrollment 612 609 598 590 611 622 622Available Space (194) (191) (180) (172) (193) (204) (204)Comments Boundary
Study
Clearspring ES Program Capacity 642 642 642 642 642 642 642Enrollment 665 681 678 680 701 662 648Available Space (23) (39) (36) (38) (59) (20) (6)Comments
Damascus ES Program Capacity 351 351 351 351 351 351 351Enrollment 331 336 339 346 343 354 382Available Space 20 15 12 5 8 (3) (31)Comments
Lois P. Rockwell ES Program Capacity 536 536 536 536 536 536 536Enrollment 470 474 474 474 473 467 468Available Space 66 62 62 62 63 69 68Comments
Woodfield ES Program Capacity 399 399 399 399 399 399 399Enrollment 328 320 305 306 300 277 282Available Space 71 79 94 93 99 122 117Comments
Cluster Information HS Utilization 82% 83% 85% 86% 85% 87% 85% 88% 91%HS Enrollment 1271 1291 1320 1345 1329 1355 1324 1370 1410MS Utilization 95% 96% 98% 99% 102% 101% 101% 108% 116%MS Enrollment 1624 1635 1681 1688 1747 1727 1720 1850 1980ES Utilization 103% 103% 102% 102% 103% 102% 102% 103% 103%ES Enrollment 2406 2420 2394 2396 2428 2382 2402 2410 2410
Projections
DAMASCUS CLUSTER
4-24 • Recommended Actions and Planning Issues
DAMASCUS CLUSTER
Demographic Characteristics of Schools
Total Two or more Black or Mobility Schools Enrollment races % Afr. Amer. % Asian% Hispanic % White % FARMS%* ESOL%** Rate%***Damascus HS 1271 4.9% 11.4% 8.6% 18.8% 55.7% 15.2% 0.8% 6.3%John T Baker MS 872 5.2% 12.2% 6.2% 25.1% 51.0% 19.8% 3.7% 6.5%Hallie Wells MS 752 7.0% 20.3% 34.6% 13.0% 24.9% 17.7% 2.5% 13.1%Cedar Grove ES 612 4.4% 11.8% 38.9% 10.6% 34.0% 9.8% 10.0% 10.0%Clearspring ES 666 9.0% 21.3% 13.2% 20.4% 35.7% 29.2% 8.3% 8.5%Damascus ES 331 6.9% 6.3% 3.0% 30.2% 53.2% 25.9% 18.8% 13.8%Lois P. Rockwell ES 470 5.3% 12.1% 10.9% 23.8% 47.4% 19.8% 11.1% 5.7%Woodfield ES 328 7.0% 7.6% 6.7% 22.6% 55.8% 20.2% 8.0% 6.6%Elementary Cluster Total 2407 6.6% 13.2% 17.0% 20.2% 42.7% 20.4% 10.6% 8.9%Elementary County Total 76590 5.3% 21.4% 14.0% 32.3% 26.6% 40.3% 23.2% 14.1%*Percent of students approved for Free and Reduced-priced Meals Program (FARMS) during the 2016–2017 school year.**Percent of English for Speakers of Other Languages (ESOL) during the 2016–2017 school year. High School students are served in regional ESOL centers.***Mobility Rate is the number of entries plus withdrawals during the 2016–2017 school year compared to total enrollment.
Notes: Native Hawaiian/Pacific Islander and American Indian/Alaskan Native categories total less than 1% and were therefore excluded from the table.
Due to federal and state guidelines, demographic characteristics of schools of less than or equal to 5 students per category are reported as 0%.
2017–2018 2016–2017
Schools Gra
des
Ser
ved
Cap
acit
y (H
S @
90%
MS@
85%
)
To
tal R
oo
ms
Sup
po
rt R
oo
ms
Reg
ular
Sec
on
dar
y @
25
Reg
ular
Ele
men
tary
@23
CSR
Gra
des
1–2
@18
Pre
–K @
20
Pre
–K @
40
HS
@20
CSR
KIN
D @
18
KIN
D @
22
ESO
L @
15
MET
S @
15
HSM
@13
ELE
M L
AD
@13
ELC
@10
LA
NG
@12
LFI
@10
SC
B @
6
AA
C@
7
AU
T @
6
BR
IDG
E @
10
DH
OH
@7
ED
@10
EX
TEN
SIO
NS
@6
GT/
LD @
13
PD
@7
PEP
@6
PEP
@12
PEP
@18
VIS
ION
(El
emen
tary
) @
7
OTH
ER
Damascus HS 9-12 1556 74 67 3 4
John T Baker MS 6-8 728 37 33 2 2
Hallie Wells MS 6-8 982 48 45 3
Cedar Grove ES K-5 418 25 4 13 4 1 3
Clearspring ES HS-5 642 34 3 21 1 1 3 1 4
Damascus ES K-5 351 21 3 12 2 1 3
Lois P. Rockwell ES K-5 536 29 4 17 3 1 1 3
Woodfield ES K-5 399 24 3 12 2 1 3 1 2
Program Capacity TableSpecial Education Services
Sch
oo
l Bas
ed
Clu
ster
Bas
ed
Quad Cluster Based County & Regional Based
(School Year 2017–2018)

Recommended Actions and Planning Issues • 4-25
DAMASCUS CLUSTER
Year Year Total Site Reloc- Home
Facility Reopened/ Square Size Adjacent atable County School
Schools Opened Revitalized Footage Acres Park Classrooms Programs Model
Damascus HS 1950 1978 235,986 32.7John T Baker MS 1971 120,532 22 YesHallie Wells MS 2016 150,089 22.37Cedar Grove ES 1960 1987 57,037 10.1 7 YesClearspring ES 1988 77,535 10 Yes YesDamascus ES 1934 1980 53,239 9.4 YesLois P. Rockwell ES 1992 75,520 10.6 YesWoodfield ES 1962 1985 53,212 10 Yes
Facility Characteristics of Schools 2017–2018
Recommended Actions and Planning Issues • 4-27
DOWNCOUNTY CONSORTIUM
CONSORTIUM PLANNING ISSUESThe Downcounty Consortium provides a program delivery model for five high schools in the Silver Spring and Whea-ton areas. Students living in this area of the county are able to choose which school they wish to attend from five high schools, based on different academy programs offered at each high schools. The Downcounty Consortium choice programs are offered at Montgomery Blair, Albert Einstein, John F. Kennedy, Northwood, and Wheaton high schools. Choice patterns are monitored for the impact on projected enrollment and facility utilization.
Elementary and secondary school service area maps are in-cluded in Appendix Y for the five consortium high schools. The articulation patterns for the schools are shown on pages 4-3 and 4-4. Students that reside in a base area are guaranteed to attend the high school located serving that base area, if it is their first choice.
The Middle Schools Magnet Consortium (MSMC) includes three middle schools—Argyle, A. Mario Loiederman, and Parkland middle schools. The programs at these schools are open to all middle school students in the county.
Planning Issue: The Downcounty Consortium includes three recent land-use plans that will add a large number of multi-family housing units in the future. The Wheaton CBD and Vicinity Sector Plan, adopted in 2012, provides for up to 7,060 mostly multi-family residential units. The majority of these housing units require the redevelopment of the West-field Wheaton Mall. The 2013 adopted Glenmont Sector Plan provides for up to 5,800 mostly multi-family residential units. A future elementary school site is included in the Glenmont Sector Plan. This plan requires the redevelopment of existing land uses, including the Glenmont Shopping Center, to achieve build-out density. The 2013 adopted Long Branch Sector Plan provides for approximately 5,000 mostly multi-family residential units. This plan requires the redevelopment of existing land uses and funding for the Purple Line to achieve build-out density. It is anticipated that each of these plans will take 20 to 30 years to build-out, and the pace of construction will be market driven. Other land-use plans that will impact the cluster include the forthcoming Greater Lyttonsville and White Flint 2 Sector Plans, which have yet to be adopted.
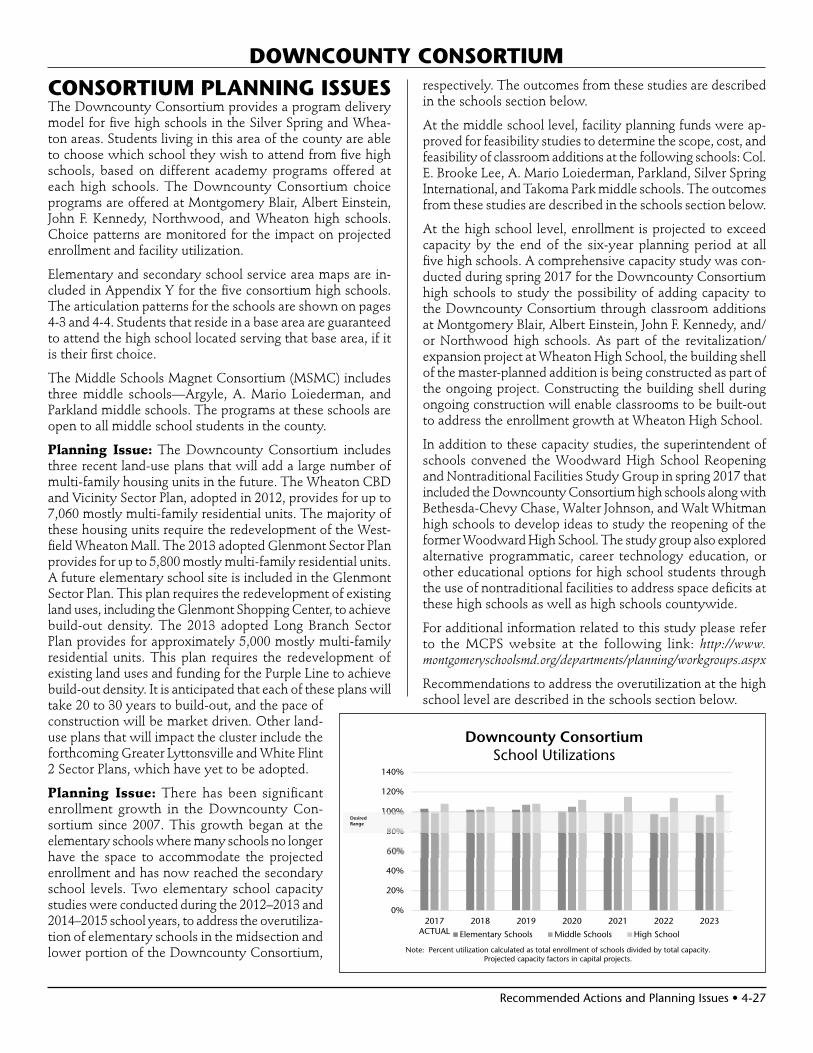
Planning Issue: There has been significant enrollment growth in the Downcounty Con-sortium since 2007. This growth began at the elementary schools where many schools no longer have the space to accommodate the projected enrollment and has now reached the secondary school levels. Two elementary school capacity studies were conducted during the 2012–2013 and 2014–2015 school years, to address the overutiliza-tion of elementary schools in the midsection and lower portion of the Downcounty Consortium,
respectively. The outcomes from these studies are described in the schools section below.
At the middle school level, facility planning funds were ap-proved for feasibility studies to determine the scope, cost, and feasibility of classroom additions at the following schools: Col. E. Brooke Lee, A. Mario Loiederman, Parkland, Silver Spring International, and Takoma Park middle schools. The outcomes from these studies are described in the schools section below.
At the high school level, enrollment is projected to exceed capacity by the end of the six-year planning period at all five high schools. A comprehensive capacity study was con-ducted during spring 2017 for the Downcounty Consortium high schools to study the possibility of adding capacity to the Downcounty Consortium through classroom additions at Montgomery Blair, Albert Einstein, John F. Kennedy, and/or Northwood high schools. As part of the revitalization/expansion project at Wheaton High School, the building shell of the master-planned addition is being constructed as part of the ongoing project. Constructing the building shell during ongoing construction will enable classrooms to be built-out to address the enrollment growth at Wheaton High School.
In addition to these capacity studies, the superintendent of schools convened the Woodward High School Reopening and Nontraditional Facilities Study Group in spring 2017 that included the Downcounty Consortium high schools along with Bethesda-Chevy Chase, Walter Johnson, and Walt Whitman high schools to develop ideas to study the reopening of the former Woodward High School. The study group also explored alternative programmatic, career technology education, or other educational options for high school students through the use of nontraditional facilities to address space deficits at these high schools as well as high schools countywide.
For additional information related to this study please refer to the MCPS website at the following link: http://www.montgomeryschoolsmd.org/departments/planning/workgroups.aspx
Recommendations to address the overutilization at the high school level are described in the schools section below.
0%
20%
40%
60%
80%
100%
120%
140%
2017ACTUAL
2018 2019 2020 2021 2022 2023
Note: Percent utilization calculated as total enrollment of schools divided by total capacity. Projected capacity factors in capital projects.
Downcounty ConsortiumSchool Utilizations
Elementary Schools Middle Schools High School
DesiredRange

4-28 • Recommended Actions and Planning Issues
Flora M. Singer ES
DOWNCOUNTY CONSORTIUM
SCHOOLSMontgomery Blair High SchoolPlanning Study: There are urgent space needs in the Downcounty Consortium high schools. To address these space needs, a capacity study was conducted to study the possibility of adding space through classroom additions at Montgomery Blair, Albert Einstein, John F. Kennedy, and/or Northwood high schools. As part of the revitalization/expansion project at Wheaton High School, the build out of the master planned classroom shell was approved with a completion date of September 2018. In addition to these capacity studies, the superintendent of schools convened the Woodward High School Reopening and Nontraditional Facilities Study Group in spring 2017 that included the Downcounty Consortium high schools along with Bethesda-Chevy Chase, Walter Johnson, and Walt Whitman high schools to develop ideas to study the reopening of the former Woodward High School. The study group also explored alternative programmatic, career technology education, or other educational options for high school students through the use of nontraditional facilities to address space deficits at these high schools as well as high schools countywide. For additional information related to this study please refer to the MCPS website at the following link: http://www.montgomeryschoolsmd.org/departments/planning/workgroups.aspx
Capital Project: To address the urgent space needs in the Downcounty Consortium high schools, expenditures are recommended to construct additional capacity and provide the instructional support spaces needed for 2,700 students at Northwood High School. Therefore, an FY 2019 appropriation is recommended to begin this project. Additionally, expendi-tures are recommended to reopen Woodward High School to address the remaining space deficits in the Downcounty Consortium high schools and Walter Johnson High School. An
FY 2019 appropriation is recommended for planning funds to reopen Woodward High School. The current Woodward High School facility is significantly smaller than the proposed 2,700 student capacity. An addition, as the first phase of the project, is recommended to provide some of the needed capacity and for flexibility during construction. An FY 2019 appropriation is recommended for planning and construction funds for the first phase. Once planning is complete, recommendations will be included in the next full CIP regarding the phasing and completion dates for both high school projects.
Albert Einstein High SchoolPlanning Study: There are urgent space needs in the Downcounty Consortium high schools. To address these space needs, a capacity study was conducted to study the possibility of adding space through classroom additions at Montgomery Blair, Albert Einstein, John F. Kennedy, and/or Northwood high schools. As part of the revitalization/expansion project at Wheaton High School, the build out of the master planned classroom shell is approved with a completion date of September 2018. In addition to these capacity studies, the superintendent of schools convened the Woodward High School Reopening and Nontraditional Facilities Study Group in spring 2017 that included the Downcounty Consortium high schools along with Bethesda-Chevy Chase, Walter Johnson, and Walt Whitman high schools to develop ideas to study the reopening of the former Woodward High School. The study group also explored alternative programmatic, career technology education, or other educational options for high school students through the use of nontraditional facilities to address space deficits at these high schools as well as high schools countywide. For additional information related to this study please refer to the MCPS website at the following link: http://www.montgomeryschoolsmd.org/departments/planning/workgroups.aspx
Recommended Actions and Planning Issues • 4-29
DOWNCOUNTY CONSORTIUM
Capital Project: To address the urgent space needs in the Downcounty Consortium high schools, expenditures are recommended to construct additional capacity and provide the instructional support spaces needed for 2,700 students at Northwood High School. Therefore, an FY 2019 appropriation is recommended to begin this project. Additionally, expen-ditures are recommended to reopen Woodward High School to address the remaining space deficits in the Downcounty Consortium high schools and Walter Johnson High School. An FY 2019 appropriation is recommended for planning funds to reopen Woodward High School. The current Woodward High School facility is significantly smaller than the proposed 2,700 student capacity. An addition, as the first phase of the project, is recommended to provide some of the needed capacity and for flexibility during construction. An FY 2019 appropriation is recommended for planning and construction funds for the first phase. Once planning is complete, recommendations will be included in the next full CIP regarding the phasing and completion dates for both high school projects.
John F. Kennedy High SchoolPlanning Study: There are urgent space needs in the Downcounty Consortium high schools. To address these space needs, a capacity study was conducted to study the possibility of adding space through classroom additions at Montgomery Blair, Albert Einstein, John F. Kennedy, and/or Northwood high schools. As part of the revitalization/expansion project at Wheaton High School, the build out of the master planned classroom shell is approved with a completion date of September 2018. In addition to these capacity studies, the superintendent of schools convened the Woodward High School Reopening and Nontraditional Facilities Study Group in spring 2017 that included the Downcounty Consortium high schools along with Bethesda-Chevy Chase, Walter Johnson, and Walt Whitman high schools to develop ideas to study the reopening of the former Woodward High School. The study group also explored alternative programmatic, career technology education, or other educational options for high school students through the use of nontraditional facilities to address space deficits at these high schools as well as high schools countywide. For additional information related to this study please refer to the MCPS website at the following link: http://www.montgomeryschoolsmd.org/departments/planning/workgroups.aspx
Capital Project: To address the urgent space needs in the Downcounty Consortium high schools, expenditures are recommended to construct additional capacity and provide the instructional support spaces needed for 2,700 students at Northwood High School. Therefore, an FY 2019 appropriation is recommended to begin this project. Additionally, expen-ditures are recommended to reopen Woodward High School to address the remaining space deficits in the Downcounty Consortium high schools and Walter Johnson High School. An FY 2019 appropriation is recommended for planning funds to reopen Woodward High School. The current Woodward High
School facility is significantly smaller than the proposed 2,700 student capacity. An addition, as the first phase of the project, is recommended to provide some of the needed capacity and for flexibility during construction. An FY 2019 appropriation is recommended for planning and construction funds for the first phase. Once planning is complete, recommendations will be included in the next full CIP regarding the phasing and completion dates for both high school projects.
Capital Project: To provide capacity in the Downcounty Consortium, an addition is recommended for John F. Ken-nedy High School. An FY 2019 appropriation for planning funds is recommended to begin the architectural design for an addition project. The recommended completion date is September 2022. In order for this project to be completed on this schedule, county and state funding must be provided at the levels recommended in this CIP.
Northwood High SchoolPlanning Study: There are urgent space needs in the Downcounty Consortium high schools. To address these space needs, a capacity study was conducted to study the possibility of adding space through classroom additions at Montgomery Blair, Albert Einstein, John F. Kennedy, and/or Northwood high schools. As part of the revitalization/expansion project at Wheaton High School, the build out of the master planned classroom shell is approved with a completion date of September 2018. In addition to these capacity studies, the superintendent of schools convened the Woodward High School Reopening and Nontraditional Facilities Study Group in spring 2017 that included the Downcounty Consortium high schools along with Bethesda-Chevy Chase, Walter Johnson, and Walt Whitman high schools to develop ideas to study the reopening of the former Woodward High School. The study group also explored alternative programmatic, career technology education, or other educational options for high school students through the use of nontraditional facilities to address space deficits at these high schools as well as high schools countywide. For additional information related to this study please refer to the MCPS website at the following link: http://www.montgomeryschoolsmd.org/departments/planning/workgroups.aspx
Capital Project: To address the urgent space needs in the Downcounty Consortium high schools, expenditures are recommended to construct additional capacity and provide the instructional support spaces needed for 2,700 students at Northwood High School. Therefore, an FY 2019 appropriation is recommended to begin this project. Additionally, expendi-tures are recommended to reopen Woodward High School to address the remaining space deficits in the Downcounty Consortium high schools and Walter Johnson High School. An FY 2019 appropriation is recommended for planning funds to reopen Woodward High School. The current Woodward High School facility is significantly smaller than the proposed 2,700 student capacity. An addition, as the first phase of the project,

4-30 • Recommended Actions and Planning Issues
DOWNCOUNTY CONSORTIUM
is recommended to provide some of the needed capacity and for flexibility during construction. An FY 2019 appropriation is recommended for planning and construction funds for the first phase. Once planning is complete, recommendations will be included in the next full CIP regarding the phasing and completion dates for both high school projects.
Wheaton High SchoolPlanning Study: Wheaton High School and Thomas Edison High School of Technology (TEHST) are located on the same site and shared one facility. Two major planning studies were conducted to prepare for the revitalization/expansion projects of these schools. During the fall and winter 2010–2011, a round-table discussion group, with broad stakeholder involvement, met to explore various approaches for the future relationship between the two schools. Following the Roundtable review, the Board of Education took action on March 28, 2011, to keep the two schools separate with distinct identities and directed staff to conduct a feasibility study to review two options—a one-building option and a two-building option. At the conclusion of the feasibility study on September 13, 2011, the Board of Education adopted a two-building option for the revitalization/expansion projects of Wheaton High School and Thomas Edison High School of Technology.
Capital Project: An FY 2014 appropriation for construction funds was approved to construct the replacement facility for Wheaton High School. The Wheaton High School facility was completed in January 2016 while the Thomas Edison High School of Technology facility is scheduled for completion in September 2018 and restoration of the site is scheduled for completion in September 2019. In order to address the projected enrollment at Wheaton High School, an FY 2017 appropriation was approved to build out of the master planned classroom shell with a completion date of September 2018.
Planning Study: There are urgent space needs in the Downcounty Consortium high schools. To address these space needs, a capacity study was conducted to study the possibility of adding space through classroom additions at Montgomery Blair, Albert Einstein, John F. Kennedy, and/or Northwood high schools. In addition to these capacity studies, the superintendent of schools convened the Woodward High School Reopening and Nontraditional Facilities Study Group in spring 2017 that included the Downcounty Consortium high schools along with Bethesda-Chevy Chase, Walter Johnson, and Walt Whitman high schools to develop ideas to study the reopening of the former Woodward High School. The study group also explored alternative programmatic, career technology education, or other educational options for high school students through the use of nontraditional facilities to address space deficits at these high schools as well as high schools countywide. For additional information related to this study please refer to the MCPS website at the following link: http://www.montgomeryschoolsmd.org/departments/planning/workgroups.aspx
Eastern Middle SchoolCapital Project: Based on the Montgomery County Council Office of Legislative Oversight (OLO) study of the revitaliza-tion/expansion program released in July 2015, this program is under review in order to develop a multi-variable approach to determine the priority order of large-scale renovations of facilities, possibly including programmatic and capacity con-siderations. Recommendations regarding possible changes to this program will be released once the review is complete.
Col. E. Brooke Lee Middle SchoolCapital Project: Projections indicate enrollment at Col. E. Brooke Lee Middle School will exceed capacity by 150 seats or more by the end of the six-year period. Therefore expenditures are recommended to address the overutilization at this school, as well as to address the building systems to accommodate a 1,200 student capacity. An FY 2019 appropriation for planning funds is recommended to begin the architectural design for this project with a scheduled completion of September 2021. Relocatable classrooms will be utilized until additional capac-ity can be added. In order for this project to be completed on this schedule, county and state funding must be provided at the levels recommended in this CIP.
A. Mario Loiederman Middle SchoolCapital Project: Previous projections indicated enrollment at A. Mario Loiederman Middle School would exceed capac-ity by 150 seats or more by the end of the six-year planning period, therefore, an FY 2014 appropriation was approved for facility planning to determine the feasibility, scope, and cost for a classroom addition. The current space deficit, however, does not meet the minimum threshold of 150 seats or more for consideration of an addition project. Therefore, enrollment will continue to be monitored and relocatable classrooms will be utilized.
Capital Project: An FY 2019 appropriation is recommended as part of the Building Modifications and Program Improve-ments Program to provide a black box theater to support the Creative and Performing Arts Magnet program.
Parkland Middle SchoolCapital Project: Projections indicate that enrollment at Parkland Middle School will exceed capacity by 150 seats or more by the end of the six-year planning period. An FY 2019 appropriation for planning funds is recommended to begin the architectural design for an addition project. The recommended completion date is September 2021. Relocatable classrooms will be utilized until additional capacity can be added. In order for this project to be completed on this schedule, county and state funding must be provided at the levels recommended in this CIP.
Recommended Actions and Planning Issues • 4-31
Silver Spring International Middle SchoolCapital Project: Projections indicate that enrollment at Silver Spring International Middle School is increasing and will exceed capacity throughout the six-year planning period. In addition to the enrollment growth, the gymnasiums and locker rooms are located in a separate building, down a steep hill, which impacts the accessibility and administra-tion of the physical education program at the school. Also, the construction of the Purple Line will impact the school site and outdoor programmatic spaces that will need to be addressed. Therefore, an FY 2019 appropriation for planning funds is recommended to begin the architectural design for this project. The recommended completion date is September 2022. Relocatable classrooms will be utilized until additional capacity can be added. In order for this project to be completed on this schedule, county and state funding must be provided at the levels recommended in this CIP.
Takoma Park Middle SchoolCapital Project: An addition project is approved for this school with a completion date of September 2020. An FY 2019 appropriation is recommended to construct the addition proj-ect. Relocatable classrooms will be utilized until additional capacity can be added. In order for this project to be completed on this schedule, county and state funding must be provided at the levels recommended in this CIP.
East Silver Spring Elementary SchoolPlanning Study: A comprehensive capacity study to address overutilization at several elementary schools in the lower sec-tion of the Downcounty Consortium was conducted during the 2014–2015 school year. This capacity study included the following schools: East Silver Spring, Forest Knolls, Highland View, Montgomery Knolls, New Hampshire Estates, Oak View, Takoma Park, Pine Crest, Piney Branch, Rolling Terrace, Sligo Creek, and Woodlin elementary schools. As a result of the capacity study, the Board of Education approved several addition projects. The Board of Education also approved a feasibility study to explore the possibility of opening an elementary school in the Downcounty Consortium to address the space deficits at these elementary schools. Based on the outcome of an internal staff review and evaluation for a new elementary school, on August 31, 2017, the Board of Educa-tion authorized that a site selection committee be formed to evaluate potential elementary school sites in the lower portion of the Downcounty Consortium. The site selection process will begin fall 2017, with Board of Education action in March 2018. The adopted CIP includes funding for five elementary school addition projects and, at this time, those projects will continue based on the approved schedule.
Capital Project: As a result of the capacity study, the Board of Education approved an addition project at East Silver Spring Elementary School to relieve overutilization at Rolling Terrace Elementary School. The recommended CIP will continue to reflect the approved schedule for this project, including an
DOWNCOUNTY CONSORTIUM
FY 2019 appropriation to begin the architectural design for the addition project, pending the outcome of the elementary school site selection process. Any adjustments to the project will be recommended once the site selection process is complete.
Forest Knolls Elementary SchoolPlanning Study: A comprehensive capacity study to address overutilization at several elementary schools in the lower sec-tion of the Downcounty Consortium was conducted during the 2014–2015 school year. This capacity study included the following schools: East Silver Spring, Forest Knolls, Highland View, Montgomery Knolls, New Hampshire Estates, Oak View, Takoma Park, Pine Crest, Piney Branch, Rolling Terrace, Sligo Creek, and Woodlin elementary schools. As a result of the capacity study, the Board of Education approved several addition projects. The Board of Education also approved a feasibility study to explore the possibility of opening an elementary school in the Downcounty Consortium to address the space deficits at these elementary schools. Based on the outcome of an internal staff review and evaluation for a new elementary school, on August 31, 2017, the Board of Educa-tion authorized that a site selection committee be formed to evaluate potential elementary school sites in the lower portion of the Downcounty Consortium. The site selection process will begin fall 2017, with Board of Education action in March 2018. The adopted CIP includes funding for five elementary school addition projects and, at this time, those projects will continue based on the approved schedule.
Capital Project: As a result of the capacity study, the Board of Education approved an addition project at East Silver Spring Elementary School to relieve overutilization at Rolling Terrace Elementary School. The recommended CIP will continue to reflect the approved schedule for this project, including an FY 2019 appropriation to begin the architectural design for the addition project, pending the outcome of the elementary school site selection process. Any adjustments to the project will be recommended once the site selection process is complete.
Highland Elementary SchoolPlanning Study: A boundary study was conducted in fall 2016 to explore the possible reassignment of the area of Highland Elementary School, currently assigned to Sligo Middle School to Newport Middle School. Representatives from Highland Elementary School and Newport Mill and Sligo middle schools participated in the boundary study. The Board of Education took action to reassign the area from Sligo Middle School to Newport Middle School on March 30, 2017. The Board of Education action is available on the MCPS website on the following link: http://gis.mcpsmd.org/boundarystudypdfs/HighlandGreensheet.pdf
4-32 • Recommended Actions and Planning Issues
DOWNCOUNTY CONSORTIUM
Highland View Elementary SchoolPlanning Study: A comprehensive capacity study to address overutilization at several elementary schools in the lower sec-tion of the Downcounty Consortium was conducted during the 2014–2015 school year. This capacity study included the following schools: East Silver Spring, Forest Knolls, Highland View, Montgomery Knolls, New Hampshire Estates, Oak View, Takoma Park, Pine Crest, Piney Branch, Rolling Terrace, Sligo Creek, and Woodlin elementary schools. As a result of the capacity study, the Board of Education approved several addition projects. The Board of Education also approved a feasibility study to explore the possibility of opening an elementary school in the Downcounty Consortium to address the space deficits at these elementary schools. Based on the outcome of an internal staff review and evaluation for a new elementary school, on August 31, 2017, the Board of Educa-tion authorized that a site selection committee be formed to evaluate potential elementary school sites in the lower portion of the Downcounty Consortium. The site selection process will begin fall 2017, with Board of Education action in March 2018. The adopted CIP includes funding for five elementary school addition projects and, at this time, those projects will continue based on the approved schedule.
Capital Project: A feasibility study for a classroom addition was conducted in FY 2010. Projections indicate that enrollment at Highland View Elementary School will exceed capacity throughout the six-year planning period. As indicated above, the Board of Education approved a site selection process to evaluate potential elementary school sites in the lower portion of the Downcounty Consortium. Therefore, at this time, no funds are recommended for an addition project until the site selection process is complete. Relocatable classrooms will be utilized to accommodate the enrollment.
Montgomery Knolls Elementary SchoolPlanning Study: A comprehensive capacity study to address overutilization at several elementary schools in the lower sec-tion of the Downcounty Consortium was conducted during the 2014–2015 school year. This capacity study included the following schools: East Silver Spring, Forest Knolls, Highland View, Montgomery Knolls, New Hampshire Estates, Oak View, Takoma Park, Pine Crest, Piney Branch, Rolling Terrace, Sligo Creek, and Woodlin elementary schools. As a result of the capacity study, the Board of Education approved several addition projects. The Board of Education also approved a feasibility study to explore the possibility of opening an elementary school in the Downcounty Consortium to address the space deficits at these elementary schools. Based on the outcome of an internal staff review and evaluation for a new elementary school, on August 31, 2017, the Board of Educa-tion authorized that a site selection committee be formed to evaluate potential elementary school sites in the lower portion of the Downcounty Consortium. The site selection process will begin fall 2017, with Board of Education action in March 2018. The adopted CIP includes funding for five elementary
school addition projects and, at this time, those projects will continue based on the approved schedule.
Capital Project: As a result of the capacity study, the Board of Education approved an addition project at East Silver Spring Elementary School to relieve overutilization at Rolling Terrace Elementary School. The recommended CIP will continue to reflect the approved schedule for this project, including an FY 2019 appropriation to begin the architectural design for the addition project, pending the outcome of the elementary school site selection process. Any adjustments to the project will be recommended once the site selection process is complete.
Pine Crest Elementary SchoolPlanning Study: A comprehensive capacity study to address overutilization at several elementary schools in the lower sec-tion of the Downcounty Consortium was conducted during the 2014–2015 school year. This capacity study included the following schools: East Silver Spring, Forest Knolls, Highland View, Montgomery Knolls, New Hampshire Estates, Oak View, Takoma Park, Pine Crest, Piney Branch, Rolling Terrace, Sligo Creek, and Woodlin elementary schools. As a result of the capacity study, the Board of Education approved several addition projects. The Board of Education also approved a feasibility study to explore the possibility of opening an elementary school in the Downcounty Consortium to address the space deficits at these elementary schools. Based on the outcome of an internal staff review and evaluation for a new elementary school, on August 31, 2017, the Board of Educa-tion authorized that a site selection committee be formed to evaluate potential elementary school sites in the lower portion of the Downcounty Consortium. The site selection process will begin fall 2017, with Board of Education action in March 2018. The adopted CIP includes funding for five elementary school addition projects and, at this time, those projects will continue based on the approved schedule.
Capital Project: As a result of the capacity study, the Board of Education approved an addition project at East Silver Spring Elementary School to relieve overutilization at Rolling Terrace Elementary School. The recommended CIP will continue to reflect the approved schedule for this project, including an FY 2019 appropriation to begin the architectural design for the addition project, pending the outcome of the elementary school site selection process. Any adjustments to the project will be recommended once the site selection process is complete.
Piney Branch Elementary SchoolPlanning Study: A comprehensive capacity study to address overutilization at several elementary schools in the lower sec-tion of the Downcounty Consortium was conducted during the 2014–2015 school year. This capacity study included the following schools: East Silver Spring, Forest Knolls, Highland View, Montgomery Knolls, New Hampshire Estates, Oak View, Takoma Park, Pine Crest, Piney Branch, Rolling Terrace, Sligo Creek, and Woodlin elementary schools. As a result of

Recommended Actions and Planning Issues • 4-33
the capacity study, the Board of Education approved several addition projects. The Board of Education also approved a feasibility study to explore the possibility of opening an elementary school in the Downcounty Consortium to address the space deficits at these elementary schools. Based on the outcome of an internal staff review and evaluation for a new elementary school, on August 31, 2017, the Board of Educa-tion authorized that a site selection committee be formed to evaluate potential elementary school sites in the lower portion of the Downcounty Consortium. The site selection process will begin fall 2017, with Board of Education action in March 2018. The adopted CIP includes funding for five elementary school addition projects and, at this time, those projects will continue based on the approved schedule.
Capital Project: Piney Branch Elementary School is located on the smallest site in the county at 1.9 acres and there is little to no room for relocatable classrooms to accommodate over-utilization at the school. To address the current and projected overutilization at the school, an addition project was approved at Piney Branch Elementary School with a completion date of September 2021. An FY 2017 appropriation for facility planning was approved to conduct a feasibility study to determine the feasibility, scope and cost of the project. An FY 2019 appro-priation is recommended to begin the architectural design for an addition project. The recommended completion date is September 2021. In order for this project to be completed on this schedule, county and state funding must be provided at the levels recommended in this CIP.
Rolling Terrace Elementary SchoolPlanning Study: A comprehensive capacity study to address overutilization at several elementary schools in the lower sec-tion of the Downcounty Consortium was conducted during the 2014–2015 school year. This capacity study included the following schools: East Silver Spring, Forest Knolls, Highland View, Montgomery Knolls, New Hampshire Estates, Oak View, Takoma Park, Pine Crest, Piney Branch, Rolling Terrace, Sligo Creek, and Woodlin elementary schools. As a result of the capacity study, the Board of Education approved several addition projects. The Board of Education also approved a feasibility study to explore the possibility of opening an elementary school in the Downcounty Consortium to address the space deficits at these elementary schools. Based on the outcome of an internal staff review and evaluation for a new elementary school, on August 31, 2017, the Board of Educa-tion authorized that a site selection committee be formed to evaluate potential elementary school sites in the lower portion of the Downcounty Consortium. The site selection process will begin fall 2017, with Board of Education action in March 2018. The adopted CIP includes funding for five elementary school addition projects and, at this time, those projects will continue based on the approved schedule.
DOWNCOUNTY CONSORTIUM
Capital Project: As a result of the capacity study, the Board of Education approved an addition project at East Silver Spring Elementary School to relieve overutilization at Rolling Terrace Elementary School. The recommended CIP will continue to reflect the approved schedule for this project, including an FY 2019 appropriation to begin the architectural design for the addition project, pending the outcome of the elementary school site selection process. Any adjustments to the project will be recommended once the site selection process is complete.
Woodlin Elementary SchoolPlanning Study: A comprehensive capacity study to address overutilization at several elementary schools in the lower sec-tion of the Downcounty Consortium was conducted during the 2014–2015 school year. This capacity study included the following schools: East Silver Spring, Forest Knolls, Highland View, Montgomery Knolls, New Hampshire Estates, Oak View, Takoma Park, Pine Crest, Piney Branch, Rolling Terrace, Sligo Creek, and Woodlin elementary schools. As a result of the capacity study, the Board of Education approved several addition projects. The Board of Education also approved a feasibility study to explore the possibility of opening an elementary school in the Downcounty Consortium to address the space deficits at these elementary schools. Based on the outcome of an internal staff review and evaluation for a new elementary school, on August 31, 2017, the Board of Educa-tion authorized that a site selection committee be formed to evaluate potential elementary school sites in the lower portion of the Downcounty Consortium. The site selection process will begin fall 2017, with Board of Education action in March 2018. The adopted CIP includes funding for five elementary school addition projects and, at this time, those projects will continue based on the approved schedule.
Capital Project: As a result of the capacity study, the Board of Education approved an addition project at East Silver Spring Elementary School to relieve overutilization at Rolling Terrace Elementary School. The recommended CIP will continue to reflect the approved schedule for this project, including an FY 2019 appropriation to begin the architectural design for the addition project, pending the outcome of the elementary school site selection process. Any adjustments to the project will be recommended once the site selection process is complete.

4-34 • Recommended Actions and Planning Issues
DOWNCOUNTY CONSORTIUM
CAPITAL PROJECTS
School ProjectProject Status*
Date of Completion
John F. Kennedy HS
Classroom addition
Recommended Sept. 2022
Northwood HS Classroom addition and Facility upgrades
Recommended TBD
Wheaton HS Revitalization/expansion
Approved Jan. 2016 Sept. 2019, site
Addition Approved Sept. 2018
Col. E. Brooke Lee MS
Classroom addition and Facility upgrades
Recommended Sept. 2021
Parkland MS Classroom addition
Recommended Sept. 2021
Silver Spring International MS
Classroom addition
Recommended Sept. 2022
Takoma Park MS Classroom addition
Approved Sept. 2020
East Silver Spring ES
Classroom addition
Recommended Sept. 2022
Montgomery Knolls ES
Classroom addition
Approved Sept. 2020
Pine Crest ES Classroom addition
Approved Sept. 2020
Piney Branch ES Classroom addition
Recommended Sept. 2021
Woodlin ES Classroom addition
Recommended Sept. 2022
“Approved”—Project has an FY 2017 or FY 2018 appropriation approved in the Amended FY 2017–2022 CIP.“Programmed”—Project has expenditures programmed in a future year of the CIP for planning and/or construction funds.“Proposed”—Project has facility planning funds recommended for a feasibility study.“Recommended”—Project has an FY 2019 appropriation recommended for planning or construction in the FY 2019–2024 CIP.
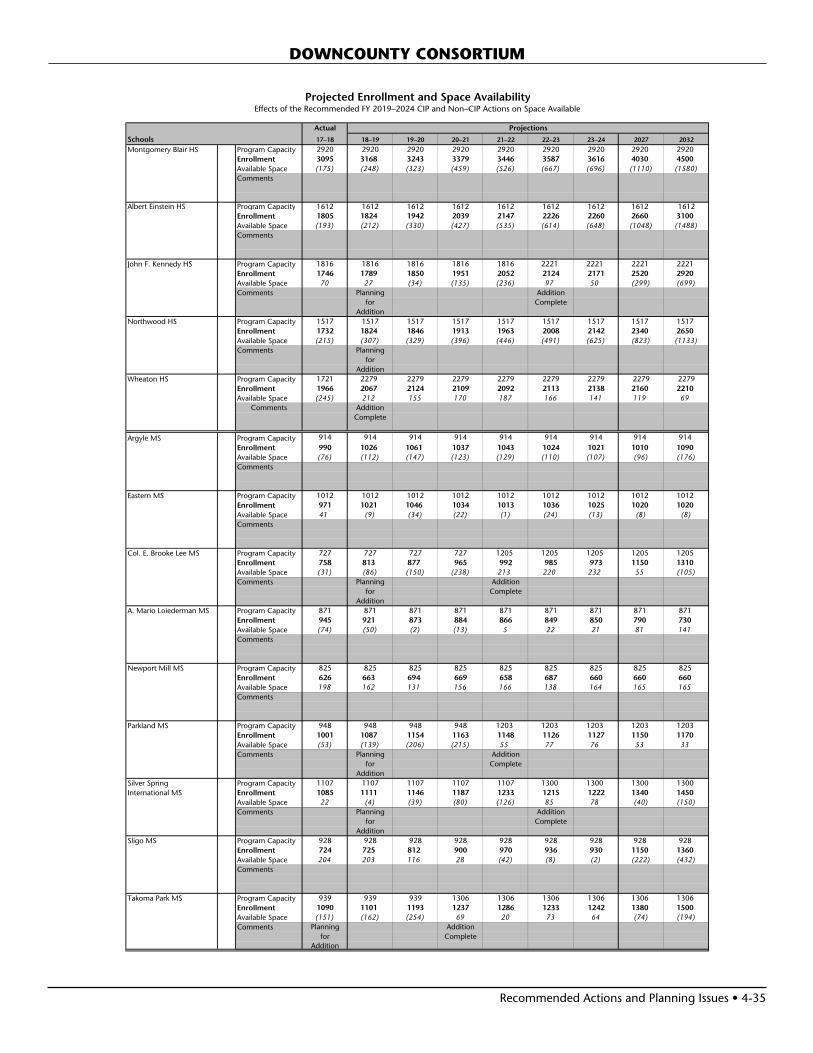
Recommended Actions and Planning Issues • 4-35
DOWNCOUNTY CONSORTIUM
Projected Enrollment and Space AvailabilityEffects of the Recommended FY 2019–2024 CIP and Non–CIP Actions on Space Available
Actual
Schools 17–18 18–19 19–20 20–21 21–22 22–23 23–24 2027 2032
Montgomery Blair HS Program Capacity 2920 2920 2920 2920 2920 2920 2920 2920 2920Enrollment 3095 3168 3243 3379 3446 3587 3616 4030 4500Available Space (175) (248) (323) (459) (526) (667) (696) (1110) (1580)Comments
Albert Einstein HS Program Capacity 1612 1612 1612 1612 1612 1612 1612 1612 1612Enrollment 1805 1824 1942 2039 2147 2226 2260 2660 3100Available Space (193) (212) (330) (427) (535) (614) (648) (1048) (1488)Comments
John F. Kennedy HS Program Capacity 1816 1816 1816 1816 1816 2221 2221 2221 2221Enrollment 1746 1789 1850 1951 2052 2124 2171 2520 2920Available Space 70 27 (34) (135) (236) 97 50 (299) (699)Comments Planning Addition
for CompleteAddition
Northwood HS Program Capacity 1517 1517 1517 1517 1517 1517 1517 1517 1517Enrollment 1732 1824 1846 1913 1963 2008 2142 2340 2650Available Space (215) (307) (329) (396) (446) (491) (625) (823) (1133)Comments Planning
forAddition
Wheaton HS Program Capacity 1721 2279 2279 2279 2279 2279 2279 2279 2279Enrollment 1966 2067 2124 2109 2092 2113 2138 2160 2210Available Space (245) 212 155 170 187 166 141 119 69
Comments AdditionComplete
Argyle MS Program Capacity 914 914 914 914 914 914 914 914 914Enrollment 990 1026 1061 1037 1043 1024 1021 1010 1090Available Space (76) (112) (147) (123) (129) (110) (107) (96) (176)Comments
Eastern MS Program Capacity 1012 1012 1012 1012 1012 1012 1012 1012 1012Enrollment 971 1021 1046 1034 1013 1036 1025 1020 1020Available Space 41 (9) (34) (22) (1) (24) (13) (8) (8)Comments
Col. E. Brooke Lee MS Program Capacity 727 727 727 727 1205 1205 1205 1205 1205Enrollment 758 813 877 965 992 985 973 1150 1310Available Space (31) (86) (150) (238) 213 220 232 55 (105)Comments Planning Addition
for CompleteAddition
A. Mario Loiederman MS Program Capacity 871 871 871 871 871 871 871 871 871Enrollment 945 921 873 884 866 849 850 790 730Available Space (74) (50) (2) (13) 5 22 21 81 141Comments
Newport Mill MS Program Capacity 825 825 825 825 825 825 825 825 825Enrollment 626 663 694 669 658 687 660 660 660Available Space 198 162 131 156 166 138 164 165 165Comments
Parkland MS Program Capacity 948 948 948 948 1203 1203 1203 1203 1203Enrollment 1001 1087 1154 1163 1148 1126 1127 1150 1170Available Space (53) (139) (206) (215) 55 77 76 53 33Comments Planning Addition
for CompleteAddition
Silver Spring Program Capacity 1107 1107 1107 1107 1107 1300 1300 1300 1300International MS Enrollment 1085 1111 1146 1187 1233 1215 1222 1340 1450
Available Space 22 (4) (39) (80) (126) 85 78 (40) (150)Comments Planning Addition
for CompleteAddition
Sligo MS Program Capacity 928 928 928 928 928 928 928 928 928Enrollment 724 725 812 900 970 936 930 1150 1360Available Space 204 203 116 28 (42) (8) (2) (222) (432)Comments
Takoma Park MS Program Capacity 939 939 939 1306 1306 1306 1306 1306 1306Enrollment 1090 1101 1193 1237 1286 1233 1242 1380 1500Available Space (151) (162) (254) 69 20 73 64 (74) (194)Comments Planning Addition
for CompleteAddition
Projections
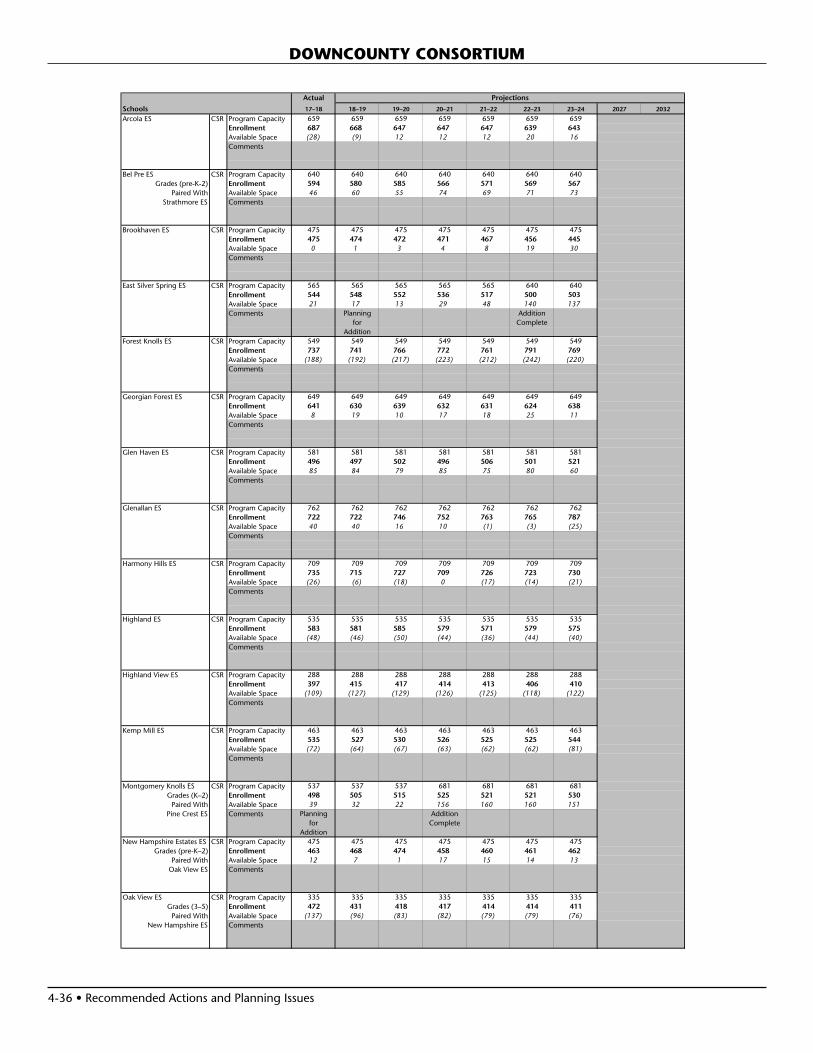
4-36 • Recommended Actions and Planning Issues
DOWNCOUNTY CONSORTIUM
Actual
Schools 17–18 18–19 19–20 20–21 21–22 22–23 23–24 2027 2032
Arcola ES CSR Program Capacity 659 659 659 659 659 659 659 Enrollment 687 668 647 647 647 639 643 Available Space (28) (9) 12 12 12 20 16 Comments
Bel Pre ES CSR Program Capacity 640 640 640 640 640 640 640 Grades (pre-K-2) Enrollment 594 580 585 566 571 569 567
Paired With Available Space 46 60 55 74 69 71 73 Strathmore ES Comments
Brookhaven ES CSR Program Capacity 475 475 475 475 475 475 475 Enrollment 475 474 472 471 467 456 445 Available Space 0 1 3 4 8 19 30 Comments
East Silver Spring ES CSR Program Capacity 565 565 565 565 565 640 640 Enrollment 544 548 552 536 517 500 503 Available Space 21 17 13 29 48 140 137 Comments Planning Addition
for CompleteAddition
Forest Knolls ES CSR Program Capacity 549 549 549 549 549 549 549 Enrollment 737 741 766 772 761 791 769 Available Space (188) (192) (217) (223) (212) (242) (220) Comments
Georgian Forest ES CSR Program Capacity 649 649 649 649 649 649 649 Enrollment 641 630 639 632 631 624 638 Available Space 8 19 10 17 18 25 11 Comments
Glen Haven ES CSR Program Capacity 581 581 581 581 581 581 581 Enrollment 496 497 502 496 506 501 521 Available Space 85 84 79 85 75 80 60 Comments
Glenallan ES CSR Program Capacity 762 762 762 762 762 762 762 Enrollment 722 722 746 752 763 765 787 Available Space 40 40 16 10 (1) (3) (25) Comments
Harmony Hills ES CSR Program Capacity 709 709 709 709 709 709 709 Enrollment 735 715 727 709 726 723 730 Available Space (26) (6) (18) 0 (17) (14) (21) Comments
Highland ES CSR Program Capacity 535 535 535 535 535 535 535 Enrollment 583 581 585 579 571 579 575 Available Space (48) (46) (50) (44) (36) (44) (40) Comments
Highland View ES CSR Program Capacity 288 288 288 288 288 288 288 Enrollment 397 415 417 414 413 406 410 Available Space (109) (127) (129) (126) (125) (118) (122) Comments
Kemp Mill ES CSR Program Capacity 463 463 463 463 463 463 463 Enrollment 535 527 530 526 525 525 544 Available Space (72) (64) (67) (63) (62) (62) (81) Comments
Montgomery Knolls ES CSR Program Capacity 537 537 537 681 681 681 681 Grades (K–2) Enrollment 498 505 515 525 521 521 530
Paired With Available Space 39 32 22 156 160 160 151 Pine Crest ES Comments Planning Addition
for CompleteAddition
New Hampshire Estates ES CSR Program Capacity 475 475 475 475 475 475 475 Grades (pre-K–2) Enrollment 463 468 474 458 460 461 462
Paired With Available Space 12 7 1 17 15 14 13 Oak View ES Comments
Oak View ES CSR Program Capacity 335 335 335 335 335 335 335 Grades (3–5) Enrollment 472 431 418 417 414 414 411
Paired With Available Space (137) (96) (83) (82) (79) (79) (76) New Hampshire ES Comments
Projections
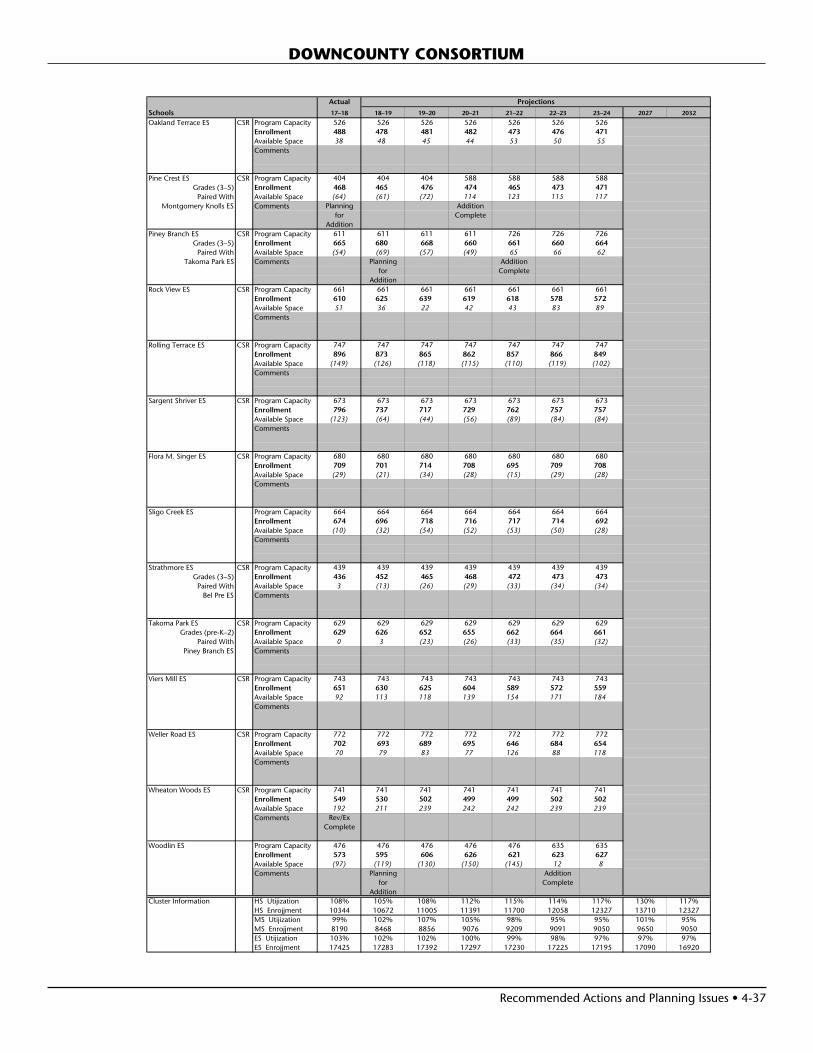
Recommended Actions and Planning Issues • 4-37
DOWNCOUNTY CONSORTIUM
Actual
Schools 17–18 18–19 19–20 20–21 21–22 22–23 23–24 2027 2032
Oakland Terrace ES CSR Program Capacity 526 526 526 526 526 526 526 Enrollment 488 478 481 482 473 476 471 Available Space 38 48 45 44 53 50 55 Comments
Pine Crest ES CSR Program Capacity 404 404 404 588 588 588 588 Grades (3–5) Enrollment 468 465 476 474 465 473 471
Paired With Available Space (64) (61) (72) 114 123 115 117 Montgomery Knolls ES Comments Planning Addition
for CompleteAddition
Piney Branch ES CSR Program Capacity 611 611 611 611 726 726 726 Grades (3–5) Enrollment 665 680 668 660 661 660 664
Paired With Available Space (54) (69) (57) (49) 65 66 62 Takoma Park ES Comments Planning Addition
for CompleteAddition
Rock View ES CSR Program Capacity 661 661 661 661 661 661 661 Enrollment 610 625 639 619 618 578 572 Available Space 51 36 22 42 43 83 89 Comments
Rolling Terrace ES CSR Program Capacity 747 747 747 747 747 747 747 Enrollment 896 873 865 862 857 866 849 Available Space (149) (126) (118) (115) (110) (119) (102) Comments
Sargent Shriver ES CSR Program Capacity 673 673 673 673 673 673 673 Enrollment 796 737 717 729 762 757 757 Available Space (123) (64) (44) (56) (89) (84) (84) Comments
Flora M. Singer ES CSR Program Capacity 680 680 680 680 680 680 680 Enrollment 709 701 714 708 695 709 708 Available Space (29) (21) (34) (28) (15) (29) (28) Comments
Sligo Creek ES Program Capacity 664 664 664 664 664 664 664 Enrollment 674 696 718 716 717 714 692 Available Space (10) (32) (54) (52) (53) (50) (28) Comments
Strathmore ES CSR Program Capacity 439 439 439 439 439 439 439 Grades (3–5) Enrollment 436 452 465 468 472 473 473
Paired With Available Space 3 (13) (26) (29) (33) (34) (34) Bel Pre ES Comments
Takoma Park ES CSR Program Capacity 629 629 629 629 629 629 629 Grades (pre-K–2) Enrollment 629 626 652 655 662 664 661
Paired With Available Space 0 3 (23) (26) (33) (35) (32) Piney Branch ES Comments
Viers Mill ES CSR Program Capacity 743 743 743 743 743 743 743 Enrollment 651 630 625 604 589 572 559 Available Space 92 113 118 139 154 171 184 Comments
Weller Road ES CSR Program Capacity 772 772 772 772 772 772 772 Enrollment 702 693 689 695 646 684 654 Available Space 70 79 83 77 126 88 118 Comments
Wheaton Woods ES CSR Program Capacity 741 741 741 741 741 741 741 Enrollment 549 530 502 499 499 502 502 Available Space 192 211 239 242 242 239 239 Comments Rev/Ex
Complete
Woodlin ES Program Capacity 476 476 476 476 476 635 635 Enrollment 573 595 606 626 621 623 627 Available Space (97) (119) (130) (150) (145) 12 8 Comments Planning Addition
for CompleteAddition
Cluster Information HS Utijization 108% 105% 108% 112% 115% 114% 117% 130% 117%HS Enrojjment 10344 10672 11005 11391 11700 12058 12327 13710 12327MS Utijization 99% 102% 107% 105% 98% 95% 95% 101% 95%MS Enrojjment 8190 8468 8856 9076 9209 9091 9050 9650 9050ES Utijization 103% 102% 102% 100% 99% 98% 97% 97% 97%ES Enrojjment 17425 17283 17392 17297 17230 17225 17195 17090 16920
Projections
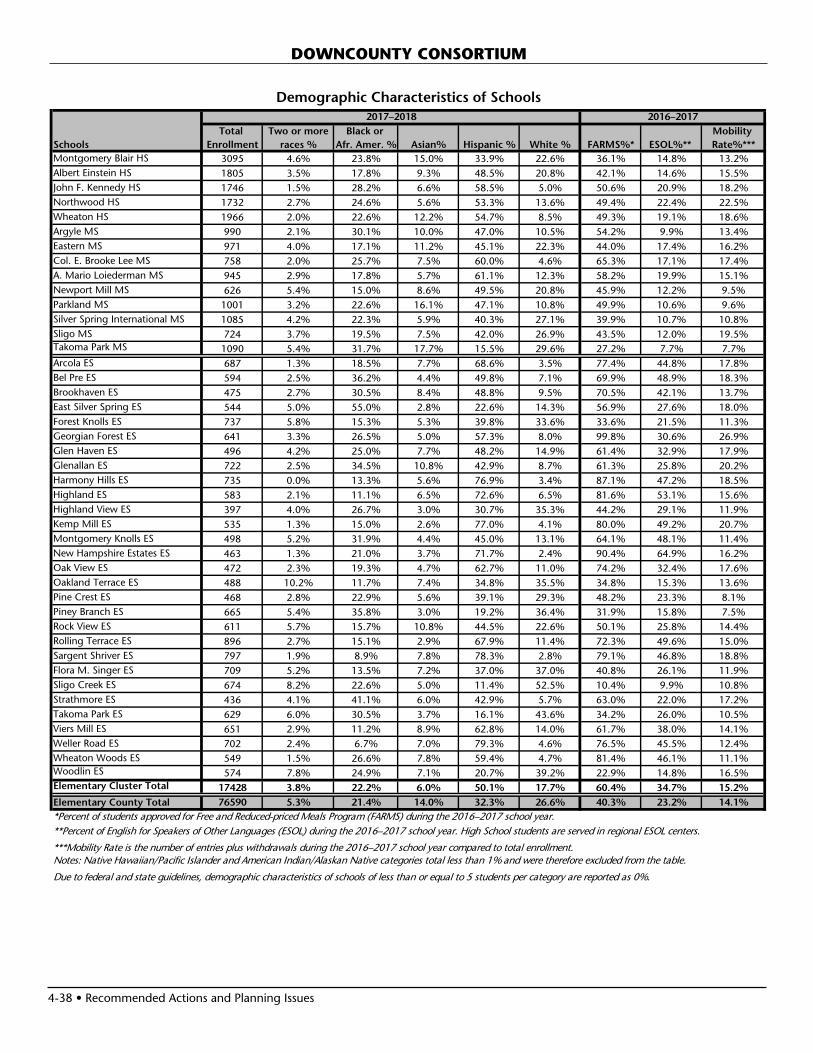
4-38 • Recommended Actions and Planning Issues
Demographic Characteristics of Schools
Total Two or more Black or Mobility Schools Enrollment races % Afr. Amer. % Asian% Hispanic % White % FARMS%* ESOL%** Rate%***Montgomery Blair HS 3095 4.6% 23.8% 15.0% 33.9% 22.6% 36.1% 14.8% 13.2%Albert Einstein HS 1805 3.5% 17.8% 9.3% 48.5% 20.8% 42.1% 14.6% 15.5%John F. Kennedy HS 1746 1.5% 28.2% 6.6% 58.5% 5.0% 50.6% 20.9% 18.2%Northwood HS 1732 2.7% 24.6% 5.6% 53.3% 13.6% 49.4% 22.4% 22.5%Wheaton HS 1966 2.0% 22.6% 12.2% 54.7% 8.5% 49.3% 19.1% 18.6%Argyle MS 990 2.1% 30.1% 10.0% 47.0% 10.5% 54.2% 9.9% 13.4%Eastern MS 971 4.0% 17.1% 11.2% 45.1% 22.3% 44.0% 17.4% 16.2%Col. E. Brooke Lee MS 758 2.0% 25.7% 7.5% 60.0% 4.6% 65.3% 17.1% 17.4%A. Mario Loiederman MS 945 2.9% 17.8% 5.7% 61.1% 12.3% 58.2% 19.9% 15.1%Newport Mill MS 626 5.4% 15.0% 8.6% 49.5% 20.8% 45.9% 12.2% 9.5%Parkland MS 1001 3.2% 22.6% 16.1% 47.1% 10.8% 49.9% 10.6% 9.6%Silver Spring International MS 1085 4.2% 22.3% 5.9% 40.3% 27.1% 39.9% 10.7% 10.8%Sligo MS 724 3.7% 19.5% 7.5% 42.0% 26.9% 43.5% 12.0% 19.5%Takoma Park MS 1090 5.4% 31.7% 17.7% 15.5% 29.6% 27.2% 7.7% 7.7%Arcola ES 687 1.3% 18.5% 7.7% 68.6% 3.5% 77.4% 44.8% 17.8%Bel Pre ES 594 2.5% 36.2% 4.4% 49.8% 7.1% 69.9% 48.9% 18.3%Brookhaven ES 475 2.7% 30.5% 8.4% 48.8% 9.5% 70.5% 42.1% 13.7%East Silver Spring ES 544 5.0% 55.0% 2.8% 22.6% 14.3% 56.9% 27.6% 18.0%Forest Knolls ES 737 5.8% 15.3% 5.3% 39.8% 33.6% 33.6% 21.5% 11.3%Georgian Forest ES 641 3.3% 26.5% 5.0% 57.3% 8.0% 99.8% 30.6% 26.9%Glen Haven ES 496 4.2% 25.0% 7.7% 48.2% 14.9% 61.4% 32.9% 17.9%Glenallan ES 722 2.5% 34.5% 10.8% 42.9% 8.7% 61.3% 25.8% 20.2%Harmony Hills ES 735 0.0% 13.3% 5.6% 76.9% 3.4% 87.1% 47.2% 18.5%Highland ES 583 2.1% 11.1% 6.5% 72.6% 6.5% 81.6% 53.1% 15.6%Highland View ES 397 4.0% 26.7% 3.0% 30.7% 35.3% 44.2% 29.1% 11.9%Kemp Mill ES 535 1.3% 15.0% 2.6% 77.0% 4.1% 80.0% 49.2% 20.7%Montgomery Knolls ES 498 5.2% 31.9% 4.4% 45.0% 13.1% 64.1% 48.1% 11.4%New Hampshire Estates ES 463 1.3% 21.0% 3.7% 71.7% 2.4% 90.4% 64.9% 16.2%Oak View ES 472 2.3% 19.3% 4.7% 62.7% 11.0% 74.2% 32.4% 17.6%Oakland Terrace ES 488 10.2% 11.7% 7.4% 34.8% 35.5% 34.8% 15.3% 13.6%Pine Crest ES 468 2.8% 22.9% 5.6% 39.1% 29.3% 48.2% 23.3% 8.1%Piney Branch ES 665 5.4% 35.8% 3.0% 19.2% 36.4% 31.9% 15.8% 7.5%Rock View ES 611 5.7% 15.7% 10.8% 44.5% 22.6% 50.1% 25.8% 14.4%Rolling Terrace ES 896 2.7% 15.1% 2.9% 67.9% 11.4% 72.3% 49.6% 15.0%Sargent Shriver ES 797 1.9% 8.9% 7.8% 78.3% 2.8% 79.1% 46.8% 18.8%Flora M. Singer ES 709 5.2% 13.5% 7.2% 37.0% 37.0% 40.8% 26.1% 11.9%Sligo Creek ES 674 8.2% 22.6% 5.0% 11.4% 52.5% 10.4% 9.9% 10.8%Strathmore ES 436 4.1% 41.1% 6.0% 42.9% 5.7% 63.0% 22.0% 17.2%Takoma Park ES 629 6.0% 30.5% 3.7% 16.1% 43.6% 34.2% 26.0% 10.5%Viers Mill ES 651 2.9% 11.2% 8.9% 62.8% 14.0% 61.7% 38.0% 14.1%Weller Road ES 702 2.4% 6.7% 7.0% 79.3% 4.6% 76.5% 45.5% 12.4%Wheaton Woods ES 549 1.5% 26.6% 7.8% 59.4% 4.7% 81.4% 46.1% 11.1%Woodlin ES 574 7.8% 24.9% 7.1% 20.7% 39.2% 22.9% 14.8% 16.5%Elementary Cluster Total 17428 3.8% 22.2% 6.0% 50.1% 17.7% 60.4% 34.7% 15.2%Elementary County Total 76590 5.3% 21.4% 14.0% 32.3% 26.6% 40.3% 23.2% 14.1%*Percent of students approved for Free and Reduced-priced Meals Program (FARMS) during the 2016–2017 school year.**Percent of English for Speakers of Other Languages (ESOL) during the 2016–2017 school year. High School students are served in regional ESOL centers.
***Mobility Rate is the number of entries plus withdrawals during the 2016–2017 school year compared to total enrollment.Notes: Native Hawaiian/Pacific Islander and American Indian/Alaskan Native categories total less than 1% and were therefore excluded from the table.
Due to federal and state guidelines, demographic characteristics of schools of less than or equal to 5 students per category are reported as 0%.
2017–2018 2016–2017
DOWNCOUNTY CONSORTIUM
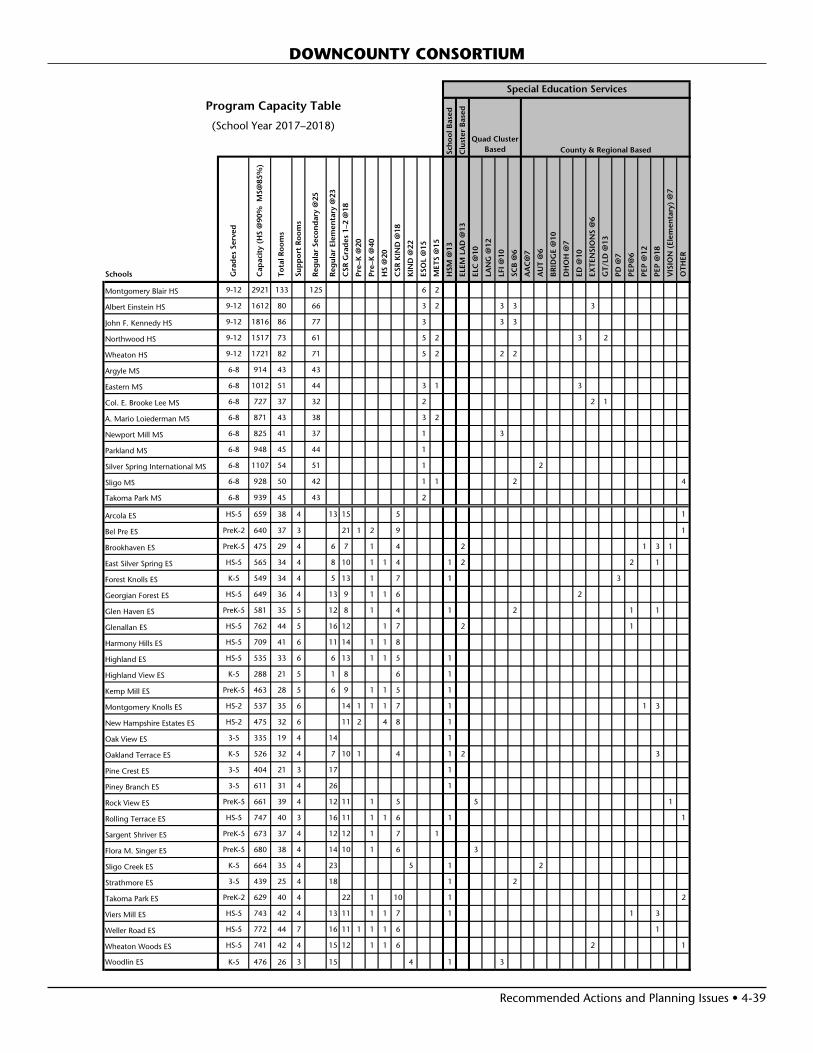
Recommended Actions and Planning Issues • 4-39
DOWNCOUNTY CONSORTIUM
Schools Gra
des
Ser
ved
Cap
acit
y (H
S @
90%
MS@
85%
)
To
tal R
oo
ms
Sup
po
rt R
oo
ms
Reg
ular
Sec
on
dar
y @
25
Reg
ular
Ele
men
tary
@23
CSR
Gra
des
1–2
@18
Pre
–K @
20
Pre
–K @
40
HS
@20
CSR
KIN
D @
18
KIN
D @
22
ESO
L @
15
MET
S @
15
HSM
@13
ELE
M L
AD
@13
ELC
@10
LA
NG
@12
LFI
@10
SC
B @
6
AA
C@
7
AU
T @
6
BR
IDG
E @
10
DH
OH
@7
ED
@10
EX
TEN
SIO
NS
@6
GT/
LD @
13
PD
@7
PEP
@6
PEP
@12
PEP
@18
VIS
ION
(El
emen
tary
) @
7
OTH
ER
Montgomery Blair HS 9-12 2921 133 125 6 2
Albert Einstein HS 9-12 1612 80 66 3 2 3 3 3
John F. Kennedy HS 9-12 1816 86 77 3 3 3
Northwood HS 9-12 1517 73 61 5 2 3 2
Wheaton HS 9-12 1721 82 71 5 2 2 2
Argyle MS 6-8 914 43 43
Eastern MS 6-8 1012 51 44 3 1 3
Col. E. Brooke Lee MS 6-8 727 37 32 2 2 1
A. Mario Loiederman MS 6-8 871 43 38 3 2
Newport Mill MS 6-8 825 41 37 1 3
Parkland MS 6-8 948 45 44 1
Silver Spring International MS 6-8 1107 54 51 1 2
Sligo MS 6-8 928 50 42 1 1 2 4
Takoma Park MS 6-8 939 45 43 2
Arcola ES HS-5 659 38 4 13 15 5 1
Bel Pre ES PreK-2 640 37 3 21 1 2 9 1
Brookhaven ES PreK-5 475 29 4 6 7 1 4 2 1 3 1
East Silver Spring ES HS-5 565 34 4 8 10 1 1 4 1 2 2 1
Forest Knolls ES K-5 549 34 4 5 13 1 7 1 3
Georgian Forest ES HS-5 649 36 4 13 9 1 1 6 2
Glen Haven ES PreK-5 581 35 5 12 8 1 4 1 2 1 1
Glenallan ES HS-5 762 44 5 16 12 1 7 2 1
Harmony Hills ES HS-5 709 41 6 11 14 1 1 8
Highland ES HS-5 535 33 6 6 13 1 1 5 1
Highland View ES K-5 288 21 5 1 8 6 1
Kemp Mill ES PreK-5 463 28 5 6 9 1 1 5 1
Montgomery Knolls ES HS-2 537 35 6 14 1 1 1 7 1 1 3
New Hampshire Estates ES HS-2 475 32 6 11 2 4 8 1
Oak View ES 3-5 335 19 4 14 1
Oakland Terrace ES K-5 526 32 4 7 10 1 4 1 2 3
Pine Crest ES 3-5 404 21 3 17 1
Piney Branch ES 3-5 611 31 4 26 1
Rock View ES PreK-5 661 39 4 12 11 1 5 5 1
Rolling Terrace ES HS-5 747 40 3 16 11 1 1 6 1 1
Sargent Shriver ES PreK-5 673 37 4 12 12 1 7 1
Flora M. Singer ES PreK-5 680 38 4 14 10 1 6 3
Sligo Creek ES K-5 664 35 4 23 5 1 2
Strathmore ES 3-5 439 25 4 18 1 2
Takoma Park ES PreK-2 629 40 4 22 1 10 1 2
Viers Mill ES HS-5 743 42 4 13 11 1 1 7 1 1 3
Weller Road ES HS-5 772 44 7 16 11 1 1 1 6 1
Wheaton Woods ES HS-5 741 42 4 15 12 1 1 6 2 1
Woodlin ES K-5 476 26 3 15 4 1 3
Program Capacity TableSpecial Education Services
Sch
oo
l Bas
ed
Clu
ster
Bas
ed
Quad Cluster Based County & Regional Based
(School Year 2017–2018)

4-40 • Recommended Actions and Planning Issues
Year Year Total Site Reloc- Home
Facility Reopened/ Square Size Adjacent atable County School
Schools Opened Revitalized Footage Acres Park Classrooms Programs Model
Montgomery Blair HS 1998 386,567 30.2 YesAlbert Einstein HS 1962 1997 276,462 26.67 YesJohn F. Kennedy HS 1964 1999 280,048 29.1Northwood HS 1956 2004 254,054 29.6 4 SBWCWheaton HS 1954 2016 373,825 28.2Argyle MS 1971 1993 120,205 19.9Eastern MS 1951 1976 152,030 14.5 LTLCol. E. Brooke Lee MS 1966 123,199 16.5 YesA. Mario Loiederman MS 1956 2005 131,746 17.08 2 LTLNewport Mill MS 1958 2002 108,240 8.4 YesParkland MS 1963 2007 151,169 9.2 Yes LTLSilver Spring International MS 1934 1999 152,731 10.64 Yes LTLSligo MS 1959 1991 149,527 21.7 YesTakoma Park MS 1939 1999 137,348 18.8 Yes 4Arcola ES 1956 2007 95,421 5 Yes 6 LTL YesBel Pre ES 1968 2014 95,330 8.9 Yes YesBrookhaven ES 1961 1995 81,320 8.57East Silver Spring ES 1929 1975 88,895 8.4 YesForest Knolls ES 1960 1993 89,564 7.8 5 YesGeorgian Forest ES 1961 1995 88,111 11 Yes LTL YesGlen Haven ES 1950 2004 85,845 10 Yes YesGlenallan ES 1966 2013 98,700 12.1
Harmony Hills ES 1957 1999 85,648 10.2 Yes 5 SBHC Yes
Highland ES 1950 1989 87,491 11 Yes SBHC YesHighland View ES 1953 1994 59,213 6.6 6 YesKemp Mill ES 1960 1996 68,222 10 3 LTL YesMontgomery Knolls ES 1952 1989 97,213 10.3 LTL YesNew Hampshire Estates ES 1954 1988 73,306 5.4 SBHC YesOak View ES 1949 1985 57,560 11.3 1 LTL YesOakland Terrace ES 1950 1993 79,145 9.5 Yes 2 YesPine Crest ES 1941 1992 53,778 5.6 Yes 5 LTL YesPiney Branch ES 1973 99,706 1.97 Yes YesRock View ES 1955 1999 91,977 7.4 YesRolling Terrace ES 1950 1989 92,241 4.3 10 SBHC YesSargent Shriver ES 1954 2006 91,628 9.17 9 LTL YesFlora M. Singer ES 2012 95,831 12.67 Yes 3 YesSligo Creek ES 1934 1999 98,799 15.6 Yes YesStrathmore ES 1970 59,497 10.8 Yes YesTakoma Park ES 1979 85,553 4.7 YesViers Mill ES 1950 1991 120,572 10.52 SBHC YesWeller Road ES 1953 2013 121,346 11.1 SBHC YesWheaton Woods ES 1952 2017 120,154 8 LTL YesWoodlin ES 1944 1974 60,725 11 7 Yes
Facility Characteristics of Schools 2017–2018
DOWNCOUNTY CONSORTIUM

Recommended Actions and Planning Issues • 4-41
CLUSTER PLANNING ISSUESPlanning Issue: Since 2007, elementary school enrollment in the Gaithersburg Cluster has increased by 820 students. Some of this growth is due to new housing planned for in the Shady Grove Sector Plan. In addition, development of the Crown community, with over 2,000 residential units planned in the Rosemont Elementary School service area, is moving forward. Elementary school enrollment growth continues in the Gaithersburg Cluster and several schools exceed program capacities—Gaithersburg, Rosemont, Strawberry Knoll, Sum-mit Hall, and Washington Grove elementary schools. In the 2014–2015 school year, a Gaithersburg Cluster Elementary School Capacity Study was conducted to determine whether additions to cluster schools could address the projected space deficits. Along with additions to existing schools, a new elementary school also was considered.
On October 15, 2015, the Findings of the Gaithersburg Cluster Elementary School Capacity Study were released. The interim superintendent of schools concluded that challenges existed with both approaches—additions or a new school—including concerns regarding future enrollment, size of schools, and potential reassignment of students. As a result, the interim superintendent of schools recommended a Tri-Cluster Round-table Discussion Group (Roundtable) for the Gaithersburg, Col. Zadok Magruder, and Thomas S. Wootton clusters. This roundtable reviewed school enrollments, utilization levels, and facility options at the three adjacent clusters to more broadly address enrollment growth and space deficits in the Gaithersburg Cluster.
On April 19, 2016, the Board of Education approved the fol-lowing actions for the elementary schools in the Gaithersburg Cluster that stemmed from the Roundtable.
• Gaithersburg Elementary School—construct an addi-tion at the school that would provide two schools in one—a Grades Pre-K–2 and a Grades 3–5—with physi-cal separations where possible. A feasibility study was conducted in FY 2017 to determine the feasibility, scope, and cost for the addition with completion by September 2020.
• Rosemont Elementary School—monitor enrollment before any capital solutions or reassignments are considered. Only a four-classroom addition would be feasible at this school. Reassignment of the area west of Interstate 270 to Thomas S. Wootton Cluster schools was considered; however, the interim superintendent of schools’ did not support reassignment of additional students to the Thomas S. Wootton Cluster due to projected enrollment at Thomas S. Wootton High School.
• Strawberry Knoll Elementary School—moni-tor enrollment and consider an addition in a future Capital Improvements Program.
• Summit Hall Elementary School—the future revitaliza-tion/expansion would address the overutilization at the school. In the short-term, replace the six older relocat-able classrooms with new units or modular classrooms.
• Washington Grove Elementary School—conduct a boundary study in spring 2017 to reassign the portion of the Shady Grove Sector Plan within the Gaithersburg Cluster service area to Col. Zadok Magruder Cluster schools.
The actions above were completed including the feasibility study for a possible addition at Gaithersburg Elementary School to increase the capacity for 1,000 students. The fea-sibility study revealed several challenges with construction, security, and administration of the building. Based on these challenges, as well as the absence of a recommendation to address the space deficits at Rosemont and Strawberry Knolls elementary schools, on August 31, 2017, the Board of Educa-tion authorized that a site selection committee be formed to evaluate potential school sites in the Gaithersburg Cluster. This potential school site could address the overutilization at the elementary schools in the cluster. The site selection process will occur in fall 2017 with Board of Education in March 2018.
Planning Study: A boundary study was conducted in fall 2016 for residents of the Unity area to consider a reassign-ment from the Gaithersburg Cluster schools to the Sher-wood Cluster schools. Representatives from Laytonsville and Greenwood elementary schools, Gaithersburg and Rosa Parks middle schools, and Gaithersburg and Sherwood high schools participated in the boundary study. The Board of Education took action on March 30, 2017, to reassign the area from the Gaithersburg Cluster to the Sherwood Cluster. The Board of Education action is available on the MCPS website at the following link: http://gis.mcpsmd.org/boundarystudypdfs/UnityBOEAdoptedBoundary.pdf
Planning Study: A boundary study was conducted in spring 2017 to reassign the portion of the Shady Grove Sector Plan that is located east of Interstate 370 in the Washington Grove
GAITHERSBURG CLUSTER
0%
20%
40%
60%
80%
100%
120%
2017ACTUAL
2018 2019 2020 2021 2022 2023
Note: Percent utilization calculated as total enrollment of schools divided by total capacity. Projected capacity factors in capital projects.
Gaithersburg ClusterSchool Utilizations
Elementary Schools Middle Schools High School
DesiredRange
4-42 • Recommended Actions and Planning Issues
GAITHERSBURG CLUSTER
Elementary School, Forest Oak Middle School, and Gaithers-burg High School service areas to the Col. Zadok Magruder Cluster schools. On August 31, 2017, the Board of Education authorized that a site selection committee be formed to evalu-ate potential school sites in the Gaithersburg Cluster. This potential school site could address the overutilization at the elementary schools in the cluster. The site selection process will occur in fall 2017, with Board of Education action in March 2018. The Boundary Advisory Committee Report for the Shady Grove Sector Plan boundary study was released on September 6, 2017. However, based on the approved site selection process, decisions regarding potential reassignments in the Shady Grove Sector Plan will not be considered until after the site selection process is complete.
SCHOOLSGaithersburg High SchoolPlanning Study: A boundary study was conducted in fall 2016 for residents of the Unity area to consider a reassign-ment from the Gaithersburg Cluster schools to the Sher-wood Cluster schools. Representatives from Laytonsville and Greenwood elementary schools, Gaithersburg and Rosa Parks middle schools, and Gaithersburg and Sherwood high schools participated in the boundary study. The Board of Education took action on March 30, 2017, to reassign the area from the Gaithersburg Cluster to the Sherwood Cluster. The Board of Education action is available on the MCPS website at the following link: http://gis.mcpsmd.org/boundarystudypdfs/UnityBOEAdoptedBoundary.pdf
Planning Study: A boundary study was conducted in spring 2017 to reassign the portion of the Shady Grove Sector Plan that is located east of Interstate 370 in the Washington Grove Elementary School, Forest Oak Middle School, and Gaithers-burg High School service areas to the Col. Zadok Magruder Cluster schools. On August 31, 2017, the Board of Education authorized that a site selection committee be formed to evalu-ate potential school sites in the Gaithersburg Cluster. This potential school site could address the overutilization at the elementary schools in the cluster. The site selection process will occur in fall 2017, with Board of Education action in March 2018. The Boundary Advisory Committee Report for the Shady Grove Sector Plan boundary study was released on September 6, 2017. However, based on the approved site selection process, decisions regarding potential reassignments in the Shady Grove Sector Plan will not be considered until after the site selection process is complete.
Capital Project: Projections indicate enrollment at Gaithers-burg High School will exceed capacity by 200 seats or more by the end of the six-year planning period. Expenditures are recommended in the six-year period to open a new high school on the Crown Farm site to address overutilization in the mid-county region. An FY 2019 appropriation for planning is recommended to begin the architectural design for this new school. Once the planning is complete, a recommendation
will be included in the next full CIP regarding the phasing and completion date for the opening of this new high school.
Forest Oak Middle SchoolPlanning Study: A boundary study was conducted in spring 2017 to reassign the portion of the Shady Grove Sector Plan that is located east of Interstate 370 in the Washington Grove Elementary School, Forest Oak Middle School, and Gaithers-burg High School service areas to the Col. Zadok Magruder Cluster schools. On August 31, 2017, the Board of Education authorized that a site selection committee be formed to evalu-ate potential school sites in the Gaithersburg Cluster. This potential school site could address the overutilization at the elementary schools in the cluster. The site selection process will occur in fall 2017, with Board of Education action in March 2018. The Boundary Advisory Committee Report for the Shady Grove Sector Plan boundary study was released on September 6, 2017. However, based on the approved site selection process, decisions regarding potential reassignments in the Shady Grove Sector Plan will not be considered until after the site selection process is complete.
Planning Study: Projections indicate that enrollment is growing and will exceed capacity by 150 seats or more by the end of the six-year planning period. A capacity study is recommended to explore possible options to provide additional capacity at Forest Oak Middle School. Relocatable schools will be utilized as needed until a permanent solution is identified in a future CIP.
Gaithersburg Middle SchoolPlanning Study: A boundary study was conducted in fall 2016 for residents of the Unity area to consider a reassign-ment from the Gaithersburg Cluster schools to the Sher-wood Cluster schools. Representatives from Laytonsville and Greenwood elementary schools, Gaithersburg and Rosa Parks middle schools, and Gaithersburg and Sherwood high schools participated in the boundary study. The Board of Education took action on March 30, 2017, to reassign the area from the Gaithersburg Cluster to the Sherwood Cluster. The Board of Education action is available on the MCPS website at the following link: http://gis.mcpsmd.org/boundarystudypdfs/UnityBOEAdoptedBoundary.pdf
Gaithersburg Elementary SchoolCapital Project: Projections indicated that enrollment is growing and will exceed capacity by the end of the six-year planning period. An FY 2019 appropriation is recommended to construct the addition at this school. Prior to the design, a feasibility study was conducted for an addition to increase the capacity for 1,000 students, to include an option to construct an addition for a Pre-K–5 school and an option to construct an addition to create two schools in one adjoining building—Grades Pre-K–2 in one part of the facility and Grades 3–5 in the other part of the facility—with physical separation where possible. The scheduled completion date for the addition is

Recommended Actions and Planning Issues • 4-43
GAITHERSBURG CLUSTER
September 2020. In order for this project to be completed on schedule, county and state funding must be provided at the levels recommended in this CIP.
Planning Study: The feasibility study revealed several chal-lenges with construction, security, and administration of the building. Based on these challenges, as well as the absence of a recommendation to address the space deficits at Rose-mont and Strawberry Knolls elementary schools following the Roundtable described in the Cluster Planning Issues, on August 31, 2017, the Board of Education authorized that a site selection committee be formed to evaluate potential school sites in the Gaithersburg Cluster. This potential school site could address the overutilization at the elementary schools in the cluster. The site selection process will occur in fall 2017 with Board of Education in March 2018.
Laytonsville Elementary SchoolPlanning Study: A boundary study was conducted in fall 2016 for residents of the Unity area to consider a reassign-ment from the Gaithersburg Cluster schools to the Sher-wood Cluster schools. Representatives from Laytonsville and Greenwood elementary schools, Gaithersburg and Rosa Parks middle schools, and Gaithersburg and Sherwood high schools participated in the boundary study. The Board of Education took action on March 30, 2017, to reassign the area from the Gaithersburg Cluster to the Sherwood Cluster. The Board of Education action is available on the MCPS website at the following link: http://gis.mcpsmd.org/boundarystudypdfs/UnityBOEAdoptedBoundary.pdf
Rosemont Elementary SchoolCapital Project: Enrollment projections for Rosemont Elementary School indicate that enrollment is growing and will exceed capacity by over 250 seats by the end of the six-year planning period. A feasibility study was conducted in the 2016–2017 school year to determine the feasibility, scope, and cost of an addition and core improvements at the school. Relocatable classrooms will be utilized until a solution to provide additional capacity is identified for the school.
Planning Study: Based on the absence of a recommenda-tion to address the space deficits at Rosemont and Strawberry Knolls elementary schools following the Roundtable described in the Cluster Planning Issues, on August 31, 2017, the Board of Education authorized that a site selection committee be formed to evaluate potential school sites in the Gaithersburg Cluster. This potential school site could address the over-utilization at the elementary schools in the cluster. The site selection process will occur in fall 2017 with Board of Educa-tion in March 2018.
The Board of Education authorized, on August 31, 2017, that a site selection committee be formed to evaluate potential elementary school sites in the Gaithersburg Cluster. This potential school site could address the overutilization at the
elementary schools in the cluster. The site selection process will occur in fall 2017, with Board of Education in March 2018.
Strawberry Knoll Elementary SchoolCapital Project: Projections indicate enrollment is grow-ing and will exceed capacity at Strawberry Knoll Elementary School by over 200 seats by the end of the six-year planning period. An FY 2012 appropriation was approved for facility planning to conduct a feasibility study to determine the scope and cost for an addition at the school. Relocatable classrooms will be utilized until a solution to provide additional capacity is identified for the school.
Planning Study: Based on the absence of a recommenda-tion to address the space deficits at Rosemont and Strawberry Knolls elementary schools, on August 31, 2017 following the Roundtable described in the Cluster Planning Issues, the Board of Education authorized that a site selection commit-tee be formed to evaluate potential school sites in the Gaith-ersburg Cluster. This potential school site could address the overutilization at the elementary schools in the cluster. The site selection process will occur in fall 2017 with Board of Education in March 2018.
Summit Hall Elementary SchoolCapital Project: The Board of Education action directed staff to evaluate the older relocatable classrooms at Summit Hall Elementary School for replacement with newer relocatable classrooms, or modular classrooms, by fall 2017.
Planning Study: Projections indication that enrollment will exceed capacity by more than 200 seats by the end of the six-year planning period. The Gaithersburg Elementary School feasibility study revealed several challenges with construction, security, and administration of the building. Based on these challenges, as well as the absence of a recommendation to address the space deficits at Rosemont and Strawberry Knolls elementary schools following the Roundtable described in the Cluster Planning Issues, on August 31, 2017, the Board of Education authorized that a site selection committee be formed to evaluate potential school sites in the Gaithersburg Cluster. This potential school site could address the overutilization at the elementary schools in the cluster. The site selection process will occur in fall 2017 with Board of Education in March 2018.
Capital Project: Based on the Montgomery County Council Office of Legislative Oversight (OLO) study of the revitaliza-tion/expansion program released in July 2015, this program is under review in order to develop a multi-variable approach to determine the priority order of large-scale renovations of facilities, possibly including programmatic and capacity con-siderations. Recommendations regarding possible changes to this program will be released once the review is complete.

4-44 • Recommended Actions and Planning Issues
Washington Grove Elementary SchoolPlanning Study: A boundary study was conducted in spring 2017 to reassign the portion of the Shady Grove Sector Plan that is located east of Interstate 370 in the Washington Grove Elementary School, Forest Oak Middle School, and Gaithers-burg High School service areas to the Col. Zadok Magruder Cluster schools. On August 31, 2017, the Board of Education authorized that a site selection committee be formed to evalu-ate potential school sites in the Gaithersburg Cluster. This potential school site could address the overutilization at the elementary schools in the cluster. The site selection process will occur in fall 2017, with Board of Education action in March 2018. The Boundary Advisory Committee Report for the Shady Grove Sector Plan boundary study was released on September 6, 2017. However, based on the approved site selection process, decisions regarding potential reassignments in the Shady Grove Sector Plan will not be considered until after the site selection process is complete.
GAITHERSBURG CLUSTER
CAPITAL PROJECTS
School ProjectProject Status*
Date of Completion
Gaithersburg ES Classroom addition
Approved Sept. 2020
“Approved”—Project has an FY 2017 or FY 2018 appropriation approved in the Amended FY 2017–2022 CIP.“Programmed”—Project has expenditures programmed in a future year of the CIP for planning and/or construction funds.“Proposed”—Project has facility planning funds recommended for a feasibility study.“Recommended”—Project has an FY 2019 appropriation recommended for planning or construction in the FY 2019–2024 CIP.
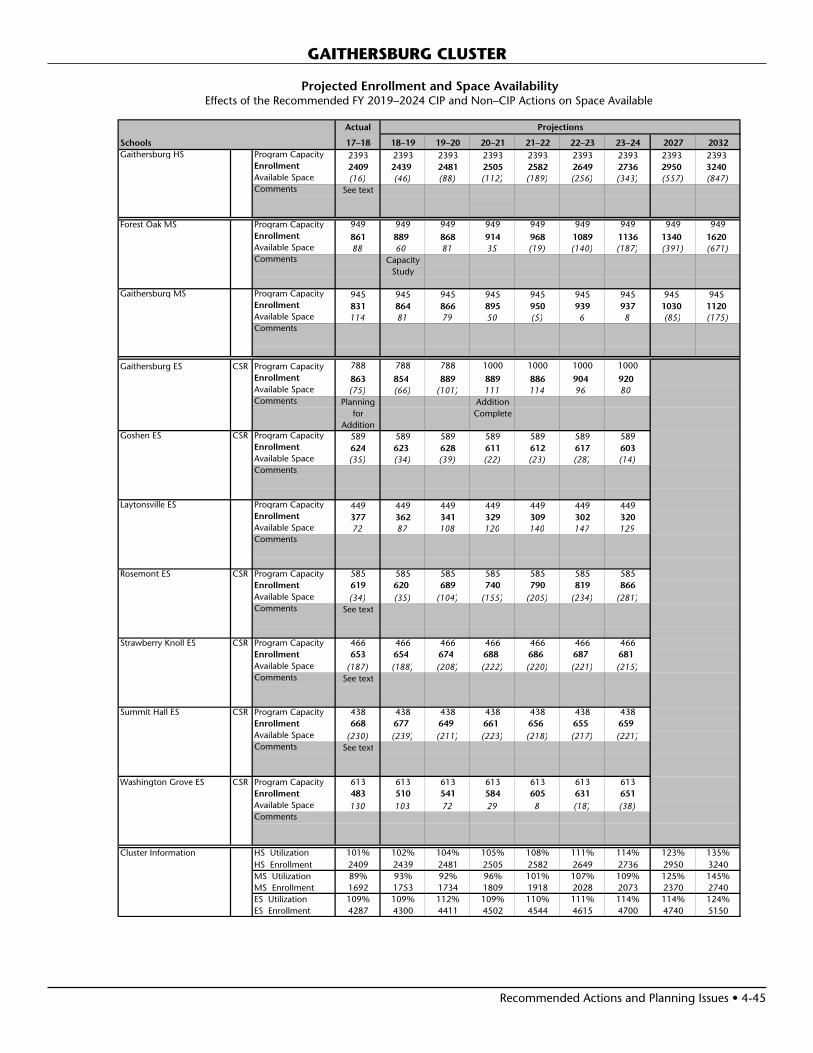
Recommended Actions and Planning Issues • 4-45
Projected Enrollment and Space AvailabilityEffects of the Recommended FY 2019–2024 CIP and Non–CIP Actions on Space Available
Actual
Schools 17–18 18–19 19–20 20–21 21–22 22–23 23–24 2027 2032Gaithersburg HS Program Capacity 2393 2393 2393 2393 2393 2393 2393 2393 2393
Enrollment 2409 2439 2481 2505 2582 2649 2736 2950 3240Available Space (16) (46) (88) (112) (189) (256) (343) (557) (847)Comments See text
Forest Oak MS Program Capacity 949 949 949 949 949 949 949 949 949Enrollment 861 889 868 914 968 1089 1136 1340 1620Available Space 88 60 81 35 (19) (140) (187) (391) (671)Comments Capacity
Study
Gaithersburg MS Program Capacity 945 945 945 945 945 945 945 945 945Enrollment 831 864 866 895 950 939 937 1030 1120Available Space 114 81 79 50 (5) 6 8 (85) (175)Comments
Gaithersburg ES CSR Program Capacity 788 788 788 1000 1000 1000 1000Enrollment 863 854 889 889 886 904 920Available Space (75) (66) (101) 111 114 96 80Comments Planning Addition
for CompleteAddition
Goshen ES CSR Program Capacity 589 589 589 589 589 589 589Enrollment 624 623 628 611 612 617 603Available Space (35) (34) (39) (22) (23) (28) (14)Comments
Laytonsville ES Program Capacity 449 449 449 449 449 449 449Enrollment 377 362 341 329 309 302 320Available Space 72 87 108 120 140 147 129Comments
Rosemont ES CSR Program Capacity 585 585 585 585 585 585 585Enrollment 619 620 689 740 790 819 866Available Space (34) (35) (104) (155) (205) (234) (281)Comments See text
Strawberry Knoll ES CSR Program Capacity 466 466 466 466 466 466 466Enrollment 653 654 674 688 686 687 681Available Space (187) (188) (208) (222) (220) (221) (215)Comments See text
Summit Hall ES CSR Program Capacity 438 438 438 438 438 438 438Enrollment 668 677 649 661 656 655 659Available Space (230) (239) (211) (223) (218) (217) (221)Comments See text
Washington Grove ES CSR Program Capacity 613 613 613 613 613 613 613Enrollment 483 510 541 584 605 631 651Available Space 130 103 72 29 8 (18) (38)Comments
Cluster Information HS Utilization 101% 102% 104% 105% 108% 111% 114% 123% 135%HS Enrollment 2409 2439 2481 2505 2582 2649 2736 2950 3240MS Utilization 89% 93% 92% 96% 101% 107% 109% 125% 145%MS Enrollment 1692 1753 1734 1809 1918 2028 2073 2370 2740ES Utilization 109% 109% 112% 109% 110% 111% 114% 114% 124%ES Enrollment 4287 4300 4411 4502 4544 4615 4700 4740 5150
Projections
GAITHERSBURG CLUSTER
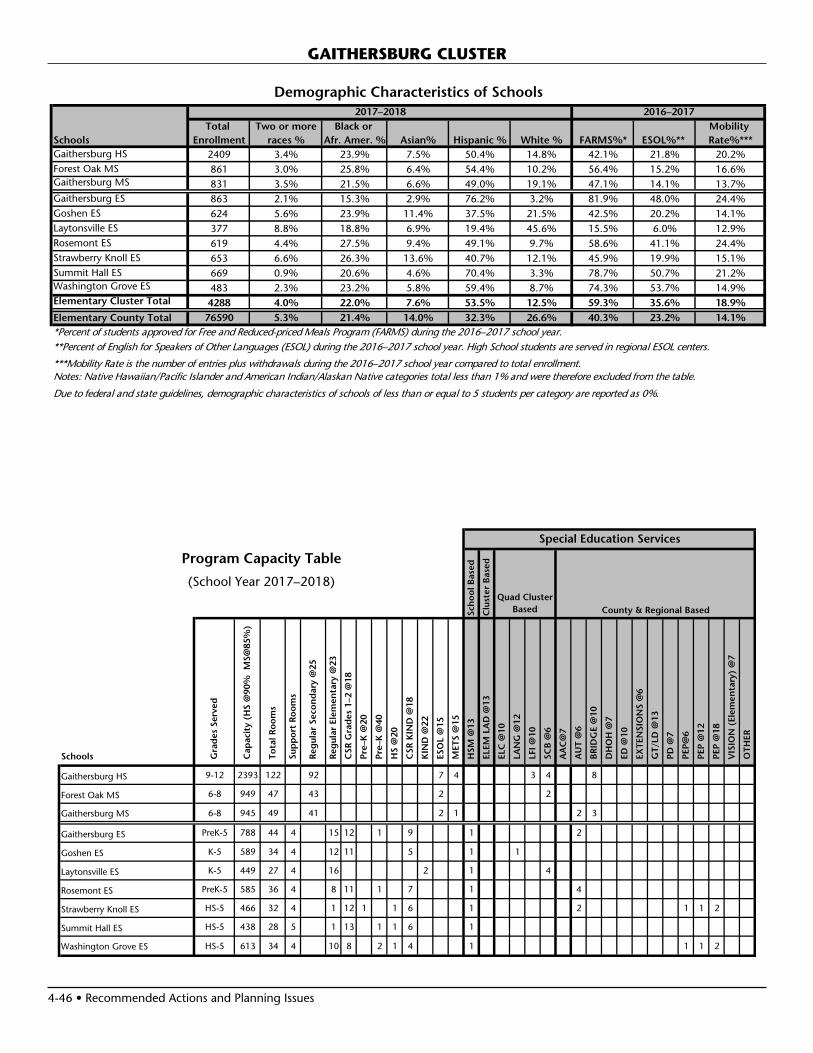
4-46 • Recommended Actions and Planning Issues
GAITHERSBURG CLUSTER
Demographic Characteristics of Schools
Total Two or more Black or Mobility Schools Enrollment races % Afr. Amer. % Asian% Hispanic % White % FARMS%* ESOL%** Rate%***Gaithersburg HS 2409 3.4% 23.9% 7.5% 50.4% 14.8% 42.1% 21.8% 20.2%Forest Oak MS 861 3.0% 25.8% 6.4% 54.4% 10.2% 56.4% 15.2% 16.6%Gaithersburg MS 831 3.5% 21.5% 6.6% 49.0% 19.1% 47.1% 14.1% 13.7%Gaithersburg ES 863 2.1% 15.3% 2.9% 76.2% 3.2% 81.9% 48.0% 24.4%Goshen ES 624 5.6% 23.9% 11.4% 37.5% 21.5% 42.5% 20.2% 14.1%Laytonsville ES 377 8.8% 18.8% 6.9% 19.4% 45.6% 15.5% 6.0% 12.9%Rosemont ES 619 4.4% 27.5% 9.4% 49.1% 9.7% 58.6% 41.1% 24.4%Strawberry Knoll ES 653 6.6% 26.3% 13.6% 40.7% 12.1% 45.9% 19.9% 15.1%Summit Hall ES 669 0.9% 20.6% 4.6% 70.4% 3.3% 78.7% 50.7% 21.2%Washington Grove ES 483 2.3% 23.2% 5.8% 59.4% 8.7% 74.3% 53.7% 14.9%Elementary Cluster Total 4288 4.0% 22.0% 7.6% 53.5% 12.5% 59.3% 35.6% 18.9%Elementary County Total 76590 5.3% 21.4% 14.0% 32.3% 26.6% 40.3% 23.2% 14.1%*Percent of students approved for Free and Reduced-priced Meals Program (FARMS) during the 2016–2017 school year.**Percent of English for Speakers of Other Languages (ESOL) during the 2016–2017 school year. High School students are served in regional ESOL centers.
***Mobility Rate is the number of entries plus withdrawals during the 2016–2017 school year compared to total enrollment.Notes: Native Hawaiian/Pacific Islander and American Indian/Alaskan Native categories total less than 1% and were therefore excluded from the table.
Due to federal and state guidelines, demographic characteristics of schools of less than or equal to 5 students per category are reported as 0%.
2017–2018 2016–2017
Schools Gra
des
Ser
ved
Cap
acit
y (H
S @
90%
MS@
85%
)
To
tal R
oo
ms
Sup
po
rt R
oo
ms
Reg
ular
Sec
on
dar
y @
25
Reg
ular
Ele
men
tary
@23
CSR
Gra
des
1–2
@18
Pre
–K @
20
Pre
–K @
40
HS
@20
CSR
KIN
D @
18
KIN
D @
22
ESO
L @
15
MET
S @
15
HSM
@13
ELE
M L
AD
@13
ELC
@10
LA
NG
@12
LFI
@10
SC
B @
6
AA
C@
7
AU
T @
6
BR
IDG
E @
10
DH
OH
@7
ED
@10
EX
TEN
SIO
NS
@6
GT/
LD @
13
PD
@7
PEP
@6
PEP
@12
PEP
@18
VIS
ION
(El
emen
tary
) @
7
OTH
ER
Gaithersburg HS 9-12 2393 122 92 7 4 3 4 8
Forest Oak MS 6-8 949 47 43 2 2
Gaithersburg MS 6-8 945 49 41 2 1 2 3
Gaithersburg ES PreK-5 788 44 4 15 12 1 9 1 2
Goshen ES K-5 589 34 4 12 11 5 1 1
Laytonsville ES K-5 449 27 4 16 2 1 4
Rosemont ES PreK-5 585 36 4 8 11 1 7 1 4
Strawberry Knoll ES HS-5 466 32 4 1 12 1 1 6 1 2 1 1 2
Summit Hall ES HS-5 438 28 5 1 13 1 1 6 1
Washington Grove ES HS-5 613 34 4 10 8 2 1 4 1 1 1 2
Program Capacity TableSpecial Education Services
Sch
oo
l Bas
ed
Clu
ster
Bas
ed
Quad Cluster Based County & Regional Based
(School Year 2017–2018)

Recommended Actions and Planning Issues • 4-47
GAITHERSBURG CLUSTER
Year Year Total Site Reloc- Home
Facility Reopened/ Square Size Adjacent atable County School
Schools Opened Revitalized Footage Acres Park Classrooms Programs Model
Gaithersburg HS 1951 2013 427,048 41.07 Yes SBWCForest Oak MS 1999 132,259 41.2 LTLGaithersburg MS 1960 1988 157,694 22.82 LTLGaithersburg ES 1947 94,468 9.22 11 SBHC YesGoshen ES 1988 76,740 10.5 2 YesLaytonsville ES 1951 1989 64,160 10.4 1 YesRosemont ES 1965 1995 88,764 8.9 3 SBHC YesStrawberry Knoll ES 1988 78,723 10.8 Yes 7 YesSummit Hall ES 1971 68,059 10.2 Yes 14 SBHC YesWashington Grove ES 1956 1984 86,266 10.7 SBHC Yes
Facility Characteristics of Schools 2017–2018

Recommended Actions and Planning Issues • 4-49
WALTER JOHNSON CLUSTER
CLUSTER PLANNING ISSUESPlanning Issue: The Walter Johnson Cluster has experienced large enrollment increases in the past eight years, primarily driven by the turnover of homes to younger families. New development in the cluster also has played a role, although by a significantly smaller amount than demographic changes in existing communities. The 2010 adopted White Flint Sector Plan provides for up to 9,800 new multi-family residential units over the next 20 to 30 years. A future elementary school site is recommended in the Plan. The Plan requires the rede-velopment of existing land uses and is phased with major transit and infrastructure improvements. The cluster also will see substantial amounts of new housing associated with the following land-use plans now under consideration: Rock Spring Master Plan, White Flint 2 Sector Plan and Grosvenor-Strathmore Metro Area Minor Master Plan. In addition, a new subdivision will be developed on the “WMAL property” located within the cluster.
A roundtable discussion group convened in spring 2016 to gather input on a range of approaches to accommodate short- and long-term enrollment increases in the Walter Johnson Cluster. The roundtable considered approaches at all three school levels. The Board of Education actions are summarized in the individual school sections below and also are avail-able on the MCPS website at the following link: http://www.montgomeryschoolsmd.org/uploadedFiles/departments/planning/SupplementB.WJClusterSchools(3).pdf
As part of the Board of Education action, the superintendent of schools convened the Woodward High School Reopening and Nontraditional Facilities Study Group in spring 2017 that included the Downcounty Consortium high schools along with Bethesda-Chevy Chase, Walter Johnson, and Walt Whitman high schools to develop ideas to study the reopening of the former Woodward High School. The study group also explored alternative programmatic, career technology education, or other educational options for high school students through the use of nontraditional facilities to address space deficits at these high schools as well as high schools countywide.
For additional information related to this study please refer to the MCPS website at the following link: http://www.montgomeryschoolsmd.org/departments/planning/workgroups.aspx
SCHOOLSWalter Johnson High SchoolCapital Project: Projections indicate enrollment at Walter Johnson High School will exceed capac-ity by over 700 seats by the end of the six-year planning period. An FY 2015 appropriation was completed for facility planning to determine the feasibility, scope, and cost for a classroom addition.
Planning Study: Due to the large enrollment increases the past eight years in the Walter Johnson
Cluster, a roundtable discussion group convened in spring 2016 to gather input on a range of approaches to accommo-date short- and long-term enrollment increases in the Walter Johnson Cluster. The roundtable considered approaches at all three school levels. The Board of Education actions are summarized in the individual school sections below and also are available on the MCPS website at the following link: http://www.montgomeryschoolsmd.org/uploadedFiles/departments/planning/SupplementB.WJClusterSchools(3).pdf
As part of the Board of Education action, the superintendent of schools convened the Woodward High School Reopening and Nontraditional Facilities Study Group in spring 2017 that included the Downcounty Consortium high schools along with Bethesda-Chevy Chase, Walter Johnson, and Walt Whitman high schools to develop ideas to study the reopening of the former Woodward High School. The study group also explored alternative programmatic, career technology education, or other educational options for high school students through the use of nontraditional facilities to address space deficits at these high schools as well as high schools countywide.
For additional information related to this study please refer to the MCPS website at the following link: http://www.montgomeryschoolsmd.org/departments/planning/workgroups.aspx
Woodward High SchoolCapital Project: To address the urgent space needs in the Downcounty Consortium high schools, expenditures are recommended to construct additional capacity and provide the instructional support spaces needed for 2,700 students at Northwood High School. Therefore, an FY 2019 appropriation is recommended to begin this project. Additionally, expendi-tures are recommended to reopen Woodward High School to address the remaining space deficits in the Downcounty Consortium high schools and Walter Johnson High School. An FY 2019 appropriation is recommended for planning funds to reopen Woodward High School. The current Woodward High School facility is significantly smaller than the proposed 2,700
0%
20%
40%
60%
80%
100%
120%
140%
160%
2017ACTUAL
2018 2019 2020 2021 2022 2023
Note: Percent utilization calculated as total enrollment of schools divided by total capacity. Projected capacity factors in capital projects.
Walter Johnson ClusterSchool Utilizations
Elementary Schools Middle Schools High School
DesiredRange

4-50 • Recommended Actions and Planning Issues
WALTER JOHNSON CLUSTER
student capacity. An addition, as the first phase of the project, is recommended to provide some of the needed capacity and for flexibility during construction. An FY 2019 appropriation is recommended for planning and construction funds for the first phase. Once planning is complete, recommendations will be included in the next full CIP regarding the phasing and completion dates for both high school projects.
North Bethesda Middle SchoolPlanning Study: Due to the large enrollment increases the past eight years in the Walter Johnson Cluster, a roundtable discussion group convened in spring 2016 to gather input on a range of approaches to accommodate short- and long-term enrollment in the Walter Johnson Cluster. Based on the outcome of the study, the Board of Education approved to continue with the addition at North Bethesda Middle School to address the projected space deficits at the school. More information relating to this study is available on the MCPS website at the following link: http://www.montgomeryschoolsmd.org/departments/planning/workgroups.aspx
Capital Project: Projections indicate enrollment at North Bethesda Middle School will exceed capacity by 150 seats or more by the end of the six-year CIP planning period. A classroom addition project is scheduled for this school with a completion date of September 2018. Relocatable classrooms will be utilized until additional capacity can be added.
Tilden Middle SchoolPlanning Study: On November 17, 2014, the Board of Edu-cation approved a roundtable discussion group (roundtable) to explore the possible collocation of Rock Terrace School with Tilden Middle School on the Tilden Lane site. With an upcoming revitalization/expansion project, Tilden Middle School was identified because of its central location in the Walter Johnson Cluster, its large site size, its accessibility to accommodate the two schools, and the long history of the Walter Johnson cluster serving special education students.
Board of Education Policy IOB, Education of Students with Disabilities, states that MCPS is committed to providing stu-dents with disabilities the opportunity to interact with non-disabled peers to the maximum extent possible. The Maryland State Department of Education (MSDE) has stated that state funding would be very difficult to acquire for stand-alone special education centers because students in these centers are not provided opportunities to receive instruction in the general education setting to the maximum extent appropriate. Following input from the roundtable and the community at large, the interim superintendent of schools recommended and, on May 12, 2015, the Board of Education approved the collocation of Rock Terrace School and Tilden Middle School.
Planning Study: Due to the large enrollment increases the past eight years in the Walter Johnson Cluster, a roundtable discussion group convened in spring 2016 to gather input on a range of approaches to accommodate short- and long-term
enrollment in the Walter Johnson Cluster. Based on the outcome of the study, the Board of Education approved to continue with the revitalization/expansion project at Tilden Middle School/Rock Terrace School to address the projected space deficits at this school. More information relating to this study is available on the MCPS website at the following link: http://www.montgomeryschoolsmd.org/departments/planning/workgroups.aspx
Capital Project: Tilden Middle School is currently located in the Woodward facility on Old Georgetown Road. Rather than revitalize/expand the Woodward facility for Rock Terrace School and Tilden Middle School, the current Tilden Holding Facility, located on Tilden Lane, will be revitalized/expanded to house both Rock Terrace School and Tilden Middle School.
A revitalization/expansion project is scheduled for this school with a completion date of September 2020. An FY 2019 ap-propriation is recommended to construct the project. In order for this project to be completed on this schedule, county and state funding must be provided at the levels recommended in this CIP.
Ashburton Elementary SchoolPlanning Study: Based on the input received from the roundtable discussion group conducted in spring 2016 to better address the growing enrollment in the Ashburton Elementary School service area, the Board of Education approved an addi-tion for a 770 student capacity and simultaneously construct a modular addition building to avoid permanently enlarging the school beyond the planned capacity of the school. Once the modular building is no longer required, it will be relocated for future use to another school. More information relating to this study is available on the MCPS website at the following link: http://www.montgomeryschoolsmd.org/departments/planning/workgroups.aspx
Capital Project: An FY 2018 appropriation was approved to begin the construction for an addition at this school. The completion date is scheduled for September 2019.
Farmland Elementary SchoolPlanning Study: Due to the large enrollment increases the past eight years in the Walter Johnson Cluster, a roundtable discussion group convened in spring 2016 to gather input on a range of approaches to accommodate short- and long-term enrollment in the Walter Johnson Cluster. To address the space deficits at Farmland Elementary School, the Board of Education approved that the enrollment be monitored, and if the space deficit continues to remain at this level, that student reassignments be considered to Luxmanor Elementary School one year prior to the completion of the Luxmanor Elementary School revitalization/expansion project.
More information relating to this study is available on the MCPS website at the following link: http://www.montgomeryschoolsmd.org/departments/planning/workgroups.aspx
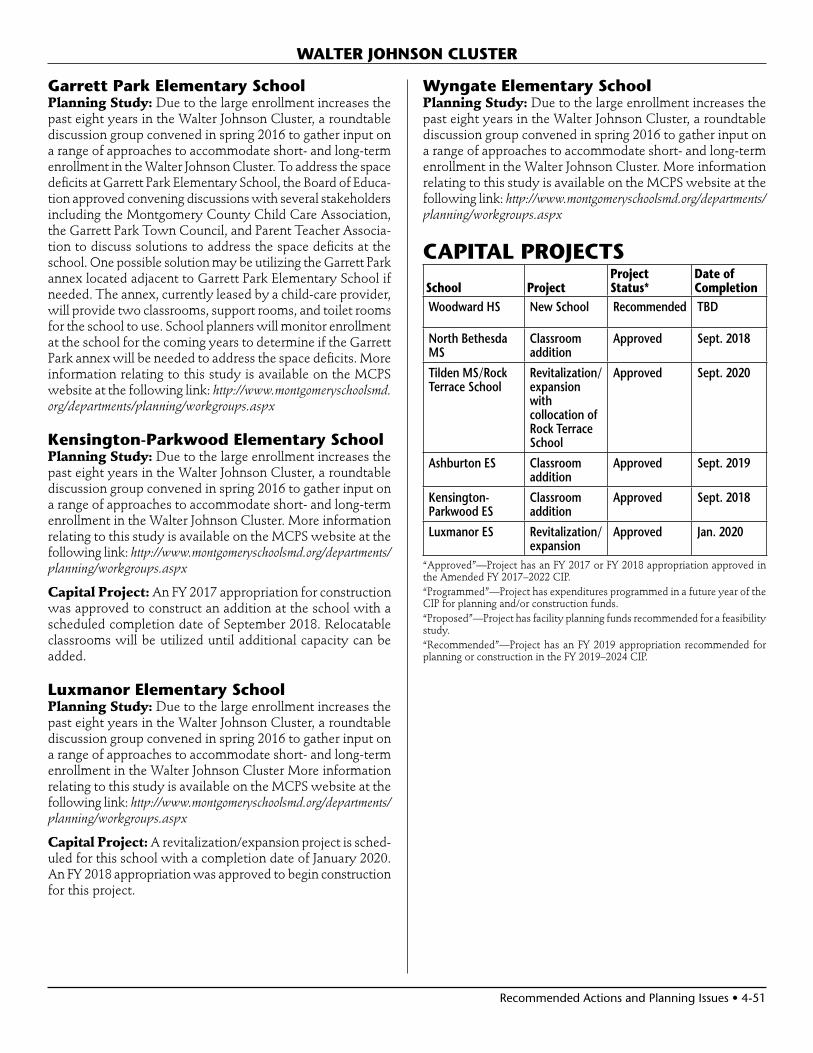
Recommended Actions and Planning Issues • 4-51
WALTER JOHNSON CLUSTER
Garrett Park Elementary SchoolPlanning Study: Due to the large enrollment increases the past eight years in the Walter Johnson Cluster, a roundtable discussion group convened in spring 2016 to gather input on a range of approaches to accommodate short- and long-term enrollment in the Walter Johnson Cluster. To address the space deficits at Garrett Park Elementary School, the Board of Educa-tion approved convening discussions with several stakeholders including the Montgomery County Child Care Association, the Garrett Park Town Council, and Parent Teacher Associa-tion to discuss solutions to address the space deficits at the school. One possible solution may be utilizing the Garrett Park annex located adjacent to Garrett Park Elementary School if needed. The annex, currently leased by a child-care provider, will provide two classrooms, support rooms, and toilet rooms for the school to use. School planners will monitor enrollment at the school for the coming years to determine if the Garrett Park annex will be needed to address the space deficits. More information relating to this study is available on the MCPS website at the following link: http://www.montgomeryschoolsmd.org/departments/planning/workgroups.aspx
Kensington-Parkwood Elementary SchoolPlanning Study: Due to the large enrollment increases the past eight years in the Walter Johnson Cluster, a roundtable discussion group convened in spring 2016 to gather input on a range of approaches to accommodate short- and long-term enrollment in the Walter Johnson Cluster. More information relating to this study is available on the MCPS website at the following link: http://www.montgomeryschoolsmd.org/departments/planning/workgroups.aspx
Capital Project: An FY 2017 appropriation for construction was approved to construct an addition at the school with a scheduled completion date of September 2018. Relocatable classrooms will be utilized until additional capacity can be added.
Luxmanor Elementary SchoolPlanning Study: Due to the large enrollment increases the past eight years in the Walter Johnson Cluster, a roundtable discussion group convened in spring 2016 to gather input on a range of approaches to accommodate short- and long-term enrollment in the Walter Johnson Cluster More information relating to this study is available on the MCPS website at the following link: http://www.montgomeryschoolsmd.org/departments/planning/workgroups.aspx
Capital Project: A revitalization/expansion project is sched-uled for this school with a completion date of January 2020. An FY 2018 appropriation was approved to begin construction for this project.
Wyngate Elementary SchoolPlanning Study: Due to the large enrollment increases the past eight years in the Walter Johnson Cluster, a roundtable discussion group convened in spring 2016 to gather input on a range of approaches to accommodate short- and long-term enrollment in the Walter Johnson Cluster. More information relating to this study is available on the MCPS website at the following link: http://www.montgomeryschoolsmd.org/departments/planning/workgroups.aspx
CAPITAL PROJECTS
School ProjectProject Status*
Date of Completion
Woodward HS New School Recommended TBD
North Bethesda MS
Classroom addition
Approved Sept. 2018
Tilden MS/Rock Terrace School
Revitalization/ expansion with collocation of Rock Terrace School
Approved Sept. 2020
Ashburton ES Classroom addition
Approved Sept. 2019
Kensington-Parkwood ES
Classroom addition
Approved Sept. 2018
Luxmanor ES Revitalization/ expansion
Approved Jan. 2020
“Approved”—Project has an FY 2017 or FY 2018 appropriation approved in the Amended FY 2017–2022 CIP.“Programmed”—Project has expenditures programmed in a future year of the CIP for planning and/or construction funds.“Proposed”—Project has facility planning funds recommended for a feasibility study.“Recommended”—Project has an FY 2019 appropriation recommended for planning or construction in the FY 2019–2024 CIP.

4-52 • Recommended Actions and Planning Issues
WALTER JOHNSON CLUSTER
Projected Enrollment and Space AvailabilityEffects of the Recommended FY 2019–2024 CIP and Non–CIP Actions on Space Available
Actual
Schools 17–18 18–19 19–20 20–21 21–22 22–23 23–24 2027 2032Walter Johnson HS Program Capacity 2330 2330 2330 2330 2330 2330 2330 2330 2330
Enrollment 2498 2606 2762 2882 2962 3018 3118 3520 4010Available Space (168) (276) (432) (552) (632) (688) (788) (1190) (1680)Comments See text
North Bethesda MS Program Capacity 872 1229 1229 1229 1229 1229 1229 1229 1229Enrollment 1165 1184 1200 1184 1140 1142 1188 1140 1110Available Space (293) 45 29 45 89 87 41 89 119Comments Addition
Complete
Tilden MS Program Capacity 960 960 960 1200 1200 1200 1200 1200 1200Enrollment 949 987 999 1043 1085 1151 1145 1310 1490Available Space 11 (27) (39) 157 115 49 55 (110) (290)Comments Rev/Ex
CompleteAug. 2020
Ashburton ES Program Capacity 666 666 770 770 770 770 770Enrollment 879 864 877 888 910 913 943Available Space (213) (198) (107) (118) (140) (143) (173)Comments Addition
Complete
Farmland ES Program Capacity 714 714 714 714 714 714 714Enrollment 799 806 833 834 846 839 839Available Space (85) (92) (119) (120) (132) (125) (125)Comments See text
Garrett Park ES Program Capacity 776 776 776 776 776 776 776Enrollment 831 849 868 876 861 860 883Available Space (55) (73) (92) (100) (85) (84) (107)Comments See text
Kensington–Parkwood ES Program Capacity 448 746 746 746 746 746 746Enrollment 657 657 655 657 657 659 647Available Space (209) 89 91 89 89 87 99Comments Addition
Complete
Luxmanor ES Program Capacity 406 406 758 758 758 758 758Enrollment 525 521 542 554 570 570 569Available Space (119) (115) 216 204 188 188 189Comments @ Rev/Ex
Grosvenor CompleteJan. 2020
Wyngate ES Program Capacity 777 777 777 777 777 777 777Enrollment 738 729 701 704 722 720 705Available Space 39 48 76 73 55 57 72Comments
Cluster Information HS Utilization 107% 112% 119% 124% 127% 130% 134% 151% 172%HS Enrollment 2498 2606 2762 2882 2962 3018 3118 3520 4010MS Utilization 115% 99% 100% 92% 92% 94% 96% 101% 107%MS Enrollment 2114 2171 2199 2227 2225 2293 2333 2450 2600ES Utilization 117% 108% 99% 99% 101% 100% 101% 104% 108%ES Enrollment 4429 4426 4476 4513 4566 4561 4586 4740 4890
Projections
Revitalization/Expansion in progress
See text
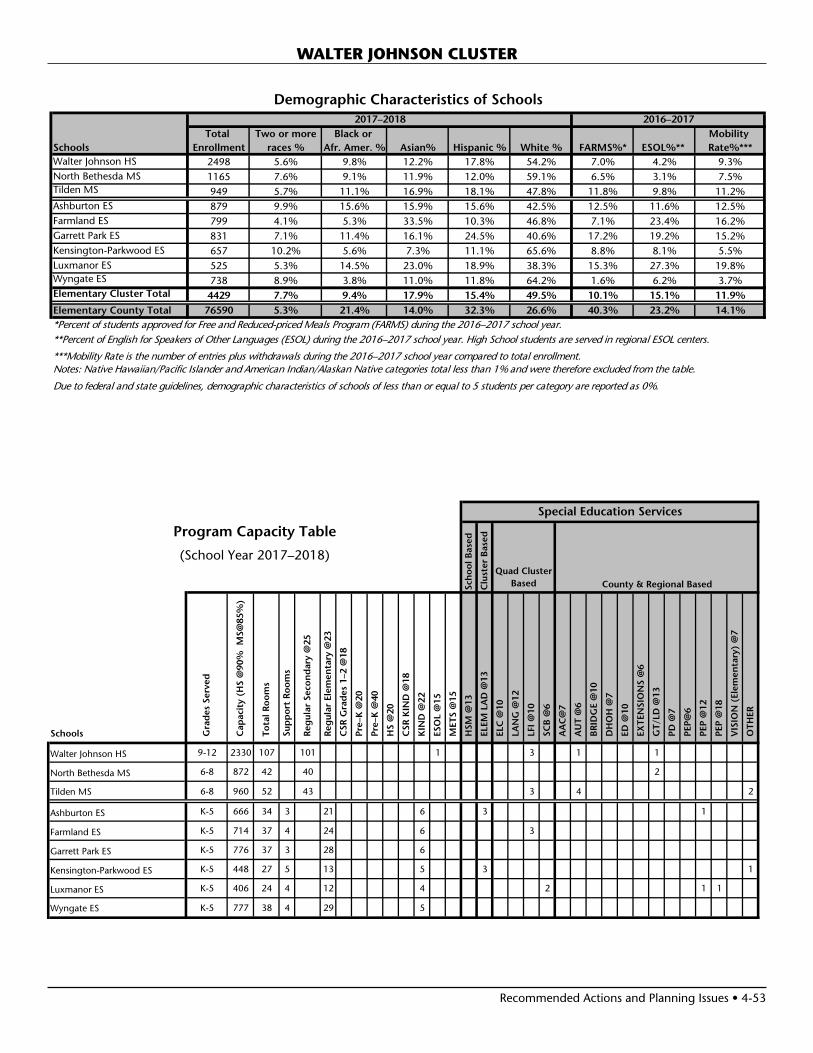
Recommended Actions and Planning Issues • 4-53
WALTER JOHNSON CLUSTER
Demographic Characteristics of Schools
Total Two or more Black or Mobility Schools Enrollment races % Afr. Amer. % Asian% Hispanic % White % FARMS%* ESOL%** Rate%***Walter Johnson HS 2498 5.6% 9.8% 12.2% 17.8% 54.2% 7.0% 4.2% 9.3%North Bethesda MS 1165 7.6% 9.1% 11.9% 12.0% 59.1% 6.5% 3.1% 7.5%Tilden MS 949 5.7% 11.1% 16.9% 18.1% 47.8% 11.8% 9.8% 11.2%Ashburton ES 879 9.9% 15.6% 15.9% 15.6% 42.5% 12.5% 11.6% 12.5%Farmland ES 799 4.1% 5.3% 33.5% 10.3% 46.8% 7.1% 23.4% 16.2%Garrett Park ES 831 7.1% 11.4% 16.1% 24.5% 40.6% 17.2% 19.2% 15.2%Kensington-Parkwood ES 657 10.2% 5.6% 7.3% 11.1% 65.6% 8.8% 8.1% 5.5%Luxmanor ES 525 5.3% 14.5% 23.0% 18.9% 38.3% 15.3% 27.3% 19.8%Wyngate ES 738 8.9% 3.8% 11.0% 11.8% 64.2% 1.6% 6.2% 3.7%Elementary Cluster Total 4429 7.7% 9.4% 17.9% 15.4% 49.5% 10.1% 15.1% 11.9%Elementary County Total 76590 5.3% 21.4% 14.0% 32.3% 26.6% 40.3% 23.2% 14.1%*Percent of students approved for Free and Reduced-priced Meals Program (FARMS) during the 2016–2017 school year.**Percent of English for Speakers of Other Languages (ESOL) during the 2016–2017 school year. High School students are served in regional ESOL centers.
***Mobility Rate is the number of entries plus withdrawals during the 2016–2017 school year compared to total enrollment.Notes: Native Hawaiian/Pacific Islander and American Indian/Alaskan Native categories total less than 1% and were therefore excluded from the table.
Due to federal and state guidelines, demographic characteristics of schools of less than or equal to 5 students per category are reported as 0%.
2017–2018 2016–2017
Schools Gra
des
Ser
ved
Cap
acit
y (H
S @
90%
MS@
85%
)
To
tal R
oo
ms
Sup
po
rt R
oo
ms
Reg
ular
Sec
on
dar
y @
25
Reg
ular
Ele
men
tary
@23
CSR
Gra
des
1–2
@18
Pre
–K @
20
Pre
–K @
40
HS
@20
CSR
KIN
D @
18
KIN
D @
22
ESO
L @
15
MET
S @
15
HSM
@13
ELE
M L
AD
@13
ELC
@10
LA
NG
@12
LFI
@10
SC
B @
6
AA
C@
7
AU
T @
6
BR
IDG
E @
10
DH
OH
@7
ED
@10
EX
TEN
SIO
NS
@6
GT/
LD @
13
PD
@7
PEP
@6
PEP
@12
PEP
@18
VIS
ION
(El
emen
tary
) @
7
OTH
ERWalter Johnson HS 9-12 2330 107 101 1 3 1 1
North Bethesda MS 6-8 872 42 40 2
Tilden MS 6-8 960 52 43 3 4 2
Ashburton ES K-5 666 34 3 21 6 3 1
Farmland ES K-5 714 37 4 24 6 3
Garrett Park ES K-5 776 37 3 28 6
Kensington-Parkwood ES K-5 448 27 5 13 5 3 1
Luxmanor ES K-5 406 24 4 12 4 2 1 1
Wyngate ES K-5 777 38 4 29 5
Program Capacity TableSpecial Education Services
Sch
oo
l Bas
ed
Clu
ster
Bas
ed
Quad Cluster Based County & Regional Based
(School Year 2017–2018)

4-54 • Recommended Actions and Planning Issues
WALTER JOHNSON CLUSTER
Year Year Total Site Reloc- Home
Facility Reopened/ Square Size Adjacent atable County School
Schools Opened Revitalized Footage Acres Park Classrooms Programs Model
Walter Johnson HS 1956 2009 365,138 30.9North Bethesda MS 1955 1999 130,461 19.99 5Tilden MS 1967 1991 135,150 29.8Ashburton ES 1957 1993 81,438 8.3 8Farmland ES 1963 2011 89,988 4.8 YesGarrett Park ES 1948 2012 96,348 4.4 YesKensington-Parkwood ES 1952 2006 77,136 9.9 7Luxmanor ES 1966 61,694 6.5 Yes 3Wyngate ES 1952 1997 89,104 9.5
Facility Characteristics of Schools 2017–2018

Recommended Actions and Planning Issues • 4-55
COL. ZADOK MAGRUDER CLUSTER
CLUSTER PLANNING ISSUESSince 2007, elementary school enrollment in the Gaithersburg Cluster has increased by 820 students. Some of this growth is due to new planned housing associated with the Shady Grove Sector Plan. A comprehensive capacity study was conducted during the 2014–2015 school year for the Gaithersburg Clus-ter to address enrollment growth in this area. Because of the challenges of enrollment growth, and absorption of large new residential developments, a tri-cluster roundtable discussion group convened in spring 2016, to take a broader look at school enrollments, utilization levels and facility options in the Gaithersburg Cluster. Three adjacent clusters participated in the Roundtable—Gaithersburg, Col. Zadok Magruder, and Thomas S. Wootton.
Planning Study: A boundary study was conducted in spring 2017 to reassign the portion of the Shady Grove Sector Plan that is located east of Interstate 370 in the Washington Grove Elementary School, Forest Oak Middle School, and Gaithers-burg High School service areas to the Col. Zadok Magruder Cluster schools. On August 31, 2017, the Board of Education authorized that a site selection committee be formed to evalu-ate potential school sites in the Gaithersburg Cluster. This potential school site could address the overutilization at the elementary schools in the cluster. The site selection process will occur in fall 2017, with Board of Education action in March 2018. The Boundary Advisory Committee Report for the Shady Grove Sector Plan boundary study was released on September 6, 2017. However, based on the approved site selection process, decisions regarding potential reassignments in the Shady Grove Sector Plan will not be considered until after the site selection process is complete.
SCHOOLSJudith A. Resnik Elementary SchoolCapital Project: A feasibility study was conducted in FY 2013 to determine the cost and scope of an addition project. Projections indicate enrollment will trend down over the six-year planning period at Judith A. Resnik Elementary School; however enrollment will continue to exceed capacity over the same time period. Therefore, planning will continue for the proposed addition project; however, expenditures for construction funds will be considered in a future CIP. Enrollment will continue to be moni-tored and relocatable classrooms will be utilized.
CAPITAL PROJECTS
School ProjectProject Status*
Date of Completion
Judith A. Resnik ES
Classroom addition
Approved TBD
“Approved”—Project has an FY 2017 or FY 2018 appropriation approved in the Amended FY 2017–2022 CIP.“Programmed”—Project has expenditures programmed in a future year of the CIP for planning and/or construction funds.“Proposed”—Project has facility planning funds recommended for a feasibility study.“Recommended”—Project has an FY 2019 appropriation recommended for planning or construction in the FY 2019–2024 CIP.
0%
20%
40%
60%
80%
100%
120%
2017ACTUAL
2018 2019 2020 2021 2022 2023
Note: Percent utilization calculated as total enrollment of schools divided by total capacity. Projected capacity factors in capital projects.
Col. Zadok Magruder ClusterSchool Utilizations
Elementary Schools Middle Schools High School
DesiredRange

4-56 • Recommended Actions and Planning Issues
COL. ZADOK MAGRUDER CLUSTER
Projected Enrollment and Space AvailabilityEffects of the Recommended FY 2019–2024 CIP and Non–CIP Actions on Space Available
Actual
Schools 17–18 18–19 19–20 20–21 21–22 22–23 23–24 2027 2032Col. Zadok Magruder HS Program Capacity 1950 1950 1950 1950 1950 1950 1950 1950 1950
Enrollment 1621 1592 1682 1683 1735 1854 1862 2090 2360Available Space 329 358 268 267 215 96 88 (140) (410)Comments
Redland MS Program Capacity 765 765 765 765 765 765 765 765 765Enrollment 560 609 670 676 698 634 631 660 660Available Space 205 156 95 89 67 131 134 105 105Comments
Shady Grove MS Program Capacity 846 846 846 846 846 846 846 846 846Enrollment 615 640 600 621 615 610 623 610 680Available Space 231 206 246 225 231 236 223 236 166Comments
Candlewood ES Program Capacity 514 514 514 514 514 514 514Enrollment 376 376 390 386 378 388 359Available Space 138 138 124 128 136 126 155Comments
Cashell ES Program Capacity 340 340 340 340 340 340 340Enrollment 382 405 394 391 412 412 403Available Space (42) (65) (54) (51) (72) (72) (63)Comments
Flower Hill ES CSR Program Capacity 465 465 465 465 465 465 465Enrollment 492 482 490 485 485 492 483Available Space (27) (17) (25) (20) (20) (27) (18)Comments
Mill Creek Towne ES CSR Program Capacity 321 321 321 321 321 321 321Enrollment 389 384 371 354 347 338 336Available Space (68) (63) (50) (33) (26) (17) (15)Comments
Judith A. Resnik ES CSR Program Capacity 498 498 498 498 498 498 498Enrollment 643 652 614 611 615 608 608Available Space (145) (154) (116) (113) (117) (110) (110)Comments Planning
for Addition
See textSequoyah ES CSR Program Capacity 508 508 508 508 508 508 508
Enrollment 388 386 353 335 347 358 381Available Space 120 122 155 173 161 150 127Comments
Cluster Information HS Utilization 83% 82% 86% 86% 89% 95% 95% 107% 121%HS Enrollment 1621 1592 1682 1683 1735 1854 1862 2090 2360MS Utilization 73% 78% 79% 81% 82% 77% 78% 79% 83%MS Enrollment 1175 1249 1270 1297 1313 1244 1254 1270 1340ES Utilization 101% 101% 99% 97% 98% 98% 97% 94% 91%ES Enrollment 2670 2685 2612 2562 2584 2596 2570 2480 2400
Projections
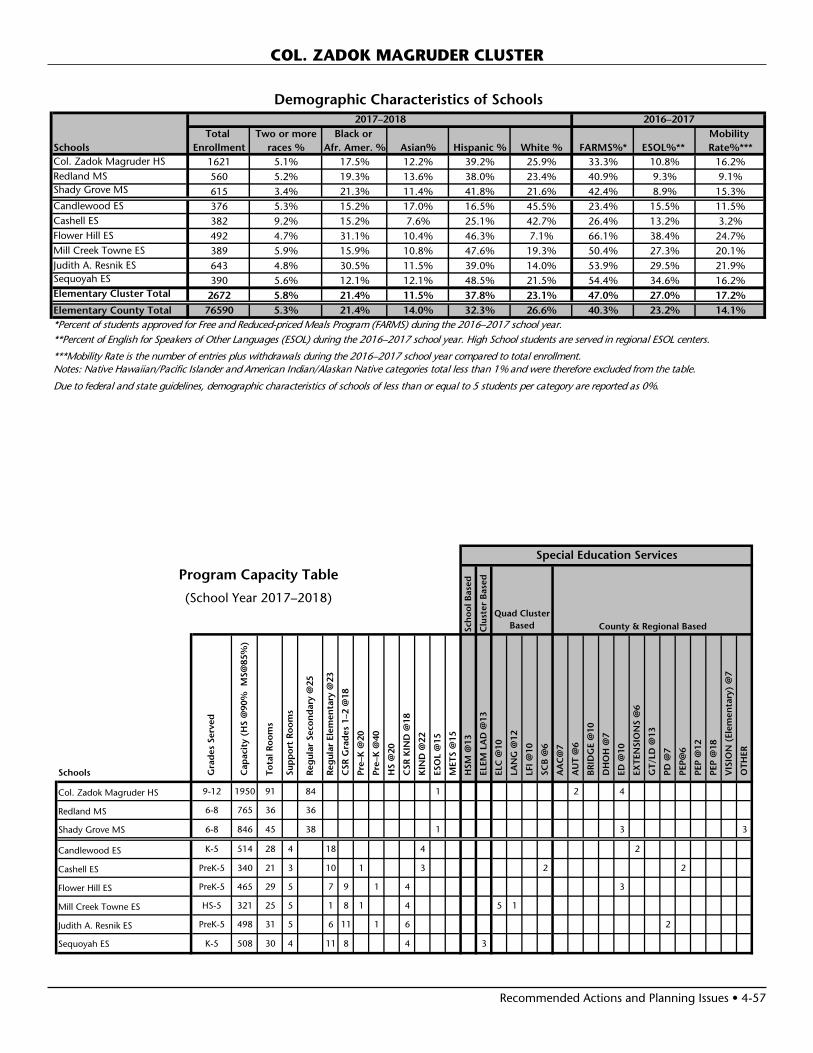
Recommended Actions and Planning Issues • 4-57
COL. ZADOK MAGRUDER CLUSTER
Demographic Characteristics of Schools
Total Two or more Black or Mobility Schools Enrollment races % Afr. Amer. % Asian% Hispanic % White % FARMS%* ESOL%** Rate%***Col. Zadok Magruder HS 1621 5.1% 17.5% 12.2% 39.2% 25.9% 33.3% 10.8% 16.2%Redland MS 560 5.2% 19.3% 13.6% 38.0% 23.4% 40.9% 9.3% 9.1%Shady Grove MS 615 3.4% 21.3% 11.4% 41.8% 21.6% 42.4% 8.9% 15.3%Candlewood ES 376 5.3% 15.2% 17.0% 16.5% 45.5% 23.4% 15.5% 11.5%Cashell ES 382 9.2% 15.2% 7.6% 25.1% 42.7% 26.4% 13.2% 3.2%Flower Hill ES 492 4.7% 31.1% 10.4% 46.3% 7.1% 66.1% 38.4% 24.7%Mill Creek Towne ES 389 5.9% 15.9% 10.8% 47.6% 19.3% 50.4% 27.3% 20.1%Judith A. Resnik ES 643 4.8% 30.5% 11.5% 39.0% 14.0% 53.9% 29.5% 21.9%Sequoyah ES 390 5.6% 12.1% 12.1% 48.5% 21.5% 54.4% 34.6% 16.2%Elementary Cluster Total 2672 5.8% 21.4% 11.5% 37.8% 23.1% 47.0% 27.0% 17.2%Elementary County Total 76590 5.3% 21.4% 14.0% 32.3% 26.6% 40.3% 23.2% 14.1%*Percent of students approved for Free and Reduced-priced Meals Program (FARMS) during the 2016–2017 school year.**Percent of English for Speakers of Other Languages (ESOL) during the 2016–2017 school year. High School students are served in regional ESOL centers.
***Mobility Rate is the number of entries plus withdrawals during the 2016–2017 school year compared to total enrollment.Notes: Native Hawaiian/Pacific Islander and American Indian/Alaskan Native categories total less than 1% and were therefore excluded from the table.
Due to federal and state guidelines, demographic characteristics of schools of less than or equal to 5 students per category are reported as 0%.
2017–2018 2016–2017
Schools Gra
des
Ser
ved
Cap
acit
y (H
S @
90%
MS@
85%
)
To
tal R
oo
ms
Sup
po
rt R
oo
ms
Reg
ular
Sec
on
dar
y @
25
Reg
ular
Ele
men
tary
@23
CSR
Gra
des
1–2
@18
Pre
–K @
20
Pre
–K @
40
HS
@20
CSR
KIN
D @
18
KIN
D @
22
ESO
L @
15
MET
S @
15
HSM
@13
ELE
M L
AD
@13
ELC
@10
LA
NG
@12
LFI
@10
SC
B @
6
AA
C@
7
AU
T @
6
BR
IDG
E @
10
DH
OH
@7
ED
@10
EX
TEN
SIO
NS
@6
GT/
LD @
13
PD
@7
PEP
@6
PEP
@12
PEP
@18
VIS
ION
(El
emen
tary
) @
7
OTH
ER
Col. Zadok Magruder HS 9-12 1950 91 84 1 2 4
Redland MS 6-8 765 36 36
Shady Grove MS 6-8 846 45 38 1 3 3
Candlewood ES K-5 514 28 4 18 4 2
Cashell ES PreK-5 340 21 3 10 1 3 2 2
Flower Hill ES PreK-5 465 29 5 7 9 1 4 3
Mill Creek Towne ES HS-5 321 25 5 1 8 1 4 5 1
Judith A. Resnik ES PreK-5 498 31 5 6 11 1 6 2
Sequoyah ES K-5 508 30 4 11 8 4 3
Program Capacity TableSpecial Education Services
Sch
oo
l Bas
ed
Clu
ster
Bas
ed
Quad Cluster Based County & Regional Based
(School Year 2017–2018)

4-58 • Recommended Actions and Planning Issues
COL. ZADOK MAGRUDER CLUSTER
Year Year Total Site Reloc- Home
Facility Reopened/ Square Size Adjacent atable County School
Schools Opened Revitalized Footage Acres Park Classrooms Programs Model
Col. Zadok Magruder HS 1970 295,478 30Redland MS 1971 112,297 20.64 YesShady Grove MS 1995 1999 129,206 20Candlewood ES 1968 2015 82,222 11.8Cashell ES 1969 2009 71,171 10.24 1Flower Hill ES 1985 58,770 10 Yes 3Mill Creek Towne ES 1966 2000 67,465 8.4 3Judith A. Resnik ES 1991 78,547 12.8 6Sequoyah ES 1990 72,582 10 Yes
Facility Characteristics of Schools 2017–2018
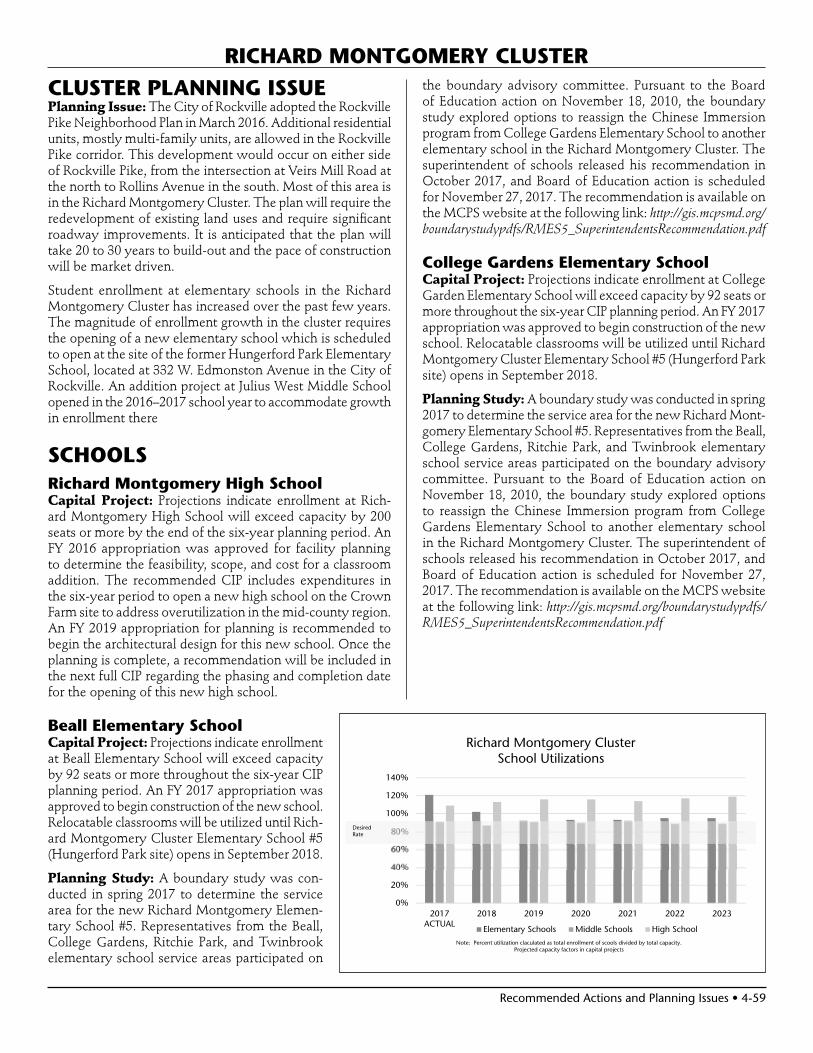
Recommended Actions and Planning Issues • 4-59
RICHARD MONTGOMERY CLUSTER
CLUSTER PLANNING ISSUE Planning Issue: The City of Rockville adopted the Rockville Pike Neighborhood Plan in March 2016. Additional residential units, mostly multi-family units, are allowed in the Rockville Pike corridor. This development would occur on either side of Rockville Pike, from the intersection at Veirs Mill Road at the north to Rollins Avenue in the south. Most of this area is in the Richard Montgomery Cluster. The plan will require the redevelopment of existing land uses and require significant roadway improvements. It is anticipated that the plan will take 20 to 30 years to build-out and the pace of construction will be market driven.
Student enrollment at elementary schools in the Richard Montgomery Cluster has increased over the past few years. The magnitude of enrollment growth in the cluster requires the opening of a new elementary school which is scheduled to open at the site of the former Hungerford Park Elementary School, located at 332 W. Edmonston Avenue in the City of Rockville. An addition project at Julius West Middle School opened in the 2016–2017 school year to accommodate growth in enrollment there
SCHOOLSRichard Montgomery High SchoolCapital Project: Projections indicate enrollment at Rich-ard Montgomery High School will exceed capacity by 200 seats or more by the end of the six-year planning period. An FY 2016 appropriation was approved for facility planning to determine the feasibility, scope, and cost for a classroom addition. The recommended CIP includes expenditures in the six-year period to open a new high school on the Crown Farm site to address overutilization in the mid-county region. An FY 2019 appropriation for planning is recommended to begin the architectural design for this new school. Once the planning is complete, a recommendation will be included in the next full CIP regarding the phasing and completion date for the opening of this new high school.
Beall Elementary SchoolCapital Project: Projections indicate enrollment at Beall Elementary School will exceed capacity by 92 seats or more throughout the six-year CIP planning period. An FY 2017 appropriation was approved to begin construction of the new school. Relocatable classrooms will be utilized until Rich-ard Montgomery Cluster Elementary School #5 (Hungerford Park site) opens in September 2018.
Planning Study: A boundary study was con-ducted in spring 2017 to determine the service area for the new Richard Montgomery Elemen-tary School #5. Representatives from the Beall, College Gardens, Ritchie Park, and Twinbrook elementary school service areas participated on
the boundary advisory committee. Pursuant to the Board of Education action on November 18, 2010, the boundary study explored options to reassign the Chinese Immersion program from College Gardens Elementary School to another elementary school in the Richard Montgomery Cluster. The superintendent of schools released his recommendation in October 2017, and Board of Education action is scheduled for November 27, 2017. The recommendation is available on the MCPS website at the following link: http://gis.mcpsmd.org/boundarystudypdfs/RMES5_SuperintendentsRecommendation.pdf
College Gardens Elementary SchoolCapital Project: Projections indicate enrollment at College Garden Elementary School will exceed capacity by 92 seats or more throughout the six-year CIP planning period. An FY 2017 appropriation was approved to begin construction of the new school. Relocatable classrooms will be utilized until Richard Montgomery Cluster Elementary School #5 (Hungerford Park site) opens in September 2018.
Planning Study: A boundary study was conducted in spring 2017 to determine the service area for the new Richard Mont-gomery Elementary School #5. Representatives from the Beall, College Gardens, Ritchie Park, and Twinbrook elementary school service areas participated on the boundary advisory committee. Pursuant to the Board of Education action on November 18, 2010, the boundary study explored options to reassign the Chinese Immersion program from College Gardens Elementary School to another elementary school in the Richard Montgomery Cluster. The superintendent of schools released his recommendation in October 2017, and Board of Education action is scheduled for November 27, 2017. The recommendation is available on the MCPS website at the following link: http://gis.mcpsmd.org/boundarystudypdfs/RMES5_SuperintendentsRecommendation.pdf
0%
20%
40%
60%
80%
100%
120%
140%
2017ACTUAL
2018 2019 2020 2021 2022 2023
Richard Montgomery ClusterSchool Utilizations
Elementary Schools Middle Schools High School
Desired Rate
Note: Percent utilization claculated as total enrollment of scools divided by total capacity.Projected capacity factors in capital projects

4-60 • Recommended Actions and Planning Issues
Ritchie Park Elementary SchoolCapital Project: Projections indicate enrollment at Ritchie Park Elementary School will exceed capacity by 92 seats or more throughout the six-year CIP planning period. An FY 2017 appropriation was approved to begin construction of the new school. Relocatable classrooms will be utilized until Richard Montgomery Cluster Elementary School #5 (Hungerford Park site) opens in September 2018.
Planning Study: A boundary study was conducted in spring 2017 to determine the service area for the new Richard Mont-gomery Elementary School #5. Representatives from the Beall, College Gardens, Ritchie Park, and Twinbrook elementary school service areas participated on the boundary advisory committee. Pursuant to the Board of Education action on November 18, 2010, the boundary study explored options to reassign the Chinese Immersion program from College Gardens Elementary School to another elementary school in the Richard Montgomery Cluster. The superintendent of schools released his recommendation in October 2017, and Board of Education action is scheduled for November 27, 2017. The recommendation is available on the MCPS website at the following link: http://gis.mcpsmd.org/boundarystudypdfs/RMES5_SuperintendentsRecommendation.pdf
Richard Montgomery Cluster Elementary School #5 (Hungerford Park site)Capital Project: A new school is scheduled to open in September 2018 to relieve projected overutilization in the Richard Montgomery Cluster. An FY 2017 appropriation was approved to begin construction of the new school. Funding is approved in the Rehabilitation and Renovation of Closed Schools (RROCS) project to construct the new elementary school.
Planning Study: A boundary study was conducted in spring 2017 to determine the service area for the new Richard Mont-gomery Elementary School #5. Representatives from the Beall, College Gardens, Ritchie Park, and Twinbrook elementary school service areas participated on the boundary advisory committee. Pursuant to the Board of Education action on November 18, 2010, the boundary study explored options to reassign the Chinese Immersion program from College Gardens Elementary School to another elementary school in the Richard Montgomery Cluster. The superintendent of schools released his recommendation in October 2017, and Board of Education action is scheduled for November 27, 2017. The recommendation is available on the MCPS website at the following link: http://gis.mcpsmd.org/boundarystudypdfs/RMES5_SuperintendentsRecommendation.pdf
RICHARD MONTGOMERY CLUSTER
Twinbrook Elementary SchoolCapital Project: Based on the Montgomery County Council Office of Legislative Oversight (OLO) study of the revitaliza-tion/expansion program released in July 2015, this program is under review in order to develop a multi-variable approach to determine the priority order of large-scale renovations of facilities, possibly including programmatic and capacity considerations. Recommendations regarding possible changes to this program will be released once the review is complete. (For more information see Appendix J.)
Planning Study: A boundary study was conducted in spring 2017 to determine the service area for the new Richard Mont-gomery Elementary School #5. Representatives from the Beall, College Gardens, Ritchie Park, and Twinbrook elementary school service areas participated on the boundary advisory committee. Pursuant to the Board of Education action on November 18, 2010, the boundary study explored options to reassign the Chinese Immersion program from College Gardens Elementary School to another elementary school in the Richard Montgomery Cluster. The superintendent of schools released his recommendation in October 2017, and Board of Education action is scheduled for November 27, 2017. The recommendation is available on the MCPS website at the following link: http://gis.mcpsmd.org/boundarystudypdfs/RMES5_SuperintendentsRecommendation.pdf
CAPITAL PROJECTS
School ProjectProject Status*
Date of Completion
Richard Montgomery Cluster ES #5
New school Approved Sept. 2018
“Approved”—Project has an FY 2017 or FY 2018 appropriation approved in the Amended FY 2017–2022 CIP.“Programmed”—Project has expenditures programmed in a future year of the CIP for planning and/or construction funds.“Proposed”—Project has facility planning funds recommended for a feasibility study.“Recommended”—Project has an FY 2019 appropriation recommended for planning or construction in the FY 2019–2024 CIP.
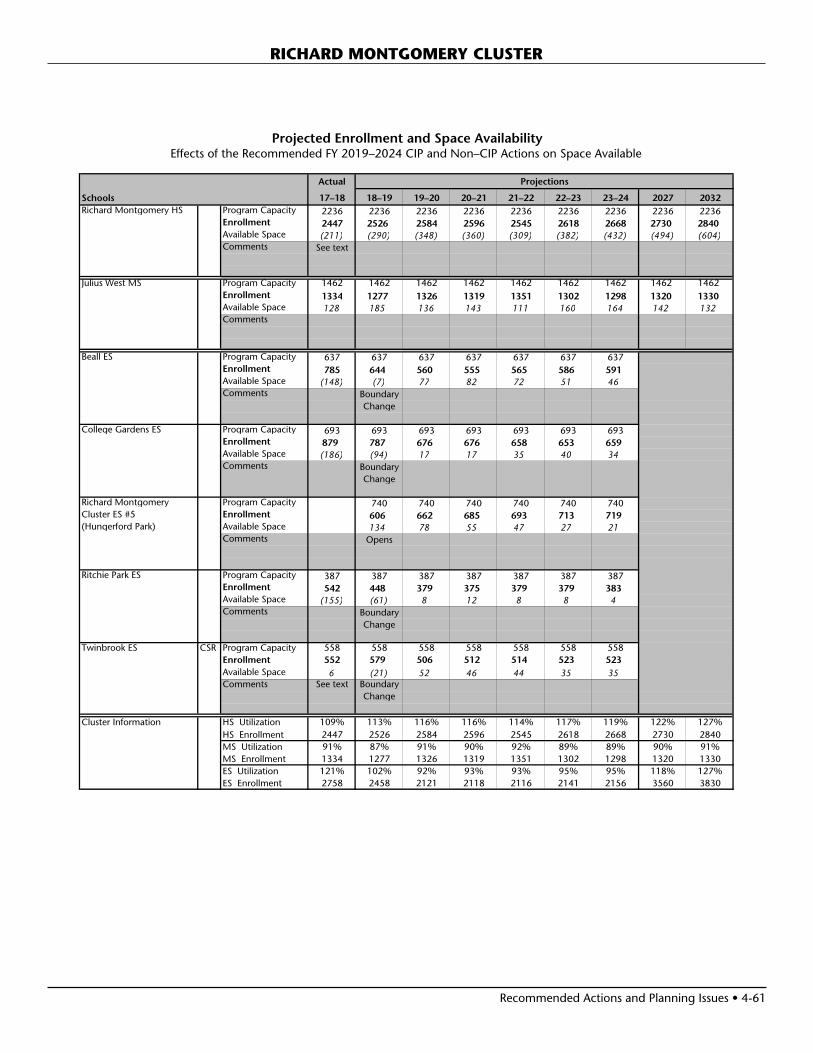
Recommended Actions and Planning Issues • 4-61
RICHARD MONTGOMERY CLUSTER
Projected Enrollment and Space AvailabilityEffects of the Recommended FY 2019–2024 CIP and Non–CIP Actions on Space Available
Actual
Schools 17–18 18–19 19–20 20–21 21–22 22–23 23–24 2027 2032Richard Montgomery HS Program Capacity 2236 2236 2236 2236 2236 2236 2236 2236 2236
Enrollment 2447 2526 2584 2596 2545 2618 2668 2730 2840Available Space (211) (290) (348) (360) (309) (382) (432) (494) (604)Comments See text
Julius West MS Program Capacity 1462 1462 1462 1462 1462 1462 1462 1462 1462Enrollment 1334 1277 1326 1319 1351 1302 1298 1320 1330Available Space 128 185 136 143 111 160 164 142 132Comments
Beall ES Program Capacity 637 637 637 637 637 637 637Enrollment 785 644 560 555 565 586 591Available Space (148) (7) 77 82 72 51 46Comments Boundary
Change
College Gardens ES Program Capacity 693 693 693 693 693 693 693Enrollment 879 787 676 676 658 653 659Available Space (186) (94) 17 17 35 40 34Comments Boundary
Change
Richard Montgomery Program Capacity 740 740 740 740 740 740Cluster ES #5 Enrollment 606 662 685 693 713 719(Hungerford Park) Available Space 134 78 55 47 27 21
Comments Opens
Ritchie Park ES Program Capacity 387 387 387 387 387 387 387Enrollment 542 448 379 375 379 379 383Available Space (155) (61) 8 12 8 8 4Comments Boundary
Change
Twinbrook ES CSR Program Capacity 558 558 558 558 558 558 558Enrollment 552 579 506 512 514 523 523Available Space 6 (21) 52 46 44 35 35Comments See text Boundary
Change
Cluster Information HS Utilization 109% 113% 116% 116% 114% 117% 119% 122% 127%HS Enrollment 2447 2526 2584 2596 2545 2618 2668 2730 2840MS Utilization 91% 87% 91% 90% 92% 89% 89% 90% 91%MS Enrollment 1334 1277 1326 1319 1351 1302 1298 1320 1330ES Utilization 121% 102% 92% 93% 93% 95% 95% 118% 127%ES Enrollment 2758 2458 2121 2118 2116 2141 2156 3560 3830
Projections
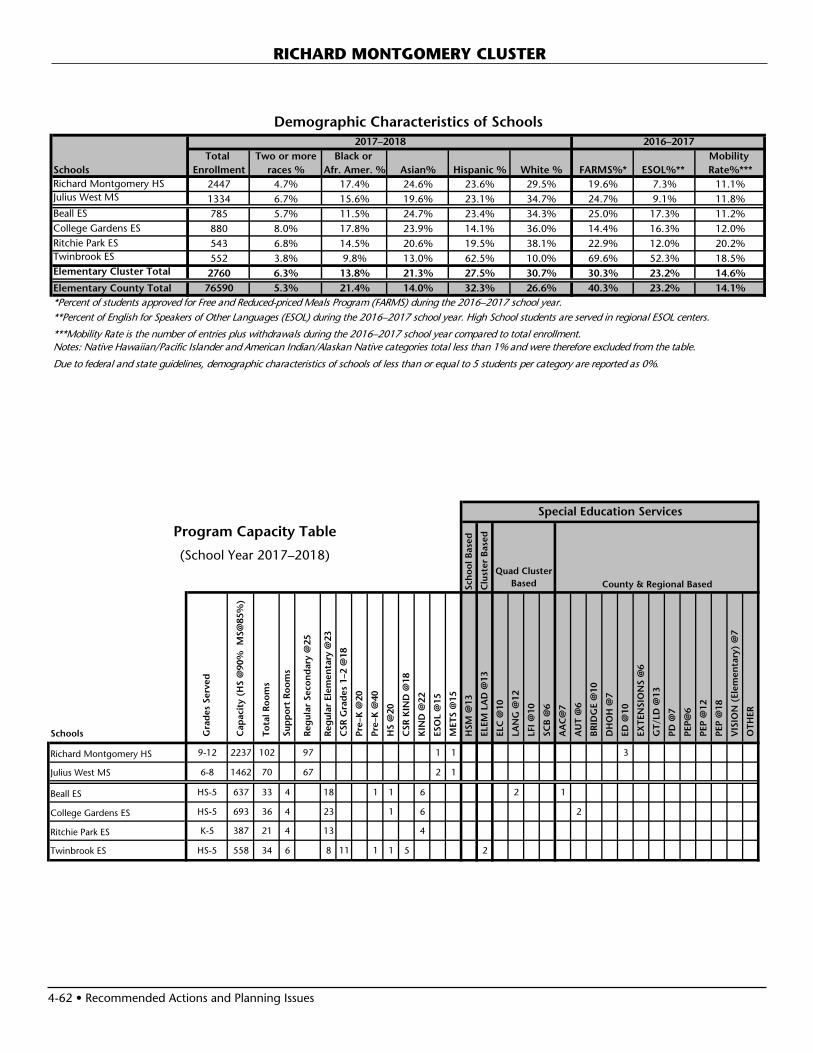
4-62 • Recommended Actions and Planning Issues
RICHARD MONTGOMERY CLUSTER
Demographic Characteristics of Schools
Total Two or more Black or Mobility Schools Enrollment races % Afr. Amer. % Asian% Hispanic % White % FARMS%* ESOL%** Rate%***Richard Montgomery HS 2447 4.7% 17.4% 24.6% 23.6% 29.5% 19.6% 7.3% 11.1%Julius West MS 1334 6.7% 15.6% 19.6% 23.1% 34.7% 24.7% 9.1% 11.8%Beall ES 785 5.7% 11.5% 24.7% 23.4% 34.3% 25.0% 17.3% 11.2%College Gardens ES 880 8.0% 17.8% 23.9% 14.1% 36.0% 14.4% 16.3% 12.0%Ritchie Park ES 543 6.8% 14.5% 20.6% 19.5% 38.1% 22.9% 12.0% 20.2%Twinbrook ES 552 3.8% 9.8% 13.0% 62.5% 10.0% 69.6% 52.3% 18.5%Elementary Cluster Total 2760 6.3% 13.8% 21.3% 27.5% 30.7% 30.3% 23.2% 14.6%Elementary County Total 76590 5.3% 21.4% 14.0% 32.3% 26.6% 40.3% 23.2% 14.1%*Percent of students approved for Free and Reduced-priced Meals Program (FARMS) during the 2016–2017 school year.**Percent of English for Speakers of Other Languages (ESOL) during the 2016–2017 school year. High School students are served in regional ESOL centers.
***Mobility Rate is the number of entries plus withdrawals during the 2016–2017 school year compared to total enrollment.Notes: Native Hawaiian/Pacific Islander and American Indian/Alaskan Native categories total less than 1% and were therefore excluded from the table.
Due to federal and state guidelines, demographic characteristics of schools of less than or equal to 5 students per category are reported as 0%.
2017–2018 2016–2017
Schools Gra
des
Ser
ved
Cap
acit
y (H
S @
90%
MS@
85%
)
To
tal R
oo
ms
Sup
po
rt R
oo
ms
Reg
ular
Sec
on
dar
y @
25
Reg
ular
Ele
men
tary
@23
CSR
Gra
des
1–2
@18
Pre
–K @
20
Pre
–K @
40
HS
@20
CSR
KIN
D @
18
KIN
D @
22
ESO
L @
15
MET
S @
15
HSM
@13
ELE
M L
AD
@13
ELC
@10
LA
NG
@12
LFI
@10
SC
B @
6
AA
C@
7
AU
T @
6
BR
IDG
E @
10
DH
OH
@7
ED
@10
EX
TEN
SIO
NS
@6
GT/
LD @
13
PD
@7
PEP
@6
PEP
@12
PEP
@18
VIS
ION
(El
emen
tary
) @
7
OTH
ERRichard Montgomery HS 9-12 2237 102 97 1 1 3
Julius West MS 6-8 1462 70 67 2 1
Beall ES HS-5 637 33 4 18 1 1 6 2 1
College Gardens ES HS-5 693 36 4 23 1 6 2
Ritchie Park ES K-5 387 21 4 13 4
Twinbrook ES HS-5 558 34 6 8 11 1 1 5 2
Program Capacity TableSpecial Education Services
Sch
oo
l Bas
ed
Clu
ster
Bas
ed
Quad Cluster Based County & Regional Based
(School Year 2017–2018)

Recommended Actions and Planning Issues • 4-63
RICHARD MONTGOMERY CLUSTER
Year Year Total Site Reloc- Home
Facility Reopened/ Square Size Adjacent atable County School
Schools Opened Revitalized Footage Acres Park Classrooms Programs Model
Richard Montgomery HS 1942 2007 311,500 29.05Julius West MS 1961 1995 182,617 21.3Beall ES 1954 1991 79,477 8.4 Yes 8College Gardens ES 1967 2008 96,986 7.9 Yes 6Ritchie Park ES 1966 1997 58,500 9.2 6Twinbrook ES 1952 1986 79,818 10.5 2
Facility Characteristics of Schools 2017–2018

Recommended Actions and Planning Issues • 4-65
CONSORTIUM PLANNING ISSUESThe Northeast Consortium provides a program delivery model for the three high schools in the northeast area of the county. Students living in this area of the county are able to choose from three high schools they wish to attend, based on different signature programs offered at the high schools. The Northeast Consortium choice programs are offered at James Hubert Blake, Paint Branch, and Springbrook high schools. Choice patterns will be monitored for their impact on projected enrollment and facility utilization.
Elementary and secondary school service area maps are in-cluded for the three consortium high schools in Appendix Y. Students residing in a base area are guaranteed to attend the high school serving that base area, if it is their first choice.
Planning Issue: The 2014 adopted White Oak Science Gate-way Master Plan provides for up to 8,570 mostly multi-family residential units. The plan will require the redevelopment of many existing land uses. Montgomery County anticipates that it will take 20 to 30 years for build-out of the plan to occur and the pace of construction will be market driven. A future elementary school site is included in the plan.
SCHOOLSPaint Branch High SchoolCapital Project: Previous projections indicated enrollment at Paint Branch High School would exceed capacity by 200 seats or more by the end of the last six-year planning period, therefore an FY 2017 appropriation was approved for facility planning to determine the feasibility, scope, and cost for a classroom addition. The current space deficit, however, does not meet the minimum threshold of 200 seats or more for consideration of an addition project. Therefore, enrollment will continue to be monitored and a date for the addition will be considered in a future CIP if needed. Relocatable classrooms will be utilized until additional capacity can be added.
Burnt Mills Elementary SchoolCapital Project: An FY 2012 appropriation was approved for facility planning to determine the feasibility, scope, and cost for a classroom addition. Current projections indicate enrollment at Burnt Mills Elementary School will exceed capacity by 92 seats or more by the end of the six-year planning period. In addition to the over-utilization at this school, various building systems may need to be addressed. A new approach to address capacity and building infrastructure is under review in order to develop a multi-variable approach to determine the priority order of large-scale renovations of facilities, possibly includ-ing programmatic and capacity considerations. Recommendations regarding possible changes to this program will be released once the review
is complete. Relocatable classrooms will be utilized until additional capacity can be added.
Burtonsville Elementary SchoolCapital Project: Previous projections indicated enrollment at Burtonsville Elementary School would exceed capacity by 92 seats or more by the end of the six-year planning period. Therefore, a feasibility study was conducted in FY 2013 to determine the cost and scope of an addition project. Current projections indicate enrollment will fall below the 92 seat threshold by the end of the six-year period. Therefore, plan-ning will continue for the proposed addition project; however, expenditures for construction funds will be considered in a future CIP. Enrollment will continue to be monitored and relocatable classrooms will be utilized.
Cresthaven Elementary SchoolPlanning Study: To address the space deficits at JoAnn Leleck Elementary School at Broad Acres, feasibility studies were conducted during the 2016–2017 school year at Cres-thaven and Roscoe Nix elementary schools, to determine if these schools can be expanded to address the space deficits at JoAnn Leleck Elementary School at Broad Acres.
Capital Project: Projections indicate that enrollment at JoAnn Leleck Elementary School at Broad Acres will exceed capacity throughout the six-year planning period. Therefore, an FY 2019 appropriation is recommended to begin the archi-tectural planning and design for an addition project, with a scheduled completion date of September 2021. In order for this project to be completed on this schedule, county and state funding must be provided at the levels recommended in this CIP.
NORTHEAST CONSORTIUM
����������������������������������������������������������������������������������
����������������������������������
����������������������� ������������������������������
���������� ���������������
��������� ������������ ���� ���������� ���������� �� �� �� ��
�������������� ����������� �������������� ������ ������ ����������������������� ������������ ������������ �� ���������� ���� ������
���� �������� �� ����� ������������� ����������� ���������������������������� ��������������� ��� ����������
� �������� ���� �������������� ����������������������������������������������� ���� ������������������������������������������ ���
������������������� ��������� ����������������������������������� ������������ ������ ���
JoAnn Leleck ES at Broad Acres
Jackson Road ESStonegate ES*Westover ES

4-66 • Recommended Actions and Planning Issues
NORTHEAST CONSORTIUM
Greencastle Elementary SchoolCapital Project: Previous projections indicated enrollment at Greencastle Elementary School would exceed capacity by 92 seats or more by the end of the six-year planning period. A feasibility study was conducted to determine the cost and scope of an addition project. Current projections indicate enrollment will remain stable at Greencastle Elementary School over the six-year planning period; however enrollment will exceed capacity over the same time period. Therefore, enrollment will continue to be monitored and relocatable classrooms will be utilized.
JoAnn Leleck Elementary School at Broad AcresPlanning Study: Projections indicated enrollment at JoAnn Leleck Elementary School at Broad Acres will exceed capacity by 92 seats or more by the end of the six-year planning period. An FY 2014 appropriation was approved for facility planning to determine the feasibility, scope, and cost for a classroom addition. The outcome of the feasibility study determined that due to site limitations, it is difficult to expand the facility to meet the enrollment growth needs. Therefore, feasibility studies were conducted during the 2016–2017 school year at Cresthaven and Roscoe Nix elementary schools, to determine if these schools can be expanded to address the space deficits at JoAnn Leleck Elementary School at Broad Acres. Relocat-able classrooms will be utilized until a plan can be developed for this school.
Capital Project: Projections indicate that enrollment at JoAnn Leleck Elementary School at Broad Acres will exceed capacity throughout the six-year planning period, with over an 800 student enrollment. Currently, the school has 10 relocatable classrooms and, due to the site, it will be a chal-lenge to place additional relocatable classrooms if necessary. Therefore, FY 2019 appropriations are recommended to begin the architectural planning and design for addition projects at Cresthaven and Roscoe Nix elementary schools, with sched-uled completion dates of September 2021. In order for these projects to be completed on this schedule, county and state funding must be provided at the levels recommended in this CIP.
Capital Project: Based on the Montgomery County Council Office of Legislative Oversight (OLO) study of the revitalization/expansion program released in July 2015, this program is under review in order to develop a multi-variable approach to determine the priority order of large-scale renovations of facilities, possibly includ-ing programmatic and capacity considerations. Recommendations regarding possible changes to this program will be released once the review is complete.
Roscoe Nix Elementary SchoolPlanning Study: To address the space deficits at JoAnn Leleck Elementary School at Broad Acres, feasibility studies will be conducted during the 2016–2017 school year at Cresthaven and Roscoe Nix elementary schools, to determine if these schools can be expanded to address the space deficits at JoAnn Leleck Elementary School at Broad Acres.
Capital Project: Projections indicate that enrollment at JoAnn Leleck Elementary School at Broad Acres will exceed capacity throughout the six-year planning period. Therefore, an FY 2019 appropriation is recommended to begin the archi-tectural planning and design for an addition project, with a scheduled completion date of September 2021. In order for this project to be completed on this schedule, county and state funding must be provided at the levels recommended in this CIP.
Stonegate Elementary SchoolCapital Project: Based on the Montgomery County Council Office of Legislative Oversight (OLO) study of the revitaliza-tion/expansion program released in July 2015, this program is under review in order to develop a multi-variable approach to determine the priority order of large-scale renovations of facilities, possibly including programmatic and capacity considerations. Recommendations regarding possible changes to this program will be released once the review is complete.
Capital Project: Current projections indicate enrollment at Stonegate Elementary School will exceed capacity throughout the six-year planning period. In addition to the overutiliza-tion at this school, various building systems may need to be addressed. A new approach to address capacity and building infrastructure is under review in order to develop a multi-variable approach to determine the priority order of large-scale renovations of facilities, possibly including programmatic and capacity considerations. Recommendations regarding possible changes to this program will be released once the review is complete. Relocatable classrooms will be utilized until additional capacity can be added.
0%
20%
40%
60%
80%
100%
120%
2017ACTUAL
2018 2019 2020 2021 2022 2023
Note: Percent utilization calculated as total enrollment of schools divided by total capacity.Projected capacity factors in capital projects.
Northeast ConsortiumSchool Utilizations
Elementary Schools Middle Schools High School
DesiredRange

Recommended Actions and Planning Issues • 4-67
NORTHEAST CONSORTIUM
CAPITAL PROJECTS
School ProjectProject Status*
Date of Completion
Burtonsville ES Classroom addition
Approved TBD
Cresthaven ES Classroom addition
Recommended Sept. 2021
Roscoe Nix ES Classroom addition
Recommended Sept. 2021
“Approved”—Project has an FY 2017 or FY 2018 appropriation approved in the Amended FY 2017–2022 CIP.“Programmed”—Project has expenditures programmed in a future year of the CIP for planning and/or construction funds.“Proposed”—Project has facility planning funds recommended for a feasibility study.“Recommended”—Project has an FY 2019 appropriation recommended for planning or construction in the FY 2019–2024 CIP.

4-68 • Recommended Actions and Planning Issues
NORTHEAST CONSORTIUM
Projected Enrollment and Space AvailabilityEffects of the Recommended FY 2019–2024 CIP and Non–CIP Actions on Space Available
Actual
Schools 17–18 18–19 19–20 20–21 21–22 22–23 23–24 2027 2032James Hubert Blake HS Program Capacity 1743 1743 1743 1743 1743 1743 1743 1743 1743
Enrollment 1626 1687 1727 1751 1752 1815 1862 1980 2140Available Space 117 56 16 (8) (9) (72) (119) (237) (397)Comments
Paint Branch HS Program Capacity 2020 2020 2020 2020 2020 2020 2020 2020 2020Enrollment 2006 2066 2135 2165 2130 2192 2189 2290 2390Available Space 14 (46) (114) (144) (110) (172) (169) (270) (370)Comments
Springbrook HS Program Capacity 2121 2121 2121 2121 2121 2121 2121 2121 2121Enrollment 1799 1821 1845 1937 1945 1985 1994 2160 2350Available Space 322 300 276 184 176 136 127 (39) (229)Comments
Benjamin Banneker MS Program Capacity 812 812 812 812 812 812 812 812 812Enrollment 841 841 852 807 788 711 710 650 570Available Space (29) (29) (40) 5 24 101 102 162 242Comments
Briggs Chaney MS Program Capacity 918 918 918 918 918 918 918 918 918Enrollment 888 922 942 952 968 954 956 990 1020Available Space 30 (4) (24) (34) (50) (36) (38) (72) (102)Comments
William H. Farquhar MS Program Capacity 800 800 800 800 800 800 800 800 800Enrollment 703 696 664 638 611 618 592 560 510Available Space 97 104 136 162 189 182 208 240 290Comments
Francis Scott Key MS Program Capacity 969 969 969 969 969 969 969 969 969Enrollment 998 1020 1063 1047 1067 1052 1050 1080 1090Available Space (29) (51) (94) (78) (98) (83) (81) (111) (121)Comments
White Oak MS Program Capacity 978 978 978 978 978 978 978 978 978Enrollment 790 786 812 854 885 903 936 1060 1210Available Space 188 192 166 124 93 75 42 (82) (232)Comments
Projections
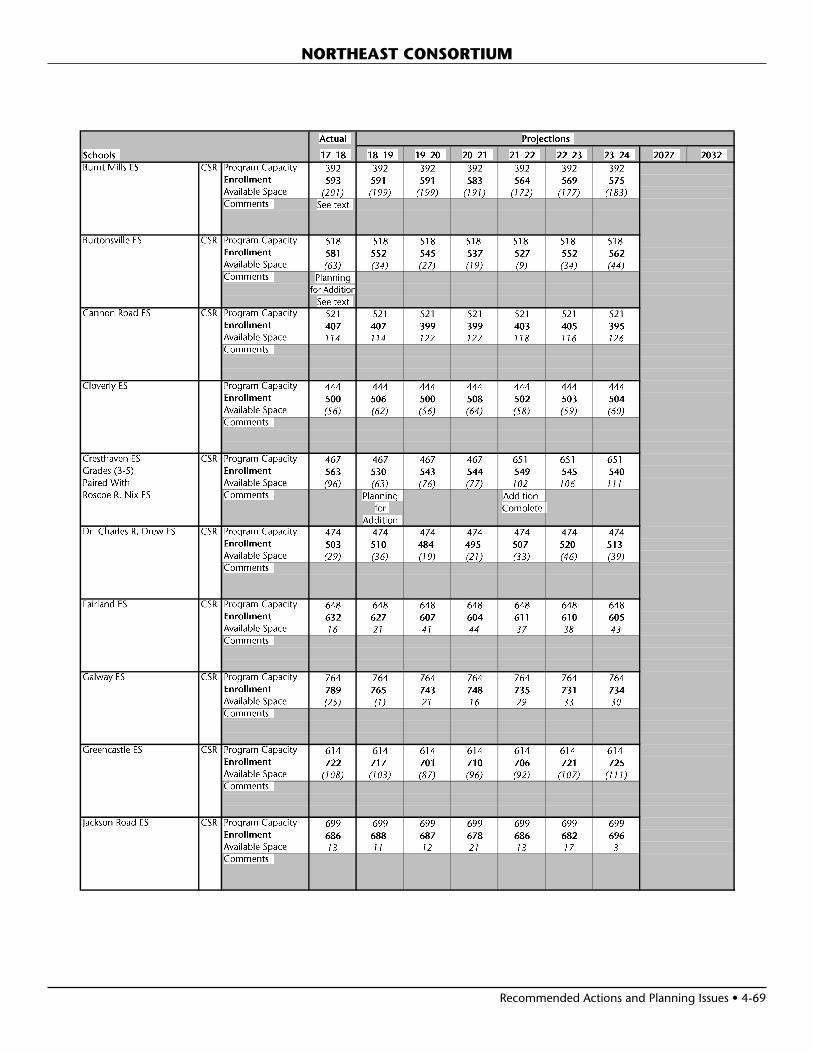
Recommended Actions and Planning Issues • 4-69
NORTHEAST CONSORTIUM
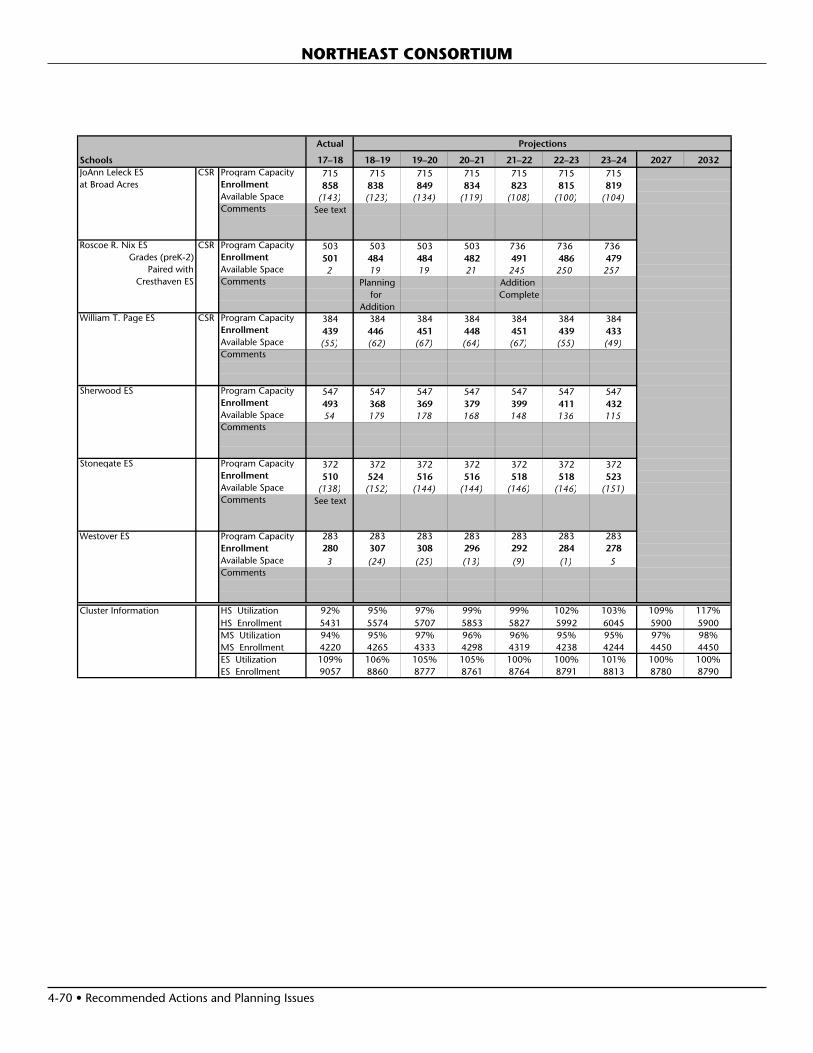
4-70 • Recommended Actions and Planning Issues
NORTHEAST CONSORTIUM
Actual
Schools 17–18 18–19 19–20 20–21 21–22 22–23 23–24 2027 2032JoAnn Leleck ES CSR Program Capacity 715 715 715 715 715 715 715at Broad Acres Enrollment 858 838 849 834 823 815 819
Available Space (143) (123) (134) (119) (108) (100) (104)Comments See text
Roscoe R. Nix ES CSR Program Capacity 503 503 503 503 736 736 736Grades (preK-2) Enrollment 501 484 484 482 491 486 479
Paired with Available Space 2 19 19 21 245 250 257Cresthaven ES Comments Planning Addition
for CompleteAddition
William T. Page ES CSR Program Capacity 384 384 384 384 384 384 384Enrollment 439 446 451 448 451 439 433Available Space (55) (62) (67) (64) (67) (55) (49)Comments
Sherwood ES Program Capacity 547 547 547 547 547 547 547Enrollment 493 368 369 379 399 411 432Available Space 54 179 178 168 148 136 115Comments
Stonegate ES Program Capacity 372 372 372 372 372 372 372Enrollment 510 524 516 516 518 518 523Available Space (138) (152) (144) (144) (146) (146) (151)Comments See text
Westover ES Program Capacity 283 283 283 283 283 283 283Enrollment 280 307 308 296 292 284 278Available Space 3 (24) (25) (13) (9) (1) 5Comments
Cluster Information HS Utilization 92% 95% 97% 99% 99% 102% 103% 109% 117%HS Enrollment 5431 5574 5707 5853 5827 5992 6045 5900 5900MS Utilization 94% 95% 97% 96% 96% 95% 95% 97% 98%MS Enrollment 4220 4265 4333 4298 4319 4238 4244 4450 4450ES Utilization 109% 106% 105% 105% 100% 100% 101% 100% 100%ES Enrollment 9057 8860 8777 8761 8764 8791 8813 8780 8790
Projections

Recommended Actions and Planning Issues • 4-71
NORTHEAST CONSORTIUM
Demographic Characteristics of Schools
Total Two or more Black or Mobility Schools Enrollment races % Afr. Amer. % Asian% Hispanic % White % FARMS%* ESOL%** Rate%***James Blake HS 1626 5.2% 41.1% 9.3% 26.1% 18.1% 35.0% 2.9% 11.0%Paint Branch HS 2006 3.3% 58.1% 13.2% 18.9% 6.4% 34.2% 2.8% 11.9%Springbrook HS 1799 3.4% 38.1% 12.8% 38.5% 7.2% 47.2% 15.3% 16.5%Benjamin Banneker MS 841 3.1% 66.1% 11.2% 15.7% 3.6% 49.2% 4.7% 14.5%Briggs Chaney MS 888 3.5% 52.6% 13.3% 21.3% 9.1% 45.5% 5.2% 12.7%William H. Farquhar MS 703 4.3% 25.2% 12.7% 15.2% 42.5% 13.7% 2.4% 6.2%Francis Scott Key MS 998 1.6% 45.1% 9.8% 39.0% 4.1% 74.2% 11.0% 22.0%White Oak MS 790 2.7% 30.0% 9.7% 50.4% 7.1% 59.8% 14.8% 18.4%Burnt Mills ES 593 3.9% 59.0% 4.2% 26.5% 6.4% 67.1% 25.6% 17.1%Burtonsville ES 581 3.1% 59.4% 11.7% 19.6% 5.9% 46.1% 11.1% 16.7%Cannon Road ES 407 3.2% 34.6% 10.1% 47.2% 4.7% 66.0% 13.3% 15.5%Cloverly ES 500 7.6% 25.0% 16.2% 22.2% 28.6% 19.5% 13.9% 11.7%Cresthaven ES 563 1.6% 38.7% 9.4% 45.6% 4.3% 73.1% 28.0% 23.4%Dr. Charles R. Drew ES 503 6.0% 42.9% 14.3% 24.3% 12.1% 49.0% 24.1% 9.5%Fairland ES 632 4.6% 57.0% 7.9% 24.8% 5.1% 61.6% 19.5% 17.7%Galway ES 789 2.3% 62.9% 9.1% 22.8% 2.5% 59.3% 28.5% 17.4%Greencastle ES 722 3.0% 66.1% 6.8% 20.4% 3.3% 65.4% 14.3% 20.4%Jackson Road ES 686 1.6% 51.9% 9.6% 33.7% 2.9% 77.1% 30.8% 20.1%JoAnn Leleck ES at Broad Acres 858 0.0% 13.3% 3.4% 82.8% 0.0% 92.2% 67.2% 26.2%Roscoe R. Nix ES 501 1.6% 36.3% 7.2% 49.9% 4.6% 75.7% 50.4% 25.3%William T. Page ES 439 3.0% 51.9% 13.4% 25.3% 5.7% 50.2% 19.8% 10.5%Sherwood ES 493 7.5% 19.9% 12.4% 17.6% 42.2% 15.0% 6.5% 8.3%Stonegate ES 510 9.0% 35.1% 13.5% 21.6% 20.4% 22.5% 13.1% 8.8%Westover ES 280 8.2% 34.3% 14.3% 25.4% 17.9% 21.4% 11.0% 12.1%Elementary Cluster Total 9057 3.8% 44.0% 9.6% 33.2% 9.1% 57.4% 25.7% 17.1%Elementary County Total 76590 5.3% 21.4% 14.0% 32.3% 26.6% 40.3% 23.2% 14.1%*Percent of students approved for Free and Reduced-priced Meals Program (FARMS) during the 2016–2017 school year.**Percent of English for Speakers of Other Languages (ESOL) during the 2016–2017 school year. High School students are served in regional ESOL centers.
***Mobility Rate is the number of entries plus withdrawals during the 2016–2017 school year compared to total enrollment.Notes: Native Hawaiian/Pacific Islander and American Indian/Alaskan Native categories total less than 1% and were therefore excluded from the table.
Due to federal and state guidelines, demographic characteristics of schools of less than or equal to 5 students per category are reported as 0%.
2017–2018 2016–2017
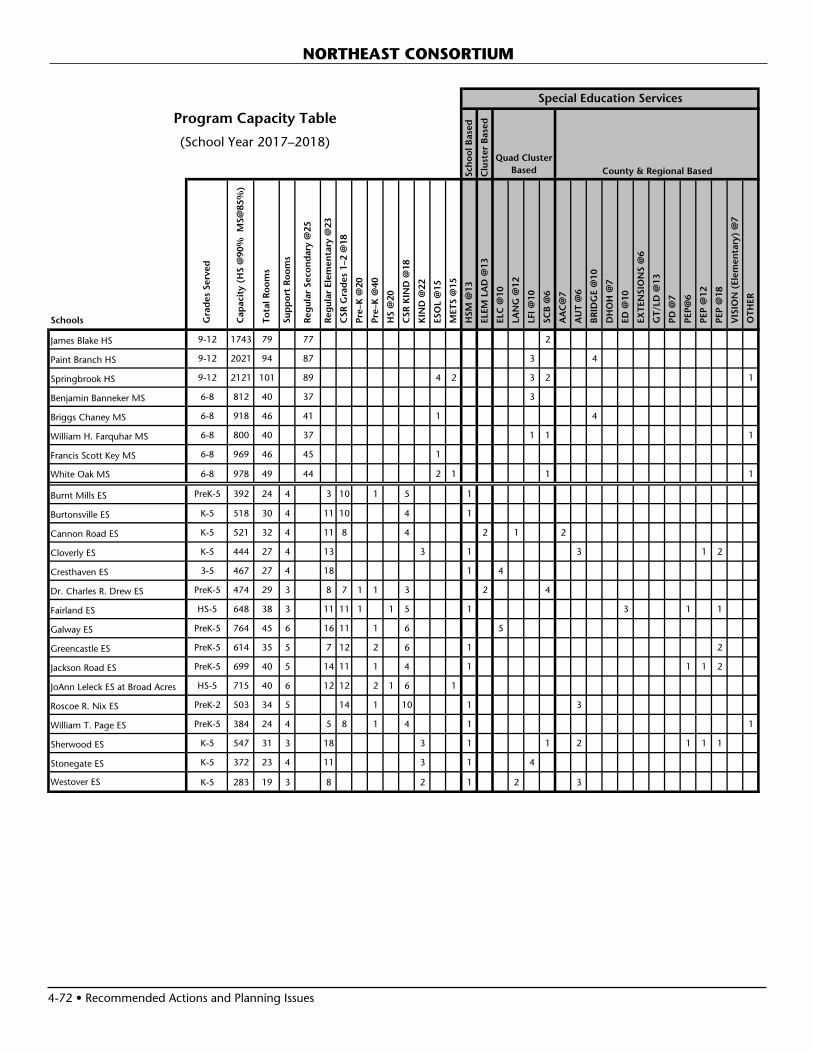
4-72 • Recommended Actions and Planning Issues
NORTHEAST CONSORTIUM
Schools Gra
des
Ser
ved
Cap
acit
y (H
S @
90%
MS@
85%
)
To
tal R
oo
ms
Sup
po
rt R
oo
ms
Reg
ular
Sec
on
dar
y @
25
Reg
ular
Ele
men
tary
@23
CSR
Gra
des
1–2
@18
Pre
–K @
20
Pre
–K @
40
HS
@20
CSR
KIN
D @
18
KIN
D @
22
ESO
L @
15
MET
S @
15
HSM
@13
ELE
M L
AD
@13
ELC
@10
LA
NG
@12
LFI
@10
SC
B @
6
AA
C@
7
AU
T @
6
BR
IDG
E @
10
DH
OH
@7
ED
@10
EX
TEN
SIO
NS
@6
GT/
LD @
13
PD
@7
PEP
@6
PEP
@12
PEP
@18
VIS
ION
(El
emen
tary
) @
7
OTH
ER
James Blake HS 9-12 1743 79 77 2
Paint Branch HS 9-12 2021 94 87 3 4
Springbrook HS 9-12 2121 101 89 4 2 3 2 1
Benjamin Banneker MS 6-8 812 40 37 3
Briggs Chaney MS 6-8 918 46 41 1 4
William H. Farquhar MS 6-8 800 40 37 1 1 1
Francis Scott Key MS 6-8 969 46 45 1
White Oak MS 6-8 978 49 44 2 1 1 1
Burnt Mills ES PreK-5 392 24 4 3 10 1 5 1
Burtonsville ES K-5 518 30 4 11 10 4 1
Cannon Road ES K-5 521 32 4 11 8 4 2 1 2
Cloverly ES K-5 444 27 4 13 3 1 3 1 2
Cresthaven ES 3-5 467 27 4 18 1 4
Dr. Charles R. Drew ES PreK-5 474 29 3 8 7 1 1 3 2 4
Fairland ES HS-5 648 38 3 11 11 1 1 5 1 3 1 1
Galway ES PreK-5 764 45 6 16 11 1 6 5
Greencastle ES PreK-5 614 35 5 7 12 2 6 1 2
Jackson Road ES PreK-5 699 40 5 14 11 1 4 1 1 1 2
JoAnn Leleck ES at Broad Acres HS-5 715 40 6 12 12 2 1 6 1
Roscoe R. Nix ES PreK-2 503 34 5 14 1 10 1 3
William T. Page ES PreK-5 384 24 4 5 8 1 4 1 1
Sherwood ES K-5 547 31 3 18 3 1 1 2 1 1 1
Stonegate ES K-5 372 23 4 11 3 1 4
Westover ES K-5 283 19 3 8 2 1 2 3
Program Capacity TableSpecial Education Services
Sch
oo
l Bas
ed
Clu
ster
Bas
ed
Quad Cluster Based County & Regional Based
(School Year 2017–2018)

Recommended Actions and Planning Issues • 4-73
NORTHEAST CONSORTIUM
Year Year Total Site Reloc- Home
Facility Reopened/ Square Size Adjacent atable County School
Schools Opened Revitalized Footage Acres Park Classrooms Programs Model
James Blake HS 1998 297,125 91.09Paint Branch HS 1969 2012 347,169 45.98Springbrook HS 1960 1994 305,006 25.13 YesBenjamin Banneker MS 1974 117,035 20Briggs Chaney MS 1991 115,000 29.4William H. Farquhar MS 1968 2016 135,626 20Francis Scott Key MS 1966 2009 147,424 20.6White Oak MS 1962 1993 140,990 17.3Burnt Mills ES 1964 1990 57,318 15.1 6 YesBurtonsville ES 1952 1993 71,349 11.9 6 YesCannon Road ES 1967 2012 83,377 4.4 YesCloverly ES 1961 1989 61,991 10 Yes 2 YesCresthaven ES 1962 2010 76,862 9.8 YesDr. Charles R. Drew ES 1991 73,975 12Fairland ES 1934 1992 92,227 11.8 YesGalway ES 1967 2009 103,170 9 Yes 2 YesGreencastle ES 1988 78,275 18.9 6 LTL YesJackson Road ES 1959 1995 91,465 8.8 YesJoAnn Leleck ES at Broad Acres 1952 1974 88,922 6.2 Yes 10 SBHC YesRoscoe R. Nix ES 2006 88,351 8.97 Yes YesWilliam T. Page ES 1965 2003 58,726 9.8 2 YesSherwood ES 1977 81,727 10.85 Yes
Stonegate ES 1971 52,468 10.3 4 Yes
Westover ES 1964 1998 54,645 7.6 2 Yes
Facility Characteristics of Schools 2017–2018

Recommended Actions and Planning Issues • 4-75
SCHOOLSNorthwest High SchoolPlanning Issue: Projections indicate enrollment at Northwest High School will exceed capacity by almost 400 students by the end of the six year CIP planning period. Enrollment also is projected to exceed capacity at Clarksburg High School by more than 800 students. The Seneca Valley High School service area is adjacent to the Clarksburg and Northwest high school service areas. A revitalization/expansion project of Seneca Valley High School, scheduled for completion in September 2020, will be designed and constructed with a capacity for 2,400 students. The enrollment at Seneca Valley High School is projected to be 1,499 students by the end of the six-year planning period. With a capacity of 2,400 seats, there will be approximately 900 seats available to accommodate students from Clarksburg and Northwest high schools when the project is complete.
Planning Study: A boundary study is recommended to explore the reassignment of Clarksburg and Northwest high school students to Seneca Val-ley High School. As part of the boundary study, middle school articulation patterns in the Sen-eca Valley Cluster will be reviewed in order to evaluate utilizations and articulation patterns, therefore Roberto Clemente and Martin Luther King, Jr. middle schools will participate in the boundary study. The boundary study will begin in September 2018 with Board action scheduled in November 2019.
Capital Project: Expenditures are recommended in the six-year period to open a new high school on the Crown Farm site to address overutilization in the mid-county region. An FY 2019 appropria-tion for planning is recommended to begin the architectural design for this new school. Once the planning is complete, a recommendation will be included in the next full CIP regarding the phas-ing and completion date for the opening of this new high school.
Roberto Clemente Middle SchoolPlanning Study: A boundary study is recom-mended to explore the reassignment of Clarksburg and Northwest high school students to Seneca Valley High School. As part of the boundary study, middle school articulation patterns in the Seneca Valley Cluster will be reviewed in order to evaluate utilizations and articulation patterns, therefore Roberto Clemente and Martin Luther King, Jr. middle schools will participate in the boundary study. The boundary study will begin in September 2018 with Board action scheduled in November 2019
Clopper Mill Elementary SchoolCapital Project: The Northwest Cluster elementary school deficit has decreased from previous years. Therefore, the Board of Education, in the FY 2017–2022 CIP, delayed the construc-tion funds two years to provide an opportunity to monitor the cluster deficit and explore alternatives to address the overutilization at the elementary schools in this cluster. Based on the Board of Education’s decision to monitor enrollment and evaluate alternatives to address the overutilization, the County Council changed the name of this project to Northwest Cluster ES Solution in the FY 2017–2022 CIP. As part of the Amended FY 2017–2022 Amended CIP, the County Council, deleted the Northwest Cluster Elementary School Solution project and replaced it with the Clopper Mill Elementary School and Ronald McNair Elementary School Solution Project, in order to more accurately reflect the elementary service areas that would go into residential moratorium in the Northwest
NORTHWEST CLUSTER
Northwest Cluster Articulation*
Northwest High School
Lakelands Park MS
Darnestown ESDiamond ES**
(North of Great Seneca Highway)
Roberto Clemente MS
Clopper Mill ESGermantown ES
Great Seneca Creek ES**
* ”Cluster” is defined as the collection of elementary schools that articulate to the same high school.
* S. Christa McAuliffe and Sally K. Ride elementary schools (south of Middlebrook Road) also articulate to Roberto Clemente Middle School, but thereafter articulate to Seneca Valley High School.
* Brown Station and Rachel Carson elementary schools also articulate to Lakelands Park Middle School but thereafter articulate to Quince Orchard High School.
** Diamond Elementary School (south of Great Seneca Highway) also articulates to Ridgeview Middle School and to Quince Orchard High School.
** A portion of Great Seneca Creek Elementary School articulates to Roberto Clemente Middle School and another portion to Kingsview Middle School.
Kingsview MS
Ronald McNair ESSpark M. Matsunaga ESGreat Seneca Creek ES**
0%
20%
40%
60%
80%
100%
120%
140%
2017ACTUAL
2018 2019 2020 2021 2022 2023
Note: Percent utilization calculated as total enrollment of schools divided by total capacity. Projected capacity factors in capital projects.
Northwest ClusterSchool Utilizations
Elementary Schools Middle Schools High School
DesiredRange
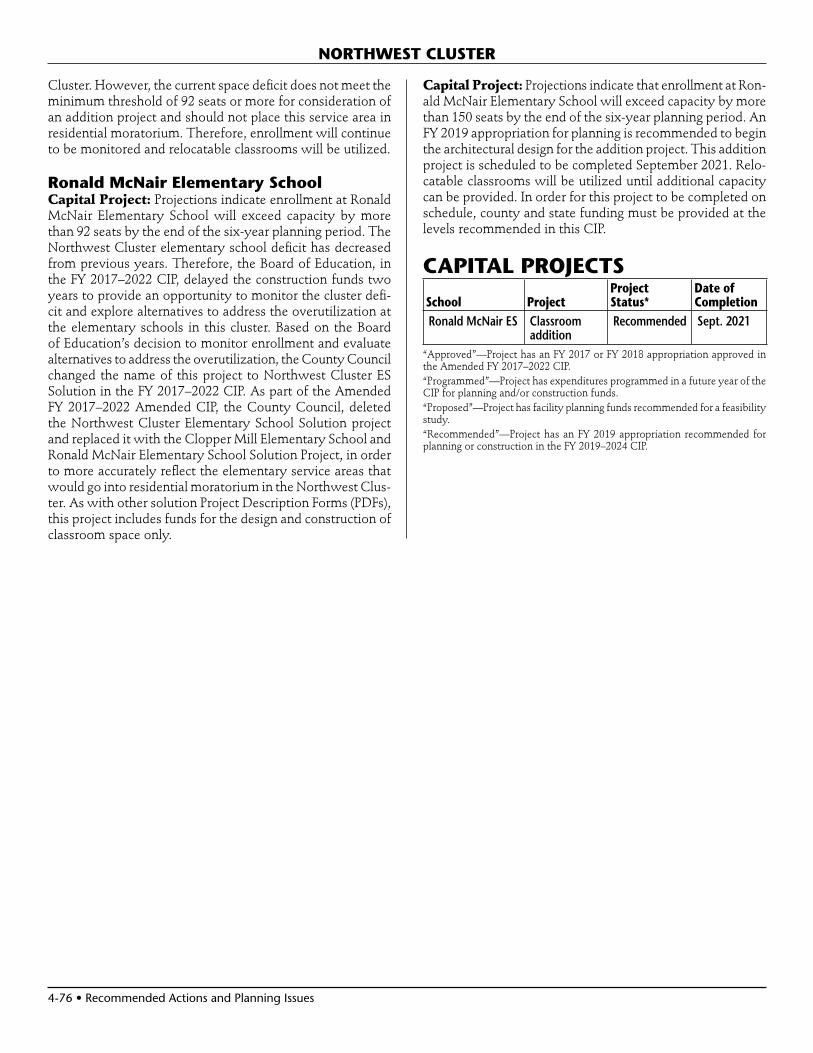
4-76 • Recommended Actions and Planning Issues
Cluster. However, the current space deficit does not meet the minimum threshold of 92 seats or more for consideration of an addition project and should not place this service area in residential moratorium. Therefore, enrollment will continue to be monitored and relocatable classrooms will be utilized.
Ronald McNair Elementary SchoolCapital Project: Projections indicate enrollment at Ronald McNair Elementary School will exceed capacity by more than 92 seats by the end of the six-year planning period. The Northwest Cluster elementary school deficit has decreased from previous years. Therefore, the Board of Education, in the FY 2017–2022 CIP, delayed the construction funds two years to provide an opportunity to monitor the cluster defi-cit and explore alternatives to address the overutilization at the elementary schools in this cluster. Based on the Board of Education’s decision to monitor enrollment and evaluate alternatives to address the overutilization, the County Council changed the name of this project to Northwest Cluster ES Solution in the FY 2017–2022 CIP. As part of the Amended FY 2017–2022 Amended CIP, the County Council, deleted the Northwest Cluster Elementary School Solution project and replaced it with the Clopper Mill Elementary School and Ronald McNair Elementary School Solution Project, in order to more accurately reflect the elementary service areas that would go into residential moratorium in the Northwest Clus-ter. As with other solution Project Description Forms (PDFs), this project includes funds for the design and construction of classroom space only.
Capital Project: Projections indicate that enrollment at Ron-ald McNair Elementary School will exceed capacity by more than 150 seats by the end of the six-year planning period. An FY 2019 appropriation for planning is recommended to begin the architectural design for the addition project. This addition project is scheduled to be completed September 2021. Relo-catable classrooms will be utilized until additional capacity can be provided. In order for this project to be completed on schedule, county and state funding must be provided at the levels recommended in this CIP.
CAPITAL PROJECTS
School ProjectProject Status*
Date of Completion
Ronald McNair ES Classroom addition
Recommended Sept. 2021
“Approved”—Project has an FY 2017 or FY 2018 appropriation approved in the Amended FY 2017–2022 CIP.“Programmed”—Project has expenditures programmed in a future year of the CIP for planning and/or construction funds.“Proposed”—Project has facility planning funds recommended for a feasibility study.“Recommended”—Project has an FY 2019 appropriation recommended for planning or construction in the FY 2019–2024 CIP.
NORTHWEST CLUSTER
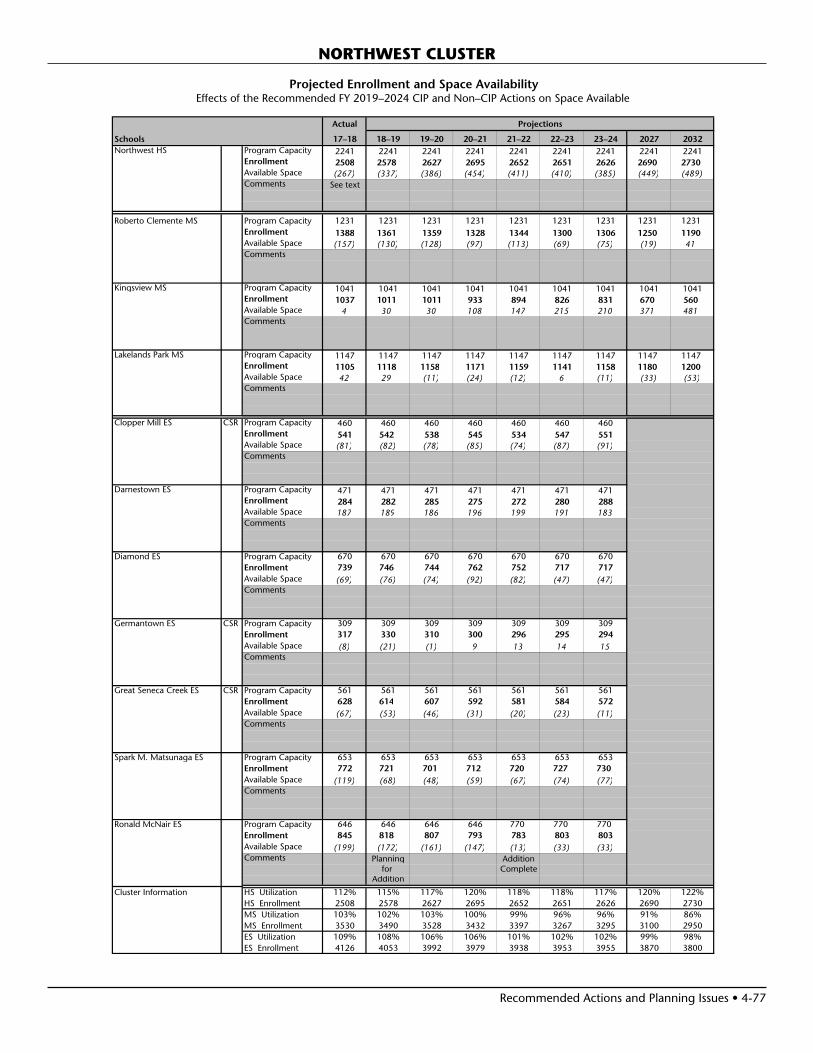
Recommended Actions and Planning Issues • 4-77
NORTHWEST CLUSTER
Projected Enrollment and Space AvailabilityEffects of the Recommended FY 2019–2024 CIP and Non–CIP Actions on Space Available
Actual
Schools 17–18 18–19 19–20 20–21 21–22 22–23 23–24 2027 2032Northwest HS Program Capacity 2241 2241 2241 2241 2241 2241 2241 2241 2241
Enrollment 2508 2578 2627 2695 2652 2651 2626 2690 2730Available Space (267) (337) (386) (454) (411) (410) (385) (449) (489)Comments See text
Roberto Clemente MS Program Capacity 1231 1231 1231 1231 1231 1231 1231 1231 1231Enrollment 1388 1361 1359 1328 1344 1300 1306 1250 1190Available Space (157) (130) (128) (97) (113) (69) (75) (19) 41Comments
Kingsview MS Program Capacity 1041 1041 1041 1041 1041 1041 1041 1041 1041Enrollment 1037 1011 1011 933 894 826 831 670 560Available Space 4 30 30 108 147 215 210 371 481Comments
Lakelands Park MS Program Capacity 1147 1147 1147 1147 1147 1147 1147 1147 1147Enrollment 1105 1118 1158 1171 1159 1141 1158 1180 1200Available Space 42 29 (11) (24) (12) 6 (11) (33) (53)Comments
Clopper Mill ES CSR Program Capacity 460 460 460 460 460 460 460Enrollment 541 542 538 545 534 547 551Available Space (81) (82) (78) (85) (74) (87) (91)Comments
Darnestown ES Program Capacity 471 471 471 471 471 471 471Enrollment 284 282 285 275 272 280 288Available Space 187 189 186 196 199 191 183Comments
Diamond ES Program Capacity 670 670 670 670 670 670 670Enrollment 739 746 744 762 752 717 717Available Space (69) (76) (74) (92) (82) (47) (47)Comments
Germantown ES CSR Program Capacity 309 309 309 309 309 309 309Enrollment 317 330 310 300 296 295 294Available Space (8) (21) (1) 9 13 14 15Comments
Great Seneca Creek ES CSR Program Capacity 561 561 561 561 561 561 561Enrollment 628 614 607 592 581 584 572Available Space (67) (53) (46) (31) (20) (23) (11)Comments
Spark M. Matsunaga ES Program Capacity 653 653 653 653 653 653 653Enrollment 772 721 701 712 720 727 730Available Space (119) (68) (48) (59) (67) (74) (77)Comments
Ronald McNair ES Program Capacity 646 646 646 646 770 770 770Enrollment 845 818 807 793 783 803 803Available Space (199) (172) (161) (147) (13) (33) (33)Comments Planning Addition
for CompleteAddition
Cluster Information HS Utilization 112% 115% 117% 120% 118% 118% 117% 120% 122%HS Enrollment 2508 2578 2627 2695 2652 2651 2626 2690 2730MS Utilization 103% 102% 103% 100% 99% 96% 96% 91% 86%MS Enrollment 3530 3490 3528 3432 3397 3267 3295 3100 2950ES Utilization 109% 108% 106% 106% 101% 102% 102% 99% 98%ES Enrollment 4126 4053 3992 3979 3938 3953 3955 3870 3800
Projections
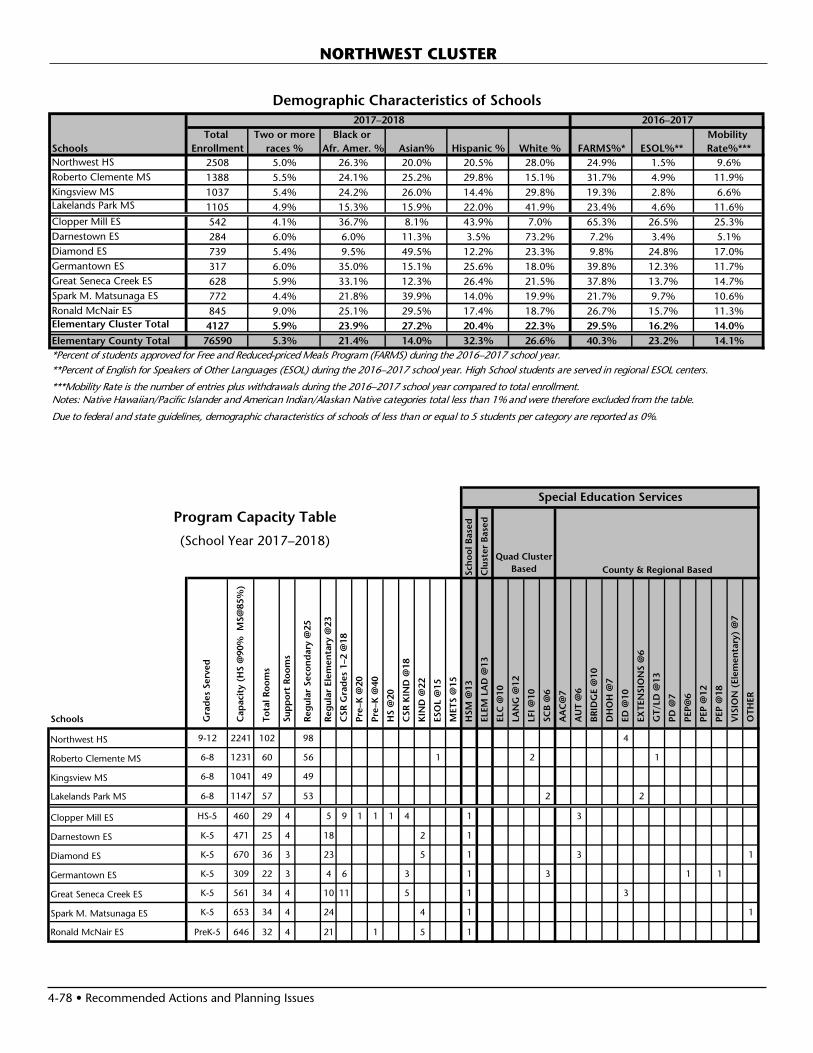
4-78 • Recommended Actions and Planning Issues
NORTHWEST CLUSTER
Schools Gra
des
Ser
ved
Cap
acit
y (H
S @
90%
MS@
85%
)
To
tal R
oo
ms
Sup
po
rt R
oo
ms
Reg
ular
Sec
on
dar
y @
25
Reg
ular
Ele
men
tary
@23
CSR
Gra
des
1–2
@18
Pre
–K @
20
Pre
–K @
40
HS
@20
CSR
KIN
D @
18
KIN
D @
22
ESO
L @
15
MET
S @
15
HSM
@13
ELE
M L
AD
@13
ELC
@10
LA
NG
@12
LFI
@10
SC
B @
6
AA
C@
7
AU
T @
6
BR
IDG
E @
10
DH
OH
@7
ED
@10
EX
TEN
SIO
NS
@6
GT/
LD @
13
PD
@7
PEP
@6
PEP
@12
PEP
@18
VIS
ION
(El
emen
tary
) @
7
OTH
ERNorthwest HS 9-12 2241 102 98 4
Roberto Clemente MS 6-8 1231 60 56 1 2 1
Kingsview MS 6-8 1041 49 49
Lakelands Park MS 6-8 1147 57 53 2 2
Clopper Mill ES HS-5 460 29 4 5 9 1 1 1 4 1 3
Darnestown ES K-5 471 25 4 18 2 1
Diamond ES K-5 670 36 3 23 5 1 3 1
Germantown ES K-5 309 22 3 4 6 3 1 3 1 1
Great Seneca Creek ES K-5 561 34 4 10 11 5 1 3
Spark M. Matsunaga ES K-5 653 34 4 24 4 1 1
Ronald McNair ES PreK-5 646 32 4 21 1 5 1
Program Capacity TableSpecial Education Services
Sch
oo
l Bas
ed
Clu
ster
Bas
ed
Quad Cluster Based County & Regional Based
(School Year 2017–2018)
Demographic Characteristics of Schools
Total Two or more Black or Mobility Schools Enrollment races % Afr. Amer. % Asian% Hispanic % White % FARMS%* ESOL%** Rate%***Northwest HS 2508 5.0% 26.3% 20.0% 20.5% 28.0% 24.9% 1.5% 9.6%Roberto Clemente MS 1388 5.5% 24.1% 25.2% 29.8% 15.1% 31.7% 4.9% 11.9%Kingsview MS 1037 5.4% 24.2% 26.0% 14.4% 29.8% 19.3% 2.8% 6.6%Lakelands Park MS 1105 4.9% 15.3% 15.9% 22.0% 41.9% 23.4% 4.6% 11.6%Clopper Mill ES 542 4.1% 36.7% 8.1% 43.9% 7.0% 65.3% 26.5% 25.3%Darnestown ES 284 6.0% 6.0% 11.3% 3.5% 73.2% 7.2% 3.4% 5.1%Diamond ES 739 5.4% 9.5% 49.5% 12.2% 23.3% 9.8% 24.8% 17.0%Germantown ES 317 6.0% 35.0% 15.1% 25.6% 18.0% 39.8% 12.3% 11.7%Great Seneca Creek ES 628 5.9% 33.1% 12.3% 26.4% 21.5% 37.8% 13.7% 14.7%Spark M. Matsunaga ES 772 4.4% 21.8% 39.9% 14.0% 19.9% 21.7% 9.7% 10.6%Ronald McNair ES 845 9.0% 25.1% 29.5% 17.4% 18.7% 26.7% 15.7% 11.3%Elementary Cluster Total 4127 5.9% 23.9% 27.2% 20.4% 22.3% 29.5% 16.2% 14.0%Elementary County Total 76590 5.3% 21.4% 14.0% 32.3% 26.6% 40.3% 23.2% 14.1%*Percent of students approved for Free and Reduced-priced Meals Program (FARMS) during the 2016–2017 school year.**Percent of English for Speakers of Other Languages (ESOL) during the 2016–2017 school year. High School students are served in regional ESOL centers.
***Mobility Rate is the number of entries plus withdrawals during the 2016–2017 school year compared to total enrollment.Notes: Native Hawaiian/Pacific Islander and American Indian/Alaskan Native categories total less than 1% and were therefore excluded from the table.
Due to federal and state guidelines, demographic characteristics of schools of less than or equal to 5 students per category are reported as 0%.
2017–2018 2016–2017

Recommended Actions and Planning Issues • 4-79
NORTHWEST CLUSTER
Year Year Total Site Reloc- Home
Facility Reopened/ Square Size Adjacent atable County School
Schools Opened Revitalized Footage Acres Park Classrooms Programs Model
Northwest HS 1998 340,867 34.6 YesRoberto Clemente MS 1992 148,246 19.9 3Kingsview MS 1997 140,398 18.5 YesLakelands Park MS 2005 153,588 8.11 YesClopper Mill ES 1986 64,851 9 Yes 4 YesDarnestown ES 1954 1980 64,840 7.2 YesDiamond ES 1975 83,177 10 Yes 5 YesGermantown ES 1935 1978 57,668 7.8 YesGreat Seneca Creek ES 2006 82,511 13.71 3 YesSpark M. Matsunaga ES 2001 90,718 11.8 15 YesRonald McNair ES 1990 78,275 10 Yes 6 Yes
Facility Characteristics of Schools 2017–2018

Recommended Actions and Planning Issues • 4-81
POOLESVILLE CLUSTER
SCHOOLSPoolesville High SchoolCapital Project: Based on the Montgomery County Council Office of Legislative Oversight (OLO) study of the revitaliza-tion/expansion program released in July 2015, this program is under review in order to develop a multi-variable approach to determine the priority order of large-scale renovations of facilities, possibly including programmatic and capacity considerations. Recommendations regarding possible changes to this program will be released once the review is complete.
0%
20%
40%
60%
80%
100%
120%
2017 ACTUAL 2018 2019 2020 2021 2022 2023
Poolesville ClusterSchool Utilizations
Elementary Schools Middle Schools High School
DesiredRange
Note: Percent utilization calculated as total enrollment of schools divided by total capacity.Projected capacity factors in capital projects.

4-82 • Recommended Actions and Planning Issues
POOLESVILLE CLUSTER
Projected Enrollment and Space AvailabilityEffects of the Recommended FY 2019–2024 CIP and Non–CIP Actions on Space Available
Actual
Schools 17–18 18–19 19–20 20–21 21–22 22–23 23–24 2027 2032Poolesville HS Program Capacity 1170 1170 1170 1170 1170 1170 1170 1170 1170
Enrollment 1183 1168 1186 1207 1189 1205 1194 1220 1250Available Space (13) 2 (16) (37) (19) (35) (24) (50) (80)Comments
John Poole MS Program Capacity 468 468 468 468 468 468 468 468 468Enrollment 375 368 346 304 290 266 255 210 150Available Space 93 100 122 164 178 202 212 258 318Comments
Monocacy ES Program Capacity 219 219 219 219 219 219 219Enrollment 146 142 140 140 148 164 151Available Space 73 77 79 79 71 55 68Comments
Poolesville ES Program Capacity 539 539 539 539 539 539 539Enrollment 448 427 402 394 391 383 373Available Space 91 112 137 145 148 156 166Comments
Cluster Information HS Utilization 101% 100% 101% 103% 102% 103% 102% 104% 107%HS Enrollment 1183 1168 1186 1207 1189 1205 1194 1220 1250MS Utilization 80% 79% 74% 65% 62% 57% 54% 45% 32%MS Enrollment 375 368 346 304 290 266 255 210 150ES Utilization 78% 75% 72% 70% 71% 72% 69% 66% 63%ES Enrollment 594 569 542 534 539 547 524 500 480
Projections

Recommended Actions and Planning Issues • 4-83
POOLESVILLE CLUSTER
Year Year Total Site Reloc- Home
Facility Reopened/ Square Size Adjacent atable County School
Schools Opened Revitalized Footage Acres Park Classrooms Programs Model
Poolesville HS 1953 1978 165,056 37.2John Poole MS 1997 85,669 20.5Monocacy ES 1961 1989 42,482 27 1 YesPoolesville ES 1960 1978 64,803 12.3 Yes
Facility Characteristics of Schools 2017–2018
Schools Gra
des
Ser
ved
Cap
acit
y (H
S @
90%
MS@
85%
)
To
tal R
oo
ms
Sup
po
rt R
oo
ms
Reg
ular
Sec
on
dar
y @
25
Reg
ular
Ele
men
tary
@23
CSR
Gra
des
1–2
@18
Pre
–K @
20
Pre
–K @
40
HS
@20
CSR
KIN
D @
18
KIN
D @
22
ESO
L @
15
MET
S @
15
HSM
@13
ELE
M L
AD
@13
ELC
@10
LA
NG
@12
LFI
@10
SC
B @
6
AA
C@
7
AU
T @
6
BR
IDG
E @
10
DH
OH
@7
ED
@10
EX
TEN
SIO
NS
@6
GT/
LD @
13
PD
@7
PEP
@6
PEP
@12
PEP
@18
VIS
ION
(El
emen
tary
) @
7
OTH
ER
Poolesville HS 9-12 1170 52 52
John Poole MS 6-8 468 22 22
Monocacy ES K-5 219 13 3 8 1 1
Poolesville ES K-5 539 28 4 20 3 1
Program Capacity TableSpecial Education Services
Sch
oo
l Bas
ed
Clu
ster
Bas
edQuad Cluster
Based County & Regional Based
(School Year 2017–2018)
Demographic Characteristics of Schools
Total Two or more Black or Mobility Schools Enrollment races % Afr. Amer. % Asian% Hispanic % White % FARMS%* ESOL%** Rate%***Poolesville HS 1183 5.7% 5.5% 30.0% 7.7% 50.8% 6.4% 0.0% 2.6%John Poole MS 375 3.2% 5.6% 7.2% 11.7% 71.7% 11.1% 0.0% 4.2%Monocacy ES 146 6.8% 4.8% 0.0% 14.4% 72.6% 17.3% 6.8% 8.0%Poolesville ES 450 7.6% 5.8% 7.6% 12.7% 66.2% 11.7% 6.2% 4.8%Elementary Cluster Total 596 7.4% 5.5% 6.0% 13.1% 67.8% 12.9% 6.2% 5.7%Elementary County Total 76590 5.3% 21.4% 14.0% 32.3% 26.6% 40.3% 23.2% 14.1%*Percent of students approved for Free and Reduced-priced Meals Program (FARMS) during the 2016–2017 school year.**Percent of English for Speakers of Other Languages (ESOL) during the 2016–2017 school year. High School students are served in regional ESOL centers.
***Mobility Rate is the number of entries plus withdrawals during the 2016–2017 school year compared to total enrollment.Notes: Native Hawaiian/Pacific Islander and American Indian/Alaskan Native categories total less than 1% and were therefore excluded from the table.
Due to federal and state guidelines, demographic characteristics of schools of less than or equal to 5 students per category are reported as 0%.
2017–2018 2016–2017

Recommended Actions and Planning Issues • 4-85
SCHOOLSQuince Orchard High SchoolCapital Project: Projections indicate that enrollment at Quince Orchard High School will exceed capacity by 200 seats or more by the end of the six year planning period. An FY 2018 appropriation was approved for a facility planning to conduct a capacity study. Relocatable classroom will be utilized as needed until additional capacity can be provided. Expenditures are recommended in the six-year period to open a new high school on the Crown Farm site to address over-utilization in the mid-county region. An FY 2019 appropria-tion for planning is recommended to begin the architectural design for this new school. Once the planning is complete, a recommendation will be included in the next full CIP regard-ing the phasing and completion date for the opening of this new high school.
Rachel Carson Elementary SchoolPlanning Issue: Projections indicate that enrollment at Rachel Carson Elementary School will exceed capacity by over 300 seats throughout the six-year planning period. To address the high enrollment at Rachel Carson Elementary School, the Board of Education approved the expansion of DuFief Elementary School to accommodate the overutilization of Rachel Carson Elementary School. The Board of Education action can be found at the fol-lowing link: http://gis.mcpsmd.org/cipmasterpdfs/CIP17_AdoptedRachelCarsonESOverutilization.pdf
Capital Project: Expenditures are recommended to provide capacity and facility upgrades at DuFief Elementary School. An FY 2019 appropriation for planning funds is recommended to begin the architectural design for this project with a scheduled completion of September 2021. Relocat-able classrooms will be utilized until additional capacity can be added. In order for this project to be completed on this schedule, county and state funding must be provided at the levels recom-mended in this CIP.
Fields Road Elementary SchoolCapital Project: Previous projections indicated that enrollment at Fields Road Elementary School would exceed capacity by 92 seats or more by the end of the six-year planning period. Therefore, an FY 2015 appropriation was completed for facility planning to determine the feasibility, scope, and cost for a classroom addition. The current space deficit, however, does not meet the minimum threshold of 92 seats or more for consideration of an addition project. Therefore, enrollment will continue to be monitored and relocatable classrooms will be utilized.
Thurgood Marshall Elementary SchoolCapital Project: Previous projections indicated that enroll-ment at Thurgood Marshall Elementary School would exceed capacity by 92 seats or more by the end of the six-year plan-ning period. A feasibility study was conducted in FY 2008 to determine the feasibility, cost, and scope of an addition project. Current projections indicate that enrollment is trend-ing down in the six-year period; however, enrollment will exceed capacity slightly above the 92 seat threshold within the same time period. Therefore, enrollment will continue to be monitored and relocatable classrooms will be utilized until a capacity project is considered in a future CIP.
QUINCE ORCHARD CLUSTER
�����������������������������������
�������������������������
����������������� ������������
�������������� ����������������������� �������������������������������
�������������������������
�������������������
��������������������������������������������������������������������������������������������������
����������������������������������������������������������������������������������������������������������������������������������������������������������������
0%
20%
40%
60%
80%
100%
120%
140%
2017ACTUAL
2018 2019 2020 2021 2022 2023
Quince Orchard ClusterSchool Utilizations
Elementary Schools Middle Schools High School
DesiredRange
Note: Percent utilization calculated as total enrollment of schools divided by total capacity.Projected capacity factors in capital projects.
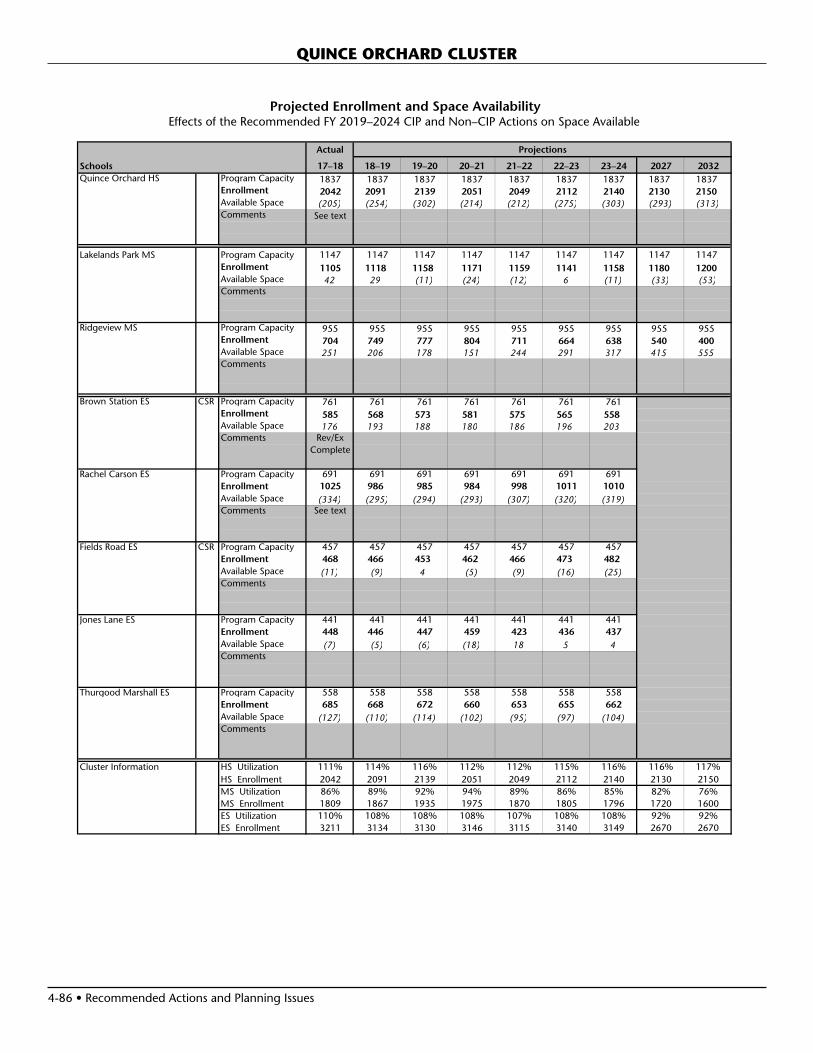
4-86 • Recommended Actions and Planning Issues
Projected Enrollment and Space AvailabilityEffects of the Recommended FY 2019–2024 CIP and Non–CIP Actions on Space Available
Actual
Schools 17–18 18–19 19–20 20–21 21–22 22–23 23–24 2027 2032Quince Orchard HS Program Capacity 1837 1837 1837 1837 1837 1837 1837 1837 1837
Enrollment 2042 2091 2139 2051 2049 2112 2140 2130 2150Available Space (205) (254) (302) (214) (212) (275) (303) (293) (313)Comments See text
Lakelands Park MS Program Capacity 1147 1147 1147 1147 1147 1147 1147 1147 1147Enrollment 1105 1118 1158 1171 1159 1141 1158 1180 1200Available Space 42 29 (11) (24) (12) 6 (11) (33) (53)Comments
Ridgeview MS Program Capacity 955 955 955 955 955 955 955 955 955Enrollment 704 749 777 804 711 664 638 540 400Available Space 251 206 178 151 244 291 317 415 555Comments
Brown Station ES CSR Program Capacity 761 761 761 761 761 761 761Enrollment 585 568 573 581 575 565 558Available Space 176 193 188 180 186 196 203Comments Rev/Ex
Complete
Rachel Carson ES Program Capacity 691 691 691 691 691 691 691Enrollment 1025 986 985 984 998 1011 1010Available Space (334) (295) (294) (293) (307) (320) (319)Comments See text
Fields Road ES CSR Program Capacity 457 457 457 457 457 457 457Enrollment 468 466 453 462 466 473 482Available Space (11) (9) 4 (5) (9) (16) (25)Comments
Jones Lane ES Program Capacity 441 441 441 441 441 441 441Enrollment 448 446 447 459 423 436 437Available Space (7) (5) (6) (18) 18 5 4Comments
Thurgood Marshall ES Program Capacity 558 558 558 558 558 558 558Enrollment 685 668 672 660 653 655 662Available Space (127) (110) (114) (102) (95) (97) (104)Comments
Cluster Information HS Utilization 111% 114% 116% 112% 112% 115% 116% 116% 117%HS Enrollment 2042 2091 2139 2051 2049 2112 2140 2130 2150MS Utilization 86% 89% 92% 94% 89% 86% 85% 82% 76%MS Enrollment 1809 1867 1935 1975 1870 1805 1796 1720 1600ES Utilization 110% 108% 108% 108% 107% 108% 108% 92% 92%ES Enrollment 3211 3134 3130 3146 3115 3140 3149 2670 2670
Projections
QUINCE ORCHARD CLUSTER

Recommended Actions and Planning Issues • 4-87
QUINCE ORCHARD CLUSTER
Demographic Characteristics of Schools
Total Two or more Black or Mobility Schools Enrollment races % Afr. Amer. % Asian% Hispanic % White % FARMS%* ESOL%** Rate%***Quince Orchard HS 2042 4.5% 15.1% 13.6% 26.6% 40.2% 22.8% 9.0% 11.8%Lakelands Park MS 1105 4.9% 15.3% 15.9% 22.0% 41.9% 23.4% 4.6% 11.6%Ridgeview MS 704 5.0% 14.1% 13.1% 26.6% 41.2% 28.6% 6.8% 9.7%Brown Station ES 585 2.7% 26.3% 11.6% 48.4% 10.6% 68.0% 29.5% 25.5%Rachel Carson ES 1025 7.9% 8.6% 16.4% 19.1% 47.9% 20.1% 11.8% 10.9%Fields Road ES 468 4.5% 17.5% 15.6% 35.7% 26.5% 42.1% 20.6% 15.5%Jones Lane ES 449 5.8% 14.0% 9.1% 27.4% 43.4% 27.1% 18.2% 6.6%Thurgood Marshall ES 685 4.7% 18.4% 17.1% 27.6% 31.7% 33.6% 14.2% 16.4%Elementary Cluster Total 3212 5.5% 16.0% 14.5% 29.8% 33.9% 33.5% 16.7% 14.3%Elementary County Total 76590 5.3% 21.4% 14.0% 32.3% 26.6% 40.3% 23.2% 14.1%*Percent of students approved for Free and Reduced-priced Meals Program (FARMS) during the 2016–2017 school year.**Percent of English for Speakers of Other Languages (ESOL) during the 2016–2017 school year. High School students are served in regional ESOL centers.
***Mobility Rate is the number of entries plus withdrawals during the 2016–2017 school year compared to total enrollment.Notes: Native Hawaiian/Pacific Islander and American Indian/Alaskan Native categories total less than 1% and were therefore excluded from the table.
Due to federal and state guidelines, demographic characteristics of schools of less than or equal to 5 students per category are reported as 0%.
2017–2018 2016–2017
Schools Gra
des
Ser
ved
Cap
acit
y (H
S @
90%
MS@
85%
)
To
tal R
oo
ms
Sup
po
rt R
oo
ms
Reg
ular
Sec
on
dar
y @
25
Reg
ular
Ele
men
tary
@23
CSR
Gra
des
1–2
@18
Pre
–K @
20
Pre
–K @
40
HS
@20
CSR
KIN
D @
18
KIN
D @
22
ESO
L @
15
MET
S @
15
HSM
@13
ELE
M L
AD
@13
ELC
@10
LA
NG
@12
LFI
@10
SC
B @
6
AA
C@
7
AU
T @
6
BR
IDG
E @
10
DH
OH
@7
ED
@10
EX
TEN
SIO
NS
@6
GT/
LD @
13
PD
@7
PEP
@6
PEP
@12
PEP
@18
VIS
ION
(El
emen
tary
) @
7
OTH
ERQuince Orchard HS 9-12 1837 87 78 3 1 1 1 3
Lakelands Park MS 6-8 1147 57 53 2 2
Ridgeview MS 6-8 955 48 44 4
Brown Station ES HS-5 761 41 3 16 10 2 1 4 1 2 2
Rachel Carson ES PreK-5 691 35 4 22 1 6 1 1
Fields Road ES PreK-5 457 30 4 8 8 1 4 1 4
Jones Lane ES K-5 441 27 5 14 3 1 4
Thurgood Marshall ES K-5 558 32 3 17 4 1 1 3 3
Program Capacity TableSpecial Education Services
Sch
oo
l Bas
ed
Clu
ster
Bas
ed
Quad Cluster Based County & Regional Based
(School Year 2017–2018)

4-88 • Recommended Actions and Planning Issues
QUINCE ORCHARD CLUSTER
Year Year Total Site Reloc- Home
Facility Reopened/ Square Size Adjacent atable County School
Schools Opened Revitalized Footage Acres Park Classrooms Programs Model
Quince Orchard HS 1988 284,912 30.1Lakelands Park MS 2005 153,588 8.11 YesRidgeview MS 1975 139,742 20 4Brown Station ES 1969 2017 113,998 9 Yes YesRachel Carson ES 1990 78,547 12.4 11 YesFields Road ES 1973 72,302 10 4 YesJones Lane ES 1987 60,679 12.1 2 YesThurgood Marshall ES 1993 77,798 12 5 Yes
Facility Characteristics of Schools 2017–2018

Recommended Actions and Planning Issues • 4-89
SCHOOLSEarle B. Wood Middle SchoolCapital Project: Previous projections indicate enrollment at Earle B. Wood Middle School will exceed capacity by 150 seats or more by the end of the six-year planning period. An FY 2017 appropriation was approved for facility planning to determine the feasibility, scope, and cost for a classroom addi-tion. Current projections, however, indicate that enrollment is trending down and the current space deficit does not meet the minimum threshold of 150 seats or more for consideration of an addition project. Therefore, enrollment will continue to be monitored and relocatable classrooms will be utilized until a capacity project is considered in a future CIP.
Lucy V. Barnsley Elementary SchoolCapital Project: A classroom addition is approved for the school with a completion date of September 2018. An FY 2017 appropriation was approved to begin the construction for the project. Due to difficulties related to construction, the school is relocated to the North Lake Holding Facility during the 2017–2018 school year while it is under construction.
Maryvale Elementary SchoolCapital Project: A revitalization/expansion project is sched-uled for this school with a completion date of January 2020. An FY 2018 appropriation for construction is approved to begin construction for this project. On November 17, 2011, the Board of Education approved the collocation of Carl Sandburg Learning Center on the Maryvale Elementary School site when the revitalization/expansion project is complete.
Meadow Hall Elementary SchoolCapital Project: Because previous projections indicated enrollment at Meadow Hall Elementary School would exceed capacity by 92 seats or more by the end of the six-year period, an FY 2013 appropriation was approved for facility planning to determine the feasibility, scope, and cost for a classroom addition. The current space deficit, is slightly above the minimum threshold of 92 seats or more for consideration of an addition project. Therefore, enrollment will continue to be monitored for con-sideration of a future CIP project, with relocatable classrooms utilized in the interim.
CAPITAL PROJECTS
School ProjectProject Status*
Date of Completion
Lucy V. Barnsley ES
Classroom addition
Approved Sept. 2018
Maryvale ES/Sandburg LC
Revitalization/expansion, with collocation of Carl Sandburg LC
Approved Jan. 2020
“Approved”—Project has an FY 2017 or FY 2018 appropriation approved in the Amended FY 2017–2022 CIP.“Programmed”—Project has expenditures programmed in a future year of the CIP for planning and/or construction funds.“Proposed”—Project has facility planning funds recommended for a feasibility study.“Recommended”—Project has an FY 2019 appropriation recommended for planning or construction in the FY 2019–2024 CIP.
ROCKVILLE CLUSTER
0%
20%
40%
60%
80%
100%
120%
140%
2017ACTUAL
2018 2019 2020 2021 2022 2023
Rockville ClusterSchool Utilizations
Elementary Schools Middle Schools High School
DesiredRange
Note: Percent utilization calculated as total enrollment of schools divided by total capacity. Projected capacity factors in capital projects
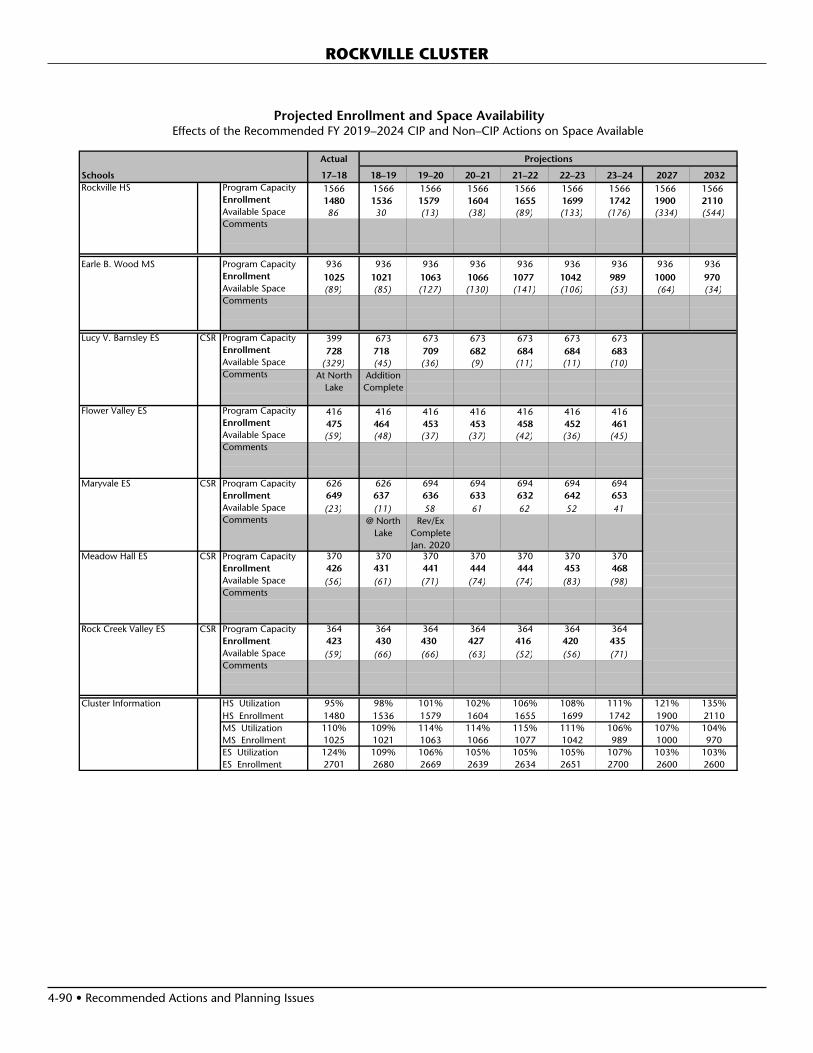
4-90 • Recommended Actions and Planning Issues
ROCKVILLE CLUSTER
Projected Enrollment and Space AvailabilityEffects of the Recommended FY 2019–2024 CIP and Non–CIP Actions on Space Available
Actual
Schools 17–18 18–19 19–20 20–21 21–22 22–23 23–24 2027 2032Rockville HS Program Capacity 1566 1566 1566 1566 1566 1566 1566 1566 1566
Enrollment 1480 1536 1579 1604 1655 1699 1742 1900 2110Available Space 86 30 (13) (38) (89) (133) (176) (334) (544)Comments
Earle B. Wood MS Program Capacity 936 936 936 936 936 936 936 936 936Enrollment 1025 1021 1063 1066 1077 1042 989 1000 970Available Space (89) (85) (127) (130) (141) (106) (53) (64) (34)Comments
Lucy V. Barnsley ES CSR Program Capacity 399 673 673 673 673 673 673Enrollment 728 718 709 682 684 684 683Available Space (329) (45) (36) (9) (11) (11) (10)Comments At North Addition
Lake Complete
Flower Valley ES Program Capacity 416 416 416 416 416 416 416Enrollment 475 464 453 453 458 452 461Available Space (59) (48) (37) (37) (42) (36) (45)Comments
Maryvale ES CSR Program Capacity 626 626 694 694 694 694 694Enrollment 649 637 636 633 632 642 653Available Space (23) (11) 58 61 62 52 41Comments @ North Rev/Ex
Lake CompleteJan. 2020
Meadow Hall ES CSR Program Capacity 370 370 370 370 370 370 370Enrollment 426 431 441 444 444 453 468Available Space (56) (61) (71) (74) (74) (83) (98)Comments
Rock Creek Valley ES CSR Program Capacity 364 364 364 364 364 364 364Enrollment 423 430 430 427 416 420 435Available Space (59) (66) (66) (63) (52) (56) (71)Comments
Cluster Information HS Utilization 95% 98% 101% 102% 106% 108% 111% 121% 135%HS Enrollment 1480 1536 1579 1604 1655 1699 1742 1900 2110MS Utilization 110% 109% 114% 114% 115% 111% 106% 107% 104%MS Enrollment 1025 1021 1063 1066 1077 1042 989 1000 970ES Utilization 124% 109% 106% 105% 105% 105% 107% 103% 103%ES Enrollment 2701 2680 2669 2639 2634 2651 2700 2600 2600
Projections

Recommended Actions and Planning Issues • 4-91
ROCKVILLE CLUSTER
Demographic Characteristics of Schools
Total Two or more Black or Mobility Schools Enrollment races % Afr. Amer. % Asian% Hispanic % White % FARMS%* ESOL%** Rate%***Rockville HS 1480 3.2% 13.2% 11.3% 41.2% 30.5% 35.6% 12.8% 11.0%Earle B. Wood MS 1025 4.1% 14.0% 10.5% 43.5% 27.7% 37.6% 7.8% 10.2%Lucy V. Barnsley ES 729 8.6% 10.2% 13.6% 33.1% 34.2% 31.1% 13.2% 10.5%Flower Valley ES 475 8.4% 14.7% 10.1% 24.4% 42.3% 25.6% 14.7% 14.3%Maryvale ES 649 7.4% 25.7% 9.9% 34.8% 21.9% 43.9% 25.0% 8.3%Meadow Hall ES 426 6.3% 12.7% 10.8% 50.9% 18.5% 55.3% 23.2% 19.0%Rock Creek Valley ES 423 8.5% 9.7% 15.8% 36.4% 29.3% 31.4% 18.7% 9.0%Elementary Cluster Total 2702 7.9% 15.0% 12.0% 35.3% 29.4% 37.7% 19.1% 11.9%Elementary County Total 76590 5.3% 21.4% 14.0% 32.3% 26.6% 40.3% 23.2% 14.1%*Percent of students approved for Free and Reduced-priced Meals Program (FARMS) during the 2016–2017 school year.**Percent of English for Speakers of Other Languages (ESOL) during the 2016–2017 school year. High School students are served in regional ESOL centers.
***Mobility Rate is the number of entries plus withdrawals during the 2016–2017 school year compared to total enrollment.Notes: Native Hawaiian/Pacific Islander and American Indian/Alaskan Native categories total less than 1% and were therefore excluded from the table.
Due to federal and state guidelines, demographic characteristics of schools of less than or equal to 5 students per category are reported as 0%.
2017–2018 2016–2017
Schools Gra
des
Ser
ved
Cap
acit
y (H
S @
90%
MS@
85%
)
To
tal R
oo
ms
Sup
po
rt R
oo
ms
Reg
ular
Sec
on
dar
y @
25
Reg
ular
Ele
men
tary
@23
CSR
Gra
des
1–2
@18
Pre
–K @
20
Pre
–K @
40
HS
@20
CSR
KIN
D @
18
KIN
D @
22
ESO
L @
15
MET
S @
15
HSM
@13
ELE
M L
AD
@13
ELC
@10
LA
NG
@12
LFI
@10
SC
B @
6
AA
C@
7
AU
T @
6
BR
IDG
E @
10
DH
OH
@7
ED
@10
EX
TEN
SIO
NS
@6
GT/
LD @
13
PD
@7
PEP
@6
PEP
@12
PEP
@18
VIS
ION
(El
emen
tary
) @
7
OTH
ERRockville HS 9-12 1566 78 64 3 1 4 2 4
Earle B. Wood MS 6-8 936 50 41 2 3 4
Lucy V. Barnsley ES K-5 399 28 4 3 10 5 3 3
Flower Valley ES K-5 416 25 3 13 3 3 3
Maryvale ES HS-5 626 36 4 12 9 1 2 5 3
Meadow Hall ES K-5 370 25 3 4 9 4 2 3
Rock Creek Valley ES K-5 364 29 5 4 8 4 8
Program Capacity TableSpecial Education Services
Sch
oo
l Bas
ed
Clu
ster
Bas
ed
Quad Cluster Based County & Regional Based
(School Year 2017–2018)

4-92 • Recommended Actions and Planning Issues
ROCKVILLE CLUSTER
Year Year Total Site Reloc- Home
Facility Reopened/ Square Size Adjacent atable County School
Schools Opened Revitalized Footage Acres Park Classrooms Programs Model
Rockville HS 1968 2004 316,973 29.61Earle B. Wood MS 1965 2001 152,588 8.5 YesLucy V. Barnsley ES 1965 1998 72,024 10 10Flower Valley ES 1967 1996 61,567 9.3 1Maryvale ES 1969 92,050 17.7 1 LTLMeadow Hall ES 1956 1994 61,694 8.4 Yes 7Rock Creek Valley ES 1964 2001 76,692 10.4 4
Facility Characteristics of Schools 2017–2018

Recommended Actions and Planning Issues • 4-93
SENECA VALLEY CLUSTERCLUSTER PLANNING ISSUESPlanning Issue: The 2009 adopted Germantown Employ-ment Area Sector Plan provides for up to 10,200 mostly multi-family residential units. The majority of planned residential development is located in the Seneca Valley Cluster. The plan requires some redevelopment of shopping centers and some other commercial uses. In addition, the plan anticipates construction of the Corridor Cities Transitway to support the higher housing densities. It is anticipated that the plan will take 20 to 30 years to build-out. The pace of construction will be market driven. A future elementary school site is included in the plan.
SCHOOLSSeneca Valley High SchoolCapital Project: A revitalization/expansion project is sched-uled for this school with a completion date of September 2020. An FY 2018 appropriation was approved to begin construction for the project. Recently, a Career Readiness External Review was conducted and provided recommendations to increase the number of students prepared for employment in high demand fields. Given this school is under con-struction, there is an opportunity to provide the potential to expand career technology education for students living in the upcounty area. Therefore, it is recommended that the master planned shell on the fourth floor be constructed as part of the new facility. Once the school system develops an action plan for career technology and readiness programs across the county, additional details on the full build out will be provided in a future CIP. An FY 2019 appropriation is recommended to continue this revitalization/expansion project.
Planning Issue: Although a classroom addition opened in September 2015 to accommodate the overutilization at Clarksburg High School, stu-dent enrollment at Clarksburg High School will continue to exceed capacity by more than 800 students by the end of the six-year CIP planning period. Enrollment also is projected to exceed capacity at Northwest High School by nearly 400 students. The Seneca Valley High School service area is adjacent to the Clarksburg and North-west high school service areas. A revitalization/expansion project of Seneca Valley High School, scheduled for completion in September 2020, will be designed and constructed with a capacity for 2,400 students. The enrollment at Seneca Valley High School is projected to be 1,499 students by the end of the six-year planning period. With a capacity of 2,400 seats, there will be approximately 900 seats available to accommodate students from Clarksburg and Northwest high schools when the project is complete.
Planning Study: A boundary study is recommended to explore the reassignment of Clarksburg and Northwest high school students to Seneca Valley High School. As part of the boundary study, middle school articulation patterns in the Seneca Valley Cluster will be reviewed in order to evalu-ate utilizations and articulation patterns, therefore Roberto Clemente and Martin Luther King, Jr. middle schools will participate in the boundary study. The boundary study will begin in September 2018 with Board action scheduled in November 2019.
Roberto Clemente Middle SchoolPlanning Study: A boundary study is recommended to explore the reassignment of Clarksburg and Northwest high school students to Seneca Valley High School. As part of the boundary study, middle school articulation patterns in the Seneca Valley Cluster will be reviewed in order to evalu-ate utilizations and articulation patterns, therefore Roberto Clemente and Martin Luther King, Jr. middle schools will participate in the boundary study. The boundary study will begin in September 2018 with Board action scheduled in November 2019.
Seneca Valley Cluster Articulation*
Seneca Valley High School
Dr. Martin Luther King, Jr. MS
Lake Seneca ESDr. Sally K. Ride ES
(North of Middlebrook Road)Waters Landing ES
Roberto Clemente MS
S. Christa McAuliffe ESDr. Sally K. Ride ES
(South of Middlebrook Road)
* ”Cluster” is defined as the collection of elementary schools that articulate to the same high school.
* Clopper Mill, Germantown, and a portion of Great Seneca Creek elementary schools also articulate to Roberto Clemente Middle School, but thereafter articulate to Northwest High School.
0%
20%
40%
60%
80%
100%
120%
2017ACTUAL
2018 2019 2020 2021 2022 2023
Seneca Valley ClusterSchool Utilizations
Elementary Schools Middle Schools High School
DesiredRange
Note: Percent utilization calculated as total enrollment of schools divided by total capacity.Projected capacity factors in capital projects

4-94 • Recommended Actions and Planning Issues
SENECA VALLEY CLUSTER
Martin Luther King, Jr. Middle SchoolPlanning Study: A boundary study is recommended to explore the reassignment of Clarksburg and Northwest high school students to Seneca Valley High School. As part of the boundary study, middle school articulation patterns in the Seneca Valley Cluster will be reviewed in order to evalu-ate utilizations and articulation patterns, therefore Roberto Clemente and Martin Luther King, Jr. middle schools will participate in the boundary study. The boundary study will begin in September 2018 with Board action scheduled in November 2019.
Lake Seneca Elementary SchoolCapital Project: Previous projections indicated that enroll-ment at Lake Seneca Elementary School would exceed capac-ity by 92 seats or more by the end of the six-year planning period. Therefore, an FY 2014 appropriation was approved for facility planning to determine the feasibility, scope, and cost for a classroom addition. Current projections indicate enrollment will exceed capacity over the six-year period; however, enrollment is trending downward over the same time period. Therefore, enrollment will continue to be monitored and relocatable classrooms will be utilized until a capacity project is considered in a future CIP.
S. Christa McAuliffe Elementary SchoolCapital Project: A classroom addition is scheduled for this school with a completion date of September 2019. An FY 2018 appropriation was approved to begin the construction for the classroom addition. Relocatable classrooms will be utilized until additional capacity can be added.
CAPITAL PROJECTS
School ProjectProject Status*
Date of Completion
Seneca Valley HS Revitalization/expansion
Approved Sept. 2020, building Sept. 2021, site
S. Christa McAuliffe ES
Classroom addition
Approved Sept. 2019
“Approved”—Project has an FY 2017 or FY 2018 appropriation approved in the Amended FY 2017–2022 CIP.“Programmed”—Project has expenditures programmed in a future year of the CIP for planning and/or construction funds.“Proposed”—Project has facility planning funds recommended for a feasibility study.“Recommended”—Project has an FY 2019 appropriation recommended for planning or construction in the FY 2019–2024 CIP.
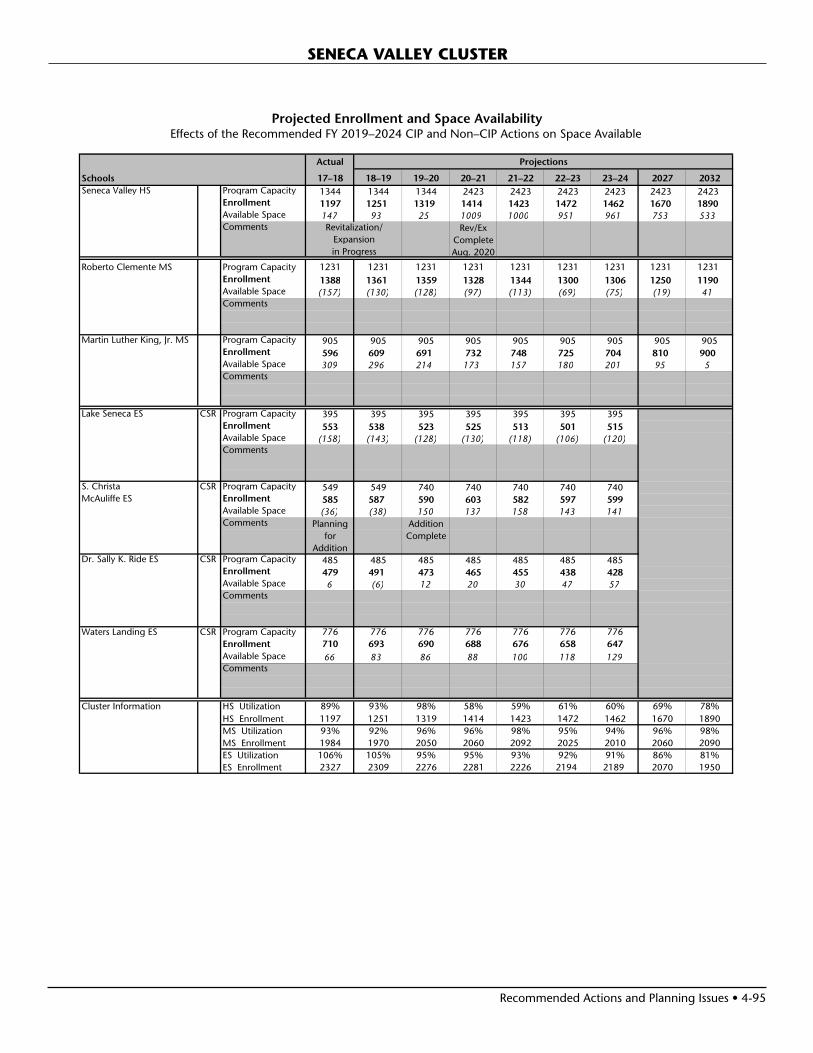
Recommended Actions and Planning Issues • 4-95
SENECA VALLEY CLUSTER
Projected Enrollment and Space AvailabilityEffects of the Recommended FY 2019–2024 CIP and Non–CIP Actions on Space Available
Actual
Schools 17–18 18–19 19–20 20–21 21–22 22–23 23–24 2027 2032Seneca Valley HS Program Capacity 1344 1344 1344 2423 2423 2423 2423 2423 2423
Enrollment 1197 1251 1319 1414 1423 1472 1462 1670 1890Available Space 147 93 25 1009 1000 951 961 753 533Comments Rev/Ex
CompleteAug. 2020
Roberto Clemente MS Program Capacity 1231 1231 1231 1231 1231 1231 1231 1231 1231Enrollment 1388 1361 1359 1328 1344 1300 1306 1250 1190Available Space (157) (130) (128) (97) (113) (69) (75) (19) 41Comments
Martin Luther King, Jr. MS Program Capacity 905 905 905 905 905 905 905 905 905Enrollment 596 609 691 732 748 725 704 810 900Available Space 309 296 214 173 157 180 201 95 5Comments
Lake Seneca ES CSR Program Capacity 395 395 395 395 395 395 395Enrollment 553 538 523 525 513 501 515Available Space (158) (143) (128) (130) (118) (106) (120)Comments
S. Christa CSR Program Capacity 549 549 740 740 740 740 740McAuliffe ES Enrollment 585 587 590 603 582 597 599
Available Space (36) (38) 150 137 158 143 141Comments Planning Addition
for CompleteAddition
Dr. Sally K. Ride ES CSR Program Capacity 485 485 485 485 485 485 485Enrollment 479 491 473 465 455 438 428Available Space 6 (6) 12 20 30 47 57Comments
Waters Landing ES CSR Program Capacity 776 776 776 776 776 776 776Enrollment 710 693 690 688 676 658 647Available Space 66 83 86 88 100 118 129Comments
Cluster Information HS Utilization 89% 93% 98% 58% 59% 61% 60% 69% 78%HS Enrollment 1197 1251 1319 1414 1423 1472 1462 1670 1890MS Utilization 93% 92% 96% 96% 98% 95% 94% 96% 98%MS Enrollment 1984 1970 2050 2060 2092 2025 2010 2060 2090ES Utilization 106% 105% 95% 95% 93% 92% 91% 86% 81%ES Enrollment 2327 2309 2276 2281 2226 2194 2189 2070 1950
Projections
Revitalization/Expansionin Progress

4-96 • Recommended Actions and Planning Issues
SENECA VALLEY CLUSTER
Demographic Characteristics of Schools
Total Two or more Black or Mobility Schools Enrollment races % Afr. Amer. % Asian% Hispanic % White % FARMS%* ESOL%** Rate%***Seneca Valley HS 1197 4.3% 34.6% 11.8% 33.1% 16.0% 36.4% 12.0% 21.3%Roberto Clemente MS 1388 5.5% 24.1% 25.2% 29.8% 15.1% 31.7% 4.9% 11.9%Martin Luther King, Jr MS 596 5.4% 38.3% 9.6% 32.6% 14.3% 48.9% 8.5% 21.4%Lake Seneca ES 553 4.7% 37.8% 5.8% 38.2% 12.8% 56.1% 27.3% 21.1%S. Christa McAuliffe ES 585 6.2% 38.6% 9.1% 30.3% 15.2% 48.6% 20.0% 19.5%Dr. Sally K. Ride ES 479 3.5% 40.1% 15.4% 30.5% 10.4% 50.2% 18.8% 17.1%Waters Landing ES 710 5.9% 37.5% 5.4% 37.5% 13.8% 50.5% 21.7% 25.8%Elementary Cluster Total 2327 5.2% 38.4% 8.5% 34.4% 13.2% 51.4% 22.0% 21.2%Elementary County Total 76590 5.3% 21.4% 14.0% 32.3% 26.6% 40.3% 23.2% 14.1%*Percent of students approved for Free and Reduced-priced Meals Program (FARMS) during the 2016–2017 school year.**Percent of English for Speakers of Other Languages (ESOL) during the 2016–2017 school year. High School students are served in regional ESOL centers.
***Mobility Rate is the number of entries plus withdrawals during the 2016–2017 school year compared to total enrollment.Notes: Native Hawaiian/Pacific Islander and American Indian/Alaskan Native categories total less than 1% and were therefore excluded from the table.
Due to federal and state guidelines, demographic characteristics of schools of less than or equal to 5 students per category are reported as 0%.
2017–2018 2016–2017
Schools Gra
des
Ser
ved
Cap
acit
y (H
S @
90%
MS@
85%
)
To
tal R
oo
ms
Sup
po
rt R
oo
ms
Reg
ular
Sec
on
dar
y @
25
Reg
ular
Ele
men
tary
@23
CSR
Gra
des
1–2
@18
Pre
–K @
20
Pre
–K @
40
HS
@20
CSR
KIN
D @
18
KIN
D @
22
ESO
L @
15
MET
S @
15
HSM
@13
ELE
M L
AD
@13
ELC
@10
LA
NG
@12
LFI
@10
SC
B @
6
AA
C@
7
AU
T @
6
BR
IDG
E @
10
DH
OH
@7
ED
@10
EX
TEN
SIO
NS
@6
GT/
LD @
13
PD
@7
PEP
@6
PEP
@12
PEP
@18
VIS
ION
(El
emen
tary
) @
7
OTH
ERSeneca Valley HS 9-12 1344 66 55 3 1 4 3
Roberto Clemente MS 6-8 1231 60 56 1 2 1
Martin Luther King, Jr MS 6-8 905 43 42 1
Lake Seneca ES K-5 395 26 4 10 1 6 1 1 1 2
S. Christa McAuliffe ES HS-5 549 33 4 7 13 1 6 2
Dr. Sally K. Ride ES HS-5 485 33 5 3 10 1 1 5 1 1 6
Waters Landing ES K-5 776 43 3 16 14 7 3
Program Capacity TableSpecial Education Services
Sch
oo
l Bas
ed
Clu
ster
Bas
ed
Quad Cluster Based County & Regional Based
(School Year 2017–2018)

Recommended Actions and Planning Issues • 4-97
SENECA VALLEY CLUSTER
Year Year Total Site Reloc- Home
Facility Reopened/ Square Size Adjacent atable County School
Schools Opened Revitalized Footage Acres Park Classrooms Programs Model
Seneca Valley HS 1974 251,278 29.4 1Roberto Clemente MS 1992 148,246 19.9 3Martin Luther King, Jr MS 1996 135,867 19Lake Seneca ES 1985 58,770 9.4 9 YesS. Christa McAuliffe ES 1987 77,240 10.6 Yes 8Dr. Sally K. Ride ES 1994 78,686 13.5 4Waters Landing ES 1988 101,352 10 Yes
Facility Characteristics of Schools 2017–2018
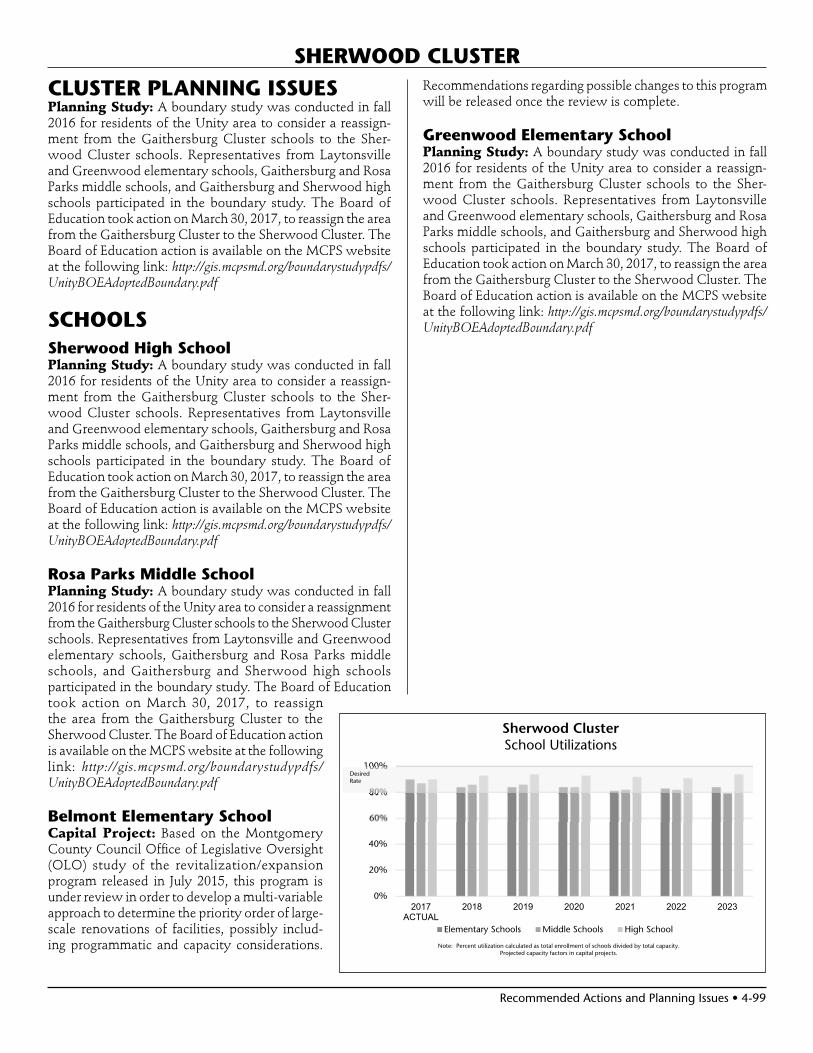
Recommended Actions and Planning Issues • 4-99
CLUSTER PLANNING ISSUESPlanning Study: A boundary study was conducted in fall 2016 for residents of the Unity area to consider a reassign-ment from the Gaithersburg Cluster schools to the Sher-wood Cluster schools. Representatives from Laytonsville and Greenwood elementary schools, Gaithersburg and Rosa Parks middle schools, and Gaithersburg and Sherwood high schools participated in the boundary study. The Board of Education took action on March 30, 2017, to reassign the area from the Gaithersburg Cluster to the Sherwood Cluster. The Board of Education action is available on the MCPS website at the following link: http://gis.mcpsmd.org/boundarystudypdfs/UnityBOEAdoptedBoundary.pdf
SCHOOLSSherwood High SchoolPlanning Study: A boundary study was conducted in fall 2016 for residents of the Unity area to consider a reassign-ment from the Gaithersburg Cluster schools to the Sher-wood Cluster schools. Representatives from Laytonsville and Greenwood elementary schools, Gaithersburg and Rosa Parks middle schools, and Gaithersburg and Sherwood high schools participated in the boundary study. The Board of Education took action on March 30, 2017, to reassign the area from the Gaithersburg Cluster to the Sherwood Cluster. The Board of Education action is available on the MCPS website at the following link: http://gis.mcpsmd.org/boundarystudypdfs/UnityBOEAdoptedBoundary.pdf
Rosa Parks Middle SchoolPlanning Study: A boundary study was conducted in fall 2016 for residents of the Unity area to consider a reassignment from the Gaithersburg Cluster schools to the Sherwood Cluster schools. Representatives from Laytonsville and Greenwood elementary schools, Gaithersburg and Rosa Parks middle schools, and Gaithersburg and Sherwood high schools participated in the boundary study. The Board of Education took action on March 30, 2017, to reassign the area from the Gaithersburg Cluster to the Sherwood Cluster. The Board of Education action is available on the MCPS website at the following link: http://gis.mcpsmd.org/boundarystudypdfs/UnityBOEAdoptedBoundary.pdf
Belmont Elementary SchoolCapital Project: Based on the Montgomery County Council Office of Legislative Oversight (OLO) study of the revitalization/expansion program released in July 2015, this program is under review in order to develop a multi-variable approach to determine the priority order of large-scale renovations of facilities, possibly includ-ing programmatic and capacity considerations.
Recommendations regarding possible changes to this program will be released once the review is complete.
Greenwood Elementary SchoolPlanning Study: A boundary study was conducted in fall 2016 for residents of the Unity area to consider a reassign-ment from the Gaithersburg Cluster schools to the Sher-wood Cluster schools. Representatives from Laytonsville and Greenwood elementary schools, Gaithersburg and Rosa Parks middle schools, and Gaithersburg and Sherwood high schools participated in the boundary study. The Board of Education took action on March 30, 2017, to reassign the area from the Gaithersburg Cluster to the Sherwood Cluster. The Board of Education action is available on the MCPS website at the following link: http://gis.mcpsmd.org/boundarystudypdfs/UnityBOEAdoptedBoundary.pdf
SHERWOOD CLUSTER
0%
20%
40%
60%
80%
100%
2017ACTUAL
2018 2019 2020 2021 2022 2023
Sherwood ClusterSchool Utilizations
Elementary Schools Middle Schools High School
DesiredRate
Note: Percent utilization calculated as total enrollment of schools divided by total capacity.Projected capacity factors in capital projects.
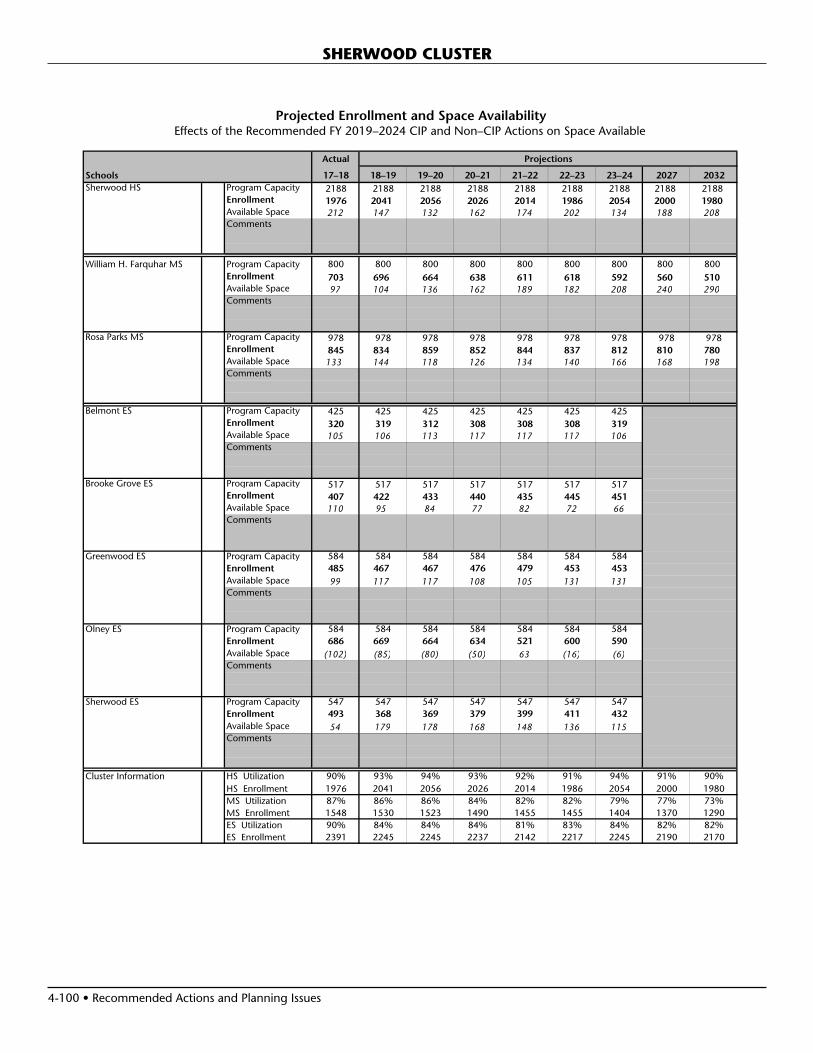
4-100 • Recommended Actions and Planning Issues
SHERWOOD CLUSTER
Projected Enrollment and Space AvailabilityEffects of the Recommended FY 2019–2024 CIP and Non–CIP Actions on Space Available
Actual
Schools 17–18 18–19 19–20 20–21 21–22 22–23 23–24 2027 2032Sherwood HS Program Capacity 2188 2188 2188 2188 2188 2188 2188 2188 2188
Enrollment 1976 2041 2056 2026 2014 1986 2054 2000 1980Available Space 212 147 132 162 174 202 134 188 208Comments
William H. Farquhar MS Program Capacity 800 800 800 800 800 800 800 800 800Enrollment 703 696 664 638 611 618 592 560 510Available Space 97 104 136 162 189 182 208 240 290Comments
Rosa Parks MS Program Capacity 978 978 978 978 978 978 978 978 978Enrollment 845 834 859 852 844 837 812 810 780Available Space 133 144 118 126 134 140 166 168 198Comments
Belmont ES Program Capacity 425 425 425 425 425 425 425Enrollment 320 319 312 308 308 308 319Available Space 105 106 113 117 117 117 106Comments
Brooke Grove ES Program Capacity 517 517 517 517 517 517 517Enrollment 407 422 433 440 435 445 451Available Space 110 95 84 77 82 72 66Comments
Greenwood ES Program Capacity 584 584 584 584 584 584 584Enrollment 485 467 467 476 479 453 453Available Space 99 117 117 108 105 131 131Comments
Olney ES Program Capacity 584 584 584 584 584 584 584Enrollment 686 669 664 634 521 600 590Available Space (102) (85) (80) (50) 63 (16) (6)Comments
Sherwood ES Program Capacity 547 547 547 547 547 547 547Enrollment 493 368 369 379 399 411 432Available Space 54 179 178 168 148 136 115Comments
Cluster Information HS Utilization 90% 93% 94% 93% 92% 91% 94% 91% 90%HS Enrollment 1976 2041 2056 2026 2014 1986 2054 2000 1980MS Utilization 87% 86% 86% 84% 82% 82% 79% 77% 73%MS Enrollment 1548 1530 1523 1490 1455 1455 1404 1370 1290ES Utilization 90% 84% 84% 84% 81% 83% 84% 82% 82%ES Enrollment 2391 2245 2245 2237 2142 2217 2245 2190 2170
Projections

Recommended Actions and Planning Issues • 4-101
SHERWOOD CLUSTER
Demographic Characteristics of Schools
Total Two or more Black or Mobility Schools Enrollment races % Afr. Amer. % Asian% Hispanic % White % FARMS%* ESOL%** Rate%***Sherwood HS 1976 4.5% 15.6% 11.1% 18.4% 50.3% 17.0% 10.5% 11.5%William H. Farquhar MS 703 4.3% 25.2% 12.7% 15.2% 42.5% 13.7% 2.4% 6.2%Rosa Parks MS 845 5.1% 10.5% 9.9% 13.5% 60.9% 10.1% 0.7% 2.9%Belmont ES 320 5.9% 7.2% 5.6% 10.9% 70.3% 7.5% 4.0% 4.4%Brooke Grove ES 407 5.4% 22.9% 15.5% 15.0% 41.0% 28.7% 12.4% 7.0%Greenwood ES 485 7.0% 10.7% 7.6% 9.9% 64.7% 9.0% 5.5% 3.3%Olney ES 686 7.4% 17.2% 13.8% 15.0% 46.5% 20.0% 11.3% 7.8%Sherwood ES 493 7.5% 19.9% 12.4% 17.6% 42.2% 15.0% 6.5% 8.3%Elementary Cluster Total 2391 6.8% 16.1% 11.5% 14.0% 51.6% 16.6% 8.4% 6.4%Elementary County Total 76590 5.3% 21.4% 14.0% 32.3% 26.6% 40.3% 23.2% 14.1%*Percent of students approved for Free and Reduced-priced Meals Program (FARMS) during the 2016–2017 school year.**Percent of English for Speakers of Other Languages (ESOL) during the 2016–2017 school year. High School students are served in regional ESOL centers.
***Mobility Rate is the number of entries plus withdrawals during the 2016–2017 school year compared to total enrollment.Notes: Native Hawaiian/Pacific Islander and American Indian/Alaskan Native categories total less than 1% and were therefore excluded from the table.
Due to federal and state guidelines, demographic characteristics of schools of less than or equal to 5 students per category are reported as 0%.
2017–2018 2016–2017
Schools Gra
des
Ser
ved
Cap
acit
y (H
S @
90%
MS@
85%
)
To
tal R
oo
ms
Sup
po
rt R
oo
ms
Reg
ular
Sec
on
dar
y @
25
Reg
ular
Ele
men
tary
@23
CSR
Gra
des
1–2
@18
Pre
–K @
20
Pre
–K @
40
HS
@20
CSR
KIN
D @
18
KIN
D @
22
ESO
L @
15
MET
S @
15
HSM
@13
ELE
M L
AD
@13
ELC
@10
LA
NG
@12
LFI
@10
SC
B @
6
AA
C@
7
AU
T @
6
BR
IDG
E @
10
DH
OH
@7
ED
@10
EX
TEN
SIO
NS
@6
GT/
LD @
13
PD
@7
PEP
@6
PEP
@12
PEP
@18
VIS
ION
(El
emen
tary
) @
7
OTH
ERSherwood HS 9-12 2188 101 95 2 2 1 1
William H. Farquhar MS 6-8 800 40 37 1 1 1
Rosa Parks MS 6-8 978 46 46
Belmont ES K-5 425 23 4 16 2 1
Brooke Grove ES PreK-5 517 30 4 16 1 3 1 5
Greenwood ES K-5 584 29 3 21 4 1
Olney ES K-5 584 30 4 21 4 1
Sherwood ES K-5 547 31 3 18 3 1 1 2 1 1 1
Program Capacity TableSpecial Education Services
Sch
oo
l Bas
ed
Clu
ster
Bas
ed
Quad Cluster Based County & Regional Based
(School Year 2017–2018)
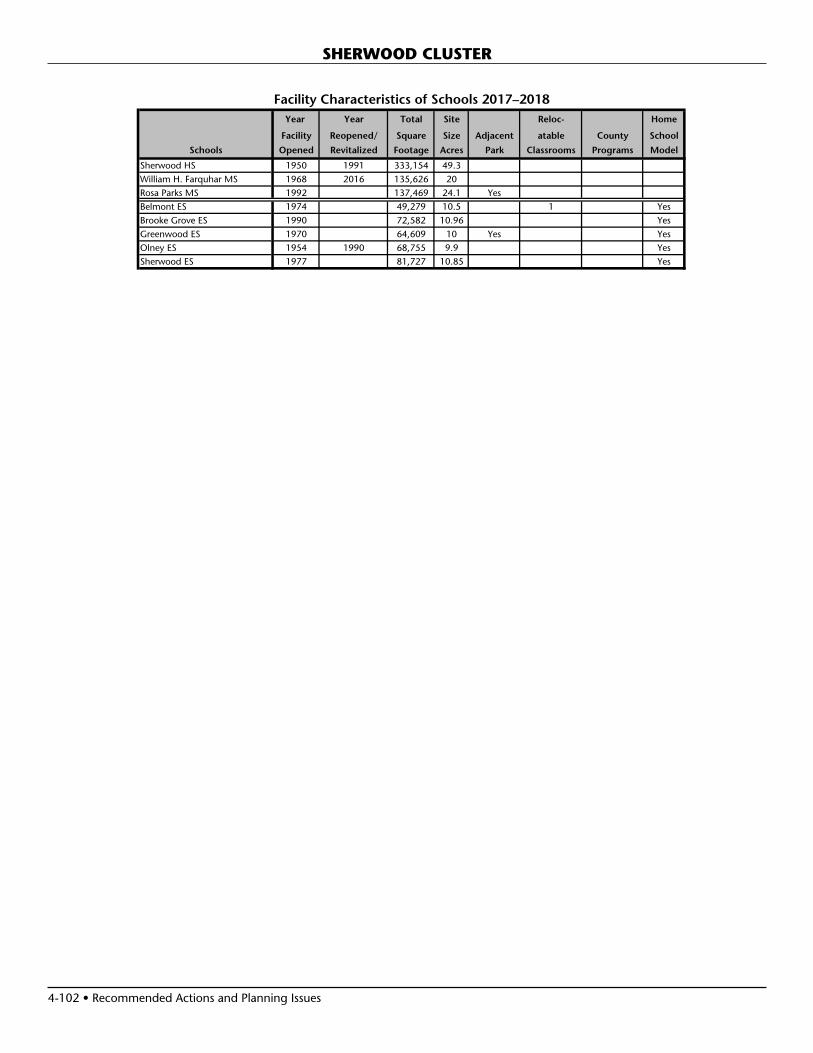
4-102 • Recommended Actions and Planning Issues
SHERWOOD CLUSTER
Year Year Total Site Reloc- Home
Facility Reopened/ Square Size Adjacent atable County School
Schools Opened Revitalized Footage Acres Park Classrooms Programs Model
Sherwood HS 1950 1991 333,154 49.3William H. Farquhar MS 1968 2016 135,626 20Rosa Parks MS 1992 137,469 24.1 YesBelmont ES 1974 49,279 10.5 1 YesBrooke Grove ES 1990 72,582 10.96 YesGreenwood ES 1970 64,609 10 Yes YesOlney ES 1954 1990 68,755 9.9 YesSherwood ES 1977 81,727 10.85 Yes
Facility Characteristics of Schools 2017–2018
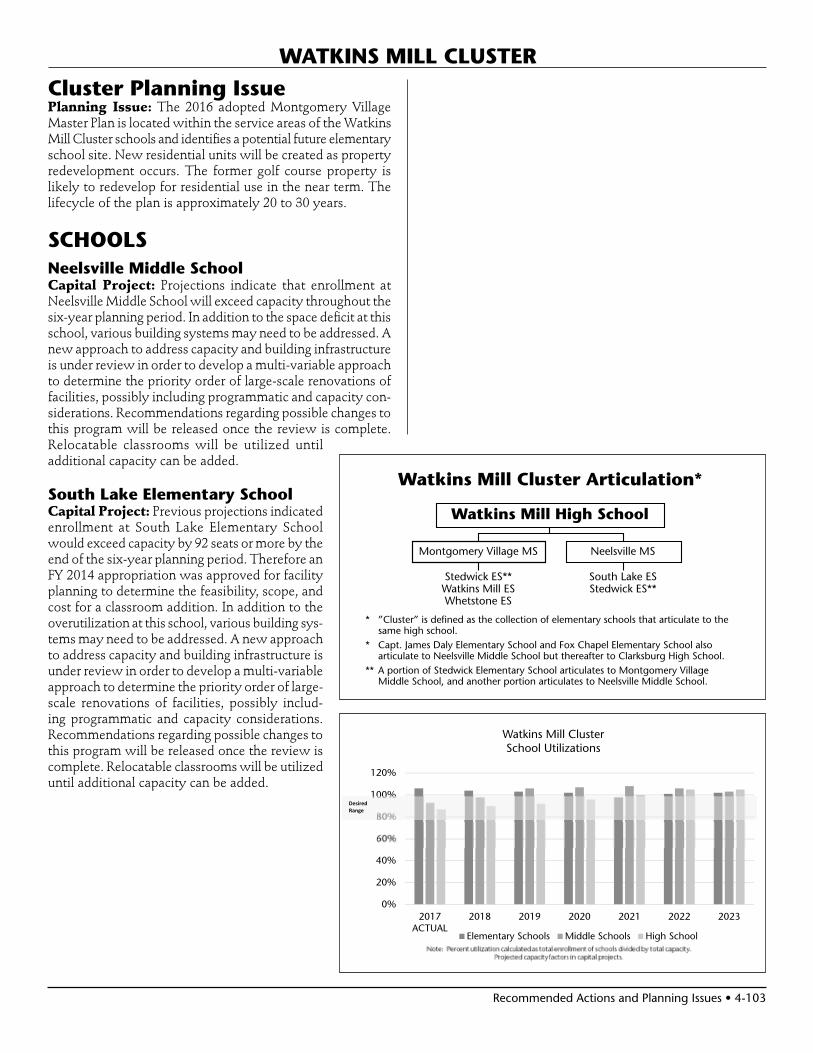
Recommended Actions and Planning Issues • 4-103
WATKINS MILL CLUSTER
Cluster Planning IssuePlanning Issue: The 2016 adopted Montgomery Village Master Plan is located within the service areas of the Watkins Mill Cluster schools and identifies a potential future elementary school site. New residential units will be created as property redevelopment occurs. The former golf course property is likely to redevelop for residential use in the near term. The lifecycle of the plan is approximately 20 to 30 years.
SCHOOLSNeelsville Middle SchoolCapital Project: Projections indicate that enrollment at Neelsville Middle School will exceed capacity throughout the six-year planning period. In addition to the space deficit at this school, various building systems may need to be addressed. A new approach to address capacity and building infrastructure is under review in order to develop a multi-variable approach to determine the priority order of large-scale renovations of facilities, possibly including programmatic and capacity con-siderations. Recommendations regarding possible changes to this program will be released once the review is complete. Relocatable classrooms will be utilized until additional capacity can be added.
South Lake Elementary SchoolCapital Project: Previous projections indicated enrollment at South Lake Elementary School would exceed capacity by 92 seats or more by the end of the six-year planning period. Therefore an FY 2014 appropriation was approved for facility planning to determine the feasibility, scope, and cost for a classroom addition. In addition to the overutilization at this school, various building sys-tems may need to be addressed. A new approach to address capacity and building infrastructure is under review in order to develop a multi-variable approach to determine the priority order of large-scale renovations of facilities, possibly includ-ing programmatic and capacity considerations. Recommendations regarding possible changes to this program will be released once the review is complete. Relocatable classrooms will be utilized until additional capacity can be added.
Watkins Mill Cluster Articulation*
Watkins Mill High School
Neelsville MS
South Lake ESStedwick ES**
Montgomery Village MS
Stedwick ES**Watkins Mill ESWhetstone ES
* ”Cluster” is defined as the collection of elementary schools that articulate to the same high school.
* Capt. James Daly Elementary School and Fox Chapel Elementary School also articulate to Neelsville Middle School but thereafter to Clarksburg High School.
** A portion of Stedwick Elementary School articulates to Montgomery Village Middle School, and another portion articulates to Neelsville Middle School.
0%
20%
40%
60%
80%
100%
120%
2017ACTUAL
2018 2019 2020 2021 2022 2023
Watkins Mill ClusterSchool Utilizations
Elementary Schools Middle Schools High School
DesiredRange

4-104 • Recommended Actions and Planning Issues
WATKINS MILL CLUSTER
Projected Enrollment and Space AvailabilityEffects of the Recommended FY 2019–2024 CIP and Non–CIP Actions on Space Available
Actual
Schools 17–18 18–19 19–20 20–21 21–22 22–23 23–24 2027 2032Watkins Mill HS Program Capacity 1915 1915 1915 1915 1915 1915 1915 1915 1915
Enrollment 1665 1730 1760 1843 1922 2005 2009 2290 2600Available Space 250 185 155 72 (7) (90) (94) (375) (685)Comments
Montgomery Village MS Program Capacity 873 873 873 873 873 873 873 873 873Enrollment 743 752 823 818 842 818 786 840 870Available Space 130 121 50 55 31 55 87 33 3Comments
Neelsville MS Program Capacity 914 914 914 914 914 914 914 914 914Enrollment 926 1006 1080 1089 1081 1068 1054 1100 1130Available Space (12) (92) (166) (175) (167) (154) (140) (186) (216)Comments See text
South Lake ES CSR Program Capacity 716 716 716 716 716 716 716Enrollment 847 821 807 793 801 797 810Available Space (131) (105) (91) (77) (85) (81) (94)Comments See text
Stedwick ES CSR Program Capacity 670 670 670 670 670 670 670Enrollment 609 591 584 570 577 584 596Available Space 61 79 86 100 93 86 74Comments
Watkins Mill ES CSR Program Capacity 641 641 641 641 641 641 641Enrollment 694 697 700 713 699 684 681Available Space (53) (56) (59) (72) (58) (43) (40)Comments
Whetstone ES CSR Program Capacity 750 750 750 750 750 750 750Enrollment 797 768 760 745 649 734 755Available Space (47) (18) (10) 5 101 16 (5)Comments
Cluster Information HS Utilization 87% 90% 92% 96% 100% 105% 105% 120% 136%HS Enrollment 1665 1730 1760 1843 1922 2005 2009 2290 2600MS Utilization 93% 98% 106% 107% 108% 106% 103% 109% 112%MS Enrollment 1669 1758 1903 1907 1923 1886 1840 1940 2000ES Utilization 106% 104% 103% 102% 98% 101% 102% 100% 98%ES Enrollment 2947 2877 2851 2821 2726 2799 2842 2780 2730
Projections

Recommended Actions and Planning Issues • 4-105
WATKINS MILL CLUSTER
Demographic Characteristics of Schools
Total Two or more Black or Mobility Schools Enrollment races % Afr. Amer. % Asian% Hispanic % White % FARMS%* ESOL%** Rate%***Watkins Mill HS 1665 4.3% 29.8% 8.0% 50.2% 7.7% 52.5% 21.4% 24.8%Montgomery Village MS 743 2.6% 32.8% 7.1% 52.9% 4.4% 66.2% 15.6% 22.3%Neelsville MS 926 2.5% 33.2% 9.4% 48.7% 5.9% 60.2% 17.6% 18.8%South Lake ES 847 2.7% 26.6% 5.3% 63.4% 1.7% 82.1% 51.4% 30.4%Stedwick ES 609 5.9% 28.4% 4.9% 48.1% 12.3% 60.0% 38.1% 15.8%Watkins Mill ES 696 4.7% 29.6% 7.5% 53.6% 4.5% 99.9% 43.4% 23.1%Whetstone ES 797 3.0% 28.9% 8.7% 51.7% 7.7% 62.4% 40.8% 15.8%Elementary Cluster Total 2949 3.9% 28.3% 6.6% 54.8% 6.1% 76.5% 43.9% 21.8%Elementary County Total 76590 5.3% 21.4% 14.0% 32.3% 26.6% 40.3% 23.2% 14.1%*Percent of students approved for Free and Reduced-priced Meals Program (FARMS) during the 2016–2017 school year.**Percent of English for Speakers of Other Languages (ESOL) during the 2016–2017 school year. High School students are served in regional ESOL centers.
***Mobility Rate is the number of entries plus withdrawals during the 2016–2017 school year compared to total enrollment.Notes: Native Hawaiian/Pacific Islander and American Indian/Alaskan Native categories total less than 1% and were therefore excluded from the table.
Due to federal and state guidelines, demographic characteristics of schools of less than or equal to 5 students per category are reported as 0%.
2017–2018 2016–2017
Schools Gra
des
Ser
ved
Cap
acit
y (H
S @
90%
MS@
85%
)
To
tal R
oo
ms
Sup
po
rt R
oo
ms
Reg
ular
Sec
on
dar
y @
25
Reg
ular
Ele
men
tary
@23
CSR
Gra
des
1–2
@18
Pre
–K @
20
Pre
–K @
40
HS
@20
CSR
KIN
D @
18
KIN
D @
22
ESO
L @
15
MET
S @
15
HSM
@13
ELE
M L
AD
@13
ELC
@10
LA
NG
@12
LFI
@10
SC
B @
6
AA
C@
7
AU
T @
6
BR
IDG
E @
10
DH
OH
@7
ED
@10
EX
TEN
SIO
NS
@6
GT/
LD @
13
PD
@7
PEP
@6
PEP
@12
PEP
@18
VIS
ION
(El
emen
tary
) @
7
OTH
ERWatkins Mill HS 9-12 1915 90 79 5 3 2 1
Montgomery Village MS 6-8 873 46 37 3 1 3 2
Neelsville MS 6-8 914 45 40 3 2
South Lake ES HS-5 716 39 5 16 10 1 1 6
Stedwick ES PreK-5 670 39 5 13 10 1 6 1 3
Watkins Mill ES HS-5 641 42 5 6 13 1 1 7 2 1 6
Whetstone ES PreK-5 750 43 5 12 14 1 6 2 1 2
Program Capacity TableSpecial Education Services
Sch
oo
l Bas
ed
Clu
ster
Bas
ed
Quad Cluster Based County & Regional Based
(School Year 2017–2018)

4-106 • Recommended Actions and Planning Issues
WATKINS MILL CLUSTER
Year Year Total Site Reloc- Home
Facility Reopened/ Square Size Adjacent atable County School
Schools Opened Revitalized Footage Acres Park Classrooms Programs Model
Watkins Mill HS 1989 305,288 50.99 Yes SBWCMontgomery Village MS 1968 2003 141,615 15.1Neelsville MS 1981 131,432 29.2South Lake ES 1972 83,038 10.2 4 LTL YesStedwick ES 1974 109,677 10 YesWatkins Mill ES 1970 80,923 10 Yes 1 YesWhetstone ES 1968 96,946 8.8 Yes
Facility Characteristics of Schools 2017–2018
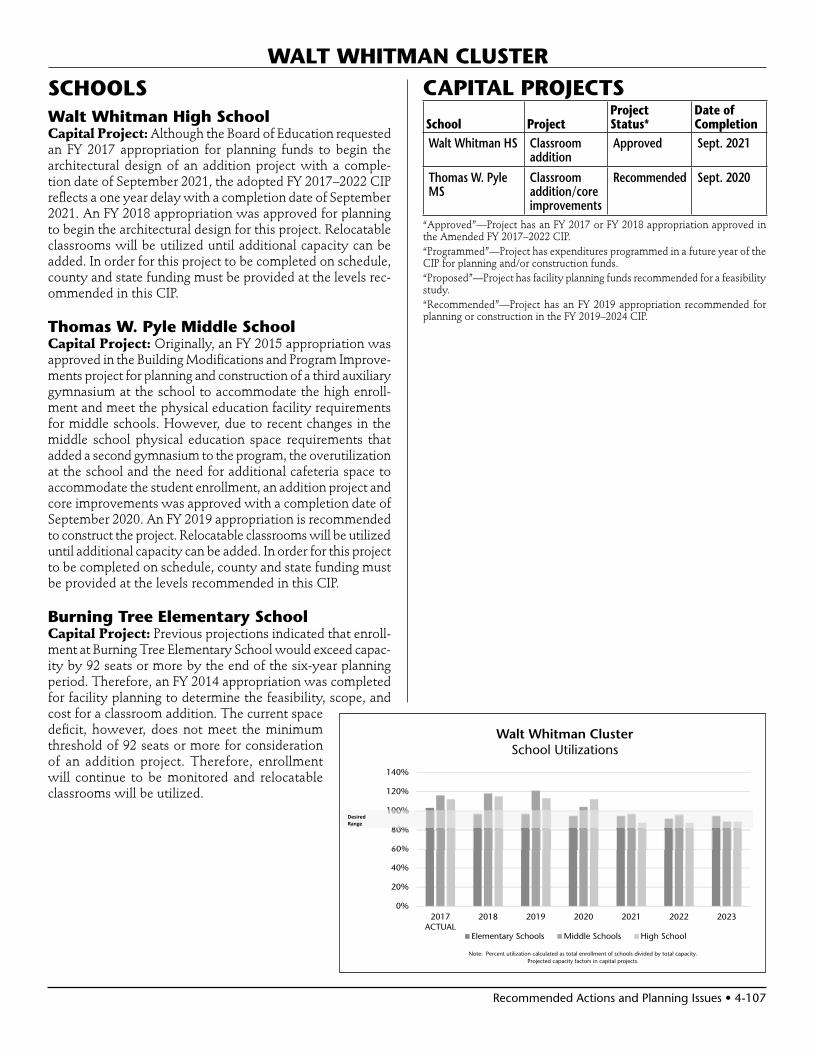
Recommended Actions and Planning Issues • 4-107
WALT WHITMAN CLUSTER
SCHOOLS Walt Whitman High SchoolCapital Project: Although the Board of Education requested an FY 2017 appropriation for planning funds to begin the architectural design of an addition project with a comple-tion date of September 2021, the adopted FY 2017–2022 CIP reflects a one year delay with a completion date of September 2021. An FY 2018 appropriation was approved for planning to begin the architectural design for this project. Relocatable classrooms will be utilized until additional capacity can be added. In order for this project to be completed on schedule, county and state funding must be provided at the levels rec-ommended in this CIP.
Thomas W. Pyle Middle SchoolCapital Project: Originally, an FY 2015 appropriation was approved in the Building Modifications and Program Improve-ments project for planning and construction of a third auxiliary gymnasium at the school to accommodate the high enroll-ment and meet the physical education facility requirements for middle schools. However, due to recent changes in the middle school physical education space requirements that added a second gymnasium to the program, the overutilization at the school and the need for additional cafeteria space to accommodate the student enrollment, an addition project and core improvements was approved with a completion date of September 2020. An FY 2019 appropriation is recommended to construct the project. Relocatable classrooms will be utilized until additional capacity can be added. In order for this project to be completed on schedule, county and state funding must be provided at the levels recommended in this CIP.
Burning Tree Elementary SchoolCapital Project: Previous projections indicated that enroll-ment at Burning Tree Elementary School would exceed capac-ity by 92 seats or more by the end of the six-year planning period. Therefore, an FY 2014 appropriation was completed for facility planning to determine the feasibility, scope, and cost for a classroom addition. The current space deficit, however, does not meet the minimum threshold of 92 seats or more for consideration of an addition project. Therefore, enrollment will continue to be monitored and relocatable classrooms will be utilized.
CAPITAL PROJECTS
School ProjectProject Status*
Date of Completion
Walt Whitman HS Classroom addition
Approved Sept. 2021
Thomas W. Pyle MS
Classroom addition/core improvements
Recommended Sept. 2020
“Approved”—Project has an FY 2017 or FY 2018 appropriation approved in the Amended FY 2017–2022 CIP.“Programmed”—Project has expenditures programmed in a future year of the CIP for planning and/or construction funds.“Proposed”—Project has facility planning funds recommended for a feasibility study.“Recommended”—Project has an FY 2019 appropriation recommended for planning or construction in the FY 2019–2024 CIP.
0%
20%
40%
60%
80%
100%
120%
140%
2017ACTUAL
2018 2019 2020 2021 2022 2023
Walt Whitman ClusterSchool Utilizations
Elementary Schools Middle Schools High School
DesiredRange
Note: Percent utilization calculated as total enrollment of schools divided by total capacity. Projected capacity factors in capital projects.

4-108 • Recommended Actions and Planning Issues
WALT WHITMAN CLUSTER
Projected Enrollment and Space AvailabilityEffects of the Recommended FY 2019–2024 CIP and Non–CIP Actions on Space Available
Actual
Schools 17–18 18–19 19–20 20–21 21–22 22–23 23–24 2027 2032Walt Whitman HS Program Capacity 1866 1866 1866 1866 2397 2397 2397 2397 2397
Enrollment 2094 2137 2109 2092 2108 2104 2129 2110 2100Available Space (228) (271) (243) (226) 289 293 268 287 297Comments Planning Addition
for CompleteAddition
Thomas W. Pyle MS Program Capacity 1285 1285 1285 1502 1502 1502 1502 1502 1502Enrollment 1485 1521 1557 1555 1456 1449 1336 1290 1190Available Space (200) (236) (272) (53) 46 53 166 212 312Comments Planning Addition
for CompleteAddition
Bannockburn ES Program Capacity 365 365 365 365 365 365 365Enrollment 450 437 435 420 416 394 405Available Space (85) (72) (70) (55) (51) (29) (40)Comments
Bradley Hills ES Program Capacity 663 663 663 663 663 663 663Enrollment 630 605 606 601 610 607 610Available Space 33 58 57 62 53 56 53Comments
Burning Tree ES Program Capacity 379 379 379 379 379 379 379Enrollment 463 441 432 429 442 409 429Available Space (84) (62) (53) (50) (63) (30) (50)Comments
Carderock Springs ES Program Capacity 407 407 407 407 407 407 407Enrollment 395 369 355 346 336 331 325Available Space 12 38 52 61 71 76 82Comments
Wood Acres ES Program Capacity 725 725 725 725 725 725 725Enrollment 668 623 624 615 612 596 641Available Space 57 102 101 110 113 129 84Comments
Cluster Information HS Utilization 112% 115% 113% 112% 88% 88% 89% 88% 88%HS Enrollment 2094 2137 2109 2092 2108 2104 2129 2110 2100MS Utilization 116% 118% 121% 104% 97% 96% 89% 86% 79%MS Enrollment 1485 1521 1557 1555 1456 1449 1336 1290 1190ES Utilization 103% 97% 97% 95% 95% 92% 95% 90% 86%ES Enrollment 2606 2475 2452 2411 2416 2337 2410 2290 2190
Projections

Recommended Actions and Planning Issues • 4-109
WALT WHITMAN CLUSTER
Demographic Characteristics of Schools
Total Two or more Black or Mobility Schools Enrollment races % Afr. Amer. % Asian% Hispanic % White % FARMS%* ESOL%** Rate%***Walt Whitman HS 2094 5.0% 4.1% 15.1% 8.7% 66.9% 1.9% 3.0% 8.1%Thomas W. Pyle MS 1485 7.6% 3.2% 13.3% 10.0% 65.7% 1.5% 2.3% 5.0%Bannockburn ES 450 6.9% 4.0% 12.9% 8.7% 67.6% 2.2% 7.0% 10.6%Bradley Hills ES 632 10.8% 1.1% 14.9% 6.5% 66.8% 1.1% 5.2% 4.5%Burning Tree ES 463 7.1% 6.9% 18.1% 8.4% 59.2% 5.8% 9.6% 7.2%Carderock Springs ES 395 7.6% 3.3% 17.7% 9.9% 61.5% 0.0% 3.7% 5.6%Wood Acres ES 668 6.4% 3.4% 9.6% 12.9% 67.5% 3.2% 6.6% 7.4%Elementary Cluster Total 2608 7.9% 3.6% 14.2% 9.4% 65.0% 2.8% 6.6% 6.9%Elementary County Total 76590 5.3% 21.4% 14.0% 32.3% 26.6% 40.3% 23.2% 14.1%*Percent of students approved for Free and Reduced-priced Meals Program (FARMS) during the 2016–2017 school year.**Percent of English for Speakers of Other Languages (ESOL) during the 2016–2017 school year. High School students are served in regional ESOL centers.
***Mobility Rate is the number of entries plus withdrawals during the 2016–2017 school year compared to total enrollment.Notes: Native Hawaiian/Pacific Islander and American Indian/Alaskan Native categories total less than 1% and were therefore excluded from the table.
Due to federal and state guidelines, demographic characteristics of schools of less than or equal to 5 students per category are reported as 0%.
2017–2018 2016–2017
Schools Gra
des
Ser
ved
Cap
acit
y (H
S @
90%
MS@
85%
)
To
tal R
oo
ms
Sup
po
rt R
oo
ms
Reg
ular
Sec
on
dar
y @
25
Reg
ular
Ele
men
tary
@23
CSR
Gra
des
1–2
@18
Pre
–K @
20
Pre
–K @
40
HS
@20
CSR
KIN
D @
18
KIN
D @
22
ESO
L @
15
MET
S @
15
HSM
@13
ELE
M L
AD
@13
ELC
@10
LA
NG
@12
LFI
@10
SC
B @
6
AA
C@
7
AU
T @
6
BR
IDG
E @
10
DH
OH
@7
ED
@10
EX
TEN
SIO
NS
@6
GT/
LD @
13
PD
@7
PEP
@6
PEP
@12
PEP
@18
VIS
ION
(El
emen
tary
) @
7
OTH
ERWalt Whitman HS 9-12 1866 88 80 2 1 1 4
Thomas W. Pyle MS 6-8 1285 63 59 1 3
Bannockburn ES K-5 365 20 4 13 3
Bradley Hills ES K-5 663 33 4 25 4
Burning Tree ES K-5 379 24 4 11 3 6
Carderock Springs ES K-5 407 24 4 15 2 3
Wood Acres ES K-5 725 37 4 25 4 2 2
Program Capacity TableSpecial Education Services
Sch
oo
l Bas
ed
Clu
ster
Bas
ed
Quad Cluster Based County & Regional Based
(School Year 2017–2018)

4-110 • Recommended Actions and Planning Issues
WALT WHITMAN CLUSTER
Year Year Total Site Reloc- Home
Facility Reopened/ Square Size Adjacent atable County School
Schools Opened Revitalized Footage Acres Park Classrooms Programs Model
Walt Whitman HS 1962 1992 261,295 30.7 Yes 4Thomas W. Pyle MS 1962 1993 153,824 14.3Bannockburn ES 1957 1988 54,234 8.3 2Bradley Hills ES 1951 1984 76,745 6.7 YesBurning Tree ES 1958 1991 68,119 6.8 Yes 4Carderock Springs ES 1966 2010 75,351 9Wood Acres ES 1952 2002 96,358 4.78 Yes
Facility Characteristics of Schools 2017–2018
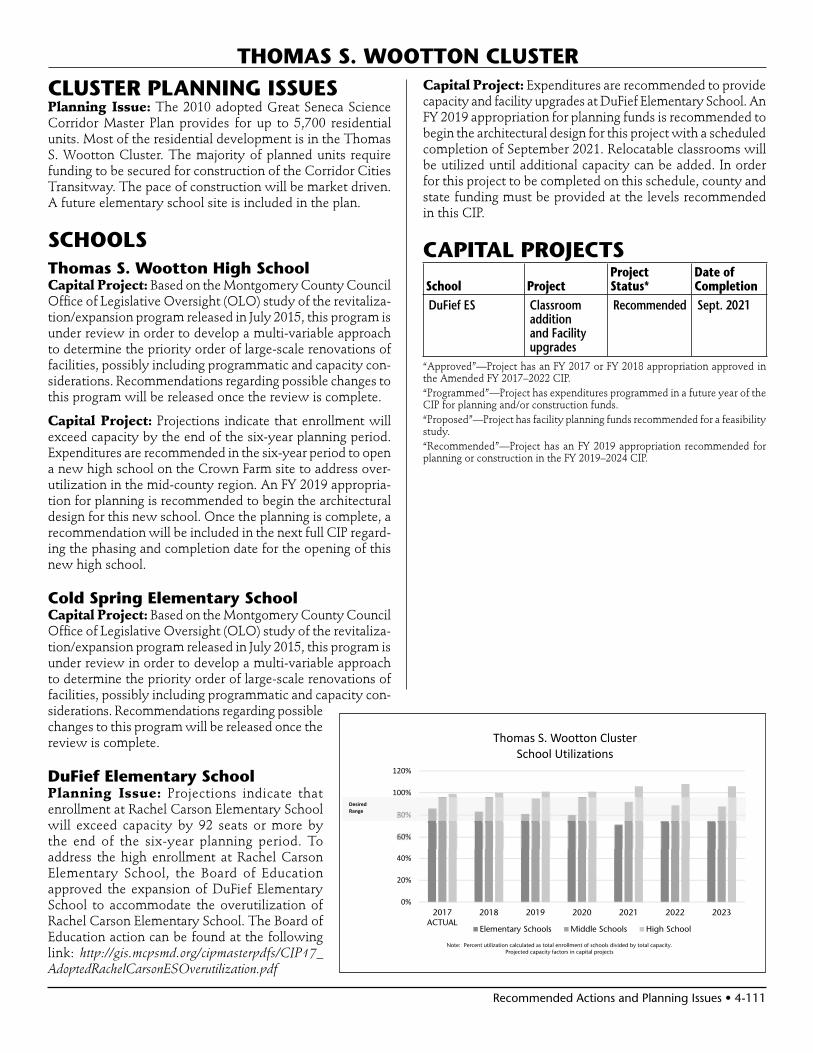
Recommended Actions and Planning Issues • 4-111
THOMAS S. WOOTTON CLUSTER
CLUSTER PLANNING ISSUESPlanning Issue: The 2010 adopted Great Seneca Science Corridor Master Plan provides for up to 5,700 residential units. Most of the residential development is in the Thomas S. Wootton Cluster. The majority of planned units require funding to be secured for construction of the Corridor Cities Transitway. The pace of construction will be market driven. A future elementary school site is included in the plan.
SCHOOLSThomas S. Wootton High SchoolCapital Project: Based on the Montgomery County Council Office of Legislative Oversight (OLO) study of the revitaliza-tion/expansion program released in July 2015, this program is under review in order to develop a multi-variable approach to determine the priority order of large-scale renovations of facilities, possibly including programmatic and capacity con-siderations. Recommendations regarding possible changes to this program will be released once the review is complete.
Capital Project: Projections indicate that enrollment will exceed capacity by the end of the six-year planning period. Expenditures are recommended in the six-year period to open a new high school on the Crown Farm site to address over-utilization in the mid-county region. An FY 2019 appropria-tion for planning is recommended to begin the architectural design for this new school. Once the planning is complete, a recommendation will be included in the next full CIP regard-ing the phasing and completion date for the opening of this new high school.
Cold Spring Elementary SchoolCapital Project: Based on the Montgomery County Council Office of Legislative Oversight (OLO) study of the revitaliza-tion/expansion program released in July 2015, this program is under review in order to develop a multi-variable approach to determine the priority order of large-scale renovations of facilities, possibly including programmatic and capacity con-siderations. Recommendations regarding possible changes to this program will be released once the review is complete.
DuFief Elementary SchoolPlanning Issue: Projections indicate that enrollment at Rachel Carson Elementary School will exceed capacity by 92 seats or more by the end of the six-year planning period. To address the high enrollment at Rachel Carson Elementary School, the Board of Education approved the expansion of DuFief Elementary School to accommodate the overutilization of Rachel Carson Elementary School. The Board of Education action can be found at the following link: http://gis.mcpsmd.org/cipmasterpdfs/CIP17_AdoptedRachelCarsonESOverutilization.pdf
Capital Project: Expenditures are recommended to provide capacity and facility upgrades at DuFief Elementary School. An FY 2019 appropriation for planning funds is recommended to begin the architectural design for this project with a scheduled completion of September 2021. Relocatable classrooms will be utilized until additional capacity can be added. In order for this project to be completed on this schedule, county and state funding must be provided at the levels recommended in this CIP.
CAPITAL PROJECTS
School ProjectProject Status*
Date of Completion
DuFief ES Classroom addition and Facility upgrades
Recommended Sept. 2021
“Approved”—Project has an FY 2017 or FY 2018 appropriation approved in the Amended FY 2017–2022 CIP.“Programmed”—Project has expenditures programmed in a future year of the CIP for planning and/or construction funds.“Proposed”—Project has facility planning funds recommended for a feasibility study.“Recommended”—Project has an FY 2019 appropriation recommended for planning or construction in the FY 2019–2024 CIP.
0%
20%
40%
60%
80%
100%
120%
2017ACTUAL
2018 2019 2020 2021 2022 2023
Thomas S. Wootton ClusterSchool Utilizations
Elementary Schools Middle Schools High School
DesiredRange
Note: Percent utilization calculated as total enrollment of schools divided by total capacity.Projected capacity factors in capital projects

4-112 • Recommended Actions and Planning Issues
Projected Enrollment and Space AvailabilityEffects of the Recommended FY 2019–2024 CIP and Non–CIP Actions on Space Available
ActualSchools 17–18 18–19 19–20 20–21 21–22 22–23 23–24 2027 2032Thomas S. Wootton HS Program Capacity 2159 2159 2159 2159 2159 2159 2159 2159 2159
Enrollment 2134 2169 2183 2187 2279 2339 2283 2450 2610Available Space 25 (10) (24) (28) (120) (180) (124) (291) (451)Comments See text
Cabin John MS Program Capacity 1092 1092 1092 1092 1092 1092 1092 1092 1092Enrollment 1005 1016 1029 1048 1031 1004 996 990 960Available Space 87 76 63 44 61 88 96 102 132Comments
Robert Frost MS Program Capacity 1084 1084 1084 1084 1084 1084 1084 1084 1084Enrollment 1083 1067 1040 1035 979 925 917 850 770Available Space 1 17 44 49 105 159 167 234 314Comments
Cold Spring ES Program Capacity 458 458 458 458 458 458 458Enrollment 327 346 330 336 328 324 305Available Space 131 112 128 122 130 134 153Comments
DuFief ES Program Capacity 414 414 414 414 740 740 740Enrollment 314 304 292 288 286 283 285Available Space 100 110 122 126 454 457 455Comments Planning Addition
for CompleteAddition
Fallsmead ES Program Capacity 551 551 551 551 551 551 551Enrollment 559 530 508 499 496 500 489Available Space (8) 21 43 52 55 51 62Comments
Lakewood ES Program Capacity 556 556 556 556 556 556 556Enrollment 519 503 498 499 496 496 507Available Space 37 53 58 57 60 60 49Comments
Stone Mill ES Program Capacity 677 677 677 677 677 677 677Enrollment 602 587 577 572 538 602 603Available Space 75 90 100 105 139 75 74Comments
Travilah ES Program Capacity 522 522 522 522 522 522 522Enrollment 398 361 359 338 349 387 394Available Space 124 161 163 184 173 135 128Comments
Cluster Information HS Utilization 99% 100% 101% 101% 106% 108% 106% 113% 121%HS Enrollment 2134 2169 2183 2187 2279 2339 2283 2450 2610MS Utilization 96% 96% 95% 96% 92% 89% 88% 85% 80%MS Enrollment 2088 2083 2069 2083 2010 1929 1913 1840 1730ES Utilization 86% 83% 81% 80% 71% 74% 74% 72% 71%ES Enrollment 2719 2631 2564 2532 2493 2592 2583 2530 2500
Projections
THOMAS S. WOOTTON CLUSTER

Recommended Actions and Planning Issues • 4-113
THOMAS S. WOOTTON CLUSTER
Demographic Characteristics of Schools
Total Two or more Black or Mobility Schools Enrollment races % Afr. Amer. % Asian% Hispanic % White % FARMS%* ESOL%** Rate%***Thomas S. Wootton HS 2134 4.5% 6.4% 37.1% 7.6% 44.3% 5.1% 1.9% 4.8%Cabin John MS 1005 6.1% 11.6% 31.6% 7.8% 42.8% 8.0% 3.1% 5.1%Robert Frost MS 1083 4.4% 8.1% 38.6% 7.8% 40.7% 6.1% 2.3% 5.7%Cold Spring ES 327 9.5% 3.4% 43.1% 7.0% 37.0% 0.0% 2.5% 2.5%DuFief ES 314 8.0% 9.9% 26.4% 14.0% 41.4% 12.8% 15.5% 13.1%Fallsmead ES 559 5.9% 9.1% 30.4% 8.6% 45.4% 10.4% 9.5% 11.9%Lakewood ES 519 5.8% 10.8% 44.5% 8.3% 29.9% 7.7% 11.4% 13.2%Stone Mill ES 602 6.0% 11.1% 50.8% 6.1% 25.9% 10.4% 13.0% 9.0%Travilah ES 398 2.8% 6.3% 45.7% 9.0% 35.9% 7.8% 10.4% 6.3%Elementary Cluster Total 2719 6.1% 8.9% 40.9% 8.5% 35.3% 8.6% 10.6% 9.7%Elementary County Total 76590 5.3% 21.4% 14.0% 32.3% 26.6% 40.3% 23.2% 14.1%*Percent of students approved for Free and Reduced-priced Meals Program (FARMS) during the 2016–2017 school year.**Percent of English for Speakers of Other Languages (ESOL) during the 2016–2017 school year. High School students are served in regional ESOL centers.
***Mobility Rate is the number of entries plus withdrawals during the 2016–2017 school year compared to total enrollment.Notes: Native Hawaiian/Pacific Islander and American Indian/Alaskan Native categories total less than 1% and were therefore excluded from the table.
Due to federal and state guidelines, demographic characteristics of schools of less than or equal to 5 students per category are reported as 0%.
2017–2018 2016–2017
Schools Gra
des
Ser
ved
Cap
acit
y (H
S @
90%
MS@
85%
)
To
tal R
oo
ms
Sup
po
rt R
oo
ms
Reg
ular
Sec
on
dar
y @
25
Reg
ular
Ele
men
tary
@23
CSR
Gra
des
1–2
@18
Pre
–K @
20
Pre
–K @
40
HS
@20
CSR
KIN
D @
18
KIN
D @
22
ESO
L @
15
MET
S @
15
HSM
@13
ELE
M L
AD
@13
ELC
@10
LA
NG
@12
LFI
@10
SC
B @
6
AA
C@
7
AU
T @
6
BR
IDG
E @
10
DH
OH
@7
ED
@10
EX
TEN
SIO
NS
@6
GT/
LD @
13
PD
@7
PEP
@6
PEP
@12
PEP
@18
VIS
ION
(El
emen
tary
) @
7
OTH
ERThomas S. Wootton HS 9-12 2159 99 95 2 2
Cabin John MS 6-8 1092 57 49 3 1 4
Robert Frost MS 6-8 1084 51 51
Cold Spring ES K-5 458 24 4 18 2
DuFief ES K-5 414 26 4 12 3 6 1
Fallsmead ES K-5 551 30 3 19 4 2 2
Lakewood ES K-5 556 30 4 20 3 3
Stone Mill ES K-5 677 36 4 23 4 2 1 2
Travilah ES K-5 522 26 3 20 2 1
Program Capacity TableSpecial Education Services
Sch
oo
l Bas
ed
Clu
ster
Bas
ed
Quad Cluster Based County & Regional Based
(School Year 2017–2018)
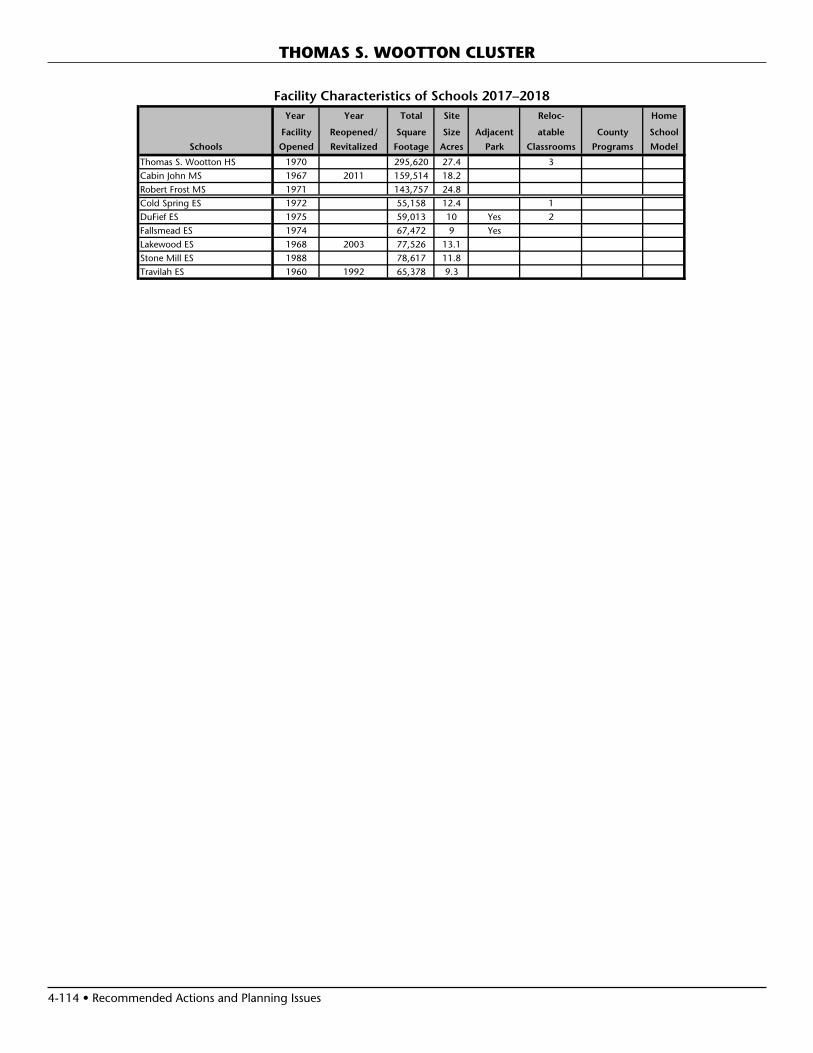
4-114 • Recommended Actions and Planning Issues
THOMAS S. WOOTTON CLUSTER
Year Year Total Site Reloc- Home
Facility Reopened/ Square Size Adjacent atable County School
Schools Opened Revitalized Footage Acres Park Classrooms Programs Model
Thomas S. Wootton HS 1970 295,620 27.4 3Cabin John MS 1967 2011 159,514 18.2Robert Frost MS 1971 143,757 24.8Cold Spring ES 1972 55,158 12.4 1DuFief ES 1975 59,013 10 Yes 2Fallsmead ES 1974 67,472 9 YesLakewood ES 1968 2003 77,526 13.1Stone Mill ES 1988 78,617 11.8Travilah ES 1960 1992 65,378 9.3
Facility Characteristics of Schools 2017–2018
Recommended Actions and Planning Issues • 4-115
SPECIAL EDUCATION CENTERSLongview SchoolLongview School provides services to students aged 5–21 with severe to profound intellectual disabilities and multiple disabilities. Alternate Academic Learning Outcomes aligned with Curriculum 2.0 are utilized to provide students with skills in the areas of communication, mobility, self-help, func-tional academics, and transition services. Longview School is collocated with Spark Matsunaga Elementary School in the Northwest Cluster.
John L. Gildner Regional institute for Children and Adolescents (RICA)The John L. Gildner Regional Institute for Children and Adolescents (RICA), in collaboration with the Maryland State Department of Health and Mental Hygiene, provides appropriate educational and treatment services to students and their families through highly-structured intensive spe-cial education services with therapy integrated in a day and residential treatment facility. An interdisciplinary treatment team, comprised of school, clinical, residential, and related service providers, develops the student’s total educational plan and monitors progress. Consulting psychiatrists, a full time pediatrician, and a school community health nurse also are on staff.
RICA offers fully accredited special education services that emphasize rigorous academic and vocational/occupational opportunities; day and residential treatment; and individual, group, and family therapy. The RICA program promotes ac-quisition of grade and age appropriate social and emotional skills and allows students to access the general education curriculum.
Rock Terrace SchoolPlanning Study: On November 17, 2014, the Board of Edu-cation approved a Roundtable Discussion Group to explore the possible collocation of Rock Terrace School with Tilden Middle School on the Tilden Lane site. With an upcoming revitalization/expansion project, Tilden Middle School was identified because of its central location in the Walter Johnson Cluster, its large site size and accessibility to accommodate the two schools, and the long history of the Walter Johnson cluster serving special education students.
Board of Education Policy IOB, Education of Students with Dis-abilities, states that MCPS is committed to providing students with disabilities the opportunity to interact with non-disabled peers to the maximum extent possible. The Maryland State Department of Education (MSDE) has stated that state fund-ing would be very difficult to acquire for stand-alone special education centers because students in these centers are not provided opportunities to receive instruction in the general education setting to the maximum extent appropriate. The collocation of special education centers with general education
schools, such as the Longview School at Matsunaga Elementary School, allows the school system to address the facility needs of the stand-alone special education centers while meeting the goal to provide special education students with opportunities to receive instruction in the general education environment to the maximum extent appropriate.
The Roundtable Discussion Group included parents and staff from Rock Terrace School and Tilden Middle School as well as a representative from the MCCPTA Special Education Committee and the Walter Johnson Cluster. Staff from the Department of Special Education Services, the Division of Long-range Planning, and Division of Construction also par-ticipated in the process. To support the activities, an architect was hired to develop concept plans for the possible collocation of the two schools. The activities of the Roundtable included the following:
• Identify opportunities for special education students to receive instruction in the general education environment to the maximum extent appropriate
• Discuss the facility and site implications• Conduct site visits and engage in discussions with parents
and staff at other collocated or soon to be collocated schools in the county and state.
The Roundtable Discussion Group met from December 2014 through February 2015 and submitted a report to the interim superintendent of schools in March 2015. Following input from the Roundtable Discussion Group and the community at large, the interim superintendent of schools recommended and the Board of Education approved the collocation of Rock Terrace School and Tilden Middle School on May 12, 2015.
Capital Project: A revitalization/expansion project is sched-uled for this school with a completion date of September 2020. An FY 2018 appropriation was approved to begin the site work for this project. In order for this project to be completed on this schedule, county and state funding must be provided at the levels recommended in this CIP.
Tilden Middle School is currently located in the Woodward facility on Old Georgetown Road. Rather than revitalize/expand the Woodward facility for Rock Terrace School and Tilden Middle School, the current Tilden Holding Facility, located on Tilden Lane, will be revitalized/expanded to house both Rock Terrace School and Tilden Middle School.
Carl Sandburg Learning CenterCarl Sandburg Learning Center is a special education school that serves students with multiple disabilities in kindergarten through Grade 5, including intellectual disabilities, autism spectrum disorders, language disabilities, and emotional or other learning disabilities. Services are designed for elemen-tary students who need a highly structured setting, small student-to-teacher ratio, and access to the MCPS Curriculum 2.0 or Alternate Learning Outcomes aligned with Curriculum 2.0. Modification of curriculum materials and instructional
SPECIAL EDUCATION CENTERS

4-116 • Recommended Actions and Planning Issues
SPECIAL EDUCATION CENTERS
strategies based on students’ needs is the basis of all instruc-tion. Emphasis is placed on the development of language and academic and social skills provided through an in-class transdisciplinary model of service delivery in which all staff members implement the recommendations of related service providers. Special emphasis is placed on meeting the sensory and motor needs of students in their classroom setting. To address behavioral goals, services may include a behavior management system, psychological consultation, and crisis intervention.
Capital Project: On November 17, 2011, the Board of Edu-cation approved the collocation of Carl Sandburg Learning Center on the Maryvale Elementary School campus when the revitalization/expansion project is complete. A revitalization/expansion project is scheduled for this school with a comple-tion date of September 2020. An FY 2018 appropriation was approved to be begin construction for this project. In order for this project to be completed on this schedule, county and state funding must be provided at the levels recommended in this CIP.
Stephen Knolls SchoolThe Stephen Knolls School services students aged 5–21 with severe to profound intellectual disabilities and multiple dis-abilities. Alternate Learning Outcomes aligned with Curriculum 2.0 are utilized to provide students with skills in the areas of communication, mobility, self-help, functional academics, and transition.
CAPITAL PROJECTS
School ProjectProject Status*
Date of Completion
Rock Terrace School
Revitalization/ expansion with collocation at Tilden MS
Approved Sept. 2020
Carl Sandberg Learning Center
Revitalization/ expansion with collocation at Maryvale ES
Approved Sept. 2020
“Approved”—Project has an FY 2017 or FY 2018 appropriation approved in the Amended FY 2017–2022 CIP.“Programmed”—Project has expenditures programmed in a future year of the CIP for planning and/or construction funds.“Proposed”—Project has facility planning funds recommended for a feasibility study.“Recommended”—Project has an FY 2019 appropriation recommended for planning or construction in the FY 2019–2024 CIP.
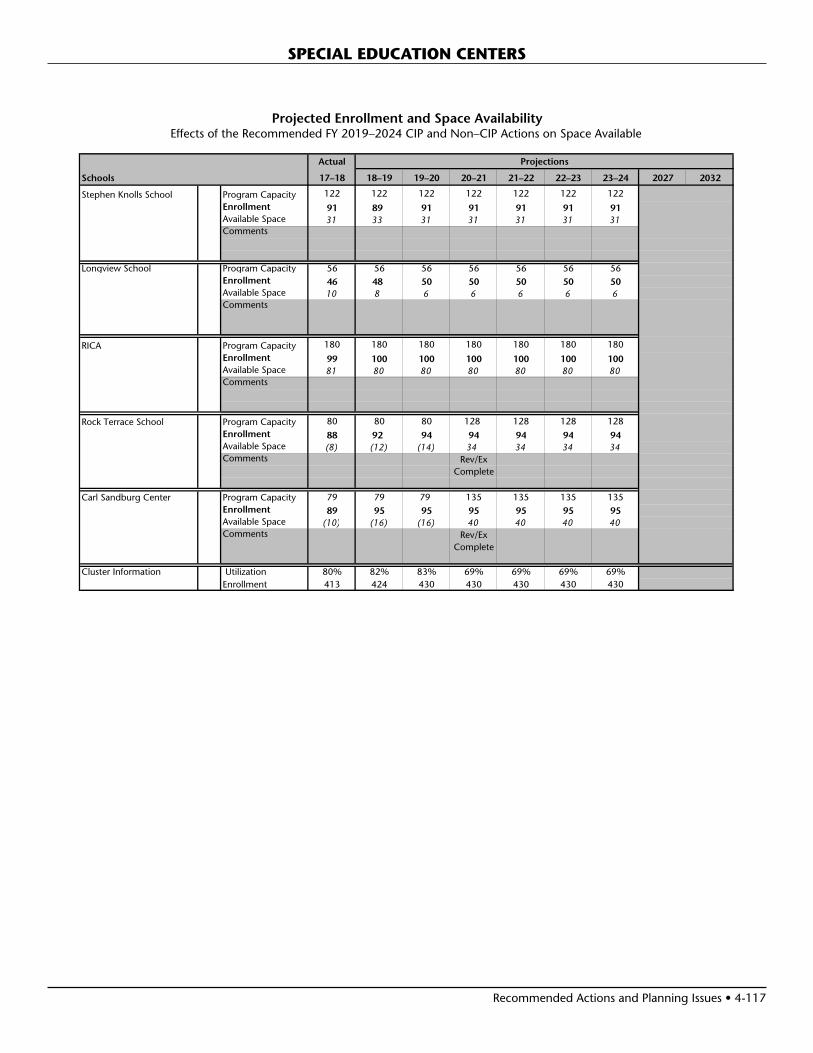
Recommended Actions and Planning Issues • 4-117
SPECIAL EDUCATION CENTERS
Projected Enrollment and Space AvailabilityEffects of the Recommended FY 2019–2024 CIP and Non–CIP Actions on Space Available
Actual
Schools 17–18 18–19 19–20 20–21 21–22 22–23 23–24 2027 2032
Stephen Knolls School Program Capacity 122 122 122 122 122 122 122 Enrollment 91 89 91 91 91 91 91Available Space 31 33 31 31 31 31 31Comments
Longview School Program Capacity 56 56 56 56 56 56 56Enrollment 46 48 50 50 50 50 50Available Space 10 8 6 6 6 6 6Comments
RICA Program Capacity 180 180 180 180 180 180 180 Enrollment 99 100 100 100 100 100 100Available Space 81 80 80 80 80 80 80Comments
Rock Terrace School Program Capacity 80 80 80 128 128 128 128 Enrollment 88 92 94 94 94 94 94Available Space (8) (12) (14) 34 34 34 34Comments Rev/Ex
Complete
Carl Sandburg Center Program Capacity 79 79 79 135 135 135 135 Enrollment 89 95 95 95 95 95 95Available Space (10) (16) (16) 40 40 40 40Comments Rev/Ex
Complete
Cluster Information Utilization 80% 82% 83% 69% 69% 69% 69%Enrollment 413 424 430 430 430 430 430
Projections

4-118 • Recommended Actions and Planning Issues
SPECIAL EDUCATION CENTERS
Demographic Characteristics of Schools
Total Two or more Black or Mobility Schools Enrollment races % Afr. Amer. % Asian% Hispanic % White % FARMS%* ESOL%** Rate%***Stephen Knolls School SP 97 0.0% 32.0% 0.0% 41.2% 19.6% 37.4% 0.0% 0.0%Longview School SP 53 0.0% 24.5% 11.3% 32.1% 30.2% 30.8% 0.0% 0.0%RICA SP 99 6.1% 27.3% 7.1% 24.2% 35.4% 35.6% 0.0% 80.8%Rock Terrace School SP 88 0.0% 25.0% 17.0% 19.3% 33.0% 35.5% 6.5% 14.0%Carl Sandburg Learning Center SP 89 0.0% 31.5% 7.9% 37.1% 19.1% 43.0% 41.9% 22.6%Elementary County Total 76590 5.3% 21.4% 14.0% 32.3% 26.6% 40.3% 23.2% 14.1%*Percent of students approved for Free and Reduced-priced Meals Program (FARMS) during the 2016–2017 school year.**Percent of English for Speakers of Other Languages (ESOL) during the 2016–2017 school year. High School students are served in regional ESOL centers.
***Mobility Rate is the number of entries plus withdrawals during the 2016–2017 school year compared to total enrollment.Notes: Native Hawaiian/Pacific Islander and American Indian/Alaskan Native categories total less than 1% and were therefore excluded from the table.
Due to federal and state guidelines, demographic characteristics of schools of less than or equal to 5 students per category are reported as 0%.
2017–2018 2016–2017
Schools Cap
acit
y (H
S @
90%
MS@
85%
)
To
tal R
oo
ms
Sup
po
rt R
oo
ms
Reg
ular
Sec
on
dar
y @
25
Reg
ular
Ele
men
tary
@23
CSR
Gra
des
1–2
@18
Pre
–K @
20
Pre
–K @
40
HS
@20
CSR
KIN
D @
18
KIN
D @
22
ESO
L @
15
MET
S @
15
HSM
@13
ELE
M L
AD
@13
ELC
@10
LA
NG
@12
LFI
@10
SC
B @
6
AA
C@
7
AU
T @
6
SPE
CIA
L SC
HO
OLS
@ 6
DH
OH
@7
ED
@10
EX
TEN
SIO
NS
@6
GT/
LD @
13
PD
@7
PEP
@6
PEP
@12
PEP
@18
VIS
ION
(El
emen
tary
) @
7
OTH
ER
Stephen Knolls School SP 122 19 4 7 5 1 1
Longview School SP 56 10 2 8
RICA SP 180 18 18
Rock Terrace School SP 80 16 2 5 5 4
Carl Sandburg Learning Center SP 79 16 3 1 12
Clu
ster
Bas
ed
Quad Cluster Based County & Regional Based
(School Year 2017–2018)
Program Capacity TableSpecial Education Services
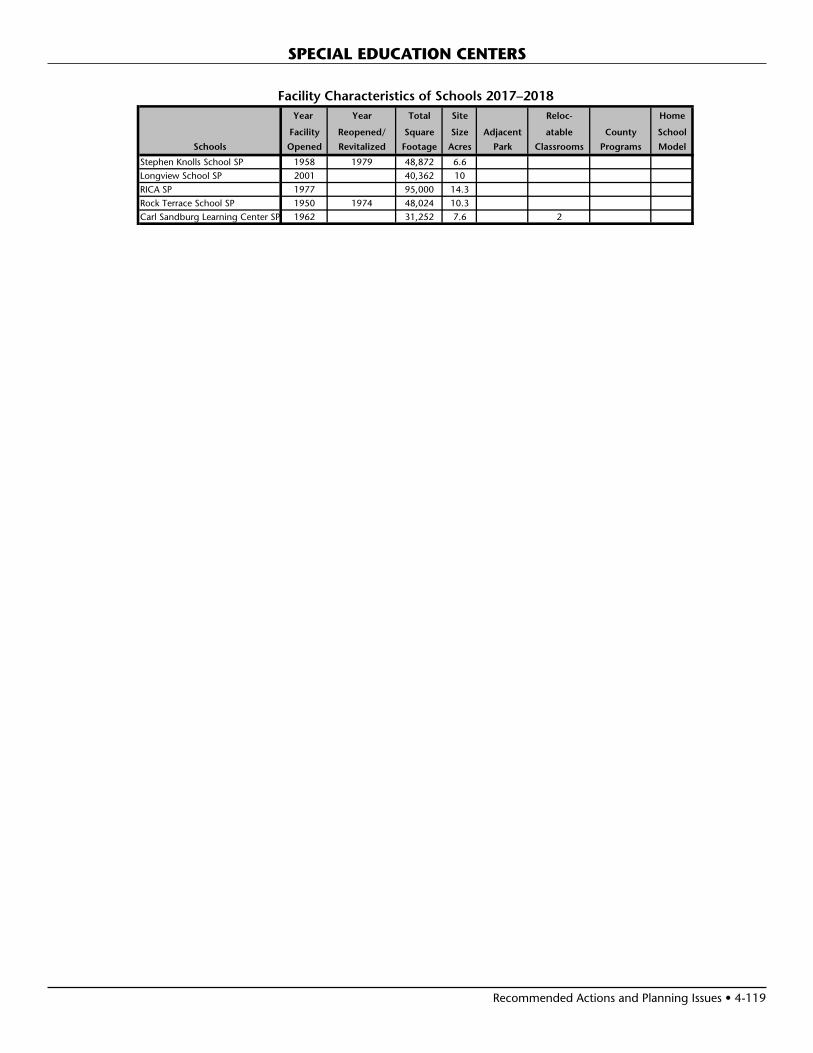
Recommended Actions and Planning Issues • 4-119
SPECIAL EDUCATION CENTERS
Year Year Total Site Reloc- Home
Facility Reopened/ Square Size Adjacent atable County School
Schools Opened Revitalized Footage Acres Park Classrooms Programs Model
Stephen Knolls School SP 1958 1979 48,872 6.6Longview School SP 2001 40,362 10RICA SP 1977 95,000 14.3Rock Terrace School SP 1950 1974 48,024 10.3Carl Sandburg Learning Center SP 1962 31,252 7.6 2
Facility Characteristics of Schools 2017–2018
Recommended Actions and Planning Issues • 4-121
OTHER EDUCATIONAL FACILITIES
ALTERNATIVE EDUCATION PROGRAMSMontgomery County Public Schools operates a program that supports students in Grades 6–12. The program is intended to support students who have been unsuccessful in their home schools for a variety of reasons. These reasons include behavior and/or attendance problems, as well as involvement in a serious disciplinary action that warrants a recommenda-tion for expulsion and placement by the Office of the Chief Operating Officer in lieu of expulsion. AEP strives to provide positive and effective educational supports and services that address the academic, social, emotional, and physical health of adolescents.
In addition, the AEP provides a 45-day Interim Placement Program that serves students in Grades 6–12 receiving special education services. Students are placed in the program after a central office review and as a result of their involvement with controlled substances, serious bodily injury, and/or weapons. Students remain enrolled in their home school and the home school provides daily assignments and assessments.
In 2013, the superintendent of schools initiated a district-wide redesign of the Alternative Education Program (AEP). The focus of the redesign has been to provide academic, social emotional supports, and interventions to meet the individual needs of students. The redesign is intended to ensure that academic performance is not predicted by race, ethnicity, or socioeco-nomic status. An AEP redesign committee comprised of central services and alternative education staff worked collaboratively to implement a three-year phase plan. In February 2014, the Board of Education approved the redesign plan for the AEP.
The three major components of the redesign plan focus on:
• Pathways for Learning with a focus on Universal Design for Learning (UDL)
• Personalized Learning Plans• Social Emotional Learning
As the redesign enters the fourth year, MCPS continues to expand upon the three major components of the redesign. Personalized learning plans will be used to help teachers in-dividualize the learning for students. In addition, the program entered into an agreement with APEX Learning to expand online opportunities for credit recovery and blended learning. In order to support students and their families, the program has increased the partnerships within the community and created a parent engagement laboratory at the Blair G. Ewing Center. The 2016–2017 school year will focused on rolling out a comprehensive behavioral management plan to better individualize the needs of our students.
Blair G. Ewing CenterCapital Project: To support the redesigned program, the Board of Education directed staff to explore several studies for Alternative Education Programs at the Blair G. Ewing Center. These studies included:
• A feasibility study for the redesigned Alternative Educa-tion Programs at the Blair G. Ewing Center;
• A conceptual review of several other possible locations for the Alternative Education Programs including the English Manor Elementary School site, other closed schools and Board of Education property, and the current site of Rock Terrace School; and Commercial locations.
Based on the review of these studies, the Board of Education approved that Alternative Education Programs at the Blair G. Ewing Center be relocated to the Rock Terrace School site beginning in January 2022. In order for this project to be completed on schedule, an FY 2018 appropriation for facility planning is approved for a feasibility study to determine the scope and cost to relocate the project to the Rock Terrace School site. An FY 2019 appropriation is recommended to begin the architectural planning and design for this project.
CAPITAL PROJECTS
School ProjectProject Status*
Date of Completion
Blair G. Ewing Center
Relocate to Rock Terrace School site
Recommended Jan. 2022
“Approved”—Project has an FY 2017 or FY 2018 appropriation approved in the Amended FY 2017–2022 CIP.“Programmed”—Project has expenditures programmed in a future year of the CIP for planning and/or construction funds.“Proposed”—Project has facility planning funds recommended for a feasibility study.“Recommended”—Project has an FY 2019 appropriation recommended for planning or construction in the FY 2019–2024 CIP.
ENVIRONMENTAL EDUCATION CENTERLathrop E. Smith CenterThe Lathrop E. Smith Center is owned and operated by Montgomery County Public Schools and hosts the Outdoor Environmental Education Programs (OEEP) that includes the Grade 6 residential program and Grades K–5 day program. OEEP provides outdoor learning experiences through the MCPS curriculum that increase students’ environmental content and science process knowledge; nurture awareness, appreciation, and stewardship for the natural environment; and build the capacity of Grades K–12 MCPS educators to teach environmental education, while encouraging the use of the outdoors as a science classroom.
All Grade 6 students in MCPS participate in a three-day, two-night residential outdoor environmental education program

4-122 • Recommended Actions and Planning Issues
OTHER EDUCATIONAL FACILITIES
that is part of the curriculum. While in residence, students study various aspects of the local watershed through par-ticipation in outdoor field investigations that teach MCPS curriculum and address the MSDE environmental education standards. The teaching and learning that occurs at school and during the residential program create a meaningful wa-tershed environmental experience for each Grade 6 student, and culminates in an environmental student service learning project. Students are accompanied by their teachers, who, in collaboration with an OEEP staff member, provide instruction and supervision during their stay.
The day program primarily serves students in Grades K–5. Each field investigation is directly linked to the school curriculum at each grade level with a focus on science and the environ-ment. Schools also may request an in-school visit from an environmental educator to provide assistance and guidance in the integration of environmental education at the local school site. The center also provides professional development after school and in the summer to more than 300 teachers in the content and pedagogy of environmental education.
Year Year Total Site Reloc- Home
Facility Reopened/ Square Size Adjacent atable County School
Schools Opened Revitalized Footage Acres Park Classrooms Programs Model
Thomas Edison HS of Tech. 1982 114,310 28.2 YesBlair G. Ewing Center 1970 85,400 22.5Lathrop E. Smith Center 20,345 9.78 Yes
Facility Characteristics of Schools 2017–2018
Recommended Actions and Planning Issues • 4-123
OTHER EDUCATIONAL FACILITIES
Career Technology Education ProgramsCareer and Technology Education (CTE) Programs of Study (POS) prepare students for college, careers, and lifelong learning. Montgomery County Public Schools currently offers College/Career Research Development in addition to over 34 POS organized within the following 11 career clusters:
• Arts, Humanities, Media, and Communications; • Biosciences, Health Science, and Medicine;• Business Management and Finance;• Construction and Development;• Education, Training, and Child Studies;• Engineering, Scientific Research, and Manufacturing
Technologies;• Environmental, Agricultural, and Natural Resources;• Human and Consumer Services, Hospitality, and
Tourism;• Information Technology; • Law, Government, Public Safety, and Administration; and• Transportation, Distribution, and Logistics.
Plans are in place to increase the number of POS offered by MCPS to include programs such as Homeland Security, Cyber Security, and Teacher Academy of Maryland. Over 13,000 MCPS students are enrolled in at least one CTE POS pathway course at comprehensive high schools throughout the county or at Thomas Edison High School of Technology (TEHST). CTE POS focus on challenging and engaging instruction that provide academic and technical knowledge and skills and prepare students for college and careers. Most POS provide opportunities for students to earn college credit through college courses or articulation agreements with select postsecondary institutions. These agreements allow students to earn college credit for identified high school courses that are successfully completed with a grade of ‘B’ or better. Internship experi-ences connect students with the world of work, enhancing the rigor and relevance of the POS. Students take and pass industry credentialing examinations in areas such as business, information technology, hospitality, and cosmetology.
There are regional hubs, like the TEHST location, that give students from all high schools equitable access to select POS. Students report to the identified location for half a day and spend the other half of the school day at their home high school. To ensure relevance to college and industry, CTE staff members have established a Program Advisory Committee (PAC) for each career cluster. The PAC includes representatives from the business community and secondary and postsecond-ary institutions. PACs strive to provide seamless experiences for students as they move from middle school to high school and postsecondary experiences.
Foundations Office Programs The Montgomery County Student Trades Foundations Of-fice is composed of the following three separate non-profit
educational foundations: Automotive Trades Foundation (ATF), Construction Trades Foundation (CTF), and Informa-tion Technology Foundation (ITF). The Foundations Office is a liaison between the business/professional community in these three industry areas and MCPS. This relationship promotes the advancement of college and career education and prepares students for a full range of careers within each industry. In MCPS, there are currently 16 POS supervised by staff in the Foundations Office. Articulation agreements are in place for all Foundation programs with select postsecondary institutions; however, students may also earn college credit by enrolling in and successfully completing pre-approved college courses that align with their respective POS.
The ATF operates as a licensed used-car dealership. ATF programs are located at Damascus, Gaithersburg, and Seneca Valley high schools in addition to TEHST. The programs are nationally certified by the National Automotive Technicians Education Foundation (NATEF), an affiliation of Automotive Service of Excellence (ASE). The programs also are affiliated with Automotive Youth Education System (AYES), which is the highest level of achievement for automotive technology programs. Automotive instructors maintain industry standard certifications in ASE areas relevant to their programs.
The CTF program operates as a licensed Residential Home Builder and supports a variety of construction industry trades that include the following: Carpentry, Electricity, Masonry, Plumbing, HVAC, Principles of Architecture and CAD Technology, and Foundations of Building and Construction Technology. The CTF programs are located at TEHST. The Foundation also has established a partnership with Associated Builders and Contractors, Metro Washington Chapter (ABC Metro). ABC Metro has certified the instructors, accredited the facility, and formalized articulation agreements. This program provides a nationally recognized certifications from the National Center for Construction Education and Research (NCCER). The CTF also has aligned with the construction programs at Montgomery College, allowing students further opportunities for professional development and advancement in the construction industry.
The ITF provides a POS in Network Operations at Clarks-burg High School and TEHST, both of which are Computing Technology Industry Association (CompTIA) Academy and Microsoft DreamSpark member programs. The ITF’s unique public/private partnership promotes computer education and provides entrepreneurial experiences to high school students throughout Montgomery County, preparing students for seamless transitions into the computer technology industry and college or other postsecondary education.
Additional POS pathways in information technology and/or computer science are provided at twenty four out of twenty five high schools and six middle schools. Programs offered include computer science, programming, networking and web development. Each program is aligned with national partners and/or national academies. These include the National

4-124 • Recommended Actions and Planning Issues
themselves in a reality-based, decision-making process that addresses aspects of individual and family budgeting—hous-ing, transportation, food, utilities, health care, investments, philanthropy, and banking. The on-site activities are designed to allow students the opportunity to “put into action” what they learned in the classroom and to understand the basic steps of maintaining a realistic personal budget. Two weeks of classroom follow-up activities will allow students to use their new financial knowledge to explore career options and to set future goals.
Junior Achievement of Greater Washington has agreed to contribute up to $2,500,000 for the construction of the Junior Achievement Finance Park. An FY 2015 supplemental appro-priation was approved for the amount of $2,500,000 to be expended over a period of three fiscal years. The scheduled completion date for the Junior Achievement Finance Park will coincide with the completion of Thomas Edison High School of Technology, on January 2018.
CAPITAL PROJECTS
School ProjectProject Status*
Date of Completion
Thomas Edison HS of Technology
Revitalization/expansion and Junior Achievement Finance Park
Approved Sept. 2018, Building Sept. 2019, Site
“Approved”—Project has an FY 2017 or FY 2018 appropriation approved in the Amended FY 2017–2022 CIP.“Programmed”—Project has expenditures programmed in a future year of the CIP for planning and/or construction funds.“Proposed”—Project has facility planning funds recommended for a feasibility study.“Recommended”—Project has an FY 2019 appropriation recommended for planning or construction in the FY 2019–2024 CIP.
Holding FacilitiesHolding facilities are utilized for capital projects, such as revitalization/expansion projects and large-scale addition projects, to house students and staff during construction. By relocating students and staff to a holding facility, MCPS is able to reduce the length of time required for construction and provide a safe and secure environment for the students and staff. Currently, MCPS utilizes the following facilities as holding schools for revitalization/expansion projects and large-scale addition projects.
Elementary School Holding FacilitiesThe elementary school holding facilities were assessed as part of the Facilities Assessment with Criteria and Testing (FACT) process during the 2010–2011 school year. To address needs at these facilities, an FY 2013 appropriation for facility plan-ning was approved in the Modifications to Holding, Special Education, and Alternative Centers Project for feasibility studies to identify improvements for these buildings. Due to fiscal constraints in the county, a recommendation for facility
Academy Foundations’ Academy of Information Technology, Cisco Networking Academy, and a partnership program with Code.org.
Seneca Valley High School has a revitalization/expansion project scheduled that includes the Automotive Technology Dealership/Training POS, Cisco Academy, and the Academy of Information Technology pathways in Programming, Net-working and Information Resource Design.
Thomas Edison High School of TechnologyPlanning Study: Wheaton High School and Thomas Edison High School of Technology (TEHST) were located on the same site and shared one facility. These schools are in the process of undergoing a revitalization/expansion projects.
Prior to the start of construction on Wheaton High School, two major planning studies were conducted to prepare for the revitalization/expansion projects of these schools. During fall and winter 2010–2011, a Roundtable Discussion Group, with broad stakeholder involvement, met to explore vari-ous approaches for the future relationship between the two schools. Following the Roundtable Discussion Group review, the Board of Education took action on March 28, 2011. The decision was to maintain the two schools as two separate entities. Staff conducted a feasibility study and reviewed two options—a one-building option and a two-building option. At the conclusion of the feasibility study, on September 13, 2011, the Board of Education adopted a two-building option for the revitalization/expansion projects of Wheaton High School and Thomas Edison High School of Technology.
Capital Project: The Wheaton High School facility project was completed in January 2016. The Thomas Edison High School of Technology facility will be complete in September 2018 and the entire site will be restored by September 2019.
Capital Project: On September 22, 2014, the Board of Edu-cation approved a plan to offer a financial literacy program at Thomas Edison High School of Technology to all Grade 7 students in Montgomery County Public Schools (MCPS). An agreement between MCPS and Junior Achievement of Greater Washington was reached to proceed with the construction of a Junior Achievement Finance Park at Thomas Edison High School of Technology. A fourth floor will be added to Thomas Edison High School of Technology to accommodate the Junior Achievement Finance Park. Grade 7 students not only will benefit from the lifelong knowledge and skills gained at Junior Achievement Finance Park, they also will have the opportunity to learn about the exciting programs available at Thomas Edison High School of Technology.
The Junior Achievement Finance Park experience begins in the classroom with four weeks of classroom curriculum and culminates with a day at the Junior Achievement Finance Park. At Junior Achievement Finance Park, students immerse
OTHER EDUCATIONAL FACILITIES

Recommended Actions and Planning Issues • 4-125
OTHER EDUCATIONAL FACILITIES
improvements will be made in a future CIP. The following facilities are utilized for elementary school projects:
• Emory Grove• Fairland • Grosvenor• North Lake • Radnor • Secondary School Holding Facilities• Broome Holding Facility
Capital Project: The Broome facility is currently owned by Montgomery County. Although FY 2015 expenditures for planning funds were programmed to reopen the facility for use as a middle school holding facility, due to fiscal constraints in the county, these funds have been deferred until a recom-mendation can be made in a future CIP.
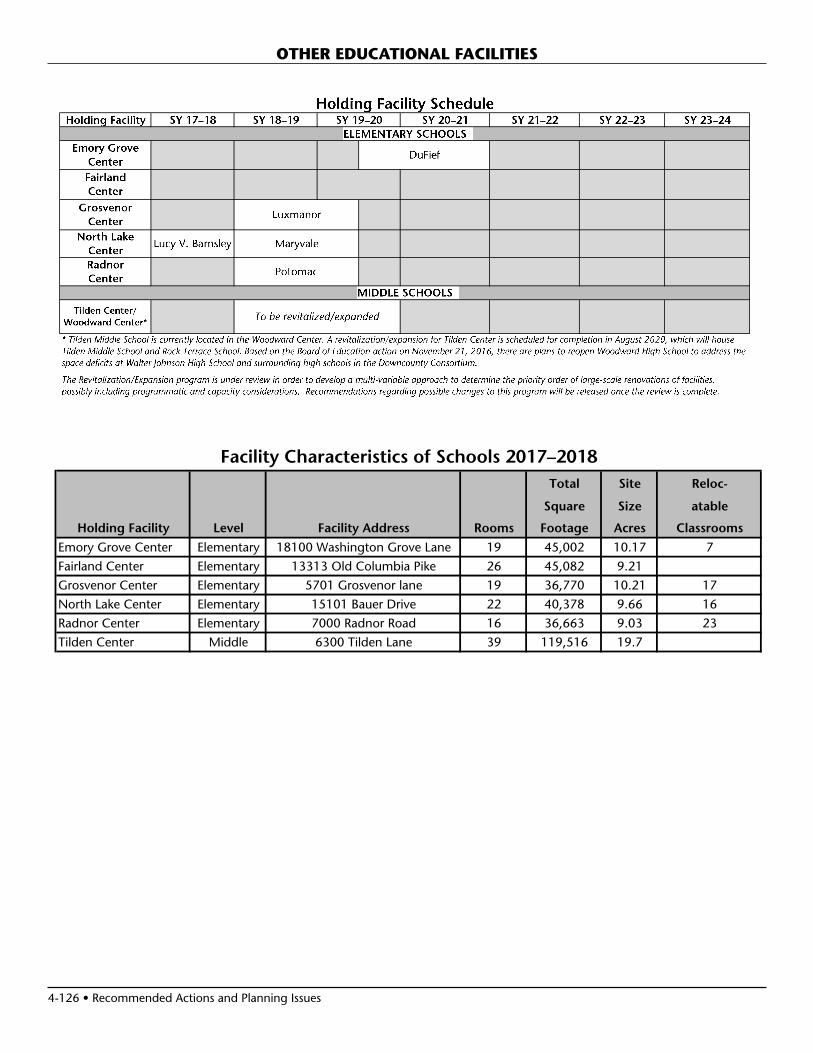
4-126 • Recommended Actions and Planning Issues
OTHER EDUCATIONAL FACILITIES
Total Site Reloc-
Square Size atable
Holding Facility Level Facility Address Rooms Footage Acres Classrooms
Emory Grove Center Elementary 18100 Washington Grove Lane 19 45,002 10.17 7
Fairland Center Elementary 13313 Old Columbia Pike 26 45,082 9.21
Grosvenor Center Elementary 5701 Grosvenor lane 19 36,770 10.21 17
North Lake Center Elementary 15101 Bauer Drive 22 40,378 9.66 16
Radnor Center Elementary 7000 Radnor Road 16 36,663 9.03 23
Tilden Center Middle 6300 Tilden Lane 39 119,516 19.7
Facility Characteristics of Schools 2017–2018