approved actions and planning issues
TRANSCRIPT

Approved Actions and Planning Issues • 4-1
AAC—Augmentative and Alternative Communication
Add.—Addition
AUT—Autism Spectrum Disorders
BRIDGE—Bridge services
Cap.—Capacity
Comp.—Complete
CSR—Class size reduction
DCC—Downcounty Consortium
DHOH—Deaf and Hard of Hearing
ED—Emotional Disability Program
ELC—Elementary Learning Center
ESOL—English for Speakers of Other Languages
Fac.—Facility
FDK—Full-day Kindergarten program
HS—Head Start
Improve.—Improvements
LAD—Learning and Academic Disabilities
LANG—Speech/Language Disabilities
LD/GT—Learning Disabled/Gifted and Talented
LFI—Learning for Independence
LTL—Linkages to Learning
METS—Multidisciplinary Educational Training and Support class (for non-English-speaking students with limited educational experience)
Mod.—Modernization
MSMC—Middle School Magnet Consortium
NEC—Northeast Consortium
PD—Physical Disabilities class
PEP—Preschool Education Program
Plng.—Planning
Pre-K—# of sessions of prekindergarten
Pre-K Lang—Preschool speech/lan-guage disabilities class
Reg. Sec.—Regular secondary classroom
Reg. Elem.—Regular elementary classroom
Replace.—Replacement
Rm CSR—# of classrooms for class-size reduction initiative
SBHC—School-based Health Center
SCB—School/Community-Based Pro-grams for Students with Intellectual Disabilities
SLC—Secondary Learning Center
Sup. Rms.—Support rooms, such as art, music, and computer labs
TBD—To be determined
VIS—Preschool or secondary Vision Impairment
Chapter 4
Approved Actions and Planning Issues
Chapter 4 is organized alphabetically by high school cluster and consortia. Each section includes a map of the cluster service areas and tables containing enrollment, demographic, room use, and facilities information for individual schools. Capital projects approved for the FY 2014 Capital Budget and Amendments to the FY 2013–2018 Capital Improvements Pro-gram (CIP) are included. It is important to note that although cluster/consortia organization is used for the presentation of information, planning actions often cross cluster/consortia boundaries in order to meet program and facility needs for all students.
All schools are evaluated based on existing and planned pro-gram capacity. School system enrollment continues to grow. Over the next six years, enrollment is projected to increase by about 10,000 students. Although temporary overutilization of facilities can be accommodated with relocatable classrooms, long-term overutilization will require additional capacity to both elementary and secondary schools through classroom additions, modernizations, and new or reopened facilities. This year, MCPS houses about 8,800 students in 395 relocat-able classrooms.
For each cluster and the Downcounty and Northeast consor-tia, information is presented within a common framework. Planning issues of a clusterwide nature are followed by a dis-cussion of individual secondary and elementary schools with approved capital projects or non-capital actions. All clusters
may not have clusterwide planning issues, and only schools with plans are discussed in each cluster section.
Following the narrative discussion of planning activities is a table labeled “Capital Projects” that summarizes all capital projects for that cluster or consortium. Four types of projects are identified under the “Type of Project” column. The types of projects are as follows:
• “Approved”—Project has an FY 2013 or FY 2014 appro-priation approved in the Amended FY 2013–2018 CIP.
• “Programmed”—Project has expenditures programmed in a future year of the CIP for planning and/or construc-tion funds.
• “Proposed”—Project has facility planning funds approved for FY 2013 or FY 2014 for a feasibility study.
For each cluster and the two consortia, four summary tables and a bar graph are presented. The bar graph shows the effects of additions to capacity in the calculation of future utilization levels. The “Projected Enrollment and Available Capacity” table reflects the projected enrollment six years into the future for elementary and secondary schools and to the years 2022 and 2027 at the secondary level. Space availability is shown with approved CIP actions. This table also has a “comments” section that contains a brief explanation of program or facil-ity changes that will impact capacity within any given year. To assist readers, a glossary of abbreviations and terms used

4-2 • Approved Actions and Planning Issues
in the tables and notes is included on the previous page. A second table, titled “Demographic Characteristics of Schools, 2012–2013,” shows the racial and ethnic group composition percentages, the student participation in the Free and Reduced-price Meals System (FARMS) Program, and the percentage of English for Speakers of Other Languages (ESOL) for each school. This table also displays the Mobility Rate (the number of entries and withdrawals during the 2011–2012 school year
as compared to total enrollment) for the 2011–2012 school year. The “Room Use Table (School Year 2012–2013)” reflects detailed room use information for each school, along with special education program information. The final table, titled “Facilities Characteristics of Schools 2012–2013,” shows facil-ity information for each school.

Approved Actions and Planning Issues • 4-3
4-4 • Approved Actions and Planning Issues
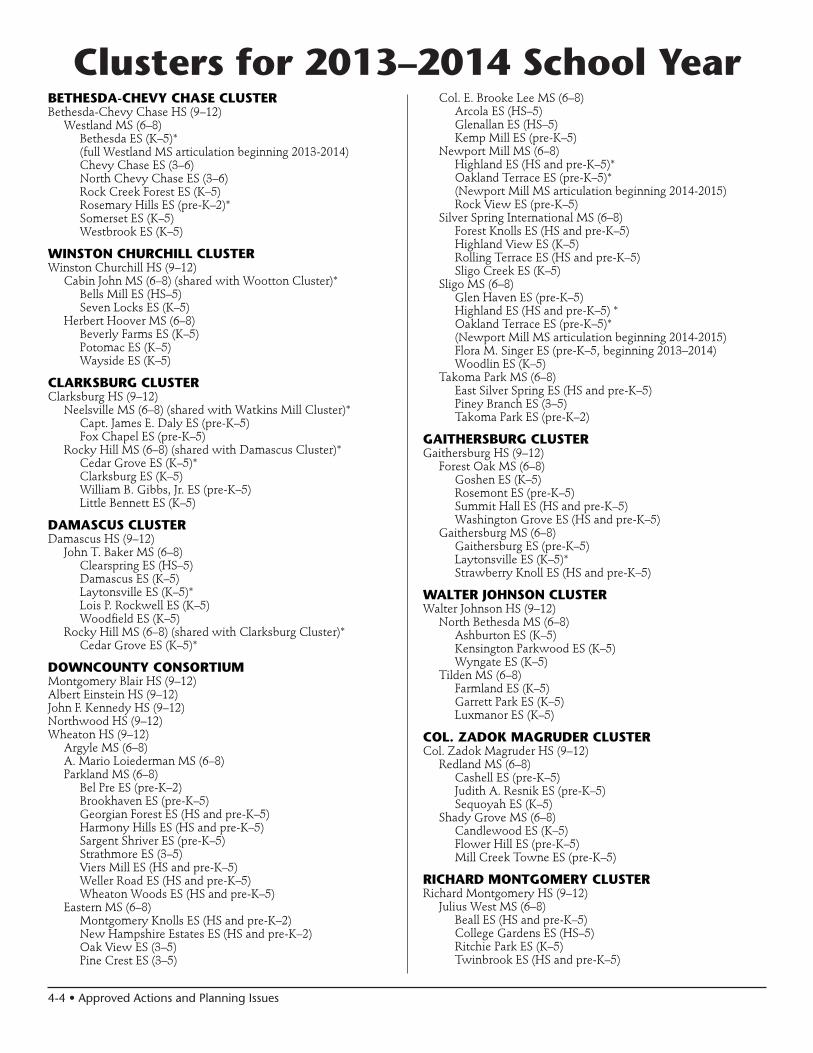
Clusters for 2013–2014 School YearBETHESDA-CHEVY CHASE CLUSTERBethesda-Chevy Chase HS (9–12) Westland MS (6–8) Bethesda ES (K–5)*
(full Westland MS articulation beginning 2013-2014) Chevy Chase ES (3–6) North Chevy Chase ES (3–6) Rock Creek Forest ES (K–5) Rosemary Hills ES (pre-K–2)* Somerset ES (K–5) Westbrook ES (K–5)
WINSTON CHURCHILL CLUSTERWinston Churchill HS (9–12) Cabin John MS (6–8) (shared with Wootton Cluster)* Bells Mill ES (HS–5) Seven Locks ES (K–5) Herbert Hoover MS (6–8) Beverly Farms ES (K–5) Potomac ES (K–5) Wayside ES (K–5)
CLARKSBURG CLUSTERClarksburg HS (9–12) Neelsville MS (6–8) (shared with Watkins Mill Cluster)* Capt. James E. Daly ES (pre-K–5) Fox Chapel ES (pre-K–5) Rocky Hill MS (6–8) (shared with Damascus Cluster)* Cedar Grove ES (K–5)* Clarksburg ES (K–5) William B. Gibbs, Jr. ES (pre-K–5) Little Bennett ES (K–5)
DAMASCUS CLUSTERDamascus HS (9–12) John T. Baker MS (6–8) Clearspring ES (HS–5) Damascus ES (K–5) Laytonsville ES (K–5)* Lois P. Rockwell ES (K–5) Woodfield ES (K–5) Rocky Hill MS (6–8) (shared with Clarksburg Cluster)* Cedar Grove ES (K–5)*
DOWNCOUNTY CONSORTIUMMontgomery Blair HS (9–12)Albert Einstein HS (9–12)John F. Kennedy HS (9–12)Northwood HS (9–12)Wheaton HS (9–12) Argyle MS (6–8) A. Mario Loiederman MS (6–8) Parkland MS (6–8) Bel Pre ES (pre-K–2) Brookhaven ES (pre-K–5) Georgian Forest ES (HS and pre-K–5) Harmony Hills ES (HS and pre-K–5) Sargent Shriver ES (pre-K–5) Strathmore ES (3–5) Viers Mill ES (HS and pre-K–5) Weller Road ES (HS and pre-K–5) Wheaton Woods ES (HS and pre-K–5) Eastern MS (6–8) Montgomery Knolls ES (HS and pre-K–2) New Hampshire Estates ES (HS and pre-K–2) Oak View ES (3–5) Pine Crest ES (3–5)
Col. E. Brooke Lee MS (6–8) Arcola ES (HS–5) Glenallan ES (HS–5) Kemp Mill ES (pre-K–5) Newport Mill MS (6–8) Highland ES (HS and pre-K–5)* Oakland Terrace ES (pre-K–5)*
(Newport Mill MS articulation beginning 2014-2015) Rock View ES (pre-K–5) Silver Spring International MS (6–8) Forest Knolls ES (HS and pre-K–5) Highland View ES (K–5) Rolling Terrace ES (HS and pre-K–5) Sligo Creek ES (K–5) Sligo MS (6–8) Glen Haven ES (pre-K–5) Highland ES (HS and pre-K–5) * Oakland Terrace ES (pre-K–5)*
(Newport Mill MS articulation beginning 2014-2015) Flora M. Singer ES (pre-K–5, beginning 2013–2014) Woodlin ES (K–5) Takoma Park MS (6–8) East Silver Spring ES (HS and pre-K–5) Piney Branch ES (3–5) Takoma Park ES (pre-K–2)
GAITHERSBURG CLUSTERGaithersburg HS (9–12) Forest Oak MS (6–8) Goshen ES (K–5) Rosemont ES (pre-K–5) Summit Hall ES (HS and pre-K–5) Washington Grove ES (HS and pre-K–5) Gaithersburg MS (6–8) Gaithersburg ES (pre-K–5) Laytonsville ES (K–5)* Strawberry Knoll ES (HS and pre-K–5)
WALTER JOHNSON CLUSTERWalter Johnson HS (9–12) North Bethesda MS (6–8) Ashburton ES (K–5) Kensington Parkwood ES (K–5) Wyngate ES (K–5) Tilden MS (6–8) Farmland ES (K–5) Garrett Park ES (K–5) Luxmanor ES (K–5)
COL. ZADOK MAGRUDER CLUSTERCol. Zadok Magruder HS (9–12) Redland MS (6–8) Cashell ES (pre-K–5) Judith A. Resnik ES (pre-K–5) Sequoyah ES (K–5) Shady Grove MS (6–8) Candlewood ES (K–5) Flower Hill ES (pre-K–5) Mill Creek Towne ES (pre-K–5)
RICHARD MONTGOMERY CLUSTERRichard Montgomery HS (9–12) Julius West MS (6–8) Beall ES (HS and pre-K–5) College Gardens ES (HS–5) Ritchie Park ES (K–5) Twinbrook ES (HS and pre-K–5)

Approved Actions and Planning Issues • 4-5
NORTHEAST CONSORTIUMJames H. Blake HS (9–12)Paint Branch HS (9–12)Springbrook HS (9–12) Benjamin Banneker MS (6–8) Burtonsville ES (K–5) Fairland ES (HS and pre-K–5)* Greencastle ES (pre-K–5) Briggs Chaney MS (6–8) Cloverly ES (K–5)* Fairland ES (HS and pre-K–5)* Galway ES (pre-K–5) William T. Page ES (pre-K–5) William H. Farquhar MS (6–8) (shared with Sherwood Cluster)* Cloverly ES (K–5)* Sherwood (K–5)* Stonegate ES (K–5)* Francis Scott Key MS (6–8) Burnt Mills ES (pre-K–5) Cannon Road ES (K–5) Cresthaven ES (3–5) Dr. Charles R. Drew ES (pre-K–5) Roscoe R. Nix ES (pre-K–2) White Oak MS (6–8) Broad Acres ES (HS and pre-K–5) Jackson Road ES (pre-K–5) Stonegate ES (K–5)* Westover ES (K–5)
NORTHWEST CLUSTERNorthwest HS (9–12) Kingsview MS (6–8) Great Seneca Creek ES (K–5)* Ronald McNair ES (pre-K–5) Spark M. Matsunaga ES (K–5) Lakelands Park MS (6–8) (shared with Quince Orchard Cluster)* Darnestown ES (K–5) Diamond ES (K–5)* Roberto Clemente MS (6–8) (shared with Seneca Valley Cluster)* Clopper Mill ES (HS and pre-K–5) Germantown ES (K–5) Great Seneca Creek ES (K–5)*
POOLESVILLE CLUSTERPoolesville HS (9–12) John Poole MS (6–8) Monocacy ES (K–5) Poolesville ES (K–5)
QUINCE ORCHARD CLUSTERQuince Orchard HS (9–12) Lakelands Park MS (6–8) (shared with Northwest Cluster)* Brown Station ES (HS and pre-K–5) Rachel Carson ES (pre-K–5) Ridgeview MS (6–8) Diamond ES (K–5)* Fields Road ES (pre-K–5) Jones Lane ES (K–5) Thurgood Marshall ES (K–5)
ROCKVILLE CLUSTERRockville HS (9–12) Earle B. Wood MS (6–8) Lucy V. Barnsley ES (pre-K–5) Flower Valley ES (K–5)
Maryvale ES (HS and pre-K–5) Meadow Hall ES (K–5) Rock Creek Valley ES (K–5)
SENECA VALLEY CLUSTERSeneca Valley HS (9–12) Roberto W. Clemente MS (6–8) (shared with Northwest Cluster)* S. Christa McAuliffe ES (HS–5) Dr. Sally K. Ride (HS and pre-K–5)* Dr. Martin Luther King, Jr. MS (6–8) Lake Seneca ES (pre-K–5) Dr. Sally K. Ride ES (HS and pre-K–5)* Waters Landing ES (K–5)
SHERWOOD CLUSTERSherwood HS (9–12) Rosa M. Parks MS (6–8) Belmont ES (K–5) Greenwood ES (K–5) Olney ES (K–5) William H. Farquhar MS (6–8) (shared with Northeast Consortium)* Brooke Grove ES (pre-K–5) Sherwood ES (K–5)
WATKINS MILL CLUSTERWatkins Mill HS (9–12) Montgomery Village MS (6–8) Stedwick ES (pre-K–5)* Watkins Mill ES (HS and pre-K–5) Whetstone ES (pre-K–5) Neelsville MS (6–8) (shared with Clarksburg Cluster)* South Lake ES (HS and pre-K–5) Stedwick ES (pre-K–5)*
WALT WHITMAN CLUSTERWalt Whitman HS (9–12) Thomas W. Pyle MS (6–8) Bannockburn ES (K–5) Bethesda ES (K–5)*
(Westland MS articulation beginning 2013-2014) Bradley Hills ES (K–5) Burning Tree ES (K–5) Carderock Springs ES (K–5) Wood Acres ES (K–5)
THOMAS S. WOOTTON CLUSTERThomas S. Wootton HS (9–12) Cabin John MS (6–8) (shared with Churchill Cluster)* Cold Spring ES (K–5) Stone Mill ES (K–5) Robert Frost MS (6–8) DuFief ES (K–5) Fallsmead ES (K–5) Lakewood ES (K–5) Travilah ES (K–5)
Other Educational FacilitiesAdditionally, Montgomery County Public Schools operates the following facilities: Thomas Edison High School of Technology Blair G. Ewing Center Stephen Knolls Center Longview Center RICA—Regional Institute for Children and Adolescents Rock Terrace Center Carl Sandburg Learning Center
Clusters for 2013–2014 School Year
* Denotes schools with split articulation, i.e., some students feed into one school, while other students feed into another school in the same or different cluster.
4-6 • Approved Actions and Planning Issues
nm
!n
!n
n
nm
nm
nm
!(nm
nm
Westland MS
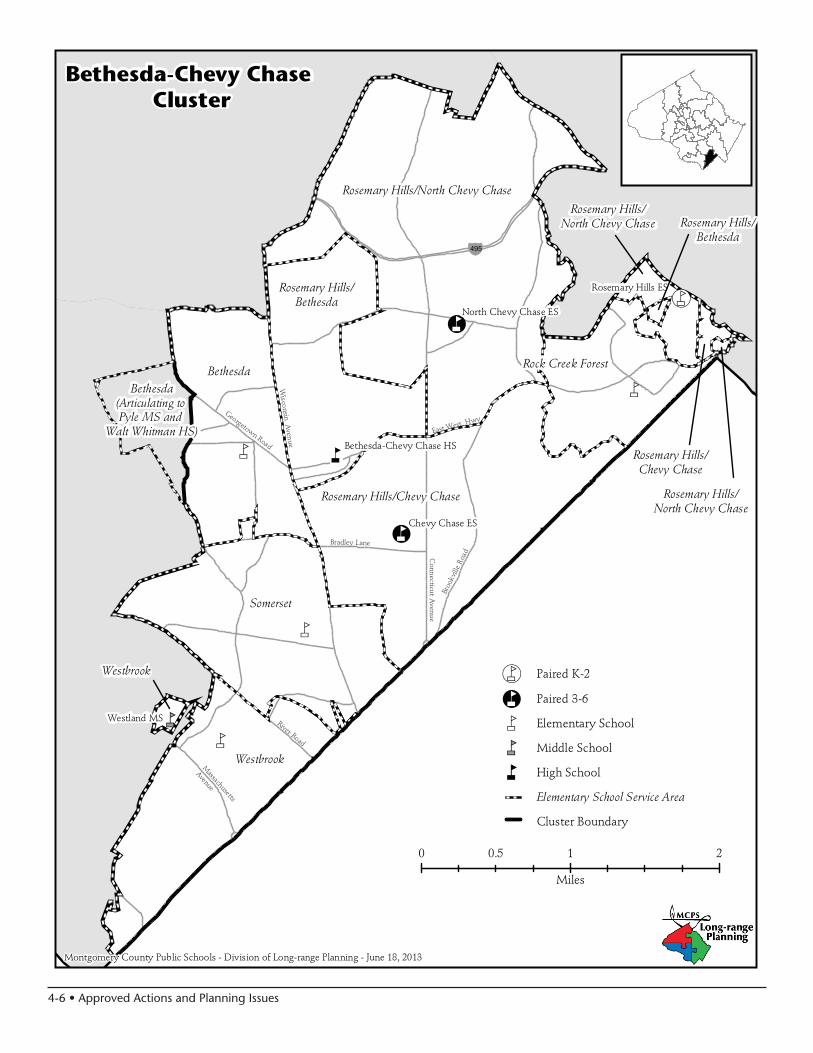
Bethesda-Chevy Chase Cluster
Montgomery County Public Schools - Division of Long-range Planning - June 18, 2013
Rosemary Hills/North Chevy Chase
Rosemary Hills ES
Bethesda-Chevy Chase HS
North Chevy Chase ES
Chevy Chase ES
Rosemary Hills/Bethesda
Rosemary Hills/Chevy Chase
Somerset
Rosemary Hills/North Chevy Chase
Rosemary Hills/North Chevy Chase Rosemary Hills/
Bethesda
Rock Creek Forest
Rosemary Hills/Chevy Chase
Bethesda(Articulating to Pyle MS and
Walt Whitman HS)
Westbrook
Westbrook
Elementary School Service Area
Cluster Boundary
!(nm Paired K-2
!n Paired 3-6
nm Elementary School
nm Middle School
nm High School
River Road
Wisconsin A
venue
East West Hwy
Connecticut A
venue
¥495
Bradley Lane
Broo
kvill
e Ro
ad
Massachusetts
Avenue
Georgetown Road
0 1 20.5
Miles
Bethesda
Approved Actions and Planning Issues • 4-7
DESIREDRANGE
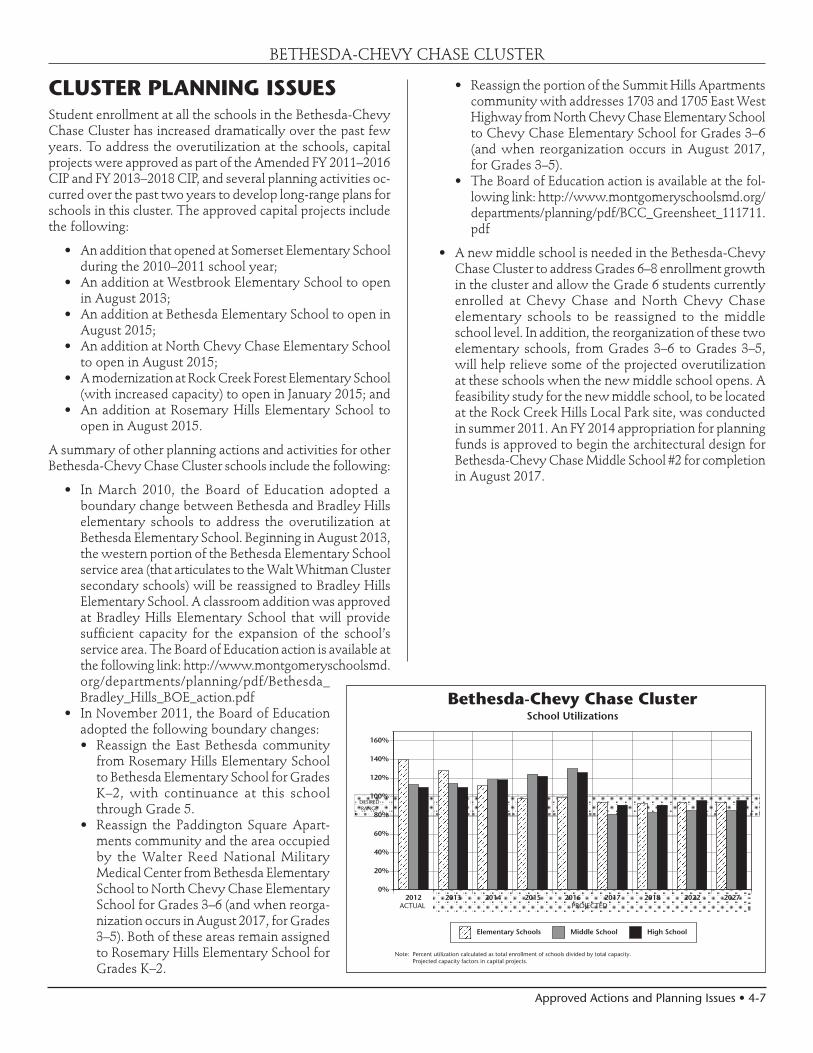
Note: Percent utilization calculated as total enrollment of schools divided by total capacity.Projected capacity factors in capital projects.
Bethesda-Chevy Chase ClusterSchool Utilizations
ACTUAL PROJECTED2012 2013 2014 2015 2016 2017 2018 2022 2027
0%
20%
40%
60%
80%
100%
120%
140%
160%
Elementary Schools Middle School High School
BETHESDA-CHEVY CHASE CLUSTER
CLUSTER PLANNING ISSUESStudent enrollment at all the schools in the Bethesda-Chevy Chase Cluster has increased dramatically over the past few years. To address the overutilization at the schools, capital projects were approved as part of the Amended FY 2011–2016 CIP and FY 2013–2018 CIP, and several planning activities oc-curred over the past two years to develop long-range plans for schools in this cluster. The approved capital projects include the following:
• An addition that opened at Somerset Elementary School during the 2010–2011 school year;
• An addition at Westbrook Elementary School to open in August 2013;
• An addition at Bethesda Elementary School to open in August 2015;
• An addition at North Chevy Chase Elementary School to open in August 2015;
• A modernization at Rock Creek Forest Elementary School (with increased capacity) to open in January 2015; and
• An addition at Rosemary Hills Elementary School to open in August 2015.
A summary of other planning actions and activities for other Bethesda-Chevy Chase Cluster schools include the following:
• InMarch 2010, the Board of Education adopted aboundary change between Bethesda and Bradley Hills elementary schools to address the overutilization at Bethesda Elementary School. Beginning in August 2013, the western portion of the Bethesda Elementary School service area (that articulates to the Walt Whitman Cluster secondary schools) will be reassigned to Bradley Hills Elementary School. A classroom addition was approved at Bradley Hills Elementary School that will provide sufficient capacity for the expansion of the school’s service area. The Board of Education action is available at the following link: http://www.montgomeryschoolsmd.org/departments/planning/pdf/Bethesda_Bradley_Hills_BOE_action.pdf
• InNovember2011,theBoardofEducationadopted the following boundary changes:• Reassign the East Bethesda community
from Rosemary Hills Elementary School to Bethesda Elementary School for Grades K–2, with continuance at this school through Grade 5.
• Reassign the Paddington Square Apart-ments community and the area occupied by the Walter Reed National Military Medical Center from Bethesda Elementary School to North Chevy Chase Elementary School for Grades 3–6 (and when reorga-nization occurs in August 2017, for Grades 3–5). Both of these areas remain assigned to Rosemary Hills Elementary School for Grades K–2.
• Reassign the portion of the Summit Hills Apartments community with addresses 1703 and 1705 East West Highway from North Chevy Chase Elementary School to Chevy Chase Elementary School for Grades 3–6 (and when reorganization occurs in August 2017, for Grades 3–5).
• The Board of Education action is available at the fol-lowing link: http://www.montgomeryschoolsmd.org/departments/planning/pdf/BCC_Greensheet_111711.pdf
• AnewmiddleschoolisneededintheBethesda-ChevyChase Cluster to address Grades 6–8 enrollment growth in the cluster and allow the Grade 6 students currently enrolled at Chevy Chase and North Chevy Chase elementary schools to be reassigned to the middle school level. In addition, the reorganization of these two elementary schools, from Grades 3–6 to Grades 3–5, will help relieve some of the projected overutilization at these schools when the new middle school opens. A feasibility study for the new middle school, to be located at the Rock Creek Hills Local Park site, was conducted in summer 2011. An FY 2014 appropriation for planning funds is approved to begin the architectural design for Bethesda-Chevy Chase Middle School #2 for completion in August 2017.

4-8 • Approved Actions and Planning Issues
BETHESDA-CHEVY CHASE CLUSTER
SCHOOLSBethesda Chevy Chase High SchoolCapital Project: Enrollment increases occurring at cluster elementary school and at Westland Middle School are reaching the high school level. Bethesda-Chevy Chase High School is projected to exceed capacity by over 500 students by the end of the six-year CIP planning period. An FY 2012 appropriation for facility planning funds was approved to determine the feasibil-ity, scope, and cost of an addition at Bethesda-Chevy Chase High School. FY 2015 expenditures for planning funds were approved in the Bethesda-Chevy Chase High School Cluster Solution Project for a 10-classroom addition to be completed in August 2017. Additional funds will need to be requested as part of the FY 2015–2020 CIP to increase the size of the addition to accommodate the projected deficit at the school.
Bethesda Chevy Chase Middle School #2 (B-CC MS #2)Capital Project: Enrollment increases at Westland Middle School, and the plan to reassign Grade 6 students from Chevy Chase and North Chevy Chase elementary schools to the middle school level, will result in a total cluster middle school enrollment of over 1,600 students. This projected enrollment would far exceed the current capacity of Westland Middle School. A new middle school is needed in the cluster to ac-commodate the projected enrollment. An FY 2014 appropria-tion is approved for planning funds to begin the architectural design for a new school. The scheduled completion date for the new school is August 2017. In order for this project to be completed on schedule, county and state funding must be provided at levels approved in this CIP.
Westland Middle SchoolPlanning Issue: Although a six-classroom addition opened in the 2009–2010 school year in order to accommodate over-utilization at Westland Middle School, enrollment continues to increase beyond the capacity of the school. The opening of a new middle school in the cluster will address overutilization of Westland Middle School. Relocatable classrooms will be utilized until the new school opens.
Bethesda Elementary SchoolNon-capital Solution: In March 2010, the Board of Edu-cation approved the reassignment of the western portion of the Bethesda Elementary School service area (the area that articulates to Whitman Cluster secondary schools) to Bradley Hills Elementary School, beginning in August 2013.
In November 2011, the Board of Education adopted boundary changes for Bethesda, Chevy Chase, North Chevy Chase, and Rosemary Hills elementary schools. The Board of Edu-cation action is available at the following link: http://www.montgomeryschoolsmd.org/departments/planning/pdf/BCC_Greensheet_111711.pdf
Capital Project: Enrollment projections that incorporate approved boundary changes indicate that enrollment at Bethesda Elementary School will exceed capacity by four or more classrooms throughout the six-year CIP planning period. Relocatable classrooms will be utilized until an addition is completed. An FY 2014 appropriation for construction funds is approved to construct the classroom addition. The scheduled completion date for the addition is August 2015.
Capital Project: An FY 2012 appropriation for Bradley Hills Elementary School was approved for construction funds to begin the construction of the addition. The scope of the ad-dition at Bradley Hills Elementary School includes additional classrooms and an expansion of the administration suite and multipurpose room to accommodate the reassignment of students from Bethesda Elementary School. The scheduled completion date for the addition is August 2013.
Chevy Chase Elementary SchoolNon-capital Solution: In November 2010, the Board of Education approved a plan to construct a new middle school in the Bethesda-Chevy Chase Cluster and reassign Grade 6 students from Chevy Chase and North Chevy Chase elemen-tary schools to the middle school level when the new middle school opens in August 2017.
In November 2011, the Board of Education adopted boundary changes for Bethesda, Chevy Chase, North Chevy Chase, and Rosemary Hills elementary schools. The Board of Edu-cation action is available at the following link: http://www.montgomeryschoolsmd.org/departments/planning/pdf/BCC_Greensheet_111711.pdf
North Chevy Chase Elementary SchoolNon-capital Solution: In November 2010, the Board of Education approved a plan to construct a new middle school in the Bethesda-Chevy Chase Cluster and reassign Grade 6 students from Chevy Chase and North Chevy Chase elemen-tary schools to the middle school level when the new middle school opens in August 2017.
In November 2011, the Board of Education adopted boundary changes for Bethesda, Chevy Chase, North Chevy Chase, and Rosemary Hills elementary schools. The Board of Edu-cation action is available at the following link: http://www.montgomeryschoolsmd.org/departments/planning/pdf/BCC_Greensheet_111711.pdf
Capital Project: Projections that incorporate approved boundary changes indicate enrollment at North Chevy Chase Elementary School will exceed capacity by four or more class-rooms throughout the six-year CIP period. The reassignment of Grade 6 students out of North Chevy Chase Elementary School will relieve some, but not all, of the projected space deficit. Relocatable classrooms will be utilized until the addi-tion is completed. An FY 2014 appropriation for construction funds is approved to construct the classroom addition. The scheduled completion date for the addition is August 2015.
Approved Actions and Planning Issues • 4-9
BETHESDA-CHEVY CHASE CLUSTER
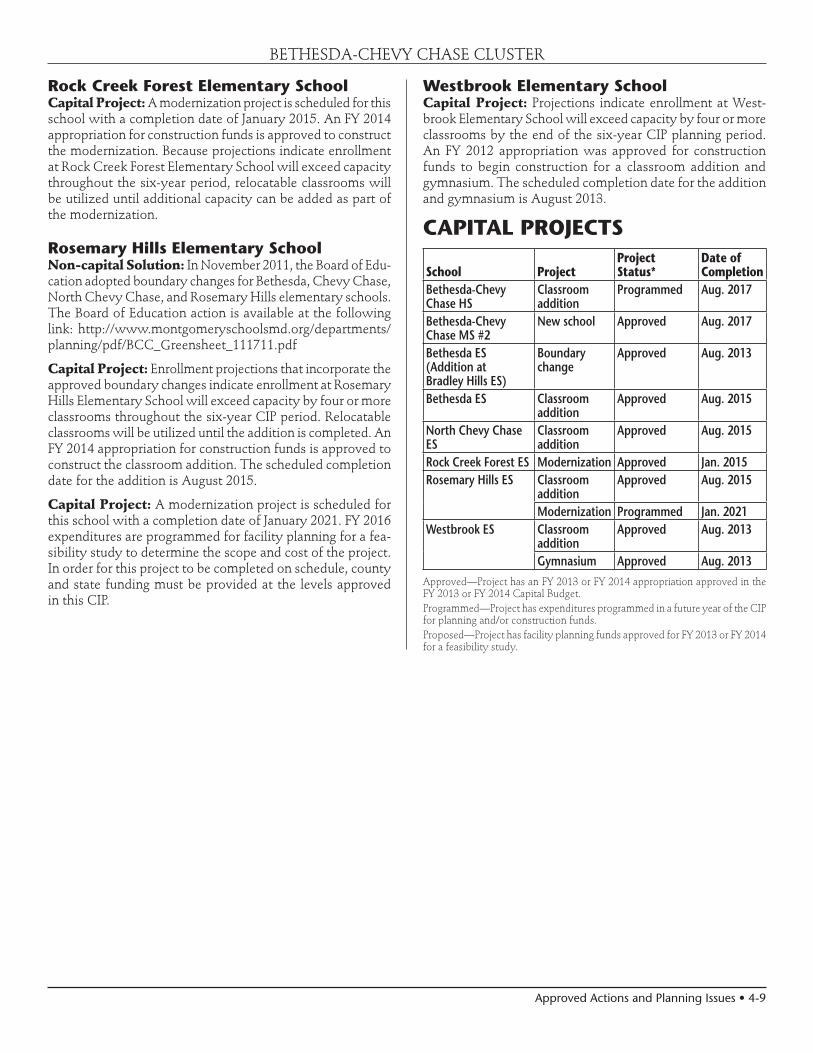
Rock Creek Forest Elementary SchoolCapital Project: A modernization project is scheduled for this school with a completion date of January 2015. An FY 2014 appropriation for construction funds is approved to construct the modernization. Because projections indicate enrollment at Rock Creek Forest Elementary School will exceed capacity throughout the six-year period, relocatable classrooms will be utilized until additional capacity can be added as part of the modernization.
Rosemary Hills Elementary SchoolNon-capital Solution: In November 2011, the Board of Edu-cation adopted boundary changes for Bethesda, Chevy Chase, North Chevy Chase, and Rosemary Hills elementary schools. The Board of Education action is available at the following link: http://www.montgomeryschoolsmd.org/departments/planning/pdf/BCC_Greensheet_111711.pdf
Capital Project: Enrollment projections that incorporate the approved boundary changes indicate enrollment at Rosemary Hills Elementary School will exceed capacity by four or more classrooms throughout the six-year CIP period. Relocatable classrooms will be utilized until the addition is completed. An FY 2014 appropriation for construction funds is approved to construct the classroom addition. The scheduled completion date for the addition is August 2015.
Capital Project: A modernization project is scheduled for this school with a completion date of January 2021. FY 2016 expenditures are programmed for facility planning for a fea-sibility study to determine the scope and cost of the project. In order for this project to be completed on schedule, county and state funding must be provided at the levels approved in this CIP.
Westbrook Elementary SchoolCapital Project: Projections indicate enrollment at West-brook Elementary School will exceed capacity by four or more classrooms by the end of the six-year CIP planning period. An FY 2012 appropriation was approved for construction funds to begin construction for a classroom addition and gymnasium. The scheduled completion date for the addition and gymnasium is August 2013.
CAPITAL PROJECTS
School ProjectProject Status*
Date of Completion
Bethesda-Chevy Chase HS
Classroom addition
Programmed Aug. 2017
Bethesda-Chevy Chase MS #2
New school Approved Aug. 2017
Bethesda ES (Addition at Bradley Hills ES)
Boundary change
Approved Aug. 2013
Bethesda ES Classroom addition
Approved Aug. 2015
North Chevy Chase ES
Classroom addition
Approved Aug. 2015
Rock Creek Forest ES Modernization Approved Jan. 2015Rosemary Hills ES Classroom
additionApproved Aug. 2015
Modernization Programmed Jan. 2021Westbrook ES Classroom
additionApproved Aug. 2013
Gymnasium Approved Aug. 2013Approved—Project has an FY 2013 or FY 2014 appropriation approved in the FY 2013 or FY 2014 Capital Budget.Programmed—Project has expenditures programmed in a future year of the CIP for planning and/or construction funds.Proposed—Project has facility planning funds approved for FY 2013 or FY 2014 for a feasibility study.

4-10 • Approved Actions and Planning Issues
BETHESDA-CHEVY CHASE CLUSTER
Projected Enrollment and Space AvailabilityEffects of the Amended FY2013–2018 CIP and Non–CIP Actions on Space Available
Actual
Schools 12–13 13–14 14–15 15–16 16-17 17-18 18-19 2022 2027Bethesda–Chevy Chase HS Program Capacity 1665 1665 1665 1665 1665 2399 2399 2400 2400
Enrollment 1841 1850 1957 2025 2099 2176 2191 2300 2300Available Space (176) (185) (292) (360) (434) 223 208 100 100Comments Planning Addition
for CompleteAddition
Bethesda-Chevy Chase Program Capacity 944 944 944 944MS #2 Enrollment 0 0 0 0
Available Space 944 944 944 944Comments Opens
Aug. 2017
Westland MS Program Capacity 1063 1063 1063 1063 1063 1063 1063 1063 1063Enrollment 1200 1210 1255 1315 1382 1616 1660 1700 1700Available Space (138) (148) (192) (252) (320) (554) (598) (637) (637)Comments See text
Bethesda ES Program Capacity 384 384 384 568 568 568 568 Grades (K–5) Enrollment 514 490 471 493 520 542 555Grades (3–5) Available Space (130) (106) (87) 75 48 26 13
Paired with Comments Planning Boundary AdditionRosemary Hills ES for Change Complete
Addition PlanningChevy Chase ES Program Capacity 450 450 450 450 450 450 450
Grades (3–6) Enrollment 523 521 536 548 544 445 433Paired With Available Space (73) (71) (86) (98) (94) 5 17
Rosemary Hills ES Comments Boundary See textChange
North Chevy Chase ES Program Capacity 220 220 220 358 358 358 358Grades (3–6) Enrollment 409 427 437 442 459 347 345
Paired with Available Space (189) (207) (217) (84) (101) 11 13Rosemary Hills ES Comments + Gym Boundary Addition See text
Planning Change Complete
Rock Creek Forest ES CSR Program Capacity 325 325 718 718 718 718 718Enrollment 594 626 647 700 700 702 685Available Space (269) (301) 71 18 18 16 33Comments Planning + 2 AUT
for Mod. Mod. Comp +1 PEPJan. 2015 + PreK
Rosemary Hills ES Program Capacity 475 475 475 644 644 644 644Grades (pre-K–2) Enrollment 732 707 681 633 618 615 613
Paired with Available Space (257) (232) (206) 11 26 29 31Bethesda ES Comments Planning Boundary Addition
Chevy Chase ES for Change CompleteNorth Chevy Chase ES Addition Fac. Plng.
Somerset ES Program Capacity 515 515 515 515 515 515 515Enrollment 517 553 546 526 514 508 500Available Space (2) (38) (31) (11) 1 7 15Comments
Westbrook ES Program Capacity 283 558 558 558 558 558 558Enrollment 438 444 427 431 430 434 430Available Space (155) 114 131 127 128 124 128Comments Addition
GymComplete
Cluster Information HS Utilization 111% 111% 118% 122% 126% 91% 91% 96% 96%HS Enrollment 1841 1850 1957 2025 2099 2176 2191 2300 2300MS Utilization 113% 114% 118% 124% 130% 81% 83% 85% 85%MS Enrollment 1200 1210 1255 1315 1382 1616 1660 1700 1700ES Utilization 141% 129% 113% 99% 99% 94% 93% 94% 94%ES Enrollment 3727 3768 3745 3773 3785 3593 3561 3600 3600
Mod.
Projections
Planningfor new school
for Addition
@ Radnor
Planningfor

Approved Actions and Planning Issues • 4-11
BETHESDA-CHEVY CHASE CLUSTER
(School Year 2012–2013)
Schools Gra
des
Ser
ved
Cap
acit
y (H
S @
90%
MS@
85%
)
To
tal R
oo
ms
Sup
po
rt R
oo
ms
Reg
ular
Sec
on
dar
y @
25
Reg
ular
Ele
men
tary
@23
CSR
Gra
des
1–2
@17
Pre
–K @
20
Pre
–K @
40
HS
@20
CSR
KIN
D @
15
KIN
D @
22
ESO
L @
15
MET
S @
15
SEC
LA
D@
15
HSM
@13
ELE
M L
AD
@13
ELC
@10
LA
NG
@12
LFI
@10
SC
B @
6
AA
C@
7
AU
T @
6
BR
IDG
E @
10
DH
OH
@7
ED
@10
EX
TEN
SIO
NS
@6
LD
/GT
@13
PD
@7
PEP
@6
PEP
@12
PEP
@18
SLC
@10
VIS
ION
(El
emen
tary
) @
7
OTH
ER
Bethesda-Chevy Chase HS 9-12 1665 76 71 1 1 3
Westland MS 6-8 1063 52 47 1 4
Bethesda ES K-5 384 21 3 13 3 1 1
Chevy Chase ES 3-6 450 24 4 19 1
North Chevy Chase ES 3-6 220 15 5 9 1
Rock Creek Forest ES K-5 325 23 4 3 9 6 1
Rosemary Hills ES PreK-2 475 27 4 8 1 10 1 3
Somerset ES K-5 515 27 4 18 4 1
Westbrook ES K-5 283 18 4 8 3 1 2
Program Capacity and Room Use Table
Sch
oo
l Bas
ed
Quad Cluster BasedC
lust
er B
ased
Special Education Programs
County & Regional Based
Demographic Characteristics of Schools2011–12
Total Two or more Black or Mobility Schools Enrollment races % Afr. Amr. % Asian% Hispanic % White % FARMS%* ESOL%** Rate%***Bethesda-Chevy Chase HS 1841 ≤ 5.0% 15.3% 6.4% 16.0% 57.4% 11.0% ≤ 5.0% 8.6%Westland MS 1200 5.5% 12.2% 5.4% 15.5% 60.9% 10.7% ≤ 5.0% 5.6%Bethesda ES 514 7.2% 9.5% 11.5% 10.1% 61.7% 5.6% 7.8% 12.4%Chevy Chase ES 523 ≤ 5.0% 10.5% ≤ 5.0% 9.6% 70.4% 12.2% 6.3% ≤ 5.0%North Chevy Chase ES 409 6.8% 11.2% 5.9% 14.2% 61.4% 7.1% 5.1% ≤ 5.0%Rock Creek Forest ES 594 5.7% 15.7% 5.1% 29.6% 43.4% 23.1% 18.9% 5.9%Rosemary Hills ES 732 7.7% 13.8% 5.2% 15.8% 57.2% 21.0% 17.1% 6.9%Somerset ES 517 5.2% ≤ 5.0% 11.0% 11.6% 67.9% ≤ 5.0% 15.9% 8.3%Westbrook ES 438 6.8% ≤ 5.0% ≤ 5.0% 7.5% 81.3% ≤ 5.0% ≤ 5.0% 5.1%Elementary Cluster Total 3727 6.4% 10.0% 6.5% 14.6% 62.2% 12.2% 12.0% 6.9%
Elementary County Total 72303 ≤ 5.0% 20.6% 14.0% 28.8% 31.4% 39.0% 25.6% 12.6%*Percent of students approved for Free and Reduced–priced Meals Program (FARMS) during the 2012–2013 school year.
**Percent of English for Speakers of Other Languages (ESOL) during the 2012–2013 school year. High School students are served in regional ESOL centers.
***Mobility Rate is the number of entries plus withdrawals during the 2011–2012 school year compared to total enrollment.Notes: Native Hawaiian/Pacific Islander and American Indian/Alaskan Native categories total less than 1% and were therefore excluded from the table.Due to federal and state guidelines, demographic characteristics of schools of less than or equal to 5.0% are reported as ≤ 5.0%.
2012–2013 2012–2013

4-12 • Approved Actions and Planning Issues
BETHESDA-CHEVY CHASE CLUSTER
Year Year Total Site Reloc- Linkages to Home
Facility Reopened/ Square Size Adjacent atable Learning School
Schools Opened Modernized Footage Acres Park Classrooms Program Model
Bethesda-Chevy Chase HS 1934 2001 308,215 16.4 2
Westland MS 1951 1997 146,006 25.1 5
Bethesda ES 1952 1999 68,254 8.42 5 Yes
Chevy Chase ES 1936 2000 70,976 3.8 Yes
North Chevy Chase ES 1953 1995 47,635 7.9 5 Yes
Rock Creek Forest ES 1950 1971 54,522 8 6 Yes
Rosemary Hills ES 1956 1988 70,541 6.1 7 Yes
Somerset ES 1949 2005 80,122 3.7 Yes
Westbrook ES 1939 1990 46,822 12.5 Yes 8 Yes
Facility Characteristics of Schools 2012–2013


4-14 • Approved Actions and Planning Issues
nm
nnm
nmnm
nm
nm
nm
Cabin John MS
Winston Churchill Cluster
Montgomery County Public Schools - Division of Long-range Planning - June 18, 2013
Potomac
Wayside
Beverly Farms
Bells Mill
Seven Locks
Herbert Hoover MSWinston Churchill HS
Cluster Boundary
Elementary School Service Area
Cabin John MS
Hoover MS
nm Elementary School
nm Middle School
n High School
0 1 20.5
Miles
River Road
Falls
Road
¥270
¥495

Approved Actions and Planning Issues • 4-15
DESIREDRANGE
Note: Percent utilization calculated as total enrollment of schools divided by total capacity.Projected capacity factors in capital projects.
ACTUAL PROJECTED2012 2013 2014 2015 2016 2017 2018 2022 2027
0%
20%
40%
60%
80%
100%
120%
140%
160%
Elementary Schools Middle Schools High School
Winston Churchill ClusterSchool Utilizations
WINSTON CHURCHILL CLUSTER
SCHOOLS
Herbert Hoover Middle SchoolCapital Project: A modernization project for this school is scheduled for completion in August 2013. An FY 2012 appropriation for construction funds was approved for the construction of the modernization.
Beverly Farms Elementary SchoolCapital Project: A modernization project for this school was completed in January 2013. An FY 2012 appropriation was approved for construction funds for the construction of the modernization.
Potomac Elementary School Capital Project: A modernization project is scheduled for this school with a completion date of January 2018. An FY 2013 appropriation was approved for facility planning to conduct a feasibility study to determine the scope and cost of the modernization project. In order for this project to be completed on schedule, county and state funding must be provided at the levels approved in this CIP.
Wayside Elementary SchoolCapital Project: A modernization project is scheduled for this school with a completion date of August 2016. An FY 2013 appropriation for planning funds was approved to begin the architectural design for the modernization. In order for this project to be completed on schedule, county and state funding must be provided at the levels approved in this CIP.
CAPITAL PROJECTS
School ProjectProject Status
Date of Completion
Hoover MS Modernization Approved Aug. 2013Beverly Farms ES
Modernization Approved Jan. 2013
Potomac ES Modernization Programmed Jan. 2018Wayside ES Modernization Approved Aug. 2016
Approved—Project has an FY 2013 or FY 2014 appropriation approved in the FY 2013 or FY 2014 Capital Budget.Programmed—Project has expenditures programmed in a future year of the CIP for planning and/or construction funds.Proposed—Project has facility planning funds approved for FY 2013 or FY 2014 for a feasibility study.

4-16 • Approved Actions and Planning Issues
WINSTON CHURCHILL CLUSTER
Projected Enrollment and Space AvailabilityEffects of the Amended FY2013–2018 CIP and Non–CIP Actions on Space Available
Actual
Schools 12–13 13–14 14–15 15–16 16-17 17-18 18-19 2022 2027Winston Churchill HS Program Capacity 1968 1968 1968 1968 1968 1968 1968 1968 1968
Enrollment 2095 2039 2020 2098 2039 2022 2000 2100 2100Available Space (127) (71) (52) (130) (71) (54) (32) (132) (132)Comments
Cabin John MS Program Capacity 1099 1099 1099 1099 1099 1099 1099 1099 1099Enrollment 925 935 944 968 1002 1020 1030 1050 1050Available Space 174 164 155 131 97 79 69 49 49Comments
Herbert Hoover MS Program Capacity 978 1084 1084 1084 1084 1084 1084 1084 1084Enrollment 999 1012 988 946 922 933 929 950 950Available Space (22) 72 96 138 162 151 155 134 134Comments @ Tilden Mod.
Center CompleteAug. 2013
Bells Mill ES Program Capacity 609 609 609 609 609 609 609Enrollment 584 582 594 593 596 583 584Available Space 25 27 15 16 13 26 25Comments
Beverly Farms ES Program Capacity 689 689 689 689 689 689 689Enrollment 579 565 575 569 568 570 570Available Space 110 124 114 120 121 119 119Comments Mod.
CompleteJan 2013
Potomac ES Program Capacity 424 424 424 424 424 548 548Enrollment 500 475 463 459 454 464 475Available Space (76) (51) (39) (35) (30) 84 73Comments Facility
Planning Mod. Comp.For Mod. Jan. 2018
Seven Locks ES Program Capacity 425 425 425 425 425 425 425Enrollment 362 363 374 388 383 391 390Available Space 63 62 51 37 42 34 35Comments
Wayside ES Program Capacity 670 670 670 670 640 640 640Enrollment 538 511 531 529 544 543 547Available Space 132 159 139 141 96 97 93Comments Move to @ Radnor
Radnor Mod. Comp.Jan. 2015 Aug. 2016
Cluster Information HS Utilization 106% 104% 103% 107% 104% 103% 102% 107% 107%HS Enrollment 2095 2039 2020 2098 2039 2022 2000 2100 2100MS Utilization 93% 89% 89% 88% 88% 89% 90% 92% 92%MS Enrollment 1924 1947 1932 1914 1924 1953 1959 2000 2000ES Utilization 91% 89% 90% 90% 91% 88% 88% 89% 89%ES Enrollment 2563 2496 2537 2538 2545 2551 2566 2600 2600
forModernization
Projections
Planningfor
Modernization
Planning
@ Radnor
Approved Actions and Planning Issues • 4-17
WINSTON CHURCHILL CLUSTER
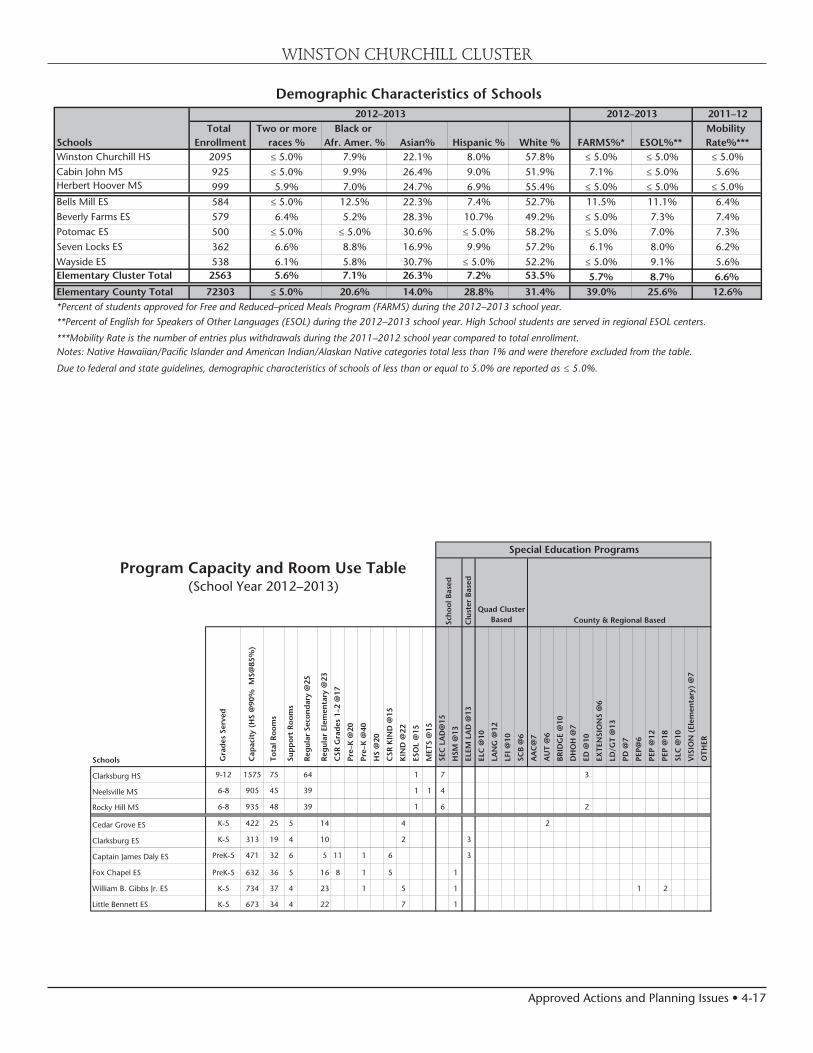
Demographic Characteristics of Schools2011–12
Total Two or more Black or Mobility Schools Enrollment races % Afr. Amer. % Asian% Hispanic % White % FARMS%* ESOL%** Rate%***Winston Churchill HS 2095 ≤ 5.0% 7.9% 22.1% 8.0% 57.8% ≤ 5.0% ≤ 5.0% ≤ 5.0%Cabin John MS 925 ≤ 5.0% 9.9% 26.4% 9.0% 51.9% 7.1% ≤ 5.0% 5.6%Herbert Hoover MS 999 5.9% 7.0% 24.7% 6.9% 55.4% ≤ 5.0% ≤ 5.0% ≤ 5.0%Bells Mill ES 584 ≤ 5.0% 12.5% 22.3% 7.4% 52.7% 11.5% 11.1% 6.4%Beverly Farms ES 579 6.4% 5.2% 28.3% 10.7% 49.2% ≤ 5.0% 7.3% 7.4%Potomac ES 500 ≤ 5.0% ≤ 5.0% 30.6% ≤ 5.0% 58.2% ≤ 5.0% 7.0% 7.3%Seven Locks ES 362 6.6% 8.8% 16.9% 9.9% 57.2% 6.1% 8.0% 6.2%Wayside ES 538 6.1% 5.8% 30.7% ≤ 5.0% 52.2% ≤ 5.0% 9.1% 5.6%Elementary Cluster Total 2563 5.6% 7.1% 26.3% 7.2% 53.5% 5.7% 8.7% 6.6%
Elementary County Total 72303 ≤ 5.0% 20.6% 14.0% 28.8% 31.4% 39.0% 25.6% 12.6%*Percent of students approved for Free and Reduced–priced Meals Program (FARMS) during the 2012–2013 school year.
**Percent of English for Speakers of Other Languages (ESOL) during the 2012–2013 school year. High School students are served in regional ESOL centers.
***Mobility Rate is the number of entries plus withdrawals during the 2011–2012 school year compared to total enrollment.Notes: Native Hawaiian/Pacific Islander and American Indian/Alaskan Native categories total less than 1% and were therefore excluded from the table.
Due to federal and state guidelines, demographic characteristics of schools of less than or equal to 5.0% are reported as ≤ 5.0%.
2012–2013 2012–2013
(School Year 2012–2013)
Schools Gra
des
Ser
ved
Cap
acit
y (H
S @
90%
MS@
85%
)
Tot
al R
oom
s
Sup
por
t R
oom
s
Reg
ular
Sec
ond
ary
@25
Reg
ular
Ele
men
tary
@23
CSR
Gra
des
1–2
@17
Pre
–K @
20
Pre
–K @
40
HS
@20
CSR
KIN
D @
15
KIN
D @
22
ESO
L @
15
MET
S @
15
SEC
LA
D@
15
HSM
@13
ELE
M L
AD
@13
ELC
@10
LA
NG
@12
LFI
@10
SC
B @
6
AA
C@
7
AU
T @
6
BR
IDG
E @
10
DH
OH
@7
ED
@10
EX
TEN
SIO
NS
@6
LD
/GT
@13
PD
@7
PEP
@6
PEP
@12
PEP
@18
SLC
@10
VIS
ION
(El
emen
tary
) @
7
OTH
ER
Clarksburg HS 9-12 1575 75 64 1 7 3
Neelsville MS 6-8 905 45 39 1 1 4
Rocky Hill MS 6-8 935 48 39 1 6 2
Cedar Grove ES K-5 422 25 5 14 4 2
Clarksburg ES K-5 313 19 4 10 2 3
Captain James Daly ES PreK-5 471 32 6 5 11 1 6 3
Fox Chapel ES PreK-5 632 36 5 16 8 1 5 1
William B. Gibbs Jr. ES K-5 734 37 4 23 1 5 1 1 2
Little Bennett ES K-5 673 34 4 22 7 1
Program Capacity and Room Use Table
Sch
ool B
ased
Clu
ster
Bas
ed
Quad Cluster Based
Special Education Programs
County & Regional Based

4-18 • Approved Actions and Planning Issues
WINSTON CHURCHILL CLUSTER
Year Year Total Site Reloc- Linkages to Home
Facility Reopened/ Square Size Adjacent atable Learning School
Schools Opened Modernized Footage Acres Park Classrooms Program Model
Winston Churchill HS 1964 2001 322,078 30.3
Cabin John MS 1967 2011 159,514 18.2
Herbert Hoover MS 1966 2013 135,342 19.1
Bells Mill ES 1968 2009 77,244 9.6
Beverly Farms ES 1965 2013 97,965 5 Yes
Potomac ES 1949 1976 57,713 9.6 5 Yes
Seven Locks ES 1964 2012 66,915 9.9 Yes
Wayside ES 1969 77,507 9.3
Facility Characteristics of Schools 2012–2013


4-20 • Approved Actions and Planning Issues
nm
n
nm
nm
nm
nm
nm
nm
Neelsville MS
Clarksburg Cluster
Montgomery County Public Schools - Division of Long-range Planning - June 18, 2013
Little Bennett
Daly
Cedar Grove
Clarksburg
Fox Chapel
Clarksburg HS
Rocky Hill MS
Elementary School Service Area
Neelsville MS
Rocky Hill MS
nm Elementary School
nm Middle School
n High School
Cluster Boundary
Cedar Grove ES
Frederick Road
¥270
Old Hundred
Road
Cla
rksb
urg
Road
Barnsville Road
Ridge Road
William B. Gibbs, Jr.
Miles
0 1 20.5
Approved Actions and Planning Issues • 4-21
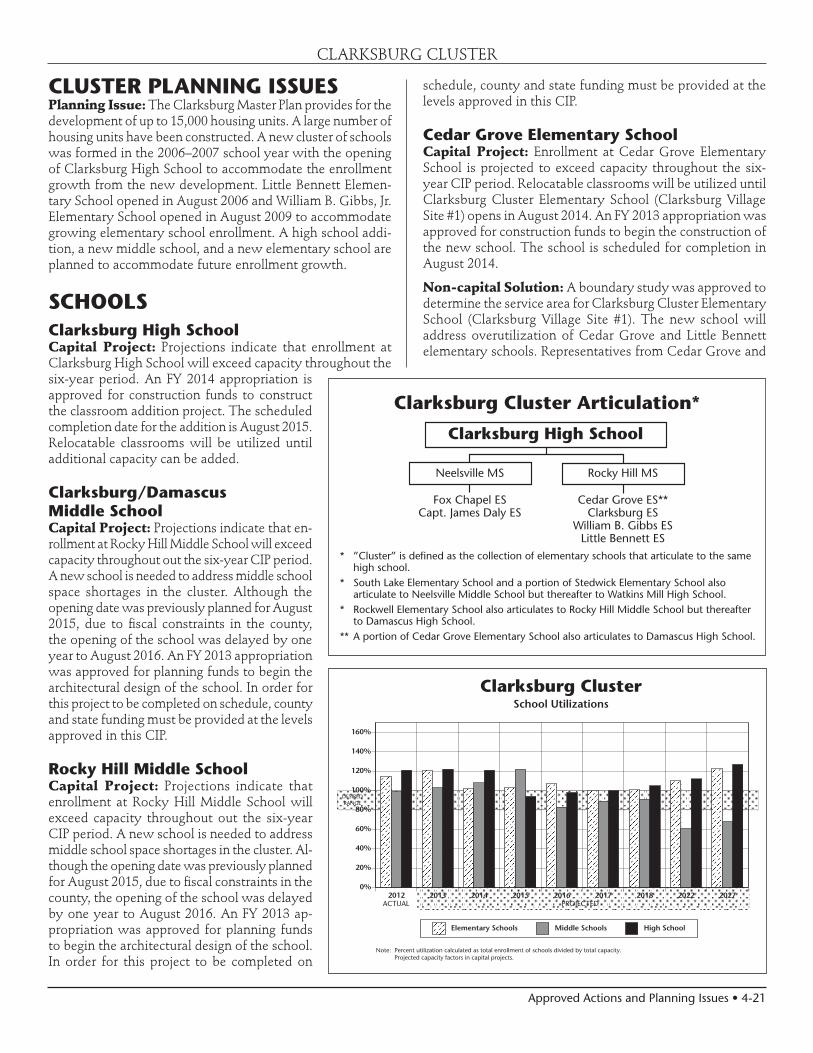
CLUSTER PLANNING ISSUESPlanning Issue: The Clarksburg Master Plan provides for the development of up to 15,000 housing units. A large number of housing units have been constructed. A new cluster of schools was formed in the 2006–2007 school year with the opening of Clarksburg High School to accommodate the enrollment growth from the new development. Little Bennett Elemen-tary School opened in August 2006 and William B. Gibbs, Jr. Elementary School opened in August 2009 to accommodate growing elementary school enrollment. A high school addi-tion, a new middle school, and a new elementary school are planned to accommodate future enrollment growth.
SCHOOLSClarksburg High SchoolCapital Project: Projections indicate that enrollment at Clarksburg High School will exceed capacity throughout the six-year period. An FY 2014 appropriation is approved for construction funds to construct the classroom addition project. The scheduled completion date for the addition is August 2015. Relocatable classrooms will be utilized until additional capacity can be added.
Clarksburg/Damascus Middle SchoolCapital Project: Projections indicate that en-rollment at Rocky Hill Middle School will exceed capacity throughout out the six-year CIP period. A new school is needed to address middle school space shortages in the cluster. Although the opening date was previously planned for August 2015, due to fiscal constraints in the county, the opening of the school was delayed by one year to August 2016. An FY 2013 appropriation was approved for planning funds to begin the architectural design of the school. In order for this project to be completed on schedule, county and state funding must be provided at the levels approved in this CIP.
Rocky Hill Middle SchoolCapital Project: Projections indicate that enrollment at Rocky Hill Middle School will exceed capacity throughout out the six-year CIP period. A new school is needed to address middle school space shortages in the cluster. Al-though the opening date was previously planned for August 2015, due to fiscal constraints in the county, the opening of the school was delayed by one year to August 2016. An FY 2013 ap-propriation was approved for planning funds to begin the architectural design of the school. In order for this project to be completed on
CLARKSBURG CLUSTER
schedule, county and state funding must be provided at the levels approved in this CIP.
Cedar Grove Elementary SchoolCapital Project: Enrollment at Cedar Grove Elementary School is projected to exceed capacity throughout the six-year CIP period. Relocatable classrooms will be utilized until Clarksburg Cluster Elementary School (Clarksburg Village Site #1) opens in August 2014. An FY 2013 appropriation was approved for construction funds to begin the construction of the new school. The school is scheduled for completion in August 2014.
Non-capital Solution: A boundary study was approved to determine the service area for Clarksburg Cluster Elementary School (Clarksburg Village Site #1). The new school will address overutilization of Cedar Grove and Little Bennett elementary schools. Representatives from Cedar Grove and
Clarksburg Cluster Articulation*
Clarksburg High School
Rocky Hill MS
Cedar Grove ES**Clarksburg ES
William B. Gibbs ESLittle Bennett ES
Neelsville MS
Fox Chapel ESCapt. James Daly ES
* ”Cluster” is defined as the collection of elementary schools that articulate to the same high school.
* South Lake Elementary School and a portion of Stedwick Elementary School also articulate to Neelsville Middle School but thereafter to Watkins Mill High School.
* Rockwell Elementary School also articulates to Rocky Hill Middle School but thereafter to Damascus High School.
** A portion of Cedar Grove Elementary School also articulates to Damascus High School.
Clarksburg ClusterSchool Utilizations
DESIREDRANGE
Note: Percent utilization calculated as total enrollment of schools divided by total capacity.Projected capacity factors in capital projects.
ACTUAL PROJECTED2012 2013 2014 2015 2016 2017 2018 2022 2027
0%
20%
40%
60%
80%
100%
120%
140%
160%
Elementary Schools Middle Schools High School

4-22 • Approved Actions and Planning Issues
Little Bennett elementary schools participated in the boundary advisory study in spring 2013. Board of Education action is scheduled for November 2013. The report of the boundary advisory committee is available at the following link: http://www.montgomeryschoolsmd.org/departments/planning/CommunityInfo_Boundary2.shtml
Clarksburg Elementary School Utilization Enrollment at Clarksburg Elementary School is projected to exceed capacity by the end of the six-year CIP period. The degree of enrollment growth at Clarksburg Elementary School did not warrant inclusion of Clarksburg Elementary School in the boundary study for the new Clarks-burg Cluster Elementary School (Clarksburg Cluster Site #1). Relocatable classrooms will be utilized until funding for a new elementary school is requested in a future CIP and after the opening of Clarksburg Cluster Elementary School (Clarksburg Village Site #1) opens.
Clarksburg Cluster Elementary School (Clarksburg Village Site #1)Capital Project: An FY 2013 appropriation was approved for construction funds to begin construction of the new school. The school is scheduled for completion in August 2014.
Non-capital Solution: A boundary study was approved to determine the service area for Clarksburg Cluster Elementary School (Clarksburg Village Site #1). The new school will address overutilization of Cedar Grove and Little Bennett elementary schools. Representatives from Cedar Grove and Little Bennett elementary schools participated in the boundary advisory study in spring 2013. Board of Education action is scheduled for November 2013. The report of the boundary advisory committee is available at the following link: http://www.montgomeryschoolsmd.org/departments/planning/CommunityInfo_Boundary2.shtml
Capt. James E. Daly Elementary SchoolCapital Project: Projections indicate enrollment at Capt. James E. Daly Elementary School will exceed capacity by 92 seats or more by the end of the six-year period. An FY 2012 appropriation was approved for facility planning to determine the feasibility, scope, and cost for a classroom ad-dition. A date for the addition will be considered in a future CIP. Relocatable classrooms will be utilized until additional capacity can be added.
CLARKSBURG CLUSTER
Little Bennett Elementary SchoolCapital Project: Enrollment at Little Bennett Elementary School is projected to exceed capacity by the end of the six-year CIP period. Relocatable classrooms will be utilized until Clarksburg Cluster Elementary School (Clarksburg Village Site #1) opens in August 2014. An FY 2013 appropriation was approved for construction funds to begin construction of the new school. The school is scheduled for completion in August 2014.
Non-capital Solution: A boundary study was approved to determine the service area for Clarksburg Cluster Elementary School (Clarksburg Village Site #1). The new school will address overutilization of Cedar Grove and Little Bennett elementary schools. Representatives from Cedar Grove and Little Bennett elementary schools participated in the boundary advisory study in spring 2013. Board of Education action is scheduled for November 2013. The report of the boundary advisory committee is available at the following link: http://www.montgomeryschoolsmd.org/departments/planning/CommunityInfo_Boundary2.shtml
CAPITAL PROJECTS
School ProjectProject Status
Date of Completion
Clarksburg HS Classroom addition
Approved Aug. 2015
Clarksburg/ Damascus MS
New school Approved Aug. 2016 (delayed)
Clarksburg Cluster ES (Clarksburg Village Site #1)
New school Approved Aug. 2014
Capt. James E. Daly ES
Classroom addition
Proposed TBD
Approved—Project has an FY 2013 or FY 2014 appropriation approved in the FY 2013 or FY 2014 Capital Budget.Programmed—Project has expenditures programmed in a future year of the CIP for planning and/or construction funds.Proposed—Project has facility planning funds approved for FY 2013 or FY 2014 for a feasibility study.

Approved Actions and Planning Issues • 4-23
CLARKSBURG CLUSTER
Projected Enrollment and Space AvailabilityEffects of the Amended FY2013–2018 CIP and Non–CIP Actions on Space Available
Actual
Schools 12–13 13–14 14–15 15–16 16-17 17-18 18-19 2022 2027Clarksburg HS Program Capacity 1575 1575 1575 1980 1980 1980 1980 1980 1980
Enrollment 1905 1955 1911 1846 1926 1967 2076 2200 2500Available Space (330) (380) (336) 134 54 13 (96) (220) (520)Comments Planning Addition
for CompleteAddition Aug. 2015
Clarksburg/Damascus MS Program Capacity 965 965 965 965 965Enrollment 0 0 0 0 0Available Space 965 965 965 965 965Comments Planning Opens
for newschool
Neelsville MS Program Capacity 905 905 905 905 905 905 905 905 905Enrollment 823 842 899 975 991 1022 1059 1100 1100Available Space 82 63 6 (70) (86) (117) (154) (195) (195)Comments
Rocky Hill MS Program Capacity 935 935 935 935 935 935 935 935 935Enrollment 1000 1056 1084 1261 1349 1466 1489 1700 1900Available Space (65) (121) (149) (326) (414) (531) (554) (765) (965)Comments
Cedar Grove ES Program Capacity 422 422 422 422 422 422 422Enrollment 530 610 661 695 745 778 808Available Space (108) (188) (239) (273) (323) (356) (386)Comments Boundary
Study
Clarksburg ES Program Capacity 313 313 313 313 313 313 313Enrollment 266 279 301 321 348 391 435Available Space 47 34 12 (8) (35) (78) (122)Comments
Clarksburg Cluster ES Program Capacity 740 740 740 740 740(Clarksburg Village Site #1) Enrollment 0 0 0 0 0
Available Space 740 740 740 740 740Comments Opens
Capt. James E. Daly ES CSR Program Capacity 471 471 471 471 471 471 471Enrollment 588 617 628 643 659 657 654Available Space (117) (146) (157) (172) (188) (186) (183)Comments
Fox Chapel ES CSR Program Capacity 632 632 632 632 632 632 632Enrollment 623 643 644 627 634 635 620Available Space 9 (11) (12) 5 (2) (3) 12Comments
William B. Gibbs Jr. ES Program Capacity 734 734 734 734 734 734 734Enrollment 766 743 773 757 751 741 742Available Space (32) (9) (39) (23) (17) (7) (8)Comments
Little Bennett ES Program Capacity 673 673 673 673 673 673 673Enrollment 953 1020 1076 1081 1079 1090 1075Available Space (280) (347) (403) (408) (406) (417) (402)Comments Boundary
Study
Cluster Information HS Utilization 121% 124% 121% 93% 97% 99% 105% 111% 126%HS Enrollment 1905 1955 1911 1846 1926 1967 2076 2200 2500MS Utilization 99% 103% 108% 122% 83% 89% 91% 100% 107%MS Enrollment 1823 1898 1983 2236 2340 2488 2548 2800 3000ES Utilization 115% 121% 102% 104% 107% 109% 110% 115% 125%ES Enrollment 3726 3912 4083 4124 4216 4292 4334 4600 5000
Projections
4-24 • Approved Actions and Planning Issues
CLARKSBURG CLUSTER
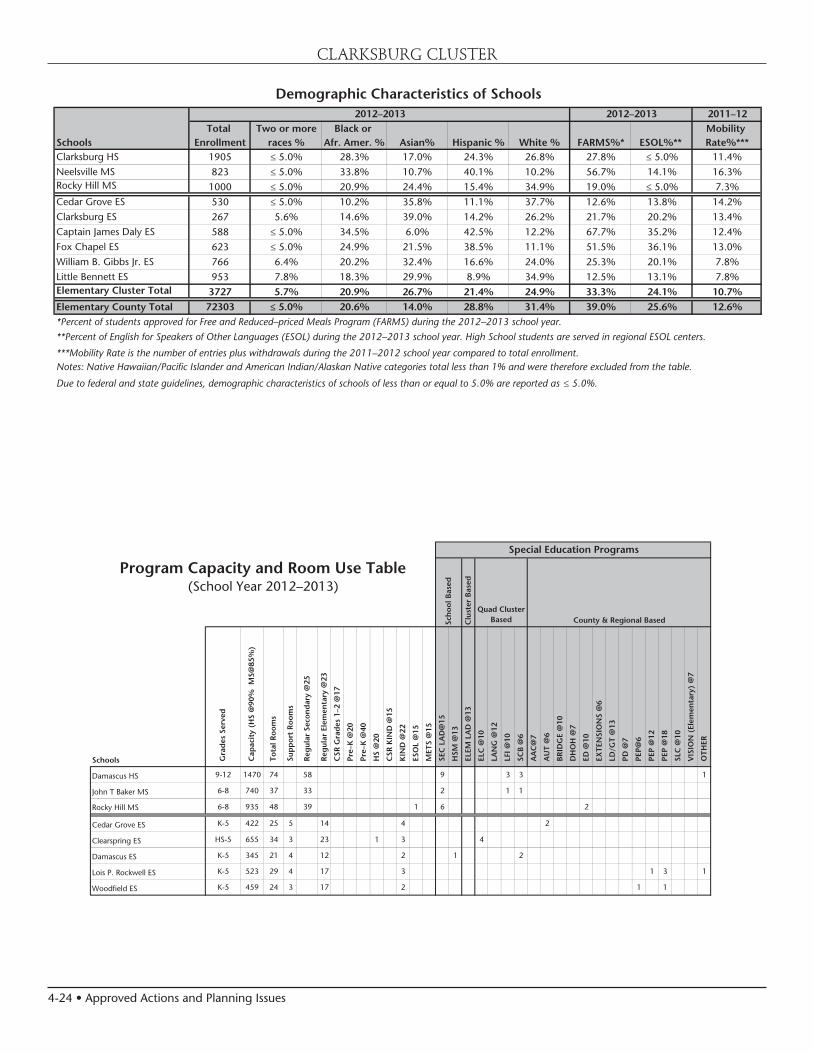
Demographic Characteristics of Schools2011–12
Total Two or more Black or Mobility Schools Enrollment races % Afr. Amer. % Asian% Hispanic % White % FARMS%* ESOL%** Rate%***Clarksburg HS 1905 ≤ 5.0% 28.3% 17.0% 24.3% 26.8% 27.8% ≤ 5.0% 11.4%Neelsville MS 823 ≤ 5.0% 33.8% 10.7% 40.1% 10.2% 56.7% 14.1% 16.3%Rocky Hill MS 1000 ≤ 5.0% 20.9% 24.4% 15.4% 34.9% 19.0% ≤ 5.0% 7.3%Cedar Grove ES 530 ≤ 5.0% 10.2% 35.8% 11.1% 37.7% 12.6% 13.8% 14.2%Clarksburg ES 267 5.6% 14.6% 39.0% 14.2% 26.2% 21.7% 20.2% 13.4%Captain James Daly ES 588 ≤ 5.0% 34.5% 6.0% 42.5% 12.2% 67.7% 35.2% 12.4%Fox Chapel ES 623 ≤ 5.0% 24.9% 21.5% 38.5% 11.1% 51.5% 36.1% 13.0%William B. Gibbs Jr. ES 766 6.4% 20.2% 32.4% 16.6% 24.0% 25.3% 20.1% 7.8%Little Bennett ES 953 7.8% 18.3% 29.9% 8.9% 34.9% 12.5% 13.1% 7.8%Elementary Cluster Total 3727 5.7% 20.9% 26.7% 21.4% 24.9% 33.3% 24.1% 10.7%
Elementary County Total 72303 ≤ 5.0% 20.6% 14.0% 28.8% 31.4% 39.0% 25.6% 12.6%*Percent of students approved for Free and Reduced–priced Meals Program (FARMS) during the 2012–2013 school year.
**Percent of English for Speakers of Other Languages (ESOL) during the 2012–2013 school year. High School students are served in regional ESOL centers.
***Mobility Rate is the number of entries plus withdrawals during the 2011–2012 school year compared to total enrollment.Notes: Native Hawaiian/Pacific Islander and American Indian/Alaskan Native categories total less than 1% and were therefore excluded from the table.
Due to federal and state guidelines, demographic characteristics of schools of less than or equal to 5.0% are reported as ≤ 5.0%.
2012–2013 2012–2013
(School Year 2012–2013)
Schools Gra
des
Ser
ved
Cap
acit
y (H
S @
90%
MS@
85%
)
Tot
al R
oom
s
Sup
por
t R
oom
s
Reg
ular
Sec
ond
ary
@25
Reg
ular
Ele
men
tary
@23
CSR
Gra
des
1–2
@17
Pre
–K @
20
Pre
–K @
40
HS
@20
CSR
KIN
D @
15
KIN
D @
22
ESO
L @
15
MET
S @
15
SEC
LA
D@
15
HSM
@13
ELE
M L
AD
@13
ELC
@10
LA
NG
@12
LFI
@10
SC
B @
6
AA
C@
7
AU
T @
6
BR
IDG
E @
10
DH
OH
@7
ED
@10
EX
TEN
SIO
NS
@6
LD
/GT
@13
PD
@7
PEP
@6
PEP
@12
PEP
@18
SLC
@10
VIS
ION
(El
emen
tary
) @
7
OTH
ER
Damascus HS 9-12 1470 74 58 9 3 3 1
John T Baker MS 6-8 740 37 33 2 1 1
Rocky Hill MS 6-8 935 48 39 1 6 2
Cedar Grove ES K-5 422 25 5 14 4 2
Clearspring ES HS-5 655 34 3 23 1 3 4
Damascus ES K-5 345 21 4 12 2 1 2
Lois P. Rockwell ES K-5 523 29 4 17 3 1 3 1
Woodfield ES K-5 459 24 3 17 2 1 1
Program Capacity and Room Use Table
Sch
ool B
ased
Quad Cluster BasedC
lust
er B
ased
Special Education Programs
County & Regional Based

Approved Actions and Planning Issues • 4-25
CLARKSBURG CLUSTER
Year Year Total Site Reloc- Linkages to Home
Facility Reopened/ Square Size Adjacent atable Learning School
Schools Opened Modernized Footage Acres Park Classrooms Program Model
Clarksburg HS 1995 2006 344,574 62.73 11
Neelsville MS 1981 131,432 29.2
Rocky Hill MS 2004 148,065 23.3 7
Cedar Grove ES 1960 1987 57,037 10.1 4
Clarksburg ES 1952 1993 54,983 9.97 4
Captain James Daly ES 1989 78,210 10 Yes 4
Fox Chapel ES 1974 85,182 10.34 Yes Yes Yes
William B. Gibbs Jr. ES 2009 88,042 10.75 Yes
Little Bennett ES 2006 82,511 4.81 Yes 8 Yes
Facility Characteristics of Schools 2012–2013
4-26 • Approved Actions and Planning Issues
n
nm
nm
nm
nm
nm
nm
nm
nm
Damascus HS
Rocky Hill MS
John T Baker MS
Laytonsville ES
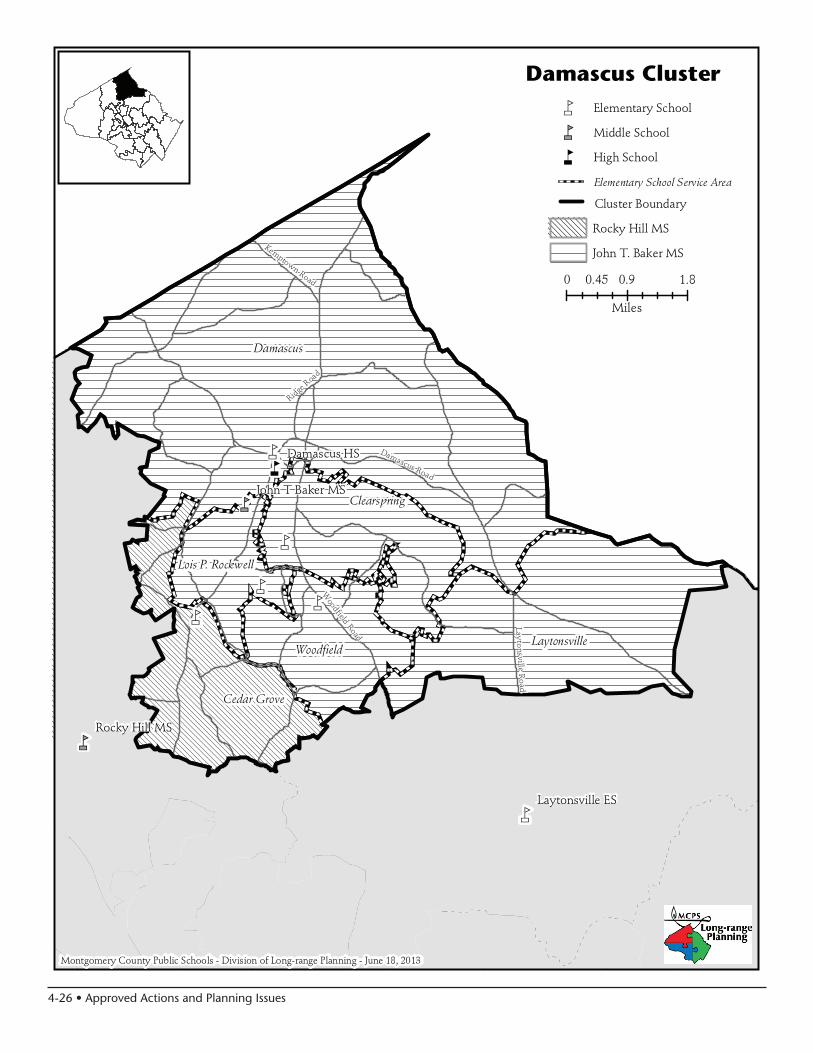
Damascus Cluster
Montgomery County Public Schools - Division of Long-range Planning - June 18, 2013
Elementary School Service Area
Rocky Hill MS
John T. Baker MS
nm Elementary School
nm Middle School
n High School
Cluster Boundary
0 0.9 1.80.45
Miles
Laytonsville
Cedar Grove
Clearspring
Damascus
Lois P. Rockwell
Woodfield
Kemptown Road
Ridge R
oad
Damascus Road
Woodfield Road
Laytonsville Road
Approved Actions and Planning Issues • 4-27
SCHOOLS
Clarksburg/Damascus Middle SchoolCapital Project: Projections indicate that enrollment at Rocky Hill Middle School will exceed capacity throughout the six-year CIP period. A new school is needed to address middle school space shortages in the cluster. Although the opening date was previously planned for August 2015, due to fiscal constraints in the county, the opening of the school was delayed by one year to August 2016. An FY 2013 ap-propriation was approved for planning funds to begin the architectural design of the school. In order for this project to be completed on schedule, county and state funding must be provided at the levels approved in this CIP.
Cedar Grove Elementary SchoolCapital Project: Enrollment at Cedar Grove Elementary School is projected to exceed capacity by the end of the six-year CIP period. Relocatable class-rooms will be utilized until Clarksburg Cluster Elementary School (Clarksburg Village Site #1) opens in August 2014. An FY 2013 appropriation was approved for construction funds to begin construction of the new school. The school is scheduled for completion in August 2014.
Non-capital Solution: A boundary study was approved to determine the service area for Clarksburg Cluster Elementary School (Clarksburg Village Site #1). The new school will address overutilization of Cedar Grove and Little Bennett elementary schools. Repre-sentatives from Cedar Grove and Little Bennett elementary schools participated in the boundary advisory study in spring 2013. Board of Educa-tion action is scheduled for November 2013. The report of the boundary advisory committee is available at the following link: http://www.montgomeryschoolsmd.org/departments/ planning/CommunityInfo_Boundary2.shtml
Damascus Elementary SchoolCapital Project: A modernization project is scheduled for this school with a completion date of January 2021. FY 2016 expenditures are programmed for facility planning for a feasibility study to determine the scope and cost of the project. In order for this project to be completed on schedule, county and state funding must be provided at the levels approved in this CIP.
CAPITAL PROJECTS
School Project Project Status*Date of Completion
Clarksburg/ Damascus MS New school Approved
Aug. 2016 (delayed)
Clarksburg Cluster ES (Clarksburg Village Site #1)
New school Approved Aug. 2014
Damascus ES Modernization Programmed Jan. 2021
Approved—Project has an FY 2013 or FY 2014 appropriation approved in the FY 2013 or FY 2014 Capital Budget.Programmed—Project has expenditures programmed in a future year of the CIP for planning and/or construction funds.Proposed—Project has facility planning funds approved for FY 2013 or FY 2014 for a feasibility study.
DESIREDRANGE
Note: Percent utilization calculated as total enrollment of schools divided by total capacity.Projected capacity factors in capital projects.
ACTUAL PROJECTED2012 2013 2014 2015 2016 2017 2018 2022 2027
0%
20%
40%
60%
80%
100%
120%
140%
160%
Elementary Schools Middle Schools High School
Damascus ClusterSchool Utilizations
DAMASCUS CLUSTER
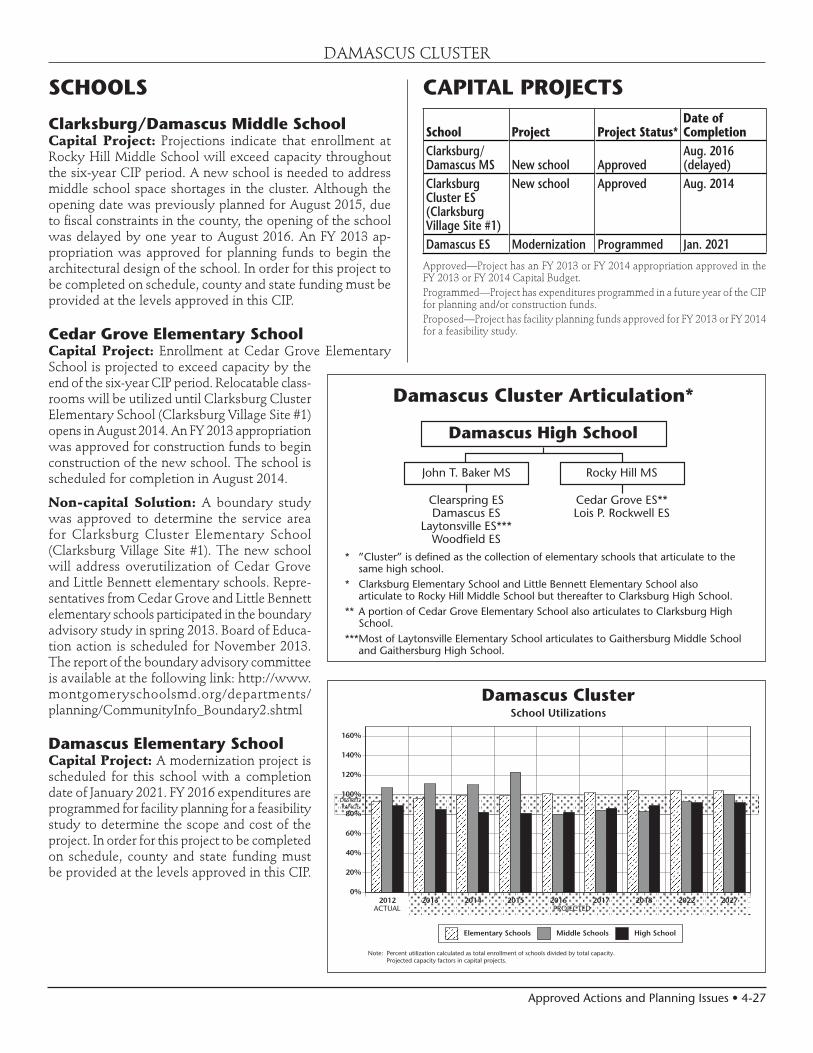
Damascus Cluster Articulation*
Damascus High School
Rocky Hill MS
Cedar Grove ES**Lois P. Rockwell ES
John T. Baker MS
Clearspring ESDamascus ES
Laytonsville ES***Woodfield ES
* ”Cluster” is defined as the collection of elementary schools that articulate to the same high school.
* Clarksburg Elementary School and Little Bennett Elementary School also articulate to Rocky Hill Middle School but thereafter to Clarksburg High School.
** A portion of Cedar Grove Elementary School also articulates to Clarksburg High School.
***Most of Laytonsville Elementary School articulates to Gaithersburg Middle School and Gaithersburg High School.
4-28 • Approved Actions and Planning Issues
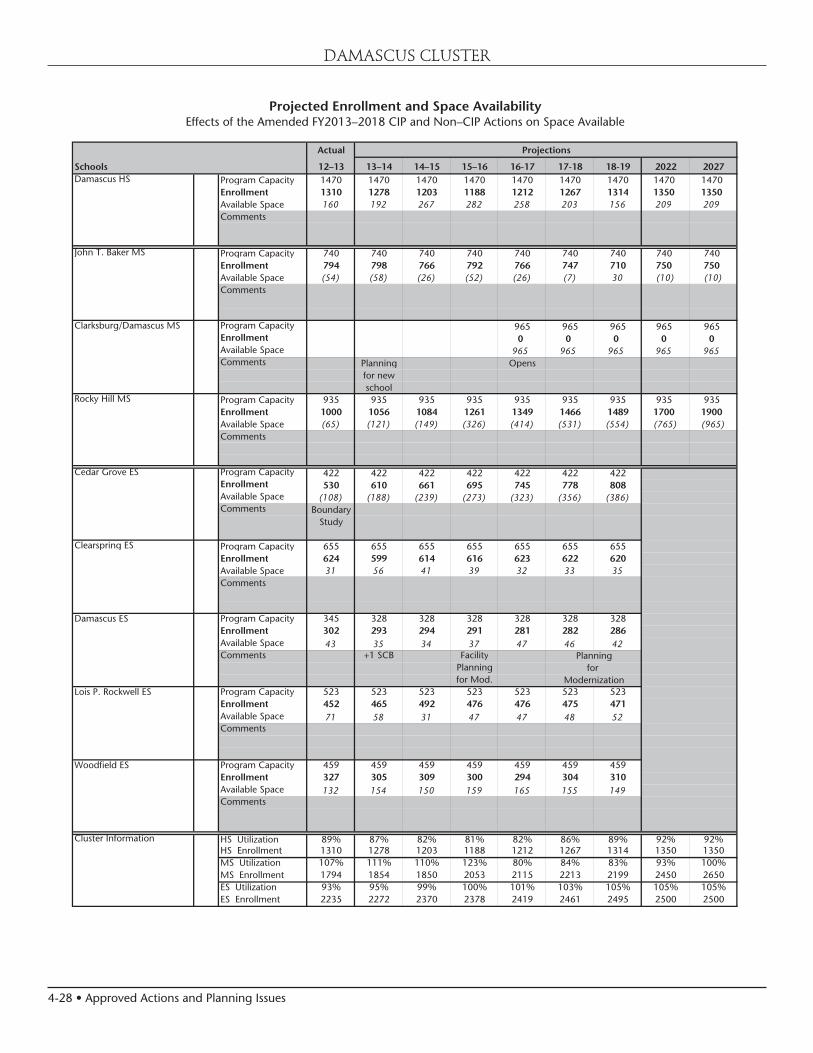
Projected Enrollment and Space AvailabilityEffects of the Amended FY2013–2018 CIP and Non–CIP Actions on Space Available
Actual
Schools 12–13 13–14 14–15 15–16 16-17 17-18 18-19 2022 2027Damascus HS Program Capacity 1470 1470 1470 1470 1470 1470 1470 1470 1470
Enrollment 1310 1278 1203 1188 1212 1267 1314 1350 1350Available Space 160 192 267 282 258 203 156 209 209Comments
John T. Baker MS Program Capacity 740 740 740 740 740 740 740 740 740Enrollment 794 798 766 792 766 747 710 750 750Available Space (54) (58) (26) (52) (26) (7) 30 (10) (10)Comments
Clarksburg/Damascus MS Program Capacity 965 965 965 965 965Enrollment 0 0 0 0 0Available Space 965 965 965 965 965Comments Planning Opens
for newschool
Rocky Hill MS Program Capacity 935 935 935 935 935 935 935 935 935Enrollment 1000 1056 1084 1261 1349 1466 1489 1700 1900Available Space (65) (121) (149) (326) (414) (531) (554) (765) (965)Comments
Cedar Grove ES Program Capacity 422 422 422 422 422 422 422Enrollment 530 610 661 695 745 778 808Available Space (108) (188) (239) (273) (323) (356) (386)Comments Boundary
Study
Clearspring ES Program Capacity 655 655 655 655 655 655 655Enrollment 624 599 614 616 623 622 620Available Space 31 56 41 39 32 33 35Comments
Damascus ES Program Capacity 345 328 328 328 328 328 328Enrollment 302 293 294 291 281 282 286Available Space 43 35 34 37 47 46 42Comments +1 SCB Facility
Planningfor Mod.
Lois P. Rockwell ES Program Capacity 523 523 523 523 523 523 523Enrollment 452 465 492 476 476 475 471Available Space 71 58 31 47 47 48 52Comments
Woodfield ES Program Capacity 459 459 459 459 459 459 459Enrollment 327 305 309 300 294 304 310Available Space 132 154 150 159 165 155 149Comments
Cluster Information HS Utilization 89% 87% 82% 81% 82% 86% 89% 92% 92%HS Enrollment 1310 1278 1203 1188 1212 1267 1314 1350 1350MS Utilization 107% 111% 110% 123% 80% 84% 83% 93% 100%MS Enrollment 1794 1854 1850 2053 2115 2213 2199 2450 2650ES Utilization 93% 95% 99% 100% 101% 103% 105% 105% 105%ES Enrollment 2235 2272 2370 2378 2419 2461 2495 2500 2500
Projections
Planningfor
Modernization
DAMASCUS CLUSTER

Approved Actions and Planning Issues • 4-29
DAMASCUS CLUSTER
Demographic Characteristics of Schools2011–12
Total Two or more Black or Mobility Schools Enrollment races % Afr. Amer. % Asian% Hispanic % White % FARMS%* ESOL%** Rate%***Damascus HS 1310 ≤ 5.0% 9.4% 5.2% 13.4% 67.1% 12.6% ≤ 5.0% 6.0%John T Baker MS 794 ≤ 5.0% 9.2% ≤ 5.0% 16.8% 64.4% 17.8% ≤ 5.0% 6.1%Rocky Hill MS 1000 ≤ 5.0% 20.9% 24.4% 15.4% 34.9% 19.0% ≤ 5.0% 7.3%Cedar Grove ES 530 ≤ 5.0% 10.2% 35.8% 11.1% 37.7% 12.6% 13.8% 14.2%Clearspring ES 624 6.9% 11.9% 14.1% 18.8% 48.2% 20.0% 9.3% 7.2%Damascus ES 302 ≤ 5.0% ≤ 5.0% ≤ 5.0% 24.2% 63.9% 26.2% 16.9% 11.1%Lois P. Rockwell ES 452 6.2% 12.6% 10.4% 21.5% 48.9% 23.5% 17.5% 7.4%Woodfield ES 327 ≤ 5.0% 8.6% ≤ 5.0% 16.5% 65.7% 18.7% 7.0% ≤ 5.0%Elementary Cluster Total 2235 5.5% 10.2% 15.6% 17.9% 50.6% 20.4% 13.2% 8.6%
Elementary County Total 72303 ≤ 5.0% 20.6% 14.0% 28.8% 31.4% 39.0% 25.6% 12.6%*Percent of students approved for Free and Reduced–priced Meals Program (FARMS) during the 2012–2013 school year.
**Percent of English for Speakers of Other Languages (ESOL) during the 2012–2013 school year. High School students are served in regional ESOL centers.
***Mobility Rate is the number of entries plus withdrawals during the 2011–2012 school year compared to total enrollment.Notes: Native Hawaiian/Pacific Islander and American Indian/Alaskan Native categories total less than 1% and were therefore excluded from the table.
Due to federal and state guidelines, demographic characteristics of schools of less than or equal to 5.0% are reported as ≤ 5.0%.
2012–2013 2012–2013
(School Year 2012–2013)
Schools Gra
des
Ser
ved
Cap
acit
y (H
S @
90%
MS@
85%
)
Tot
al R
oom
s
Sup
por
t R
oom
s
Reg
ular
Sec
ond
ary
@25
Reg
ular
Ele
men
tary
@23
CSR
Gra
des
1–2
@17
Pre
–K @
20
Pre
–K @
40
HS
@20
CSR
KIN
D @
15
KIN
D @
22
ESO
L @
15
MET
S @
15
SEC
LA
D@
15
HSM
@13
ELE
M L
AD
@13
ELC
@10
LA
NG
@12
LFI
@10
SC
B @
6
AA
C@
7
AU
T @
6
BR
IDG
E @
10
DH
OH
@7
ED
@10
EX
TEN
SIO
NS
@6
LD
/GT
@13
PD
@7
PEP
@6
PEP
@12
PEP
@18
SLC
@10
VIS
ION
(El
emen
tary
) @
7
OTH
ER
Damascus HS 9-12 1470 74 58 9 3 3 1
John T Baker MS 6-8 740 37 33 2 1 1
Rocky Hill MS 6-8 935 48 39 1 6 2
Cedar Grove ES K-5 422 25 5 14 4 2
Clearspring ES HS-5 655 34 3 23 1 3 4
Damascus ES K-5 345 21 4 12 2 1 2
Lois P. Rockwell ES K-5 523 29 4 17 3 1 3 1
Woodfield ES K-5 459 24 3 17 2 1 1
Program Capacity and Room Use Table
Sch
ool B
ased
Quad Cluster BasedC
lust
er B
ased
Special Education Programs
County & Regional Based

4-30 • Approved Actions and Planning Issues
DAMASCUS CLUSTER
Year Year Total Site Reloc- Linkages to Home
Facility Reopened/ Square Size Adjacent atable Learning School
Schools Opened Modernized Footage Acres Park Classrooms Program Model
Damascus HS 1950 1978 235,986 32.7
John T Baker MS 1971 120,532 22 Yes
Rocky Hill MS 2004 148,065 23.3 7
Cedar Grove ES 1960 1987 57,037 10.1 4
Clearspring ES 1988 77,535 10 Yes
Damascus ES 1934 1980 53,239 9.4 Yes
Lois P. Rockwell ES 1992 75,520 10.6
Woodfield ES 1962 1985 53,212 10
Facility Characteristics of Schools 2012–2013


4-32 • Approved Actions and Planning Issues
n
n
nm
nm
nm
nm
nm
nm
n
nm
n
n
nm
nm
Montgomery County Public Schools - Division of Long-range Planning - June 18, 2013
Eastern MS
Argyle MS
Col. E. Brooke Lee MSA. Mario
Loiederman MS
Newport Mill MS
Parkland MS
Silver SpringInternational MS
Sligo MS
Takoma Park MS
Sligo
Downcounty ConsortiumSecondary Schools
nm High School
nm Middle School
Middle School Service Area
Montgomery Blair HS Base Area
Albert Einstein HS Base Area
John F. Kennedy HS Base Area
Northwood HS Base Area
Wheaton HS Base Area
Parkland MS
Parkland MS
Argyle MS
John F. Kennedy HSA. Mario Loiderman MS
Wheaton HS
Col. E. Brooke Lee MS
Newport Mill MS
Albert Einstein HS Northwood HS
Sligo MS
Montgomery Blair HS
Eastern MS
Silver Spring International MS
Takoma Park MS
New
Ham
pshi
re A
ve
University Blvd East
Colesville
Rd
Georgia A
ve
UniversityBlvd West
Viers Mill Rd
Connecticut
Avenue
Layh
ill R
d
¥495
Miles
0 1 20.5

Approved Actions and Planning Issues • 4-33
!«nm!n
!«nmnm!«nm
!n !«nmnm
nm nm
nm
nm
nm
nm
!«nm
!n
nm
nm
nm
nm
nm
nm nm
nm
!n
!n
nm
nm
nmnm
nm
nm
nm nm
!n
!«nm
nm
nm
nm
nm
!«nm
nm
nm
nm
nm
nm
nm
nm
nm
nm
nm
nm
nm
nm
!«nm
nm
nm
nm
Highland
View
Kemp Mill
Oakland Terrace
Rock View
RollingTerrace
Arcola
Forest Knolls
Georgian Forest
Glen Haven
Glenallan
Harmony
Hills
Highland
Sargent Shriver
Sligo Creek
Viers Mill
Weller
Road
Wheaton
Woods
Woodlin
Brookhaven
Georgian ForestHarmony Hills
Brookhaven
Arcola
Sligo Creek
Strathmore ES
Bel Pre ES
Pine Crest ES
Montgomery Knolls ESOak
View
NewHampshireEstatesEast Silver Spring
Takoma Park ES
Piney Branch ES
Downcounty ConsortiumElementary Schools
Elementary School Service Area
Montgomery County Public Schools - Division of Long-range Planning - June 18, 2013
0 1 20.5
Miles
!«nm Paired K-2
!n Paired 3-5
nm Elementary SchoolBel Pre/Strathmore
Takoma Park/Piney Branch
Montgomery Knolls/Pine Crest
New
Ham
pshi
re A
ve
Pine
y Br
anch
Rd
University Blvd East
Col
esvi
lle R
dG
eorgia Ave
University
Blvd West
Viers Mill Rd
Connecticut
Avenue
Layh
ill R
d
¥495
HS/ES Service Area
Flora M. Singer

4-34 • Approved Actions and Planning Issues
DESIREDRANGE
Note: Percent utilization calculated as total enrollment of schools divided by total capacity.Projected capacity factors in capital projects.
ACTUAL PROJECTED2012 2013 2014 2015 2016 2017 2018 2022 2027
0%
20%
40%
60%
80%
100%
120%
140%
160%
Elementary Schools Middle School High School
Downcounty ConsortiumSchool Utilizations
DOWNCOUNTY CONSORTIUM
CONSORTIUM PLANNING ISSUESThe Downcounty Consortium provides a program delivery model for five high schools in the Silver Spring and Whea-ton area. Students living in this area of the county are able to choose which of five high schools they wish to attend, based on different academy programs offered at the high schools. The Downcounty Consortium choice programs are offered at Montgomery Blair, Albert Einstein, John F. Kennedy, Northwood, and Wheaton high schools. Choice patterns are monitored for the impact on projected enrollment and facil-ity utilization.
A high school base area map and middle school articulation diagram are included for the five consortium high schools. Students residing in a base area are guaranteed to attend the high school located serving that base area, if it is their first choice.
The Middle Schools Magnet Consortium (MSMC) includes three middle schools—Argyle, A. Mario Loiederman, and Parkland middle schools. The programs at these schools are open to all middle school students in the county.
Planning Issue: A comprehensive capacity study to address overutilization at several elementary schools in the Down-county Consortium will be conducted during the 2012–2013 school year. The following schools are included in the scope of the study: Arcola, Brookhaven, Forest Knolls, Georgian Forest, Glen Haven, Glenallan, Harmony Hills, Highland, Kemp Mill, Sargent Shriver, Weller Road, and Wheaton Woods elementary schools. A detailed description of the purpose and process for the comprehensive study is included in the Supplement to the CIP at the following link: http://www.montgomeryschoolsmd.org/departments/planning/Index2.shtml
SCHOOLSMontgomery Blair High SchoolPlanning Issue: Enrollment at Montgom-ery Blair High School is projected to exceed capacity by more than 200 seats by the end of the six-year planning period. Enrollment and choice patterns will be monitored to determine whether it is necessary to relieve overutilization at Montgomery Blair High School in the future.
Wheaton High SchoolPlanning Study: Wheaton High School and Thomas Edison High School of Tech-nology (TEHST) are currently located on the same site and share one facility. These schools are scheduled for modernization. During the past two years, two major plan-ning studies were conducted to prepare for the modernization of these schools.
During the fall and winter 2010–2011, a Roundtable Discus-sion, with broad stakeholder involvement, met to explore various approaches for the future relationship between the two schools. Following the Roundtable review, the Board of Education took action on March 28, 2011, to keep the two schools separate with distinct identities and directed staff to conduct a feasibility study to review two options—a one-building option and a two-building option. At the conclusion of the feasibility study, on September 13, 2011, the Board of Education adopted a two-building option for the modern-izations of Wheaton High School and Thomas Edison High School of Technology.
Capital Project: An FY 2014 appropriation for construction funds is approved to begin the construction of the replacement facilities for Wheaton High School and Thomas Edison High School of Technology. The completion dates for these schools are scheduled for August 2015 for the Wheaton High School facility, August 2017 for the Thomas Edison High School of Technology facility, and August 2018 for restoration of the site. In order for this project to be completed on the new schedule, county and state funding must be provided at levels approved in this CIP.
Capital Project: An FY 2014 appropriation for construc-tion funds is programmed in the Department of Health and Human Services (DHHS) Capital Budget for a School-based Wellness Center at Wheaton High School. The design and construction of the Wellness Center are included as part of the replacement facility.
Eastern Middle SchoolCapital Project: A modernization project was scheduled for this school for completion in August 2019. However, due to fiscal constraints in the county, the modernization was delayed by two years to August 2021. FY 2017 expenditures are programmed for facility planning funds to determine the

Approved Actions and Planning Issues • 4-35
DOWNCOUNTY CONSORTIUM
�����������������������������������������������������������������������������������
����������������������������������
������������������������ ����������������������������
������� ��������������������������
��������������������
����������� �������� ��������� ������ ������������ ������������� ������������� �������� �������������������������� �� ��� ���� ��
��� ��� ������������������ � ������� � �������� �� ��� ������������� � ����������� � � ������������������ ������������� ���������� � ���������������� �� ������������� � �������� �� ������������ �
������� � ���������� � ���������� � ����������� � ���������������� �� ������������ ���������� � ���������������� � �������� ����������� �
� ����������������������������������������������������������������������������������������������������������������������������������������
�������������������������������������������������������������������������������������������������������������������������������������������������������������������������������������������������������������������������������������������������������������������������������������������������������������
scope and cost for the modernization. In order for this project to be completed on schedule, county and state funding must be provided at the levels approved in this CIP.
A. Mario Loiederman Middle SchoolCapital Project: Projections indicate enrollment at A. Mario Loiderman Middle School will exceed capacity by 150 seats or more by the end of the six-year period. An FY 2014 ap-propriation is approved for facility planning to determine the feasibility, scope, and cost for a classroom addition. A date for the addition will be considered in a future CIP. Relocat-able classrooms will be utilized until additional capacity can be added.
Newport Mill Middle SchoolNon-capital Solution: On November 17, 2011, the Board of Education adopted boundary changes for Oakland Terrace Elementary School, Newport Mill and Sligo middle schools, and created the service area for Flora M. Singer Elementary School. The boundary changes for the middle school will be phased in, beginning in the 2014–2015 school year.
Silver Spring International Middle SchoolNon-capital Solution: In November 2009, the Board of Education adopted boundary changes to relieve overutiliza-tion at Sligo Creek Elementary School. The boundary changes went into effect at the elementary school level, beginning in August 2010 and began phasing in at the middle school level, beginning in August 2012.
Sligo Middle SchoolNon-capital Solution: On November 17, 2011, the Board of Education adopted boundary changes for Oakland Terrace Elementary School, Newport Mill and Sligo middle schools, and created the service area for Flora M. Singer Elementary
School. The boundary changes for the middle school will be phased in, beginning in the 2014–2015 school year.
Takoma Park Middle SchoolNon-capital Solution: In November 2009, the Board of Education adopted boundary changes to relieve overutiliza-tion at Sligo Creek Elementary School. The boundary changes went into effect at the elementary school level, beginning in August 2010 and began phasing in at the middle school level, beginning in August 2012.
Arcola Elementary SchoolCapital Project: An FY 2014 appropriation for funds is approved for the construction of a classroom addition. The scheduled completion date for the addition is August 2015. Even with the addition, the enrollment at Arcola Elementary School will exceed the new capacity. Relocatable classrooms will continue to be utilized until a plan is developed as part of the comprehensive Downcounty Consortium Capacity Study.
Planning Issue: A comprehensive capacity study to address overutilization at several elementary schools in the Down-county Consortium was conducted during the 2012–2013 school year. The following schools were included in the scope of the study: Arcola, Brookhaven, Forest Knolls, Georgian Forest, Glen Haven, Glenallan, Harmony Hills, Highland, Kemp Mill, Sargent Shriver, Weller Road, and Wheaton Woods elementary school. A detailed description of the purpose and process for the comprehensive study is included in the Supplement to the CIP at the following link: http://www.montgomeryschoolsmd.org/departments/planning/ CIPMaster_Current2.shtml

4-36 • Approved Actions and Planning Issues
DOWNCOUNTY CONSORTIUM
Bel Pre Elementary SchoolCapital Project: A modernization project is scheduled for this school with a completion date of August 2014. An FY 2013 appropriation for construction funds was approved to construct the modernization. Projections indicate that enrollment at Bel Pre Elementary School will exceed capacity by 92 seats or more throughout the six-year CIP period. Relocatable classrooms will be utilized until additional capacity can be added as part of the modernization.
Brookhaven Elementary SchoolPlanning Study: A comprehensive capacity study to address overutilization at several elementary schools in the Down-county Consortium was conducted during the 2012–2013 school year. The following schools were included in the scope of the study: Arcola, Brookhaven, Forest Knolls, Georgian Forest, Glen Haven, Glenallan, Harmony Hills, Highland, Kemp Mill, Sargent Shriver, Weller Road, and Wheaton Woods elementary schools. A detailed description of the purpose and process for the comprehensive study is included in the Supplement to the CIP at the following link: http://www.montgomeryschoolsmd.org/departments/planning/ CIPMaster_Current2.shtml
Forest Knolls Elementary SchoolPlanning Study: A comprehensive capacity study to address overutilization at several elementary schools in the Down-county Consortium was conducted during the 2012–2013 school year. The following schools were included in the scope of the study: Arcola, Brookhaven, Forest Knolls, Georgian Forest, Glen Haven, Glenallan, Harmony Hills, Highland, Kemp Mill, Sargent Shriver, Weller Road, and Wheaton Woods elementary schools. A detailed description of the purpose and process for the comprehensive study is included in the Supplement to the CIP at the following link: http://www.montgomeryschoolsmd.org/departments/planning/ CIPMaster_Current2.shtml
Georgian Forest Elementary SchoolCapital Project: Projections indicate enrollment at Georgian Forest Elementary School will exceed capacity by 92 seats or more by the end of the six-year CIP planning period. An FY 2012 appropriation was approved for construction funds to begin the construction of the classroom addition. The scheduled completion date is August 2013. Relocatable classrooms will be utilized until additional capacity can be added.
Planning Study: A comprehensive capacity study to address overutilization at several elementary schools in the Down-county Consortium was conducted during the 2012–2013 school year. The following schools were included in the scope of the study: Arcola, Brookhaven, Forest Knolls, Georgian Forest, Glen Haven, Glenallan, Harmony Hills, Highland, Kemp Mill, Sargent Shriver, Weller Road, and Wheaton Woods elementary schools. A detailed description of the purpose and process for the comprehensive study is included
in the Supplement to the CIP at the following link: http://www.montgomeryschoolsmd.org/departments/planning/ CIPMaster_Current2.shtml
Glen Haven Elementary SchoolPlanning Study: A comprehensive capacity study to address overutilization at several elementary schools in the Down-county Consortium was conducted during the 2012–2013 school year. The following schools were included in the scope of the study: Arcola, Brookhaven, Forest Knolls, Georgian Forest, Glen Haven, Glenallan, Harmony Hills, Highland, Kemp Mill, Sargent Shriver, Weller Road, and Wheaton Woods elementary schools. A detailed description of the purpose and process for the comprehensive study is included in the Supplement to the CIP at the following link: http://www.montgomeryschoolsmd.org/departments/planning/ CIPMaster_Current2.shtml
Glenallan Elementary SchoolCapital Project: Projections indicate enrollment at Glenal-lan Elementary School will exceed capacity by at least four classrooms by the end of the six-year period. Relocatable classrooms will be utilized until additional capacity can be added as part of the modernization project. A modernization project is scheduled for this school with a completion date of August 2013. An FY 2012 appropriation was approved for con-struction funds to begin the construction of the modernization.
Planning Study: A comprehensive capacity study to address overutilization at several elementary schools in the Down-county Consortium was conducted during the 2012–2013 school year. The following schools were included in the scope of the study: Arcola, Brookhaven, Forest Knolls, Georgian Forest, Glen Haven, Glenallan, Harmony Hills, Highland, Kemp Mill, Sargent Shriver, Weller Road, and Wheaton Woods elementary schools. A detailed description of the purpose and process for the comprehensive study is included in the Supplement to the CIP at the following link: http://www.montgomeryschoolsmd.org/departments/planning/ CIPMaster_Current2.shtml
Harmony Hills Elementary SchoolPlanning Study: A comprehensive capacity study to address overutilization at several elementary schools in the Down-county Consortium was conducted during the 2012–2013 school year. The following schools were included in the scope of the study: Arcola, Brookhaven, Forest Knolls, Georgian Forest, Glen Haven, Glenallan, Harmony Hills, Highland, Kemp Mill, Sargent Shriver, Weller Road, and Wheaton Woods elementary schools. A detailed description of the purpose and process for the comprehensive study is included in the Supplement to the CIP at the following link: http://www.montgomeryschoolsmd.org/departments/planning/ CIPMaster_Current2.shtml
Approved Actions and Planning Issues • 4-37
DOWNCOUNTY CONSORTIUM
Highland Elementary SchoolPlanning Study: A comprehensive capacity study to address overutilization at several elementary schools in the Down-county Consortium was conducted during the 2012–2013 school year. The following schools were included in the scope of the study: Arcola, Brookhaven, Forest Knolls, Georgian Forest, Glen Haven, Glenallan, Harmony Hills, Highland, Kemp Mill, Sargent Shriver, Weller Road, and Wheaton Woods elementary schools. A detailed description of the purpose and process for the comprehensive study is included in the Supplement to the CIP at the following link: http://www.montgomeryschoolsmd.org/departments/planning/ CIPMaster_Current2.shtml
Highland View Elementary SchoolCapital Project: Projections indicate enrollment at Highland View Elementary School will exceed capacity by 92 seats or more by the end of the six-year period. FY 2015 expenditures for planning funds are programmed to begin the architec-tural design of a classroom addition project. The scheduled completion date for the addition is August 2017. In order for this project to be completed on schedule, county and state funding must be provided at the levels approved in this CIP.
Kemp Mill Elementary SchoolPlanning Study: A comprehensive capacity study to address overutilization at several elementary schools in the Down-county Consortium was conducted during the 2012–2013 school year. The following schools were included in the scope of the study: Arcola, Brookhaven, Forest Knolls, Georgian Forest, Glen Haven, Glenallan, Harmony Hills, Highland, Kemp Mill, Sargent Shriver, Weller Road, and Wheaton Woods elementary schools. A detailed description of the purpose and process for the comprehensive study is included in the Supplement to the CIP at the following link: http://www.montgomeryschoolsmd.org/departments/planning/ CIPMaster_Current2.shtml
Oak View Elementary SchoolPlanning Study: Oak View Elementary School, that serves Grades 3–5 students, is paired with New Hampshire Estates Elementary School that serves Grades pre-K–2 students. A roundtable discussion was approved to review the enrollment, demographic, and facility impact of unpairing New Hampshire Estates and Oak View elementary schools. Representatives from the New Hampshire Estates and Oak View elementary schools Parent Teacher Association, a representative from the Pre-K Neighborhood School Initiative, and Montgomery Blair cluster coordinators served on the roundtable discussion. The roundtable discussion occurred in spring 2013. The report of the roundtable discussion is available at the following link: http://www.montgomeryschoolsmd.org/departments/ planning/CommunityInfo_Roundtable.shtml
New Hampshire Estates Elementary SchoolPlanning Study: New Hampshire Estates Elementary School, that serves Grades pre-K–2 students, is paired with Oak View Elementary School that serves Grades 3–5 students. A roundtable discussion was approved to review the enrollment, demographic, and facility impact of unpairing New Hampshire Estates and Oak View elementary schools. Representatives from the New Hampshire Estates and Oak View elementary schools Parent Teacher Association, a representative from the Pre-K Neighborhood School Initiative, and Montgomery Blair cluster coordinators served on the roundtable discussion. The roundtable discussion occurred in spring 2013. The report of the roundtable discussion is available at the following link: http://www.montgomeryschoolsmd.org/departments/ planning/CommunityInfo_Roundtable.shtml
Rolling Terrace Elementary SchoolCapital Project: Projections indicate enrollment at Rolling Terrace Elementary School will exceed capacity by 92 seats or more by the end of the six-year period. An FY 2014 ap-propriation is approved for facility planning to determine the feasibility, scope, and cost for a classroom addition. A date for the addition will be considered in a future CIP. Relocat-able classrooms will be utilized until additional capacity can be added.
Sargent Shriver Elementary SchoolPlanning Study: A comprehensive capacity study to address overutilization at several elementary schools in the Down-county Consortium was conducted during the 2012–2013 school year. The following schools were included in the scope of the study: Arcola, Brookhaven, Forest Knolls, Georgian Forest, Glen Haven, Glenallan, Harmony Hills, Highland, Kemp Mill, Sargent Shriver, Weller Road, and Wheaton Woods elementary schools. A detailed description of the purpose and process for the comprehensive study is included in the Supplement to the CIP at the following link: http://www.montgomeryschoolsmd.org/departments/planning/ CIPMaster_Current2.shtml
Viers Mill Elementary SchoolCapital Project: Projections indicate enrollment at Viers Mill Elementary School will exceed capacity by 92 seats or more by the end of the six-year period. An FY 2012 appropriation was approved for construction funds to begin the construction of the classroom addition. The scheduled completion date for the addition is August 2013. Relocatable classrooms will be utilized until additional capacity can be added.

4-38 • Approved Actions and Planning Issues
Weller Road Elementary SchoolCapital Project: A modernization project is scheduled for this school with a completion date of August 2013. An FY 2012 appropriation was approved for construction funds to begin the construction of the modernization.
Planning Study: A comprehensive capacity study to address overutilization at several elementary schools in the Down-county Consortium was conducted during the 2012–2013 school year. The following schools were included in the scope of the study: Arcola, Brookhaven, Forest Knolls, Georgian Forest, Glen Haven, Glenallan, Harmony Hills, Highland, Kemp Mill, Sargent Shriver, Weller Road, and Wheaton Woods elementary schools. A detailed description of the purpose and process for the comprehensive study is included in the Supplement to the CIP at the following link: http://www.montgomeryschoolsmd.org/departments/planning/ CIPMaster_Current2.shtml
Wheaton Woods Elementary SchoolCapital Project: A modernization project is scheduled for this school with a completion date of August 2016. An FY 2013 appropriation was approved for planning funds to begin the architectural design for the modernization. In order for this project to be completed on schedule, county and state funding must be provided at the levels approved in this CIP.
Planning Study: A comprehensive capacity study to address overutilization at several elementary schools in the Down-county Consortium was conducted during the 2012–2013 school year. The following schools were included in the scope of the study: Arcola, Brookhaven, Forest Knolls, Georgian Forest, Glen Haven, Glenallan, Harmony Hills, Highland, Kemp Mill, Sargent Shriver, Weller Road, and Wheaton Woods elementary schools. A detailed description of the purpose and process for the comprehensive study is included in the Supplement to the CIP at the following link: http://www.montgomeryschoolsmd.org/departments/planning/ CIPMaster_Current2.shtml
Woodlin Elementary SchoolCapital Project: Enrollment projections indicate enrollment at Woodlin Elementary School will exceed capacity by four or more classrooms throughout the six-year CIP period. An FY 2013 appropriation was approved for facility planning to determine the feasibility, scope, and cost for a classroom ad-dition at Woodlin Elementary School. A date for the addition will be considered in a future CIP. Relocatable classrooms will be utilized until additional capacity can be added.
DOWNCOUNTY CONSORTIUM
CAPITAL PROJECTS
School ProjectProject Status*
Date of Completion
Wheaton HS Modernization Approved Aug. 2015 Aug. 2018, site
Wellness Center Approved Aug. 2015Eastern MS Modernization Programmed Aug. 2021
(delayed)A. Mario Loiderman MS
Classroom addition
Proposed TBD
Arcola ES Classroom addition
Approved Aug. 2015
Bel Pre ES Modernization Approved Aug. 2014Georgian Forest ES
Addition Approved Aug. 2013
Glenallan ES Modernization Approved Aug. 2013Highland View ES
Addition Programmed Aug. 2017
Rolling Terrace ES
Proposed Proposed TBD
Viers Mill ES Addition Approved Aug. 2013Weller Road ES Modernization Approved Aug. 2013Wheaton Woods ES
Modernization Approved Aug. 2016
Woodlin ES Addition Proposed TBDApproved—Project has an FY 2013 or FY 2014 appropriation approved in the FY 2013 or FY 2014 Capital Budget.Programmed—Project has expenditures programmed in a future year of the CIP for planning and/or construction funds.Proposed—Project has facility planning funds approved for FY 2013 or FY 2014 for a feasibility study.
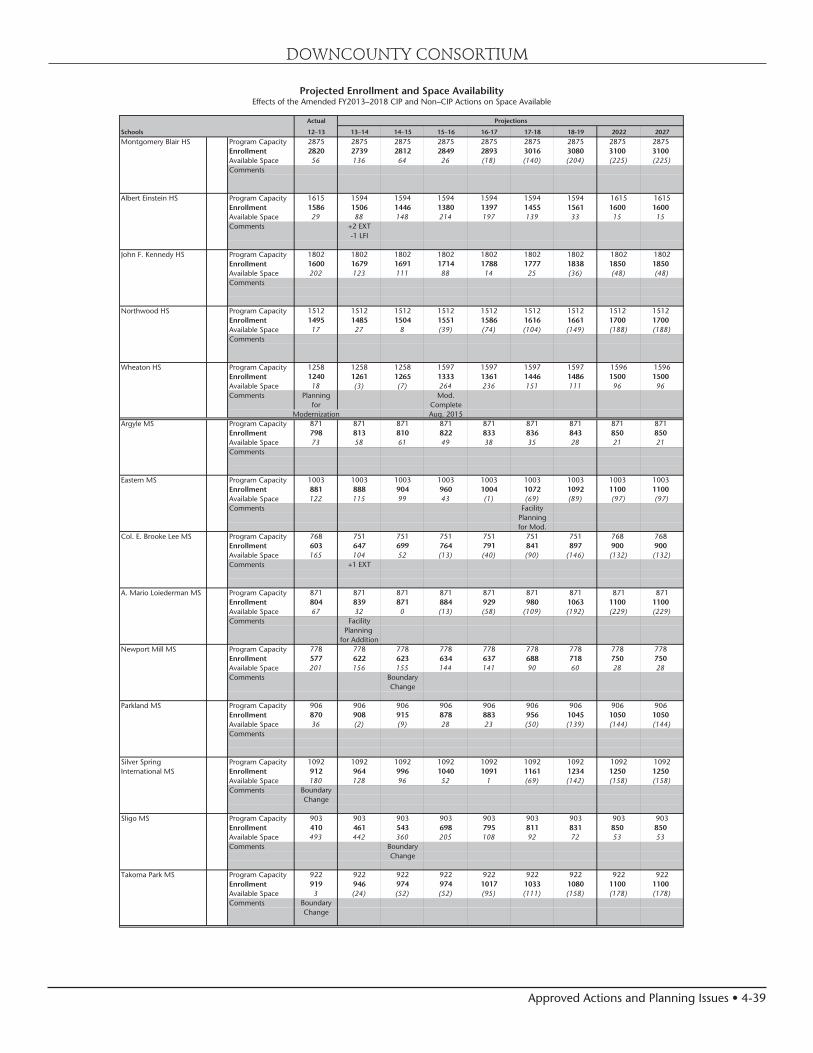
Approved Actions and Planning Issues • 4-39
DOWNCOUNTY CONSORTIUM
Projected Enrollment and Space AvailabilityEffects of the Amended FY2013–2018 CIP and Non–CIP Actions on Space Available
Actual
Schools 12–13 13–14 14–15 15–16 16-17 17-18 18-19 2022 2027
Montgomery Blair HS Program Capacity 2875 2875 2875 2875 2875 2875 2875 2875 2875Enrollment 2820 2739 2812 2849 2893 3016 3080 3100 3100Available Space 56 136 64 26 (18) (140) (204) (225) (225)Comments
Albert Einstein HS Program Capacity 1615 1594 1594 1594 1594 1594 1594 1615 1615Enrollment 1586 1506 1446 1380 1397 1455 1561 1600 1600Available Space 29 88 148 214 197 139 33 15 15Comments +2 EXT
-1 LFI
John F. Kennedy HS Program Capacity 1802 1802 1802 1802 1802 1802 1802 1802 1802Enrollment 1600 1679 1691 1714 1788 1777 1838 1850 1850Available Space 202 123 111 88 14 25 (36) (48) (48)Comments
Northwood HS Program Capacity 1512 1512 1512 1512 1512 1512 1512 1512 1512Enrollment 1495 1485 1504 1551 1586 1616 1661 1700 1700Available Space 17 27 8 (39) (74) (104) (149) (188) (188)Comments
Wheaton HS Program Capacity 1258 1258 1258 1597 1597 1597 1597 1596 1596Enrollment 1240 1261 1265 1333 1361 1446 1486 1500 1500Available Space 18 (3) (7) 264 236 151 111 96 96Comments Planning Mod.
for CompleteModernization Aug. 2015
Argyle MS Program Capacity 871 871 871 871 871 871 871 871 871Enrollment 798 813 810 822 833 836 843 850 850Available Space 73 58 61 49 38 35 28 21 21Comments
Eastern MS Program Capacity 1003 1003 1003 1003 1003 1003 1003 1003 1003Enrollment 881 888 904 960 1004 1072 1092 1100 1100Available Space 122 115 99 43 (1) (69) (89) (97) (97)Comments Facility
Planning for Mod.
Col. E. Brooke Lee MS Program Capacity 768 751 751 751 751 751 751 768 768Enrollment 603 647 699 764 791 841 897 900 900Available Space 165 104 52 (13) (40) (90) (146) (132) (132)Comments +1 EXT
A. Mario Loiederman MS Program Capacity 871 871 871 871 871 871 871 871 871Enrollment 804 839 871 884 929 980 1063 1100 1100Available Space 67 32 0 (13) (58) (109) (192) (229) (229)Comments Facility
Planning for Addition
Newport Mill MS Program Capacity 778 778 778 778 778 778 778 778 778Enrollment 577 622 623 634 637 688 718 750 750Available Space 201 156 155 144 141 90 60 28 28Comments Boundary
Change
Parkland MS Program Capacity 906 906 906 906 906 906 906 906 906Enrollment 870 908 915 878 883 956 1045 1050 1050Available Space 36 (2) (9) 28 23 (50) (139) (144) (144)Comments
Silver Spring Program Capacity 1092 1092 1092 1092 1092 1092 1092 1092 1092International MS Enrollment 912 964 996 1040 1091 1161 1234 1250 1250
Available Space 180 128 96 52 1 (69) (142) (158) (158)Comments Boundary
Change
Sligo MS Program Capacity 903 903 903 903 903 903 903 903 903Enrollment 410 461 543 698 795 811 831 850 850Available Space 493 442 360 205 108 92 72 53 53Comments Boundary
Change
Takoma Park MS Program Capacity 922 922 922 922 922 922 922 922 922Enrollment 919 946 974 974 1017 1033 1080 1100 1100Available Space 3 (24) (52) (52) (95) (111) (158) (178) (178)Comments Boundary
Change
Projections

4-40 • Approved Actions and Planning Issues
DOWNCOUNTY CONSORTIUM
ActualSchools 12–13 13–14 14–15 15–16 16-17 17-18 18-19 2022 2027Arcola ES CSR Program Capacity 434 402 402 624 624 624 624
Enrollment 721 751 762 767 759 743 734 Available Space (287) (349) (360) (143) (135) (119) (110) Comments Planning Addition
for Addition Complete-2SCB, -1HS Aug. 2015
Bel Pre ES CSR Program Capacity 368 368 568 568 568 568 568 Grades (preK-2) Enrollment 493 476 493 492 492 489 488
Paired With Available Space (125) (108) 75 76 76 79 80 Strathmore ES Comments Move to @ North Mod.
North Lake Lake CompleteJan. 2013 Aug. 2014
Brookhaven ES CSR Program Capacity 466 466 466 466 466 466 466 Enrollment 432 452 461 469 477 456 451 Available Space 34 14 5 (3) (11) 10 15 Comments See text
East Silver Spring ES CSR Program Capacity 558 558 558 558 558 558 558 Enrollment 487 526 545 574 570 575 559 Available Space 71 32 13 (16) (12) (17) (1) Comments
Forest Knolls ES CSR Program Capacity 509 506 506 506 506 506 506 Enrollment 687 689 691 702 693 694 689 Available Space (178) (183) (185) (196) (187) (188) (183) Comments +1 HS
See text
Georgian Forest ES CSR Program Capacity 304 583 583 583 583 583 583 Enrollment 565 578 577 584 577 568 560 Available Space (261) 5 6 (1) 6 15 23 Comments Addition
Complete
Glen Haven ES CSR Program Capacity 551 534 534 534 534 534 534 Enrollment 561 574 594 604 604 592 589 Available Space (10) (40) (60) (70) (70) (58) (55) Comments +1 SCB
See text
Glenallan ES CSR Program Capacity 274 722 722 722 722 722 722 Enrollment 474 513 534 548 578 591 602 Available Space (200) 209 188 174 144 131 120 Comments @ Fairland Mod. Comp.
Aug. 2013See text
Harmony Hills ES CSR Program Capacity 671 671 671 671 671 671 671 Enrollment 745 802 817 834 848 831 794 Available Space (74) (131) (146) (163) (177) (160) (123) Comments See text
Highland ES CSR Program Capacity 462 462 462 462 462 462 462 Enrollment 535 546 548 553 561 549 535 Available Space (73) (84) (86) (91) (99) (87) (73) Comments See text
Highland View ES CSR Program Capacity 278 278 278 278 278 548 548 Enrollment 389 399 415 422 433 435 435 Available Space (111) (121) (137) (144) (155) 113 113 Comments Planning Addition
for Complete Addition Aug. 2017
Kemp Mill ES CSR Program Capacity 442 442 442 442 442 442 442 Enrollment 483 490 496 506 503 508 490 Available Space (41) (48) (54) (64) (61) (66) (48) Comments +1 HS
See text
Montgomery Knolls ES CSR Program Capacity 501 501 501 501 501 501 501 Grades (K–2) Enrollment 499 482 470 479 478 475 475
Paired With Available Space 2 19 31 22 23 26 26 Pine Crest ES Comments
New Hampshire Estates ES CSR Program Capacity 444 444 444 444 444 444 444 Grades (K–2) Enrollment 512 530 531 507 487 484 484
Paired With Available Space (68) (86) (87) (63) (43) (40) (40) Oak View ES Comments See text
Oak View ES CSR Program Capacity 358 358 358 358 358 358 358 Grades (3–5) Enrollment 350 384 410 445 461 463 438
Paired With Available Space 8 (26) (52) (87) (103) (105) (80) New Hampshire ES Comments See text
Projections

Approved Actions and Planning Issues • 4-41
DOWNCOUNTY CONSORTIUM
ActualSchools 12–13 13–14 14–15 15–16 16-17 17-18 18-19 2022 2027Oakland Terrace ES CSR Program Capacity 496 491 491 491 491 491 491
Enrollment 522 482 469 474 471 463 460 Available Space (26) 9 22 17 20 28 31 Comments Boundary +1 PEP
Change
Pine Crest ES CSR Program Capacity 381 381 381 381 381 381 381 Grades (3–5) Enrollment 438 450 494 474 478 435 445
Paired With Available Space (57) (69) (113) (93) (97) (54) (64) Montgomery Knolls ES Comments
Piney Branch ES CSR Program Capacity 611 611 611 611 611 611 611 Grades (3–5) Enrollment 496 543 556 584 589 587 573
Paired With Available Space 115 68 55 27 22 24 38 Takoma Park ES Comments
Rock View ES CSR Program Capacity 631 631 631 631 631 631 631 Enrollment 628 632 668 676 674 656 654 Available Space 3 (1) (37) (45) (43) (25) (23) Comments
Rolling Terrace ES CSR Program Capacity 672 672 672 672 672 672 672 Enrollment 818 856 868 879 873 845 818 Available Space (146) (184) (196) (207) (201) (173) (146) Comments Facility
Planning for Addition
Sargent Shriver ES CSR Program Capacity 541 541 541 541 541 541 541 Enrollment 767 785 793 825 825 814 793 Available Space (226) (244) (252) (284) (284) (273) (252) Comments See text
Flora M. Singer CSR Program Capacity 652 652 652 652 652 652 652 Enrollment 508 630 657 658 669 660 644 Available Space 144 22 (5) (6) (17) (8) 8 Comments
Sligo Creek ES Program Capacity 665 665 665 665 665 665 665 Enrollment 564 592 590 607 618 609 609 Available Space 101 73 75 58 47 56 56 Comments
Strathmore ES CSR Program Capacity 460 426 426 426 426 426 426 Grades (3–5) Enrollment 406 410 400 396 382 415 414
Paired With Available Space 54 16 26 30 44 11 12 Bel Pre ES Comments +2 SCB
Takoma Park ES CSR Program Capacity 586 586 586 586 586 586 586 Grades (preK–2) Enrollment 593 598 600 587 577 574 572
Paired With Available Space (7) (12) (14) (1) 9 12 14 Piney Branch ES Comments
Viers Mill ES CSR Program Capacity 389 740 740 740 740 740 740 Enrollment 650 699 706 728 741 741 726 Available Space (261) 41 34 12 (1) (1) 14 Comments Addition
and SBHCComplete
Weller Road ES CSR Program Capacity 527 743 743 743 743 743 743 Enrollment 603 628 668 682 690 688 679 Available Space (76) 115 75 61 53 55 64 Comments Mod. and SBHC
Comp. Aug. 2013 See text
Wheaton Woods ES CSR Program Capacity 334 334 334 334 740 740 740 Enrollment 467 500 533 553 571 585 585 Available Space (133) (166) (199) (219) 169 155 155 Comments Planning Move to @ North Mod.
for Mod. North Lake Lake CompleteSee text Jan. 2015 Aug. 2016
Woodlin ES Program Capacity 463 463 463 463 463 463 463 Enrollment 560 597 625 607 601 574 574 Available Space (97) (134) (162) (144) (138) (111) (111) Comments Facility
Planning for Addition
Cluster Information HS Utilization 96% 96% 96% 94% 96% 99% 103% 104% 104%HS Enrollment 8741 8670 8718 8827 9025 9310 9626 9750 9750MS Utilization 83% 88% 91% 95% 99% 103% 109% 110% 110%MS Enrollment 6774 7088 7335 7654 7980 8378 8803 8950 8950ES Utilization 114% 109% 110% 110% 108% 105% 103% 104% 104%ES Enrollment 15953 16594 16971 17216 17280 17099 16869 17000 17000
Projections

4-42 • Approved Actions and Planning Issues
Demographic Characteristics of Schools2011–12
Total Two or more Black or Mobility Schools Enrollment races % Afr. Amer. % Asian% Hispanic % White % FARMS%* ESOL%** Rate%***Montgomery Blair HS 2820 ≤ 5.0% 26.3% 16.6% 29.9% 23.3% 35.2% 9.8% 9.6%Albert Einstein HS 1586 ≤ 5.0% 22.0% 10.1% 43.9% 21.2% 41.5% 7.5% 12.1%John F. Kennedy HS 1600 ≤ 5.0% 37.8% 9.1% 45.6% 5.4% 51.8% 8.0% 13.9%Northwood HS 1495 ≤ 5.0% 27.9% 6.4% 45.8% 17.1% 44.6% 9.8% 18.4%Wheaton HS 1240 ≤ 5.0% 23.1% 9.4% 57.0% 7.9% 57.3% 18.1% 17.5%Argyle MS 798 ≤ 5.0% 38.0% 10.5% 39.3% 9.4% 56.4% 14.2% 13.8%Eastern MS 881 5.4% 20.4% 14.3% 37.6% 22.2% 46.4% 11.9% 10.9%Col. E. Brooke Lee MS 603 ≤ 5.0% 32.7% 8.0% 51.6% 5.8% 64.0% 21.1% 20.1%A. Mario Loiederman MS 804 ≤ 5.0% 25.6% 6.8% 49.4% 13.9% 56.1% 14.1% 13.2%Newport Mill MS 577 ≤ 5.0% 18.7% 12.5% 44.9% 20.6% 51.8% 12.7% 10.8%Parkland MS 870 ≤ 5.0% 24.4% 17.5% 43.1% 12.2% 46.9% 10.5% 7.3%Silver Spring International MS 912 ≤ 5.0% 24.8% 6.0% 37.4% 27.2% 43.9% 14.4% 12.0%Sligo MS 410 ≤ 5.0% 23.2% 8.5% 42.2% 22.4% 48.0% 12.9% 19.1%Takoma Park MS 919 6.3% 27.5% 19.6% 15.3% 31.0% 26.1% 6.9% 9.2%Arcola ES 721 ≤ 5.0% 18.0% 9.7% 65.5% ≤ 5.0% 74.8% 50.3% 15.6%Bel Pre ES 493 ≤ 5.0% 45.2% 5.7% 38.1% 7.3% 66.3% 45.6% 19.7%Brookhaven ES 432 ≤ 5.0% 30.8% 6.5% 48.4% 11.8% 64.6% 49.1% 14.1%East Silver Spring ES 487 ≤ 5.0% 52.2% ≤ 5.0% 23.2% 16.8% 56.7% 34.7% 17.2%Forest Knolls ES 687 ≤ 5.0% 14.3% 7.1% 41.3% 32.8% 39.7% 28.1% 7.8%Georgian Forest ES 565 ≤ 5.0% 36.1% 8.7% 45.7% 6.7% 74.7% 33.3% 25.1%Glen Haven ES 561 ≤ 5.0% 23.0% 9.1% 51.2% 13.5% 66.8% 38.9% 25.5%Glenallan ES 474 ≤ 5.0% 29.3% 12.0% 48.3% 5.9% 66.7% 37.1% 25.8%Harmony Hills ES 745 ≤ 5.0% 17.7% 6.2% 71.7% ≤ 5.0% 87.8% 57.0% 20.8%Highland ES 535 ≤ 5.0% 12.3% 5.6% 74.0% ≤ 5.0% 82.1% 59.3% 10.8%Highland View ES 389 5.7% 23.9% ≤ 5.0% 27.5% 39.3% 42.4% 32.1% 18.4%Kemp Mill ES 483 ≤ 5.0% 20.5% 5.4% 67.5% ≤ 5.0% 74.7% 53.8% 25.7%Montgomery Knolls ES 499 ≤ 5.0% 23.0% 7.6% 48.9% 18.0% 60.3% 48.5% 10.8%New Hampshire Estates ES 512 ≤ 5.0% 14.6% ≤ 5.0% 79.5% ≤ 5.0% 89.8% 76.2% 13.6%Oak View ES 350 ≤ 5.0% 18.9% 8.3% 55.1% 15.7% 70.3% 38.9% 12.7%Oakland Terrace ES 522 7.3% 14.6% 8.6% 27.0% 42.1% 31.8% 18.4% 7.8%Pine Crest ES 438 ≤ 5.0% 17.4% 13.9% 35.8% 28.1% 47.5% 24.0% 11.9%Piney Branch ES 496 5.6% 34.5% ≤ 5.0% 17.1% 38.1% 33.7% 15.5% 11.9%Rock View ES 628 5.4% 15.9% 11.3% 44.3% 22.9% 48.9% 39.0% 9.5%Rolling Terrace ES 818 ≤ 5.0% 14.3% ≤ 5.0% 62.5% 15.6% 66.6% 48.2% 13.7%Sargent Shriver ES 767 ≤ 5.0% 12.9% 9.1% 72.4% ≤ 5.0% 81.0% 61.7% 14.2%Flora M. Singer ES 508 5.7% 15.0% 7.1% 32.5% 39.0% 36.8% 30.5% %Sligo Creek ES 564 9.4% 21.5% ≤ 5.0% 10.8% 53.0% 14.4% 7.3% 9.9%Strathmore ES 406 ≤ 5.0% 44.6% 7.4% 37.7% 6.2% 61.8% 24.9% 18.6%Takoma Park ES 593 5.9% 32.4% 5.2% 18.5% 37.6% 37.6% 28.8% 9.2%Viers Mill ES 650 ≤ 5.0% 12.3% 8.2% 63.4% 13.2% 70.6% 48.2% 10.9%Weller Road ES 603 ≤ 5.0% 12.1% 9.1% 73.3% ≤ 5.0% 79.9% 60.0% 16.8%Wheaton Woods ES 467 ≤ 5.0% 26.6% 7.3% 58.0% 6.6% 81.6% 54.2% 11.1%Woodlin ES 560 5.5% 27.9% 6.4% 16.8% 43.0% 22.7% 11.8% 11.2%Elementary Cluster Total 15953 ≤ 5.0% 22.6% 7.2% 48.2% 18.2% 63.5% 42.7% 14.6%
Elementary County Total 72303 ≤ 5.0% 20.6% 14.0% 28.8% 31.4% 39.0% 25.6% 12.6%*Percent of students approved for Free and Reduced–priced Meals Program (FARMS) during the 2012–2013 school year.
**Percent of English for Speakers of Other Languages (ESOL) during the 2012–2013 school year. High School students are served in regional ESOL centers.
***Mobility Rate is the number of entries plus withdrawals during the 2011–2012 school year compared to total enrollment.Notes: Native Hawaiian/Pacific Islander and American Indian/Alaskan Native categories total less than 1% and were therefore excluded from the table.
Due to federal and state guidelines, demographic characteristics of schools of less than or equal to 5.0% are reported as ≤ 5.0%.
2012–2013 2012–2013
DOWNCOUNTY CONSORTIUM
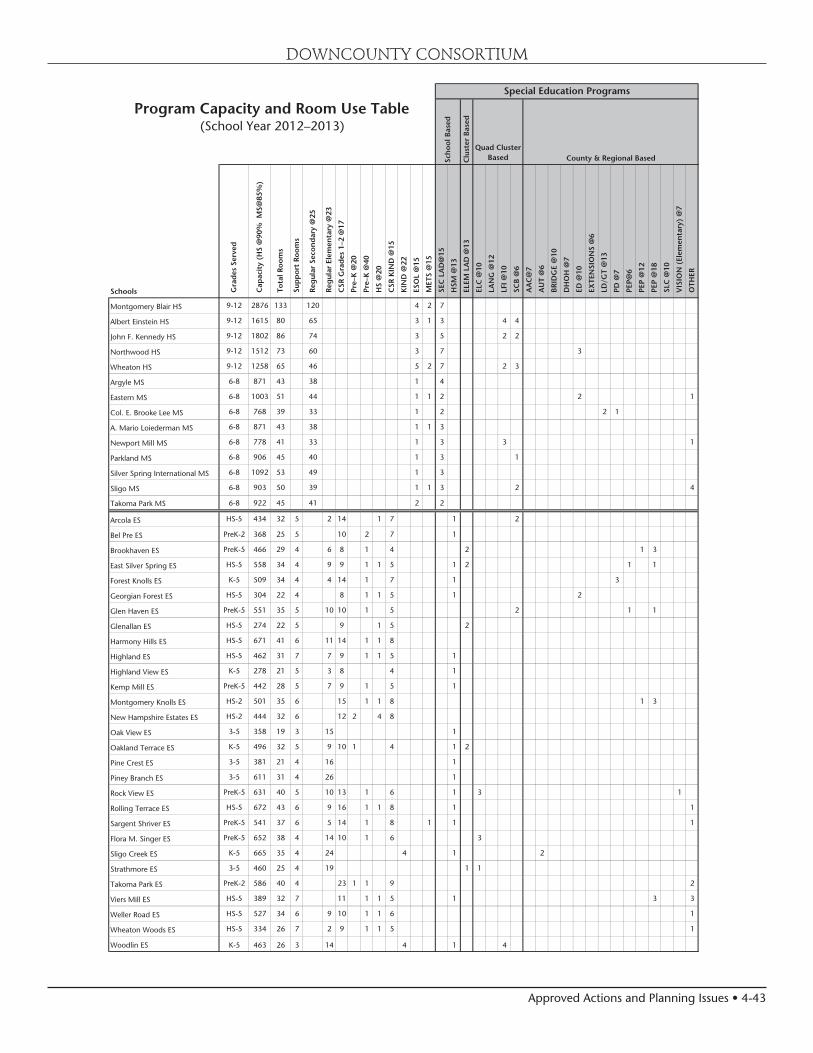
Approved Actions and Planning Issues • 4-43
DOWNCOUNTY CONSORTIUM
(School Year 2012–2013)
Schools Gra
des
Ser
ved
Cap
acit
y (H
S @
90%
MS@
85%
)
To
tal R
oo
ms
Sup
po
rt R
oo
ms
Reg
ular
Sec
on
dar
y @
25
Reg
ular
Ele
men
tary
@23
CSR
Gra
des
1–2
@17
Pre
–K @
20
Pre
–K @
40
HS
@20
CSR
KIN
D @
15
KIN
D @
22
ESO
L @
15
MET
S @
15
SEC
LA
D@
15
HSM
@13
ELE
M L
AD
@13
ELC
@10
LA
NG
@12
LFI
@10
SC
B @
6
AA
C@
7
AU
T @
6
BR
IDG
E @
10
DH
OH
@7
ED
@10
EX
TEN
SIO
NS
@6
LD
/GT
@13
PD
@7
PEP
@6
PEP
@12
PEP
@18
SLC
@10
VIS
ION
(El
emen
tary
) @
7
OTH
ER
Montgomery Blair HS 9-12 2876 133 120 4 2 7
Albert Einstein HS 9-12 1615 80 65 3 1 3 4 4
John F. Kennedy HS 9-12 1802 86 74 3 5 2 2
Northwood HS 9-12 1512 73 60 3 7 3
Wheaton HS 9-12 1258 65 46 5 2 7 2 3
Argyle MS 6-8 871 43 38 1 4
Eastern MS 6-8 1003 51 44 1 1 2 2 1
Col. E. Brooke Lee MS 6-8 768 39 33 1 2 2 1
A. Mario Loiederman MS 6-8 871 43 38 1 1 3
Newport Mill MS 6-8 778 41 33 1 3 3 1
Parkland MS 6-8 906 45 40 1 3 1
Silver Spring International MS 6-8 1092 53 49 1 3
Sligo MS 6-8 903 50 39 1 1 3 2 4
Takoma Park MS 6-8 922 45 41 2 2
Arcola ES HS-5 434 32 5 2 14 1 7 1 2
Bel Pre ES PreK-2 368 25 5 10 2 7 1
Brookhaven ES PreK-5 466 29 4 6 8 1 4 2 1 3
East Silver Spring ES HS-5 558 34 4 9 9 1 1 5 1 2 1 1
Forest Knolls ES K-5 509 34 4 4 14 1 7 1 3
Georgian Forest ES HS-5 304 22 4 8 1 1 5 1 2
Glen Haven ES PreK-5 551 35 5 10 10 1 5 2 1 1
Glenallan ES HS-5 274 22 5 9 1 5 2
Harmony Hills ES HS-5 671 41 6 11 14 1 1 8
Highland ES HS-5 462 31 7 7 9 1 1 5 1
Highland View ES K-5 278 21 5 3 8 4 1
Kemp Mill ES PreK-5 442 28 5 7 9 1 5 1
Montgomery Knolls ES HS-2 501 35 6 15 1 1 8 1 3
New Hampshire Estates ES HS-2 444 32 6 12 2 4 8
Oak View ES 3-5 358 19 3 15 1
Oakland Terrace ES K-5 496 32 5 9 10 1 4 1 2
Pine Crest ES 3-5 381 21 4 16 1
Piney Branch ES 3-5 611 31 4 26 1
Rock View ES PreK-5 631 40 5 10 13 1 6 1 3 1
Rolling Terrace ES HS-5 672 43 6 9 16 1 1 8 1 1
Sargent Shriver ES PreK-5 541 37 6 5 14 1 8 1 1 1
Flora M. Singer ES PreK-5 652 38 4 14 10 1 6 3
Sligo Creek ES K-5 665 35 4 24 4 1 2
Strathmore ES 3-5 460 25 4 19 1 1
Takoma Park ES PreK-2 586 40 4 23 1 1 9 2
Viers Mill ES HS-5 389 32 7 11 1 1 5 1 3 3
Weller Road ES HS-5 527 34 6 9 10 1 1 6 1
Wheaton Woods ES HS-5 334 26 7 2 9 1 1 5 1
Woodlin ES K-5 463 26 3 14 4 1 4
Program Capacity and Room Use Table
Sch
oo
l Bas
ed
Quad Cluster BasedC
lust
er B
ased
Special Education Programs
County & Regional Based
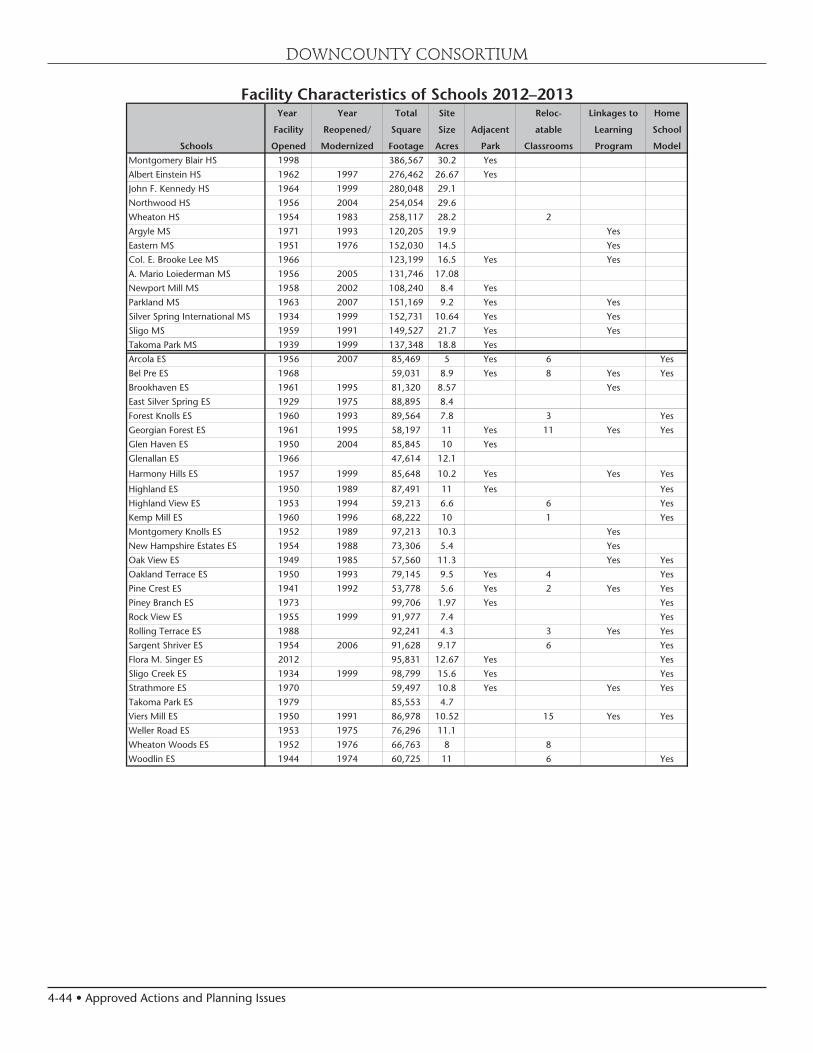
4-44 • Approved Actions and Planning Issues
Year Year Total Site Reloc- Linkages to Home
Facility Reopened/ Square Size Adjacent atable Learning School
Schools Opened Modernized Footage Acres Park Classrooms Program Model
Montgomery Blair HS 1998 386,567 30.2 Yes
Albert Einstein HS 1962 1997 276,462 26.67 Yes
John F. Kennedy HS 1964 1999 280,048 29.1
Northwood HS 1956 2004 254,054 29.6
Wheaton HS 1954 1983 258,117 28.2 2
Argyle MS 1971 1993 120,205 19.9 Yes
Eastern MS 1951 1976 152,030 14.5 Yes
Col. E. Brooke Lee MS 1966 123,199 16.5 Yes Yes
A. Mario Loiederman MS 1956 2005 131,746 17.08
Newport Mill MS 1958 2002 108,240 8.4 Yes
Parkland MS 1963 2007 151,169 9.2 Yes Yes
Silver Spring International MS 1934 1999 152,731 10.64 Yes Yes
Sligo MS 1959 1991 149,527 21.7 Yes Yes
Takoma Park MS 1939 1999 137,348 18.8 Yes
Arcola ES 1956 2007 85,469 5 Yes 6 Yes
Bel Pre ES 1968 59,031 8.9 Yes 8 Yes Yes
Brookhaven ES 1961 1995 81,320 8.57 Yes
East Silver Spring ES 1929 1975 88,895 8.4
Forest Knolls ES 1960 1993 89,564 7.8 3 Yes
Georgian Forest ES 1961 1995 58,197 11 Yes 11 Yes Yes
Glen Haven ES 1950 2004 85,845 10 Yes
Glenallan ES 1966 47,614 12.1
Harmony Hills ES 1957 1999 85,648 10.2 Yes Yes Yes
Highland ES 1950 1989 87,491 11 Yes Yes
Highland View ES 1953 1994 59,213 6.6 6 Yes
Kemp Mill ES 1960 1996 68,222 10 1 Yes
Montgomery Knolls ES 1952 1989 97,213 10.3 Yes
New Hampshire Estates ES 1954 1988 73,306 5.4 Yes
Oak View ES 1949 1985 57,560 11.3 Yes Yes
Oakland Terrace ES 1950 1993 79,145 9.5 Yes 4 Yes
Pine Crest ES 1941 1992 53,778 5.6 Yes 2 Yes Yes
Piney Branch ES 1973 99,706 1.97 Yes Yes
Rock View ES 1955 1999 91,977 7.4 Yes
Rolling Terrace ES 1988 92,241 4.3 3 Yes Yes
Sargent Shriver ES 1954 2006 91,628 9.17 6 Yes
Flora M. Singer ES 2012 95,831 12.67 Yes Yes
Sligo Creek ES 1934 1999 98,799 15.6 Yes Yes
Strathmore ES 1970 59,497 10.8 Yes Yes Yes
Takoma Park ES 1979 85,553 4.7
Viers Mill ES 1950 1991 86,978 10.52 15 Yes Yes
Weller Road ES 1953 1975 76,296 11.1
Wheaton Woods ES 1952 1976 66,763 8 8
Woodlin ES 1944 1974 60,725 11 6 Yes
Facility Characteristics of Schools 2012–2013
DOWNCOUNTY CONSORTIUM


4-46 • Approved Actions and Planning Issues
n
nm
nm
nm
nm
nm
nmnm
nm
nm Gaithersburg MS
Gaithersburg Cluster
Montgomery County Public Schools - Division of Long-range Planning - June 18, 2013
Gaithersburg
Goshen
StrawberryKnoll
WashingtonGrove
Laytonsville
Gaithersburg HS
Elementary School Service Area
Forest Oak MS
nm Elementary School
nm Middle School
n High School
Cluster Boundary
Forest Oak MS
Miles
0 2 41
Gaithersburg MSRosemont
Rosemont
Rosemont
SummitHall
Damascus Rd
Olney Laytonsville Rd
Woodfield Rd
Frederick Rd¥270

Approved Actions and Planning Issues • 4-47
DESIREDRANGE
Note: Percent utilization calculated as total enrollment of schools divided by total capacity.Projected capacity factors in capital projects.
ACTUAL PROJECTED2012 2013 2014 2015 2016 2017 2018 2022 2027
0%
20%
40%
60%
80%
100%
120%
140%
160%
Elementary Schools Middle Schools High School
Gaithersburg ClusterSchool Utilizations
CLUSTER PLANNING ISSUESPlanning Issue: The Shady Grove Sector Plan will increase housing around the Shady Grove METRO station. Most of the new development is located within the Gaithersburg Cluster.
SCHOOLSGaithersburg High SchoolCapital Project: A replacement facility is scheduled for this school. An FY 2012 appropriation was approved for construc-tion funds to begin the construction of the replacement school. The scheduled completion date for the modernization of the facility is August 2013 with restoration of the site scheduled for completion in August 2014.
Capital Project: The Department of Health and Human Services (DHHS) Capital Budget includes funds for a School-based Wellness Center at this school. The design and con-struction of the Wellness Center were included as part of the replacement facility.
Gaithersburg Elementary SchoolCapital Project: Projections indicate enrollment at Gaith-ersburg Elementary School will exceed capacity by 92 seats or more by the end of the six-year period. An FY 2014 ap-propriation is approved for facility planning to determine the feasibility, scope, and cost for a classroom addition. A date for the addition will be considered in a future CIP. Relocat-able classrooms will be utilized until additional capacity can be added.
Goshen Elementary SchoolCapital Project: Projections indicate enrollment at Goshen Elementary School will exceed capacity by 92 seats or more by the end of the six-year period. An FY 2014 appropriation is approved for facility planning to determine the feasibility, scope, and cost for a classroom addition. A date for the addition will be considered in a future CIP. Relocatable classrooms will be utilized until additional capacity can be added.
Strawberry Knoll Elementary SchoolCapital Project: Projections indicate enroll-ment at Strawberry Knoll Elementary School will exceed capacity by 92 seats or more by the end of the six-year period. An FY 2012 ap-propriation was approved for facility planning to determine the feasibility, scope, and cost for a classroom addition. A date for the addition will be considered in a future CIP. Relocatable classrooms will be utilized until additional capacity can be added.
Summit Hall Elementary SchoolCapital Project: Projections indicate enrollment at Summit Hall Elementary School will exceed capacity by 92 seats or more by the end of the six-year period. An FY 2012 appropriation was approved for facility planning to determine the feasibility, scope, and cost for a classroom addition. A date for the addition will be considered in a future CIP. Relocatable classrooms will be utilized until additional capacity can be added.
Capital Project: A modernization project is scheduled for this school with a completion date of January 2021. FY 2016 expen-ditures are programmed for facility planning for a feasibility study to determine the scope and cost of the project. In order for this project to be completed on schedule, county and state funding must be provided at the levels approved in this CIP.
CAPITAL PROJECTS
School ProjectProject Status*
Date of Completion
Gaithersburg HS Modernization Approved Aug. 2013Site work Approved Aug. 2014Wellness Center Approved Aug. 2013
Gaithersburg ES Classroom addition Proposed TBDGoshen ES Classroom addition Proposed TBDStrawberry Knoll ES
Classroom addition Proposed TBD
Summit Hall ES Classroom addition Proposed TBDModernization Programmed Jan. 2021
Approved—Project has an FY 2013 or FY 2014 appropriation approved in the FY 2013 or FY 2014 Capital Budget.Programmed—Project has expenditures programmed in a future year of the CIP for planning and/or construction funds.Proposed—Project has facility planning funds approved for FY 2013 or FY 2014 for a feasibility study.
GAITHERSBURG CLUSTER
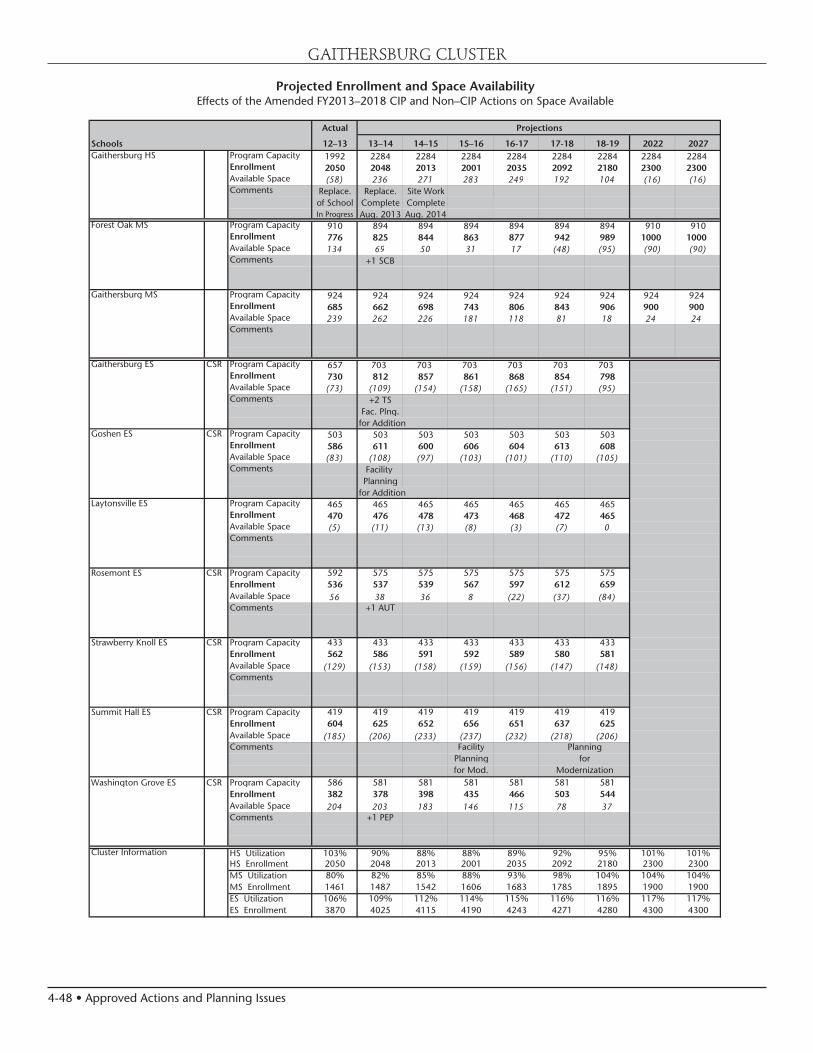
4-48 • Approved Actions and Planning Issues
Projected Enrollment and Space AvailabilityEffects of the Amended FY2013–2018 CIP and Non–CIP Actions on Space Available
Actual
Schools 12–13 13–14 14–15 15–16 16-17 17-18 18-19 2022 2027Gaithersburg HS Program Capacity 1992 2284 2284 2284 2284 2284 2284 2284 2284
Enrollment 2050 2048 2013 2001 2035 2092 2180 2300 2300Available Space (58) 236 271 283 249 192 104 (16) (16)Comments Replace. Replace. Site Work
of School Complete CompleteIn Progress Aug. 2013 Aug. 2014
Forest Oak MS Program Capacity 910 894 894 894 894 894 894 910 910Enrollment 776 825 844 863 877 942 989 1000 1000Available Space 134 69 50 31 17 (48) (95) (90) (90)Comments +1 SCB
Gaithersburg MS Program Capacity 924 924 924 924 924 924 924 924 924Enrollment 685 662 698 743 806 843 906 900 900Available Space 239 262 226 181 118 81 18 24 24Comments
Gaithersburg ES CSR Program Capacity 657 703 703 703 703 703 703Enrollment 730 812 857 861 868 854 798Available Space (73) (109) (154) (158) (165) (151) (95)Comments +2 TS
Fac. Plng.for Addition
Goshen ES CSR Program Capacity 503 503 503 503 503 503 503Enrollment 586 611 600 606 604 613 608Available Space (83) (108) (97) (103) (101) (110) (105)Comments Facility
Planningfor Addition
Laytonsville ES Program Capacity 465 465 465 465 465 465 465Enrollment 470 476 478 473 468 472 465Available Space (5) (11) (13) (8) (3) (7) 0Comments
Rosemont ES CSR Program Capacity 592 575 575 575 575 575 575Enrollment 536 537 539 567 597 612 659Available Space 56 38 36 8 (22) (37) (84)Comments +1 AUT
Strawberry Knoll ES CSR Program Capacity 433 433 433 433 433 433 433Enrollment 562 586 591 592 589 580 581Available Space (129) (153) (158) (159) (156) (147) (148)Comments
Summit Hall ES CSR Program Capacity 419 419 419 419 419 419 419Enrollment 604 625 652 656 651 637 625Available Space (185) (206) (233) (237) (232) (218) (206)Comments Facility
Planningfor Mod.
Washington Grove ES CSR Program Capacity 586 581 581 581 581 581 581Enrollment 382 378 398 435 466 503 544Available Space 204 203 183 146 115 78 37Comments +1 PEP
Cluster Information HS Utilization 103% 90% 88% 88% 89% 92% 95% 101% 101%HS Enrollment 2050 2048 2013 2001 2035 2092 2180 2300 2300MS Utilization 80% 82% 85% 88% 93% 98% 104% 104% 104%MS Enrollment 1461 1487 1542 1606 1683 1785 1895 1900 1900ES Utilization 106% 109% 112% 114% 115% 116% 116% 117% 117%ES Enrollment 3870 4025 4115 4190 4243 4271 4280 4300 4300
Projections
Planningfor
Modernization
GAITHERSBURG CLUSTER

Approved Actions and Planning Issues • 4-49
GAITHERSBURG CLUSTER
Demographic Characteristics of Schools2011–12
Total Two or more Black or Mobility Schools Enrollment races % Afr. Amer. % Asian% Hispanic % White % FARMS%* ESOL%** Rate%***Gaithersburg HS 2050 ≤ 5.0% 25.6% 9.9% 39.7% 21.0% 41.4% 10.0% 14.1%Forest Oak MS 776 ≤ 5.0% 25.9% 9.4% 44.7% 15.3% 53.0% 17.1% 15.3%Gaithersburg MS 685 5.1% 23.6% 8.6% 35.3% 27.2% 42.5% 11.4% 14.8%Gaithersburg ES 730 ≤ 5.0% 15.8% 5.5% 70.4% 5.8% 78.2% 52.9% 19.6%Goshen ES 586 7.2% 26.6% 10.6% 28.7% 26.6% 38.7% 23.7% 14.1%Laytonsville ES 470 7.0% 11.3% 9.4% 12.3% 59.8% 14.0% 6.0% 7.7%Rosemont ES 536 6.2% 23.5% 9.9% 44.2% 15.7% 58.6% 34.3% 17.4%Strawberry Knoll ES 562 ≤ 5.0% 32.7% 14.4% 33.6% 15.5% 52.0% 24.2% 14.9%Summit Hall ES 604 ≤ 5.0% 27.2% 5.5% 61.1% ≤ 5.0% 78.1% 51.8% 17.8%Washington Grove ES 382 ≤ 5.0% 18.6% 9.7% 56.8% 10.2% 73.6% 56.3% 15.3%Elementary Cluster Total 3870 ≤ 5.0% 22.5% 9.0% 45.3% 18.4% 59.6% 37.6% 15.5%
Elementary County Total 72303 ≤ 5.0% 20.6% 14.0% 28.8% 31.4% 39.0% 25.6% 12.6%*Percent of students approved for Free and Reduced–priced Meals Program (FARMS) during the 2012–2013 school year.
**Percent of English for Speakers of Other Languages (ESOL) during the 2012–2013 school year. High School students are served in regional ESOL centers.
***Mobility Rate is the number of entries plus withdrawals during the 2011–2012 school year compared to total enrollment.Notes: Native Hawaiian/Pacific Islander and American Indian/Alaskan Native categories total less than 1% and were therefore excluded from the table.
Due to federal and state guidelines, demographic characteristics of schools of less than or equal to 5.0% are reported as ≤ 5.0%.
2012–2013 2012–2013
(School Year 2012–2013)
Schools Gra
des
Ser
ved
Cap
acit
y (H
S @
90%
MS@
85%
)
Tot
al R
oom
s
Sup
por
t R
oom
s
Reg
ular
Sec
ond
ary
@25
Reg
ular
Ele
men
tary
@23
CSR
Gra
des
1–2
@17
Pre
–K @
20
Pre
–K @
40
HS
@20
CSR
KIN
D @
15
KIN
D @
22
ESO
L @
15
MET
S @
15
SEC
LA
D@
15
HSM
@13
ELE
M L
AD
@13
ELC
@10
LA
NG
@12
LFI
@10
SC
B @
6
AA
C@
7
AU
T @
6
BR
IDG
E @
10
DH
OH
@7
ED
@10
EX
TEN
SIO
NS
@6
LD
/GT
@13
PD
@7
PEP
@6
PEP
@12
PEP
@18
SLC
@10
VIS
ION
(El
emen
tary
) @
7
OTH
ER
Gaithersburg HS 9-12 1992 104 73 5 1 12 3 3 7
Forest Oak MS 6-8 910 46 39 1 5 1
Gaithersburg MS 6-8 924 49 39 1 3 2 4
Gaithersburg ES PreK-5 657 42 5 10 13 1 9 1 3
Goshen ES K-5 503 34 6 8 12 6 1 1
Laytonsville ES K-5 465 27 4 16 3 1 3
Rosemont ES PreK-5 592 36 4 12 10 1 5 1 3
Strawberry Knoll ES HS-5 433 32 5 3 10 1 1 5 1 2 1 1 2
Summit Hall ES HS-5 419 28 5 3 11 1 1 6 1
Washington Grove ES HS-5 586 34 4 14 6 1 1 1 3 1 1 1 1
Program Capacity and Room Use Table
Sch
ool B
ased
Quad Cluster BasedC
lust
er B
ased
Special Education Programs
County & Regional Based

4-50 • Approved Actions and Planning Issues
GAITHERSBURG CLUSTER
Year Year Total Site Reloc- Linkages to Home
Facility Reopened/ Square Size Adjacent atable Learning School
Schools Opened Modernized Footage Acres Park Classrooms Program Model
Gaithersburg HS 1951 431,178 41.07 Yes 15
Forest Oak MS 1999 132,259 41.2 Yes
Gaithersburg MS 1960 1988 157,694 22.82 Yes
Gaithersburg ES 1947 94,468 9.22 1 Yes Yes
Goshen ES 1988 76,740 10.5 5 Yes
Laytonsville ES 1951 1989 64,160 10.4 1 Yes
Rosemont ES 1965 1995 88,764 8.9 1 Yes Yes
Strawberry Knoll ES 1988 78,723 10.8 Yes 5 Yes
Summit Hall ES 1971 68,059 10.2 Yes 9 Yes Yes
Washington Grove ES 1956 1984 86,266 10.7 Yes Yes
Facility Characteristics of Schools 2012–2013

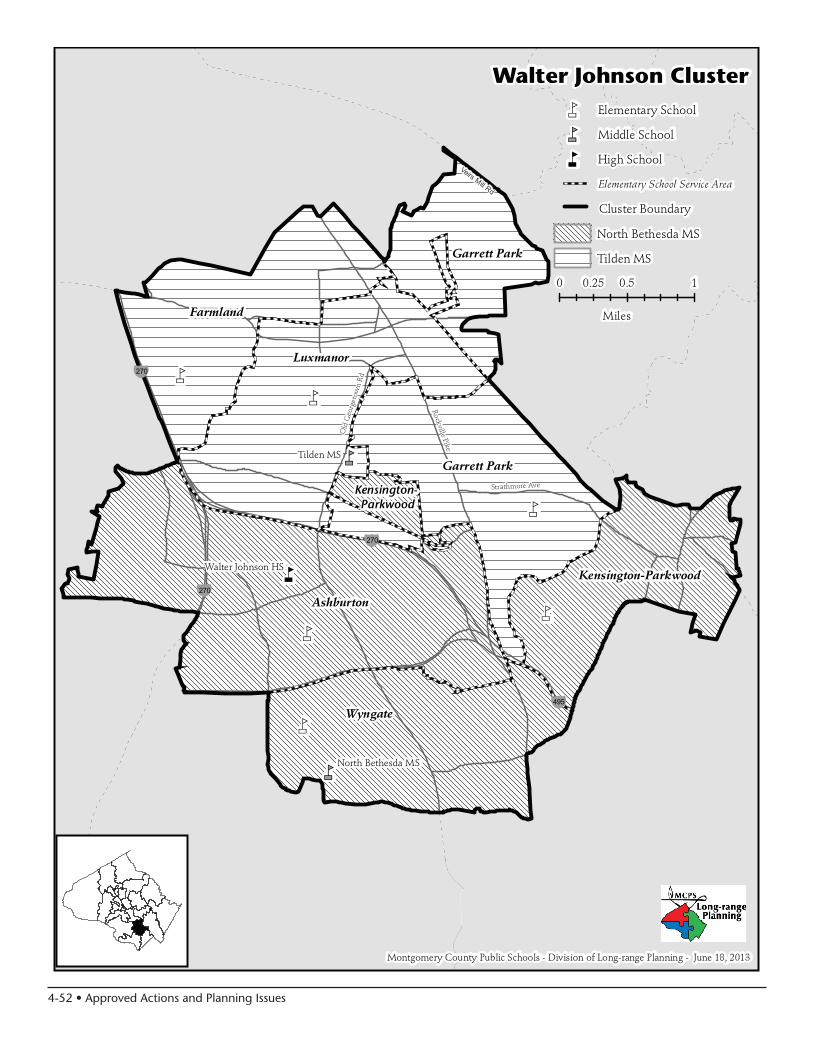
4-52 • Approved Actions and Planning Issues
nm
n
nm
nm
nm
nmnm
nmnm
Walter Johnson Cluster
Montgomery County Public Schools - Division of Long-range Planning - June 18, 2013
Garrett Park
Elementary School Service Area
North Bethesda MS
Tilden MS
nm Elementary School
nm Middle School
n High School
Cluster Boundary
Walter Johnson HS
North Bethesda MS
Tilden MS
Luxmanor
Kensington-Parkwood
Farmland
Ashburton
Wyngate
Miles
0 0.5 10.25
Garrett Park
Kensington- Parkwood
¥270
¥495
¥270
¥270
Veirs Mill Rd
Rockville Pike
Old
Geo
rget
own
Rd
Strathmore Ave
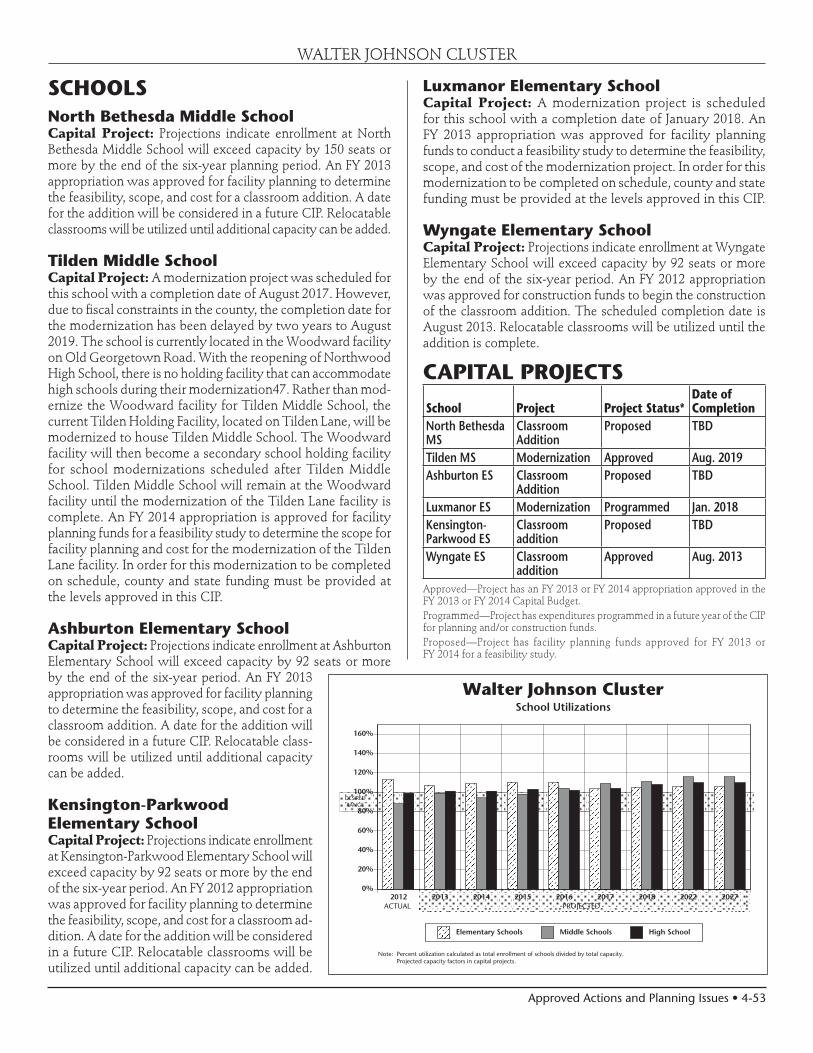
Approved Actions and Planning Issues • 4-53
DESIREDRANGE
Note: Percent utilization calculated as total enrollment of schools divided by total capacity.Projected capacity factors in capital projects.
ACTUAL PROJECTED2012 2013 2014 2015 2016 2017 2018 2022 2027
0%
20%
40%
60%
80%
100%
120%
140%
160%
Elementary Schools Middle Schools High School
Walter Johnson ClusterSchool Utilizations
WALTER JOHNSON CLUSTER
SCHOOLSNorth Bethesda Middle SchoolCapital Project: Projections indicate enrollment at North Bethesda Middle School will exceed capacity by 150 seats or more by the end of the six-year planning period. An FY 2013 appropriation was approved for facility planning to determine the feasibility, scope, and cost for a classroom addition. A date for the addition will be considered in a future CIP. Relocatable classrooms will be utilized until additional capacity can be added.
Tilden Middle SchoolCapital Project: A modernization project was scheduled for this school with a completion date of August 2017. However, due to fiscal constraints in the county, the completion date for the modernization has been delayed by two years to August 2019. The school is currently located in the Woodward facility on Old Georgetown Road. With the reopening of Northwood High School, there is no holding facility that can accommodate high schools during their modernization47. Rather than mod-ernize the Woodward facility for Tilden Middle School, the current Tilden Holding Facility, located on Tilden Lane, will be modernized to house Tilden Middle School. The Woodward facility will then become a secondary school holding facility for school modernizations scheduled after Tilden Middle School. Tilden Middle School will remain at the Woodward facility until the modernization of the Tilden Lane facility is complete. An FY 2014 appropriation is approved for facility planning funds for a feasibility study to determine the scope for facility planning and cost for the modernization of the Tilden Lane facility. In order for this modernization to be completed on schedule, county and state funding must be provided at the levels approved in this CIP.
Ashburton Elementary SchoolCapital Project: Projections indicate enrollment at Ashburton Elementary School will exceed capacity by 92 seats or more by the end of the six-year period. An FY 2013 appropriation was approved for facility planning to determine the feasibility, scope, and cost for a classroom addition. A date for the addition will be considered in a future CIP. Relocatable class-rooms will be utilized until additional capacity can be added.
Kensington-Parkwood Elementary SchoolCapital Project: Projections indicate enrollment at Kensington-Parkwood Elementary School will exceed capacity by 92 seats or more by the end of the six-year period. An FY 2012 appropriation was approved for facility planning to determine the feasibility, scope, and cost for a classroom ad-dition. A date for the addition will be considered in a future CIP. Relocatable classrooms will be utilized until additional capacity can be added.
Luxmanor Elementary SchoolCapital Project: A modernization project is scheduled for this school with a completion date of January 2018. An FY 2013 appropriation was approved for facility planning funds to conduct a feasibility study to determine the feasibility, scope, and cost of the modernization project. In order for this modernization to be completed on schedule, county and state funding must be provided at the levels approved in this CIP.
Wyngate Elementary SchoolCapital Project: Projections indicate enrollment at Wyngate Elementary School will exceed capacity by 92 seats or more by the end of the six-year period. An FY 2012 appropriation was approved for construction funds to begin the construction of the classroom addition. The scheduled completion date is August 2013. Relocatable classrooms will be utilized until the addition is complete.
CAPITAL PROJECTS
School Project Project Status*Date of Completion
North Bethesda MS
Classroom Addition
Proposed TBD
Tilden MS Modernization Approved Aug. 2019 Ashburton ES Classroom
AdditionProposed TBD
Luxmanor ES Modernization Programmed Jan. 2018Kensington-Parkwood ES
Classroom addition
Proposed TBD
Wyngate ES Classroom addition
Approved Aug. 2013
Approved—Project has an FY 2013 or FY 2014 appropriation approved in the FY 2013 or FY 2014 Capital Budget.Programmed—Project has expenditures programmed in a future year of the CIP for planning and/or construction funds.Proposed—Project has facility planning funds approved for FY 2013 or FY 2014 for a feasibility study.

4-54 • Approved Actions and Planning Issues
WALTER JOHNSON CLUSTER
Projected Enrollment and Space AvailabilityEffects of the Amended FY2013–2018 CIP and Non–CIP Actions on Space Available
Actual
Schools 12–13 13–14 14–15 15–16 16-17 17-18 18-19 2022 2027Walter Johnson HS Program Capacity 2274 2301 2301 2301 2301 2301 2301 2274 2274
Enrollment 2260 2297 2305 2335 2313 2363 2467 2500 2500Available Space 14 4 (4) (34) (12) (62) (166) (226) (226)Comments - SLC
North Bethesda MS Program Capacity 847 847 847 847 847 847 847 847 847Enrollment 823 876 919 985 1042 1100 1101 1150 1150Available Space 24 (29) (72) (138) (195) (253) (254) (303) (303)Comments Facility
Planningfor Addition
Tilden MS Program Capacity 963 963 963 963 963 963 963 963 963Enrollment 780 754 784 793 848 874 917 950 950Available Space 183 209 179 170 115 89 46 13 13Comments Facility
Planningfor Mod.
Ashburton ES Program Capacity 629 629 629 629 629 629 629Enrollment 798 814 820 816 794 771 760Available Space (169) (185) (191) (187) (165) (142) (131)Comments Facility
Planningfor Addition
Farmland ES Program Capacity 715 715 715 715 715 715 715Enrollment 648 652 659 667 683 685 684Available Space 67 63 56 48 32 30 31Comments
Garrett Park ES Program Capacity 755 755 755 755 755 755 755Enrollment 631 677 703 714 723 739 733Available Space 124 78 52 41 32 16 22Comments
Kensington–Parkwood ES Program Capacity 471 471 471 471 471 471 471Enrollment 655 663 656 662 666 660 669Available Space (184) (192) (185) (191) (195) (189) (198)Comments Facility
Planningfor Addition
Luxmanor ES Program Capacity 428 428 428 428 428 642 642Enrollment 450 481 503 530 544 570 596Available Space (22) (53) (75) (102) (116) 72 46Comments Facility @ Mod.
Planning Grosvenor CompleteFor Mod. Jan. 2018
Wyngate ES Program Capacity 432 734 734 734 734 734 734Enrollment 711 711 718 719 703 684 689Available Space (279) 23 16 15 31 50 45Comments Addition
Complete
Cluster Information HS Utilization 99% 100% 100% 101% 101% 103% 107% 110% 110%HS Enrollment 2260 2297 2305 2335 2313 2363 2467 2500 2500MS Utilization 89% 90% 94% 98% 104% 109% 111% 116% 116%MS Enrollment 1603 1630 1703 1778 1890 1974 2018 2100 2100ES Utilization 113% 107% 109% 110% 110% 104% 105% 106% 106%ES Enrollment 3893 3998 4059 4108 4113 4109 4131 4200 4200
for Modernization
Projections
Planningfor
Modernization
Planning
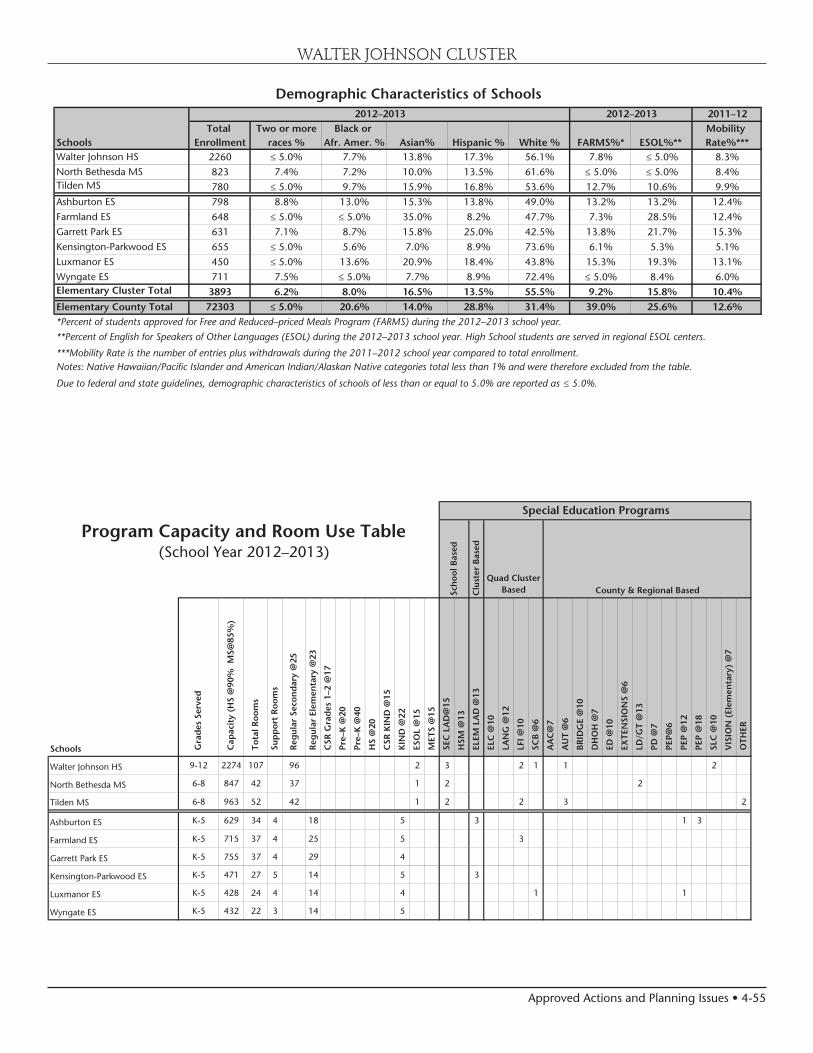
Approved Actions and Planning Issues • 4-55
WALTER JOHNSON CLUSTER
Demographic Characteristics of Schools2011–12
Total Two or more Black or Mobility Schools Enrollment races % Afr. Amer. % Asian% Hispanic % White % FARMS%* ESOL%** Rate%***Walter Johnson HS 2260 ≤ 5.0% 7.7% 13.8% 17.3% 56.1% 7.8% ≤ 5.0% 8.3%North Bethesda MS 823 7.4% 7.2% 10.0% 13.5% 61.6% ≤ 5.0% ≤ 5.0% 8.4%Tilden MS 780 ≤ 5.0% 9.7% 15.9% 16.8% 53.6% 12.7% 10.6% 9.9%Ashburton ES 798 8.8% 13.0% 15.3% 13.8% 49.0% 13.2% 13.2% 12.4%Farmland ES 648 ≤ 5.0% ≤ 5.0% 35.0% 8.2% 47.7% 7.3% 28.5% 12.4%Garrett Park ES 631 7.1% 8.7% 15.8% 25.0% 42.5% 13.8% 21.7% 15.3%Kensington-Parkwood ES 655 ≤ 5.0% 5.6% 7.0% 8.9% 73.6% 6.1% 5.3% 5.1%Luxmanor ES 450 ≤ 5.0% 13.6% 20.9% 18.4% 43.8% 15.3% 19.3% 13.1%Wyngate ES 711 7.5% ≤ 5.0% 7.7% 8.9% 72.4% ≤ 5.0% 8.4% 6.0%Elementary Cluster Total 3893 6.2% 8.0% 16.5% 13.5% 55.5% 9.2% 15.8% 10.4%
Elementary County Total 72303 ≤ 5.0% 20.6% 14.0% 28.8% 31.4% 39.0% 25.6% 12.6%*Percent of students approved for Free and Reduced–priced Meals Program (FARMS) during the 2012–2013 school year.
**Percent of English for Speakers of Other Languages (ESOL) during the 2012–2013 school year. High School students are served in regional ESOL centers.
***Mobility Rate is the number of entries plus withdrawals during the 2011–2012 school year compared to total enrollment.Notes: Native Hawaiian/Pacific Islander and American Indian/Alaskan Native categories total less than 1% and were therefore excluded from the table.
Due to federal and state guidelines, demographic characteristics of schools of less than or equal to 5.0% are reported as ≤ 5.0%.
2012–2013 2012–2013
(School Year 2012–2013)
Schools Gra
des
Ser
ved
Cap
acit
y (H
S @
90%
MS@
85%
)
Tot
al R
oom
s
Sup
por
t R
oom
s
Reg
ular
Sec
ond
ary
@25
Reg
ular
Ele
men
tary
@23
CSR
Gra
des
1–2
@17
Pre
–K @
20
Pre
–K @
40
HS
@20
CSR
KIN
D @
15
KIN
D @
22
ESO
L @
15
MET
S @
15
SEC
LA
D@
15
HSM
@13
ELE
M L
AD
@13
ELC
@10
LA
NG
@12
LFI
@10
SC
B @
6
AA
C@
7
AU
T @
6
BR
IDG
E @
10
DH
OH
@7
ED
@10
EX
TEN
SIO
NS
@6
LD
/GT
@13
PD
@7
PEP
@6
PEP
@12
PEP
@18
SLC
@10
VIS
ION
(El
emen
tary
) @
7
OTH
ER
Walter Johnson HS 9-12 2274 107 96 2 3 2 1 1 2
North Bethesda MS 6-8 847 42 37 1 2 2
Tilden MS 6-8 963 52 42 1 2 2 3 2
Ashburton ES K-5 629 34 4 18 5 3 1 3
Farmland ES K-5 715 37 4 25 5 3
Garrett Park ES K-5 755 37 4 29 4
Kensington-Parkwood ES K-5 471 27 5 14 5 3
Luxmanor ES K-5 428 24 4 14 4 1 1
Wyngate ES K-5 432 22 3 14 5
Program Capacity and Room Use Table
Sch
ool B
ased
Quad Cluster BasedC
lust
er B
ased
Special Education Programs
County & Regional Based

4-56 • Approved Actions and Planning Issues
WALTER JOHNSON CLUSTER
Year Year Total Site Reloc- Linkages to Home
Facility Reopened/ Square Size Adjacent atable Learning School
Schools Opened Modernized Footage Acres Park Classrooms Program Model
Walter Johnson HS 1956 2009 365,138 30.9
North Bethesda MS 1955 1999 130,461 19.99
Tilden MS 1967 1991 135,150 29.8
Ashburton ES 1957 1993 81,438 8.3 6
Farmland ES 1963 2011 89,988 4.8 Yes
Garrett Park ES 1948 2012 96,348 4.4 Yes
Kensington-Parkwood ES 1952 2006 77,136 9.9 7
Luxmanor ES 1966 61,694 6.5 Yes 3
Wyngate ES 1952 1997 58,654 9.5 10
Facility Characteristics of Schools 2012–2013


4-58 • Approved Actions and Planning Issues
n
nmnm
nm
nm
nm
nm
nm
nm
Col. Zadok MagruderCluster
Montgomery County Public Schools - Division of Long-range Planning - June 18, 2013
Mill CreekTowne
Elementary School Service Area
Shady Grove MS
Redland MS
nm Elementary School
nm Middle School
n High School
Cluster Boundary
Col. Zadok Magruder HS
Shady Grove MS Redland MS
Cashell
Sequoyah
Candlewood
Flower Hill
Judith A. Resnik
Miles
0 1 20.5
SequoyahFlower Hill
Judith A.Resnik
¥370
Frederick Rd
Woo
dfie
ld R
d
Midcounty Hwy
Muncaster Mill Rd

Approved Actions and Planning Issues • 4-59
DESIREDRANGE
Note: Percent utilization calculated as total enrollment of schools divided by total capacity.Projected capacity factors in capital projects.
2012 2013 2014 2015 2016 2017 2018 2022 20270%
20%
40%
60%
80%
100%
120%
140%
160%
Elementary Schools Middle Schools High School
Col. Zadok Magruder ClusterSchool Utilizations
ACTUAL PROJECTED
COL. ZADOK MAGRUDER CLUSTER
SCHOOLS
Candlewood Elementary SchoolCapital Project: A modernization project is scheduled for this school with a completion date of January 2015. An FY 2014 appropriation is approved for construction funds to begin the construction of the modernization.
Judith A. Resnik Elementary SchoolCapital Project: Projections indicate enrollment at Judith A. Resnik Elementary School will exceed capacity by 92 seats or more by the end of the six-year period. An FY 2012 appro-priation was approved for facility planning to determine the feasibility, scope, and cost for a classroom addition. A date for the addition will be considered in a future CIP. Relocat-able classrooms will be utilized until additional capacity can be added.
CAPITAL PROJECTS
School Project Project Status*Date of Completion
Candlewood ES Modernization Approved Jan. 2015Judith A. Resnik ES
Classroom addition
Proposed TBD
Approved—Project has an FY 2013 or FY 2014 appropriation approved in the FY 2013 or FY 2014 Capital Budget.Programmed—Project has expenditures programmed in a future year of the CIP for planning and/or construction funds.Proposed—Project has facility planning funds approved for FY 2013 or FY 2014 for a feasibility study.

4-60 • Approved Actions and Planning Issues
COL. ZADOK MAGRUDER CLUSTER
Projected Enrollment and Space AvailabilityEffects of the Amended FY2013–2018 CIP and Non–CIP Actions on Space Available
Actual
Schools 12–13 13–14 14–15 15–16 16-17 17-18 18-19 2022 2027Col. Zadok Magruder HS Program Capacity 1896 1923 1923 1923 1923 1923 1923 1896 1896
Enrollment 1692 1638 1602 1571 1557 1617 1640 1700 1700Available Space 204 285 321 352 366 306 283 196 196Comments -2 ED
Redland MS Program Capacity 740 740 740 740 740 740 740 740 740Enrollment 530 528 561 589 634 639 697 700 700Available Space 210 212 178 150 106 100 42 40 40Comments
Shady Grove MS Program Capacity 842 842 842 842 842 842 842 842 842Enrollment 551 570 582 583 622 619 642 650 650Available Space 290 272 260 258 220 222 200 192 192Comments
Candlewood ES Program Capacity 434 434 502 502 502 502 502Enrollment 361 365 377 388 392 399 400Available Space 73 69 125 114 110 103 102Comments Planning @Emory Mod.
for Grove CompleteMod. Jan. 2015
Cashell ES Program Capacity 341 341 341 341 341 341 341Enrollment 328 333 328 343 329 324 317Available Space 13 8 13 (2) 12 17 24Comments
Flower Hill ES CSR Program Capacity 440 440 440 440 440 440 440Enrollment 482 485 485 481 463 478 475Available Space (42) (45) (45) (41) (23) (38) (35)Comments
Mill Creek Towne ES CSR Program Capacity 333 307 307 307 307 307 307Enrollment 408 427 435 380 430 428 418Available Space (75) (120) (128) (73) (123) (121) (111)Comments +2 ELC
Judith A. Resnik ES CSR Program Capacity 463 463 463 463 463 463 463Enrollment 594 605 641 667 665 663 660Available Space (131) (142) (178) (204) (202) (200) (197)Comments
Sequoyah ES CSR Program Capacity 465 465 465 465 465 465 465Enrollment 449 462 463 472 479 497 495Available Space 16 3 2 (7) (14) (32) (30)Comments
Cluster Information HS Utilization 89% 85% 83% 82% 81% 84% 85% 90% 90%HS Enrollment 1692 1638 1602 1571 1557 1617 1640 1700 1700MS Utilization 68% 69% 72% 74% 79% 80% 85% 85% 85%MS Enrollment 1081 1098 1143 1172 1256 1258 1339 1350 1350ES Utilization 106% 109% 108% 108% 110% 111% 110% 111% 111%ES Enrollment 2622 2677 2729 2731 2758 2789 2765 2800 2800
Projections
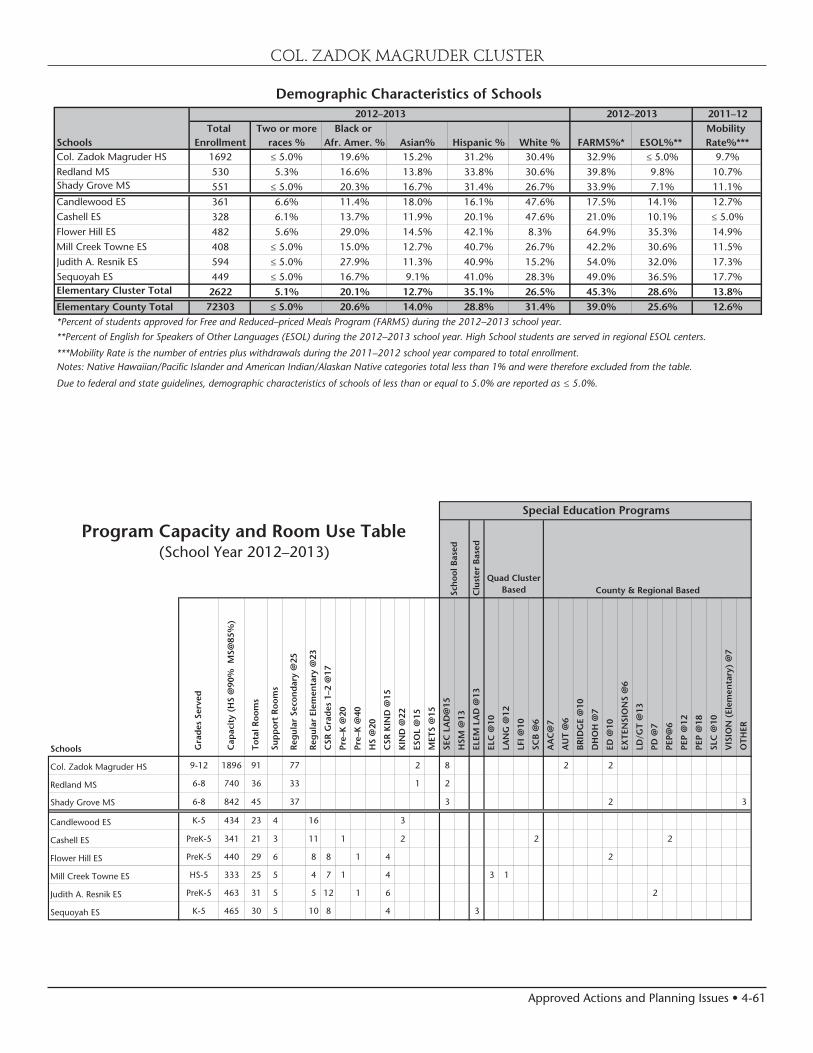
Approved Actions and Planning Issues • 4-61
COL. ZADOK MAGRUDER CLUSTER
Demographic Characteristics of Schools2011–12
Total Two or more Black or Mobility Schools Enrollment races % Afr. Amer. % Asian% Hispanic % White % FARMS%* ESOL%** Rate%***Col. Zadok Magruder HS 1692 ≤ 5.0% 19.6% 15.2% 31.2% 30.4% 32.9% ≤ 5.0% 9.7%Redland MS 530 5.3% 16.6% 13.8% 33.8% 30.6% 39.8% 9.8% 10.7%Shady Grove MS 551 ≤ 5.0% 20.3% 16.7% 31.4% 26.7% 33.9% 7.1% 11.1%Candlewood ES 361 6.6% 11.4% 18.0% 16.1% 47.6% 17.5% 14.1% 12.7%Cashell ES 328 6.1% 13.7% 11.9% 20.1% 47.6% 21.0% 10.1% ≤ 5.0%Flower Hill ES 482 5.6% 29.0% 14.5% 42.1% 8.3% 64.9% 35.3% 14.9%Mill Creek Towne ES 408 ≤ 5.0% 15.0% 12.7% 40.7% 26.7% 42.2% 30.6% 11.5%Judith A. Resnik ES 594 ≤ 5.0% 27.9% 11.3% 40.9% 15.2% 54.0% 32.0% 17.3%Sequoyah ES 449 ≤ 5.0% 16.7% 9.1% 41.0% 28.3% 49.0% 36.5% 17.7%Elementary Cluster Total 2622 5.1% 20.1% 12.7% 35.1% 26.5% 45.3% 28.6% 13.8%
Elementary County Total 72303 ≤ 5.0% 20.6% 14.0% 28.8% 31.4% 39.0% 25.6% 12.6%*Percent of students approved for Free and Reduced–priced Meals Program (FARMS) during the 2012–2013 school year.
**Percent of English for Speakers of Other Languages (ESOL) during the 2012–2013 school year. High School students are served in regional ESOL centers.
***Mobility Rate is the number of entries plus withdrawals during the 2011–2012 school year compared to total enrollment.Notes: Native Hawaiian/Pacific Islander and American Indian/Alaskan Native categories total less than 1% and were therefore excluded from the table.
Due to federal and state guidelines, demographic characteristics of schools of less than or equal to 5.0% are reported as ≤ 5.0%.
2012–2013 2012–2013
(School Year 2012–2013)
Schools Gra
des
Ser
ved
Cap
acit
y (H
S @
90%
MS@
85%
)
Tot
al R
oom
s
Sup
por
t R
oom
s
Reg
ular
Sec
ond
ary
@25
Reg
ular
Ele
men
tary
@23
CSR
Gra
des
1–2
@17
Pre
–K @
20
Pre
–K @
40
HS
@20
CSR
KIN
D @
15
KIN
D @
22
ESO
L @
15
MET
S @
15
SEC
LA
D@
15
HSM
@13
ELE
M L
AD
@13
ELC
@10
LA
NG
@12
LFI
@10
SC
B @
6
AA
C@
7
AU
T @
6
BR
IDG
E @
10
DH
OH
@7
ED
@10
EX
TEN
SIO
NS
@6
LD
/GT
@13
PD
@7
PEP
@6
PEP
@12
PEP
@18
SLC
@10
VIS
ION
(El
emen
tary
) @
7
OTH
ER
Col. Zadok Magruder HS 9-12 1896 91 77 2 8 2 2
Redland MS 6-8 740 36 33 1 2
Shady Grove MS 6-8 842 45 37 3 2 3
Candlewood ES K-5 434 23 4 16 3
Cashell ES PreK-5 341 21 3 11 1 2 2 2
Flower Hill ES PreK-5 440 29 6 8 8 1 4 2
Mill Creek Towne ES HS-5 333 25 5 4 7 1 4 3 1
Judith A. Resnik ES PreK-5 463 31 5 5 12 1 6 2
Sequoyah ES K-5 465 30 5 10 8 4 3
Program Capacity and Room Use Table
Sch
ool B
ased
Quad Cluster BasedC
lust
er B
ased
Special Education Programs
County & Regional Based
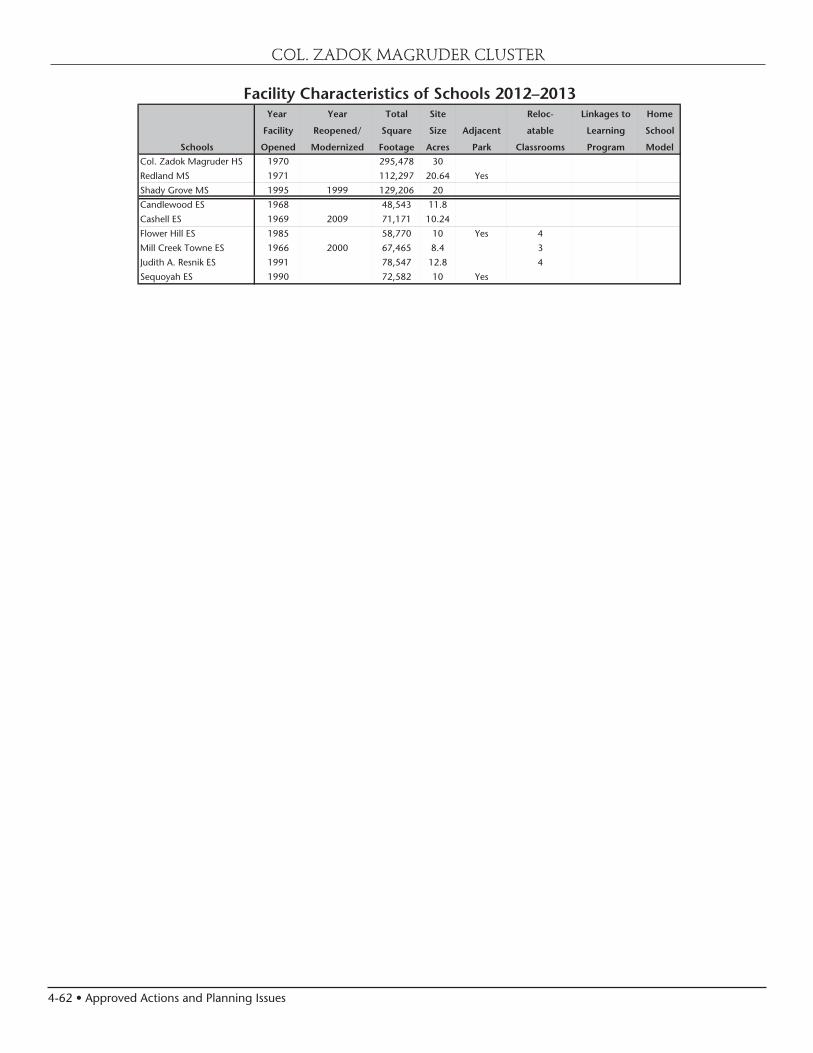
4-62 • Approved Actions and Planning Issues
COL. ZADOK MAGRUDER CLUSTER
Year Year Total Site Reloc- Linkages to Home
Facility Reopened/ Square Size Adjacent atable Learning School
Schools Opened Modernized Footage Acres Park Classrooms Program Model
Col. Zadok Magruder HS 1970 295,478 30
Redland MS 1971 112,297 20.64 Yes
Shady Grove MS 1995 1999 129,206 20
Candlewood ES 1968 48,543 11.8
Cashell ES 1969 2009 71,171 10.24
Flower Hill ES 1985 58,770 10 Yes 4
Mill Creek Towne ES 1966 2000 67,465 8.4 3
Judith A. Resnik ES 1991 78,547 12.8 4
Sequoyah ES 1990 72,582 10 Yes
Facility Characteristics of Schools 2012–2013

Approved Actions and Planning Issues • 4-63
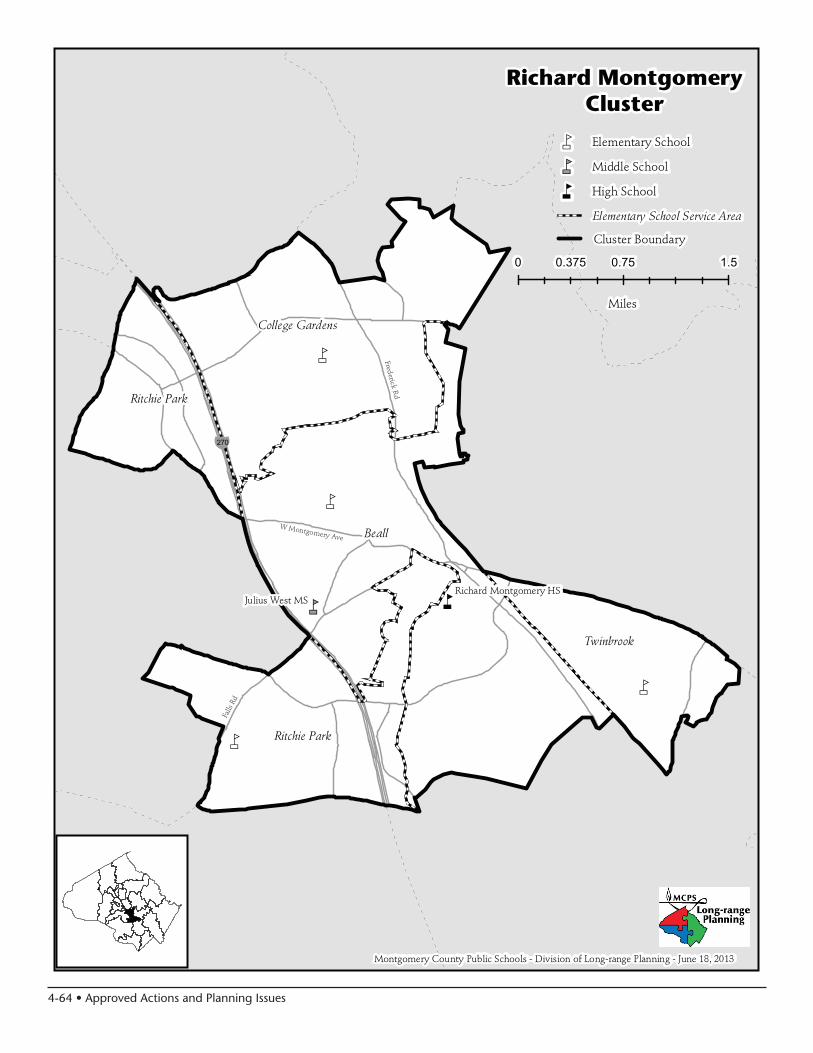
4-64 • Approved Actions and Planning Issues
nm
nm
nm
nnm
nm
Richard MontgomeryCluster
Montgomery County Public Schools - Division of Long-range Planning - June 18, 2013
Elementary School Service Area
nm Elementary School
nm Middle School
n High School
Beall
Julius West MSRichard Montgomery HS
College Gardens
Ritchie Park
Twinbrook
Ritchie Park
0 0.75 1.50.375
Miles
Cluster Boundary
¥270
Frederick Rd
W Montgomery Ave
Falls
Rd
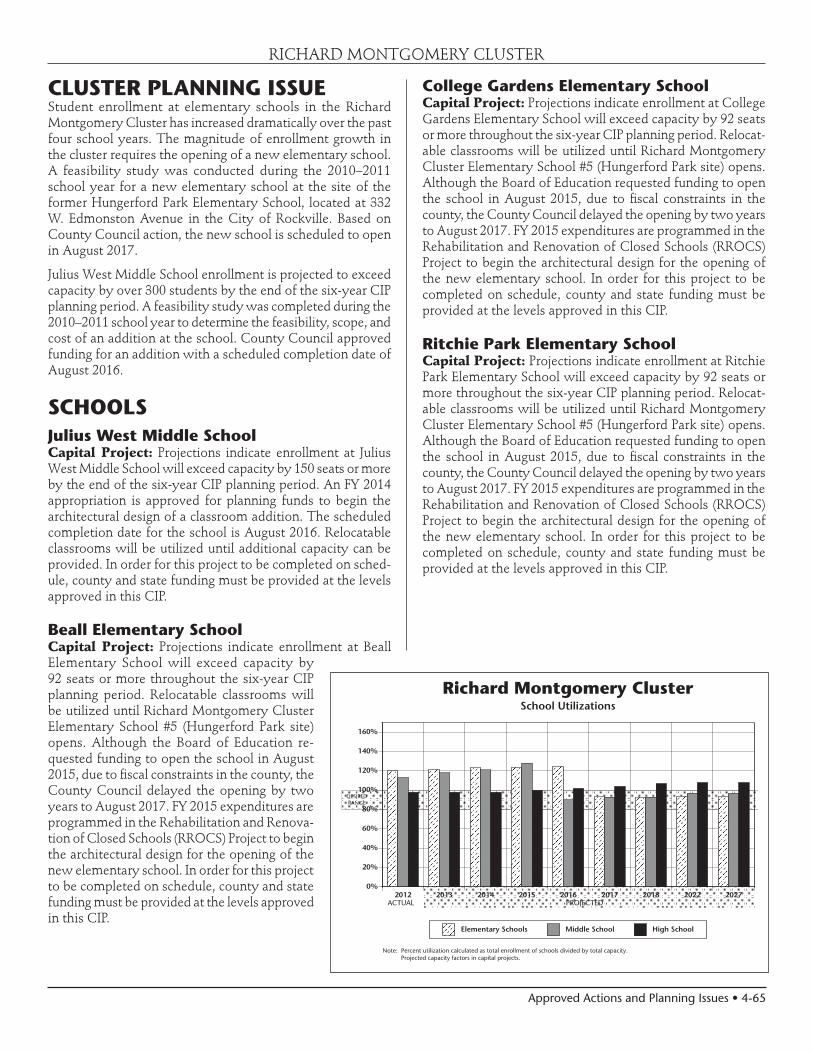
Approved Actions and Planning Issues • 4-65
DESIREDRANGE
Note: Percent utilization calculated as total enrollment of schools divided by total capacity.Projected capacity factors in capital projects.
ACTUAL PROJECTED2012 2013 2014 2015 2016 2017 2018 2022 2027
0%
20%
40%
60%
80%
100%
120%
140%
160%
Elementary Schools Middle School High School
Richard Montgomery ClusterSchool Utilizations
RICHARD MONTGOMERY CLUSTER
CLUSTER PLANNING ISSUE Student enrollment at elementary schools in the Richard Montgomery Cluster has increased dramatically over the past four school years. The magnitude of enrollment growth in the cluster requires the opening of a new elementary school. A feasibility study was conducted during the 2010–2011 school year for a new elementary school at the site of the former Hungerford Park Elementary School, located at 332 W. Edmonston Avenue in the City of Rockville. Based on County Council action, the new school is scheduled to open in August 2017.
Julius West Middle School enrollment is projected to exceed capacity by over 300 students by the end of the six-year CIP planning period. A feasibility study was completed during the 2010–2011 school year to determine the feasibility, scope, and cost of an addition at the school. County Council approved funding for an addition with a scheduled completion date of August 2016.
SCHOOLSJulius West Middle SchoolCapital Project: Projections indicate enrollment at Julius West Middle School will exceed capacity by 150 seats or more by the end of the six-year CIP planning period. An FY 2014 appropriation is approved for planning funds to begin the architectural design of a classroom addition. The scheduled completion date for the school is August 2016. Relocatable classrooms will be utilized until additional capacity can be provided. In order for this project to be completed on sched-ule, county and state funding must be provided at the levels approved in this CIP.
Beall Elementary SchoolCapital Project: Projections indicate enrollment at Beall Elementary School will exceed capacity by 92 seats or more throughout the six-year CIP planning period. Relocatable classrooms will be utilized until Richard Montgomery Cluster Elementary School #5 (Hungerford Park site) opens. Although the Board of Education re-quested funding to open the school in August 2015, due to fiscal constraints in the county, the County Council delayed the opening by two years to August 2017. FY 2015 expenditures are programmed in the Rehabilitation and Renova-tion of Closed Schools (RROCS) Project to begin the architectural design for the opening of the new elementary school. In order for this project to be completed on schedule, county and state funding must be provided at the levels approved in this CIP.
College Gardens Elementary SchoolCapital Project: Projections indicate enrollment at College Gardens Elementary School will exceed capacity by 92 seats or more throughout the six-year CIP planning period. Relocat-able classrooms will be utilized until Richard Montgomery Cluster Elementary School #5 (Hungerford Park site) opens. Although the Board of Education requested funding to open the school in August 2015, due to fiscal constraints in the county, the County Council delayed the opening by two years to August 2017. FY 2015 expenditures are programmed in the Rehabilitation and Renovation of Closed Schools (RROCS) Project to begin the architectural design for the opening of the new elementary school. In order for this project to be completed on schedule, county and state funding must be provided at the levels approved in this CIP.
Ritchie Park Elementary SchoolCapital Project: Projections indicate enrollment at Ritchie Park Elementary School will exceed capacity by 92 seats or more throughout the six-year CIP planning period. Relocat-able classrooms will be utilized until Richard Montgomery Cluster Elementary School #5 (Hungerford Park site) opens. Although the Board of Education requested funding to open the school in August 2015, due to fiscal constraints in the county, the County Council delayed the opening by two years to August 2017. FY 2015 expenditures are programmed in the Rehabilitation and Renovation of Closed Schools (RROCS) Project to begin the architectural design for the opening of the new elementary school. In order for this project to be completed on schedule, county and state funding must be provided at the levels approved in this CIP.
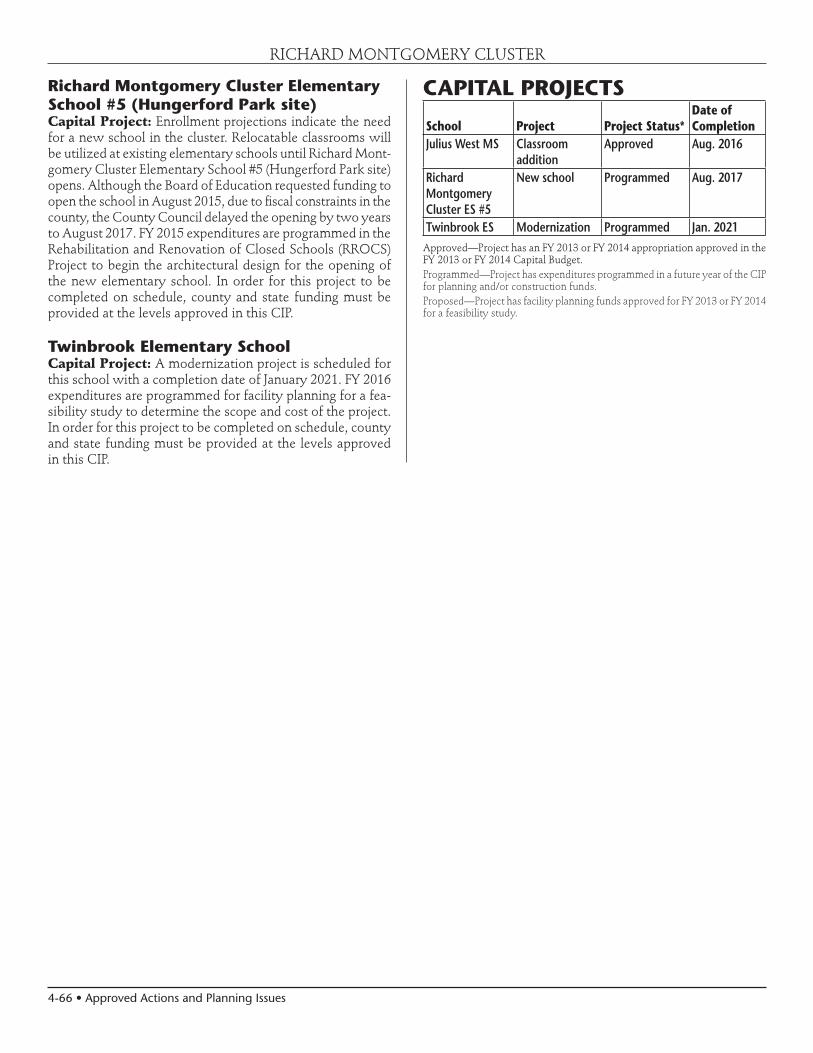
4-66 • Approved Actions and Planning Issues
Richard Montgomery Cluster Elementary School #5 (Hungerford Park site)Capital Project: Enrollment projections indicate the need for a new school in the cluster. Relocatable classrooms will be utilized at existing elementary schools until Richard Mont-gomery Cluster Elementary School #5 (Hungerford Park site) opens. Although the Board of Education requested funding to open the school in August 2015, due to fiscal constraints in the county, the County Council delayed the opening by two years to August 2017. FY 2015 expenditures are programmed in the Rehabilitation and Renovation of Closed Schools (RROCS) Project to begin the architectural design for the opening of the new elementary school. In order for this project to be completed on schedule, county and state funding must be provided at the levels approved in this CIP.
Twinbrook Elementary SchoolCapital Project: A modernization project is scheduled for this school with a completion date of January 2021. FY 2016 expenditures are programmed for facility planning for a fea-sibility study to determine the scope and cost of the project. In order for this project to be completed on schedule, county and state funding must be provided at the levels approved in this CIP.
RICHARD MONTGOMERY CLUSTER
CAPITAL PROJECTS
School Project Project Status*Date of Completion
Julius West MS Classroom addition
Approved Aug. 2016
Richard Montgomery Cluster ES #5
New school Programmed Aug. 2017
Twinbrook ES Modernization Programmed Jan. 2021Approved—Project has an FY 2013 or FY 2014 appropriation approved in the FY 2013 or FY 2014 Capital Budget.Programmed—Project has expenditures programmed in a future year of the CIP for planning and/or construction funds.Proposed—Project has facility planning funds approved for FY 2013 or FY 2014 for a feasibility study.

Approved Actions and Planning Issues • 4-67
RICHARD MONTGOMERY CLUSTER
Projected Enrollment and Space AvailabilityEffects of the Amended FY2013–2018 CIP and Non–CIP Actions on Space Available
Actual
Schools 12–13 13–14 14–15 15–16 16-17 17-18 18-19 2022 2027Richard Montgomery HS Program Capacity 2218 2218 2218 2218 2218 2218 2218 2218 2218
Enrollment 2123 2166 2169 2211 2255 2316 2377 2400 2400Available Space 96 52 50 8 (36) (98) (158) (182) (182)Comments
Julius West MS Program Capacity 995 995 995 995 1445 1445 1445 1445 1445Enrollment 1127 1164 1204 1277 1303 1338 1347 1400 1400Available Space (132) (170) (210) (282) 142 107 98 45 45Comments Addition
CompleteAug. 2016
Beall ES Program Capacity 641 641 641 641 641 641 641Enrollment 783 799 802 809 790 788 788Available Space (142) (158) (161) (168) (149) (147) (147)Comments
College Gardens ES Program Capacity 671 671 671 671 671 671 671Enrollment 842 812 838 836 845 834 833Available Space (171) (141) (167) (165) (174) (163) (162)Comments
Richard Montgomery Program Capacity 740 740Cluster ES #5 Enrollment 0 0(Hungerford Park) Available Space 740 740
Comments OpensAug. 2017
Ritchie Park ES Program Capacity 387 387 387 387 387 387 387Enrollment 531 537 535 529 536 540 540Available Space (144) (150) (148) (142) (149) (153) (153)Comments
Twinbrook ES CSR Program Capacity 538 538 538 538 538 538 538Enrollment 548 571 596 604 619 625 620Available Space (10) (33) (58) (66) (81) (87) (82)Comments Facility
Planningfor Mod.
Cluster Information HS Utilization 96% 98% 98% 100% 102% 104% 107% 108% 108%HS Enrollment 2123 2166 2169 2211 2255 2316 2377 2400 2400MS Utilization 113% 117% 121% 128% 90% 93% 93% 97% 97%MS Enrollment 1127 1164 1204 1277 1303 1338 1347 1400 1400ES Utilization 121% 122% 124% 124% 125% 94% 93% 94% 94%ES Enrollment 2704 2719 2771 2778 2790 2787 2781 2800 2800
Projections
Planningfor
Addition
Planningfor newschool
Planningfor
Modernization
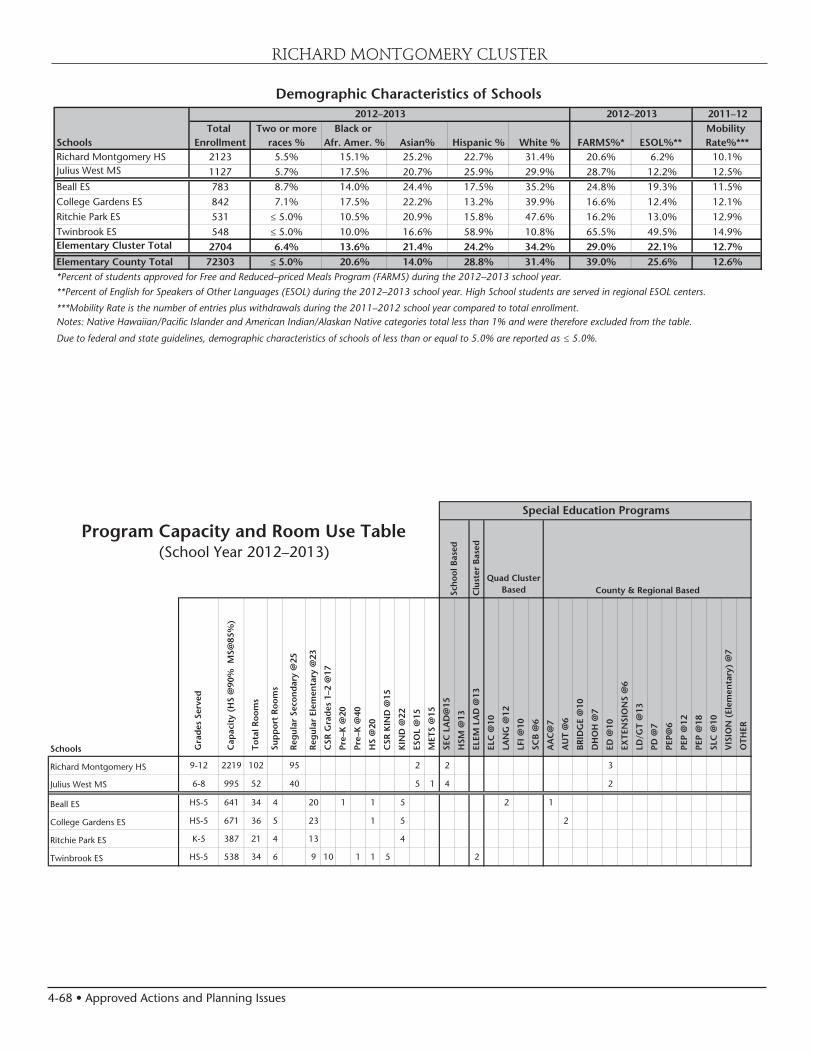
4-68 • Approved Actions and Planning Issues
RICHARD MONTGOMERY CLUSTER
Demographic Characteristics of Schools2011–12
Total Two or more Black or Mobility Schools Enrollment races % Afr. Amer. % Asian% Hispanic % White % FARMS%* ESOL%** Rate%***Richard Montgomery HS 2123 5.5% 15.1% 25.2% 22.7% 31.4% 20.6% 6.2% 10.1%Julius West MS 1127 5.7% 17.5% 20.7% 25.9% 29.9% 28.7% 12.2% 12.5%Beall ES 783 8.7% 14.0% 24.4% 17.5% 35.2% 24.8% 19.3% 11.5%College Gardens ES 842 7.1% 17.5% 22.2% 13.2% 39.9% 16.6% 12.4% 12.1%Ritchie Park ES 531 ≤ 5.0% 10.5% 20.9% 15.8% 47.6% 16.2% 13.0% 12.9%Twinbrook ES 548 ≤ 5.0% 10.0% 16.6% 58.9% 10.8% 65.5% 49.5% 14.9%Elementary Cluster Total 2704 6.4% 13.6% 21.4% 24.2% 34.2% 29.0% 22.1% 12.7%
Elementary County Total 72303 ≤ 5.0% 20.6% 14.0% 28.8% 31.4% 39.0% 25.6% 12.6%*Percent of students approved for Free and Reduced–priced Meals Program (FARMS) during the 2012–2013 school year.
**Percent of English for Speakers of Other Languages (ESOL) during the 2012–2013 school year. High School students are served in regional ESOL centers.
***Mobility Rate is the number of entries plus withdrawals during the 2011–2012 school year compared to total enrollment.Notes: Native Hawaiian/Pacific Islander and American Indian/Alaskan Native categories total less than 1% and were therefore excluded from the table.
Due to federal and state guidelines, demographic characteristics of schools of less than or equal to 5.0% are reported as ≤ 5.0%.
2012–2013 2012–2013
(School Year 2012–2013)
Schools Gra
des
Ser
ved
Cap
acit
y (H
S @
90%
MS@
85%
)
Tot
al R
oom
s
Sup
por
t R
oom
s
Reg
ular
Sec
ond
ary
@25
Reg
ular
Ele
men
tary
@23
CSR
Gra
des
1–2
@17
Pre
–K @
20
Pre
–K @
40
HS
@20
CSR
KIN
D @
15
KIN
D @
22
ESO
L @
15
MET
S @
15
SEC
LA
D@
15
HSM
@13
ELE
M L
AD
@13
ELC
@10
LA
NG
@12
LFI
@10
SC
B @
6
AA
C@
7
AU
T @
6
BR
IDG
E @
10
DH
OH
@7
ED
@10
EX
TEN
SIO
NS
@6
LD
/GT
@13
PD
@7
PEP
@6
PEP
@12
PEP
@18
SLC
@10
VIS
ION
(El
emen
tary
) @
7
OTH
ER
Richard Montgomery HS 9-12 2219 102 95 2 2 3
Julius West MS 6-8 995 52 40 5 1 4 2
Beall ES HS-5 641 34 4 20 1 1 5 2 1
College Gardens ES HS-5 671 36 5 23 1 5 2
Ritchie Park ES K-5 387 21 4 13 4
Twinbrook ES HS-5 538 34 6 9 10 1 1 5 2
Program Capacity and Room Use Table
Sch
ool B
ased
Quad Cluster BasedC
lust
er B
ased
Special Education Programs
County & Regional Based

Approved Actions and Planning Issues • 4-69
RICHARD MONTGOMERY CLUSTER
Year Year Total Site Reloc- Linkages to Home
Facility Reopened/ Square Size Adjacent atable Learning School
Schools Opened Modernized Footage Acres Park Classrooms Program Model
Richard Montgomery HS 1942 2007 311,500 29.05
Julius West MS 1961 1995 147,223 21.3 2
Beall ES 1954 1991 79,477 8.4 Yes 8
College Gardens ES 1967 2008 96,986 7.9 Yes 4
Ritchie Park ES 1966 1997 58,500 9.2 5
Twinbrook ES 1952 1986 79,818 10.5 4
Facility Characteristics of Schools 2012–2013
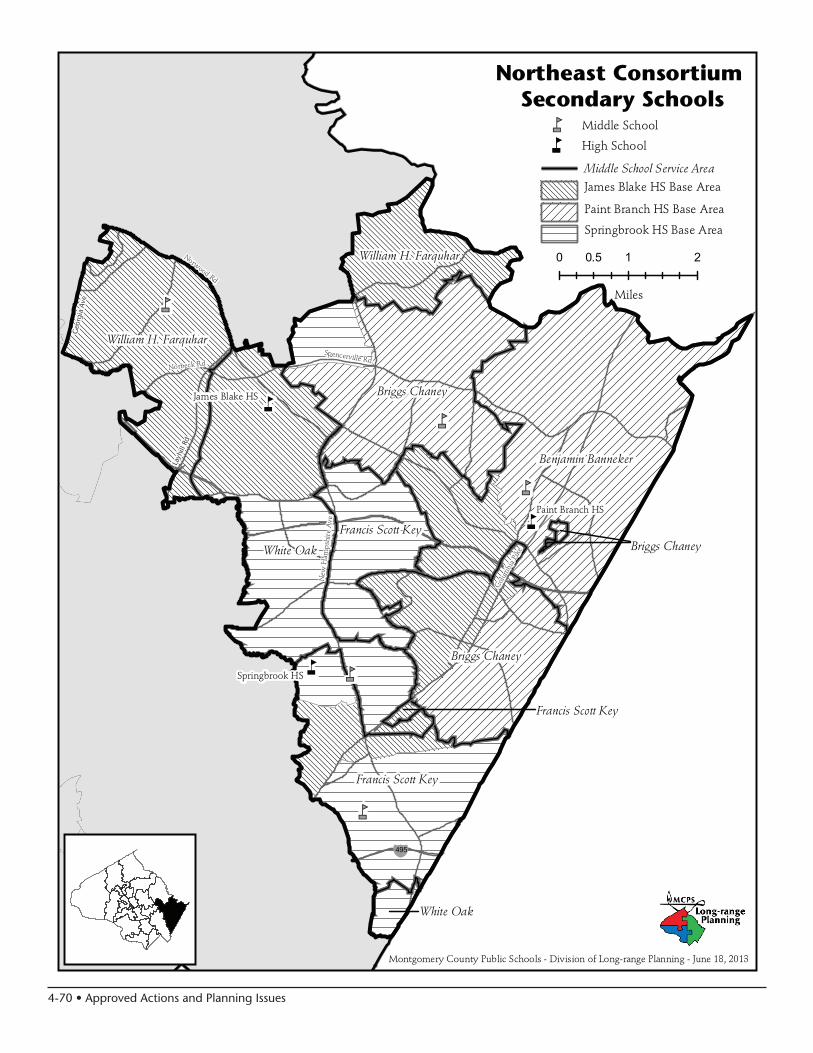
4-70 • Approved Actions and Planning Issues
n
nm
nm
nm
nm
nmn
n
Montgomery County Public Schools - Division of Long-range Planning - June 18, 2013
Northeast Consortium Secondary Schools
nm High Schoolnm Middle School
Middle School Service Area
James Blake HS Base Area
Paint Branch HS Base Area
Springbrook HS Base Area
Benjamin Banneker
James Blake HS
0 1 20.5
Miles
Paint Branch HS
Springbrook HS
Briggs Chaney
William H. Farquhar
Francis Scott Key
White Oak Briggs Chaney
William H. Farquhar
White Oak
Francis Scott Key
Briggs Chaney
Francis Scott Key
Geo
rgia
Ave
Norwood Rd
Norbeck Rd
Layh
ill R
d
New
Ham
pshi
re A
ve
Spencerville Rd
Col
umbi
a Pi
ke
¥495

Approved Actions and Planning Issues • 4-71
nm
nm
nm
!n
nm
nm
nm
nm
nm
nm nm
nm
nm
nm
!«nm
nm
Northeast ConsortiumElementary Schools
Elementary School Service Area
Montgomery County Public Schools - Division of Long-range Planning - June 18, 2013
!«nm Paired K-2
!n Paired 3-5
nm Elementary School
Sherwood ES
Burnt Mills
Burtonsville
Cannon
Road
Cloverly
Roscoe Nix/Cresthaven
Dr. Charles
R. Drew
Fairland
Galway
Greencastle
Jackson Road
William T. Page
Sherwood
Stonegate
Westover
Roscoe Nix ES
Cresthaven ES
Dr. CharlesR. Drew
Cannon Road
GalwayFairland
Fairland
Burnt Mills
Cannon Road
Broad Acres
0 1 20.5
Geo
rgia
Ave
Norwood Rd
Norbeck Rd
Layh
ill R
d
New
Ham
pshi
re A
ve
Spencerville Rd
Col
umbi
a Pi
ke
¥495
Miles
ES/HS Service Area

4-72 • Approved Actions and Planning Issues
����������������������������������������������������������������������������������
����������������������������������
����������������������� ������������������������������
���������� ���������������
��������� ������������ ���� ���������� ���������� �� �� �� ��
�������������� ����������� �������������� ������ ������ ����������������������� ������������ ������������ �� ���������� ���� ������
���� �������� �� ����� ������������� ����������� ���������������������������� ��������������� ��� ����������
� �������� ���� �������������� ����������������������������������������������� ���� ������������������������������������������ ���
������������������� ��������� ����������������������������������� ������������ ������ ���
CONSORTIUM PLANNING ISSUESThe Northeast Consortium provides a program delivery model for the three high schools in the northeast area of the county. Students living in this area of the county are able to choose which of three high schools they wish to attend, based on different signature programs offered at the high schools. The Northeast Consortium choice programs are offered at James Hubert Blake, Paint Branch, and Springbrook high schools. Choice patterns will be monitored for their impact on projected enrollment and facility utilization.
A high school base area map and middle school articulation diagram are included for the three consortium high schools. Students residing in a base area are guaranteed to attend the high school serving that base area, if it is their first choice.
SCHOOLSPaint Branch High SchoolCapital Project: A replacement facility opened in August 2012 as part of the Current Replacements/Modernization Project. Restoration of the site is scheduled for completion by August 2013.
William H. Farquhar Middle SchoolCapital Project: A modernization project was scheduled for this school with a completion date of August 2015. However, due to fiscal constraints in the county, the completion date was delayed by one year to August 2016. An FY 2012 appropriation was approved for planning funds to begin the architectural design of the modernization. In order for this project to be completed on schedule, county and state funding must be provided at the levels approved in this CIP.
Broad Acres Elementary SchoolCapital Project: Projections indicate enrollment at Broad Acres Elementary School will exceed capacity by 92 seats or more by the end of the six-year period. An FY 2014 appropriation is approved for facility planning to determine the feasibility, scope, and cost for a classroom addition. A date for the addition will be considered in a future CIP. Relocatable classrooms will be utilized until additional capacity can be added.
Burnt Mills Elementary SchoolCapital Project: Projections indicate enroll-ment at Burnt Mills Elementary School will exceed capacity by 92 seats or more by the end of the six-year period. An FY 2012 appro-priation was approved for facility planning to determine the feasibility, scope, and cost for a classroom addition. A date for the addition will
be considered in a future CIP. Relocatable classrooms will be utilized until additional capacity can be added.
Burtonsville Elementary SchoolCapital Project: Projections indicate enrollment at Burtons-ville Elementary School will exceed capacity by 92 seats or more by the end of the six-year period. An FY 2013 appro-priation was approved for facility planning to determine the feasibility, scope, and cost for a classroom addition. A date for the addition will be considered in a future CIP. Relocat-able classrooms will be utilized until additional capacity can be added.
Greencastle Elementary SchoolCapital Project: Projections indicate enrollment at Green-castle Elementary School will exceed capacity by 92 seats or more by the end of the six-year period. An FY 2013 appro-priation was approved for facility planning to determine the feasibility, scope, and cost for a classroom addition. A date for the addition will be considered in a future CIP. Relocat-able classrooms will be utilized until additional capacity can be added.
Stonegate Elementary SchoolCapital Project: A modernization project is scheduled for this school with a completion date of August 2019. FY 2015 expenditures are programmed for facility planning for a fea-sibility study to determine the scope and cost of the project. In order for this project to be completed on schedule, county and state funding must be provided at the levels approved in this CIP.
NORTHEAST CONSORTIUM

Approved Actions and Planning Issues • 4-73
NORTHEAST CONSORTIUM
DESIREDRANGE
Note: Percent utilization calculated as total enrollment of schools divided by total capacity.Projected capacity factors in capital projects.
ACTUAL PROJECTED2012 2013 2014 2015 2016 2017 2018 2022 2027
0%
20%
40%
60%
80%
100%
120%
140%
160%
Elementary Schools Middle Schools High Schools
Northeast ConsortiumSchool Utilizations
CAPITAL PROJECTS
School Project Project Status*Date of Completion
Paint Branch HS
Modernization Approved Aug. 2012 Site work Approved Aug. 2013
Farquhar MS Modernization ProgrammedAug. 2016(delayed)
Broad Acres ES Classroom addition Proposed TBD
Burnt Mill ES Classroom addition Proposed TBD
Burtonsville ES Classroom addition Proposed TBD
Greencastle ES Classroom addition Proposed TBD
Stonegate ES Modernization Programmed Aug. 2019Approved—Project has an FY 2013 or FY 2014 appropriation approved in the FY 2013 or FY 2014 Capital Budget.Programmed—Project has expenditures programmed in a future year of the CIP for planning and/or construction funds.Proposed—Project has facility planning funds approved for FY 2013 or FY 2014 for a feasibility study.
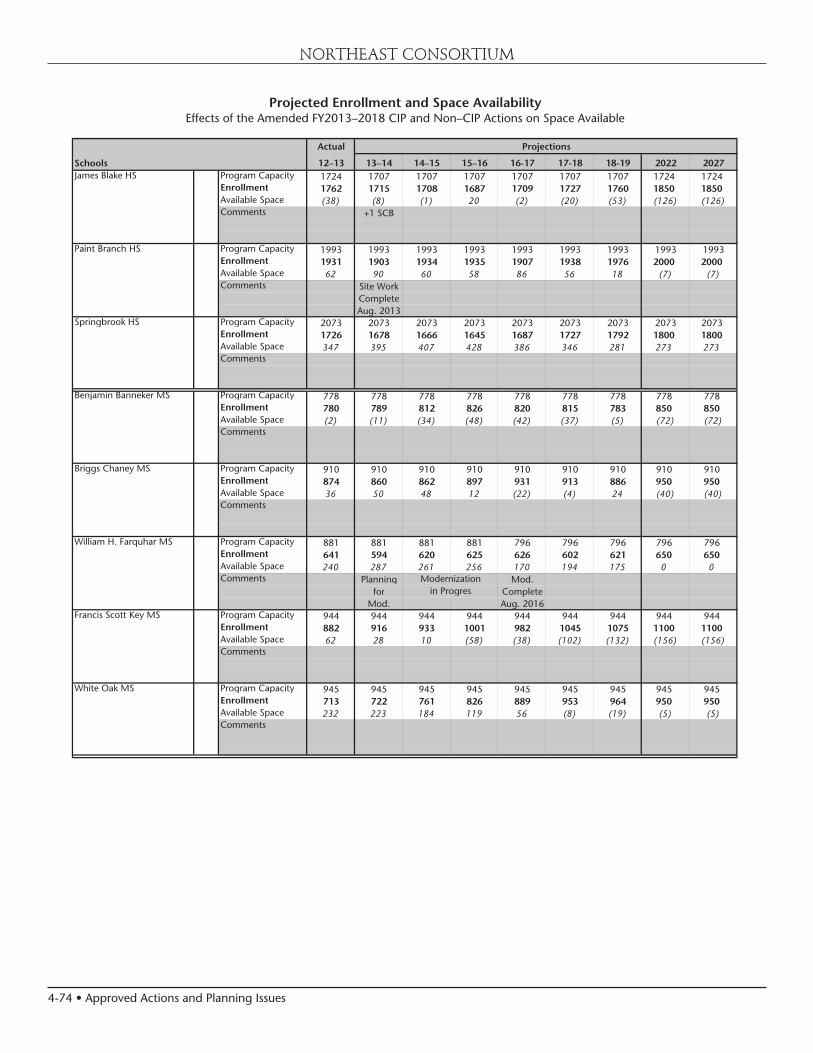
4-74 • Approved Actions and Planning Issues
NORTHEAST CONSORTIUM
Projected Enrollment and Space AvailabilityEffects of the Amended FY2013–2018 CIP and Non–CIP Actions on Space Available
Actual
Schools 12–13 13–14 14–15 15–16 16-17 17-18 18-19 2022 2027James Blake HS Program Capacity 1724 1707 1707 1707 1707 1707 1707 1724 1724
Enrollment 1762 1715 1708 1687 1709 1727 1760 1850 1850Available Space (38) (8) (1) 20 (2) (20) (53) (126) (126)Comments +1 SCB
Paint Branch HS Program Capacity 1993 1993 1993 1993 1993 1993 1993 1993 1993Enrollment 1931 1903 1934 1935 1907 1938 1976 2000 2000Available Space 62 90 60 58 86 56 18 (7) (7)Comments Site Work
CompleteAug. 2013
Springbrook HS Program Capacity 2073 2073 2073 2073 2073 2073 2073 2073 2073Enrollment 1726 1678 1666 1645 1687 1727 1792 1800 1800Available Space 347 395 407 428 386 346 281 273 273Comments
Benjamin Banneker MS Program Capacity 778 778 778 778 778 778 778 778 778Enrollment 780 789 812 826 820 815 783 850 850Available Space (2) (11) (34) (48) (42) (37) (5) (72) (72)Comments
Briggs Chaney MS Program Capacity 910 910 910 910 910 910 910 910 910Enrollment 874 860 862 897 931 913 886 950 950Available Space 36 50 48 12 (22) (4) 24 (40) (40)Comments
William H. Farquhar MS Program Capacity 881 881 881 881 796 796 796 796 796Enrollment 641 594 620 625 626 602 621 650 650Available Space 240 287 261 256 170 194 175 0 0Comments Planning Mod.
for CompleteMod. Aug. 2016
Francis Scott Key MS Program Capacity 944 944 944 944 944 944 944 944 944Enrollment 882 916 933 1001 982 1045 1075 1100 1100Available Space 62 28 10 (58) (38) (102) (132) (156) (156)Comments
White Oak MS Program Capacity 945 945 945 945 945 945 945 945 945Enrollment 713 722 761 826 889 953 964 950 950Available Space 232 223 184 119 56 (8) (19) (5) (5)Comments
Projections
Modernizationin Progres

Approved Actions and Planning Issues • 4-75
NORTHEAST CONSORTIUM
Actual
Schools 12–13 13–14 14–15 15–16 16-17 17-18 18-19 2022 2027Broad Acres ES CSR Program Capacity 618 618 618 618 618 618 618
Enrollment 701 750 764 773 785 749 734Available Space (83) (132) (146) (155) (167) (131) (116)Comments Facility
Planningfor Addition
Burnt Mills ES CSR Program Capacity 358 358 358 358 358 358 358Enrollment 505 516 540 536 539 537 535Available Space (147) (158) (182) (178) (181) (179) (177)Comments
Burtonsville ES CSR Program Capacity 455 455 455 455 455 455 455Enrollment 688 661 663 655 660 654 669Available Space (233) (206) (208) (200) (205) (199) (214)Comments Facility
Planningfor Addition
Cannon Road ES CSR Program Capacity 521 521 521 521 521 521 521Enrollment 417 425 435 444 446 437 427Available Space 104 96 86 77 75 84 94Comments
Cloverly ES Program Capacity 454 454 454 454 454 454 454Enrollment 456 452 463 460 455 453 453Available Space (2) 2 (9) (6) (1) 1 1Comments
Cresthaven ES CSR Program Capacity 493 480 480 480 480 480 480Grades (3-5) Enrollment 486 472 515 515 537 489 473Paired With Available Space 7 8 (35) (35) (57) (9) 7
Roscoe R. Nix ES Comments +2 ELC +1 ELC
Dr. Charles R. Drew ES CSR Program Capacity 431 431 431 431 431 431 431Enrollment 468 469 471 477 474 483 475Available Space (37) (38) (40) (46) (43) (52) (44)Comments
Fairland ES CSR Program Capacity 650 650 650 650 650 650 650Enrollment 606 582 580 571 564 574 560Available Space 44 68 70 79 86 76 90Comments
Galway ES CSR Program Capacity 733 733 733 733 733 733 733Enrollment 832 813 804 774 754 746 743Available Space (99) (80) (71) (41) (21) (13) (10)Comments
Greencastle ES CSR Program Capacity 567 567 567 567 567 567 567Enrollment 733 756 721 711 701 694 690Available Space (166) (189) (154) (144) (134) (127) (123)Comments Facility
Planningfor Addition
Projections

4-76 • Approved Actions and Planning Issues
NORTHEAST CONSORTIUM
Actual
Schools 12–13 13–14 14–15 15–16 16-17 17-18 18-19 2022 2027Jackson Road ES CSR Program Capacity 661 661 661 661 661 661 661
Enrollment 679 694 701 699 675 677 665Available Space (18) (33) (40) (38) (14) (16) (4)Comments
Roscoe R. Nix ES CSR Program Capacity 480 480 480 480 480 480 480Grades (preK-2) Enrollment 542 556 524 509 494 491 489
Paired with Available Space (62) (76) (44) (29) (14) (11) (9)Cresthaven ES Comments
William T. Page ES CSR Program Capacity 341 341 341 341 341 341 341Enrollment 404 424 429 433 424 421 420Available Space (63) (83) (88) (92) (83) (80) (79)Comments
Sherwood ES Program Capacity 568 568 568 568 568 568 568Enrollment 499 525 510 526 537 542 537Available Space 69 43 58 42 31 26 31Comments +1 PEP -1 SCB
+1 AUT
Stonegate ES Program Capacity 395 395 395 395 395 395 395Enrollment 467 460 475 467 464 462 460Available Space (72) (65) (80) (72) (69) (67) (65)Comments Facility
Planningfor Mod.
Westover ES Program Capacity 293 293 293 293 293 293 293Enrollment 322 330 341 337 332 328 338Available Space (29) (37) (48) (44) (39) (35) (45)Comments
Cluster Information HS Utilization 94% 92% 92% 91% 92% 93% 96% 98% 98%HS Enrollment 5419 5296 5308 5267 5303 5392 5528 5550 5550MS Utilization 87% 87% 89% 94% 97% 99% 99% 103% 103%MS Enrollment 3890 3881 3988 4175 4248 4328 4329 4400 4400ES Utilization 110% 111% 112% 111% 110% 109% 108% 109% 109%ES Enrollment 8805 8885 8936 8887 8841 8737 8668 8700 8700
Planningfor Modernization
Projections

Approved Actions and Planning Issues • 4-77
NORTHEAST CONSORTIUM
Demographic Characteristics of Schools2011–12
Total Two or more Black or Mobility Schools Enrollment races % Afr. Amer. % Asian% Hispanic % White % FARMS%* ESOL%** Rate%***James Blake HS 1762 ≤ 5.0% 43.6% 9.4% 20.1% 22.6% 29.2% ≤ 5.0% 12.8%Paint Branch HS 1931 ≤ 5.0% 52.9% 15.6% 15.7% 11.5% 33.9% ≤ 5.0% 11.2%Springbrook HS 1726 ≤ 5.0% 41.2% 12.5% 34.1% 9.2% 44.0% 7.0% 13.8%Benjamin Banneker MS 780 5.6% 60.5% 10.6% 14.7% 8.2% 45.3% ≤ 5.0% 13.7%Briggs Chaney MS 874 ≤ 5.0% 49.1% 13.7% 20.1% 12.2% 44.3% 6.9% 15.5%William H. Farquhar MS 641 5.3% 20.3% 13.7% 11.7% 49.0% 12.3% ≤ 5.0% 6.9%Francis Scott Key MS 882 ≤ 5.0% 47.5% 11.1% 34.4% 5.4% 62.0% 14.5% 16.4%White Oak MS 713 ≤ 5.0% 35.5% 10.2% 38.1% 12.6% 57.5% 16.7% 14.6%Broad Acres ES 702 ≤ 5.0% 16.0% 6.6% 76.4% ≤ 5.0% 93.6% 73.5% 24.0%Burnt Mills ES 505 ≤ 5.0% 66.7% ≤ 5.0% 20.6% 6.7% 64.4% 26.3% 28.6%Burtonsville ES 688 5.1% 60.2% 16.6% 11.6% 6.1% 47.5% 21.5% 13.1%Cannon Road ES 417 ≤ 5.0% 36.5% 10.1% 39.3% 9.1% 59.0% 17.7% 16.8%Cloverly ES 456 6.8% 20.2% 15.4% 19.1% 38.4% 16.7% 12.7% 12.5%Cresthaven ES 486 ≤ 5.0% 37.2% 11.5% 43.8% 5.3% 69.8% 28.0% 15.8%Dr. Charles R. Drew ES 468 ≤ 5.0% 45.5% 14.3% 21.8% 13.9% 50.0% 20.9% 13.8%Fairland ES 606 ≤ 5.0% 57.3% 9.7% 20.6% 9.2% 53.8% 19.6% 21.4%Galway ES 832 ≤ 5.0% 56.9% 13.3% 22.5% ≤ 5.0% 55.6% 28.4% 14.4%Greencastle ES 733 ≤ 5.0% 70.5% 8.5% 16.4% ≤ 5.0% 62.3% 18.6% 23.6%Jackson Road ES 679 ≤ 5.0% 49.0% 11.0% 34.2% ≤ 5.0% 70.4% 30.8% 14.7%Roscoe R. Nix ES 542 ≤ 5.0% 34.9% 12.0% 46.3% 5.2% 68.6% 42.4% 18.5%William T. Page ES 405 ≤ 5.0% 51.1% 20.5% 17.5% 6.9% 49.9% 22.2% 18.4%Sherwood ES 499 ≤ 5.0% 18.4% 13.2% 10.4% 52.9% 13.2% 8.8% 7.9%Stonegate ES 467 5.6% 31.9% 14.6% 15.4% 32.5% 22.9% 6.9% 9.8%Westover ES 322 ≤ 5.0% 32.3% 15.2% 19.6% 27.3% 23.9% 12.7% 12.3%Elementary Cluster Total 8807 ≤ 5.0% 44.4% 12.0% 27.9% 12.0% 55.6% 26.9% 17.0%
Elementary County Total 72303 ≤ 5.0% 20.6% 14.0% 28.8% 31.4% 39.0% 25.6% 12.6%*Percent of students approved for Free and Reduced–priced Meals Program (FARMS) during the 2012–2013 school year.
**Percent of English for Speakers of Other Languages (ESOL) during the 2012–2013 school year. High School students are served in regional ESOL centers.
***Mobility Rate is the number of entries plus withdrawals during the 2011–2012 school year compared to total enrollment.Notes: Native Hawaiian/Pacific Islander and American Indian/Alaskan Native categories total less than 1% and were therefore excluded from the table.
Due to federal and state guidelines, demographic characteristics of schools of less than or equal to 5.0% are reported as ≤ 5.0%.
2012–2013 2012–2013
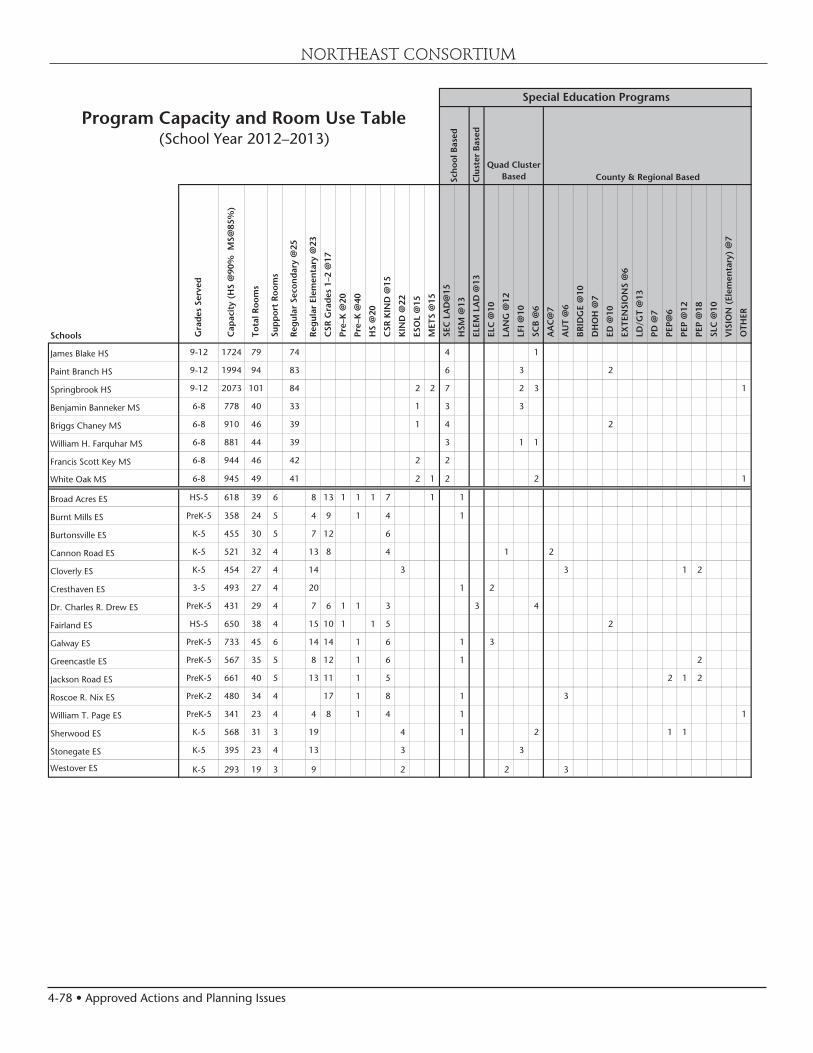
4-78 • Approved Actions and Planning Issues
NORTHEAST CONSORTIUM
(School Year 2012–2013)
Schools Gra
des
Ser
ved
Cap
acit
y (H
S @
90%
MS@
85%
)
To
tal R
oom
s
Su
pp
ort
Ro
om
s
Reg
ula
r Se
con
dar
y @
25
Reg
ular
Ele
men
tary
@23
CSR
Gra
des
1–2
@17
Pre
–K @
20
Pre
–K @
40
HS
@20
CSR
KIN
D @
15
KIN
D @
22
ESO
L @
15
MET
S @
15
SEC
LA
D@
15
HSM
@13
ELE
M L
AD
@13
ELC
@10
LA
NG
@12
LFI
@10
SC
B @
6
AA
C@
7
AU
T @
6
BR
IDG
E @
10
DH
OH
@7
ED
@10
EX
TEN
SIO
NS
@6
LD
/GT
@13
PD
@7
PEP
@6
PEP
@12
PEP
@18
SLC
@10
VIS
ION
(El
emen
tary
) @
7
OTH
ER
James Blake HS 9-12 1724 79 74 4 1
Paint Branch HS 9-12 1994 94 83 6 3 2
Springbrook HS 9-12 2073 101 84 2 2 7 2 3 1
Benjamin Banneker MS 6-8 778 40 33 1 3 3
Briggs Chaney MS 6-8 910 46 39 1 4 2
William H. Farquhar MS 6-8 881 44 39 3 1 1
Francis Scott Key MS 6-8 944 46 42 2 2
White Oak MS 6-8 945 49 41 2 1 2 2 1
Broad Acres ES HS-5 618 39 6 8 13 1 1 1 7 1 1
Burnt Mills ES PreK-5 358 24 5 4 9 1 4 1
Burtonsville ES K-5 455 30 5 7 12 6
Cannon Road ES K-5 521 32 4 13 8 4 1 2
Cloverly ES K-5 454 27 4 14 3 3 1 2
Cresthaven ES 3-5 493 27 4 20 1 2
Dr. Charles R. Drew ES PreK-5 431 29 4 7 6 1 1 3 3 4
Fairland ES HS-5 650 38 4 15 10 1 1 5 2
Galway ES PreK-5 733 45 6 14 14 1 6 1 3
Greencastle ES PreK-5 567 35 5 8 12 1 6 1 2
Jackson Road ES PreK-5 661 40 5 13 11 1 5 2 1 2
Roscoe R. Nix ES PreK-2 480 34 4 17 1 8 1 3
William T. Page ES PreK-5 341 23 4 4 8 1 4 1 1
Sherwood ES K-5 568 31 3 19 4 1 2 1 1
Stonegate ES K-5 395 23 4 13 3 3
Westover ES K-5 293 19 3 9 2 2 3
Program Capacity and Room Use Table
Sch
ool B
ased
Quad Cluster BasedC
lust
er B
ased
Special Education Programs
County & Regional Based
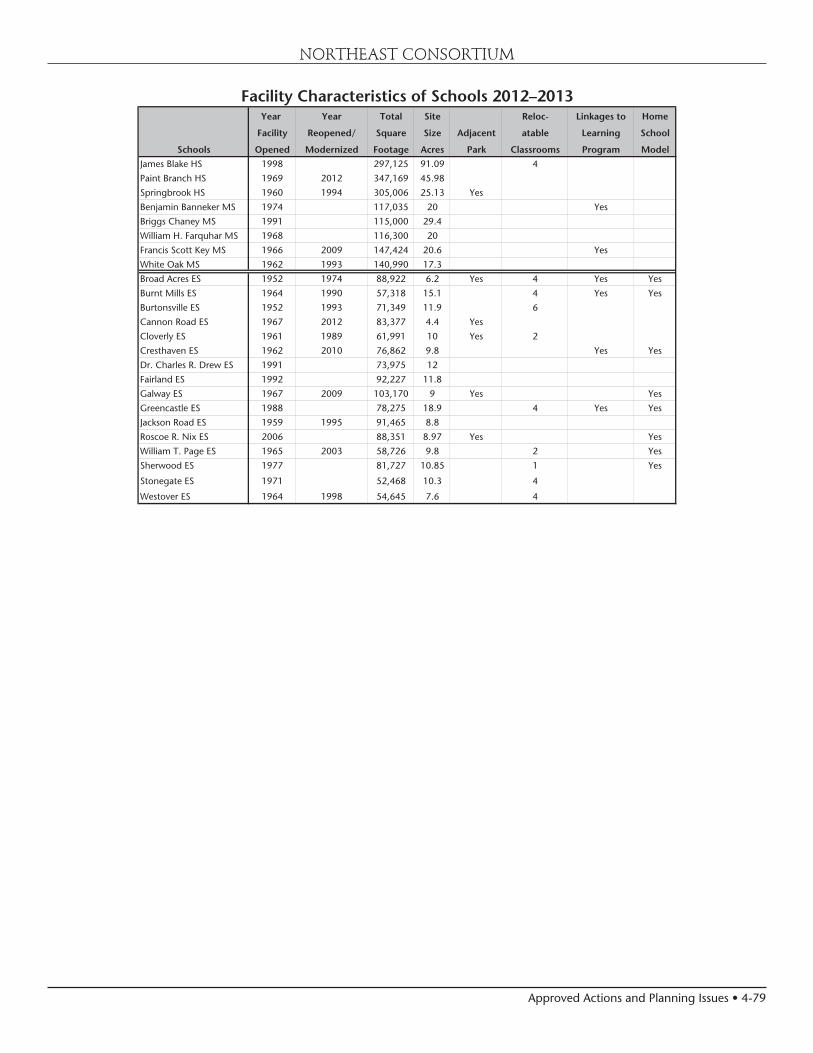
Approved Actions and Planning Issues • 4-79
NORTHEAST CONSORTIUM
Year Year Total Site Reloc- Linkages to Home
Facility Reopened/ Square Size Adjacent atable Learning School
Schools Opened Modernized Footage Acres Park Classrooms Program Model
James Blake HS 1998 297,125 91.09 4
Paint Branch HS 1969 2012 347,169 45.98
Springbrook HS 1960 1994 305,006 25.13 Yes
Benjamin Banneker MS 1974 117,035 20 Yes
Briggs Chaney MS 1991 115,000 29.4
William H. Farquhar MS 1968 116,300 20
Francis Scott Key MS 1966 2009 147,424 20.6 Yes
White Oak MS 1962 1993 140,990 17.3
Broad Acres ES 1952 1974 88,922 6.2 Yes 4 Yes Yes
Burnt Mills ES 1964 1990 57,318 15.1 4 Yes Yes
Burtonsville ES 1952 1993 71,349 11.9 6
Cannon Road ES 1967 2012 83,377 4.4 Yes
Cloverly ES 1961 1989 61,991 10 Yes 2
Cresthaven ES 1962 2010 76,862 9.8 Yes Yes
Dr. Charles R. Drew ES 1991 73,975 12
Fairland ES 1992 92,227 11.8
Galway ES 1967 2009 103,170 9 Yes Yes
Greencastle ES 1988 78,275 18.9 4 Yes Yes
Jackson Road ES 1959 1995 91,465 8.8
Roscoe R. Nix ES 2006 88,351 8.97 Yes Yes
William T. Page ES 1965 2003 58,726 9.8 2 Yes
Sherwood ES 1977 81,727 10.85 1 Yes
Stonegate ES 1971 52,468 10.3 4
Westover ES 1964 1998 54,645 7.6 4
Facility Characteristics of Schools 2012–2013
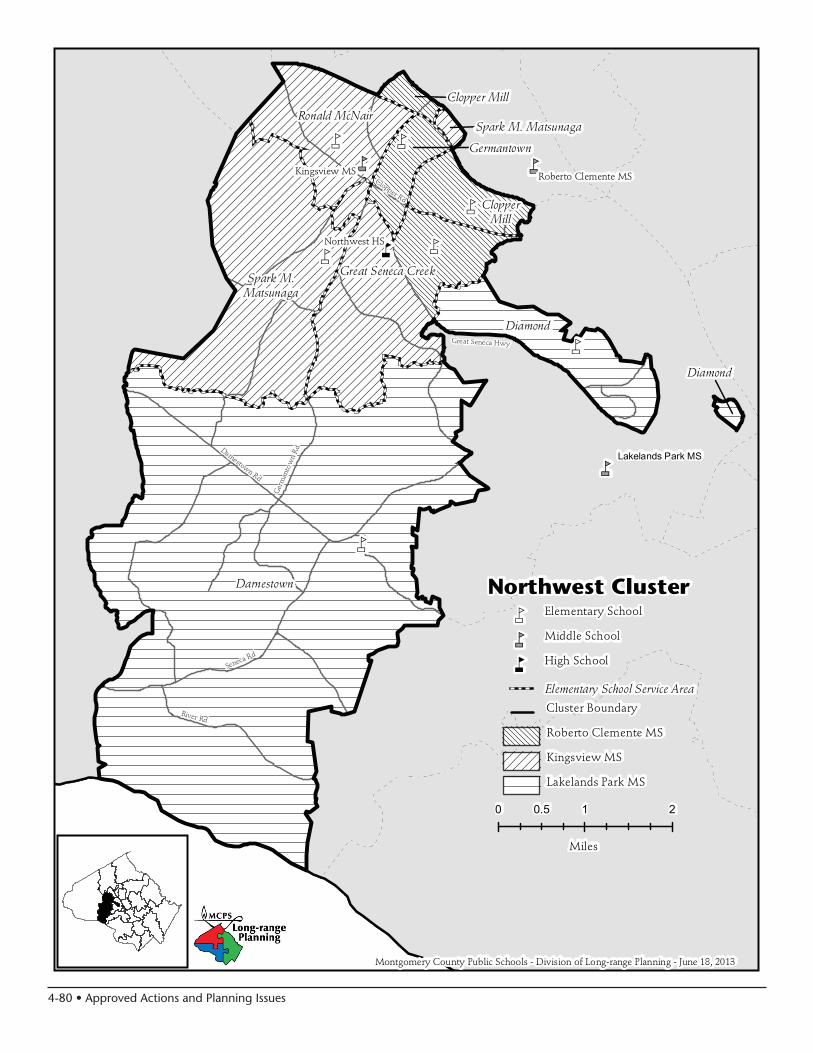
4-80 • Approved Actions and Planning Issues
n
nm nm
nm
nm
nm
nm nm
nm
nm
nm
Northwest Cluster
Montgomery County Public Schools - Division of Long-range Planning - June 18, 2013
Elementary School Service Area
nm Elementary School
nm Middle School
n High School
Northwest HS
ClopperMill
Cluster Boundary
Roberto Clemente MSKingsview MS
Lakelands Park MS
Roberto Clemente MS
Kingsview MS
Lakelands Park MS
0 1 20.5
Miles
Darnestown
Diamond
Great Seneca CreekSpark M.
Matsunaga
Ronald McNair
Diamond
Germantown
Clopper Mill
Spark M. Matsunaga
Clopper Rd
Great Seneca Hwy
Ger
man
tow
n R
dDarnestown Rd
Seneca Rd
River Rd
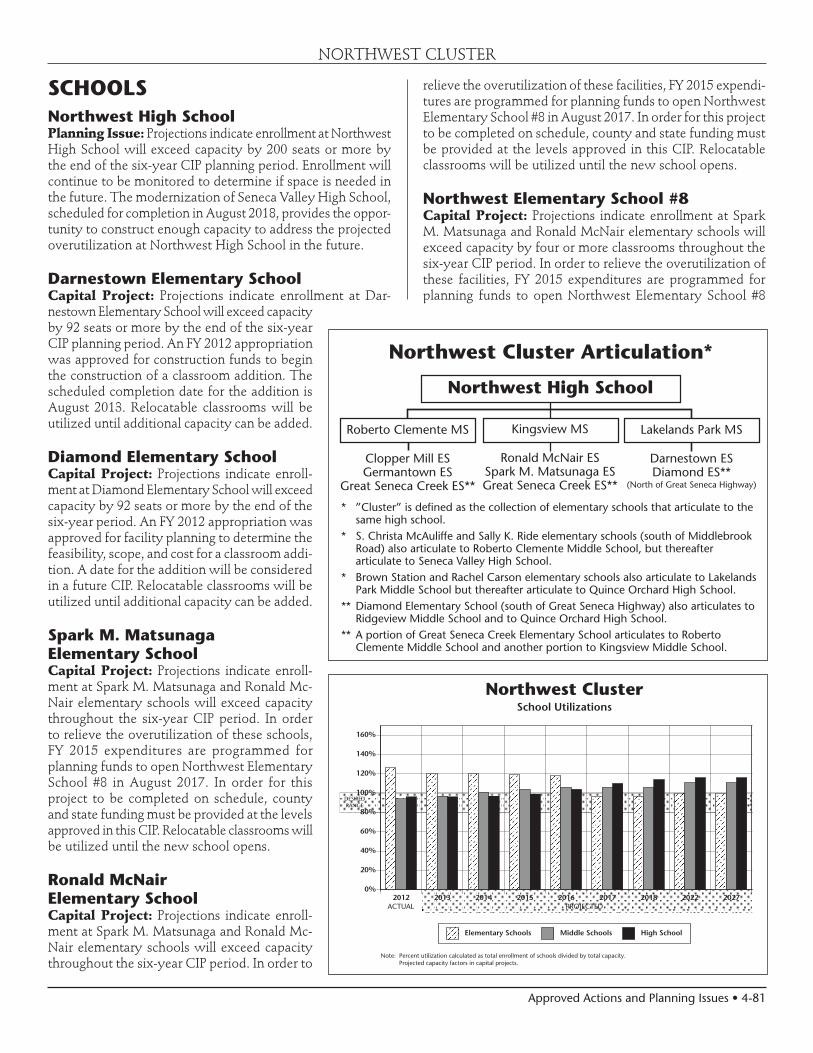
Approved Actions and Planning Issues • 4-81
Northwest Cluster Articulation*
Northwest High School
Lakelands Park MS
Darnestown ESDiamond ES**
(North of Great Seneca Highway)
Roberto Clemente MS
Clopper Mill ESGermantown ES
Great Seneca Creek ES**
* ”Cluster” is defined as the collection of elementary schools that articulate to the same high school.
* S. Christa McAuliffe and Sally K. Ride elementary schools (south of Middlebrook Road) also articulate to Roberto Clemente Middle School, but thereafter articulate to Seneca Valley High School.
* Brown Station and Rachel Carson elementary schools also articulate to Lakelands Park Middle School but thereafter articulate to Quince Orchard High School.
** Diamond Elementary School (south of Great Seneca Highway) also articulates to Ridgeview Middle School and to Quince Orchard High School.
** A portion of Great Seneca Creek Elementary School articulates to Roberto Clemente Middle School and another portion to Kingsview Middle School.
Kingsview MS
Ronald McNair ESSpark M. Matsunaga ESGreat Seneca Creek ES**
DESIREDRANGE
Note: Percent utilization calculated as total enrollment of schools divided by total capacity.Projected capacity factors in capital projects.
ACTUAL PROJECTED2012 2013 2014 2015 2016 2017 2018 2022 2027
0%
20%
40%
60%
80%
100%
120%
140%
160%
Elementary Schools Middle Schools High School
Northwest ClusterSchool Utilizations
SCHOOLSNorthwest High SchoolPlanning Issue: Projections indicate enrollment at Northwest High School will exceed capacity by 200 seats or more by the end of the six-year CIP planning period. Enrollment will continue to be monitored to determine if space is needed in the future. The modernization of Seneca Valley High School, scheduled for completion in August 2018, provides the oppor-tunity to construct enough capacity to address the projected overutilization at Northwest High School in the future.
Darnestown Elementary SchoolCapital Project: Projections indicate enrollment at Dar-nestown Elementary School will exceed capacity by 92 seats or more by the end of the six-year CIP planning period. An FY 2012 appropriation was approved for construction funds to begin the construction of a classroom addition. The scheduled completion date for the addition is August 2013. Relocatable classrooms will be utilized until additional capacity can be added.
Diamond Elementary SchoolCapital Project: Projections indicate enroll-ment at Diamond Elementary School will exceed capacity by 92 seats or more by the end of the six-year period. An FY 2012 appropriation was approved for facility planning to determine the feasibility, scope, and cost for a classroom addi-tion. A date for the addition will be considered in a future CIP. Relocatable classrooms will be utilized until additional capacity can be added.
Spark M. Matsunaga Elementary SchoolCapital Project: Projections indicate enroll-ment at Spark M. Matsunaga and Ronald Mc-Nair elementary schools will exceed capacity throughout the six-year CIP period. In order to relieve the overutilization of these schools, FY 2015 expenditures are programmed for planning funds to open Northwest Elementary School #8 in August 2017. In order for this project to be completed on schedule, county and state funding must be provided at the levels approved in this CIP. Relocatable classrooms will be utilized until the new school opens.
Ronald McNair Elementary SchoolCapital Project: Projections indicate enroll-ment at Spark M. Matsunaga and Ronald Mc-Nair elementary schools will exceed capacity throughout the six-year CIP period. In order to
relieve the overutilization of these facilities, FY 2015 expendi-tures are programmed for planning funds to open Northwest Elementary School #8 in August 2017. In order for this project to be completed on schedule, county and state funding must be provided at the levels approved in this CIP. Relocatable classrooms will be utilized until the new school opens.
Northwest Elementary School #8Capital Project: Projections indicate enrollment at Spark M. Matsunaga and Ronald McNair elementary schools will exceed capacity by four or more classrooms throughout the six-year CIP period. In order to relieve the overutilization of these facilities, FY 2015 expenditures are programmed for planning funds to open Northwest Elementary School #8
NORTHWEST CLUSTER
4-82 • Approved Actions and Planning Issues
in August 2017. In order for this project to be completed on schedule, county and state funding must be provided at the levels approved in this CIP.
CAPITAL PROJECTS
School Project Project Status*Date of Completion
Darnestown ES Classroom addition
Approved Aug. 2013
Diamond ES Classroom addition
Proposed TBD
Northwest ES #8 New school Programmed Aug. 2017Approved—Project has an FY 2013 or FY 2014 appropriation approved in the FY 2013 or FY 2014 Capital Budget.Programmed—Project has expenditures programmed in a future year of the CIP for planning and/or construction funds.Proposed—Project has facility planning funds approved for FY 2013 or FY 2014 for a feasibility study.
NORTHWEST CLUSTER
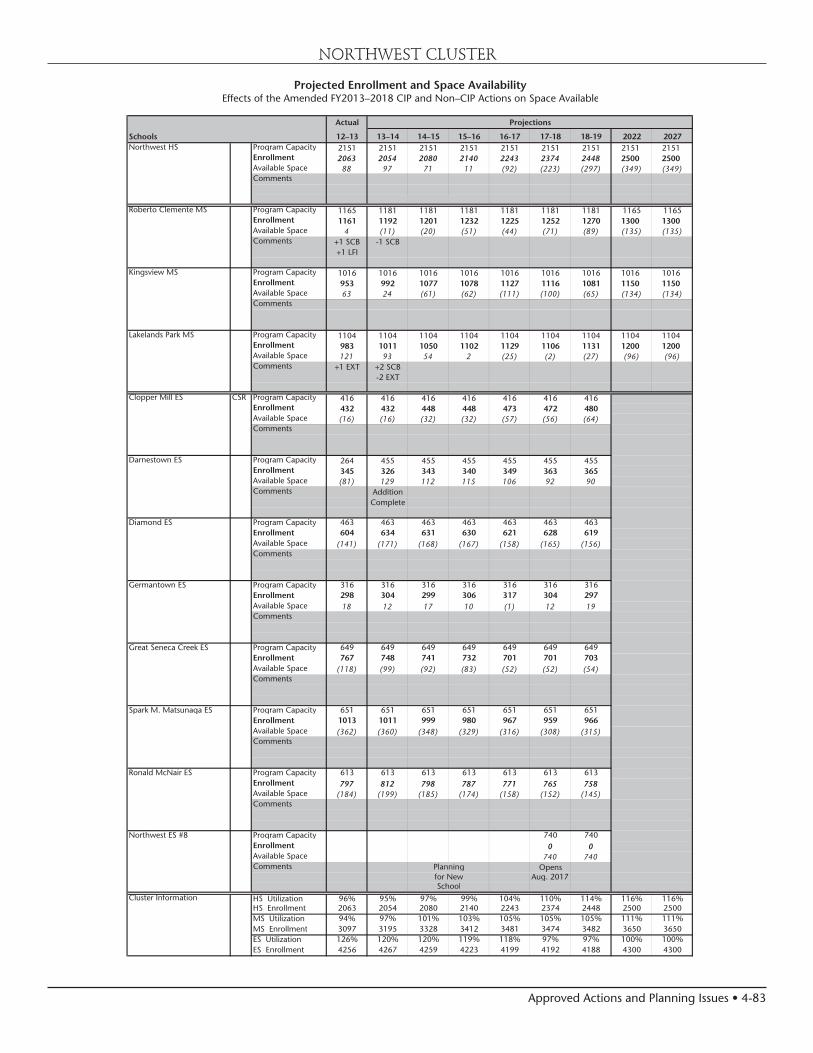
Approved Actions and Planning Issues • 4-83
NORTHWEST CLUSTER
Projected Enrollment and Space AvailabilityEffects of the Amended FY2013–2018 CIP and Non–CIP Actions on Space Available
Actual
Schools 12–13 13–14 14–15 15–16 16-17 17-18 18-19 2022 2027Northwest HS Program Capacity 2151 2151 2151 2151 2151 2151 2151 2151 2151
Enrollment 2063 2054 2080 2140 2243 2374 2448 2500 2500Available Space 88 97 71 11 (92) (223) (297) (349) (349)Comments
Roberto Clemente MS Program Capacity 1165 1181 1181 1181 1181 1181 1181 1165 1165Enrollment 1161 1192 1201 1232 1225 1252 1270 1300 1300Available Space 4 (11) (20) (51) (44) (71) (89) (135) (135)Comments +1 SCB -1 SCB
+1 LFI
Kingsview MS Program Capacity 1016 1016 1016 1016 1016 1016 1016 1016 1016Enrollment 953 992 1077 1078 1127 1116 1081 1150 1150Available Space 63 24 (61) (62) (111) (100) (65) (134) (134)Comments
Lakelands Park MS Program Capacity 1104 1104 1104 1104 1104 1104 1104 1104 1104Enrollment 983 1011 1050 1102 1129 1106 1131 1200 1200Available Space 121 93 54 2 (25) (2) (27) (96) (96)Comments +1 EXT +2 SCB
-2 EXT
Clopper Mill ES CSR Program Capacity 416 416 416 416 416 416 416Enrollment 432 432 448 448 473 472 480Available Space (16) (16) (32) (32) (57) (56) (64)Comments
Darnestown ES Program Capacity 264 455 455 455 455 455 455Enrollment 345 326 343 340 349 363 365Available Space (81) 129 112 115 106 92 90Comments Addition
Complete
Diamond ES Program Capacity 463 463 463 463 463 463 463Enrollment 604 634 631 630 621 628 619Available Space (141) (171) (168) (167) (158) (165) (156)Comments
Germantown ES Program Capacity 316 316 316 316 316 316 316Enrollment 298 304 299 306 317 304 297Available Space 18 12 17 10 (1) 12 19Comments
Great Seneca Creek ES Program Capacity 649 649 649 649 649 649 649
Enrollment 767 748 741 732 701 701 703Available Space (118) (99) (92) (83) (52) (52) (54)Comments
Spark M. Matsunaga ES Program Capacity 651 651 651 651 651 651 651Enrollment 1013 1011 999 980 967 959 966Available Space (362) (360) (348) (329) (316) (308) (315)Comments
Ronald McNair ES Program Capacity 613 613 613 613 613 613 613Enrollment 797 812 798 787 771 765 758Available Space (184) (199) (185) (174) (158) (152) (145)Comments
Northwest ES #8 Program Capacity 740 740Enrollment 0 0Available Space 740 740Comments Opens
Aug. 2017
Cluster Information HS Utilization 96% 95% 97% 99% 104% 110% 114% 116% 116%HS Enrollment 2063 2054 2080 2140 2243 2374 2448 2500 2500MS Utilization 94% 97% 101% 103% 105% 105% 105% 111% 111%MS Enrollment 3097 3195 3328 3412 3481 3474 3482 3650 3650ES Utilization 126% 120% 120% 119% 118% 97% 97% 100% 100%ES Enrollment 4256 4267 4259 4223 4199 4192 4188 4300 4300
Projections
Planningfor NewSchool
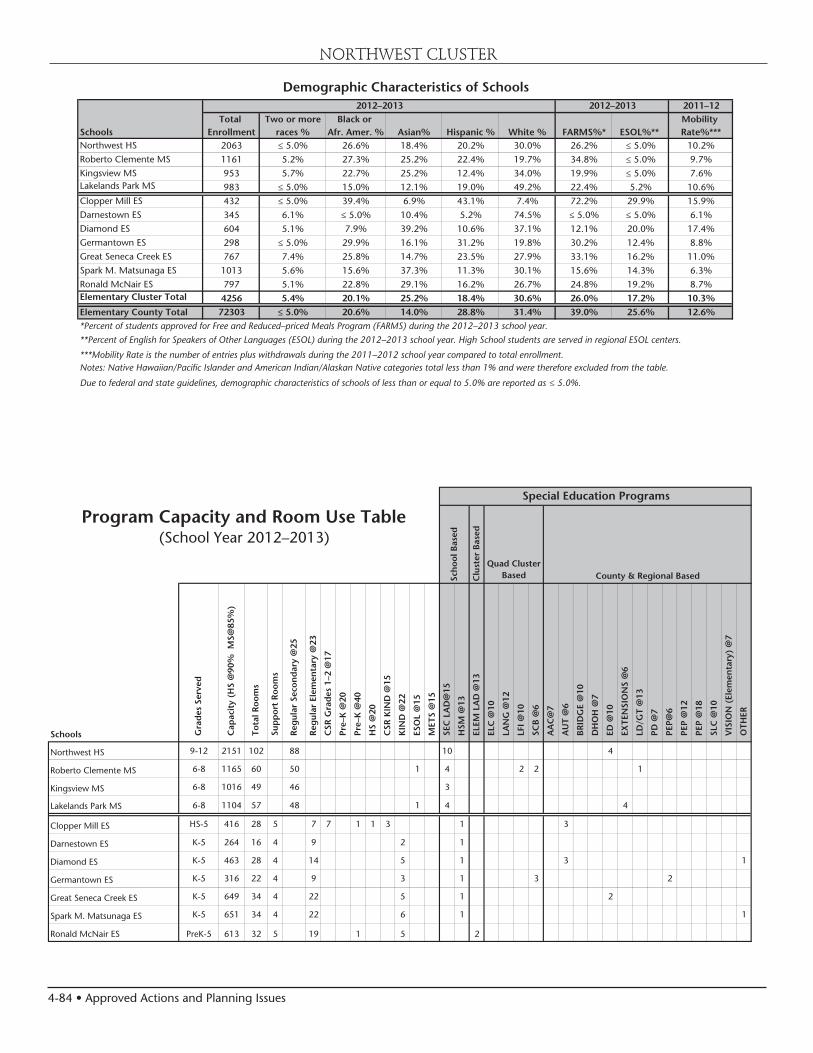
4-84 • Approved Actions and Planning Issues
NORTHWEST CLUSTER
(School Year 2012–2013)
Schools Gra
des
Ser
ved
Cap
acit
y (H
S @
90%
MS@
85%
)
Tot
al R
oom
s
Sup
por
t R
oom
s
Reg
ular
Sec
ond
ary
@25
Reg
ular
Ele
men
tary
@23
CSR
Gra
des
1–2
@17
Pre
–K @
20
Pre
–K @
40
HS
@20
CSR
KIN
D @
15
KIN
D @
22
ESO
L @
15
MET
S @
15
SEC
LA
D@
15
HSM
@13
ELE
M L
AD
@13
ELC
@10
LA
NG
@12
LFI
@10
SC
B @
6
AA
C@
7
AU
T @
6
BR
IDG
E @
10
DH
OH
@7
ED
@10
EX
TEN
SIO
NS
@6
LD
/GT
@13
PD
@7
PEP
@6
PEP
@12
PEP
@18
SLC
@10
VIS
ION
(El
emen
tary
) @
7
OTH
ERNorthwest HS 9-12 2151 102 88 10 4
Roberto Clemente MS 6-8 1165 60 50 1 4 2 2 1
Kingsview MS 6-8 1016 49 46 3
Lakelands Park MS 6-8 1104 57 48 1 4 4
Clopper Mill ES HS-5 416 28 5 7 7 1 1 3 1 3
Darnestown ES K-5 264 16 4 9 2 1
Diamond ES K-5 463 28 4 14 5 1 3 1
Germantown ES K-5 316 22 4 9 3 1 3 2
Great Seneca Creek ES K-5 649 34 4 22 5 1 2
Spark M. Matsunaga ES K-5 651 34 4 22 6 1 1
Ronald McNair ES PreK-5 613 32 5 19 1 5 2
Program Capacity and Room Use Table
Sch
ool B
ased
Quad Cluster BasedC
lust
er B
ased
Special Education Programs
County & Regional Based
Demographic Characteristics of Schools2011–12
Total Two or more Black or Mobility Schools Enrollment races % Afr. Amer. % Asian% Hispanic % White % FARMS%* ESOL%** Rate%***Northwest HS 2063 ≤ 5.0% 26.6% 18.4% 20.2% 30.0% 26.2% ≤ 5.0% 10.2%Roberto Clemente MS 1161 5.2% 27.3% 25.2% 22.4% 19.7% 34.8% ≤ 5.0% 9.7%Kingsview MS 953 5.7% 22.7% 25.2% 12.4% 34.0% 19.9% ≤ 5.0% 7.6%Lakelands Park MS 983 ≤ 5.0% 15.0% 12.1% 19.0% 49.2% 22.4% 5.2% 10.6%Clopper Mill ES 432 ≤ 5.0% 39.4% 6.9% 43.1% 7.4% 72.2% 29.9% 15.9%Darnestown ES 345 6.1% ≤ 5.0% 10.4% 5.2% 74.5% ≤ 5.0% ≤ 5.0% 6.1%Diamond ES 604 5.1% 7.9% 39.2% 10.6% 37.1% 12.1% 20.0% 17.4%Germantown ES 298 ≤ 5.0% 29.9% 16.1% 31.2% 19.8% 30.2% 12.4% 8.8%Great Seneca Creek ES 767 7.4% 25.8% 14.7% 23.5% 27.9% 33.1% 16.2% 11.0%Spark M. Matsunaga ES 1013 5.6% 15.6% 37.3% 11.3% 30.1% 15.6% 14.3% 6.3%Ronald McNair ES 797 5.1% 22.8% 29.1% 16.2% 26.7% 24.8% 19.2% 8.7%Elementary Cluster Total 4256 5.4% 20.1% 25.2% 18.4% 30.6% 26.0% 17.2% 10.3%
Elementary County Total 72303 ≤ 5.0% 20.6% 14.0% 28.8% 31.4% 39.0% 25.6% 12.6%*Percent of students approved for Free and Reduced–priced Meals Program (FARMS) during the 2012–2013 school year.
**Percent of English for Speakers of Other Languages (ESOL) during the 2012–2013 school year. High School students are served in regional ESOL centers.
***Mobility Rate is the number of entries plus withdrawals during the 2011–2012 school year compared to total enrollment.Notes: Native Hawaiian/Pacific Islander and American Indian/Alaskan Native categories total less than 1% and were therefore excluded from the table.
Due to federal and state guidelines, demographic characteristics of schools of less than or equal to 5.0% are reported as ≤ 5.0%.
2012–2013 2012–2013

Approved Actions and Planning Issues • 4-85
NORTHWEST CLUSTER
Year Year Total Site Reloc- Linkages to Home
Facility Reopened/ Square Size Adjacent atable Learning School
Schools Opened Modernized Footage Acres Park Classrooms Program Model
Northwest HS 1998 340,867 34.6 Yes
Roberto Clemente MS 1992 148,246 19.9
Kingsview MS 1997 140,398 18.5 Yes
Lakelands Park MS 2005 153,588 8.11 Yes
Clopper Mill ES 1986 64,851 9 Yes 4 Yes
Darnestown ES 1954 1980 37,685 7.2 6 Yes
Diamond ES 1975 64,950 10 Yes 3 Yes
Germantown ES 1935 1978 57,668 7.8 Yes
Great Seneca Creek ES 2006 82,511 13.71 3 Yes
Spark M. Matsunaga ES 2001 90,718 11.8 15 Yes
Ronald McNair ES 1990 78,275 10 Yes 5 Yes
Facility Characteristics of Schools 2012–2013

4-86 • Approved Actions and Planning Issues
n
nm
nm
nm
Poolesville Cluster
Montgomery County Public Schools - Division of Long-range Planning - June 18, 2013
Elementary School Service Area
nm Elementary School
nm Middle School
n High School
Poolesville HS
Poolesville
Monocacy
Cluster Boundary
0 2 41
Miles
John Poole MS
Comus Rd
Old hun
dred
Rd
Beall
sville
Rd
Dic
kers
on R
d
Darnestown Rd
Bucklodge R
d
Whites Ferry Rd
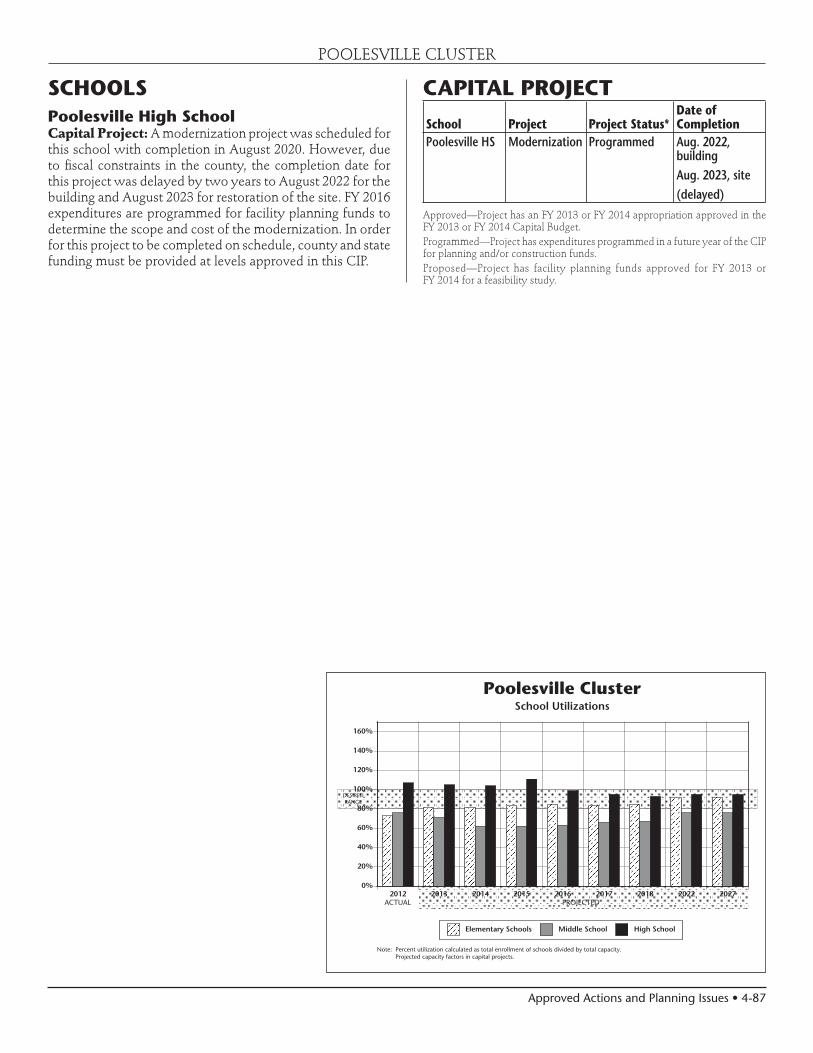
Approved Actions and Planning Issues • 4-87
DESIREDRANGE
Note: Percent utilization calculated as total enrollment of schools divided by total capacity.Projected capacity factors in capital projects.
2012 2013 2014 2015 2016 2017 2018 2022 20270%
20%
40%
60%
80%
100%
120%
140%
160%
Elementary Schools Middle School High School
ACTUAL PROJECTED
Poolesville ClusterSchool Utilizations
POOLESVILLE CLUSTER
SCHOOLSPoolesville High SchoolCapital Project: A modernization project was scheduled for this school with completion in August 2020. However, due to fiscal constraints in the county, the completion date for this project was delayed by two years to August 2022 for the building and August 2023 for restoration of the site. FY 2016 expenditures are programmed for facility planning funds to determine the scope and cost of the modernization. In order for this project to be completed on schedule, county and state funding must be provided at levels approved in this CIP.
CAPITAL PROJECT
School Project Project Status*Date of Completion
Poolesville HS Modernization Programmed Aug. 2022, buildingAug. 2023, site(delayed)
Approved—Project has an FY 2013 or FY 2014 appropriation approved in the FY 2013 or FY 2014 Capital Budget.Programmed—Project has expenditures programmed in a future year of the CIP for planning and/or construction funds.Proposed—Project has facility planning funds approved for FY 2013 or FY 2014 for a feasibility study.

4-88 • Approved Actions and Planning Issues
POOLESVILLE CLUSTER
Projected Enrollment and Space AvailabilityEffects of the Amended FY2013–2018 CIP and Non–CIP Actions on Space Available
Actual
Schools 12–13 13–14 14–15 15–16 16-17 17-18 18-19 2022 2027Poolesville HS Program Capacity 1152 1152 1152 1152 1152 1152 1152 1152 1152
Enrollment 1234 1215 1196 1167 1137 1100 1076 1100 1100Available Space (82) (63) (44) (15) 15 52 76 52 52Comments Facility
Planningfor Mod.
John Poole MS Program Capacity 459 459 459 459 459 459 459 459 459Enrollment 350 324 286 284 291 302 307 350 350Available Space 109 135 173 175 168 157 152 109 109Comments
Monocacy ES Program Capacity 219 219 219 219 219 219 219Enrollment 159 157 156 155 150 150 150Available Space 60 62 63 64 69 69 69Comments
Poolesville ES Program Capacity 539 539 539 539 539 539 539Enrollment 389 377 405 414 417 421 425Available Space 150 162 134 125 122 118 114Comments
Cluster Information HS Utilization 107% 105% 104% 101% 99% 95% 93% 95% 95%HS Enrollment 1234 1215 1196 1167 1137 1100 1076 1100 1100MS Utilization 76% 71% 62% 62% 63% 66% 67% 76% 76%MS Enrollment 350 324 286 284 291 302 307 350 350ES Utilization 72% 70% 74% 75% 75% 75% 76% 92% 92%ES Enrollment 548 534 561 569 567 571 575 700 700
Projections
Planningfor Modernization
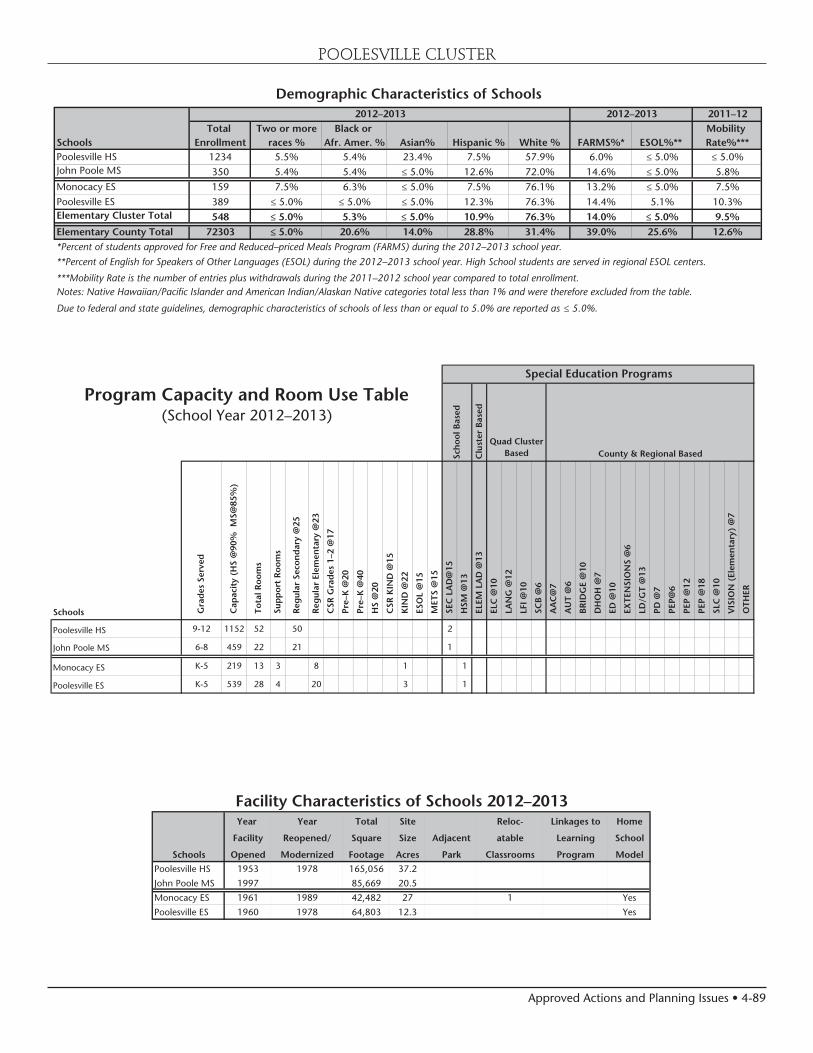
Approved Actions and Planning Issues • 4-89
POOLESVILLE CLUSTER
Year Year Total Site Reloc- Linkages to Home
Facility Reopened/ Square Size Adjacent atable Learning School
Schools Opened Modernized Footage Acres Park Classrooms Program Model
Poolesville HS 1953 1978 165,056 37.2
John Poole MS 1997 85,669 20.5
Monocacy ES 1961 1989 42,482 27 1 Yes
Poolesville ES 1960 1978 64,803 12.3 Yes
Facility Characteristics of Schools 2012–2013
(School Year 2012–2013)
Schools Gra
des
Ser
ved
Cap
acit
y (H
S @
90%
MS@
85%
)
Tot
al R
oom
s
Su
pp
ort
Roo
ms
Reg
ular
Sec
ond
ary
@25
Reg
ula
r El
emen
tary
@23
CSR
Gra
des
1–2
@17
Pre
–K @
20
Pre
–K @
40
HS
@20
CSR
KIN
D @
15
KIN
D @
22
ESO
L @
15
MET
S @
15
SEC
LA
D@
15
HSM
@13
ELE
M L
AD
@13
ELC
@10
LA
NG
@12
LFI
@10
SC
B @
6
AA
C@
7
AU
T @
6
BR
IDG
E @
10
DH
OH
@7
ED
@10
EX
TEN
SIO
NS
@6
LD
/GT
@13
PD
@7
PEP
@6
PEP
@12
PEP
@18
SLC
@10
VIS
ION
(El
emen
tary
) @
7
OTH
ER
Poolesville HS 9-12 1152 52 50 2
John Poole MS 6-8 459 22 21 1
Monocacy ES K-5 219 13 3 8 1 1
Poolesville ES K-5 539 28 4 20 3 1
Program Capacity and Room Use Table
Sch
ool B
ased
Quad Cluster BasedC
lust
er B
ased
Special Education Programs
County & Regional Based
Demographic Characteristics of Schools2011–12
Total Two or more Black or Mobility Schools Enrollment races % Afr. Amer. % Asian% Hispanic % White % FARMS%* ESOL%** Rate%***Poolesville HS 1234 5.5% 5.4% 23.4% 7.5% 57.9% 6.0% ≤ 5.0% ≤ 5.0%John Poole MS 350 5.4% 5.4% ≤ 5.0% 12.6% 72.0% 14.6% ≤ 5.0% 5.8%Monocacy ES 159 7.5% 6.3% ≤ 5.0% 7.5% 76.1% 13.2% ≤ 5.0% 7.5%Poolesville ES 389 ≤ 5.0% ≤ 5.0% ≤ 5.0% 12.3% 76.3% 14.4% 5.1% 10.3%Elementary Cluster Total 548 ≤ 5.0% 5.3% ≤ 5.0% 10.9% 76.3% 14.0% ≤ 5.0% 9.5%
Elementary County Total 72303 ≤ 5.0% 20.6% 14.0% 28.8% 31.4% 39.0% 25.6% 12.6%*Percent of students approved for Free and Reduced–priced Meals Program (FARMS) during the 2012–2013 school year.
**Percent of English for Speakers of Other Languages (ESOL) during the 2012–2013 school year. High School students are served in regional ESOL centers.
***Mobility Rate is the number of entries plus withdrawals during the 2011–2012 school year compared to total enrollment.Notes: Native Hawaiian/Pacific Islander and American Indian/Alaskan Native categories total less than 1% and were therefore excluded from the table.
Due to federal and state guidelines, demographic characteristics of schools of less than or equal to 5.0% are reported as ≤ 5.0%.
2012–2013 2012–2013
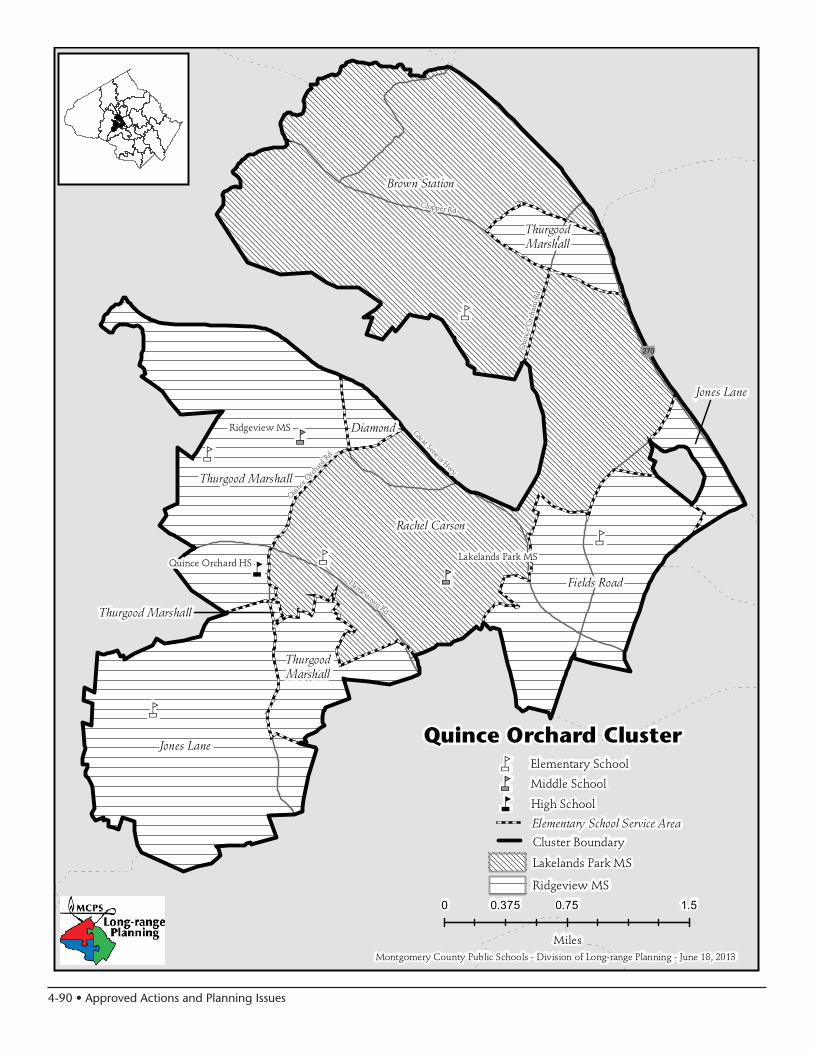
4-90 • Approved Actions and Planning Issues
n
nm
nmnm
nm
nm
nm
nm
Quince Orchard Cluster
Montgomery County Public Schools - Division of Long-range Planning - June 18, 2013
Elementary School Service Area
Lakelands Park MS
Ridgeview MS
nm Elementary School
nm Middle School
n High School
Cluster Boundary
Lakelands Park MS
Ridgeview MS
Quince Orchard HS
Rachel Carson
Brown Station
Jones Lane
Thurgood Marshall
Fields Road
0 0.75 1.50.375
Miles
Diamond
ThurgoodMarshall
Thurgood Marshall
Jones Lane
ThurgoodMarshall
Qui
nce
Orc
hard
Rd
¥270
Clopper Rd
Great Seneca Hwy
Quinc
e Orch
ard R
d
Darnestown Rd
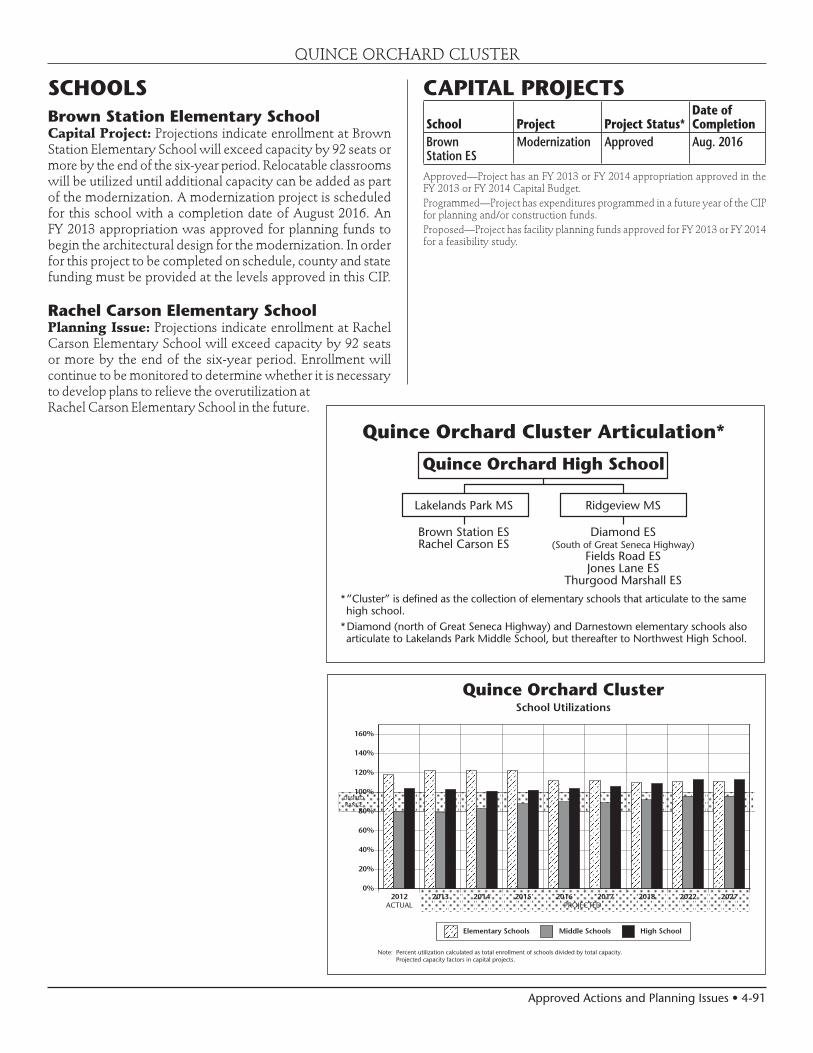
Approved Actions and Planning Issues • 4-91
�����������������������������������
�������������������������
����������������� ������������
�������������� ����������������������� �������������������������������
�������������������������
�������������������
��������������������������������������������������������������������������������������������������
����������������������������������������������������������������������������������������������������������������������������������������������������������������
DESIREDRANGE
Note: Percent utilization calculated as total enrollment of schools divided by total capacity.Projected capacity factors in capital projects.
ACTUAL PROJECTED2012 2013 2014 2015 2016 2017 2018 2022 2027
0%
20%
40%
60%
80%
100%
120%
140%
160%
Elementary Schools Middle Schools High School
Quince Orchard ClusterSchool Utilizations
SCHOOLSBrown Station Elementary SchoolCapital Project: Projections indicate enrollment at Brown Station Elementary School will exceed capacity by 92 seats or more by the end of the six-year period. Relocatable classrooms will be utilized until additional capacity can be added as part of the modernization. A modernization project is scheduled for this school with a completion date of August 2016. An FY 2013 appropriation was approved for planning funds to begin the architectural design for the modernization. In order for this project to be completed on schedule, county and state funding must be provided at the levels approved in this CIP.
Rachel Carson Elementary SchoolPlanning Issue: Projections indicate enrollment at Rachel Carson Elementary School will exceed capacity by 92 seats or more by the end of the six-year period. Enrollment will continue to be monitored to determine whether it is necessary to develop plans to relieve the overutilization at Rachel Carson Elementary School in the future.
CAPITAL PROJECTS
School Project Project Status*Date of Completion
Brown Station ES
Modernization Approved Aug. 2016
Approved—Project has an FY 2013 or FY 2014 appropriation approved in the FY 2013 or FY 2014 Capital Budget.Programmed—Project has expenditures programmed in a future year of the CIP for planning and/or construction funds.Proposed—Project has facility planning funds approved for FY 2013 or FY 2014 for a feasibility study.
QUINCE ORCHARD CLUSTER

4-92 • Approved Actions and Planning Issues
Projected Enrollment and Space AvailabilityEffects of the Amended FY2013–2018 CIP and Non–CIP Actions on Space Available
Actual
Schools 12–13 13–14 14–15 15–16 16-17 17-18 18-19 2022 2027Quince Orchard HS Program Capacity 1777 1777 1777 1777 1777 1777 1777 1777 1777
Enrollment 1829 1845 1789 1811 1844 1877 1938 2000 2000Available Space (52) (68) (12) (34) (67) (100) (161) (223) (223)Comments
Lakelands Park MS Program Capacity 1104 1104 1104 1104 1104 1104 1104 1104 1104Enrollment 983 1011 1050 1102 1129 1106 1131 1200 1200Available Space 121 93 54 2 (25) (2) (27) (96) (96)Comments +1 EXT +2 SCB
-2 EXT
Ridgeview MS Program Capacity 986 986 986 986 986 986 986 986 986Enrollment 685 668 693 727 752 760 788 800 800Available Space 301 318 293 259 234 226 198 186 186Comments
Brown Station ES CSR Program Capacity 420 420 420 420 658 658 658Enrollment 528 563 565 572 567 588 597Available Space (108) (143) (145) (152) 91 70 61Comments Move to @ Emory Mod
Emory Grove Grove CompleteJan. 2015 Aug. 2016
Rachel Carson ES Program Capacity 667 667 667 667 667 667 667Enrollment 939 964 956 943 949 935 897Available Space (272) (297) (289) (276) (282) (268) (230)Comments
Fields Road ES Program Capacity 485 491 491 491 491 491 491Enrollment 477 499 499 507 499 501 489Available Space 8 (8) (8) (16) (8) (10) 2Comments +1 AUT
- PPWs
Jones Lane ES Program Capacity 440 440 440 440 440 440 440Enrollment 488 474 482 471 470 459 465Available Space (48) (34) (42) (31) (30) (19) (25)Comments
Thurgood Marshall ES Program Capacity 535 535 535 535 535 535 535Enrollment 584 623 631 637 630 623 606Available Space (49) (88) (96) (102) (95) (88) (71)Comments
Cluster Information HS Utilization 103% 104% 101% 102% 104% 106% 109% 113% 113%HS Enrollment 1829 1845 1789 1811 1844 1877 1938 2000 2000MS Utilization 80% 80% 83% 88% 90% 89% 92% 96% 96%MS Enrollment 1668 1679 1743 1829 1881 1866 1919 2000 2000ES Utilization 118% 122% 123% 123% 112% 111% 109% 111% 111%ES Enrollment 3016 3123 3133 3130 3115 3106 3054 3100 3100
Projections
Planningfor Modernization
QUINCE ORCHARD CLUSTER

Approved Actions and Planning Issues • 4-93
QUINCE ORCHARD CLUSTER
Demographic Characteristics of Schools2011–12
Total Two or more Black or Mobility Schools Enrollment races % Afr. Amer. % Asian% Hispanic % White % FARMS%* ESOL%** Rate%***Quince Orchard HS 1829 ≤ 5.0% 15.0% 13.0% 22.1% 45.8% 21.9% 5.2% 8.4%Lakelands Park MS 983 ≤ 5.0% 15.0% 12.1% 19.0% 49.2% 22.4% 5.2% 10.6%Ridgeview MS 685 ≤ 5.0% 14.0% 15.3% 22.0% 43.6% 24.5% 5.5% 8.5%Brown Station ES 528 ≤ 5.0% 34.5% 8.5% 40.5% 11.4% 61.7% 26.9% 26.6%Rachel Carson ES 940 6.2% ≤ 5.0% 13.0% 16.7% 59.1% 16.5% 12.7% 7.6%Fields Road ES 477 5.5% 18.9% 18.7% 23.9% 32.7% 38.2% 19.5% 14.4%Jones Lane ES 489 5.5% 11.2% 12.7% 22.5% 47.6% 27.0% 17.0% 12.2%Thurgood Marshall ES 584 5.5% 13.5% 17.0% 25.3% 38.0% 27.4% 17.3% 11.8%Elementary Cluster Total 3018 5.6% 15.0% 13.8% 24.6% 40.7% 32.3% 18.2% 13.6%
Elementary County Total 72303 ≤ 5.0% 20.6% 14.0% 28.8% 31.4% 39.0% 25.6% 12.6%*Percent of students approved for Free and Reduced–priced Meals Program (FARMS) during the 2012–2013 school year.
**Percent of English for Speakers of Other Languages (ESOL) during the 2012–2013 school year. High School students are served in regional ESOL centers.
***Mobility Rate is the number of entries plus withdrawals during the 2011–2012 school year compared to total enrollment.Notes: Native Hawaiian/Pacific Islander and American Indian/Alaskan Native categories total less than 1% and were therefore excluded from the table.
Due to federal and state guidelines, demographic characteristics of schools of less than or equal to 5.0% are reported as ≤ 5.0%.
2012–2013 2012–2013
(School Year 2012–2013)
Schools Gra
des
Ser
ved
Cap
acit
y (H
S @
90%
MS@
85%
)
Tot
al R
oom
s
Sup
por
t R
oom
s
Reg
ular
Sec
ond
ary
@25
Reg
ular
Ele
men
tary
@23
CSR
Gra
des
1–2
@17
Pre
–K @
20
Pre
–K @
40
HS
@20
CSR
KIN
D @
15
KIN
D @
22
ESO
L @
15
MET
S @
15
SEC
LA
D@
15
HSM
@13
ELE
M L
AD
@13
ELC
@10
LA
NG
@12
LFI
@10
SC
B @
6
AA
C@
7
AU
T @
6
BR
IDG
E @
10
DH
OH
@7
ED
@10
EX
TEN
SIO
NS
@6
LD
/GT
@13
PD
@7
PEP
@6
PEP
@12
PEP
@18
SLC
@10
VIS
ION
(El
emen
tary
) @
7
OTH
ER
Quince Orchard HS 9-12 1777 86 72 2 2 6 2 2
Lakelands Park MS 6-8 1104 57 48 1 4 4
Ridgeview MS 6-8 986 48 44 1 3
Brown Station ES HS-5 420 27 4 4 9 1 1 4 1 1 2
Rachel Carson ES PreK-5 667 35 5 20 1 7 1 1
Fields Road ES PreK-5 485 30 5 16 1 3 1 3 1
Jones Lane ES K-5 440 27 5 13 4 1 4
Thurgood Marshall ES K-5 535 32 4 16 4 1 1 3 3
Program Capacity and Room Use Table
Sch
ool B
ased
Quad Cluster BasedC
lust
er B
ased
Special Education Programs
County & Regional Based
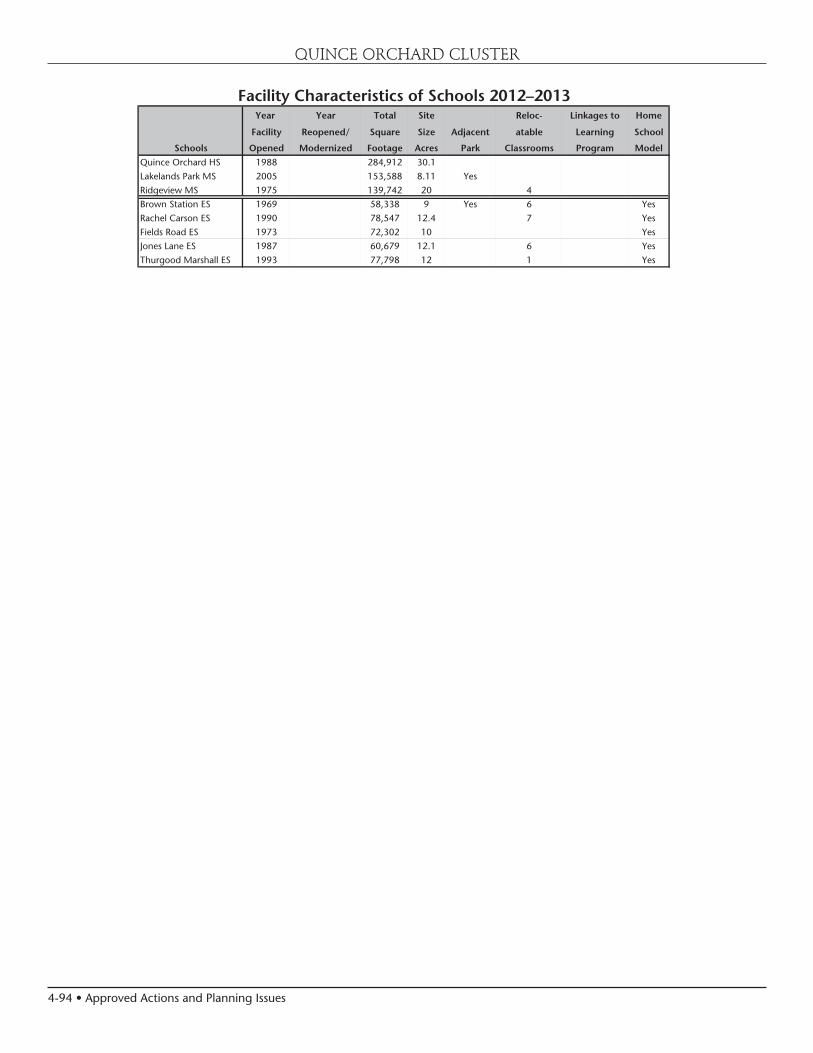
4-94 • Approved Actions and Planning Issues
QUINCE ORCHARD CLUSTER
Year Year Total Site Reloc- Linkages to Home
Facility Reopened/ Square Size Adjacent atable Learning School
Schools Opened Modernized Footage Acres Park Classrooms Program Model
Quince Orchard HS 1988 284,912 30.1
Lakelands Park MS 2005 153,588 8.11 Yes
Ridgeview MS 1975 139,742 20 4
Brown Station ES 1969 58,338 9 Yes 6 Yes
Rachel Carson ES 1990 78,547 12.4 7 Yes
Fields Road ES 1973 72,302 10 Yes
Jones Lane ES 1987 60,679 12.1 6 Yes
Thurgood Marshall ES 1993 77,798 12 1 Yes
Facility Characteristics of Schools 2012–2013


4-96 • Approved Actions and Planning Issues
nm
nmnm
nm
nm
nm
n
Rockville Cluster
Montgomery County Public Schools - Division of Long-range Planning - June, 18, 2013
Elementary School Service Area
nm Elementary School
nm Middle School
n High School
Rockville HS
Flower Valley
Lucy V. Barnsley
Cluster Boundary
Earle B. Wood MS
Meadow Hall
Maryvale
Rock Creek
Valley
0 1 20.5
Miles
Norbeck Rd
Veirs Mill Rd
Geo
rgia
Ave
Muncaster Mill Rd
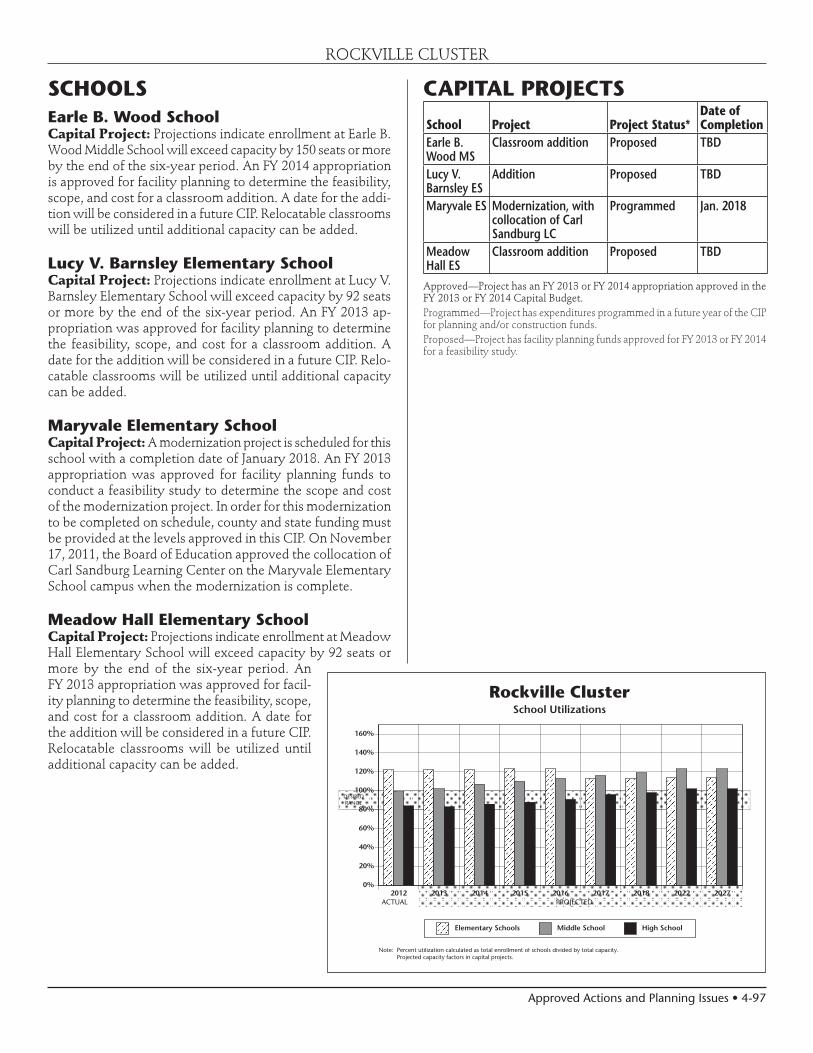
Approved Actions and Planning Issues • 4-97
DESIREDRANGE
Note: Percent utilization calculated as total enrollment of schools divided by total capacity.Projected capacity factors in capital projects.
ACTUAL PROJECTED2012 2013 2014 2015 2016 2017 2018 2022 2027
0%
20%
40%
60%
80%
100%
120%
140%
160%
Elementary Schools Middle School High School
Rockville ClusterSchool Utilizations
SCHOOLSEarle B. Wood SchoolCapital Project: Projections indicate enrollment at Earle B. Wood Middle School will exceed capacity by 150 seats or more by the end of the six-year period. An FY 2014 appropriation is approved for facility planning to determine the feasibility, scope, and cost for a classroom addition. A date for the addi-tion will be considered in a future CIP. Relocatable classrooms will be utilized until additional capacity can be added.
Lucy V. Barnsley Elementary SchoolCapital Project: Projections indicate enrollment at Lucy V. Barnsley Elementary School will exceed capacity by 92 seats or more by the end of the six-year period. An FY 2013 ap-propriation was approved for facility planning to determine the feasibility, scope, and cost for a classroom addition. A date for the addition will be considered in a future CIP. Relo-catable classrooms will be utilized until additional capacity can be added.
Maryvale Elementary SchoolCapital Project: A modernization project is scheduled for this school with a completion date of January 2018. An FY 2013 appropriation was approved for facility planning funds to conduct a feasibility study to determine the scope and cost of the modernization project. In order for this modernization to be completed on schedule, county and state funding must be provided at the levels approved in this CIP. On November 17, 2011, the Board of Education approved the collocation of Carl Sandburg Learning Center on the Maryvale Elementary School campus when the modernization is complete.
Meadow Hall Elementary SchoolCapital Project: Projections indicate enrollment at Meadow Hall Elementary School will exceed capacity by 92 seats or more by the end of the six-year period. An FY 2013 appropriation was approved for facil-ity planning to determine the feasibility, scope, and cost for a classroom addition. A date for the addition will be considered in a future CIP. Relocatable classrooms will be utilized until additional capacity can be added.
CAPITAL PROJECTS
School Project Project Status*Date of Completion
Earle B. Wood MS
Classroom addition Proposed TBD
Lucy V. Barnsley ES
Addition Proposed TBD
Maryvale ES Modernization, with collocation of Carl Sandburg LC
Programmed Jan. 2018
Meadow Hall ES
Classroom addition Proposed TBD
Approved—Project has an FY 2013 or FY 2014 appropriation approved in the FY 2013 or FY 2014 Capital Budget.Programmed—Project has expenditures programmed in a future year of the CIP for planning and/or construction funds.Proposed—Project has facility planning funds approved for FY 2013 or FY 2014 for a feasibility study.
ROCKVILLE CLUSTER

4-98 • Approved Actions and Planning Issues
ROCKVILLE CLUSTER
Projected Enrollment and Space AvailabilityEffects of the Amended FY2013–2018 CIP and Non–CIP Actions on Space Available
Actual
Schools 12–13 13–14 14–15 15–16 16-17 17-18 18-19 2022 2027Rockville HS Program Capacity 1516 1516 1516 1516 1516 1516 1516 1516 1516
Enrollment 1275 1280 1299 1335 1385 1453 1479 1550 1550Available Space 241 236 217 181 131 63 37 (34) (34)Comments
Earle B. Wood MS Program Capacity 936 952 952 952 952 952 952 936 936Enrollment 922 958 1000 1027 1057 1090 1112 1150 1150Available Space 14 (6) (48) (75) (105) (138) (160) (214) (214)Comments -1 AUT
Facility Plng.for Addition
Lucy V. Barnsley ES CSR Program Capacity 395 395 395 395 395 395 395Enrollment 666 648 631 622 611 609 610Available Space (271) (253) (236) (227) (216) (214) (215)Comments Facility
Planning for Addition
Flower Valley ES Program Capacity 429 429 429 429 429 429 429Enrollment 470 475 459 468 464 483 490Available Space (41) (46) (30) (39) (35) (54) (61)Comments
Maryvale ES CSR Program Capacity 570 570 570 570 570 740 740Enrollment 587 595 636 647 645 648 648Available Space (17) (25) (66) (77) (75) 92 92Comments Facility @ North Mod.
Planning Lake CompleteFor Mod. Jan. 2018
Meadow Hall ES CSR Program Capacity 332 332 332 332 332 332 332Enrollment 420 432 432 441 438 432 435Available Space (88) (100) (100) (109) (106) (100) (103)Comments Facility
Planningfor Addition
Rock Creek Valley ES CSR Program Capacity 383 383 383 383 383 383 383Enrollment 415 411 421 421 428 397 385Available Space (32) (28) (38) (38) (45) (14) (2)Comments
Cluster Information HS Utilization 84% 84% 86% 88% 91% 96% 98% 102% 102%HS Enrollment 1275 1280 1299 1335 1385 1453 1479 1550 1550MS Utilization 99% 101% 105% 108% 111% 114% 117% 123% 123%MS Enrollment 922 958 1000 1027 1057 1090 1112 1150 1150ES Utilization 121% 121% 122% 123% 123% 113% 113% 114% 114%ES Enrollment 2558 2561 2579 2599 2586 2569 2568 2600 2600
Projections
Planningfor Modernization

Approved Actions and Planning Issues • 4-99
ROCKVILLE CLUSTER
Demographic Characteristics of Schools2011–12
Total Two or more Black or Mobility Schools Enrollment races % Afr. Amer. % Asian% Hispanic % White % FARMS%* ESOL%** Rate%***Rockville HS 1275 ≤ 5.0% 14.9% 10.7% 32.2% 38.4% 29.9% 5.6% 11.2%Earle B. Wood MS 922 ≤ 5.0% 15.5% 11.2% 35.7% 33.3% 35.9% 8.4% 8.9%Lucy V. Barnsley ES 666 6.6% 11.9% 15.5% 26.9% 38.9% 30.3% 15.2% 11.9%Flower Valley ES 470 ≤ 5.0% 13.0% 10.2% 19.1% 53.8% 17.4% 11.3% 10.9%Maryvale ES 587 6.1% 27.8% 8.7% 32.2% 24.7% 42.8% 30.2% 13.3%Meadow Hall ES 420 ≤ 5.0% 12.9% 10.0% 51.0% 20.2% 54.3% 26.9% 16.7%Rock Creek Valley ES 415 8.0% 7.2% 11.3% 40.7% 32.0% 35.2% 28.4% 10.6%Elementary Cluster Total 2558 5.9% 15.1% 11.4% 32.9% 34.2% 35.5% 21.9% 12.6%
Elementary County Total 72303 ≤ 5.0% 20.6% 14.0% 28.8% 31.4% 39.0% 25.6% 12.6%*Percent of students approved for Free and Reduced–priced Meals Program (FARMS) during the 2012–2013 school year.
**Percent of English for Speakers of Other Languages (ESOL) during the 2012–2013 school year. High School students are served in regional ESOL centers.
***Mobility Rate is the number of entries plus withdrawals during the 2011–2012 school year compared to total enrollment.Notes: Native Hawaiian/Pacific Islander and American Indian/Alaskan Native categories total less than 1% and were therefore excluded from the table.
Due to federal and state guidelines, demographic characteristics of schools of less than or equal to 5.0% are reported as ≤ 5.0%.
2012–2013 2012–2013
(School Year 2012–2013)
Schools Gra
des
Ser
ved
Cap
acit
y (H
S @
90%
MS@
85%
)
Tot
al R
oom
s
Sup
por
t R
oom
s
Reg
ular
Sec
ond
ary
@25
Reg
ular
Ele
men
tary
@23
CSR
Gra
des
1–2
@17
Pre
–K @
20
Pre
–K @
40
HS
@20
CSR
KIN
D @
15
KIN
D @
22
ESO
L @
15
MET
S @
15
SEC
LA
D@
15
HSM
@13
ELE
M L
AD
@13
ELC
@10
LA
NG
@12
LFI
@10
SC
B @
6
AA
C@
7
AU
T @
6
BR
IDG
E @
10
DH
OH
@7
ED
@10
EX
TEN
SIO
NS
@6
LD
/GT
@13
PD
@7
PEP
@6
PEP
@12
PEP
@18
SLC
@10
VIS
ION
(El
emen
tary
) @
7
OTH
ER
Rockville HS 9-12 1516 78 59 2 6 5 3 3
Earle B. Wood MS 6-8 936 50 41 1 1 3 4
Lucy V. Barnsley ES K-5 395 28 4 5 9 1 4 3 2
Flower Valley ES K-5 429 25 3 14 3 3 2
Maryvale ES HS-5 570 36 6 12 8 1 2 4 3
Meadow Hall ES K-5 332 25 4 4 8 4 2 3
Rock Creek Valley ES K-5 383 29 4 6 8 4 7
Special Education Programs
Program Capacity and Room Use Table
Sch
ool B
ased
Clu
ster
Bas
ed
Quad Cluster Based County & Regional Based
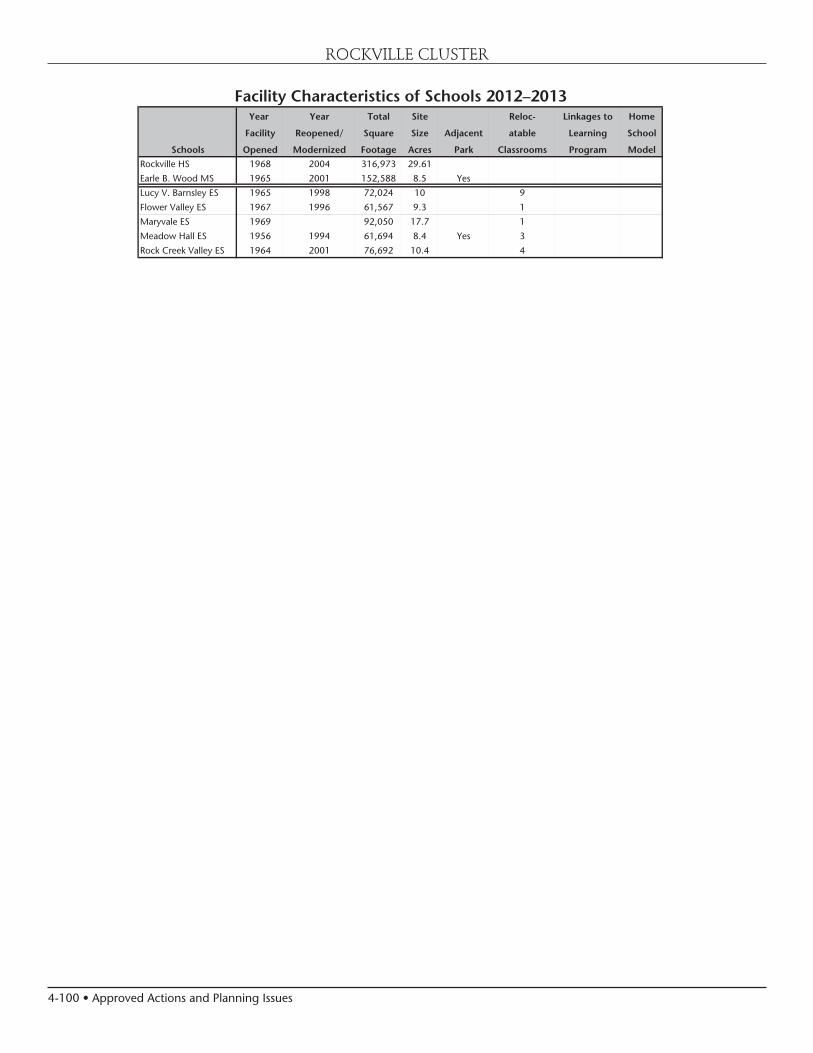
4-100 • Approved Actions and Planning Issues
ROCKVILLE CLUSTER
Year Year Total Site Reloc- Linkages to Home
Facility Reopened/ Square Size Adjacent atable Learning School
Schools Opened Modernized Footage Acres Park Classrooms Program Model
Rockville HS 1968 2004 316,973 29.61
Earle B. Wood MS 1965 2001 152,588 8.5 Yes
Lucy V. Barnsley ES 1965 1998 72,024 10 9
Flower Valley ES 1967 1996 61,567 9.3 1
Maryvale ES 1969 92,050 17.7 1
Meadow Hall ES 1956 1994 61,694 8.4 Yes 3
Rock Creek Valley ES 1964 2001 76,692 10.4 4
Facility Characteristics of Schools 2012–2013


4-102 • Approved Actions and Planning Issues
n
nm
nm
nm
nm
nm
nm
Seneca Valley Cluster
Montgomery County Public Schools - Division of Long-range Planning - June 18, 2013
Elementary School Service Area
Martin Luther King, Jr MS
Roberto Clemente MS
nm Elementary School
nm Middle School
n High School
Cluster Boundary
Roberto Clemente MS
Seneca Valley HS
Dr. Sally K.Ride
Lake Seneca
S. Christa McAuliffe
0 0.75 1.50.375
Miles
Martin Luther King, Jr MS
Waters Landing¥270
Germantown Rd

Approved Actions and Planning Issues • 4-103
Seneca Valley Cluster Articulation*
Seneca Valley High School
Dr. Martin Luther King, Jr. MS
Lake Seneca ESDr. Sally K. Ride ES
(North of Middlebrook Road)Waters Landing ES
Roberto Clemente MS
S. Christa McAuliffe ESDr. Sally K. Ride ES
(South of Middlebrook Road)
* ”Cluster” is defined as the collection of elementary schools that articulate to the same high school.
* Clopper Mill, Germantown, and a portion of Great Seneca Creek elementary schools also articulate to Roberto Clemente Middle School, but thereafter articulate to Northwest High School.
DESIREDRANGE
Note: Percent utilization calculated as total enrollment of schools divided by total capacity.Projected capacity factors in capital projects.
ACTUAL PROJECTED2012 2013 2014 2015 2016 2017 2018 2022 2027
0%
20%
40%
60%
80%
100%
120%
140%
160%
Elementary Schools Middle Schools High School
Seneca Valley ClusterSchool Utilizations
SENECA VALLEY CLUSTER
CLUSTER PLANNING ISSUESSeneca Valley High SchoolCapital Project: A modernization project was previously scheduled for this school for completion of the building in August 2016 and the completion of the site work in August 2017. However, due to fiscal constraints in the county, the completion date for the modernization has been delayed by two years to August 2018 for the facility and August 2019 for restoration of the site. An FY 2014 appropriation is approved for planning funds to begin the architectural design for the modernization. In order for this project to be completed on schedule, county and state funding must be provided at the levels approved in this CIP. The modernization of Seneca Valley High School provides the opportunity to construct enough capacity to address the projected overutilization of Northwest High School in the future.
Lake Seneca Elementary SchoolCapital Project: Projections indicate enrollment at Lake Seneca Elementary School will exceed capacity by 92 seats or more by the end of the six-year period. An FY 2014 appropriation is approved for facility planning to determine the feasibility, scope, and cost for a classroom addition. A date for the addition will be considered in a future CIP. Relocatable classrooms will be utilized until additional capacity can be added.
S. Christa McAuliffe Elementary SchoolCapital Project: Projections indicate enroll-ment at S. Christa McAuliffe Elementary School will exceed capacity by 92 seats or more by the end of the six-year period. An FY 2012 ap-propriation was approved for facility planning to determine the feasibility, scope, and cost for a classroom addition. A date for the addition will be considered in a future CIP. Relocatable classrooms will be utilized until additional capacity can be added.
Waters Landing Elementary SchoolCapital Project: Projections indicate enroll-ment at Waters Landing Elementary School will exceed capacity by 92 seats or more by the end of the six-year CIP planning period. An FY 2013 appropriation for construction funds was approved for the addition. The scheduled completion date for the addition is August 2014.
CAPITAL PROJECTS
School Project Project Status*Date of Completion
Seneca Valley HS Modernization Approved Aug. 2018, buildingAug. 2019, site(delayed)
Lake Seneca ES Classroom addition
Proposed TBD
S. Christa McAuliffe ES
Classroom addition
Proposed TBD
Waters Landing ES
Classroom addition
Approved August 2014
Approved—Project has an FY 2013 or FY 2014 appropriation approved in the FY 2013 or FY 2014 Capital Budget.Programmed—Project has expenditures programmed in a future year of the CIP for planning and/or construction funds.Proposed—Project has facility planning funds approved for FY 2013 or FY 2014 for a feasibility study.
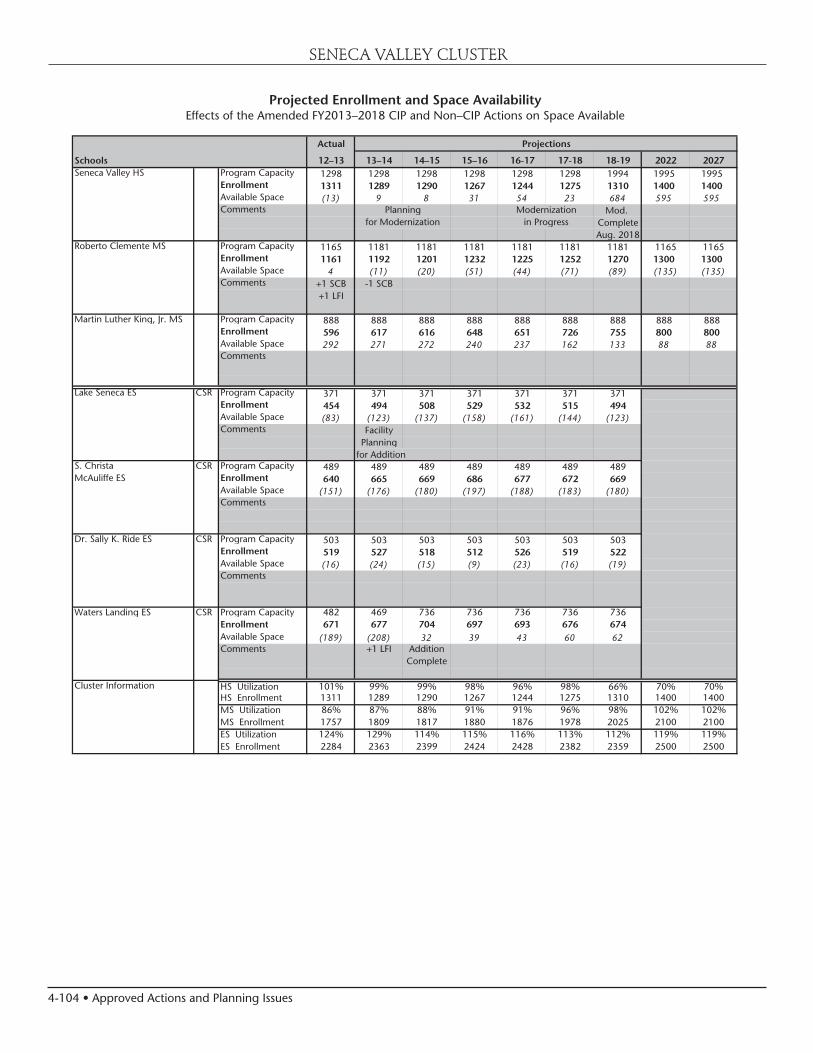
4-104 • Approved Actions and Planning Issues
SENECA VALLEY CLUSTER
Projected Enrollment and Space AvailabilityEffects of the Amended FY2013–2018 CIP and Non–CIP Actions on Space Available
Actual
Schools 12–13 13–14 14–15 15–16 16-17 17-18 18-19 2022 2027Seneca Valley HS Program Capacity 1298 1298 1298 1298 1298 1298 1994 1995 1995
Enrollment 1311 1289 1290 1267 1244 1275 1310 1400 1400Available Space (13) 9 8 31 54 23 684 595 595Comments Mod.
CompleteAug. 2018
Roberto Clemente MS Program Capacity 1165 1181 1181 1181 1181 1181 1181 1165 1165Enrollment 1161 1192 1201 1232 1225 1252 1270 1300 1300Available Space 4 (11) (20) (51) (44) (71) (89) (135) (135)Comments +1 SCB -1 SCB
+1 LFI
Martin Luther King, Jr. MS Program Capacity 888 888 888 888 888 888 888 888 888Enrollment 596 617 616 648 651 726 755 800 800Available Space 292 271 272 240 237 162 133 88 88Comments
Lake Seneca ES CSR Program Capacity 371 371 371 371 371 371 371Enrollment 454 494 508 529 532 515 494Available Space (83) (123) (137) (158) (161) (144) (123)Comments Facility
Planningfor Addition
S. Christa CSR Program Capacity 489 489 489 489 489 489 489McAuliffe ES Enrollment 640 665 669 686 677 672 669
Available Space (151) (176) (180) (197) (188) (183) (180)Comments
Dr. Sally K. Ride ES CSR Program Capacity 503 503 503 503 503 503 503Enrollment 519 527 518 512 526 519 522Available Space (16) (24) (15) (9) (23) (16) (19)Comments
Waters Landing ES CSR Program Capacity 482 469 736 736 736 736 736Enrollment 671 677 704 697 693 676 674Available Space (189) (208) 32 39 43 60 62Comments +1 LFI Addition
Complete
Cluster Information HS Utilization 101% 99% 99% 98% 96% 98% 66% 70% 70%HS Enrollment 1311 1289 1290 1267 1244 1275 1310 1400 1400MS Utilization 86% 87% 88% 91% 91% 96% 98% 102% 102%MS Enrollment 1757 1809 1817 1880 1876 1978 2025 2100 2100ES Utilization 124% 129% 114% 115% 116% 113% 112% 119% 119%ES Enrollment 2284 2363 2399 2424 2428 2382 2359 2500 2500
Projections
Planningfor Modernization
Modernizationin Progress
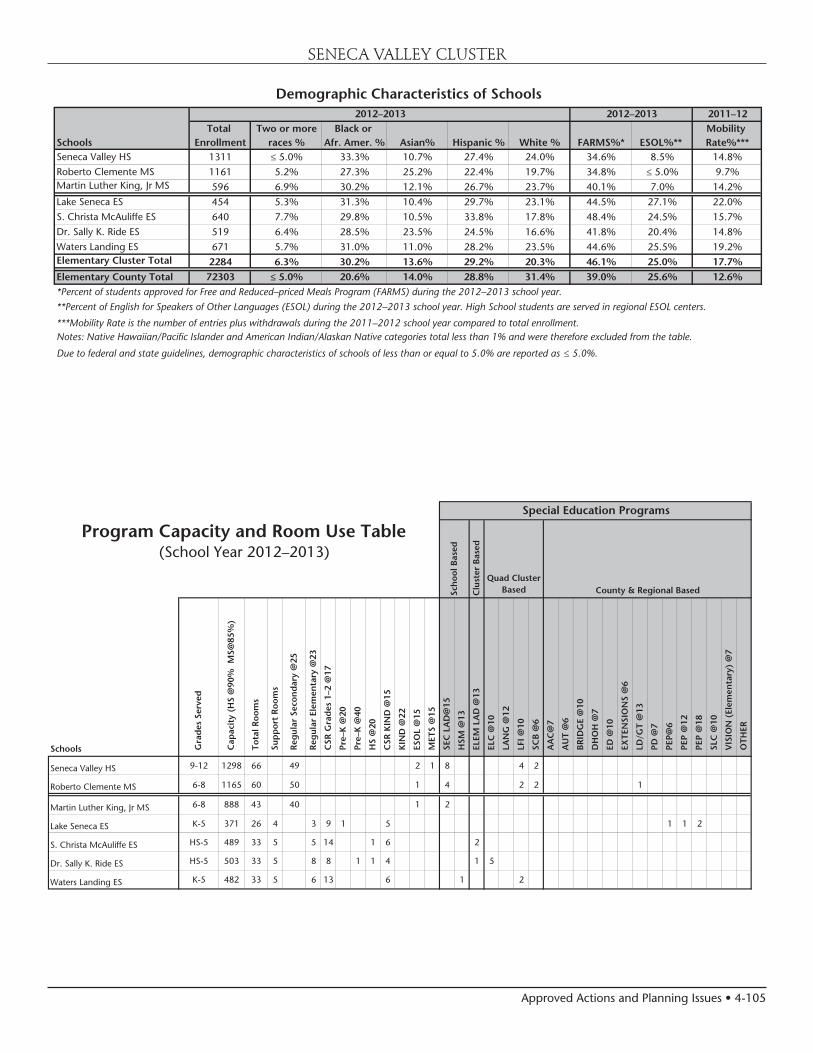
Approved Actions and Planning Issues • 4-105
SENECA VALLEY CLUSTER
Demographic Characteristics of Schools2011–12
Total Two or more Black or Mobility Schools Enrollment races % Afr. Amer. % Asian% Hispanic % White % FARMS%* ESOL%** Rate%***Seneca Valley HS 1311 ≤ 5.0% 33.3% 10.7% 27.4% 24.0% 34.6% 8.5% 14.8%Roberto Clemente MS 1161 5.2% 27.3% 25.2% 22.4% 19.7% 34.8% ≤ 5.0% 9.7%Martin Luther King, Jr MS 596 6.9% 30.2% 12.1% 26.7% 23.7% 40.1% 7.0% 14.2%Lake Seneca ES 454 5.3% 31.3% 10.4% 29.7% 23.1% 44.5% 27.1% 22.0%S. Christa McAuliffe ES 640 7.7% 29.8% 10.5% 33.8% 17.8% 48.4% 24.5% 15.7%Dr. Sally K. Ride ES 519 6.4% 28.5% 23.5% 24.5% 16.6% 41.8% 20.4% 14.8%Waters Landing ES 671 5.7% 31.0% 11.0% 28.2% 23.5% 44.6% 25.5% 19.2%Elementary Cluster Total 2284 6.3% 30.2% 13.6% 29.2% 20.3% 46.1% 25.0% 17.7%
Elementary County Total 72303 ≤ 5.0% 20.6% 14.0% 28.8% 31.4% 39.0% 25.6% 12.6%*Percent of students approved for Free and Reduced–priced Meals Program (FARMS) during the 2012–2013 school year.
**Percent of English for Speakers of Other Languages (ESOL) during the 2012–2013 school year. High School students are served in regional ESOL centers.
***Mobility Rate is the number of entries plus withdrawals during the 2011–2012 school year compared to total enrollment.Notes: Native Hawaiian/Pacific Islander and American Indian/Alaskan Native categories total less than 1% and were therefore excluded from the table.
Due to federal and state guidelines, demographic characteristics of schools of less than or equal to 5.0% are reported as ≤ 5.0%.
2012–2013 2012–2013
(School Year 2012–2013)
Schools Gra
des
Ser
ved
Cap
acit
y (H
S @
90%
MS@
85%
)
Tot
al R
oom
s
Sup
por
t R
oom
s
Reg
ular
Sec
ond
ary
@25
Reg
ular
Ele
men
tary
@23
CSR
Gra
des
1–2
@17
Pre
–K @
20
Pre
–K @
40
HS
@20
CSR
KIN
D @
15
KIN
D @
22
ESO
L @
15
MET
S @
15
SEC
LA
D@
15
HSM
@13
ELE
M L
AD
@13
ELC
@10
LA
NG
@12
LFI
@10
SC
B @
6
AA
C@
7
AU
T @
6
BR
IDG
E @
10
DH
OH
@7
ED
@10
EX
TEN
SIO
NS
@6
LD
/GT
@13
PD
@7
PEP
@6
PEP
@12
PEP
@18
SLC
@10
VIS
ION
(El
emen
tary
) @
7
OTH
ER
Seneca Valley HS 9-12 1298 66 49 2 1 8 4 2
Roberto Clemente MS 6-8 1165 60 50 1 4 2 2 1
Martin Luther King, Jr MS 6-8 888 43 40 1 2
Lake Seneca ES K-5 371 26 4 3 9 1 5 1 1 2
S. Christa McAuliffe ES HS-5 489 33 5 5 14 1 6 2
Dr. Sally K. Ride ES HS-5 503 33 5 8 8 1 1 4 1 5
Waters Landing ES K-5 482 33 5 6 13 6 1 2
Special Education Programs
Program Capacity and Room Use Table
Sch
ool B
ased
Clu
ster
Bas
ed
Quad Cluster Based County & Regional Based
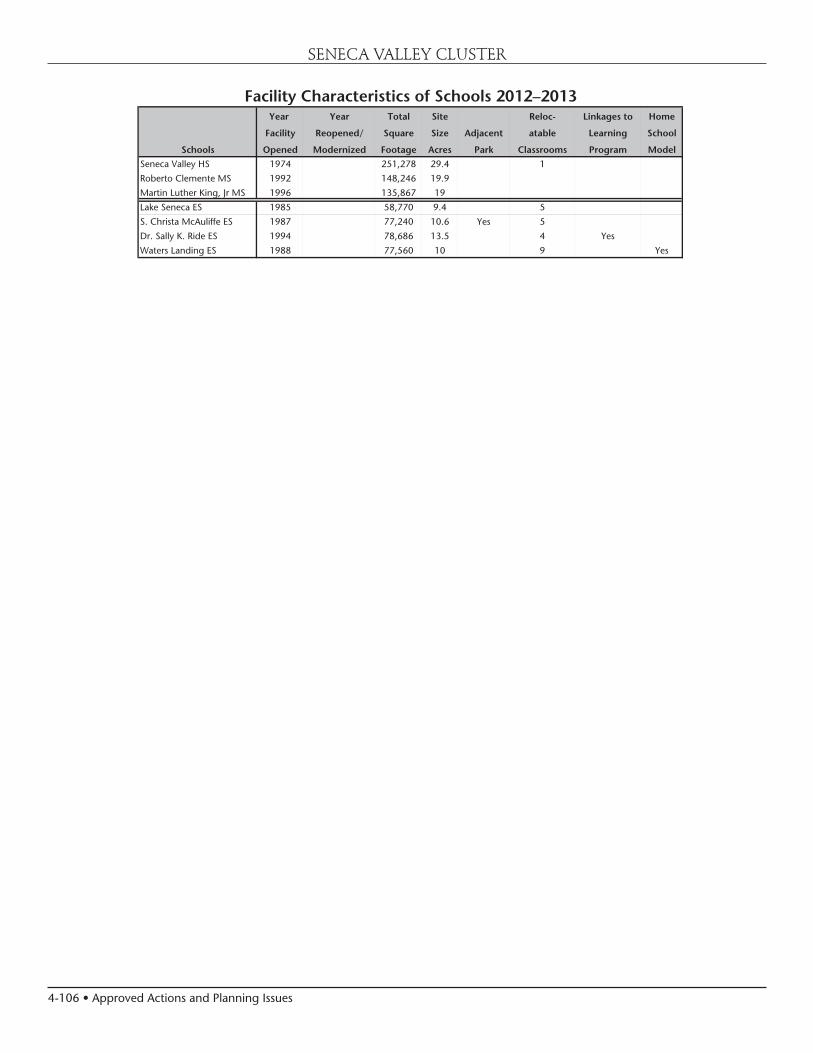
4-106 • Approved Actions and Planning Issues
SENECA VALLEY CLUSTER
Year Year Total Site Reloc- Linkages to Home
Facility Reopened/ Square Size Adjacent atable Learning School
Schools Opened Modernized Footage Acres Park Classrooms Program Model
Seneca Valley HS 1974 251,278 29.4 1
Roberto Clemente MS 1992 148,246 19.9
Martin Luther King, Jr MS 1996 135,867 19
Lake Seneca ES 1985 58,770 9.4 5
S. Christa McAuliffe ES 1987 77,240 10.6 Yes 5
Dr. Sally K. Ride ES 1994 78,686 13.5 4 Yes
Waters Landing ES 1988 77,560 10 9 Yes
Facility Characteristics of Schools 2012–2013

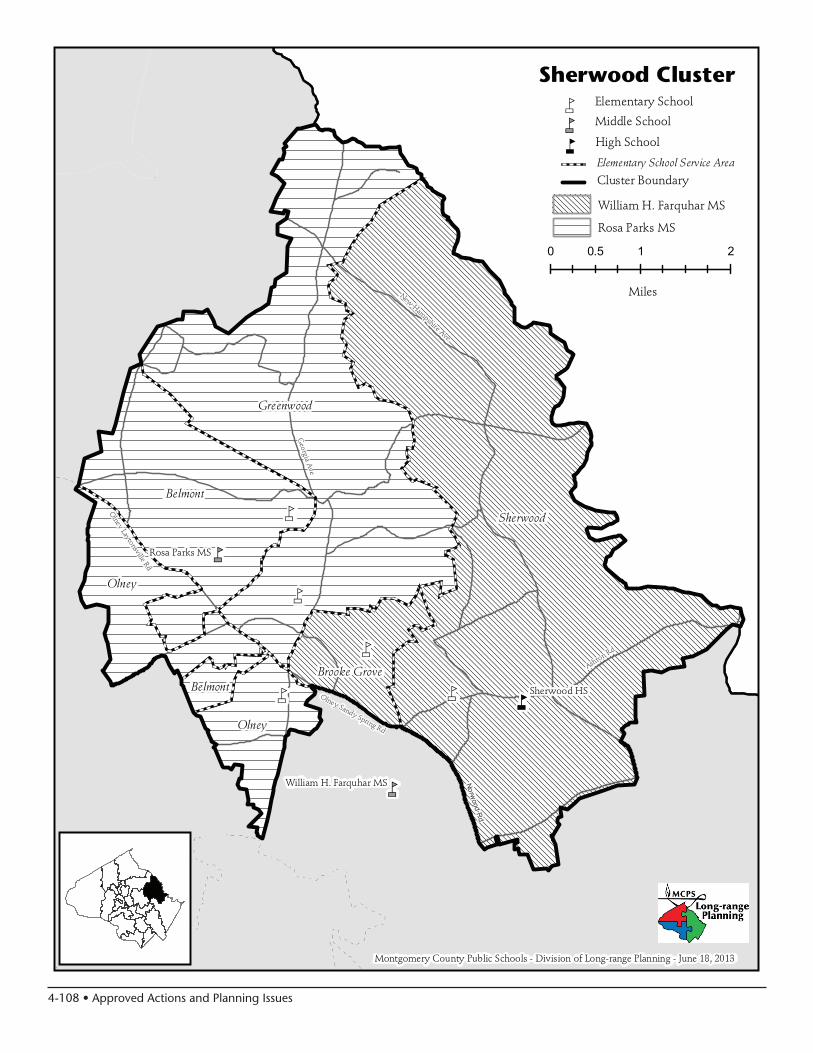
4-108 • Approved Actions and Planning Issues
nm
nm
nm
nm
nm
nm
nm
nm
Sherwood Cluster
Montgomery County Public Schools - Division of Long-range Planning - June 18, 2013
Elementary School Service Area
William H. Farquhar MS
Rosa Parks MS
nm Elementary School
nm Middle School
n High School
Cluster Boundary
William H. Farquhar MS
Sherwood HSBelmontBrooke Grove
Olney
Rosa Parks MS
Greenwood
0 1 20.5
Miles
Belmont
Olney
Sherwood
New Hampshire Ave
Georgia A
ve
Olney Sandy Spring Rd
Ashton Rd
Norwood R
d
Olney Laytonsville Rd

Approved Actions and Planning Issues • 4-109
DESIREDRANGE
Note: Percent utilization calculated as total enrollment of schools divided by total capacity.Projected capacity factors in capital projects.
ACTUAL PROJECTED2012 2013 2014 2015 2016 2017 2018 2022 2027
0%
20%
40%
60%
80%
100%
120%
140%
160%
Elementary Schools Middle Schools High School
Sherwood ClusterSchool Utilizations
SCHOOLSWilliam H. Farquhar Middle SchoolCapital Project: A modernization project was scheduled for this school with a completion date of August 2015. However, due to fiscal constraints in the county, the completion date has been delayed by one year to August 2016. An FY 2012 appropriation was approved for planning funds to begin the architectural design of the modernization. In order for this project to be completed on schedule, county and state funding must be provided at the levels approved in this CIP.
Belmont Elementary SchoolCapital Project: A modernization project is scheduled for this school with a completion date of August 2019. FY 2015 expenditures are programmed for facility planning for a fea-sibility study to determine the scope and cost of the project. In order for this project to be completed on schedule, county and state funding must be provided at the levels approved in this CIP.
CAPITAL PROJECTS
School Project Project Status*Date of Completion
Farquhar MS Modernization Programmed Aug. 2016 (delayed)
Belmont ES Modernization Programmed Aug. 2019Approved—Project has an FY 2013 or FY 2014 appropriation approved in the FY 2013 or FY 2014 Capital Budget.Programmed—Project has expenditures programmed in a future year of the CIP for planning and/or construction funds.Proposed—Project has facility planning funds approved for FY 2013 or FY 2014 for a feasibility study.
SHERWOOD CLUSTER
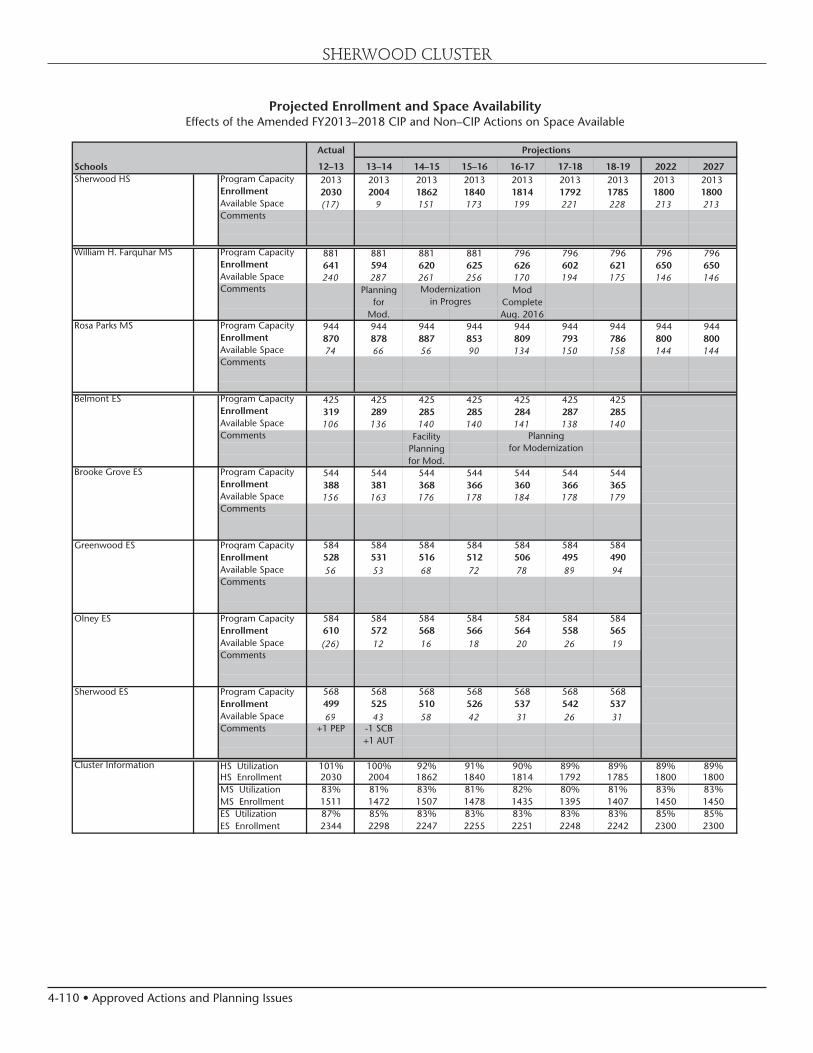
4-110 • Approved Actions and Planning Issues
SHERWOOD CLUSTER
Projected Enrollment and Space AvailabilityEffects of the Amended FY2013–2018 CIP and Non–CIP Actions on Space Available
Actual
Schools 12–13 13–14 14–15 15–16 16-17 17-18 18-19 2022 2027Sherwood HS Program Capacity 2013 2013 2013 2013 2013 2013 2013 2013 2013
Enrollment 2030 2004 1862 1840 1814 1792 1785 1800 1800Available Space (17) 9 151 173 199 221 228 213 213Comments
William H. Farquhar MS Program Capacity 881 881 881 881 796 796 796 796 796Enrollment 641 594 620 625 626 602 621 650 650Available Space 240 287 261 256 170 194 175 146 146Comments Planning Mod
for CompleteMod. Aug. 2016
Rosa Parks MS Program Capacity 944 944 944 944 944 944 944 944 944Enrollment 870 878 887 853 809 793 786 800 800Available Space 74 66 56 90 134 150 158 144 144Comments
Belmont ES Program Capacity 425 425 425 425 425 425 425Enrollment 319 289 285 285 284 287 285Available Space 106 136 140 140 141 138 140Comments Facility
Planningfor Mod.
Brooke Grove ES Program Capacity 544 544 544 544 544 544 544Enrollment 388 381 368 366 360 366 365Available Space 156 163 176 178 184 178 179Comments
Greenwood ES Program Capacity 584 584 584 584 584 584 584Enrollment 528 531 516 512 506 495 490Available Space 56 53 68 72 78 89 94Comments
Olney ES Program Capacity 584 584 584 584 584 584 584Enrollment 610 572 568 566 564 558 565Available Space (26) 12 16 18 20 26 19Comments
Sherwood ES Program Capacity 568 568 568 568 568 568 568Enrollment 499 525 510 526 537 542 537Available Space 69 43 58 42 31 26 31Comments +1 PEP -1 SCB
+1 AUT
Cluster Information HS Utilization 101% 100% 92% 91% 90% 89% 89% 89% 89%HS Enrollment 2030 2004 1862 1840 1814 1792 1785 1800 1800MS Utilization 83% 81% 83% 81% 82% 80% 81% 83% 83%MS Enrollment 1511 1472 1507 1478 1435 1395 1407 1450 1450ES Utilization 87% 85% 83% 83% 83% 83% 83% 85% 85%ES Enrollment 2344 2298 2247 2255 2251 2248 2242 2300 2300
for Modernization
Projections
Modernizationin Progres
Planning
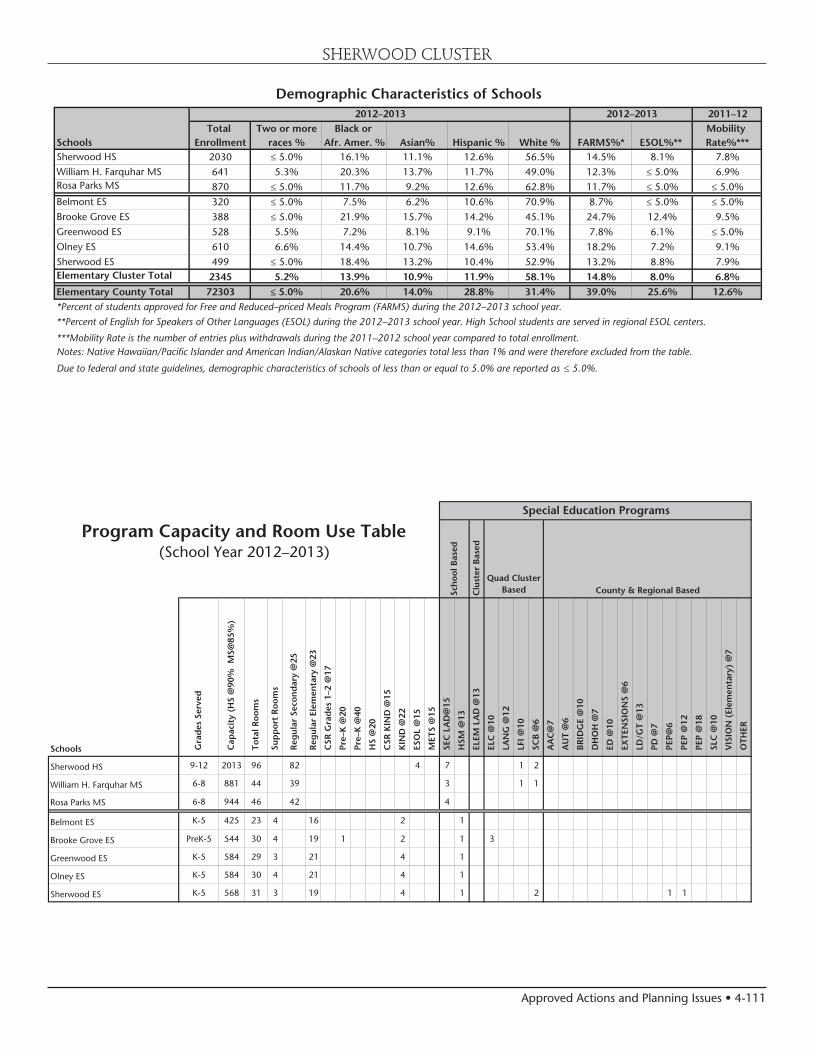
Approved Actions and Planning Issues • 4-111
SHERWOOD CLUSTER
Demographic Characteristics of Schools2011–12
Total Two or more Black or Mobility Schools Enrollment races % Afr. Amer. % Asian% Hispanic % White % FARMS%* ESOL%** Rate%***Sherwood HS 2030 ≤ 5.0% 16.1% 11.1% 12.6% 56.5% 14.5% 8.1% 7.8%William H. Farquhar MS 641 5.3% 20.3% 13.7% 11.7% 49.0% 12.3% ≤ 5.0% 6.9%Rosa Parks MS 870 ≤ 5.0% 11.7% 9.2% 12.6% 62.8% 11.7% ≤ 5.0% ≤ 5.0%Belmont ES 320 ≤ 5.0% 7.5% 6.2% 10.6% 70.9% 8.7% ≤ 5.0% ≤ 5.0%Brooke Grove ES 388 ≤ 5.0% 21.9% 15.7% 14.2% 45.1% 24.7% 12.4% 9.5%Greenwood ES 528 5.5% 7.2% 8.1% 9.1% 70.1% 7.8% 6.1% ≤ 5.0%Olney ES 610 6.6% 14.4% 10.7% 14.6% 53.4% 18.2% 7.2% 9.1%Sherwood ES 499 ≤ 5.0% 18.4% 13.2% 10.4% 52.9% 13.2% 8.8% 7.9%Elementary Cluster Total 2345 5.2% 13.9% 10.9% 11.9% 58.1% 14.8% 8.0% 6.8%
Elementary County Total 72303 ≤ 5.0% 20.6% 14.0% 28.8% 31.4% 39.0% 25.6% 12.6%*Percent of students approved for Free and Reduced–priced Meals Program (FARMS) during the 2012–2013 school year.
**Percent of English for Speakers of Other Languages (ESOL) during the 2012–2013 school year. High School students are served in regional ESOL centers.
***Mobility Rate is the number of entries plus withdrawals during the 2011–2012 school year compared to total enrollment.Notes: Native Hawaiian/Pacific Islander and American Indian/Alaskan Native categories total less than 1% and were therefore excluded from the table.
Due to federal and state guidelines, demographic characteristics of schools of less than or equal to 5.0% are reported as ≤ 5.0%.
2012–2013 2012–2013
(School Year 2012–2013)
Schools Gra
des
Ser
ved
Cap
acit
y (H
S @
90%
MS@
85%
)
Tot
al R
oom
s
Sup
por
t R
oom
s
Reg
ular
Sec
ond
ary
@25
Reg
ular
Ele
men
tary
@23
CSR
Gra
des
1–2
@17
Pre
–K @
20
Pre
–K @
40
HS
@20
CSR
KIN
D @
15
KIN
D @
22
ESO
L @
15
MET
S @
15
SEC
LA
D@
15
HSM
@13
ELE
M L
AD
@13
ELC
@10
LA
NG
@12
LFI
@10
SC
B @
6
AA
C@
7
AU
T @
6
BR
IDG
E @
10
DH
OH
@7
ED
@10
EX
TEN
SIO
NS
@6
LD
/GT
@13
PD
@7
PEP
@6
PEP
@12
PEP
@18
SLC
@10
VIS
ION
(El
emen
tary
) @
7
OTH
ER
Sherwood HS 9-12 2013 96 82 4 7 1 2
William H. Farquhar MS 6-8 881 44 39 3 1 1
Rosa Parks MS 6-8 944 46 42 4
Belmont ES K-5 425 23 4 16 2 1
Brooke Grove ES PreK-5 544 30 4 19 1 2 1 3
Greenwood ES K-5 584 29 3 21 4 1
Olney ES K-5 584 30 4 21 4 1
Sherwood ES K-5 568 31 3 19 4 1 2 1 1
Special Education Programs
Program Capacity and Room Use Table
Sch
ool B
ased
Clu
ster
Bas
ed
Quad Cluster Based County & Regional Based
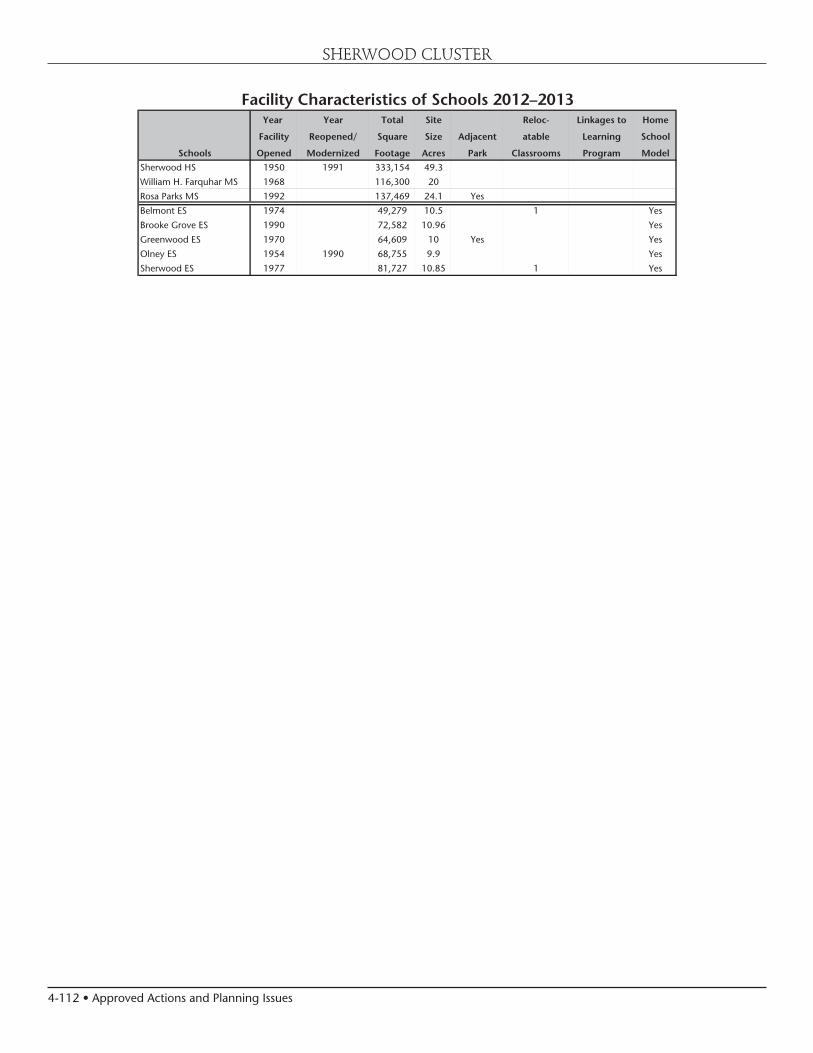
4-112 • Approved Actions and Planning Issues
SHERWOOD CLUSTER
Year Year Total Site Reloc- Linkages to Home
Facility Reopened/ Square Size Adjacent atable Learning School
Schools Opened Modernized Footage Acres Park Classrooms Program Model
Sherwood HS 1950 1991 333,154 49.3
William H. Farquhar MS 1968 116,300 20
Rosa Parks MS 1992 137,469 24.1 Yes
Belmont ES 1974 49,279 10.5 1 Yes
Brooke Grove ES 1990 72,582 10.96 Yes
Greenwood ES 1970 64,609 10 Yes Yes
Olney ES 1954 1990 68,755 9.9 Yes
Sherwood ES 1977 81,727 10.85 1 Yes
Facility Characteristics of Schools 2012–2013


4-114 • Approved Actions and Planning Issues
n
nm
nm
nm
nm
nm
nm
Watkins Mill Cluster
Montgomery County Public Schools - Division of Long-range Planning - June 18, 2013
Elementary School Service Area
nm Elementary School
nm Middle School
n High School
Cluster Boundary
Neelsville MS
Montgomery Village MS
Watkins Mill HS
Montgomery Village MS
Neelsville MS
South Lake
Watkins Mill
Stedwick
Whetstone
0 0.5 10.25
Miles
Whetstone
South Lake
South Lake
N Frederick Ave
¥270
Montgomery
Villa
ge Ave
Midcounty Hwy

Approved Actions and Planning Issues • 4-115
DESIREDRANGE
Note: Percent utilization calculated as total enrollment of schools divided by total capacity.Projected capacity factors in capital projects.
ACTUAL PROJECTED2012 2013 2014 2015 2016 2017 2018 2022 2027
0%
20%
40%
60%
80%
100%
120%
140%
160%
Elementary Schools Middle Schools High School
Watkins Mill ClusterSchool Utilizations
WATKINS MILL CLUSTER
SCHOOLSWatkins Mill High SchoolCapital Project: A School-based Wellness Center School is programmed in the Department of Health and Human Services (DHHS) CIP with a scheduled completion date of August 2013.
South Lake Elementary SchoolCapital Project: Projections indicate enrollment at South Lake Elementary School will exceed capacity by 92 seats or more by the end of the six-year period. An FY 2014 appropriation is approved for facility planning to determine the feasibility, scope, and cost for a classroom addition. A date for the addi-tion will be considered in a future CIP. Relocatable classrooms will be utilized until additional capacity can be added.
CAPITAL PROJECTS
School Project Project Status*Date of Completion
Watkins Mill HS Wellness Center Approved Aug. 2013South Lake ES Classroom
additionProposed TBD
Approved—Project has an FY 2013 or FY 2014 appropriation approved in the FY 2013 or FY 2014 Capital Budget.Programmed—Project has expenditures programmed in a future year of the CIP for planning and/or construction funds.Proposed—Project has facility planning funds approved for FY 2013 or FY 2014 for a feasibility study.
Watkins Mill Cluster Articulation*
Watkins Mill High School
Neelsville MS
South Lake ESStedwick ES**
Montgomery Village MS
Stedwick ES**Watkins Mill ESWhetstone ES
* ”Cluster” is defined as the collection of elementary schools that articulate to the same high school.
* Capt. James Daly Elementary School and Fox Chapel Elementary School also articulate to Neelsville Middle School but thereafter to Clarksburg High School.
** A portion of Stedwick Elementary School articulates to Montgomery Village Middle School, and another portion articulates to Neelsville Middle School.
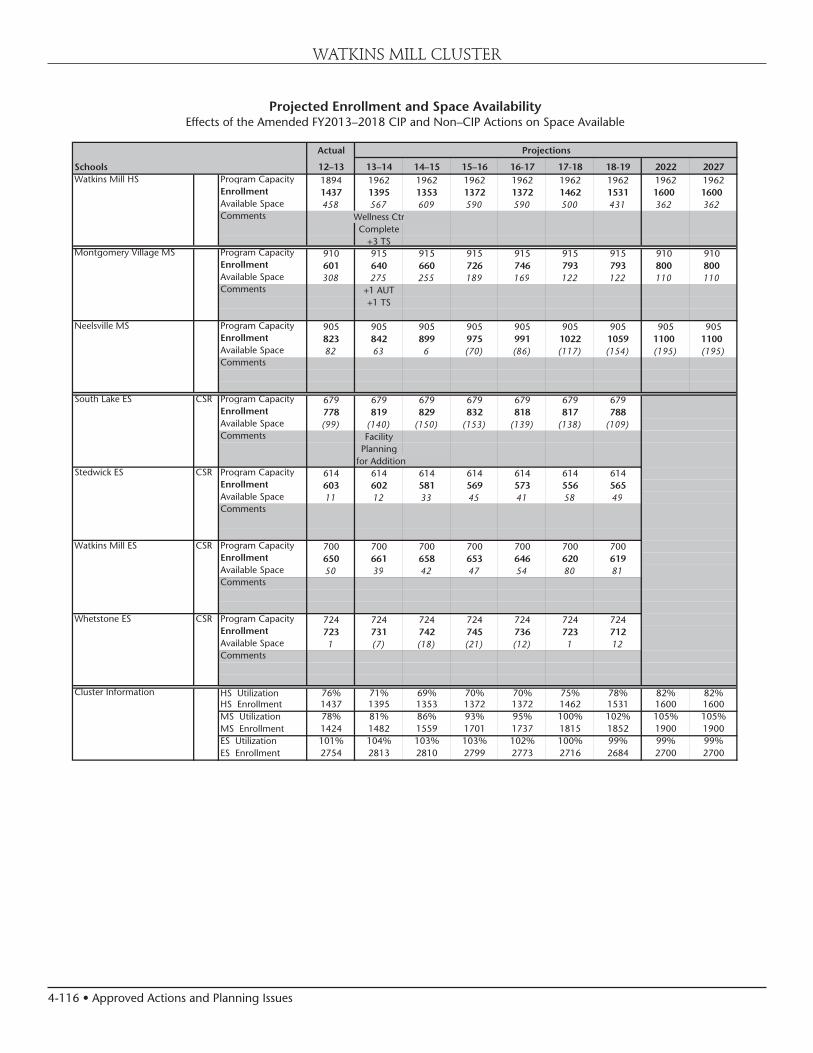
4-116 • Approved Actions and Planning Issues
WATKINS MILL CLUSTER
Projected Enrollment and Space AvailabilityEffects of the Amended FY2013–2018 CIP and Non–CIP Actions on Space Available
Actual
Schools 12–13 13–14 14–15 15–16 16-17 17-18 18-19 2022 2027Watkins Mill HS Program Capacity 1894 1962 1962 1962 1962 1962 1962 1962 1962
Enrollment 1437 1395 1353 1372 1372 1462 1531 1600 1600Available Space 458 567 609 590 590 500 431 362 362Comments Wellness Ctr
Complete+3 TS
Montgomery Village MS Program Capacity 910 915 915 915 915 915 915 910 910Enrollment 601 640 660 726 746 793 793 800 800Available Space 308 275 255 189 169 122 122 110 110Comments +1 AUT
+1 TS
Neelsville MS Program Capacity 905 905 905 905 905 905 905 905 905Enrollment 823 842 899 975 991 1022 1059 1100 1100Available Space 82 63 6 (70) (86) (117) (154) (195) (195)Comments
South Lake ES CSR Program Capacity 679 679 679 679 679 679 679Enrollment 778 819 829 832 818 817 788Available Space (99) (140) (150) (153) (139) (138) (109)Comments Facility
Planningfor Addition
Stedwick ES CSR Program Capacity 614 614 614 614 614 614 614Enrollment 603 602 581 569 573 556 565Available Space 11 12 33 45 41 58 49Comments
Watkins Mill ES CSR Program Capacity 700 700 700 700 700 700 700Enrollment 650 661 658 653 646 620 619Available Space 50 39 42 47 54 80 81Comments
Whetstone ES CSR Program Capacity 724 724 724 724 724 724 724Enrollment 723 731 742 745 736 723 712Available Space 1 (7) (18) (21) (12) 1 12Comments
Cluster Information HS Utilization 76% 71% 69% 70% 70% 75% 78% 82% 82%HS Enrollment 1437 1395 1353 1372 1372 1462 1531 1600 1600MS Utilization 78% 81% 86% 93% 95% 100% 102% 105% 105%MS Enrollment 1424 1482 1559 1701 1737 1815 1852 1900 1900ES Utilization 101% 104% 103% 103% 102% 100% 99% 99% 99%ES Enrollment 2754 2813 2810 2799 2773 2716 2684 2700 2700
Projections
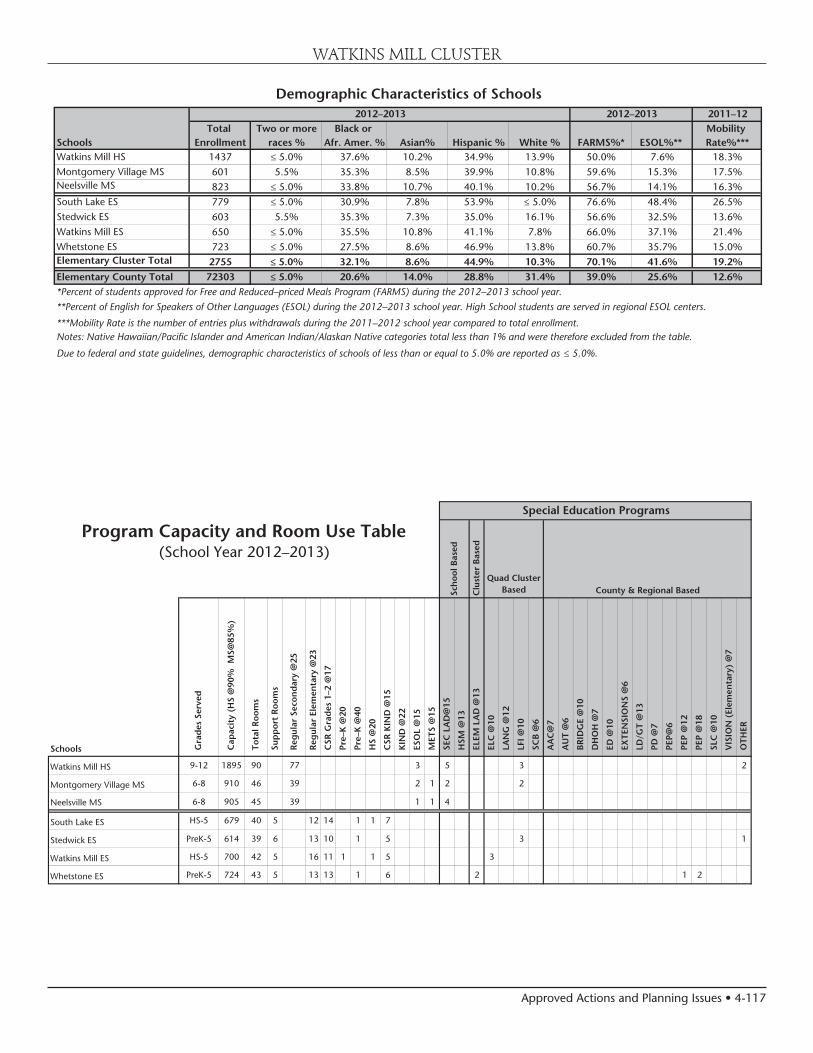
Approved Actions and Planning Issues • 4-117
WATKINS MILL CLUSTER
Demographic Characteristics of Schools2011–12
Total Two or more Black or Mobility Schools Enrollment races % Afr. Amer. % Asian% Hispanic % White % FARMS%* ESOL%** Rate%***Watkins Mill HS 1437 ≤ 5.0% 37.6% 10.2% 34.9% 13.9% 50.0% 7.6% 18.3%Montgomery Village MS 601 5.5% 35.3% 8.5% 39.9% 10.8% 59.6% 15.3% 17.5%Neelsville MS 823 ≤ 5.0% 33.8% 10.7% 40.1% 10.2% 56.7% 14.1% 16.3%South Lake ES 779 ≤ 5.0% 30.9% 7.8% 53.9% ≤ 5.0% 76.6% 48.4% 26.5%Stedwick ES 603 5.5% 35.3% 7.3% 35.0% 16.1% 56.6% 32.5% 13.6%Watkins Mill ES 650 ≤ 5.0% 35.5% 10.8% 41.1% 7.8% 66.0% 37.1% 21.4%Whetstone ES 723 ≤ 5.0% 27.5% 8.6% 46.9% 13.8% 60.7% 35.7% 15.0%Elementary Cluster Total 2755 ≤ 5.0% 32.1% 8.6% 44.9% 10.3% 70.1% 41.6% 19.2%
Elementary County Total 72303 ≤ 5.0% 20.6% 14.0% 28.8% 31.4% 39.0% 25.6% 12.6%*Percent of students approved for Free and Reduced–priced Meals Program (FARMS) during the 2012–2013 school year.
**Percent of English for Speakers of Other Languages (ESOL) during the 2012–2013 school year. High School students are served in regional ESOL centers.
***Mobility Rate is the number of entries plus withdrawals during the 2011–2012 school year compared to total enrollment.Notes: Native Hawaiian/Pacific Islander and American Indian/Alaskan Native categories total less than 1% and were therefore excluded from the table.
Due to federal and state guidelines, demographic characteristics of schools of less than or equal to 5.0% are reported as ≤ 5.0%.
2012–2013 2012–2013
(School Year 2012–2013)
Schools Gra
des
Ser
ved
Cap
acit
y (H
S @
90%
MS@
85%
)
Tot
al R
oom
s
Sup
por
t R
oom
s
Reg
ular
Sec
ond
ary
@25
Reg
ular
Ele
men
tary
@23
CSR
Gra
des
1–2
@17
Pre
–K @
20
Pre
–K @
40
HS
@20
CSR
KIN
D @
15
KIN
D @
22
ESO
L @
15
MET
S @
15
SEC
LA
D@
15
HSM
@13
ELE
M L
AD
@13
ELC
@10
LA
NG
@12
LFI
@10
SC
B @
6
AA
C@
7
AU
T @
6
BR
IDG
E @
10
DH
OH
@7
ED
@10
EX
TEN
SIO
NS
@6
LD
/GT
@13
PD
@7
PEP
@6
PEP
@12
PEP
@18
SLC
@10
VIS
ION
(El
emen
tary
) @
7
OTH
ER
Watkins Mill HS 9-12 1895 90 77 3 5 3 2
Montgomery Village MS 6-8 910 46 39 2 1 2 2
Neelsville MS 6-8 905 45 39 1 1 4
South Lake ES HS-5 679 40 5 12 14 1 1 7
Stedwick ES PreK-5 614 39 6 13 10 1 5 3 1
Watkins Mill ES HS-5 700 42 5 16 11 1 1 5 3
Whetstone ES PreK-5 724 43 5 13 13 1 6 2 1 2
Special Education Programs
Program Capacity and Room Use Table
Sch
ool B
ased
Clu
ster
Bas
ed
Quad Cluster Based County & Regional Based

4-118 • Approved Actions and Planning Issues
WATKINS MILL CLUSTER
Year Year Total Site Reloc- Linkages to Home
Facility Reopened/ Square Size Adjacent atable Learning School
Schools Opened Modernized Footage Acres Park Classrooms Program Model
Watkins Mill HS 1989 301,579 50.99 Yes
Montgomery Village MS 1968 2003 141,615 15.1
Neelsville MS 1981 131,432 29.2
South Lake ES 1972 83,038 10.2
Stedwick ES 1974 109,677 10
Watkins Mill ES 1970 80,923 10 Yes
Whetstone ES 1968 96,946 8.8 Yes
Facility Characteristics of Schools 2012–2013

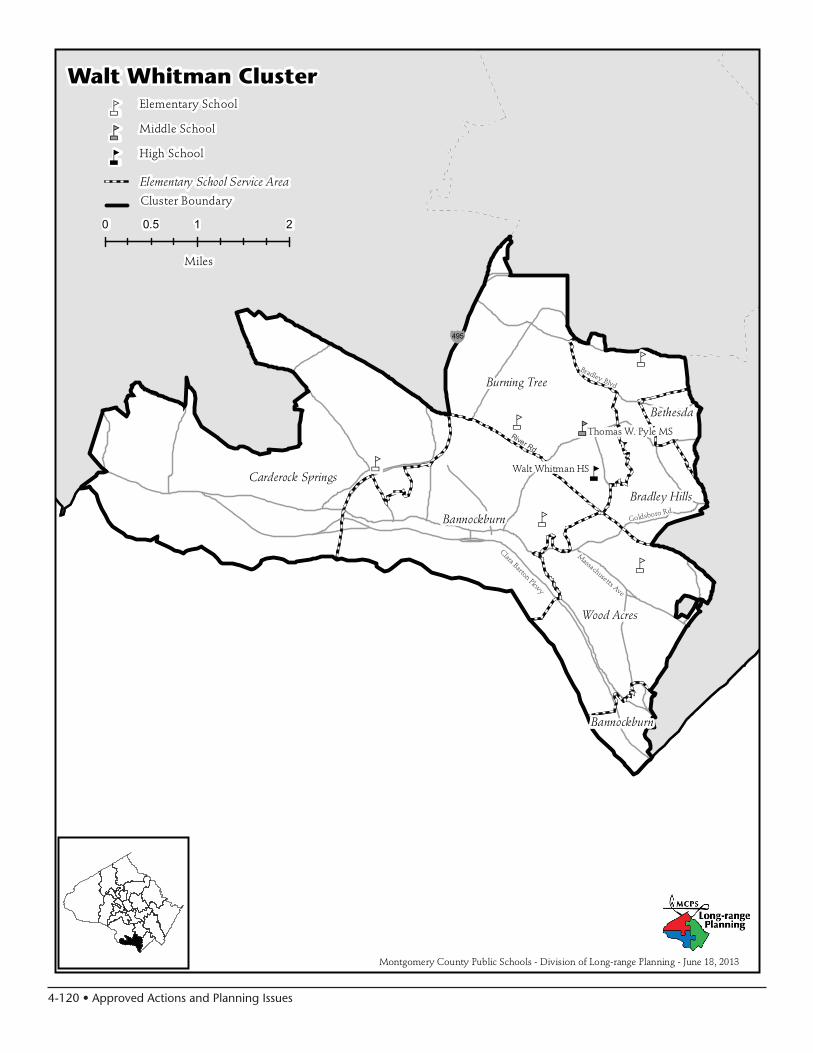
4-120 • Approved Actions and Planning Issues
nmn
nm
nm
nm
nm
nm
Walt Whitman Cluster
Montgomery County Public Schools - Division of Long-range Planning - June 18, 2013
Elementary School Service Area
nm Elementary School
nm Middle School
n High School
Walt Whitman HS
Bradley Hills
Burning Tree
Cluster Boundary
Thomas W. Pyle MS
Carderock Springs
Bannockburn
Wood Acres
Bethesda
Bannockburn
0 1 20.5
Miles
River Rd
¥495
Clara Barton Pkwy
Massachusetts Ave
Goldsboro Rd
Bradley Blvd

Approved Actions and Planning Issues • 4-121
DESIREDRANGE
Note: Percent utilization calculated as total enrollment of schools divided by total capacity.Projected capacity factors in capital projects.
ACTUAL PROJECTED2012 2013 2014 2015 2016 2017 2018 2022 2027
0%
20%
40%
60%
80%
100%
120%
140%
160%
Elementary Schools Middle School High School
Walt Whitman ClusterSchool Utilizations
WALT WHITMAN CLUSTER
SCHOOLS Walt Whitman High SchoolCapital Project: Projections indicate enrollment at Walt Whit-man High School will exceed capacity by 200 seats or more by the end of the six-year period. An FY 2014 appropriation is approved for facility planning funds for a feasibility study to determine the feasibility cost and scope of an addition. Relocatable classrooms will be utilized when needed until additional capacity can be provided.
Thomas W. Pyle Middle SchoolPlanning Issue: Enrollment projections for Thomas W. Pyle Middle School indicate that the school will have an enroll-ment of over 1,500 students and be more than 200 seats over capacity by the end of the six-year CIP planning period. A nine-classroom addition was added to the school in August 2008, bringing the capacity to 1271 students. Enrollment will be monitored in the coming years to determine if capital or non-capital actions will be needed in the future.
Bradley Hills Elementary SchoolPlanning Issue: Student enrollment at elementary schools in the Bethesda-Chevy Chase Cluster increased dramatically over the past two school years. Bethesda Elementary School is one of the schools in the Bethesda-Chevy Chase Cluster that exceeds capacity throughout the six-year CIP planning period. Students in the western portion of the Bethesda El-ementary School service area attend secondary schools in the Walt Whitman Cluster instead of the secondary schools in the Bethesda-Chevy Chase Cluster. As part of the Amended FY 2009–2014 CIP, a feasibility study was conducted during the 2008–2009 school year for an addition to Bradley Hills El-ementary School. The scope of the feasibility study for Bradley Hills Elementary School was expanded to include the option to accommodate the possible reassignment of students who currently attend Bethesda Elementary School for Grades K–5 and articulate to secondary schools in the Walt Whitman Cluster.
Non-capital Solution: A boundary study was conducted in winter 2010 to evaluate reassign-ment of the western portion of the Bethesda Elementary School service area (that articu-lates to the Walt Whitman Cluster secondary schools) to Bradley Hills Elementary School. Representatives from Bethesda Elementary School in the Bethesda-Chevy Chase Cluster and Bradley Hills Elementary School in the Walt Whitman Cluster participated on the Boundary Advisory Study. On March 9, 2010, the Board of Education approved the reassignment of the western portion of the Bethesda Elementary School service area to Bradley Hills Elementary School, beginning in August 2013.
Capital Project: Projections indicate that enrollment at Bradley Hills Elementary School will exceed capacity by 92 seats or more by the end of the six-year period. An FY 2012 appropriation was approved for construction funds to begin the construction of the classroom addition. The scope of the addition includes additional classrooms and an expan-sion of the administration suite and multipurpose room to accommodate the reassignment of students from Bethesda Elementary School. The scheduled completion date for the addition is August 2013. Due to the expanded scope of the addition, and in order to minimize disruption to the school, the school is housed at the Radnor Holding Facility, which is located within the Bradley Hills Elementary School service area, during construction. The school moved into the Radnor Holding Facility in January 2012.
Burning Tree Elementary SchoolCapital Project: Projections indicate enrollment at Burning Tree Elementary School will exceed capacity by 92 seats or more by the end of the six-year period. An FY 2014 appro-priation is approved for facility planning to determine the feasibility, scope, and cost for a classroom addition. A date for the addition will be considered in a future CIP. Relocat-able classrooms will be utilized until additional capacity can be added.
Wood Acres Elementary SchoolCapital Project: Projections indicate enrollment at Wood Acres Elementary School will exceed capacity by 92 seats or more by the end of the six-year CIP planning period. An FY 2014 appropriation is approved for planning funds to begin the architectural design for a classroom addition. The scheduled completion date for the addition for planning funds is August 2016. In order for this project to be completed on schedule, county and state funding must be provided at the levels approved in this CIP.

4-122 • Approved Actions and Planning Issues
WALT WHITMAN CLUSTER
CAPITAL PROJECTS
School Project Project Status*Date of Completion
Bradley Hills ES Classroom addition
Approved Aug. 2013
Burning Tree ES Classroom addition
Proposed TBD
Wood Acres ES Classroom addition
Approved Aug. 2016
Approved—Project has an FY 2013 or FY 2014 appropriation approved in the FY 2013 or FY 2014 Capital Budget.Programmed—Project has expenditures programmed in a future year of the CIP for planning and/or construction funds.Proposed—Project has facility planning funds approved for FY 2013 or FY 2014 for a feasibility study.

Approved Actions and Planning Issues • 4-123
WALT WHITMAN CLUSTER
Projected Enrollment and Space AvailabilityEffects of the Amended FY2013–2018 CIP and Non–CIP Actions on Space Available
Actual
Schools 12–13 13–14 14–15 15–16 16-17 17-18 18-19 2022 2027Walt Whitman HS Program Capacity 1828 1828 1828 1828 1828 1828 1828 1828 1828
Enrollment 1923 1952 1887 1918 1980 2034 2098 2100 2100Available Space (95) (124) (59) (90) (152) (206) (270) (272) (272)Comments Facility
Planningfor Addition
Thomas W. Pyle MS Program Capacity 1271 1271 1271 1271 1271 1271 1271 1271 1271Enrollment 1369 1413 1486 1523 1496 1465 1506 1550 1550Available Space (98) (142) (215) (252) (225) (194) (235) (279) (279)Comments
Bannockburn ES Program Capacity 365 365 365 365 365 365 365Enrollment 382 414 417 426 422 422 400Available Space (17) (49) (52) (61) (57) (57) (35)Comments
Bradley Hills ES Program Capacity 342 638 638 638 638 638 638Enrollment 505 602 633 635 625 631 619Available Space (163) 36 5 3 13 7 19Comments @ Radnor Addition
Complete
Burning Tree ES Program Capacity 391 391 391 391 391 391 391Enrollment 507 511 507 522 518 511 500Available Space (116) (120) (116) (131) (127) (120) (109)Comments Facility
Planning
Carderock Springs ES Program Capacity 406 406 406 406 406 406 406Enrollment 409 430 419 408 415 415 405Available Space (3) (24) (13) (2) (9) (9) 1Comments
Wood Acres ES Program Capacity 550 550 550 550 734 734 734Enrollment 766 759 731 709 714 720 718Available Space (216) (209) (181) (159) 20 14 16Comments Addition
Complete
Cluster Information HS Utilization 105% 107% 103% 105% 108% 111% 115% 115% 115%HS Enrollment 1923 1952 1887 1918 1980 2034 2098 2100 2100MS Utilization 108% 111% 117% 120% 118% 115% 118% 122% 122%MS Enrollment 1369 1413 1486 1523 1496 1465 1506 1550 1550ES Utilization 125% 116% 115% 115% 106% 107% 104% 107% 107%ES Enrollment 2569 2716 2707 2700 2694 2699 2642 2700 2700
forAddition
Projections
Bound. Change
for Addition
Planning

4-124 • Approved Actions and Planning Issues
WALT WHITMAN CLUSTER
Demographic Characteristics of Schools2011–12
Total Two or more Black or Mobility Schools Enrollment races % Afr. Amer. % Asian% Hispanic % White % FARMS%* ESOL%** Rate%***Walt Whitman HS 1923 5.1% ≤ 5.0% 12.4% 8.8% 69.9% ≤ 5.0% ≤ 5.0% 8.3%Thomas W. Pyle MS 1369 5.7% ≤ 5.0% 11.1% 8.1% 72.2% ≤ 5.0% ≤ 5.0% 5.2%Bannockburn ES 382 9.4% ≤ 5.0% 8.6% 6.5% 73.0% ≤ 5.0% 11.0% ≤ 5.0%Bradley Hills ES 505 9.7% ≤ 5.0% 11.5% 9.7% 66.9% ≤ 5.0% 7.1% 5.2%Burning Tree ES 507 7.7% ≤ 5.0% 16.4% 6.9% 65.1% ≤ 5.0% 10.5% 10.5%Carderock Springs ES 409 ≤ 5.0% ≤ 5.0% 13.7% 7.6% 72.4% ≤ 5.0% ≤ 5.0% 5.1%Wood Acres ES 766 5.7% ≤ 5.0% 9.9% 7.8% 73.5% ≤ 5.0% 6.7% 5.3%Elementary Cluster Total 2569 7.1% ≤ 5.0% 11.9% 7.8% 70.3% ≤ 5.0% 7.9% 6.2%
Elementary County Total 72303 ≤ 5.0% 20.6% 14.0% 28.8% 31.4% 39.0% 25.6% 12.6%*Percent of students approved for Free and Reduced–priced Meals Program (FARMS) during the 2012–2013 school year.
**Percent of English for Speakers of Other Languages (ESOL) during the 2012–2013 school year. High School students are served in regional ESOL centers.
***Mobility Rate is the number of entries plus withdrawals during the 2011–2012 school year compared to total enrollment.Notes: Native Hawaiian/Pacific Islander and American Indian/Alaskan Native categories total less than 1% and were therefore excluded from the table.
Due to federal and state guidelines, demographic characteristics of schools of less than or equal to 5.0% are reported as ≤ 5.0%.
2012–2013 2012–2013
(School Year 2012–2013)
Schools Gra
des
Ser
ved
Cap
acit
y (H
S @
90%
MS@
85%
)
Tot
al R
oom
s
Sup
por
t R
oom
s
Reg
ular
Sec
ond
ary
@25
Reg
ular
Ele
men
tary
@23
CSR
Gra
des
1–2
@17
Pre
–K @
20
Pre
–K @
40
HS
@20
CSR
KIN
D @
15
KIN
D @
22
ESO
L @
15
MET
S @
15
SEC
LA
D@
15
HSM
@13
ELE
M L
AD
@13
ELC
@10
LA
NG
@12
LFI
@10
SC
B @
6
AA
C@
7
AU
T @
6
BR
IDG
E @
10
DH
OH
@7
ED
@10
EX
TEN
SIO
NS
@6
LD
/GT
@13
PD
@7
PEP
@6
PEP
@12
PEP
@18
SLC
@10
VIS
ION
(El
emen
tary
) @
7
OTH
ER
Walt Whitman HS 9-12 1828 88 75 3 3 2 1 4
Thomas W. Pyle MS 6-8 1271 63 56 1 4 2
Bannockburn ES K-5 365 20 4 13 3
Bradley Hills ES K-5 342 19 4 12 3
Burning Tree ES K-5 391 24 4 11 4 5
Carderock Springs ES K-5 406 24 4 14 3 3
Wood Acres ES K-5 550 28 3 18 5 2
Special Education Programs
Program Capacity and Room Use Table
Sch
ool B
ased
Clu
ster
Bas
ed
Quad Cluster Based County & Regional Based

Approved Actions and Planning Issues • 4-125
WALT WHITMAN CLUSTER
Year Year Total Site Reloc- Linkages to Home
Facility Reopened/ Square Size Adjacent atable Learning School
Schools Opened Modernized Footage Acres Park Classrooms Program Model
Walt Whitman HS 1962 1992 261,295 30.7 Yes
Thomas W. Pyle MS 1962 1993 153,824 14.3
Bannockburn ES 1957 1988 54,234 8.3 2
Bradley Hills ES 1951 1984 76,745 6.7 Yes
Burning Tree ES 1958 1991 68,119 6.8 Yes 3
Carderock Springs ES 1966 2010 75,351 9
Wood Acres ES 1952 2002 73,138 4.78 Yes 7
Facility Characteristics of Schools 2012–2013

4-126 • Approved Actions and Planning Issues
nm
nm
nm
nm n
nm
nm
nm
nm
Thomas S. Wootton Cluster
Montgomery County Public Schools - Division of Long-range Planning - June 18, 2013
Elementary School Service Area
nm Elementary School
nm Middle School
n High School
Cluster Boundary
Cabin John MS
Robert Frost MS Thomas S. Wootton HS
Cabin John MS
Robert Frost MS
Travilah
Stone Mill
Lakewood
Cold Spring
DuFief
Fallsmead
Fallsmead
Stone Mill
Lakewood
0 1 20.5
Miles
¥270
River Rd
Darnestown Rd
Falls R
d
Key West Ave
¥270

Approved Actions and Planning Issues • 4-127
DESIREDRANGE
Note: Percent utilization calculated as total enrollment of schools divided by total capacity.Projected capacity factors in capital projects.
ACTUAL PROJECTED2012 2013 2014 2015 2016 2017 2018 2022 2027
0%
20%
40%
60%
80%
100%
120%
140%
160%
Elementary Schools Middle Schools High School
Thomas S. Wootton ClusterSchool Utilizations
THOMAS S. WOOTTON CLUSTER
SCHOOLSThomas S. Wootton High SchoolCapital Project: A modernization project was previously scheduled for this school with completion in August 2018. However, due to fiscal constraints in the county, the comple-tion date for this project has been delayed by two years to August 2020 for the building and August 2021 for restoration of the site. FY 2015 expenditures are programmed for facil-ity planning funds to determine the scope and cost of the modernization. In order for this project to be completed on schedule, county and state funding must be provided at levels approved in this CIP.
Cold Spring Elementary SchoolCapital Project: A modernization project is scheduled for this school with a completion date of August 2019. FY 2015 expenditures are programmed for facility planning for a fea-sibility study to determine the scope and cost of the project. In order for this project to be completed on schedule, county and state funding must be provided at the levels approved in this CIP.
DuFief Elementary SchoolCapital Project: A modernization project is scheduled for this school with a completion date of August 2019. FY 2015 expenditures are programmed for facility planning for a fea-sibility study to determine the scope and cost of the project. In order for this project to be completed on schedule, county and state funding must be provided at the levels approved in this CIP.
CAPITAL PROJECTS
School Project Project Status*Date of Completion
Wootton HS Modernization Programmed Aug. 2020, building Aug. 2021, site (Delayed)
Cold Spring ES Modernization Programmed Aug. 2019DuFief ES Modernization Programmed Aug. 2019
Approved—Project has an FY 2013 or FY 2014 appropriation approved in the FY 2013 or FY 2014 Capital Budget.Programmed—Project has expenditures programmed in a future year of the CIP for planning and/or construction funds.Proposed—Project has facility planning funds approved for FY 2013 or FY 2014 for a feasibility study.

4-128 • Approved Actions and Planning Issues
Projected Enrollment and Space AvailabilityEffects of the Amended FY2013–2018 CIP and Non–CIP Actions on Space Available
ActualSchools 12–13 13–14 14–15 15–16 16-17 17-18 18-19 2022 2027Thomas S. Wootton HS Program Capacity 2127 2127 2127 2127 2127 2127 2127 2127 2127
Enrollment 2300 2234 2219 2214 2176 2156 2143 2200 2200Available Space (173) (107) (92) (87) (49) (29) (16) (73) (73)Comments Facility
Planningfor Mod.
Cabin John MS Program Capacity 1099 1099 1099 1099 1099 1099 1099 1099 1099Enrollment 925 935 944 968 1002 1020 1030 1050 1050Available Space 174 164 155 131 97 79 69 49 49Comments
Robert Frost MS Program Capacity 1058 1058 1058 1058 1058 1058 1058 1058 1058Enrollment 1141 1143 1118 1065 1001 958 937 950 950Available Space (83) (85) (60) (7) 57 100 121 108 108Comments
Cold Spring ES Program Capacity 458 458 458 458 458 458 458Enrollment 362 363 358 353 344 350 355Available Space 96 95 100 105 114 108 103Comments Facility
Planningfor Mod.
DuFief ES Program Capacity 405 405 405 405 405 405 405Enrollment 366 354 340 343 342 342 342Available Space 39 51 65 62 63 63 63Comments Facility
Planningfor Mod.
Fallsmead ES Program Capacity 597 597 597 597 597 597 597Enrollment 534 551 530 522 523 535 530Available Space 63 46 67 75 74 62 67Comments
Lakewood ES Program Capacity 556 556 556 556 556 556 556Enrollment 571 546 536 524 518 517 515Available Space (15) 10 20 32 38 39 41Comments
Stone Mill ES Program Capacity 654 654 654 654 654 654 654Enrollment 634 626 636 636 632 635 634Available Space 20 28 18 18 22 19 20Comments
Travilah ES Program Capacity 504 504 504 504 504 504 504Enrollment 430 415 415 409 404 403 405Available Space 74 89 89 95 100 101 99Comments
Cluster Information HS Utilization 108% 105% 104% 104% 102% 101% 101% 103% 103%HS Enrollment 2300 2234 2219 2214 2176 2156 2143 2200 2200MS Utilization 96% 96% 96% 94% 93% 92% 91% 93% 93%MS Enrollment 2066 2078 2062 2033 2003 1978 1967 2000 2000ES Utilization 91% 90% 89% 88% 87% 88% 88% 88% 88%ES Enrollment 2897 2855 2815 2787 2763 2782 2781 2800 2800
Projections
Planningfor
Modernization
Planningfor
Modernization
Planningfor
Modernization
THOMAS S. WOOTTON CLUSTER
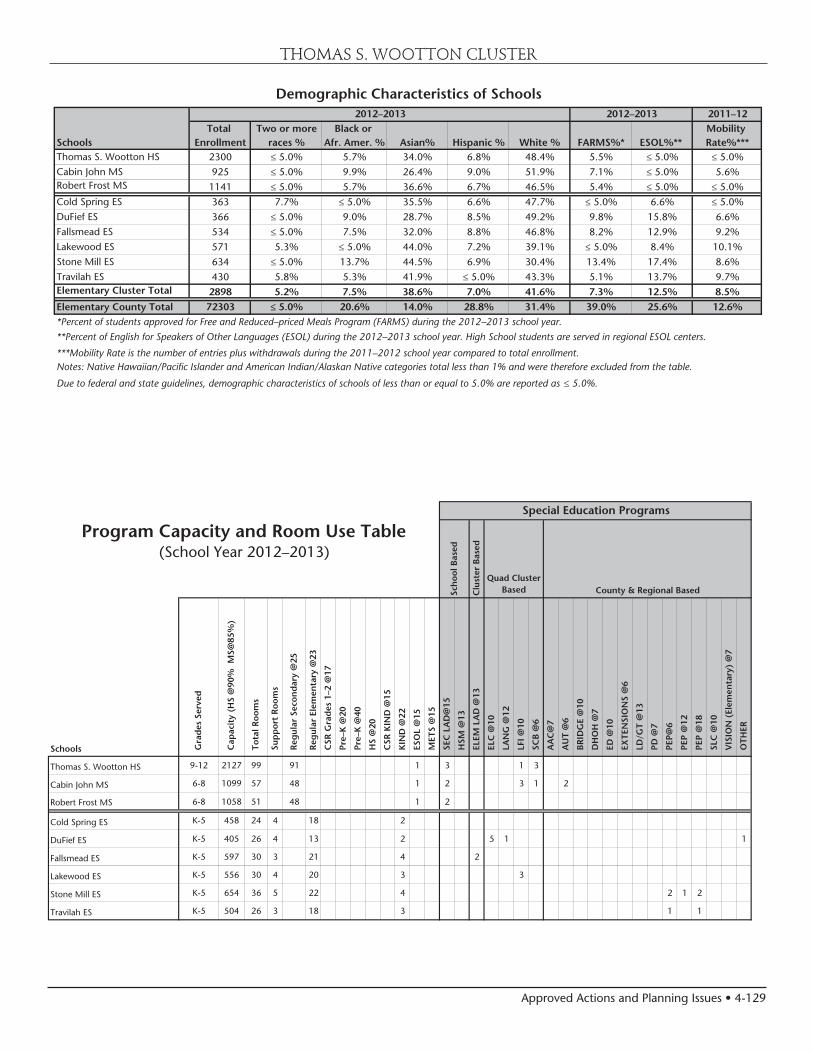
Approved Actions and Planning Issues • 4-129
THOMAS S. WOOTTON CLUSTER
Demographic Characteristics of Schools2011–12
Total Two or more Black or Mobility Schools Enrollment races % Afr. Amer. % Asian% Hispanic % White % FARMS%* ESOL%** Rate%***Thomas S. Wootton HS 2300 ≤ 5.0% 5.7% 34.0% 6.8% 48.4% 5.5% ≤ 5.0% ≤ 5.0%Cabin John MS 925 ≤ 5.0% 9.9% 26.4% 9.0% 51.9% 7.1% ≤ 5.0% 5.6%Robert Frost MS 1141 ≤ 5.0% 5.7% 36.6% 6.7% 46.5% 5.4% ≤ 5.0% ≤ 5.0%Cold Spring ES 363 7.7% ≤ 5.0% 35.5% 6.6% 47.7% ≤ 5.0% 6.6% ≤ 5.0%DuFief ES 366 ≤ 5.0% 9.0% 28.7% 8.5% 49.2% 9.8% 15.8% 6.6%Fallsmead ES 534 ≤ 5.0% 7.5% 32.0% 8.8% 46.8% 8.2% 12.9% 9.2%Lakewood ES 571 5.3% ≤ 5.0% 44.0% 7.2% 39.1% ≤ 5.0% 8.4% 10.1%Stone Mill ES 634 ≤ 5.0% 13.7% 44.5% 6.9% 30.4% 13.4% 17.4% 8.6%Travilah ES 430 5.8% 5.3% 41.9% ≤ 5.0% 43.3% 5.1% 13.7% 9.7%Elementary Cluster Total 2898 5.2% 7.5% 38.6% 7.0% 41.6% 7.3% 12.5% 8.5%
Elementary County Total 72303 ≤ 5.0% 20.6% 14.0% 28.8% 31.4% 39.0% 25.6% 12.6%*Percent of students approved for Free and Reduced–priced Meals Program (FARMS) during the 2012–2013 school year.
**Percent of English for Speakers of Other Languages (ESOL) during the 2012–2013 school year. High School students are served in regional ESOL centers.
***Mobility Rate is the number of entries plus withdrawals during the 2011–2012 school year compared to total enrollment.Notes: Native Hawaiian/Pacific Islander and American Indian/Alaskan Native categories total less than 1% and were therefore excluded from the table.
Due to federal and state guidelines, demographic characteristics of schools of less than or equal to 5.0% are reported as ≤ 5.0%.
2012–2013 2012–2013
(School Year 2012–2013)
Schools Gra
des
Ser
ved
Cap
acit
y (H
S @
90%
MS@
85%
)
Tot
al R
oom
s
Sup
por
t R
oom
s
Reg
ular
Sec
ond
ary
@25
Reg
ular
Ele
men
tary
@23
CSR
Gra
des
1–2
@17
Pre
–K @
20
Pre
–K @
40
HS
@20
CSR
KIN
D @
15
KIN
D @
22
ESO
L @
15
MET
S @
15
SEC
LA
D@
15
HSM
@13
ELE
M L
AD
@13
ELC
@10
LA
NG
@12
LFI
@10
SC
B @
6
AA
C@
7
AU
T @
6
BR
IDG
E @
10
DH
OH
@7
ED
@10
EX
TEN
SIO
NS
@6
LD
/GT
@13
PD
@7
PEP
@6
PEP
@12
PEP
@18
SLC
@10
VIS
ION
(El
emen
tary
) @
7
OTH
ER
Thomas S. Wootton HS 9-12 2127 99 91 1 3 1 3
Cabin John MS 6-8 1099 57 48 1 2 3 1 2
Robert Frost MS 6-8 1058 51 48 1 2
Cold Spring ES K-5 458 24 4 18 2
DuFief ES K-5 405 26 4 13 2 5 1 1
Fallsmead ES K-5 597 30 3 21 4 2
Lakewood ES K-5 556 30 4 20 3 3
Stone Mill ES K-5 654 36 5 22 4 2 1 2
Travilah ES K-5 504 26 3 18 3 1 1
Special Education Programs
Program Capacity and Room Use Table
Sch
ool B
ased
Clu
ster
Bas
ed
Quad Cluster Based County & Regional Based

4-130 • Approved Actions and Planning Issues
THOMAS S. WOOTTON CLUSTER
Year Year Total Site Reloc- Linkages to Home
Facility Reopened/ Square Size Adjacent atable Learning School
Schools Opened Modernized Footage Acres Park Classrooms Program Model
Thomas S. Wootton HS 1970 295,620 27.4 10
Cabin John MS 1967 2011 159,514 18.2
Robert Frost MS 1971 143,757 24.8
Cold Spring ES 1972 55,158 12.4 1
DuFief ES 1975 59,013 10 Yes 2
Fallsmead ES 1974 67,472 9 Yes
Lakewood ES 1968 2003 77,526 13.1
Stone Mill ES 1988 78,617 11.8
Travilah ES 1960 1992 65,378 9.3
Facility Characteristics of Schools 2012–2013


4-132 • Approved Actions and Planning Issues
nn
n
n
n
RICA SP
Longview
Rock Terrace SP
Carl Sandburg SP
Stephen Knolls SP
Montgomery County Public Schools - Division of Long-range Planning - June 18, 2013
Special Education Centers
Cluster Boundary
SP: Special Education Centern
0 4 82
Miles
Clarksburg
Poolesville
Damascus
Gaithersburg
WatkinsMill
Seneca Valley
Northwest QuinceOrchard
WoottonRichard
Montgomery
Rockville
Magruder
Sherwood
DowncountyConsortium
NortheastConsortium
BethesdaChevyChase
WalterJohnson
Walt Whitman
Winston Churchill
Approved Actions and Planning Issues • 4-133
SPECIAL EDUCATION CENTERSLongview SchoolLongview School provides services to students aged 5–21 with severe to profound intellectual disabilities and multiple disabilities. The Fundamental Life Skills (FLS) curriculum is utilized to provide students with skills in the area of com-munication, mobility, self-help, functional academics, and transition services. Longview School is collocated with Spark Matsunaga Elementary School in the Northwest Cluster.
John L. Gildner Regional institute for Children and Adolescents (RICA)The RICA Rockville Program, in collaboration with the Maryland State Department of Health and Mental Hygiene, provides appropriate educational and treatment services to all students and their families through highly-structured, intensive special education services with therapy integrated in a day and residential treatment facility. An interdisciplinary treatment team, comprised of school, clinical, residential, and related service providers, develops the student’s total educational plan and monitors progress. Consulting psychiatrists, a full time pediatrician, and a school community health nurse are also on staff.
RICA offers fully accredited special education services which emphasize rigorous academic and vocational/occupational opportunities; day and residential treatment; and individual, group, and family therapy. The RICA program promotes ac-quisition of grade and age appropriate social and emotional skills and allows students to access the general education curriculum.
Rock Terrace SchoolRock Terrace School is comprised of a middle school, a high school, and an upper school that prepares students for post secondary opportunities, including gainful employment and adult day programs. Alternate Academic Outcomes aligned with Curriculum 2.0 and electives in culinary arts, computer science, and career job training programs prepare students to transition from school to work. Authentic work experi-ences in the community prepare students for post secondary opportunities.
Capital Project: Rock Terrace School was assessed as part of the Facilities Assessment with Criteria and Testing (FACT) process during the 2010–2011 school year. (See Appendix R for the FACT score of this facility.) To address facilities needs at this school, an FY 2013 appropriation for facility planning was approved in the Modification to Holding, Special Educa-tion, and Alternative Centers Project for a feasibility study to identify improvements for this building. A recommendation for facility improvements will be made in a future CIP.
Carl Sandburg Learning CenterCarl Sandburg Learning Center is designed for elementary students who need a highly structured setting. The Alternate Academic Outcomes aligned with Curriculum 2.0 and the general education curriculum are used to instruct the students. Emphasis is placed on the development of language, academics, and social skills, which is provided through a transdisciplinary model. Special emphasis is placed on meeting the sensory and motor needs of students in their classroom setting. To address behavioral goals, services may include a behavior management system, psychological consultation, and crisis intervention.
Planning Study: On November 27, 2007, the Board of Education adopted a resolution regarding stand-alone special education centers. The resolution stated that when the superin-tendent of schools was ready to address facility improvements for stand-alone special education centers, a multi-stakeholder work group comprised of community members and MCPS staff should be convened to review and make recommenda-tions for the Board of Education to consider. The Maryland State Department of Education (MSDE) has stated that state funding would be very difficult to acquire for stand-alone special education centers because students in these centers are not provided opportunities to receive instruction in the general education setting to the maximum extent appropriate.
Carl Sandburg Learning Center was previously scheduled for a modernization in the Amended FY 2007–2012 CIP because the program is in need of an up-to-date facility to support the level of services that the students at this center receive. In order to continue providing the high level of services in a modern, up-to-date facility for Carl Sandburg Learning Center, the superintendent of schools directed MCPS staff to convene a Roundtable Advisory Committee with a multi-stakeholder representation to review the possibility of collocating Carl Sandburg Learning Center on the Maryvale Elementary School campus. Maryvale Elementary School was identified due to an upcoming modernization, the school is centrally located in the Rockville Cluster, and there is a large site to accommodate the school and the Carl Sandburg Learning Center program.
The Roundtable Advisory Committee included both the parents and staff from Carl Sandburg Learning Center and Maryvale Elementary School. Staff from the Office of School Performance, the Department of Special Education, and the Division of Long-range Planning, Department of Facilities Management facilitated the process. The Roundtable Ad-visory Committee discussed the various implications of collocation, including facilities, staffing, and opportunities for special education students to receive instruction in the general education setting. On November 17, 2011, the Board of Education approved the collocation of Carl Sandburg Learning Center on the Maryvale Elementary School campus. The Board of Education action is posted at the following link: http://www.montgomeryschoolsmd.org/boe/meetings/agenda/2011-12/2011-1117/4.0%20Collocation%20of%20Carl%20Sandburg%20Learning%20Center%20and%20Maryvale%20Elem%20School.pdf
SPECIAL EDUCATION CENTERS
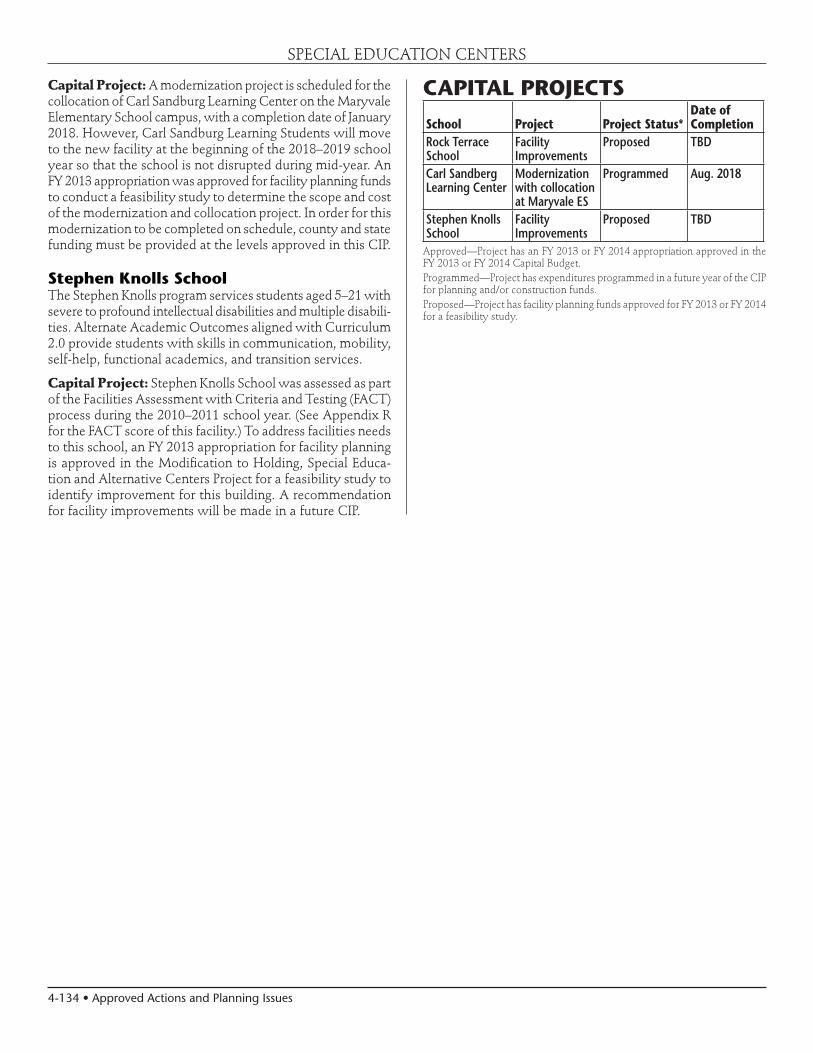
4-134 • Approved Actions and Planning Issues
SPECIAL EDUCATION CENTERS
Capital Project: A modernization project is scheduled for the collocation of Carl Sandburg Learning Center on the Maryvale Elementary School campus, with a completion date of January 2018. However, Carl Sandburg Learning Students will move to the new facility at the beginning of the 2018–2019 school year so that the school is not disrupted during mid-year. An FY 2013 appropriation was approved for facility planning funds to conduct a feasibility study to determine the scope and cost of the modernization and collocation project. In order for this modernization to be completed on schedule, county and state funding must be provided at the levels approved in this CIP.
Stephen Knolls SchoolThe Stephen Knolls program services students aged 5–21 with severe to profound intellectual disabilities and multiple disabili-ties. Alternate Academic Outcomes aligned with Curriculum 2.0 provide students with skills in communication, mobility, self-help, functional academics, and transition services.
Capital Project: Stephen Knolls School was assessed as part of the Facilities Assessment with Criteria and Testing (FACT) process during the 2010–2011 school year. (See Appendix R for the FACT score of this facility.) To address facilities needs to this school, an FY 2013 appropriation for facility planning is approved in the Modification to Holding, Special Educa-tion and Alternative Centers Project for a feasibility study to identify improvement for this building. A recommendation for facility improvements will be made in a future CIP.
CAPITAL PROJECTS
School Project Project Status*Date of Completion
Rock Terrace School
Facility Improvements
Proposed TBD
Carl Sandberg Learning Center
Modernization with collocation at Maryvale ES
Programmed Aug. 2018
Stephen Knolls School
Facility Improvements
Proposed TBD
Approved—Project has an FY 2013 or FY 2014 appropriation approved in the FY 2013 or FY 2014 Capital Budget.Programmed—Project has expenditures programmed in a future year of the CIP for planning and/or construction funds.Proposed—Project has facility planning funds approved for FY 2013 or FY 2014 for a feasibility study.

Approved Actions and Planning Issues • 4-135
SPECIAL EDUCATION CENTERS
Projected Enrollment and Space AvailabilityEffects of the Amended FY2013–2018 CIP and Non–CIP Actions on Space Available
Actual
Schools 12–13 13–14 14–15 15–16 16-17 17-18 18-19 2022 2027Stephen Knolls Program Capacity 190 190 190 190 190 190 190
Enrollment 91 38 48 48 48 48 48Available Space 99 152 142 142 142 142 142Comments
Longview Program Capacity 48 48 48 48 48 48 48Enrollment 35 38 48 48 48 48 48Available Space 13 10 0 0 0 0 0Comments
RICA Program Capacity 180 180 180 180 180 180 180Enrollment 98 86 96 96 96 96 96Available Space 82 94 84 84 84 84 84Comments
Rock Terrace Program Capacity 100 100 100 100 100 100 100Enrollment 86 98 109 109 109 109 109Available Space 14 2 (9) (9) (9) (9) (9)Comments
Carl Sandburg Program Capacity 102 102 102 102 102 142 142Enrollment 118 119 130 130 130 130 130Available Space (16) (17) (28) (28) (28) 12 12Comments Facility Mod.
Planning Completefor Mod. Aug. 2018
Cluster Information Utilization 69% 61% 70% 70% 70% 65% 65%Enrollment 428 379 431 431 431 431 431
Projections
Planningfor Modernization
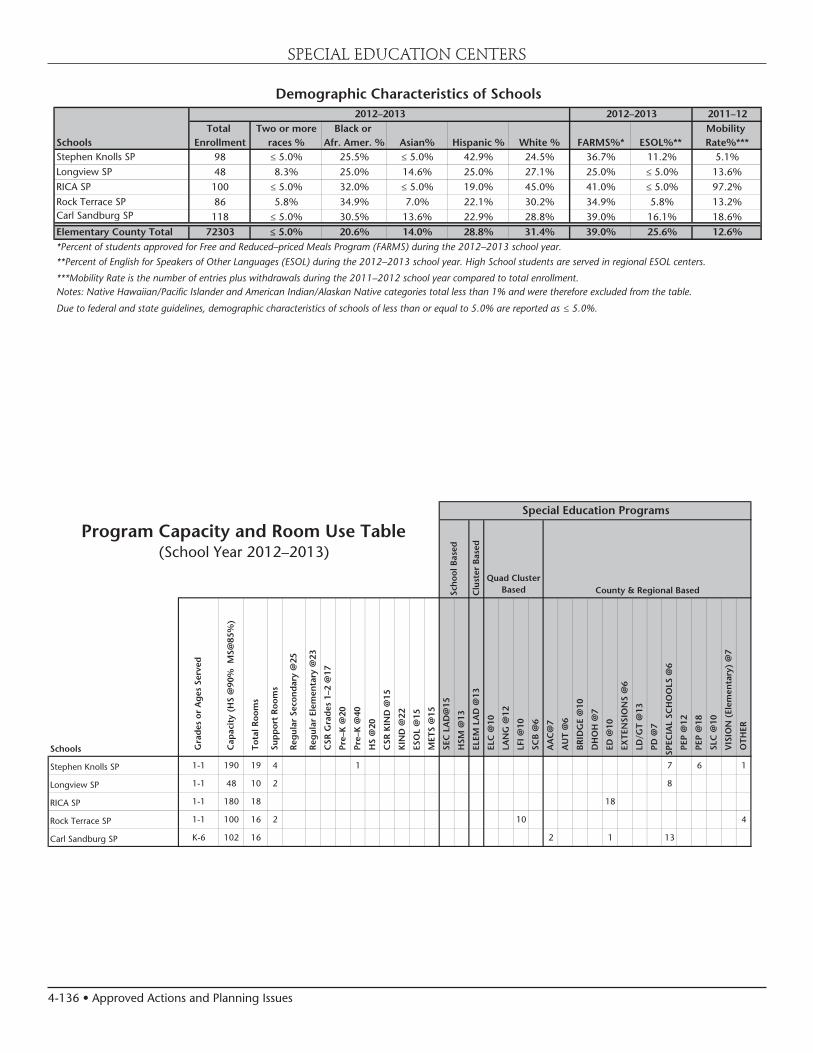
4-136 • Approved Actions and Planning Issues
SPECIAL EDUCATION CENTERS
Demographic Characteristics of Schools2011–12
Total Two or more Black or Mobility Schools Enrollment races % Afr. Amer. % Asian% Hispanic % White % FARMS%* ESOL%** Rate%***Stephen Knolls SP 98 ≤ 5.0% 25.5% ≤ 5.0% 42.9% 24.5% 36.7% 11.2% 5.1%Longview SP 48 8.3% 25.0% 14.6% 25.0% 27.1% 25.0% ≤ 5.0% 13.6%RICA SP 100 ≤ 5.0% 32.0% ≤ 5.0% 19.0% 45.0% 41.0% ≤ 5.0% 97.2%Rock Terrace SP 86 5.8% 34.9% 7.0% 22.1% 30.2% 34.9% 5.8% 13.2%Carl Sandburg SP 118 ≤ 5.0% 30.5% 13.6% 22.9% 28.8% 39.0% 16.1% 18.6%
Elementary County Total 72303 ≤ 5.0% 20.6% 14.0% 28.8% 31.4% 39.0% 25.6% 12.6%*Percent of students approved for Free and Reduced–priced Meals Program (FARMS) during the 2012–2013 school year.
**Percent of English for Speakers of Other Languages (ESOL) during the 2012–2013 school year. High School students are served in regional ESOL centers.
***Mobility Rate is the number of entries plus withdrawals during the 2011–2012 school year compared to total enrollment.Notes: Native Hawaiian/Pacific Islander and American Indian/Alaskan Native categories total less than 1% and were therefore excluded from the table.
Due to federal and state guidelines, demographic characteristics of schools of less than or equal to 5.0% are reported as ≤ 5.0%.
2012–2013 2012–2013
(School Year 2012–2013)
Schools Gra
des
or
Ag
es S
erve
d
Cap
acit
y (H
S @
90%
MS@
85%
)
Tot
al R
oom
s
Sup
por
t R
oom
s
Reg
ular
Sec
ond
ary
@25
Reg
ular
Ele
men
tary
@23
CSR
Gra
des
1–2
@17
Pre
–K @
20
Pre
–K @
40
HS
@20
CSR
KIN
D @
15
KIN
D @
22
ESO
L @
15
MET
S @
15
SEC
LA
D@
15
HSM
@13
ELE
M L
AD
@13
ELC
@10
LA
NG
@12
LFI
@10
SC
B @
6
AA
C@
7
AU
T @
6
BR
IDG
E @
10
DH
OH
@7
ED
@10
EX
TEN
SIO
NS
@6
LD
/GT
@13
PD
@7
SPEC
IAL
SCH
OO
LS @
6
PEP
@12
PEP
@18
SLC
@10
VIS
ION
(El
emen
tary
) @
7
OTH
ER
Stephen Knolls SP 1-1 190 19 4 1 7 6 1
Longview SP 1-1 48 10 2 8
RICA SP 1-1 180 18 18
Rock Terrace SP 1-1 100 16 2 10 4
Carl Sandburg SP K-6 102 16 2 1 13
Special Education Programs
Program Capacity and Room Use Table
Sch
ool B
ased
Clu
ster
Bas
ed
Quad Cluster Based County & Regional Based

Approved Actions and Planning Issues • 4-137
SPECIAL EDUCATION CENTERS
Year Year Total Site Reloc- Linkages to Home
Facility Reopened/ Square Size Adjacent atable Learning School
Schools Opened Modernized Footage Acres Park Classrooms Program Model
Stephen Knolls SP 1958 1979 48,872 6.6
Longview SP 2001 40,362 10
RICA SP 1977 95,000 14.3
Rock Terrace SP 1950 1974 48,024 10.3
Carl Sandburg SP 1962 31,252 7.6 2
Facility Characteristics of Schools 2012–2013

4-138 • Approved Actions and Planning Issues
nn
n
n
n
T
#
nnm
Montgomery County Public Schools - Division of Long-range Planning - June 18, 2013
Other Educational Facilities
Clarksburg
Poolesville
Damascus
Gaithersburg
WatkinsMill
Seneca Valley
Northwest QuinceOrchard
WoottonRichard
Montgomery
Rockville
Magruder
Sherwood
Downcounty
Consortium
NortheastConsortium
BethesdaChevyChase
WalterJohnson
Walt Whitman
Winston Churchill
Edison HS TECH
Lathrop E. Smith ENV
Hadley Farms AS
0 4 82
Miles
MCPS PreK at Stephen Knolls
Glenmont Program AS
Blair G. Ewing Center-Fleet Street AS-Needwood Academy AS-Phoenix at Needwood AS-Randolph Academy AS
Community Montessori CS
n ALT : Alternative School
nm CS: Charter School
# ENV: Environmental Education Center
T TECH: Technical Career High School
Cluster
Approved Actions and Planning Issues • 4-139
OTHER EDUCATIONAL FACILITIES
ALTERNATIVE PROGRAMSLevel 1 ProgramsMontgomery County Public Schools (MCPS) operates six alterna-tive programs for middle and high school students who are not reaching their full potential in their home schools for a variety of reasons. Alternative Programs (AP) strives to provide the proper connection for our learners who have been disconnected in some way during their educational experience in comprehen-sive schools. AP provides supports and services that promote success for all students through academic and personal growth.
The Level 1 program is a prerequisite for application to the APs. All secondary schools are required to establish a Level 1 program as an intervention strategy for providing at-risk students with an opportunity to make improvements in their academic program and/or improve their behavior.
Level 2 and Level 3 intervention and prevention services are designed to meet the unique needs of the students. These alternative education programs provide direct academic instruc-tion as well as services that address the emotional, intellectual, social, and physical demands of adolescence. The programs offer closely supervised and skillfully structured classes, allow-ing for decisive feedback from and immediate interventions by staff members. Differentiated instruction is done in small classes so students can fully access the curriculum.
Social skills training and behavioral strategy development are infused into the traditional MCPS and MSDE curriculum. The behavior management system follows the principles of Positive Behavior Interventions and Supports (PBIS). This includes proactive strategies for defining, teaching, and sup-porting appropriate student behaviors. In addition to academic and behavioral interventions, the programs offer counseling, social work services, case management, parent outreach, and community partnerships. The goal of each program is to help students return to and function effectively in their comprehensive secondary home schools.
Level 2 High School Alternative ProgramsApplication to a Level 2 program should include documen-tation of the student’s participation in the Level 1 program. The programs below are operated solely by Montgomery County Public Schools for high school students who are not successful for a wide variety of reasons, usually including behavior and/or attendance problems. Students are referred by the home school’s Collaborative Problem-solving Team (CPS). Each site provides academic instruction in coursework that earns credits toward a high school diploma. In addition, a behavioral/social skills component addresses social skills necessary to return the student to his/her home school and succeed. The behavior management system follows the prin-ciples of Positive Behavior Interventions and Supports (PBIS), which includes proactive strategies for defining, teaching, and supporting appropriate student behaviors. In addition to academic and behavioral interventions, the programs also
offer counseling, case management services, parent outreach, and frequent progress monitoring.
Needwood AcademyNeedwood Academy is the level two high school alternative program for students who are not reaching their full potential in comprehensive schools. Students are referred by their home school’s CPS team for a variety of reasons, including academic, attendance, and/or behavioral issues. The program provides academic instruction in MCPS approved credit-bearing courses so students can earn a high school diploma. In addition to the standard curriculum, staff members infuse social skills into their classes so students develop the tools needed to return to and succeed in their home schools.
Level 2 High School Recovery ProgramPhoenix Program The Phoenix Program at the Needwood Academy is a recovery program for level two high school students with substance abuse issues that interfere with their academic achievement, attendance, and/or behavior. Students are referred either by drug treatment agencies or by their home school’s CPS team. The program provides academic instruction in MCPS approved credit-bearing courses so students can earn a high school diploma. A drug-free environment is maintained through weekly urinalysis and group counseling. In addition to academic instruction and recovery counseling, students participate in adventurous field trips, community service projects, and team building activities. Phoenix is not a drug treatment program; it is support program for students currently enrolled in treatment or just exiting treatment.
Level 2 Middle School Alternative Programs Glenmont and Hadley Farms are the level two middle school alternative programs for students who are not reaching their full potential in comprehensive schools. Glenmont serves students in the downcounty area while Hadley Farms serves students in the upcounty area. Students are referred by their home school’s CPS team for a variety of reasons, including academic, atten-dance, and/or behavioral issues. Each site provides academic instruction in MCPS approved courses leading to completion of all grade-level objectives and promotion to the next grade. Social skills and behavior strategies are taught and monitored so students can return to and succeed in their home schools.
Level 3 ProgramsBlair G. Ewing CenterCapital Project: Blair G. Ewing Center was assessed as part of the Facilities Assessment with Criteria and Testing (FACT) process during the 2010–2011 school year. (See Appendix R

4-140 • Approved Actions and Planning Issues
OTHER EDUCATIONAL FACILITIES
for the FACT score of this facility.) To address facilities needs at this school, an FY 2013 appropriation for facility planning was approved in the Modification to Holding, Special Educa-tion and Alternative Centers Project for a feasibility study to identify improvement for this building. A recommendation for facility improvements will be made in a future CIP.
The following programs are located at Blair G. Ewing Center.
Fleet Street ProgramFleet Street serves level three middle school students who have been involved in a serious disciplinary action that warranted a recommendation for expulsion. Students are referred by the Office of the Chief Operating Officer (OCOO) in lieu of expulsion. Special Education students who have been expelled are placed here as well. The PPW at the student’s home school facilitates the referral process. The program provides academic instruction in MCPS approved courses leading to completion of all grade-level objectives and promotion to the next grade. Social skills and behavior strategies are taught and monitored so students can return to and succeed in their home schools.
Randolph AcademyRandolph Academy serves level three high school students who have been involved in a serious disciplinary action that warranted a recommendation for expulsion. Students are referred by the Office of the Chief Operating Officer (OCOO) in lieu of expulsion. Special Education students who have been expelled are placed here as well. The PPW at the student’s home school facilitates the referral process. The program provides academic instruction in MCPS approved credit-bearing courses so students can earn a high school diploma. Randolph Academy utilizes both direct instruction by certified teachers and online distance learning. Following a modified school day schedule, students are enrolled in either
the morning session or the afternoon session. Transportation is provided, but meals are not.
45-day Interim Placement ProgramThe 45-Day Program, managed by the Randolph Academy resource teacher, is for Special Education students in both middle and high school. Students are placed in the program as a result of their involvement with controlled substances, serious bodily injury, and/or weapons. Students remain en-rolled in their home schools, and the home schools provide daily assignments and assessments. See “Discipline for Special Education Student Procedures” or contact the Equity Assurance and Compliance Unit in the Department of Special Education Operations for more information.
The Model Learning Center at the Montgomery County Correctional Facility works with Alternative Programs to serve inmates under the age of 21 who need coursework to complete their high school diploma. Some student inmates are enrolled in Alternative Programs while others remain enrolled at their last school. Students receive part-time instruction in the courses needed for graduation. Students return to the last school attended when released.
CAPITAL PROJECTS
School Project Project Status*Date of Completion
Blair G. Ewing Center
Facility Improvements
Proposed TBD
Approved—Project has an FY 2013 or FY 2014 appropriation approved in the FY 2013 or FY 2014 Capital Budget.Programmed—Project has expenditures programmed in a future year of the CIP for planning and/or construction funds.Proposed—Project has facility planning funds approved for FY 2013 or FY 2014 for a feasibility study.
Programs Location Year Established Grades Program
EnrollmentLength of Stay
Level 2
Needwood Blair G. Ewing Center 2009 9-12 120 1-3 semesters
Phoenix Blair G. Ewing Center 1979 9–12 50 1–3 semesters
Glenmont MS Lynnbrook Center 1997 6–8 25 1–3 semesters
Hadley Farms 7401 Hadley Farms Dr. 2002 6–8 25 1–3 semesters
Level 3
Fleet Street Blair G. Ewing Center 2003 6–8 30 1–2 semesters
Randolph Academy Blair G. Ewing Center 1999 9–12 50 1–2 semesters
Approved Actions and Planning Issues • 4-141
OTHER EDUCATIONAL FACILITIES
Career Technology Education Programs Career and Technology Education (CTE) Programs of Study (POS) prepare students for lifelong learning. Montgomery County Public Schools (MCPS) currently offers over 40 POS organized within the following 11 career clusters:
• Arts, Humanities, Media, and Communications; • Biosciences, Health Science, and Medicine;• Business Management and Finance;• Construction and Development;• Education, Training, and Child Studies;• Engineering, Scientific Research, and Manufacturing
Technologies;• Environmental, Agricultural, and Natural Resources;• Human and Consumer Services, Hospitality, and Tourism;• Information Technology; • Law, Government, Public Safety, and Administration; and• Transportation, Distribution, and Logistics.
Over 22,000 MCPS students are enrolled in at least one CTE POS pathway course at high schools throughout the county or at Thomas Edison High School of Technology (TEHST).
CTE POS continue to focus on challenging, meaningful in-struction that provides academic and technical knowledge and skills and prepares students for college and careers. Most POS provide opportunities to earn college credit at selected postsecondary institutions. Students are taking and passing industry credentialing examinations in areas, such as business, information technology, hospitality, and cosmetology.
CTE POS may be housed at the home schools or at TEHST. TEHST gives students from all high schools equitable access to some POS. Students attend TEHST for half a day and spend the other half of the school day at their home high school. To ensure relevance to college and industry, CTE has established for each career cluster a Cluster Advisory Board (CAB) that includes representatives from the business community and postsecondary institutions. CABs strive to provide seamless experiences for students as they move from elementary and middle school to high school and postsecondary experiences.
Foundations Office Programs The Montgomery County Student Trades Foundations Office is composed of three separate non-profit educational foundations that support students in the Automotive, Construction, and Information Technology industries. The Foundations Office is a liaison between the business/professional community and MCPS. This relationship promotes the advancement of college and career education and prepares students for a full range of careers within each industry. In MCPS, there are currently 11 pathway programs supervised by the Foundations Office. Articulation agreements that allow students to earn college credit while still in high school have been established for all of the Foundation programs.
The Automotive Trades Foundation (ATF) operates as a licensed used-car dealership. ATF programs are located at Damascus, Gaithersburg, and Seneca Valley high schools and Thomas Edison High School of Technology (TEHST). The programs are nationally certified by the National Automotive Technicians Education Foundation (NATEF), an affiliation of Automotive Service of Excellence (ASE). The programs also are affiliated with Automotive Youth Education System (AYES), which is the highest level of achievement for automotive technology programs. Automotive instructors maintain industry standard certifications in ASE areas relevant to their programs.
The Construction Trades Foundation (CTF) operates as a licensed Residential Home Builder and supports a variety of construction industry trades that include the following: Car-pentry, Electricity, Masonry, Plumbing, HVAC, Principles of Architecture and CAD Technology, Interior Design and Foun-dations of Building and Construction Technology. The CTF programs are located at Blake High School and TEHST. The Foundation also has established a partnership with Associated Builders and Contractors, Metro Washington Chapter (ABC Metro). ABC Metro has certified the instructors, accredited the facility, and formalized articulation agreements. This pro-gram provides a nationally recognized apprenticeship from the National Center for Construction Education and Research (NCCER). The CTF also has aligned with the construction programs at Montgomery College, allowing students further opportunities for professional development and advancement in the construction industry.
The Montgomery County Students Information Technology Foundation (ITF) provides programs in Network Operations at Clarksburg High School, and TEHST. Each is a member of both the Computing Technology Industry Association’s (CompTIA) Education-To-Careers (E2C) program and the Microsoft Developer Network Academic Alliance (MSDN-AA). The ITFs unique public/private partnership promotes computer education and provides entrepreneurial experiences to high school students throughout Montgomery County. This program serves to prepare students for a seamless transition into the computer technology industry and college or other postsecondary education.
Thomas Edison High School of TechnologyPlanning Study: Wheaton High School and Thomas Edison High School of Technology (TEHST) are currently located on the same site and share one facility. These schools are sched-uled for modernization. During the past two years, two major planning studies were conducted to prepare for the moderniza-tion of these schools. During the fall and winter 2010–2011, a Roundtable Discussion, with broad stakeholder involvement, met to explore various approaches for the future relationship between the two schools. Following the Roundtable review, the Board of Education took action on March 28, 2011, to keep the two schools separate with distinct identities and

4-142 • Approved Actions and Planning Issues
CAPITAL PROJECTSSchool Project Project Status* Date of
Completion
Thomas Edison HS of Technology Modernization Programmed
Aug. 2017, Building Aug. 2018, Site
Approved—Project has an FY 2013 or FY 2014 appropriation approved in the FY 2013 or FY 2014 Capital Budget.Programmed—Project has expenditures programmed in a future year of the CIP for planning and/or construction funds.Proposed—Project has facility planning funds approved for FY 2013 or FY 2014 for a feasibility study.
directed staff to conduct a feasibility study to review two options—a one building option and a two building option. At the conclusion of the feasibility study, on September 13, 2011, the Board of Education adopted a two-building option for the modernizations of Wheaton High School and Thomas Edison High School of Technology.
Capital Project: An FY 2014 appropriation for planning funds is approved for construction funds to construct the replacement facilities for Wheaton High School and Thomas Edison High School of Technology. The completion dates for these schools are scheduled for August 2015 for the Wheaton High School facility, August 2017 for the Thomas Edison High School of Technology facility, and August 2018 for restoration of the site. In order for this project to be completed on the new schedule, county and state funding must be provided at levels approved in this CIP.
OTHER EDUCATIONAL FACILITIES

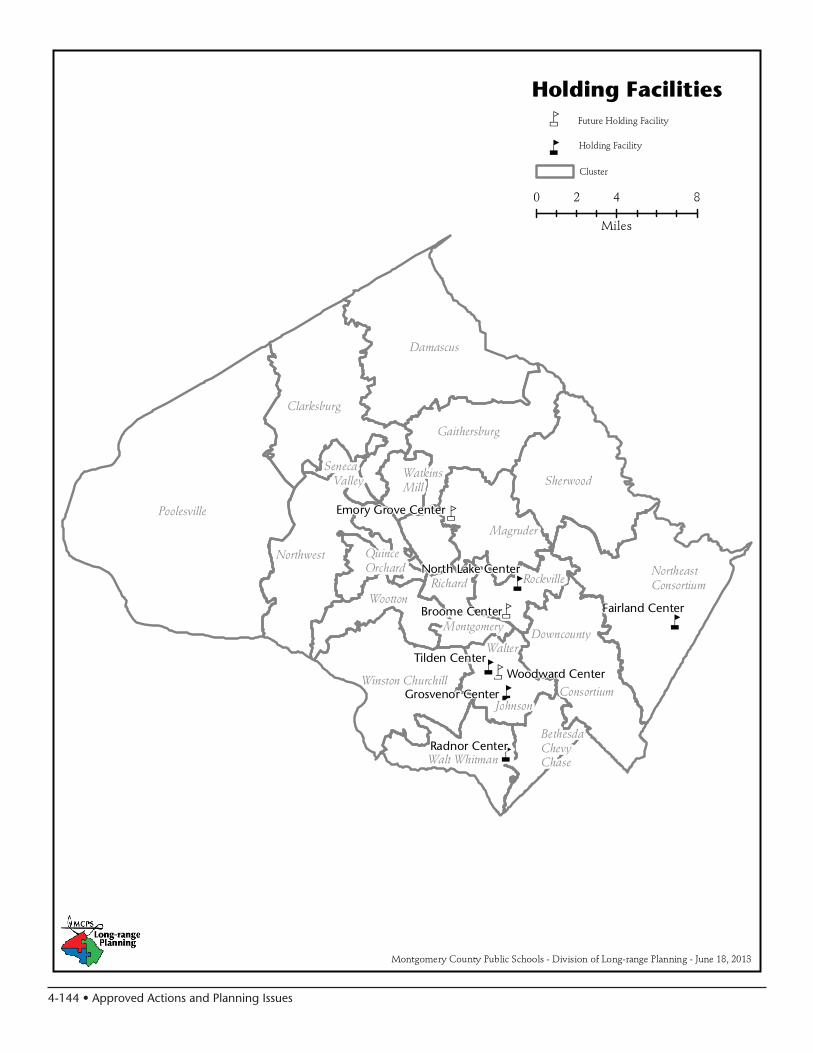
4-144 • Approved Actions and Planning Issues
nm
nmn
n
n
n
n
nm
Woodward Center
Broome Center
Emory Grove Center
Radnor Center
Grosvenor Center
North Lake Center
Tilden Center
Fairland Center
Montgomery County Public Schools - Division of Long-range Planning - June 18, 2013
Holding Facilities
Clarksburg
Poolesville
Damascus
Gaithersburg
WatkinsMill
Seneca Valley
Northwest QuinceOrchard
WoottonRichard
Montgomery
Rockville
Magruder
Sherwood
Downcounty
Consortium
NortheastConsortium
BethesdaChevyChase
Walter
Johnson
Walt Whitman
Winston Churchill
0 4 82
Miles
Cluster
nm Future Holding Facility
n Holding Facility

Approved Actions and Planning Issues • 4-145
OTHER EDUCATIONAL FACILITIES
Holding FacilitiesHolding facilities are utilized for capital projects, such as modernizations and large-scale addition projects to house students and staff during construction. By relocating students and staff to a holding facility, MCPS is able to reduce the length of time required for construction and provide a safe and secure environment for the students and staff. Currently, MCPS utilizes the following facilities as holding schools for modernizations and large-scale addition projects.
Elementary School Holding FacilitiesThe elementary school holding facilities were assessed as part of the Facilities Assessment with Criteria and Testing (FACT) process during the 2010–2011 school year. To address needs at these facilities, an FY 2013 appropriation for facility planning is approved in the Modifications to Holding, Special Educa-tion and Alternative Centers Project for feasibility studies to identify improvements for these buildings. A recommenda-tion for facility improvements will be made in a future CIP.
• Emory Grove• Fairland • Grosvenor• North Lake • Radnor
Emory Grove Holding FacilityIn the coming years, elementary schools upcounty will reach an age and condition that will require modernization. Cur-rently, all holding facilities for elementary schools undergoing modernization are located in the mid-to lower part of the county. A site selection was conducted in spring 2011 to iden-tify a site for an upcounty holding facility. The site selection process was completed in fall 2011. On January 10, 2012, the Board of Education selected the Emory Grove Center to be the fifth elementary school holding facility. Renovations will be made to this facility during the 2012–2013 school year so that the facility may be used as a holding facility beginning in August 2013.
Middle School Holding FacilityBroome Holding FacilityCapital Project: FY 2015 expenditures for planning funds are approved to reopen the Broome facility, currently owned by Montgomery County, for use as a middle school holding facility. This facility will require significant modifications to support a middle school program. In order for this project to be completed on schedule, county and state funding must be provided at the levels approved in this CIP.
Tilden Center MCPS has been unable to accelerate the pace of middle school modernizations because currently there is only one middle school holding facility. In addition, with the reopening of Northwood High School in 2004, there is no high school
holding facility, requiring high school modernizations to be constructed on site. In order to accelerate the pace of modern-izations, funding is approved in the Amended FY 2011–2016 CIP to replace the Tilden Holding Facility with the Woodward Holding Facility, which will serve as a secondary school hold-ing facility for middle and high schools.
Woodward Holding FacilityCapital Project: With the reopening of Northwood High School in 2004, there has been no high school holding facility. Tilden Middle School is currently located at the former Wood-ward High School facility, which is located on Old Georgetown Road. Tilden Middle School has a modernization scheduled for completion in August 2017. Although the school is currently located in the Woodward facility, the current Tilden Holding Facility, located on Tilden Lane, will be modernized to house Tilden Middle School. The Woodward facility will then become a secondary school holding facility for school modernizations scheduled after Tilden Middle School. Tilden Middle School will remain at the Woodward facility until the modernization of the Tilden Lane facility is complete in August 2017. FY 2017 expen-ditures are programmed in the CIP to design the renovations of the Woodward facility for use as a secondary holding facility.
CAPITAL PROJECTS
School Project Project Status*Date of Completion
Broome Holding Facility Renovations Programmed TBDWoodward Holding Facility Renovations Programmed TBD
Approved—Project has an FY 2013 or FY 2014 appropriation approved in the FY 2013 or FY 2014 Capital Budget.Programmed—Project has expenditures programmed in a future year of the CIP for planning and/or construction funds.Proposed—Project has facility planning funds approved for FY 2013 or FY 2014 for a feasibility study.
Community Montessori Charter SchoolOn July 25, 2011, the Board of Education approved the applica-tion for the first charter school in Montgomery County. The Community Montessori Charter School (CMSC) opened in August 2012 and serves prekindergarten students ages 3 and 4 years old. The school is located at 3015 Upton Drive in Kens-ington, Maryland. CMSC is not an MCPS facility and MCPS is not responsible for the capital investments in this facility. However, the students enrolled at the school are Montgomery County Public Schools students. Full implementation of the charter school plan will occur by the 2016–2017 school year with CMCS employing a Montessori educational model with three age groups in the same class. With full implementation, CMCS will serve prekindergarten and kindergarten children (ages 3 to 6) in classes together and Grades 1–3 (ages 6 to 9) together in other classes.
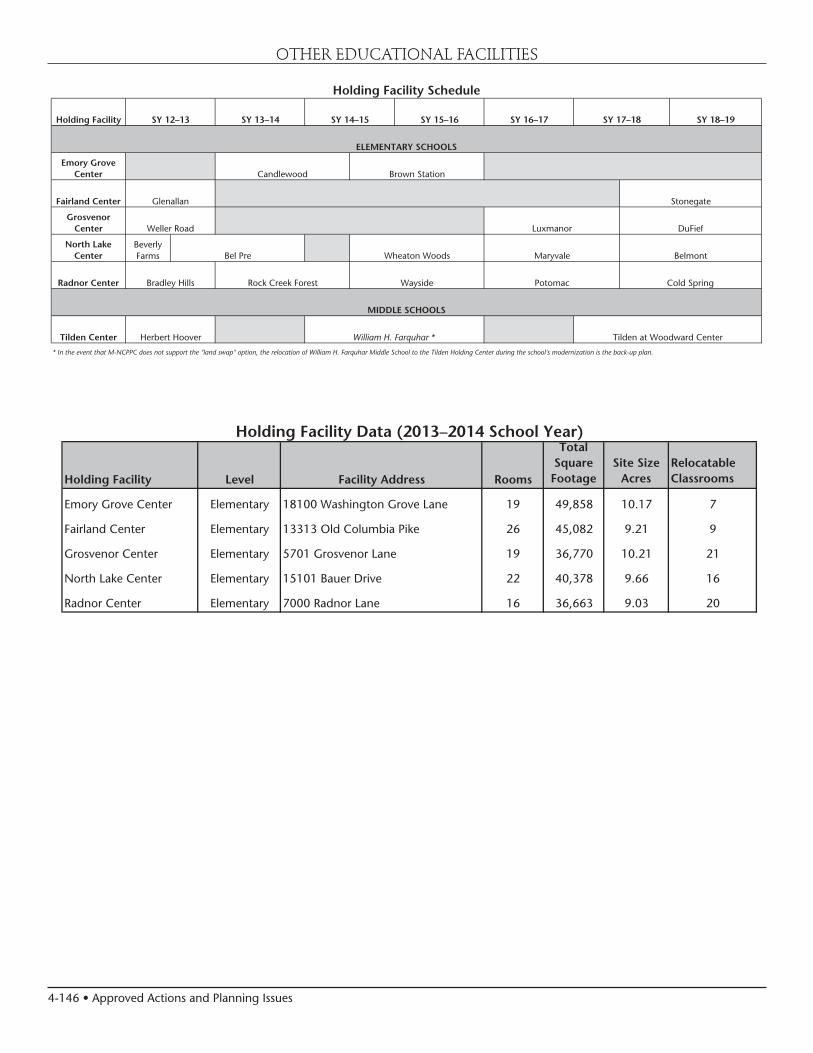
4-146 • Approved Actions and Planning Issues
OTHER EDUCATIONAL FACILITIES
Beverly Farms
* In the event that M-NCPPC does not support the "land swap" option, the relocation of William H. Farquhar Middle School to the Tilden Holding Center during the school's modernization is the back-up plan.
Stonegate
DuFief
Belmont
Cold Spring
Holding Facility SY 12–13 SY 13–14 SY 14–15 SY 15–16 SY 16–17 SY 17–18
Tilden Center William H. Farquhar *
Emory Grove Center
Grosvenor Center Luxmanor
Glenallan
Weller Road
Bradley Hills
Herbert Hoover Tilden at Woodward Center
Radnor Center Rock Creek Forest Wayside Potomac
MIDDLE SCHOOLS
Holding Facility Schedule
Fairland Center
Candlewood Brown Station
North Lake Center Bel Pre Wheaton Woods Maryvale
SY 18–19
ELEMENTARY SCHOOLS
Holding Facility Level Facility Address Rooms
Total Square Footage
Site Size Acres
Relocatable Classrooms
Emory Grove Center Elementary 18100 Washington Grove Lane 19 49,858 10.17 7
Fairland Center Elementary 13313 Old Columbia Pike 26 45,082 9.21 9
Grosvenor Center Elementary 5701 Grosvenor Lane 19 36,770 10.21 21
North Lake Center Elementary 15101 Bauer Drive 22 40,378 9.66 16
Radnor Center Elementary 7000 Radnor Lane 16 36,663 9.03 20
Holding Facility Data (2013–2014 School Year)
