reconfiguring the value bundle: product? service? information? dr. corinne alexander dr. christine...
Post on 19-Dec-2015
215 views
TRANSCRIPT

Reconfiguring The Value Bundle: Product? Service? Information?
Dr. Corinne AlexanderDr. Christine Wilson
Source: 2003 National Conference for Agribusiness, “Serving Commercial Producers: Meeting Needs, Adding Value” Center for Food and Agricultural Business

Building and Branding the Value Bundle
1. Understand the Value• Market segmentation based on survey
2. Choose the Value• Trends in market segments
3. Create the Value• Chip Donahue, Brandt Consolidated
4. Extract the Value5. Communicate the Value6. Deliver the Value
• Doug BowmanSource: 2003 National Conference for Agribusiness, “Serving Commercial Producers: Meeting Needs, Adding Value” Center for Food and Agricultural Business

Understand the Value Bundle
How do your customers choose their suppliers?
What do they want in terms of product, service, and information?
Source: 2003 National Conference for Agribusiness, “Serving Commercial Producers: Meeting Needs, Adding Value” Center for Food and Agricultural Business

Factors Influencing Buying Behavior
• When you choose a supplier, how is your decision influenced by the following factors?– Convenience/Location– Service/Information & Personal Factors– Price– Product Performance– Support Services
Source: 2003 National Conference for Agribusiness, “Serving Commercial Producers: Meeting Needs, Adding Value” Center for Food and Agricultural Business
Market Segmentation
• Identify buying behavior segments, or groups of customers, that react differently to marketing choices
• Use cluster analysis to allow buying behavior segments to be formed naturally: data-driven segmentation
Source: 2003 National Conference for Agribusiness, “Serving Commercial Producers: Meeting Needs, Adding Value” Center for Food and Agricultural Business

Buying Behavior Segments Crops & Livestock
35%
16%18%
14%
17%
Balance Performance PriceConvenience Service
Full SampleSource: 2003 National Conference for Agribusiness, “Serving Commercial Producers: Meeting Needs, Adding Value” Center for Food and Agricultural Business

There are 5 Buying Behavior Segments
Factor Balance Performance Price Convenience ServiceFull
Sample
Convenience/Location 18 6 9 57 13 19
Service/Info & Personal Factors 21 9 10 13 47 20
Price 25 26 62 19 17 29
Product Performance 20 51 13 8 13 21
Support Services 17 7 7 5 11 11
Percent of Sample 34.2 16.3 18.5 13.8 17.3 100Source: 2003 National Conference for Agribusiness, “Serving Commercial Producers: Meeting Needs, Adding Value”
Center for Food and Agricultural Business

Our 5 market segments refine the 3 traditional segments
1. Economic Buyer: 18.5%– Price segment
2. Business Buyer: 50.5%– Balance segment– Performance segment
3. Relationship Buyer: 31.1%– Convenience segment– Service segment
Source: 2003 National Conference for Agribusiness, “Serving Commercial Producers: Meeting Needs, Adding Value” Center for Food and Agricultural Business

How large are the operations in the segments?
Crops• Price has largest
operations• Balance and
Performance are in between
• Convenience has smallest operations followed by Service
Livestock• Performance has
largest operations• Balance, Price, are
in between • Convenience has
smallest operations
Source: 2003 National Conference for Agribusiness, “Serving Commercial Producers: Meeting Needs, Adding Value” Center for Food and Agricultural Business

During the next 5 years, which segments plan to grow the most?
Crops• Service and Price plan
the most growth at nearly 30%
• Convenience plans the least growth at 16%
• Corn/Soybean producers plan the most growth, 25-37%
Livestock• All segments plan to
grow about 25%• Hog producers plan the
least growth, -3 to +20%
Source: 2003 National Conference for Agribusiness, “Serving Commercial Producers: Meeting Needs, Adding Value” Center for Food and Agricultural Business

Who is the youngest/oldest in 2003?
Crops• Service and Price are
the youngest• Performance and
Balance are middle-aged producers
• Convenience is significantly older producers
Livestock• No significant age
differences• Overall, Convenience
and Service are older
Source: 2003 National Conference for Agribusiness, “Serving Commercial Producers: Meeting Needs, Adding Value” Center for Food and Agricultural Business

Value Bundle Preferences Crops vs. Livestock
Source: 2003 National Conference for Agribusiness, “Serving Commercial Producers: Meeting Needs, Adding Value” Center for Food and Agricultural Business

Buying Behavior Segments
Crops Livestock
16%
16%
15%
34%
19%
Source: 2003 National Conference for Agribusiness, “Serving Commercial Producers: Meeting Needs, Adding Value” Center for Food and Agricultural Business

Overview of Segments by 5 Primary Factors
• Crops and Livestock– Each segment dominated by a single factor except
Balance which focuses on all 5 factors– Price is the 1st or 2nd most important factor for all
segments
• Crops– Support Services is the least important factor
• Livestock– Convenience and Support Services are the least
significant factors overall
Source: 2003 National Conference for Agribusiness, “Serving Commercial Producers: Meeting Needs, Adding Value” Center for Food and Agricultural Business

The Value Bundle: Product
• For crops and livestock, Service had the highest brand loyalty while Price had the lowest
• All segments somewhat agree generics offer good trade-off between price and quality– Price agrees most, Service agrees least
• Price strongly agree that they will increase use of generic products over next 5 years, Service disagrees– Balance, Performance, and Convenience will see slight
increases
Source: 2003 National Conference for Agribusiness, “Serving Commercial Producers: Meeting Needs, Adding Value” Center for Food and Agricultural Business

The Value Bundle: Product
• Performance has fastest adoption of new products, services, and techniques; Convenience is the slowest
• All segments believe there are quality differences between brands – Livestock slightly less so than crops
• All segments believe that products and related information should be sold and priced as a single bundle
Source: 2003 National Conference for Agribusiness, “Serving Commercial Producers: Meeting Needs, Adding Value” Center for Food and Agricultural Business

The Value Bundle: Service
Desirable Salesperson Characteristics• For crops and livestock, 3 primary characteristics:
– Is honest– Has a high level of technical competence– Provides good follow-up service
• Price wants a salesperson who brings the lowest price
• Service wants to be called on frequently• Convenience wants a good communicator • Livestock Service segment wants a consultant
Source: 2003 National Conference for Agribusiness, “Serving Commercial Producers: Meeting Needs, Adding Value” Center for Food and Agricultural Business

The Value Bundle: Service
Supplier Loyalty• Convenience is most likely to buy expendable
items from one supplier; Performance and Price are least loyal– Livestock is slightly less loyal
• Convenience and Service are most willing to pay more to buy inputs from locally-owned suppliers; Price is least likely
Source: 2003 National Conference for Agribusiness, “Serving Commercial Producers: Meeting Needs, Adding Value” Center for Food and Agricultural Business

The Value Bundle: Service
• Custom Services– Price is least likely to use– In crops, Convenience has high use of custom
service; Performance has low use– In livestock, Performance and Balance have
high use; Convenience has low use
Source: 2003 National Conference for Agribusiness, “Serving Commercial Producers: Meeting Needs, Adding Value” Center for Food and Agricultural Business

The Value Bundle: Information
Computer & Internet Usage• Performance highest computer use, Convenience
and Service lowest use– Livestock use is higher than crops
• Three primary uses of the Internet are:– Obtain product/technical information– Obtain price information on inputs– Locate sources of products or dealers
Source: 2003 National Conference for Agribusiness, “Serving Commercial Producers: Meeting Needs, Adding Value” Center for Food and Agricultural Business

The Value Bundle: Information
Computer & Internet Usage• Performance, Price most likely to have
ordered an ag input on the Internet
Source: 2003 National Conference for Agribusiness, “Serving Commercial Producers: Meeting Needs, Adding Value” Center for Food and Agricultural Business

The Value Bundle: Information
Information Sources• Local dealer sales/technical people provide the
most useful information for crops and livestock– Manufacturer salespeople and other farmers also provide
a high level of useful information
• Livestock segments rate veterinarians as their second most useful source of information
Source: 2003 National Conference for Agribusiness, “Serving Commercial Producers: Meeting Needs, Adding Value” Center for Food and Agricultural Business

Understand the Value
Pricing the Value Bundle
Source: 2003 National Conference for Agribusiness, “Serving Commercial Producers: Meeting Needs, Adding Value” Center for Food and Agricultural Business

Pricing the Value Bundle: Service & Information
• Price wants service and information priced separately from product– Looking for the lowest product price
Price Value Bundle: Product only
Source: 2003 National Conference for Agribusiness, “Serving Commercial Producers: Meeting Needs, Adding Value” Center for Food and Agricultural Business

Pricing the Value Bundle: Service & Information
• Service and Convenience willing to pay more for products from local dealers who provide good service and information– Most loyal group
Service/Convenience Value Bundle:Service & Information, then Product
Source: 2003 National Conference for Agribusiness, “Serving Commercial Producers: Meeting Needs, Adding Value” Center for Food and Agricultural Business

Pricing the Value Bundle: Service & Information
• Performance and Balance are the most information intensive– High use of internet for information and
purchasing– Technical competence matters!– Product quality/brands matter
Balance/Performance Value Bundle:Product & Information, then Service
Source: 2003 National Conference for Agribusiness, “Serving Commercial Producers: Meeting Needs, Adding Value” Center for Food and Agricultural Business

Choose the Value Bundle
What is your future value bundle?
Source: 2003 National Conference for Agribusiness, “Serving Commercial Producers: Meeting Needs, Adding Value” Center for Food and Agricultural Business

Compared to 1998, which segments are growing/shrinking?
Crops• Balance is the largest
segment and stable at 35%
• Price grew substantially• Performance grew
modestly• Service is growing• Convenience is the
smallest segment and is shrinking
Livestock• Balance is the largest
segment at 35%, slight decline
• Price is stable• Performance grew
substantially • Service is growing• Convenience is the
smallest segment and is shrinking
Source: 2003 National Conference for Agribusiness, “Serving Commercial Producers: Meeting Needs, Adding Value” Center for Food and Agricultural Business

Expect Balance Segment to Remain Stable
• Largest segment for crops and livestock• Relatively stable compared to 1998• Average farm size compared to other
segments• Crops and livestock expect to grow ~25%• Primarily middle-aged producers
Source: 2003 National Conference for Agribusiness, “Serving Commercial Producers: Meeting Needs, Adding Value” Center for Food and Agricultural Business

Expect the Price Segment to Increase or Remain Stable
• Since 1998, increased substantially for crop and remained stable for livestock
• Largest farm size for crops, average or above for livestock
• Highest expected growth of all segments • High percentage of young producers
Source: 2003 National Conference for Agribusiness, “Serving Commercial Producers: Meeting Needs, Adding Value” Center for Food and Agricultural Business

Expect the Performance Segment to Increase
• Since 1998, increased substantially for livestock and modestly for crops
• Largest livestock operations, above average crop operations
• Crops and livestock expect to grow ~25%• Primarily young and middle-aged producers
Source: 2003 National Conference for Agribusiness, “Serving Commercial Producers: Meeting Needs, Adding Value” Center for Food and Agricultural Business

Expect the Service Segmentto Increase
• Increased from 1998 for crops and livestock• Average-sized or slightly below farm
operations• Very high expected growth rate for crops
and average expected growth rate for livestock
• Crop producers are very young, livestock producers are slightly above average
Source: 2003 National Conference for Agribusiness, “Serving Commercial Producers: Meeting Needs, Adding Value” Center for Food and Agricultural Business

Expect the Convenience Segment to Decrease Rapidly
• Smallest segment for crops and livestock• Decreased from 1998 for crops and
livestock• Smallest farms• Lowest overall growth rate, especially for
crops• Oldest producers
Source: 2003 National Conference for Agribusiness, “Serving Commercial Producers: Meeting Needs, Adding Value” Center for Food and Agricultural Business

Overview of Expectations
We expect that the:
• Balance (35%) segment will remain stable• Price (18%) segment will increase or remain
stable• Service (17%) segment will increase• Performance (16%) segment will increase• Convenience (14%) segment will decrease
Source: 2003 National Conference for Agribusiness, “Serving Commercial Producers: Meeting Needs, Adding Value” Center for Food and Agricultural Business

Appendix: Supporting Data
Please feel free to contact us with questions:
[email protected], [email protected]
Source: 2003 National Conference for Agribusiness, “Serving Commercial Producers: Meeting Needs, Adding Value” Center for Food and Agricultural Business

Crop Segments by 5 Primary Factors
0
10
20
30
40
50
60
70
Balance Performance Price Convenience ServiceConvenience/Location Service/Info & PersonalPrice Product PerformanceSupport Services
Source: 2003 National Conference for Agribusiness, “Serving Commercial Producers: Meeting Needs, Adding Value” Center for Food and Agricultural Business
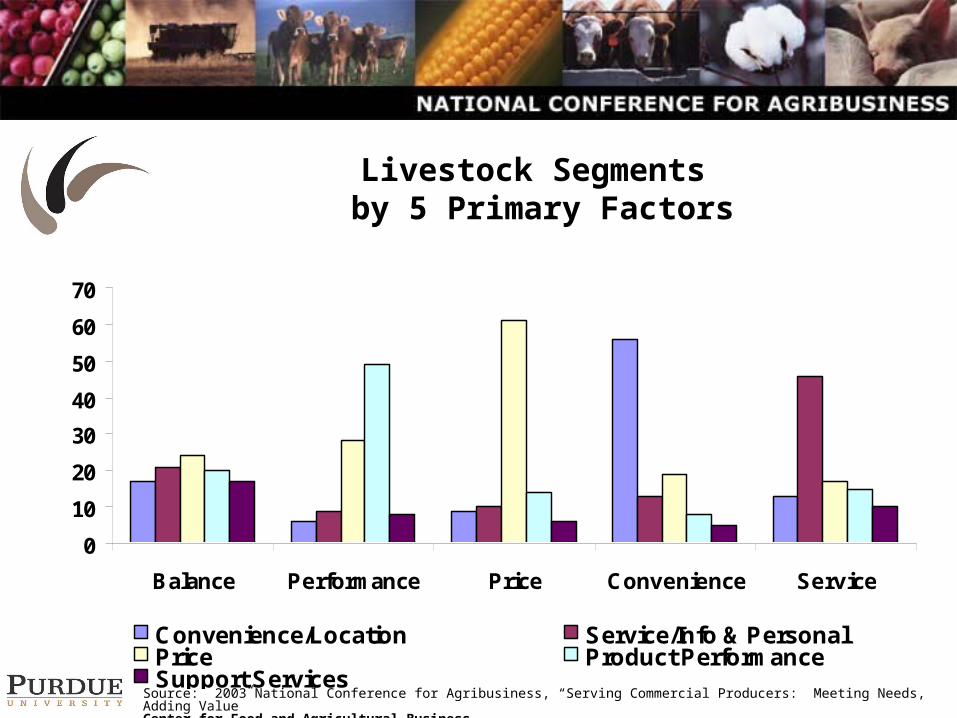
Livestock Segments by 5 Primary Factors
0
10
20
30
40
50
60
70
Balance Performance Price Convenience Service
Convenience/Location Service/Info & PersonalPrice Product PerformanceSupport Services
Source: 2003 National Conference for Agribusiness, “Serving Commercial Producers: Meeting Needs, Adding Value” Center for Food and Agricultural Business

Size of Crop Operations by Segments
0
10
20
30
40
Mid-Size Farms Commercial Farms Extra-Large Farms
Balance Performance Price Convenience ServiceSource: 2003 National Conference for Agribusiness, “Serving Commercial Producers: Meeting Needs, Adding Value” Center for Food and Agricultural Business

Size of Livestock Operationsby Segments
05
10152025303540
Mid-Size Farms Commercial Farms Extra-Large Farms
Balance Performance Price Convenience ServiceSource: 2003 National Conference for Agribusiness, “Serving Commercial Producers: Meeting Needs, Adding Value” Center for Food and Agricultural Business
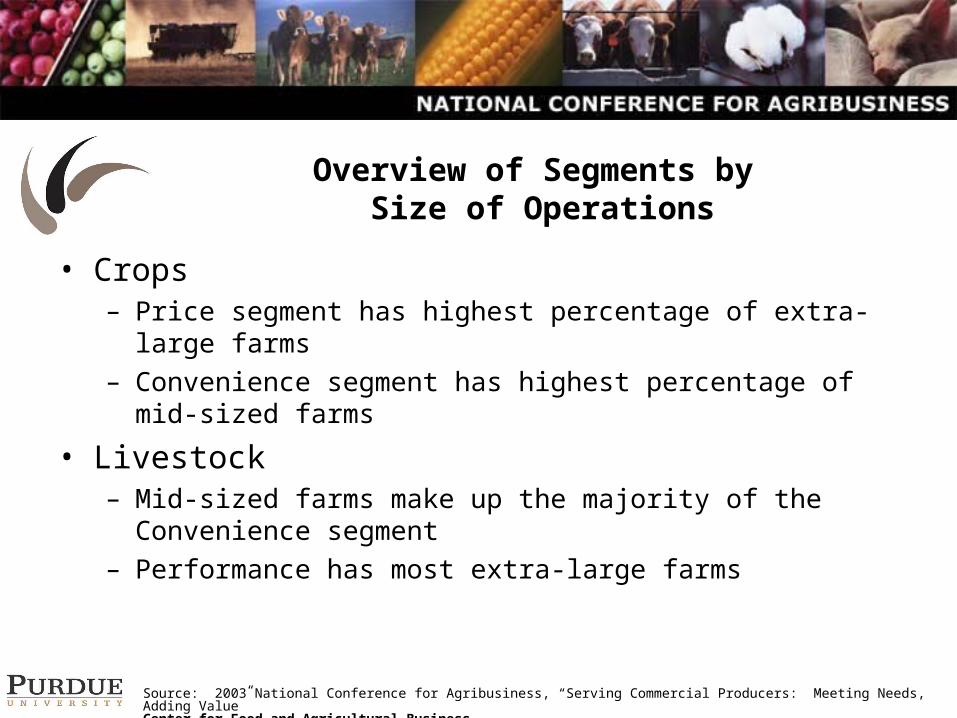
Overview of Segments by Size of Operations
• Crops– Price segment has highest percentage of extra-large
farms– Convenience segment has highest percentage of mid-
sized farms
• Livestock– Mid-sized farms make up the majority of the Convenience
segment– Performance has most extra-large farms
Source: 2003 National Conference for Agribusiness, “Serving Commercial Producers: Meeting Needs, Adding Value” Center for Food and Agricultural Business

Crop Segments by Age
0
5
10
15
20
25
30
35
40
Balance Performance Price Convenience Service
Age < 35 Age 35 to 44 Age 45 to 54Age 55 to 64 Age > 64
Source: 2003 National Conference for Agribusiness, “Serving Commercial Producers: Meeting Needs, Adding Value” Center for Food and Agricultural Business

Livestock Segments by Age
0
10
20
30
40
Balance Performance Price Convenience Service
Age < 35 Age 35 to 44 Age 45 to 54Age 55 to 64 Age > 64
Source: 2003 National Conference for Agribusiness, “Serving Commercial Producers: Meeting Needs, Adding Value” Center for Food and Agricultural Business

Crop Segments by Age
0
5
10
15
20
25
30
35
40
Age < 35 Age 35 to 44 Age 45 to 54 Age 55 to 64 Age > 64
Balance Performance Price Convenience ServiceSource: 2003 National Conference for Agribusiness, “Serving Commercial Producers: Meeting Needs, Adding Value” Center for Food and Agricultural Business

Livestock Segments by Age
0
10
20
30
40
Age < 35 Age 35 to 44 Age 45 to 54 Age 55 to 64 Age > 64
Balance Performance Price Convenience ServiceSource: 2003 National Conference for Agribusiness, “Serving Commercial Producers: Meeting Needs, Adding Value” Center for Food and Agricultural Business

Overview of Segments by Age
• Crops– Age 45-54 dominate all segments except convenience– Convenience has the highest percentage of producers in
the 55 to 64 and the 65+ age ranges– Service has the highest percentage of young producers
that are 35 or younger
• Livestock– All segments are dominated by farmers who are 45-54– Convenience has the lowest percentage of middle-aged
producers (35-54), but the highest percentage of young producers (<35) and older producers (55+)
Source: 2003 National Conference for Agribusiness, “Serving Commercial Producers: Meeting Needs, Adding Value” Center for Food and Agricultural Business

Crop Segments by Education
0
10
20
30
40
50
Balance Performance Price Convenience Service
College GraduateSource: 2003 National Conference for Agribusiness, “Serving Commercial Producers: Meeting Needs, Adding Value” Center for Food and Agricultural Business

Overview of Segments by Education
• Crops– Approximately 45% of producers in the Balance,
Performance, and Price segments have a college degree– Service has the lowest percentage of college
graduates at 34%
• Livestock– Overall, a slightly smaller percentage of livestock
producers have a college degree than crop producers– Price and Performance have the highest percentages of
producers having a college degree at over 40%– Only 29% of producers in the Service segment have a
college degree
Source: 2003 National Conference for Agribusiness, “Serving Commercial Producers: Meeting Needs, Adding Value” Center for Food and Agricultural Business

Expected 5 Year Growth by Segments
05
101520253035
Balance Performance Price Convenience Service
% E
xpec
ted
Gro
wth
Crops LivestockSource: 2003 National Conference for Agribusiness, “Serving Commercial Producers: Meeting Needs, Adding Value” Center for Food and Agricultural Business

Overview of Segments by Expected 5 Year Growth
• Crops– Service and Price expect the most growth at near 30%– Convenience producers expect the least growth at 16%– Corn producers expect to grow an average of 30%– Overall, cotton and wheat/barley/canola producers expect
lower growth
• Livestock– All segments expect to grow approximately 25%– Overall, dairy and beef cattle expect to grow
approximately 30%– Swine expects the least overall growth
Source: 2003 National Conference for Agribusiness, “Serving Commercial Producers: Meeting Needs, Adding Value” Center for Food and Agricultural Business

Livestock Segments by Education
0
10
20
30
40
50
Balance Performance Price Convenience Service
College GraduateSource: 2003 National Conference for Agribusiness, “Serving Commercial Producers: Meeting Needs, Adding Value” Center for Food and Agricultural Business

Primary Crop Enterprisesby Segments
05
1015202530354045
Corn / Soybeans Wheat/ Barley/ Canola Cotton
Balance Performance PriceConvenience Service
Source: 2003 National Conference for Agribusiness, “Serving Commercial Producers: Meeting Needs, Adding Value” Center for Food and Agricultural Business

Primary Livestock Enterprisesby Segments
0
5
10
15
20
2530
35
40
45
50
Dairy Swine Beef Cattle
Balance Performance PriceConvenience Service
Source: 2003 National Conference for Agribusiness, “Serving Commercial Producers: Meeting Needs, Adding Value” Center for Food and Agricultural Business

Overview of Segments by Primary Enterprise
• Crops– Corn/Soybeans is strongest in the Performance Segment– Cotton is strongest in the Price segment– Wheat/Barley/Canola and Cotton are significant in the
Convenience segment
• Livestock– Dairy is strongest in the Service Segment and weakest in
the Convenience segment– Beef Cattle are strongest in the Convenience segment
Source: 2003 National Conference for Agribusiness, “Serving Commercial Producers: Meeting Needs, Adding Value” Center for Food and Agricultural Business

Crop Segments by Expected 5 Year Growth
05
10152025303540
Balance Performance Price Convenience Service
% E
xpec
ted
Gro
wth
Corn/Soybeans Wheat/Barley/Canola CottonSource: 2003 National Conference for Agribusiness, “Serving Commercial Producers: Meeting Needs, Adding Value” Center for Food and Agricultural Business

Livestock Segments byExpected 5 Year Growth
-10
0
10
20
30
40
50
Balance Performance Price Convenience Service
% E
xpec
ted
Gro
wth
Dairy Swine Beef CattleSource: 2003 National Conference for Agribusiness, “Serving Commercial Producers: Meeting Needs, Adding Value” Center for Food and Agricultural Business
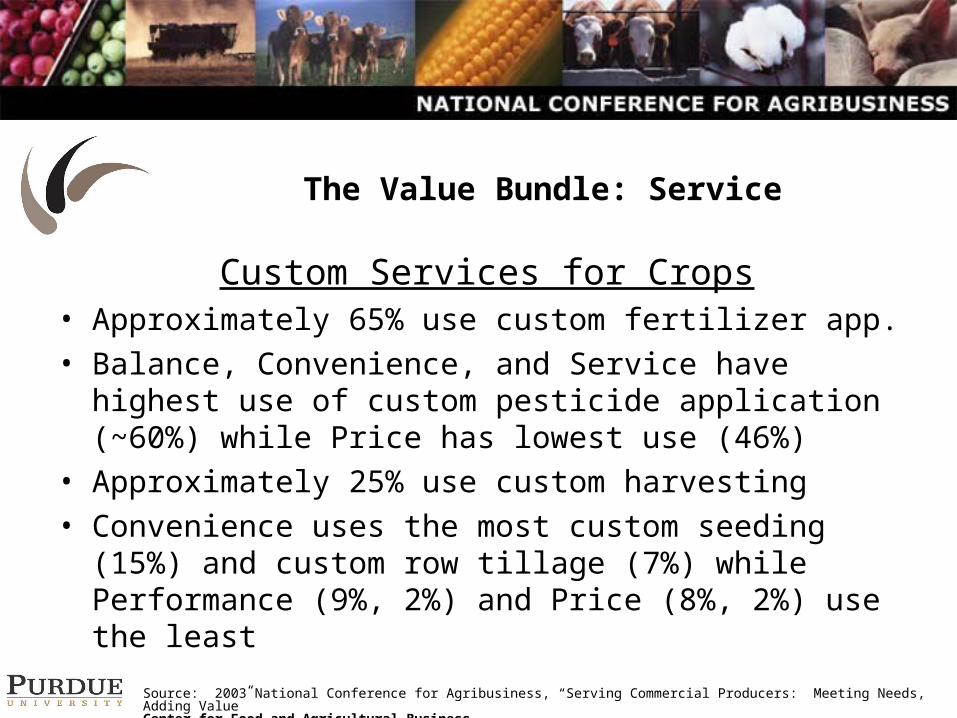
The Value Bundle: Service
Custom Services for Crops• Approximately 65% use custom fertilizer app.• Balance, Convenience, and Service have highest
use of custom pesticide application (~60%) while Price has lowest use (46%)
• Approximately 25% use custom harvesting• Convenience uses the most custom seeding (15%)
and custom row tillage (7%) while Performance (9%, 2%) and Price (8%, 2%) use the least
Source: 2003 National Conference for Agribusiness, “Serving Commercial Producers: Meeting Needs, Adding Value” Center for Food and Agricultural Business

The Value Bundle: Product – CropsStatement Balance Performance Price Convenience Service
I am loyal to brands of expendable items
3.2 3.1 2.9 3.3 3.4
Generics offer a good trade-off between price and quality
3.1 3.2 3.4 3.3 3
Will increase use of generic items over next 5 years
3.2 3.3 3.5 3.3 3
For expendable items, most brands are more or less the same
2.6 2.5 2.7 2.8 2.7
I think suppliers should charge separately for products and information
2.2 2.3 2.3 2.1 2.2
*Average responses on Likert Scale of 1-5
Source: 2003 National Conference for Agribusiness, “Serving Commercial Producers: Meeting Needs, Adding Value” Center for Food and Agricultural Business

The Value Bundle: Product - Livestock
Statement Balance Performance Price Convenience Service
I am loyal to brands of expendable items
3.2 2.9 2.8 3.2 3.3
Generics offer a good trade-off between price and quality
3.1 3.1 3.3 3.2 3
Will increase use of generic items over next 5 years
3.2 3 3.3 3.2 3.1
For expendable items, most brands are more or less the same
2.7 2.7 2.7 2.9 2.8
I think suppliers should charge separately for products and information
2.4 2.2 2.3 2.4 2.4
*Average responses on Likert Scale of 1-5
Source: 2003 National Conference for Agribusiness, “Serving Commercial Producers: Meeting Needs, Adding Value” Center for Food and Agricultural Business

The Value Bundle: Service
Custom Services for Livestock• Performance and Balance have the highest
use of custom livestock waste handling (~35%) versus only 23% of Convenience
• 17-21% use custom livestock finishing• Performance has the highest percentage of
custom raised breeding stock replacements (28%) while Price and Convenience have lowest (19% and 15%)
Source: 2003 National Conference for Agribusiness, “Serving Commercial Producers: Meeting Needs, Adding Value” Center for Food and Agricultural Business

The Value Bundle: ServiceCustom Services for Crops
01020304050607080
FertilizerApplication
PesticideApplication
Seeding Harvesting Row CropTillage
Balance Performance Price Convenience ServiceSource: 2003 National Conference for Agribusiness, “Serving Commercial Producers: Meeting Needs, Adding Value” Center for Food and Agricultural Business

The Value Bundle: ServiceCustom Services for Livestock
05
10152025303540
Livestock Waste Handling Livestock Finishing Raising Breeding StockReplacements
Balance Performance Price Convenience ServiceSource: 2003 National Conference for Agribusiness, “Serving Commercial Producers: Meeting Needs, Adding Value” Center for Food and Agricultural Business

The Value Bundle: Service - CropsDesirable Salesperson Characteristics
Characteristic Balance Performance Price Convenience Service
Is honest 62 66 58 56 58
Has a high level of technical competence
50 52 44 48 48
Provides good follow-up service
33 30 30 41 34
Brings me the best price 24 21 36 20 17
Is a good communicator 11 7 7 14 8
Is a consultant to my operation
9 14 6 10 10
Calls on me frequently 7 4 8 5 13
Source: 2003 National Conference for Agribusiness, “Serving Commercial Producers: Meeting Needs, Adding Value” Center for Food and Agricultural Business

The Value Bundle: Service - LivestockDesirable Salesperson Characteristics
Characteristic Balance Performance Price Convenience Service
Is honest 60 61 57 64 54
Has a high level of technical competence
51 53 47 40 45
Provides good follow-up service
40 34 28 32 39
Brings me the best price 25 22 36 17 16
Is a good communicator 10 10 13 20 11
Is a consultant to my operation
8 12 5 13 18
Calls on me frequently 6 3 5 9 9
Source: 2003 National Conference for Agribusiness, “Serving Commercial Producers: Meeting Needs, Adding Value” Center for Food and Agricultural Business

The Value Bundle: InformationOutside Influences - Crops
0%
20%
40%
60%
80%
100%
Balance Performance Price Convenience Service
Independent, Paid Consultants Local dealer/ dealer personnelManufacturer sales/ tech rep Other
Source: 2003 National Conference for Agribusiness, “Serving Commercial Producers: Meeting Needs, Adding Value” Center for Food and Agricultural Business

The Value Bundle: InformationOutside Influences - Livestock
0%
20%
40%
60%
80%
100%
Balance Performance Price Convenience Service
Independent, Paid Consultants Local dealer/ dealer personnel
Manufacturer sales/ tech rep Other
Source: 2003 National Conference for Agribusiness, “Serving Commercial Producers: Meeting Needs, Adding Value” Center for Food and Agricultural Business

The Value Bundle: InformationOutside Influences - Crops
0
10
20
30
40
50
Balance Performance Price Convenience Service
Independent, Paid Consultants Local dealer/ dealer personnelManufacturer sales/ tech rep Other
Source: 2003 National Conference for Agribusiness, “Serving Commercial Producers: Meeting Needs, Adding Value” Center for Food and Agricultural Business

The Value Bundle: InformationOutside Influences - Livestock
05
1015202530354045
Balance Performance Price Convenience Service
Independent, Paid Consultants Local dealer/ dealer personnel
Manufacturer sales/ tech rep Other
Source: 2003 National Conference for Agribusiness, “Serving Commercial Producers: Meeting Needs, Adding Value” Center for Food and Agricultural Business

The Value Bundle: Information
Communications Media• The best sources of information for all segments
were general farm publications and crop/livestock specific publications– Agricultural newspapers and agricultural newsletters
provides some good information
• All segments responded negatively towards telephone contacts and agricultural TV programs– Agricultural websites and agricultural radio programs
were also identified as providing little useful information
Source: 2003 National Conference for Agribusiness, “Serving Commercial Producers: Meeting Needs, Adding Value” Center for Food and Agricultural Business

The Value Bundle: Information
Computer Usage• Performance has the highest use of the computer
for communications while Convenience and Service have the lowest use– Livestock use is higher than that of crops
• Performance and Balance use the computer for information gathering while the Convenience segment uses it significantly less for this purpose– Livestock use is higher than that of crops
Source: 2003 National Conference for Agribusiness, “Serving Commercial Producers: Meeting Needs, Adding Value” Center for Food and Agricultural Business

The Value Bundle: Information
Internet Usage• Approximately 75% of the Balance, Performance,
and Price segments use Mr. Gore’s Internet while only about 65% of the Convenience segment does
• Three primary uses of the Internet are:– Obtain product/technical information– Obtain price information on inputs– Locate sources of products or dealers
• Performance and Price are most likely to have ordered an agricultural input over the Internet
Source: 2003 National Conference for Agribusiness, “Serving Commercial Producers: Meeting Needs, Adding Value” Center for Food and Agricultural Business

The Value Bundle: InformationInternet Use - Crops
Practice Balance Performance Price Convenience Service
Use the Internet in my farm business
75 74 72 63 70
Obtained product / technical information
64 67 58 50 56
Obtained price information on inputs
47 54 46 38 43
Located sources of products or dealers
54 57 42 43 38
Placed an order for agricultural inputs
14 22 18 11 10
Source: 2003 National Conference for Agribusiness, “Serving Commercial Producers: Meeting Needs, Adding Value” Center for Food and Agricultural Business

The Value Bundle: InformationInternet Use - Livestock
Practice Balance Performance Price Convenience Service
Use the Internet in my farm business
71 77 78 65 70
Obtained product / technical information
57 65 66 52 59
Obtained price information on inputs
41 49 51 34 47
Located sources of products or dealers
51 59 56 39 53
Placed an order for agricultural inputs
14 17 19 9 16
Source: 2003 National Conference for Agribusiness, “Serving Commercial Producers: Meeting Needs, Adding Value” Center for Food and Agricultural Business