record-breaking fourth quarter sales and ebita as …
TRANSCRIPT
RECORD-BREAKING FOURTH QUARTER SALES AND EBITA AS MARKET CONDITIONS RETURN TO NORMAL
Q4 2018
Bygghemma Group First AB (publ) 1
Today’s presentersQ4 2018
Bygghemma Group First AB (publ) 2
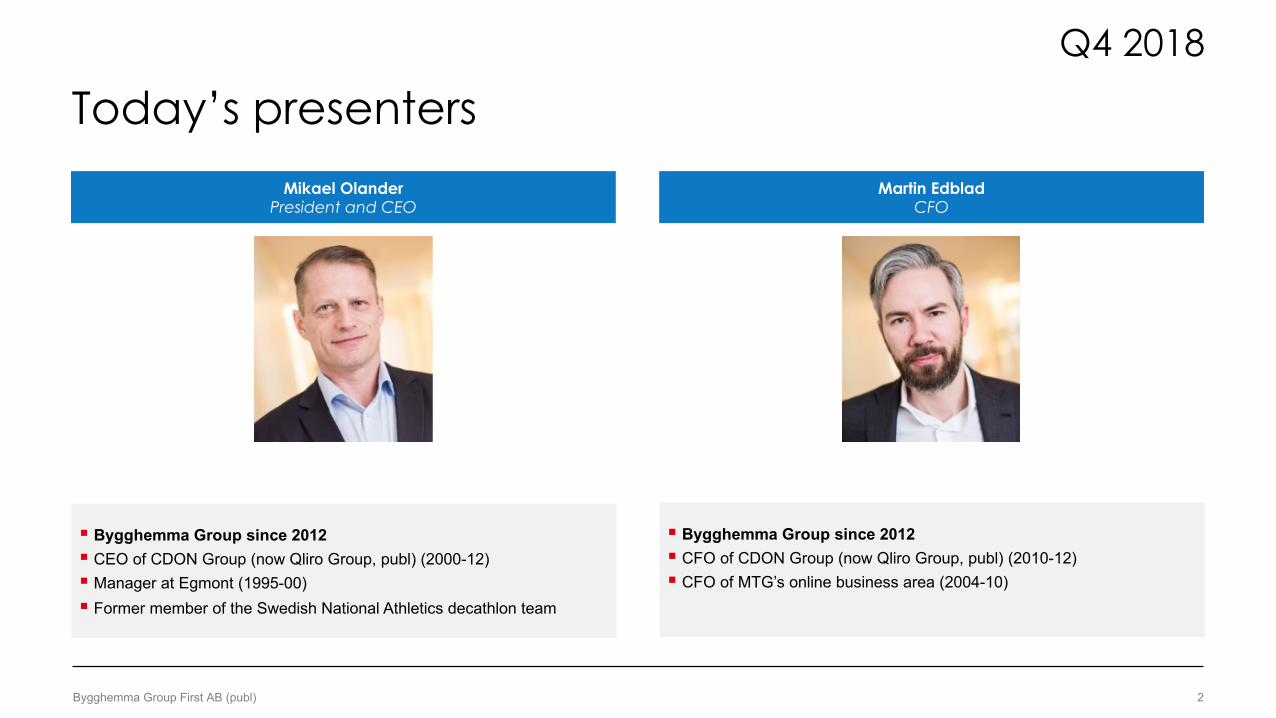
§ Bygghemma Group since 2012§ CEO of CDON Group (now Qliro Group, publ) (2000-12)§ Manager at Egmont (1995-00)§ Former member of the Swedish National Athletics decathlon team
Mikael OlanderPresident and CEO
§ Bygghemma Group since 2012§ CFO of CDON Group (now Qliro Group, publ) (2010-12)§ CFO of MTG’s online business area (2004-10)
Martin EdbladCFO
§ Results highlights
§ Business update
§ Financial update Q4 2018‒ Group ‒ DIY segment ‒ Home furnishing segment‒ Cash flow and financial position
§ Summary
§ Q&A
AgendaQ4 2018
Bygghemma Group First AB (publ) 3

§ Results highlights
§ Business update
§ Financial update Q4 2018‒ Group ‒ DIY segment ‒ Home furnishing segment‒ Cash flow and financial position
§ Summary
§ Q&A
Agenda
Bygghemma Group First AB (publ) 4
Q4 2018
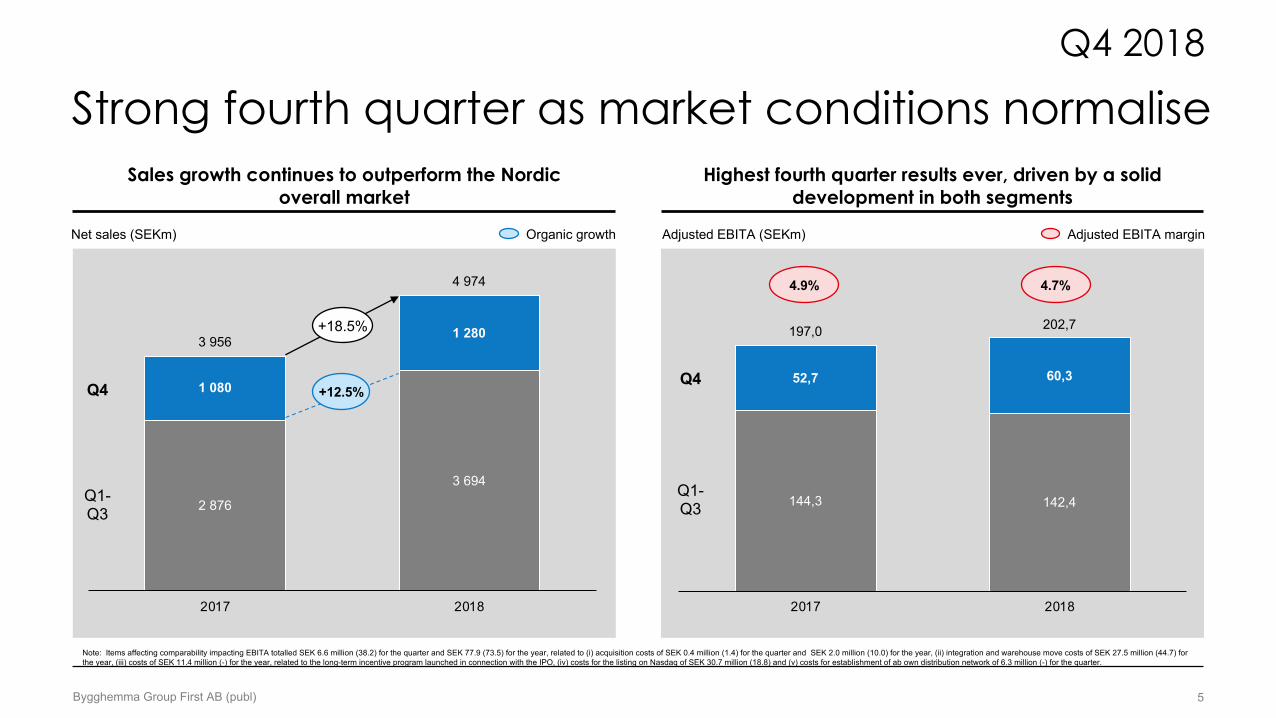
Strong fourth quarter as market conditions normaliseQ4 2018
Bygghemma Group First AB (publ) 5
Sales growth continues to outperform the Nordic overall market
Highest fourth quarter results ever, driven by a solid development in both segments
Note: Items affecting comparability impacting EBITA totalled SEK 6.6 million (38.2) for the quarter and SEK 77.9 (73.5) for the year, related to (i) acquisition costs of SEK 0.4 million (1.4) for the quarter and SEK 2.0 million (10.0) for the year, (ii) integration and warehouse move costs of SEK 27.5 million (44.7) for the year, (iii) costs of SEK 11.4 million (-) for the year, related to the long-term incentive program launched in connection with the IPO, (iv) costs for the listing on Nasdaq of SEK 30.7 million (18.8) and (v) costs for establishment of ab own distribution network of 6.3 million (-) for the quarter.
Net sales (SEKm) Adjusted EBITA (SEKm)Organic growth Adjusted EBITA margin
2 876
3 694
1 080
1 280 3 956
4 974
2017 2018
Q4
Q1-Q3
+18.5%
+12.5%
144,3 142,4
52,7 60,3
197,0 202,7
2017 2018
4.9% 4.7%
Q4
Q1-Q3
§ Results highlights
§ Business update
§ Financial update Q4 2018‒ Group ‒ DIY segment ‒ Home furnishing segment‒ Cash flow and financial position
§ Summary
§ Q&A
AgendaQ4 2018
Bygghemma Group First AB (publ) 6
Bygghemma Group at a glanceQ4 2018
Bygghemma Group First AB (publ) 7
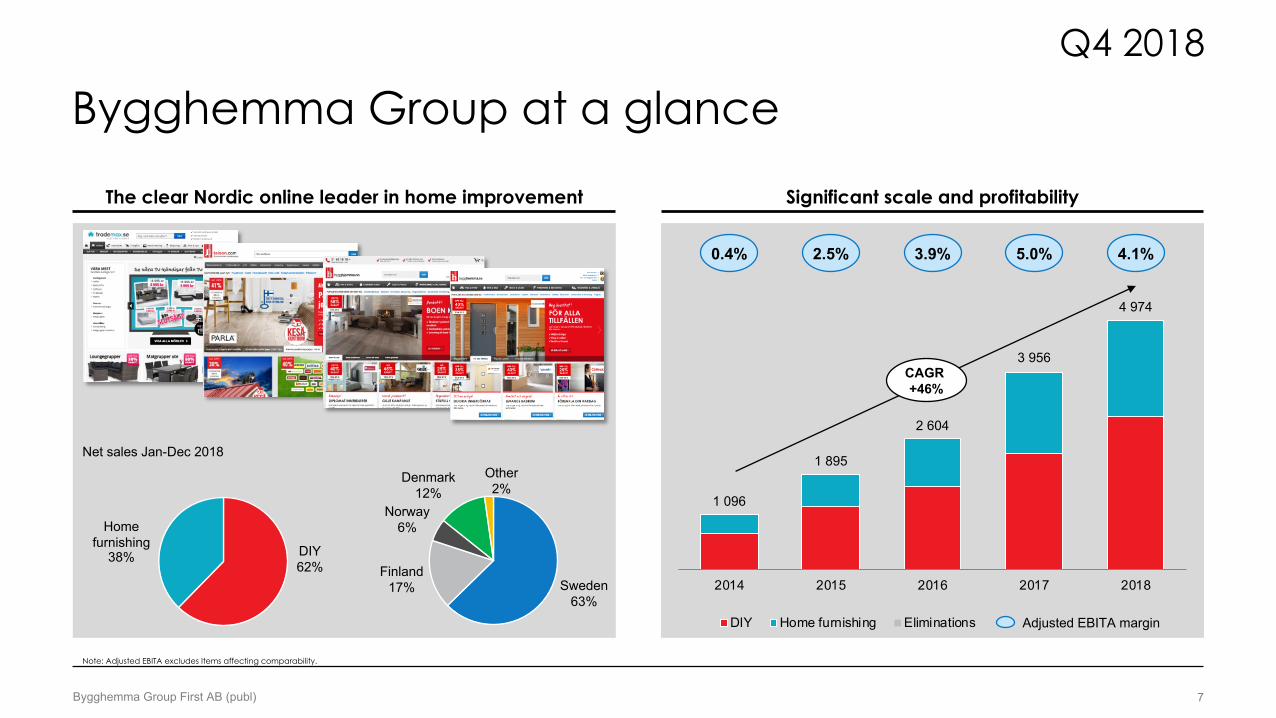
The clear Nordic online leader in home improvement Significant scale and profitability
Sweden63%
Finland17%
Norway6%
Denmark12%
Other2%
DIY62%
Home furnishing
38%
Net sales Jan-Dec 2018
1 096
1 895
2 604
3 956
4 974
2014 2015 2016 2017 2018
DIY Home furnishing Eliminations
3.9% 5.0%
CAGR +46%
0.4%
Adjusted EBITA margin
2.5%
Note: Adjusted EBITA excludes Items affecting comparability.
4.1%
Q4 highlightsQ4 2018
Bygghemma Group First AB (publ) 8
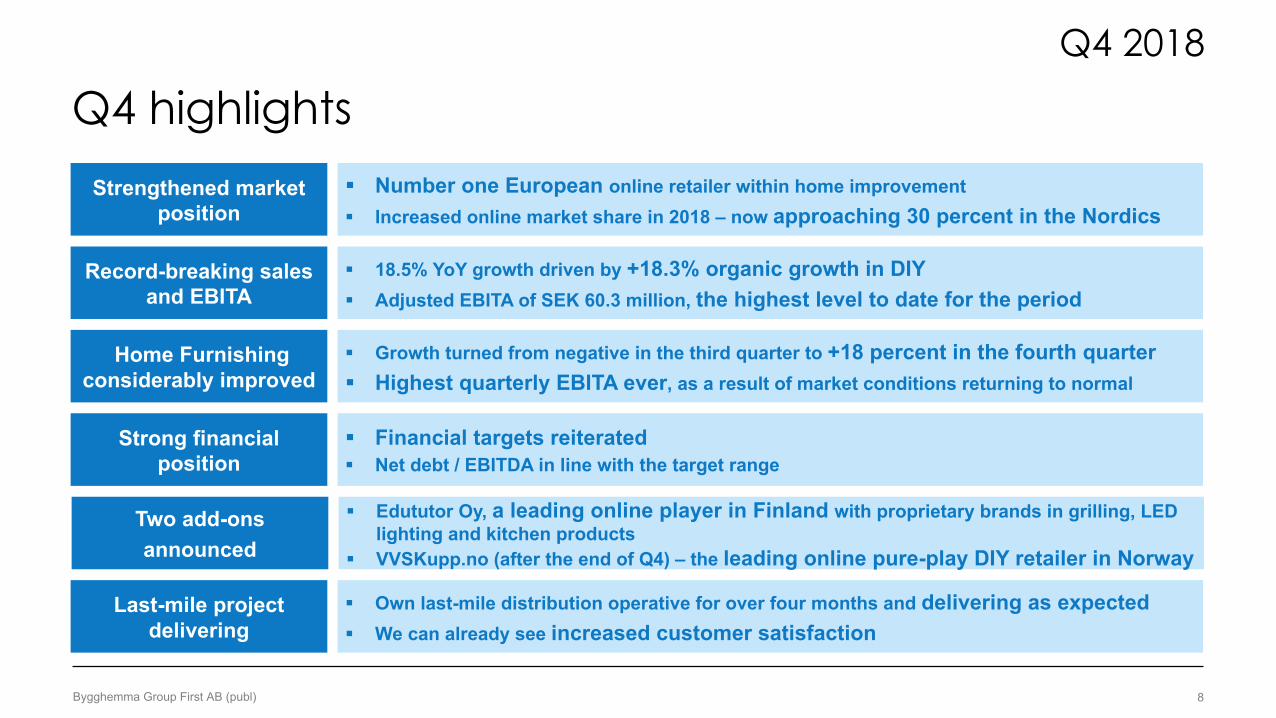
§ Number one European online retailer within home improvement§ Increased online market share in 2018 – now approaching 30 percent in the Nordics
§ 18.5% YoY growth driven by +18.3% organic growth in DIY§ Adjusted EBITA of SEK 60.3 million, the highest level to date for the period
§ Financial targets reiterated§ Net debt / EBITDA in line with the target range
Strengthened market position
Record-breaking sales and EBITA
Strong financial position
§ Growth turned from negative in the third quarter to +18 percent in the fourth quarter§ Highest quarterly EBITA ever, as a result of market conditions returning to normal
§ Own last-mile distribution operative for over four months and delivering as expected§ We can already see increased customer satisfaction
Home Furnishing considerably improved
Last-mile project delivering
§ Edututor Oy, a leading online player in Finland with proprietary brands in grilling, LED lighting and kitchen products
§ VVSKupp.no (after the end of Q4) – the leading online pure-play DIY retailer in Norway
Two add-onsannounced
Market leading position in Norway strengthened
Q4 2018
Bygghemma Group First AB (publ) 9
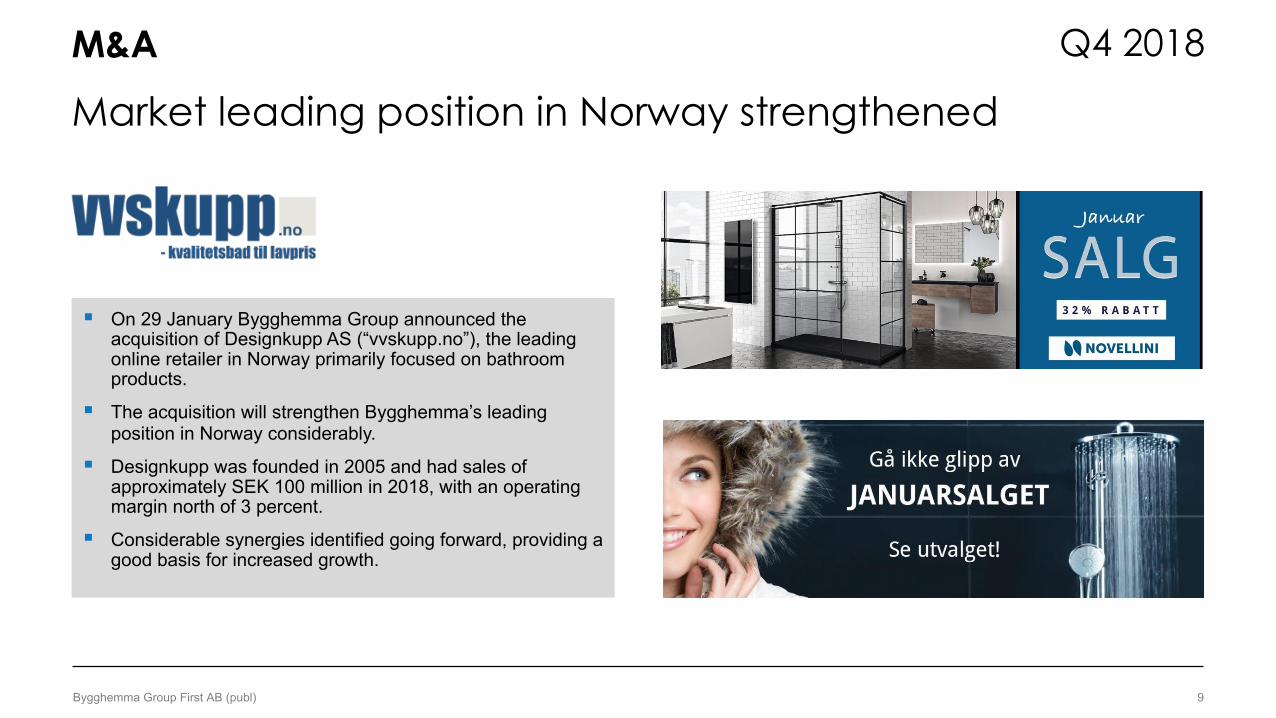
§ On 29 January Bygghemma Group announced the acquisition of Designkupp AS (“vvskupp.no”), the leading online retailer in Norway primarily focused on bathroom products.
§ The acquisition will strengthen Bygghemma’s leading position in Norway considerably.
§ Designkupp was founded in 2005 and had sales of approximately SEK 100 million in 2018, with an operating margin north of 3 percent.
§ Considerable synergies identified going forward, providing a good basis for increased growth.
M&A
§ Results highlights
§ Business update
§ Financial update Q4 2018‒ Group ‒ DIY segment ‒ Home furnishing segment‒ Cash flow and financial position
§ Summary
§ Q&A
AgendaQ4 2018
Bygghemma Group First AB (publ) 10
Sales growth mainly driven by visits and AOV growthQ4 2018
Bygghemma Group First AB (publ) 11
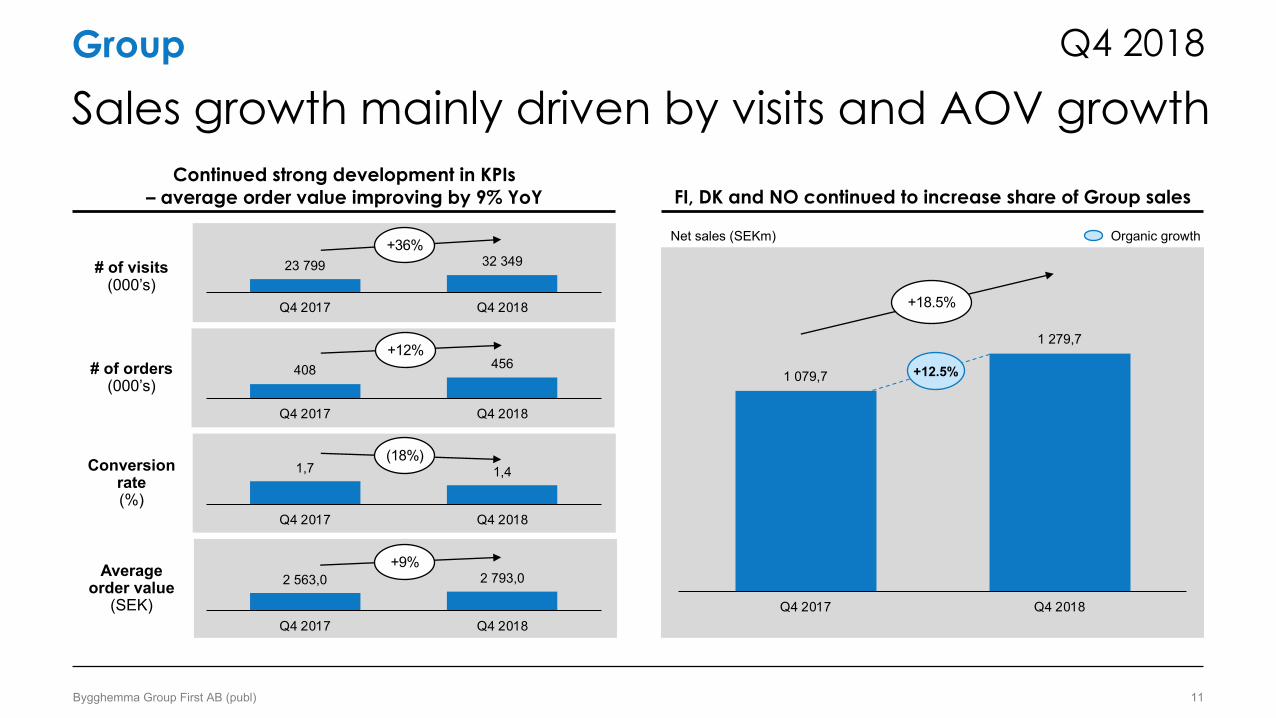
Continued strong development in KPIs– average order value improving by 9% YoY FI, DK and NO continued to increase share of Group sales
# of visits(000’s)
# of orders(000’s)
Conversion rate(%)
Average order value
(SEK)
23 799 32 349
Q4 2017 Q4 2018
+36%
408 456
Q4 2017 Q4 2018
1,7 1,4
Q4 2017 Q4 2018
2 563,0 2 793,0
Q4 2017 Q4 2018
+12%
(18%)
Net sales (SEKm)
1 079,7
1 279,7
Q4 2017 Q4 2018
+12.5%
Organic growth
Group
+18.5%
+9%
Improved gross margin and highest Q4 EBITA to date
Q4 2018
Bygghemma Group First AB (publ) 12
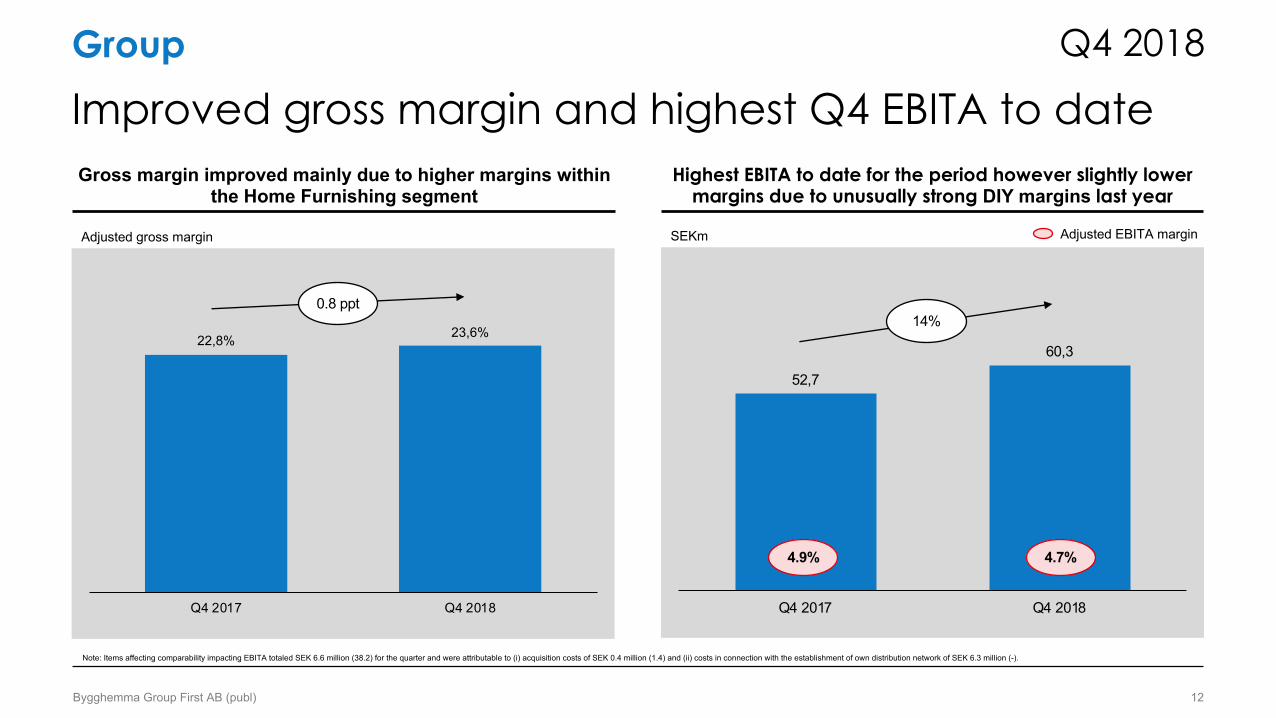
Gross margin improved mainly due to higher margins within the Home Furnishing segment
Highest EBITA to date for the period however slightly lower margins due to unusually strong DIY margins last year
SEKmAdjusted gross margin
22,8%23,6%
Q4 2017 Q4 2018
0.8 ppt
Group
52,7
60,3
Q4 2017 Q4 2018
Adjusted EBITA margin
4.9% 4.7%
Note: Items affecting comparability impacting EBITA totaled SEK 6.6 million (38.2) for the quarter and were attributable to (i) acquisition costs of SEK 0.4 million (1.4) and (ii) costs in connection with the establishment of own distribution network of SEK 6.3 million (-).
14%
Strongly outgrew the market with >18% organic growth
Q4 2018
Bygghemma Group First AB (publ) 13
DIY segment
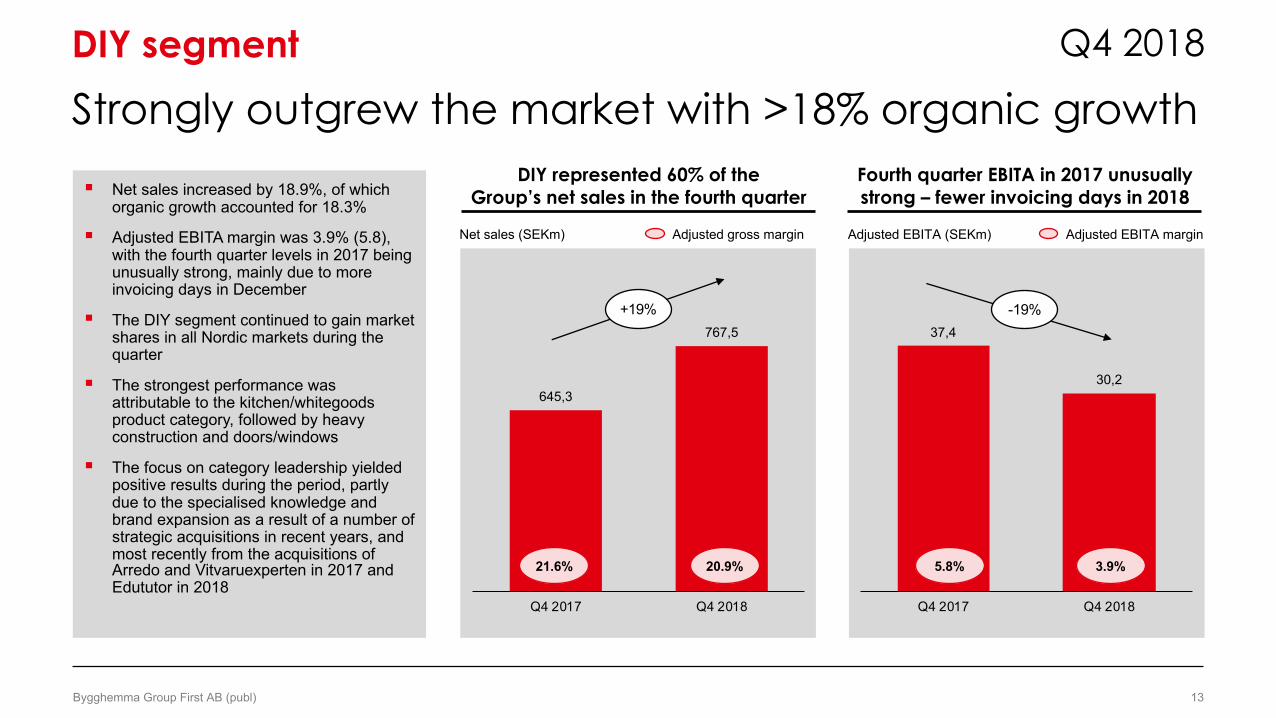
DIY represented 60% of the Group’s net sales in the fourth quarter
Fourth quarter EBITA in 2017 unusually strong – fewer invoicing days in 2018
Net sales (SEKm) Adjusted EBITA (SEKm)
645,3
767,5
Q4 2017 Q4 2018
+19%
Adjusted gross margin
21.6% 20.9%
§ Net sales increased by 18.9%, of which
organic growth accounted for 18.3%
§ Adjusted EBITA margin was 3.9% (5.8),
with the fourth quarter levels in 2017 being
unusually strong, mainly due to more
invoicing days in December
§ The DIY segment continued to gain market
shares in all Nordic markets during the
quarter
§ The strongest performance was
attributable to the kitchen/whitegoods
product category, followed by heavy
construction and doors/windows
§ The focus on category leadership yielded
positive results during the period, partly
due to the specialised knowledge and
brand expansion as a result of a number of
strategic acquisitions in recent years, and
most recently from the acquisitions of Arredo and Vitvaruexperten in 2017 and
Edututor in 2018
37,4
30,2
Q4 2017 Q4 2018
-19%
5.8% 3.9%
Adjusted EBITA margin
Returning to solid growth with highest EBITA ever
Q4 2018
Bygghemma Group First AB (publ) 14
Home furnishing segment
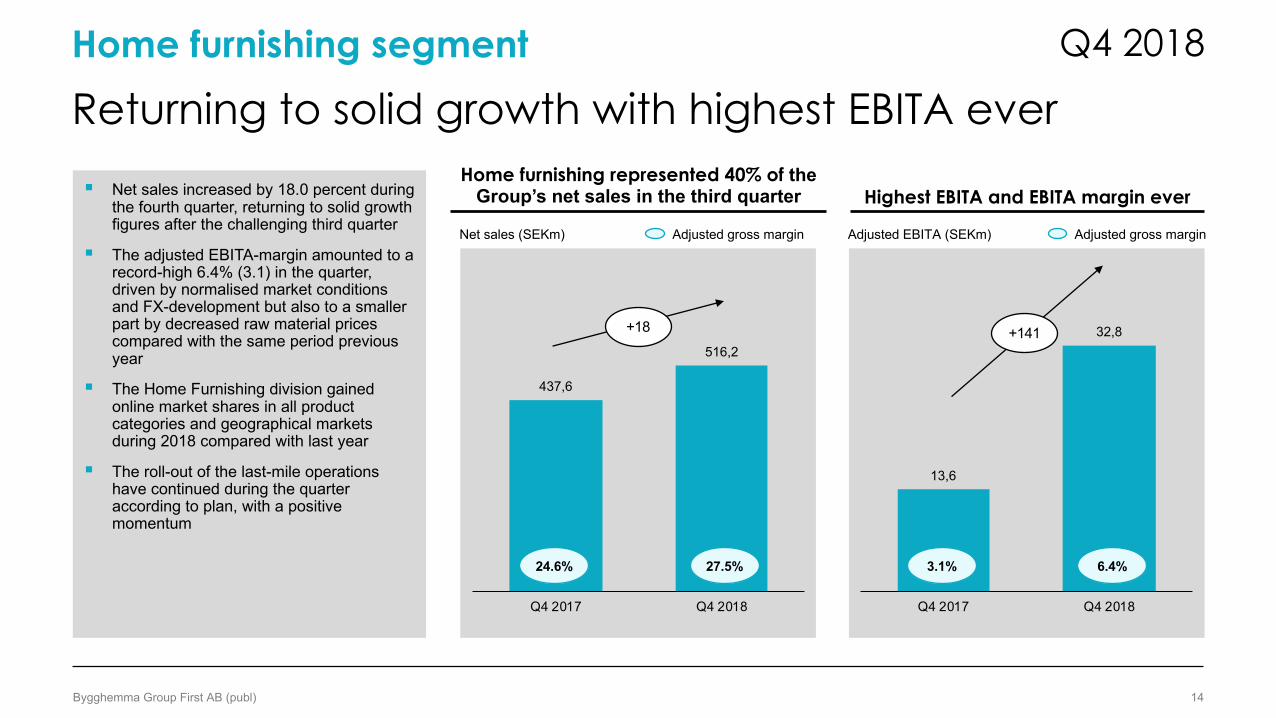
Home furnishing represented 40% of the Group’s net sales in the third quarter Highest EBITA and EBITA margin ever
Net sales (SEKm) Adjusted EBITA (SEKm)
437,6
516,2
Q4 2017 Q4 2018
Adjusted gross margin
24.6% 27.5%
§ Net sales increased by 18.0 percent during the fourth quarter, returning to solid growth figures after the challenging third quarter
§ The adjusted EBITA-margin amounted to a record-high 6.4% (3.1) in the quarter, driven by normalised market conditions and FX-development but also to a smaller part by decreased raw material prices compared with the same period previous year
§ The Home Furnishing division gained online market shares in all product categories and geographical markets during 2018 compared with last year
§ The roll-out of the last-mile operations have continued during the quarter according to plan, with a positive momentum
13,6
32,8
Q4 2017 Q4 2018
+18
Adjusted gross margin
3.1% 6.4%
+141
Strong cash generation despite heavy investment year
Q4 2018
Bygghemma Group First AB (publ) 15
Cash flow and financial position
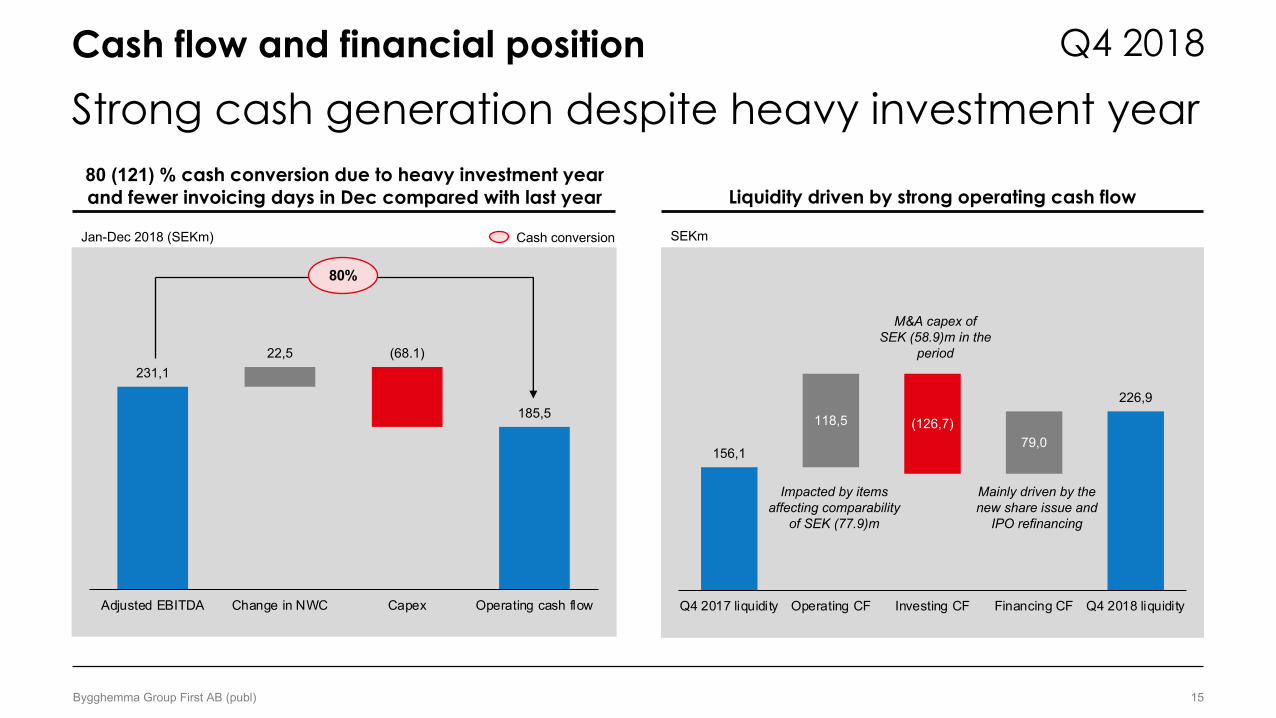
80 (121) % cash conversion due to heavy investment year and fewer invoicing days in Dec compared with last year Liquidity driven by strong operating cash flow
SEKmJan-Dec 2018 (SEKm) Cash conversion
118,5 (126,7)79,0
156,1
226,9
Q4 2017 liquidity Operating CF Investing CF Financing CF Q4 2018 liquidity
Impacted by items affecting comparability
of SEK (77.9)m
M&A capex of SEK (58.9)m in the
period
Mainly driven by the new share issue and
IPO refinancing
231,1 22,5 (68.1)
185,5
Adjusted EBITDA Change in NWC Capex Operating cash flow
80%
Financial position remains solid
Q4 2018
Bygghemma Group First AB (publ) 16
Cash flow and financial position
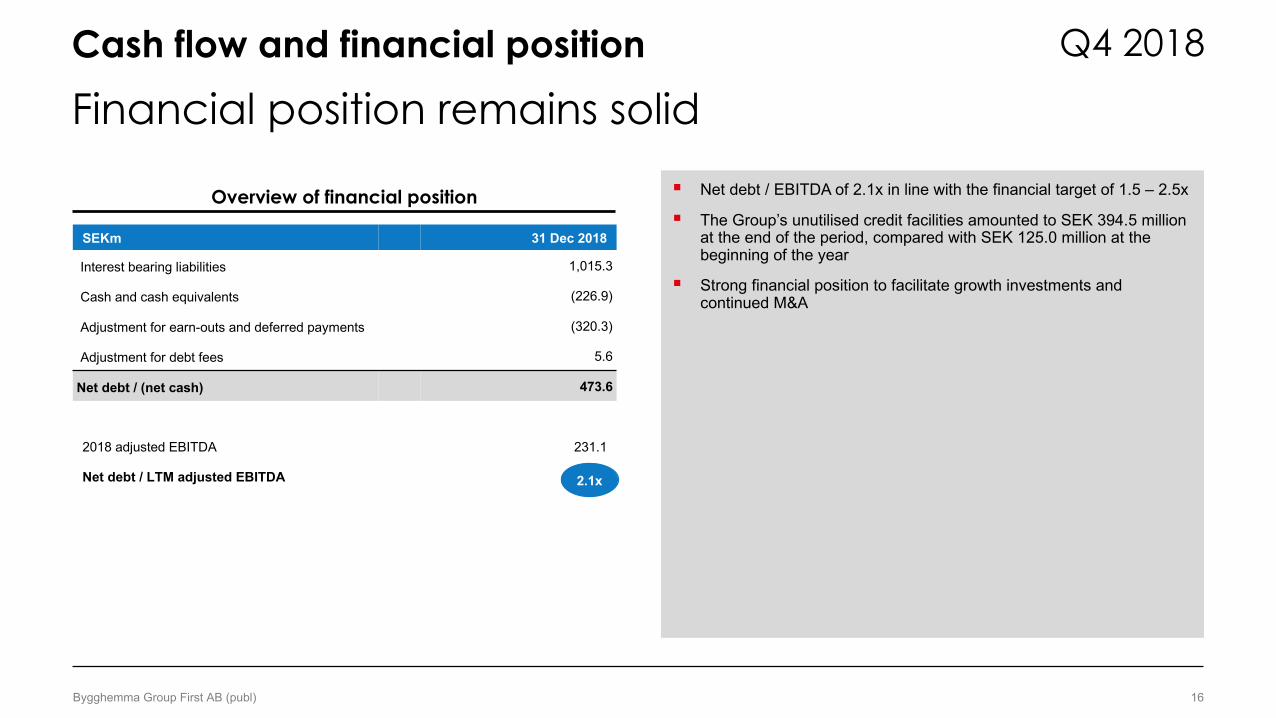
Overview of financial position
SEKm 31 Dec 2018
Interest bearing liabilities 1,015.3
Cash and cash equivalents (226.9)
Adjustment for earn-outs and deferred payments (320.3)
Adjustment for debt fees 5.6
Net debt / (net cash) 473.6
2018 adjusted EBITDA 231.1
Net debt / LTM adjusted EBITDA 2.1x
§ Net debt / EBITDA of 2.1x in line with the financial target of 1.5 – 2.5x
§ The Group’s unutilised credit facilities amounted to SEK 394.5 million at the end of the period, compared with SEK 125.0 million at the beginning of the year
§ Strong financial position to facilitate growth investments and continued M&A
§ Results highlights
§ Business update
§ Financial update Q4 2018‒ Group ‒ DIY segment ‒ Home furnishing segment‒ Cash flow and financial position
§ Summary
§ Q&A
AgendaQ4 2018
Bygghemma Group First AB (publ) 17
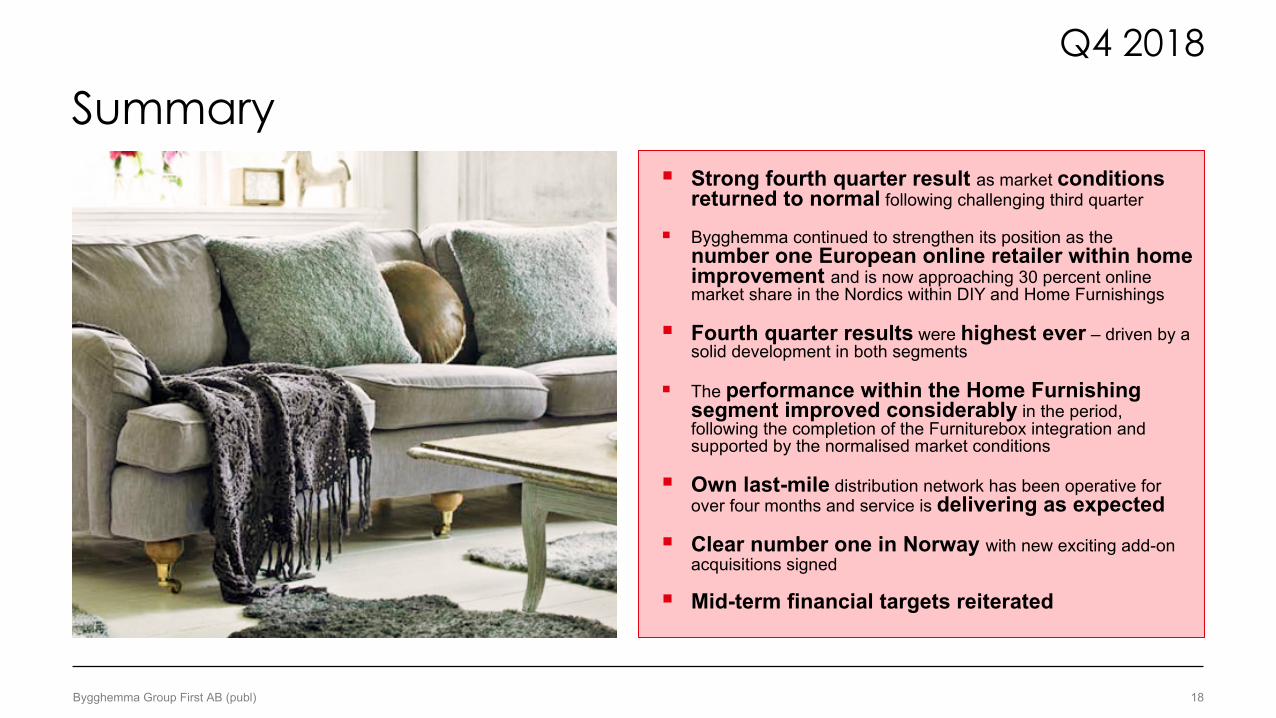
§ Strong fourth quarter result as market conditions returned to normal following challenging third quarter
§ Bygghemma continued to strengthen its position as the number one European online retailer within home improvement and is now approaching 30 percent online market share in the Nordics within DIY and Home Furnishings
§ Fourth quarter results were highest ever – driven by a solid development in both segments
§ The performance within the Home Furnishing segment improved considerably in the period, following the completion of the Furniturebox integration and supported by the normalised market conditions
§ Own last-mile distribution network has been operative for over four months and service is delivering as expected
§ Clear number one in Norway with new exciting add-on acquisitions signed
§ Mid-term financial targets reiterated
SummaryQ4 2018
Bygghemma Group First AB (publ) 18
§ Results highlights
§ Business update
§ Financial update Q4 2018‒ Group ‒ DIY segment ‒ Home furnishing segment‒ Cash flow and financial position
§ Summary
§ Q&A
AgendaQ4 2018
Bygghemma Group First AB (publ) 19
Bygghemma First Holding AB 20
Appendix
Condensed consolidated financial informationQ4 2018
Bygghemma Group First AB (publ) 21
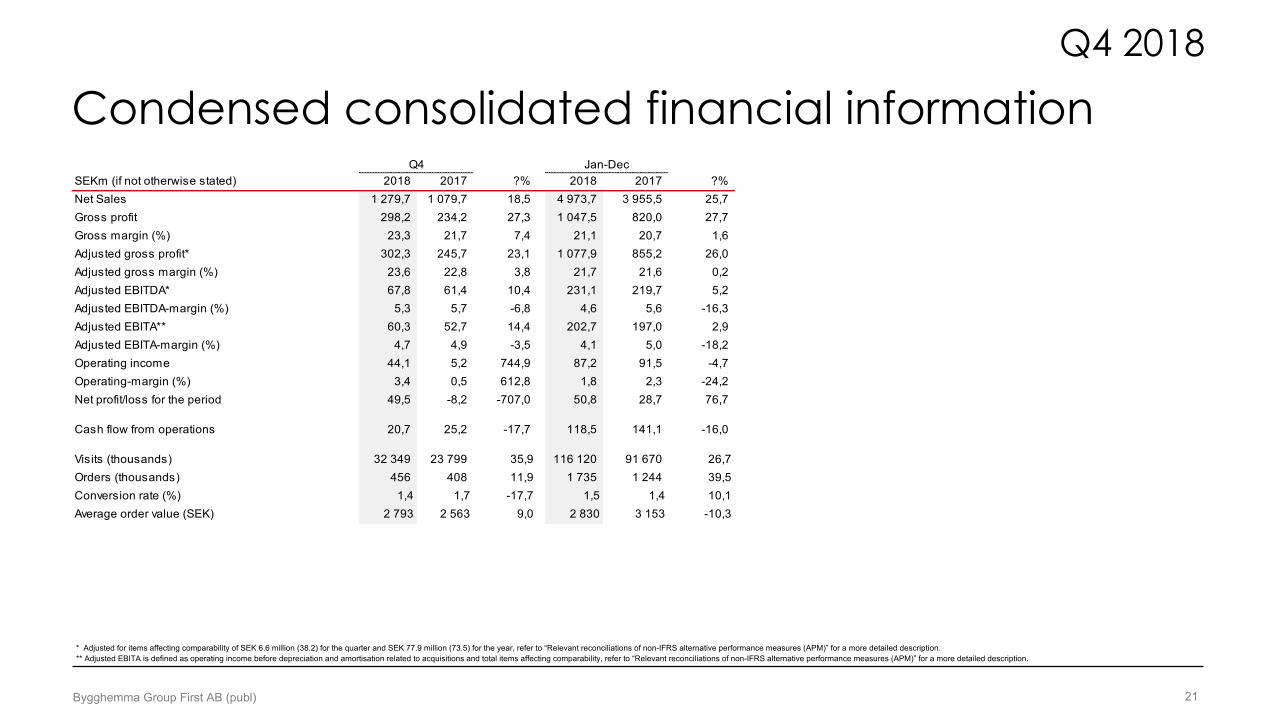
* Adjusted for items affecting comparability of SEK 6.6 million (38.2) for the quarter and SEK 77.9 million (73.5) for the year, refer to “Relevant reconciliations of non-IFRS alternative performance measures (APM)” for a more detailed description.** Adjusted EBITA is defined as operating income before depreciation and amortisation related to acquisitions and total items affecting comparability, refer to “Relevant reconciliations of non-IFRS alternative performance measures (APM)” for a more detailed description.
SEKm (if not otherwise stated) 2018 2017 ?% 2018 2017 ?%
Net Sales 1 279,7 1 079,7 18,5 4 973,7 3 955,5 25,7
Gross profit 298,2 234,2 27,3 1 047,5 820,0 27,7
Gross margin (%) 23,3 21,7 7,4 21,1 20,7 1,6
Adjusted gross profit* 302,3 245,7 23,1 1 077,9 855,2 26,0
Adjusted gross margin (%) 23,6 22,8 3,8 21,7 21,6 0,2
Adjusted EBITDA* 67,8 61,4 10,4 231,1 219,7 5,2
Adjusted EBITDA-margin (%) 5,3 5,7 -6,8 4,6 5,6 -16,3
Adjusted EBITA** 60,3 52,7 14,4 202,7 197,0 2,9
Adjusted EBITA-margin (%) 4,7 4,9 -3,5 4,1 5,0 -18,2
Operating income 44,1 5,2 744,9 87,2 91,5 -4,7
Operating-margin (%) 3,4 0,5 612,8 1,8 2,3 -24,2
Net profit/loss for the period 49,5 -8,2 -707,0 50,8 28,7 76,7
Cash flow from operations 20,7 25,2 -17,7 118,5 141,1 -16,0
Visits (thousands) 32 349 23 799 35,9 116 120 91 670 26,7
Orders (thousands) 456 408 11,9 1 735 1 244 39,5
Conversion rate (%) 1,4 1,7 -17,7 1,5 1,4 10,1
Average order value (SEK) 2 793 2 563 9,0 2 830 3 153 -10,3
Q4 Jan-Dec
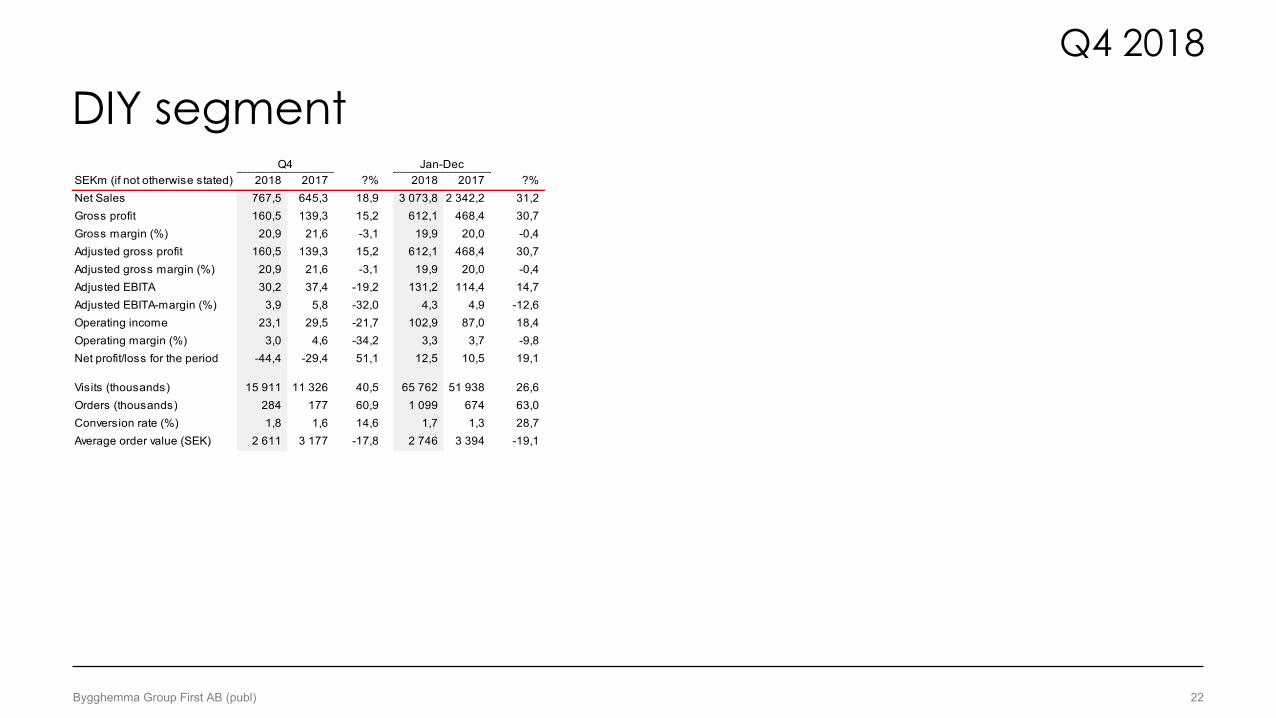
DIY segmentQ4 2018
Bygghemma Group First AB (publ) 22
SEKm (if not otherwise stated) 2018 2017 ?% 2018 2017 ?%Net Sales 767,5 645,3 18,9 3 073,8 2 342,2 31,2Gross profit 160,5 139,3 15,2 612,1 468,4 30,7Gross margin (%) 20,9 21,6 -3,1 19,9 20,0 -0,4Adjusted gross profit 160,5 139,3 15,2 612,1 468,4 30,7Adjusted gross margin (%) 20,9 21,6 -3,1 19,9 20,0 -0,4Adjusted EBITA 30,2 37,4 -19,2 131,2 114,4 14,7Adjusted EBITA-margin (%) 3,9 5,8 -32,0 4,3 4,9 -12,6Operating income 23,1 29,5 -21,7 102,9 87,0 18,4Operating margin (%) 3,0 4,6 -34,2 3,3 3,7 -9,8Net profit/loss for the period -44,4 -29,4 51,1 12,5 10,5 19,1
Visits (thousands) 15 911 11 326 40,5 65 762 51 938 26,6Orders (thousands) 284 177 60,9 1 099 674 63,0Conversion rate (%) 1,8 1,6 14,6 1,7 1,3 28,7Average order value (SEK) 2 611 3 177 -17,8 2 746 3 394 -19,1
Q4 Jan-Dec
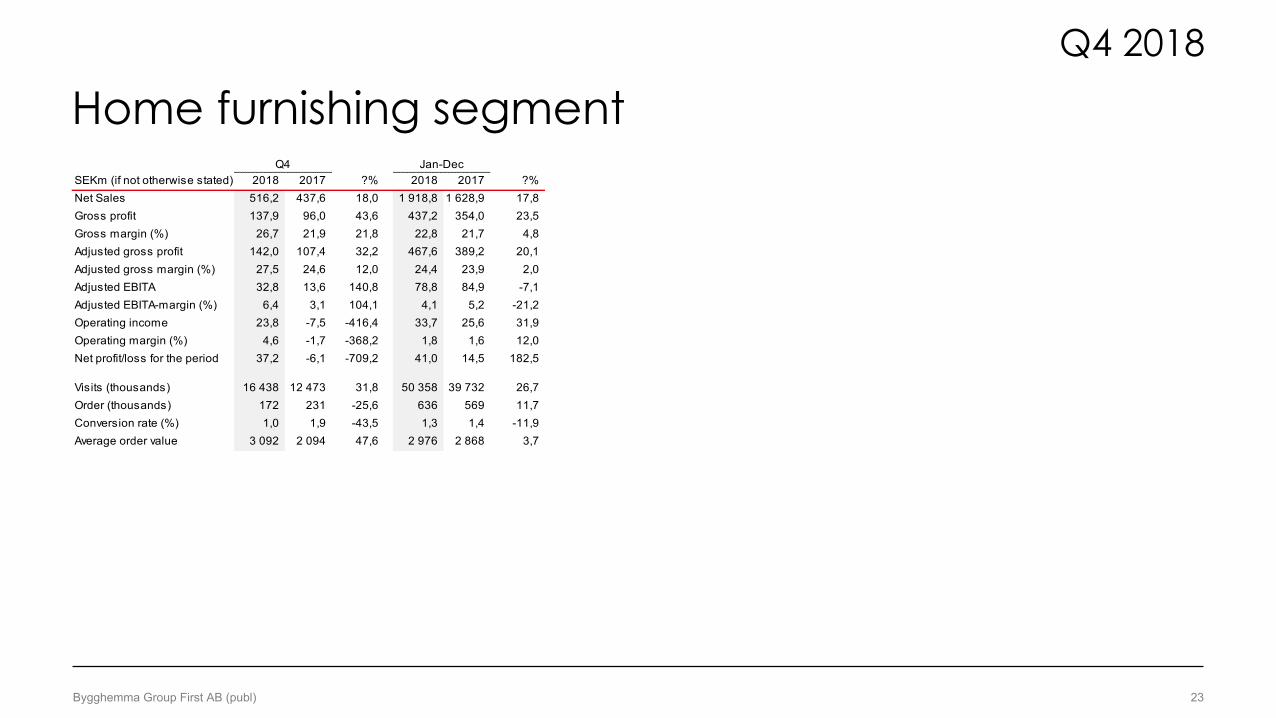
Home furnishing segmentQ4 2018
Bygghemma Group First AB (publ) 23
SEKm (if not otherwise stated) 2018 2017 ?% 2018 2017 ?%
Net Sales 516,2 437,6 18,0 1 918,8 1 628,9 17,8
Gross profit 137,9 96,0 43,6 437,2 354,0 23,5
Gross margin (%) 26,7 21,9 21,8 22,8 21,7 4,8
Adjusted gross profit 142,0 107,4 32,2 467,6 389,2 20,1
Adjusted gross margin (%) 27,5 24,6 12,0 24,4 23,9 2,0
Adjusted EBITA 32,8 13,6 140,8 78,8 84,9 -7,1
Adjusted EBITA-margin (%) 6,4 3,1 104,1 4,1 5,2 -21,2
Operating income 23,8 -7,5 -416,4 33,7 25,6 31,9
Operating margin (%) 4,6 -1,7 -368,2 1,8 1,6 12,0
Net profit/loss for the period 37,2 -6,1 -709,2 41,0 14,5 182,5
Visits (thousands) 16 438 12 473 31,8 50 358 39 732 26,7
Order (thousands) 172 231 -25,6 636 569 11,7
Conversion rate (%) 1,0 1,9 -43,5 1,3 1,4 -11,9
Average order value 3 092 2 094 47,6 2 976 2 868 3,7
Q4 Jan-Dec
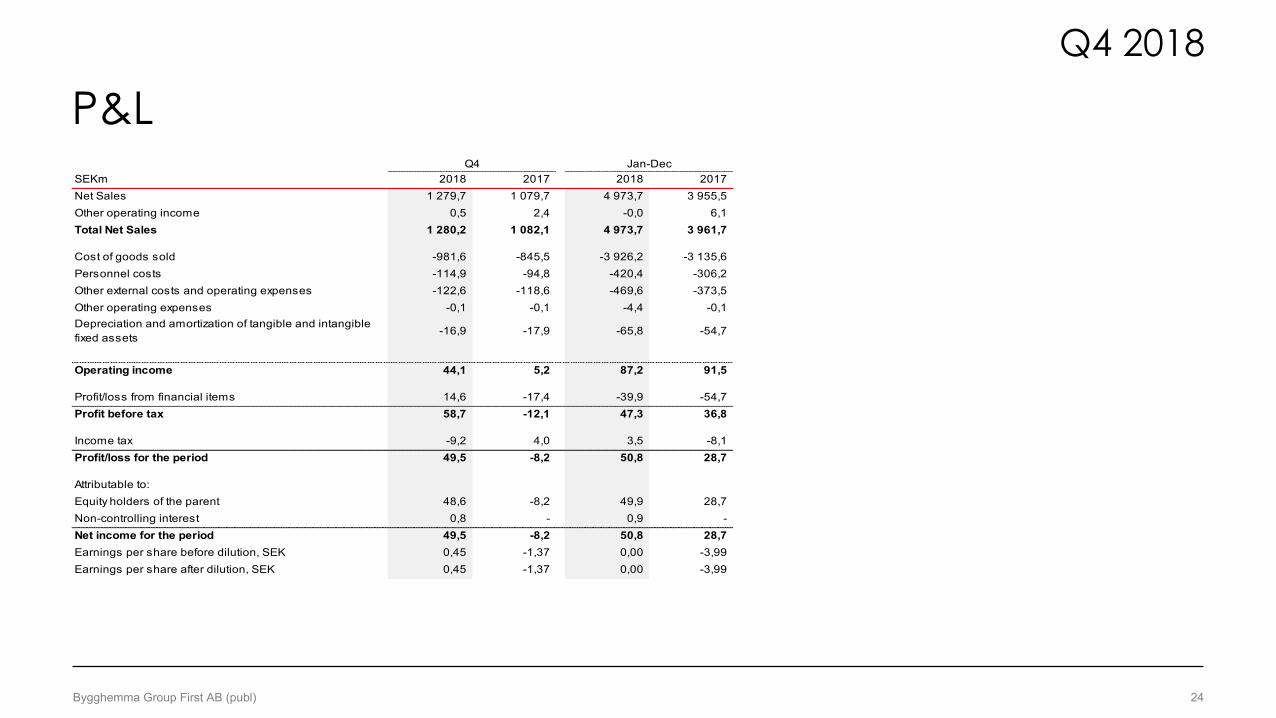
P&LQ4 2018
Bygghemma Group First AB (publ) 24
SEKm 2018 2017 2018 2017
Net Sales 1 279,7 1 079,7 4 973,7 3 955,5
Other operating income 0,5 2,4 -0,0 6,1
Total Net Sales 1 280,2 1 082,1 4 973,7 3 961,7
Cost of goods sold -981,6 -845,5 -3 926,2 -3 135,6
Personnel costs -114,9 -94,8 -420,4 -306,2
Other external costs and operating expenses -122,6 -118,6 -469,6 -373,5
Other operating expenses -0,1 -0,1 -4,4 -0,1Depreciation and amortization of tangible and intangible fixed assets
-16,9 -17,9 -65,8 -54,7
Operating income 44,1 5,2 87,2 91,5
Profit/loss from financial items 14,6 -17,4 -39,9 -54,7
Profit before tax 58,7 -12,1 47,3 36,8
Income tax -9,2 4,0 3,5 -8,1
Profit/loss for the period 49,5 -8,2 50,8 28,7
Attributable to:
Equity holders of the parent 48,6 -8,2 49,9 28,7
Non-controlling interest 0,8 - 0,9 -
Net income for the period 49,5 -8,2 50,8 28,7Earnings per share before dilution, SEK 0,45 -1,37 0,00 -3,99
Earnings per share after dilution, SEK 0,45 -1,37 0,00 -3,99
Q4 Jan-Dec
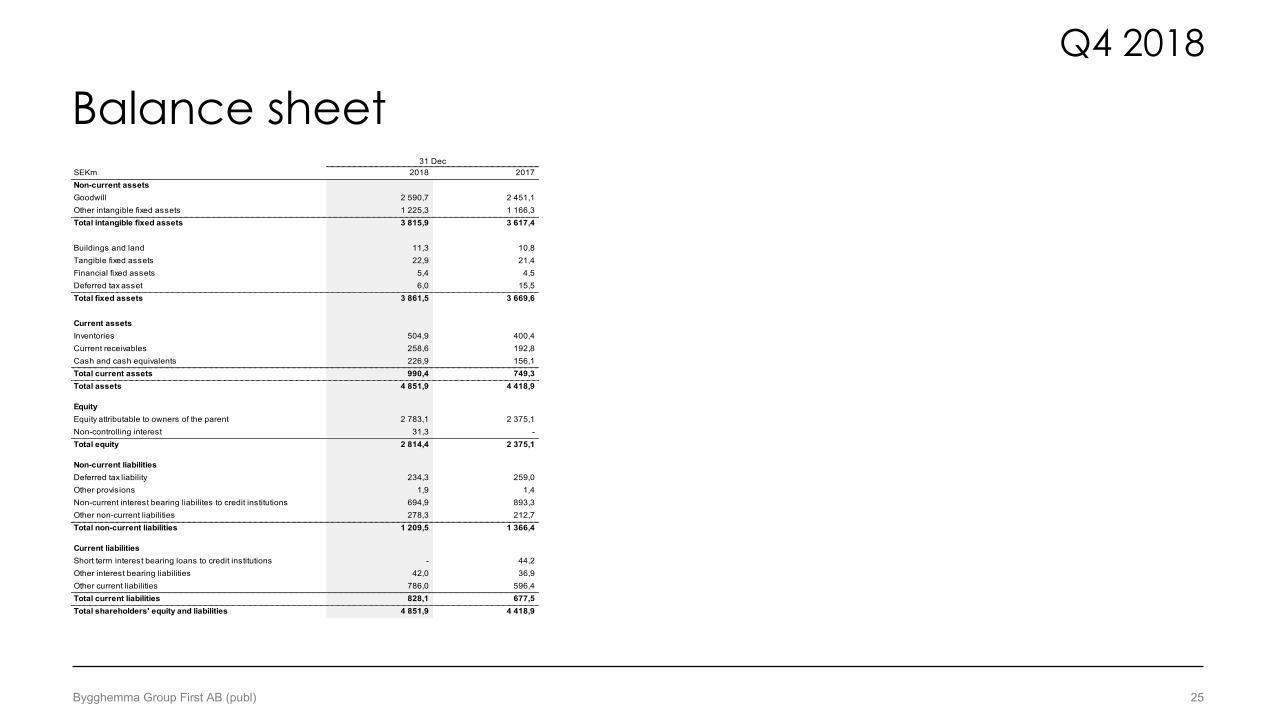
Balance sheetQ4 2018
Bygghemma Group First AB (publ) 25
SEKm 2018 2017Non-current assetsGoodwill 2 590,7 2 451,1Other intangible fixed assets 1 225,3 1 166,3Total intangible fixed assets 3 815,9 3 617,4
Buildings and land 11,3 10,8Tangible fixed assets 22,9 21,4Financial fixed assets 5,4 4,5Deferred tax asset 6,0 15,5Total fixed assets 3 861,5 3 669,6
Current assetsInventories 504,9 400,4Current receivables 258,6 192,8Cash and cash equivalents 226,9 156,1Total current assets 990,4 749,3Total assets 4 851,9 4 418,9
EquityEquity attributable to owners of the parent 2 783,1 2 375,1Non-controlling interest 31,3 -Total equity 2 814,4 2 375,1
Non-current liabilitiesDeferred tax liability 234,3 259,0Other provisions 1,9 1,4Non-current interest bearing liabilites to credit institutions 694,9 893,3Other non-current liabilities 278,3 212,7Total non-current liabilities 1 209,5 1 366,4
Current liabilitiesShort term interest bearing loans to credit institutions - 44,2Other interest bearing liabilities 42,0 36,9Other current liabilities 786,0 596,4Total current liabilities 828,1 677,5Total shareholders' equity and liabilities 4 851,9 4 418,9
31 Dec
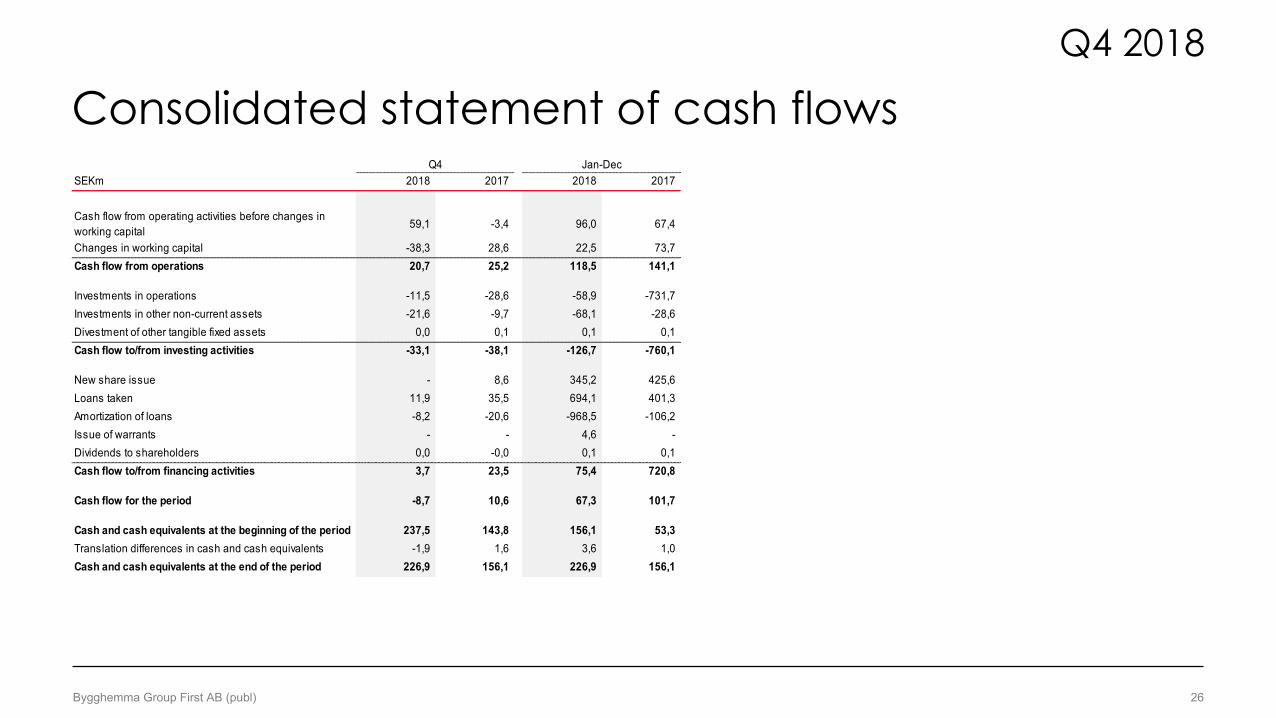
Consolidated statement of cash flowsQ4 2018
Bygghemma Group First AB (publ) 26
SEKm 2018 2017 2018 2017
Cash flow from operating activities before changes in
working capital59,1 -3,4 96,0 67,4
Changes in working capital -38,3 28,6 22,5 73,7
Cash flow from operations 20,7 25,2 118,5 141,1
Investments in operations -11,5 -28,6 -58,9 -731,7
Investments in other non-current assets -21,6 -9,7 -68,1 -28,6
Divestment of other tangible fixed assets 0,0 0,1 0,1 0,1
Cash flow to/from investing activities -33,1 -38,1 -126,7 -760,1
New share issue - 8,6 345,2 425,6
Loans taken 11,9 35,5 694,1 401,3
Amortization of loans -8,2 -20,6 -968,5 -106,2
Issue of warrants - - 4,6 -
Dividends to shareholders 0,0 -0,0 0,1 0,1
Cash flow to/from financing activities 3,7 23,5 75,4 720,8
Cash flow for the period -8,7 10,6 67,3 101,7
Cash and cash equivalents at the beginning of the period 237,5 143,8 156,1 53,3Translation differences in cash and cash equivalents -1,9 1,6 3,6 1,0
Cash and cash equivalents at the end of the period 226,9 156,1 226,9 156,1
Q4 Jan-Dec

Reconciliation of non-IFRS metricsQ4 2018
Bygghemma Group First AB (publ) 27
SEKm 2018 2017 2018 2017Operating income 44,1 5,2 87,2 91,5
Depreciation and amortization of acquisition related intangible fixed assets 9,6 9,3 37,5 32,1
EBITA 53,7 14,5 124,8 123,6EBITA (%) 4,2 1,3 2,5 3,1
Acquisition-related costs 0,4 1,4 2,0 10,0Integration costs and costs related to warehouse move - 18,4 27,5 44,7Costs in connection with the establishment of own distribution network 6,3 - 6,3 -
Costs related to LTIP - - 11,4 -Costs related to the process for expanding the shareholder base - 18,4 30,7 18,8
Total items affecting comparability 6,6 38,2 77,9 73,5
Adjusted EBITA 60,3 52,7 202,7 197,0Adjusted EBITA (%) 4,7 4,9 4,1 5,0Depreciation and amortization of tangible and intangible fixed assets 7,5 8,7 28,4 22,6
Adjusted EBITDA 67,8 61,4 231,1 219,7Adjusted EBITDA (%) 5,3 5,7 4,6 5,6
Net Sales 1 279,7 1 079,7 4 973,7 3 955,5Cost of goods sold -981,6 -845,5 -3 926,2 -3 135,6Gross profit 298,2 234,2 1 047,5 820,0Gross profit (%) 23,3 21,7 21,1 20,7
Integration costs and costs related to warehouse move - 11,5 26,3 35,2Costs in connection with the establishment of own distribution network 4,2 - 4,2 -
Adjusted gross profit 302,3 245,7 1 077,9 855,2Adjusted gross profit (%) 23,6 22,8 21,7 21,6
Q4 Jan-Dec