record quarter production and strong ......2020/07/23 · asx announcement 23 july 2020 june 2020...
TRANSCRIPT
ASX: NST
Record quarterly sales of 262,717oz at AISC of A$1,475/oz; FY20 average realised price of A$2,208/oz (current spot price ~A$2,600/oz); Hedge book reduced to just 15% of next 3 years’ production
HIGHLIGHTS ▪ Record gold sold in the June quarter of 262,717oz at an AISC of A$1,475/oz (US$969/oz)*
o Australian Operations (including 50% KCGM) sold a record 212,466oz at an AISC of A$1,360/oz (US$894/oz) o Pogo Operations sold 50,251oz at an AISC of US$1,276/oz
▪ FY20 Group sales were a record 900,388oz at AISC of A$1,496/oz (US$983/oz) o Australian Operations sold a record 727,352oz at AISC of A$1,350/oz (US$887/oz), within the stated
720,000oz - 800,000oz guidance range o Pogo Operations mined 200,718oz and sold 173,036oz at AISC US$1,402/oz
▪ Average realised price of A$2,208/oz in FY20; This included sales of 271,378oz into hedged positions, reducing the hedge book to 536,426oz and equal to just 15% of the next three years’ production
▪ Strong underlying free cash flow of A$218M generated during June quarter; This was despite investing ~A$44M in growth capital and exploration
▪ Cash, bullion and investments rose by 40% to A$770M at 30 June 2020; Corporate bank debt A$700M at 30 June 2020, with A$200M repaid post quarter on 6 July
▪ Fully franked interim dividend of 7.5cps (A$55M) was paid on 16 July; The Company expects to resume dividend payments in the ordinary course of business
▪ June quarter production: o Jundee Gold Operations:
- 102,198oz mined and 77,788oz sold at an AISC A$1,078/oz (US$708/oz) o Kalgoorlie Gold Operations:
- 83,720oz mined and 79,057oz sold at an AISC A$1,615/oz (US$1,061/oz) o KCGM Gold Operations (50% Ownership):
- 32,564oz mined and 55,621oz sold at an AISC A$1,400/oz (US$920/oz) o Pogo Gold Operations:
- 54,925oz mined and 50,251oz sold at an AISC US$1,276/oz
▪ FY2020 gold sold from the Australian Operations was within the stated guidance range: o Jundee Gold Operations:
- 379,506oz mined and 294,279oz gold sold at an AISC of A$1,095/oz (US$722/oz) o Kalgoorlie Gold Operations:
- 330,225oz mined and 317,248oz sold at an AISC of A$1,564/oz (US$1,047/oz) o KCGM (50%) and owned from Jan-20:
- 74,226oz mined and 115,825oz gold sold at an AISC of A$1,427/oz (US$939/oz)
ASX Announcement – June 2020 Quarterly Activities Report 23 July 2020
RECORD QUARTER PRODUCTION AND STRONG MARGINS GENERATE A$218M IN UNDERLYING FREE CASHFLOW
For
per
sona
l use
onl
y

ASX Announcement 23 July 2020
JUNE 2020 QUARTERLY ACTIVITIES REPORT
2
▪ FY2021 Group production/cost guidance will be published with the annual Reserve and Resource update (ex-KCGM) in the coming weeks
▪ As outlined in the March quarter, the strict COVID-19 related measures implemented early paved the way for the improved performance in the June quarter, especially at the Australian Operations. The cost of these additional measures so far is ~A$10M
▪ The June quarter result at Pogo was particularly pleasing considering there were 36 confirmed COVID-19 cases. While the virus is prevalent in Alaska, Northern Star expects Pogo volumes to remain around the levels seen in the June quarter, equal to ~25% lower than would otherwise be the case
▪ At Pogo, the transition to long-hole stoping and achieving positive cashflow, is now complete as demonstrated by the improvements in mined grade, gold production and costs per ounce. The past two quarters, while impacted by COVID-19, provide an insight into the production potential in a normalised environment especially with the anticipated increase of mining physicals volumes
▪ At KCGM, strong operational progress is being made. Open pit material movement improved by in excess of 40% over the March quarter as focus turned to expanding the available open pit mining fronts. Significant improvements were also made in the underground productivities, with mined tonnes increasing by 25% from March quarter
▪ The Jundee Operations performed strongly over the quarter with 80,666oz produced. The underground mined grade improved 25% to 4.5gpt from the March quarter. The A$22M mill expansion to 2.7Mtpa was completed ahead of schedule, under budget and successfully commissioned
▪ The Kalgoorlie Operations had a solid June quarter and delivered as expected with overall milled tonnes increasing by 10%, head grade increasing by 4% and gold production increasing by 13% compared to the March quarter
▪ Northern Star has large ore stockpiles/gold in circuit of 1.7Moz at 30 June; These help insulate the business and de-risk any operational challenges
▪ Northern Star’s A$10M Community COVID Fund provided significant funding to assist local health services, communities and businesses
▪ Option to acquire Newmont Power Business has lapsed; Multiple future power options for KCGM now being explored
▪ Northern Star will host a quarterly conference call today, 23 July 2020 at 9:30am AEST (7:30am AWST). The call can be accessed at https://webcast.boardroom.media/northern-star-resources-ltd/20200720/NaNnst-june-2020-quarter
Northern Star Resources (ASX: NST) is pleased to report its results for the June 2020 quarter, during which the Company generated solid results despite the impacts of COVID-19.
As foreshadowed in its release of 26 March 2020, the measures implemented by Northern Star to protect its people affected production and costs at the Company’s operations to varying degrees.
But despite these impacts, underlying free cashflow was a quarterly record of A$218 million. This figure is particularly notable given that it came after spending A$44 million on growth capital and exploration and in a quarter which saw the Company further sell into and reduce its hedge book.
At June 30, Northern Star’s hedge book stood at 536,426oz, which is equal to just ~15 per cent of the Company’s forecast production over the next three years. This makes Northern Star one of the most unhedged ASX gold producers of scale.
Northern Star Executive Chair Bill Beament said while COVID-19 had made it a challenging quarter, the results highlighted the Company’s enviable outlook.
For
per
sona
l use
onl
y

ASX Announcement 23 July 2020
JUNE 2020 QUARTERLY ACTIVITIES REPORT
3
“Our quarterly sales of 262,717oz was not only a record, but also very solid given the imposts stemming from the COVID-19 measures we moved quickly to put in place,” Mr Beament said.
“AISC were restricted to A$1,475/oz despite the impact of these measures and therefore margins were robust given the average selling price of A$2,487/oz. As a result, underlying free cashflow was a record A$218 million.
“All together, this demonstrates the significant potential to grow our free cashflow as the impacts of COVID-19 on production and costs are alleviated and, importantly, as our exposure to the spot gold price increases.”
Mr Beament said Northern Star would continue to reduce its hedge book in the current half, providing scope for further growth in margins and free cashflow and cementing the Company’s position as one of the most unhedged and profitable ASX gold producers.
He said the results also demonstrated the outstanding potential of Pogo in a normalised environment.
“Pogo sold 50,251oz in a quarter during which we managed 36 cases of COVID-19,” Mr Beament said. “We now have a strong insight into the impact of the virus on Pogo and it is clear that this asset will continue to produce at about 75 per cent of its potential while the virus remains in Alaska.
“However, the 18-month transition to long-hole stoping is finished and the benefits of this new mining method are being reflected in the results, albeit somewhat restricted by COVID-19.”
Gold sold across the Group in the June quarter totalled 262,717oz at an AISC of A$1,475/oz (US$969/oz). The Australian
Operations (including 50% of KCGM) sold 212,466oz at an AISC of A$1,360/oz (US$894/oz) and the Pogo Operations sold
50,251oz at an AISC of US$1,276/oz.
Cash, bullion and investments at 30 June 2020 increased by 40% to A$770 million and corporate debt stood at A$700 million.
After the quarters end, A$200 million of corporate debt was repaid on 6 July 2020.
As a result of the solid June quarter result, the payment of the A$55 million interim dividend was made shortly after year-end on 16 July 2020. It is expected that the full-year dividend will be paid on the normal timeline and in line with the Company’s prior calculation metrics.
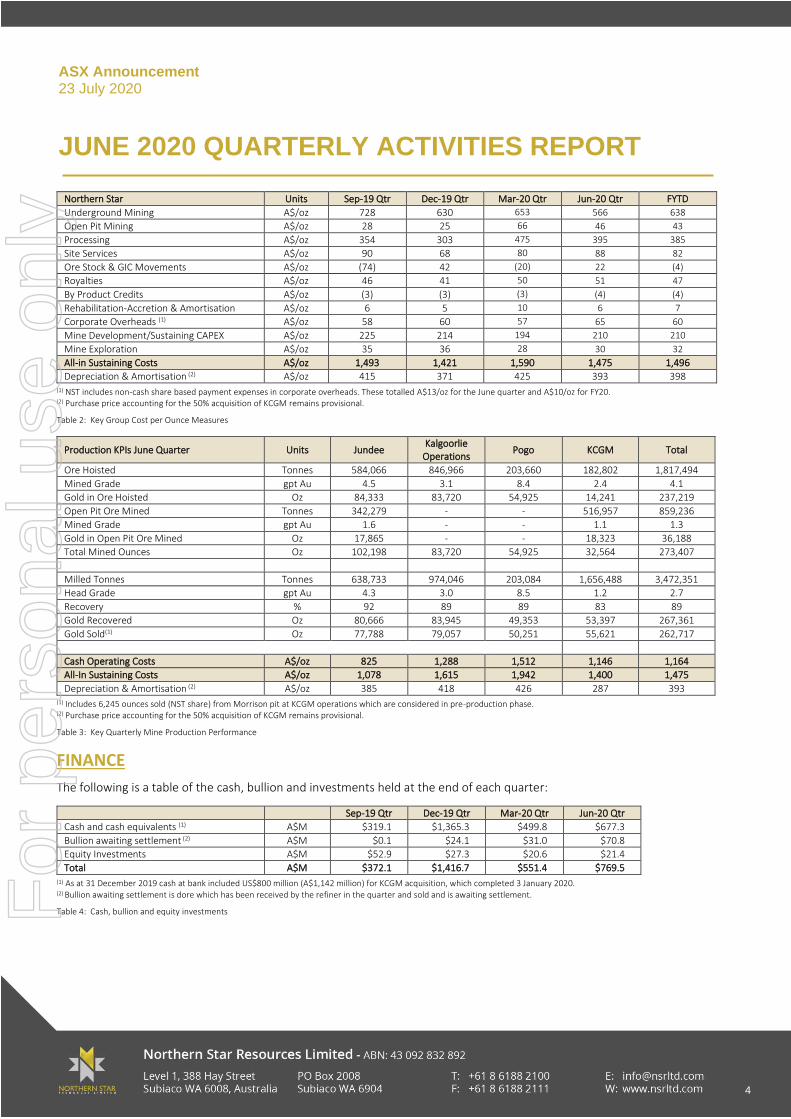
Northern Star Units Sep-19 Qtr Dec-19 Qtr Mar-20 Qtr Jun-20 Qtr FYTD
Ore Hoisted – UG Tonnes 1,439,654 1,502,172 1,638,465 1,817,494 6,397,785
Mined Grade gpt Au 4.4 4.7 3.9 4.1 4.2
Gold in Ore Hoisted Oz 204,590 224,494 206,206 237,219 872,509
Open Pit Ore Mined Tonnes 302,093 339,961 885,304 859,236 2,386,594
Mined Grade gpt Au 1.6 1.5 1.6 1.3 1.5
Gold in Open Pit Ore Mined Oz 15,272 16,513 44,193 36,188 112,166
Total Mined Ounces Oz 219,862 241,007 250,399 273,407 984,675
Milled Tonnes Tonnes 1,530,243 1,588,428 3,149,968 3,472,351 9,740,990
Head Grade gpt Au 4.3 4.6 2.7 2.7 3.3
Contained Ounces Milled Oz 211,553 235,428 270,293 301,625 1,018,899
Recovery % 89 90 88 89% 89%
Gold Recovered Oz 188,175 212,571 237,070 267,361 905,177
Gold Sold – Pre-Production Oz - - 7,600 6,245 13,845
Gold Sold – Production Oz 184,005 214,635 231,431 256,472 886,543
Ounces Sold Oz 184,005 214,635 239,031 262,717 900,388
Cash Operating Cost A$/oz 1,170 1,106 1,301 1,164 1,187
All-in Sustaining Cost A$/oz 1,493 1,421 1,590 1,475 1,496
Total Stockpiles Contained Gold Oz 93,474 95,226 1,657,810 1,634,335 1,634,335
Gold in Circuit (GIC) Oz 25,429 23,656 35,317 40,179 40,179
Gold in safe/transit Oz - - 159 - -
Northern Star Units Sep-19 Qtr Dec-19 Qtr Mar-20 Qtr Jun-20 Qtr FYTD
Revenue – Gold A$M 372.9 442.7 504.2 637.7 1,957.6
Average Price A$/oz 2,027 2,063 2,179 2,487 2,208
Table 1: Key Group Performance Figures (Quarterly)
For
per
sona
l use
onl
y
ASX Announcement 23 July 2020
JUNE 2020 QUARTERLY ACTIVITIES REPORT
4
Northern Star Units Sep-19 Qtr Dec-19 Qtr Mar-20 Qtr Jun-20 Qtr FYTD
Underground Mining A$/oz 728 630 653 566 638
Open Pit Mining A$/oz 28 25 66 46 43
Processing A$/oz 354 303 475 395 385
Site Services A$/oz 90 68 80 88 82
Ore Stock & GIC Movements A$/oz (74) 42 (20) 22 (4)
Royalties A$/oz 46 41 50 51 47
By Product Credits A$/oz (3) (3) (3) (4) (4)
Rehabilitation-Accretion & Amortisation A$/oz 6 5 10 6 7
Corporate Overheads (1) A$/oz 58 60 57 65 60
Mine Development/Sustaining CAPEX A$/oz 225 214 194 210 210
Mine Exploration A$/oz 35 36 28 30 32
All-in Sustaining Costs A$/oz 1,493 1,421 1,590 1,475 1,496
Depreciation & Amortisation (2) A$/oz 415 371 425 393 398 (1) NST includes non-cash share based payment expenses in corporate overheads. These totalled A$13/oz for the June quarter and A$10/oz for FY20.
(2) Purchase price accounting for the 50% acquisition of KCGM remains provisional.
Table 2: Key Group Cost per Ounce Measures
Production KPIs June Quarter Units Jundee Kalgoorlie
Operations Pogo KCGM Total
Ore Hoisted Tonnes 584,066 846,966 203,660 182,802 1,817,494
Mined Grade gpt Au 4.5 3.1 8.4 2.4 4.1
Gold in Ore Hoisted Oz 84,333 83,720 54,925 14,241 237,219
Open Pit Ore Mined Tonnes 342,279 - - 516,957 859,236
Mined Grade gpt Au 1.6 - - 1.1 1.3
Gold in Open Pit Ore Mined Oz 17,865 - - 18,323 36,188
Total Mined Ounces Oz 102,198 83,720 54,925 32,564 273,407
Milled Tonnes Tonnes 638,733 974,046 203,084 1,656,488 3,472,351
Head Grade gpt Au 4.3 3.0 8.5 1.2 2.7
Recovery % 92 89 89 83 89
Gold Recovered Oz 80,666 83,945 49,353 53,397 267,361
Gold Sold(1) Oz 77,788 79,057 50,251 55,621 262,717
Cash Operating Costs A$/oz 825 1,288 1,512 1,146 1,164
All-In Sustaining Costs A$/oz 1,078 1,615 1,942 1,400 1,475
Depreciation & Amortisation (2) A$/oz 385 418 426 287 393 (1) Includes 6,245 ounces sold (NST share) from Morrison pit at KCGM operations which are considered in pre-production phase. (2) Purchase price accounting for the 50% acquisition of KCGM remains provisional.
Table 3: Key Quarterly Mine Production Performance
FINANCE
The following is a table of the cash, bullion and investments held at the end of each quarter:
Sep-19 Qtr Dec-19 Qtr Mar-20 Qtr Jun-20 Qtr
Cash and cash equivalents (1) A$M $319.1 $1,365.3 $499.8 $677.3
Bullion awaiting settlement (2) A$M $0.1 $24.1 $31.0 $70.8
Equity Investments A$M $52.9 $27.3 $20.6 $21.4
Total A$M $372.1 $1,416.7 $551.4 $769.5 (1) As at 31 December 2019 cash at bank included US$800 million (A$1,142 million) for KCGM acquisition, which completed 3 January 2020. (2) Bullion awaiting settlement is dore which has been received by the refiner in the quarter and sold and is awaiting settlement.
Table 4: Cash, bullion and equity investments
For
per
sona
l use
onl
y
ASX Announcement 23 July 2020
JUNE 2020 QUARTERLY ACTIVITIES REPORT
5
The below table sets out the total of surface gold inventories:
Gold Inventories Sep-19 Qtr Dec-19 Qtr Mar-20 Qtr Jun-20 Qtr
Stockpiles contained gold (oz) 93,474 95,226 1,657,810 1,634,335
Gold in circuit (oz) 25,429 23,656 35,317 40,179
Gold in safe/transit (oz) - - 159 -
Total Gold Inventories (oz) 118,903 118,882 1,693,286 1,674,514
Table 5: Gold Inventories
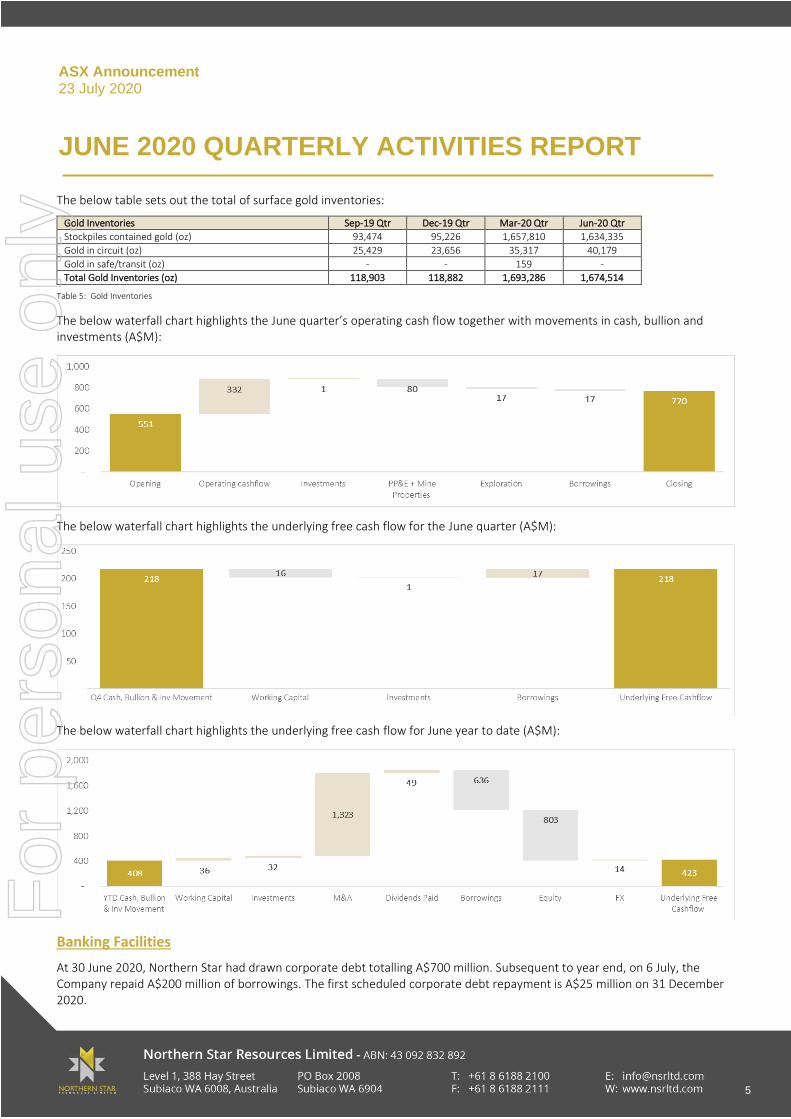
The below waterfall chart highlights the June quarter’s operating cash flow together with movements in cash, bullion and investments (A$M):
The below waterfall chart highlights the underlying free cash flow for the June quarter (A$M):
The below waterfall chart highlights the underlying free cash flow for June year to date (A$M):
Banking Facilities
At 30 June 2020, Northern Star had drawn corporate debt totalling A$700 million. Subsequent to year end, on 6 July, the Company repaid A$200 million of borrowings. The first scheduled corporate debt repayment is A$25 million on 31 December 2020.
For
per
sona
l use
onl
y

ASX Announcement 23 July 2020
JUNE 2020 QUARTERLY ACTIVITIES REPORT
6
Hedging
The below table outlines the Company’s outstanding hedges at 30 June 2020:
Term Dec-20 Half Jun-21 Half Dec-21 Half Jun-22 Half Dec-22 Half Total
Ounces (oz) - 187,111 241,315 54,000 54,000 536,426
Gold Price (A$/oz) - 2,044 2,073 2,175 2,180 2,085
Table 6: Hedging commitments
No hedge commitments were added during the quarter. Northern Star retains the flexibility to early deliver hedge commitments at any time up until maturity date.
OPERATIONS
Jundee Gold Operations
Production Summary Sep-19 Qtr Dec-19 Qtr Mar-20 Qtr Jun-20 Qtr FYTD
Jundee Operations
Ore Mined – Underground Tonnes 540,226 525,253 530,878 584,066 2,180,423
Mined Grade gpt Au 5.2 4.8 3.6 4.5 4.5
Ounces Mined – Underground Oz 89,993 80,431 60,767 84,333 315,524
Ore Mined - Open Pit Tonnes 302,093 339,961 299,433 342,279 1,283,766
Mined Grade gpt Au 1.6 1.5 1.5 1.6 1.6
Ounces Mined - Open Pit Oz 15,272 16,513 14,332 17,865 63,982
Total Mined Ounces Oz 105,265 96,944 75,099 102,198 379,506
Milled Tonnes Tonnes 586,588 572,576 501,827 638,733 2,299,724
Head Grade gpt Au 5.0 4.7 3.8 4.3 4.5
Recovery % 90 92 89 92 91
Gold Recovered Oz 84,847 80,069 54,568 80,666 300,150
Gold Sold Oz 81,428 82,434 52,629 77,788 294,279
Cost per Ounce
Underground Mining A$/oz 496 497 737 521 546
Open Pit Mining A$/oz 59 66 105 63 70
Processing A$/oz 167 168 255 168 183
Site Services A$/oz 39 37 67 50 47
Ore Stock & GIC Movements A$/oz (46) (36) (182) (36) (65)
Royalties A$/oz 58 54 62 62 59
By Product Credits A$/oz (3) (3) (3) (3) (3)
Cash Operating Costs A$/oz 770 783 1,041 825 837
Rehabilitation - Accretion & Amortisation A$/oz 2 2 7 5 4
Corporate Overheads A$/oz 56 67 60 66 62
Mine Development / Sustaining CAPEX A$/oz 127 158 235 137 158
Jundee Mine Exploration A$/oz 30 20 46 45 34
All-in Sustaining Costs A$/oz 985 1,030 1,389 1,078 1,095
Depreciation & Amortisation A$/oz 371 345 434 385 379
Table 7: Summary Details – Jundee Operations
For
per
sona
l use
onl
y

ASX Announcement 23 July 2020
JUNE 2020 QUARTERLY ACTIVITIES REPORT
7
Kalgoorlie Gold Operations
Production Summary Sep-19 Qtr Dec-19 Qtr Mar-20 Qtr Jun-20 Qtr FYTD
Kalgoorlie Operations
Ore Mined Tonnes 703,942 753,080 748,618 846,966 3,052,606
Mined Grade gpt Au 3.5 3.8 3.2 3.1 3.4
Ounces Mined Oz 78,714 90,724 77,067 83,720 330,225
Milled Tonnes Tonnes 743,532 793,862 887,021 974,046 3,398,461
Head Grade gpt Au 3.4 3.7 2.9 3.0 3.2
Recovery % 90 91 90 89 90
Gold Recovered Oz 73,860 86,356 74,598 83,945 318,759
Gold Sold Oz 73,616 87,150 77,425 79,057 317,248
Cost per Ounce
Mining A$/oz 814 645 798 774 755
Processing A$/oz 382 264 372 387 347
Site Services A$/oz 66 45 58 58 56
Ore Stock & GIC Movements A$/oz (111) 132 22 15 20
Royalties A$/oz 52 51 61 59 56
By Product Credits A$/oz (4) (3) (4) (5) (4)
Cash Operating Costs A$/oz 1,199 1,134 1,307 1,288 1,230
Rehabilitation - Accretion & Amortisation A$/oz 7 6 7 7 7
Corporate Overheads A$/oz 57 65 62 66 63
Mine Development / Sustaining CAPEX A$/oz 232 210 194 208 211
Kalgoorlie Operations Mine Exploration A$/oz 47 68 49 46 53
All-in Sustaining Costs A$/oz 1,542 1,483 1,619 1,615 1,564
Depreciation & Amortisation A$/oz 441 374 426 418 413
Table 8: Summary Details – Kalgoorlie Operations
Pogo Gold Operations
Production Summary Sep-19 Qtr Dec-19 Qtr Mar-20 Qtr Jun-20 Qtr FYTD
Pogo Operations
Ore Mined Tonnes 195,486 223,839 213,021 203,660 836,006
Mined Grade gpt Au 5.7 7.4 8.3 8.4 7.5
Ounces Mined Oz 35,883 53,339 56,571 54,925 200,718
Milled Tonnes Tonnes 200,123 221,990 208,306 203,084 833,503
Head Grade gpt Au 5.5 7.5 8.2 8.5 7.5
Recovery % 83 87 89 89 87
Gold Recovered Oz 29,468 46,146 49,340 49,353 174,307
Gold Sold Oz 28,961 45,051 48,773 50,251 173,036
Cost per Ounce
Mining A$/oz 1,162 842 897 723 877
Processing A$/oz 825 625 629 534 633
Site Services A$/oz 295 170 139 193 189
Ore Stock & GIC Movements A$/oz (58) 10 (68) 64 (8)
By Product Credits A$/oz (3) (2) (2) (2) (2)
Cash Operating Costs A$/oz 2,221 1,645 1,595 1,512 1,689
Rehabilitation - Accretion & Amortisation A$/oz 15 10 9 9 10
Corporate Overheads A$/oz 61 39 42 56 48
Mine Development / Sustaining CAPEX A$/oz 478 325 252 355 339
Pogo Mine Exploration A$/oz 23 - 6 10 8
All-in Sustaining Costs A$/oz 2,798 2,019 1,904 1,942 2,094
Depreciation & Amortisation A$/oz 441 391 442 426 424
Table 9: Summary Details - Pogo Operations
For
per
sona
l use
onl
y

ASX Announcement 23 July 2020
JUNE 2020 QUARTERLY ACTIVITIES REPORT
8
KCGM Gold Operations (50% ownership share)
Production Summary Mar-20 Qtr Jun-20 Qtr FYTD
KCGM Operations
Ore Mined – Underground Tonnes 145,948 182,802 328,750
Mined Grade gpt Au 2.5 2.4 2.5
Ounces Mined - Underground Oz 11,801 14,241 26,042
Ore Mined – Open Pit Tonnes 585,871 516,957 1,102,828
Mined Grade gpt Au 1.6 1.1 1.4
Ounces Mined – Open Pit Oz 29,861 18,323 48,184
Total Mined Ounces Oz 41,662 32,564 74,226
Milled Tonnes Tonnes 1,552,814 1,656,488 3,209,302
Head Grade gpt Au 1.4 1.2 1.3
Recovery % 83 83 83
Gold Recovered Oz 58,564 53,397 111,961
Gold Sold – Pre-Production (1) Oz 7,600 6,245 13,845
Gold Sold – Production Oz 52,604 49,375 101,980
Gold Sold – Total Oz 60,204 55,621 115,825
Cost per Ounce
Underground Mining A$/oz 130 146 138
Open Pit Mining A$/oz 185 141 164
Processing A$/oz 706 623 666
Site Services A$/oz 68 90 79
Royalties A$/oz 67 71 69
Ore Stock & GIC Movements A$/oz 765 577 653
less: Movements in acquired gold inventory (2), (3) A$/oz (640) (496) (550)
By Product Credits A$/oz (4) (6) (5)
Cash Operating Costs A$/oz 1,277 1,146 1,214
Rehabilitation - Accretion & Amortisation A$/oz 14 6 10
Corporate Overheads A$/oz 63 68 65
Mine Development / Sustaining CAPEX A$/oz 98 180 138
All-in Sustaining Costs A$/oz 1,452 1,400 1,427
Depreciation & Amortisation (3) A$/oz 346 287 293
(1) Mining activity and sales from Morrison pit are considered in pre-production phase with costs associated excluded from cash cost and AISC metrics. All associated costs and revenues are capitalised
as non-sustaining capital until commercial production is reached. (2) A provisional fair value of A$449.4 million was attributed to non-ROM ore stockpiles on acquisition of 50% of KCGM, which at acquisition contained an estimated 1.57 million ounces (NST share).
The fair value attributed to these stockpiles is not included in Cash Operating Costs and All-in Sustaining Costs, however the inventory movement associated has been disclosed. (3) Purchase price accounting for the 50% acquisition of KCGM remains provisional.
Table 10: Summary Details - KCGM Operations
Additional information on the individual operations can be found in Appendix 1.
EXPLORATION AND DEVELOPMENT - OPERATIONS
Northern Star’s in-mine drilling activity was maintained across the Australian Operations with Pogo in-mine drilling activity reflecting the impact of COVID-19 related travel restrictions.
Jundee
The Jundee underground diamond drill fleet maintained a high level of operating performance with increased focus on exploration drilling programs across all mine areas.
Resource extension drilling within the existing Gateway, Deakin (North and South), Upper Armada, Nexus, Moneyline, and Revelation systems with strong results recorded in extensions to the Revelation and Deakin areas.
Exploration drilling programs were focussed in the northern portion of the mine corridor within the “Invicta Gap” area (Clovis, Cardassian, Deakin South), the Atlantis area and the Cook-Griffin trend. Excellent results continued to be recorded from the southern areas of the Invicta Gap while early results from the Cook-Griffin area are encouraging.
For
per
sona
l use
onl
y

ASX Announcement 23 July 2020
JUNE 2020 QUARTERLY ACTIVITIES REPORT
9
Kanowna Belle
Underground diamond drilling remained focussed across the upper levels of the Kanowna Belle Mine with an emphasis on the hanging wall Sims and Troy systems.
Extensional drilling in the hanging wall of the main Lowes ore system continues to outline strongly mineralised structures on the Sims and Troy trends across B and C Block areas of higher vein intensity presenting potential bulk mining opportunities.
Kundana
Underground diamond drilling focussed on the definition and extension of the Pope John, Moonbeam and Xmas deposits during the quarter with all results within expectations.
EKJV (NST 51%)
Underground diamond drilling from Pegasus and Raleigh continued the extensional and in-fill resource definition programs into the new Falcon trend with continued success. Underground development from the Pegasus infrastructure successfully intersected the Falcon mineralised corridor during the quarter. Initial development and grade control programs commenced late in the quarter in preparation for trial stoping next quarter.
Exploration drilling the Startrek prospect, located in the footwall to the Rubicon Mine sequence, continued during the quarter.
South Kalgoorlie
The in-mine underground resource definition drilling program continued across the quarter confirming the NOZ trend down plunge and expanding additional mineralised surfaces in the footwall of the NOZ system.
Pogo
Underground diamond drilling activity continued within the mine area with a reduced capacity across the quarter due to COVID-19 related restrictions.
Underground drilling remained focussed on in-fill and reserve definition drilling across all the major producing areas with results generally within expectations. In addition, excellent intersections were recorded from numerous unmodelled structures, particularly the Liese “LQ” area, Leise 2 and North Zone areas, providing possible extensions to the known systems.
KCGM (NST 50%)
Across the quarter, underground resource definition drilling programs continued at Mount Charlotte targeting the Hidden Secret, Kal East and Belgravia areas. In-mine exploration drilling from the Sam Pearce decline into the Mount Ferrum area continued to intersect multiple mineralised surfaces.
Surface diamond drilling continued during the quarter with a single rig completing resource definition programs at Brownhill and Fimiston South areas. In addition, a surface RC resource definition drilling program was were completed at Fimiston South (in-pit) with resource extension drilling programs completed at Brownhill and Croesus areas adjacent to the northern limits of the open pit environs.
Short surface RC exploration drilling programs were also undertaken during the quarter at the regional Josephine, Two Up and Lakeside prospects.
REGIONAL EXPLORATION
Regional exploration activity remained largely suspended for the quarter in line with regulatory and Northern Star internal COVID-19 protocols with staff continuing to work offsite or redeployed into active operations. Regional exploration field activities will progressively resume in most areas across the next quarter.
Jundee - Yandal
All regional exploration was suspended due to COVID-19 restrictions. Planning for resource definition and regional reconnaissance exploration programs across the newly acquired Bronzewing tenure continued.
For
per
sona
l use
onl
y

ASX Announcement 23 July 2020
JUNE 2020 QUARTERLY ACTIVITIES REPORT
10
Kanowna
All regional exploration was suspended due to COVID-19 restrictions.
Pogo
All surface exploration at Pogo was suspended due to COVID-19 restrictions.
South Kalgoorlie
All regional exploration was suspended due to COVID-19 restrictions.
Carbine
Late in the quarter, a short surface RC resource definition drilling program was completed at the Paradigm deposit as part of ongoing feasibility studies. Visual drilling results confirmed the geological model with all assay results pending.
Central Tanami Project (NST 40%)
No significant exploration undertaken due to COVID-19 restrictions. The CTP camp was utilised by NT Police, Australian Defence Force and Australian Federal Police personnel as part of the enforced COVID-19 border checkpoint and Tanami Road patrols.
Tanami Regional Project (100% NST)
No significant exploration undertaken due to COVID-19 restrictions.
Western Tanami
No significant exploration undertaken due to COVID-19 restrictions.
CORPORATE
▪ On 11 February 2020 the Company declared an interim dividend of A7.5 cents per share with a record date of 9 March 2020 payable on 30 March 2020. As part of the Company’s fiscal response to the COVID-19 pandemic, on 26 March 2020 the Company deferred payment of the interim dividend to 27 October 2020 as a cash preservation measure to ensure the Company was in the strongest possible financial position to respond to COVID-19 and the subsequent global financial impact. The Company paid the interim dividend on 16 July 2020.
▪ During March 2020 due to the impact of COVID-19 on company priorities, Newmont agreed a 30 day extension to NST’s exclusivity period under the US$25 million conditionally refundable option to acquire the Newmont power business which supplies power to KCGM, announced on 17 December 2019. As a result of further discussions on value with Newmont, the Company allowed the option to lapse during the June quarter. KCGM is continuing to consider future power supply for the KCGM operations.
▪ On 18 June 2020, the Company executed a Tenement Sale Agreement for the sale of the Mt Olympus Project to Kalamazoo Resources Limited subject to conditions including third party rights and approvals.
▪ On 13 July 2020, the Company completed a Tenement Sale Agreement dated 10 July 2020 for the purchase of two Lake Carnage tenements from St Barbara Limited.
▪ On 20 July 2020, the Company executed a Tenement Purchase Agreement for the purchase of an 80% interest in the Mt Clement Project from Artemis Resources Limited, resulting in the Company’s 100% ownership of the Mt Clement Project.
▪ On 26 June 2020, 102,258 ordinary fully paid shares were issued to eligible employees for nil consideration in accordance with the Company’s 2017 Employee Share Plan and will be held in voluntary escrow for three years or until cessation of employment (whichever is earlier).
▪ On 13 July 2020, 18,560 Share Rights were awarded to the Company’s Non-Executive Directors as part of their FY21 remuneration, vesting on 30 June 2021, in accordance with the Company’s FY20 Non-Executive Directors’ Share Plan.
For
per
sona
l use
onl
y
ASX Announcement 23 July 2020
JUNE 2020 QUARTERLY ACTIVITIES REPORT
11
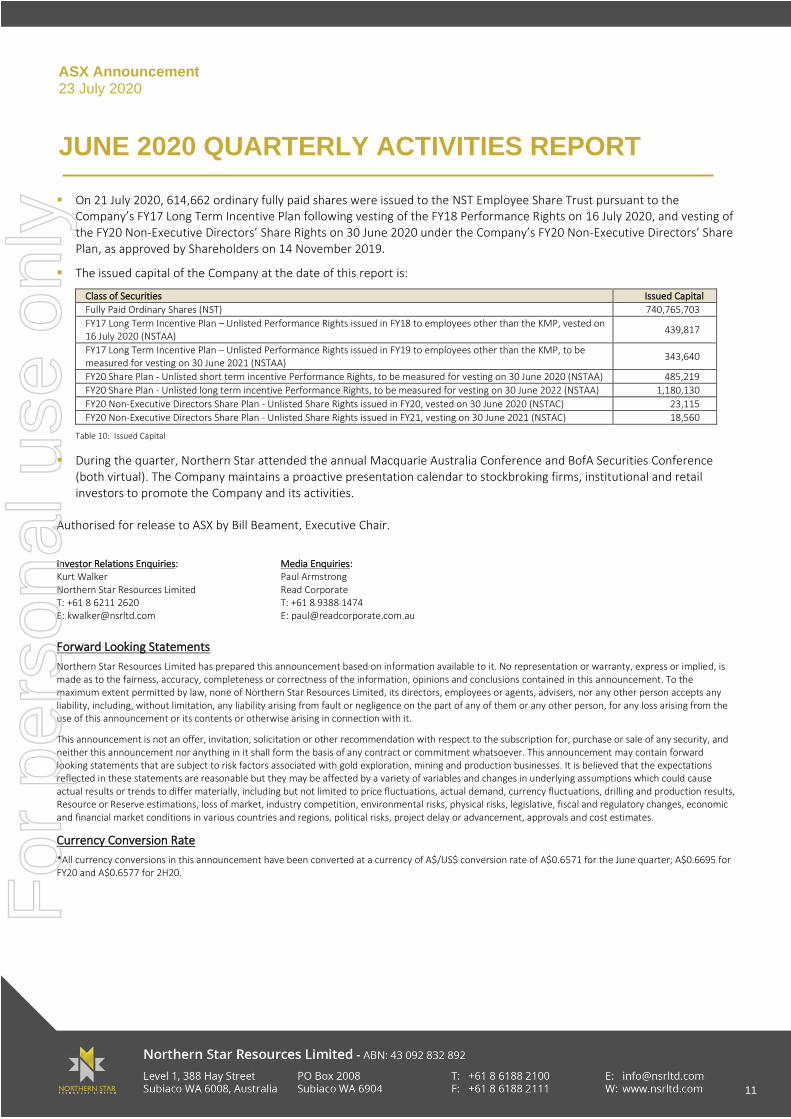
▪ On 21 July 2020, 614,662 ordinary fully paid shares were issued to the NST Employee Share Trust pursuant to the Company’s FY17 Long Term Incentive Plan following vesting of the FY18 Performance Rights on 16 July 2020, and vesting of the FY20 Non-Executive Directors’ Share Rights on 30 June 2020 under the Company’s FY20 Non-Executive Directors’ Share Plan, as approved by Shareholders on 14 November 2019.
▪ The issued capital of the Company at the date of this report is:
Class of Securities Issued Capital
Fully Paid Ordinary Shares (NST) 740,765,703
FY17 Long Term Incentive Plan – Unlisted Performance Rights issued in FY18 to employees other than the KMP, vested on 16 July 2020 (NSTAA)
439,817
FY17 Long Term Incentive Plan – Unlisted Performance Rights issued in FY19 to employees other than the KMP, to be measured for vesting on 30 June 2021 (NSTAA)
343,640
FY20 Share Plan - Unlisted short term incentive Performance Rights, to be measured for vesting on 30 June 2020 (NSTAA) 485,219
FY20 Share Plan - Unlisted long term incentive Performance Rights, to be measured for vesting on 30 June 2022 (NSTAA) 1,180,130
FY20 Non-Executive Directors Share Plan - Unlisted Share Rights issued in FY20, vested on 30 June 2020 (NSTAC) 23,115
FY20 Non-Executive Directors Share Plan - Unlisted Share Rights issued in FY21, vesting on 30 June 2021 (NSTAC) 18,560
Table 10: Issued Capital
▪ During the quarter, Northern Star attended the annual Macquarie Australia Conference and BofA Securities Conference (both virtual). The Company maintains a proactive presentation calendar to stockbroking firms, institutional and retail investors to promote the Company and its activities.
Authorised for release to ASX by Bill Beament, Executive Chair.
Investor Relations Enquiries: Kurt Walker Northern Star Resources Limited T: +61 8 6211 2620 E: [email protected]
Media Enquiries: Paul Armstrong Read Corporate T: +61 8 9388 1474 E: [email protected]
Forward Looking Statements
Northern Star Resources Limited has prepared this announcement based on information available to it. No representation or warranty, express or implied, is made as to the fairness, accuracy, completeness or correctness of the information, opinions and conclusions contained in this announcement. To the maximum extent permitted by law, none of Northern Star Resources Limited, its directors, employees or agents, advisers, nor any other person accepts any liability, including, without limitation, any liability arising from fault or negligence on the part of any of them or any other person, for any loss arising from the use of this announcement or its contents or otherwise arising in connection with it.
This announcement is not an offer, invitation, solicitation or other recommendation with respect to the subscription for, purchase or sale of any security, and neither this announcement nor anything in it shall form the basis of any contract or commitment whatsoever. This announcement may contain forward looking statements that are subject to risk factors associated with gold exploration, mining and production businesses. It is believed that the expectations reflected in these statements are reasonable but they may be affected by a variety of variables and changes in underlying assumptions which could cause actual results or trends to differ materially, including but not limited to price fluctuations, actual demand, currency fluctuations, drilling and production results, Resource or Reserve estimations, loss of market, industry competition, environmental risks, physical risks, legislative, fiscal and regulatory changes, economic and financial market conditions in various countries and regions, political risks, project delay or advancement, approvals and cost estimates.
Currency Conversion Rate
*All currency conversions in this announcement have been converted at a currency of A$/US$ conversion rate of A$0.6571 for the June quarter; A$0.6695 for FY20 and A$0.6577 for 2H20.
For
per
sona
l use
onl
y

ASX Announcement 23 July 2020
JUNE 2020 QUARTERLY ACTIVITIES REPORT
12
APPENDIX 1 – ADDITIONAL INFORMATION - OPERATIONS
Jundee Gold Operations
Safety
There were zero Lost Time Injuries during the quarter.
Underground Production
Mine Development:
Sep-19 Qtr Dec-19 Qtr Mar-20 Qtr Jun-20 Qtr
Decline 334m 460m 478m 189m
Level 963m 1,149m 1,076m 718m
Operating 3,461m 3,768m 3,603m 4,045m
Total (metres) 4,758m 5,377m 5,157m 4,952m
Table 1: Underground Production – Mine Development
Decline development continued in the Revelation, Lower Gringotts, Deakin South and Moneyline mining areas. Capital development continued through the Nimary, Gateway, Gringotts, West Side South, West Side North, Deakin South, Deakin North, Nexus and Wilson mining areas.
Sep-19 Qtr Dec-19 Qtr Mar-20 Qtr Jun-20 Qtr Development ore (t) 159,292 160,703 154,052 176,466
Development grade (gpt) 3.7 3.2 3.0 6.0
Stope ore (t) 380,934 364,550 376,826 407,600
Stope grade (gpt) 5.8 5.4 3.8 3.9
Total ore (t) 540,226 525,253 530,878 584,066
Total grade (gpt) 5.2 4.8 3.6 4.5
Contained gold (oz) 89,993 80,431 60,767 84,333 t=tonnes, gpt=grams per tonne, oz=ounces
Table 2: Underground Production – Ore Production
Open Pit Production
Open pit mining continued at Ramone, south of Jundee.
Mine Movements:
Sep-19 Qtr Dec-19 Qtr Mar-20 Qtr Jun-20 Qtr
Waste Mined (BCM) 685,837 438,175 258,840 226,992
Ore Mined (BCM) 127,733 144,881 117,925 134,127
Total Mine Movement (BCM) 813,570 583,056 376,765 361,119
Table 3: Open Pit Movement
Sep-19 Qtr Dec-19 Qtr Mar-20 Qtr Jun-20 Qtr Total Ore (t) 302,093 339,961 299,433 342,279
Total Grade (gpt) 1.6 1.5 1.5 1.6
Contained gold (oz) 15,272 16,513 14,332 17,865 t=tonnes, gpt=grams per tonne, oz=ounces
Table 4: Open Pit Production – Ore Mined
Gold Production
Jundee ore milled in the June quarter was 638,733 tonnes at 4.3gpt and 92% recovery for 80,666oz produced.
Ore stocks at the end of the quarter totalled 83,491oz of gold, with a further 9,895oz in GIC.
Gold Sales
77,788oz were sold.
Kalgoorlie Gold Operations
Introduction
Kalgoorlie Gold Operations consist of the Kundana, EKJV (East Kundana Joint Venture), Kanowna Belle and HBJ (South Kalgoorlie) operations.
Safety
There was one Lost Time Injury during the quarter.
For
per
sona
l use
onl
y

ASX Announcement 23 July 2020
JUNE 2020 QUARTERLY ACTIVITIES REPORT
13
Underground Production
Mine Development:
Sep-19 Qtr Dec-19 Qtr Mar-20 Qtr Jun-20 Qtr
Decline 647m 1,435m 1,035m 1,374m
Level 3,230m 3,233m 2,772m 1,040m
Operating 4,064m 3,220m 4,257m 5,088m
Total (metres) 7,941m 7,888m 8,064m 7,502m
Table 5: Underground Production – Mine Development (physicals represent 100% share of EKJV development metres)
Development at the Kundana operation focussed on ore driving, along with both the Moonbeam and Pope John declines. Kanowna Belle’s focus remained on A and C-Block opportunities, along with development of D-Block East opportunity. Decline and level access is a priority in the NOZ area at HBJ. EKJV development focussed on the lower Pegasus decline and associated ore drives, along with continuation of both lower and upper Pode mining area.
Sep-19 Qtr Dec-19 Qtr Mar-20 Qtr Jun-20 Qtr
Development ore (t) 196,877 202,844 244,799 275,500
Development grade (gpt) 2.7 2.9 2.8 2.5
Stope ore (t) 507,065 550,236 503,818 571,465
Stope grade (gpt) 3.8 4.1 3.4 3.4
Total ore (t) 703,942 753,080 748,618 846,966
Total grade (gpt) 3.5 3.8 3.2 3.1
Contained gold (oz) 78,714 90,724 77,067 83,720
t=tonnes, gpt=grams per tonne, oz=ounces
Table 6: Underground Production – Ore Production (physicals represent Northern Star’s 51% share of JV ore)
Gold Production
A total of 974,046 tonnes of ore was milled in the June quarter at 3.0gpt and 89% recovery for 83,945oz produced utilising the Northern Star owned processing plants and additional contracted third-party facilities.
Ore stocks at the end of the quarter totalled 26,200oz of gold, with a further 15,960oz in GIC.
Gold Sales
79,057oz were sold.
Pogo Operations
Safety
There were no Lost Time Injuries during the quarter.
Underground Production
Mine Development:
Sept-19 Qtr Dec-19 Qtr Mar-20 Qtr Jun-20 Qtr
Decline 143m 123m 183m 521m
Level 1,157m 1,580m 1,194m 832m
Operating 2,619m 1,888m 2,066m 2,259m
Total (metres) 3,919m 3,591m 3,443m 3,612m
Table 7: Underground Production – Mine Development
Sep-19 Qtr Dec-19 Qtr Mar-20 Qtr Jun-20 Qtr
Development ore (t) 122,840 89,074 69,116 76,348 Development grade (gpt) 4.8 6.9 7.9 8.7 Stope ore (t) 72,647 134,764 143,905 127,312 Stope grade (gpt) 7.2 7.8 8.4 8.2
Total ore (t) 195,486 223,839 213,021 203,660
Total grade (gpt) 5.71 7.4 8.3 8.4
Contained gold (oz) 35,883 53,339 56,571 54,925 t=tonnes, gpt=grams per tonne, oz=ounces
Table 8: Underground Production – Ore Production
The operation continued to access new areas of the mine and maintained delivery of grade as seen in March quarter. The primary source areas were from the Liese, South Pogo, and North Zone/X Vein. Capital continued to be deployed into South Pogo, Liese and Fun Zone areas to further establish level access and diamond drill platforms.
For
per
sona
l use
onl
y

ASX Announcement 23 July 2020
JUNE 2020 QUARTERLY ACTIVITIES REPORT
14
The June quarter was further impacted by the protocol and processes implemented because of COVID-19. The focus for the quarter was still on ensuring the quality of the ore being extracted and continuing to improve efficiencies across the underground fleet. The processing plant focussed on maintaining the recovery improvement saw in the March quarter and ensuring processes were established to maintain and improve on this in the future.
Gold Production
Pogo ore milled in the June quarter was 203,084 tonnes at 8.5gpt and 89% recovery for 49,353oz produced.
There was a total of 3,767oz in GIC.
Gold Sales
50,251 oz were sold.
KCGM Operations (100%)
Safety
There were no Lost Time Injuries during the quarter.
Open Pit Production
Mine Movements:
Mar-20 Qtr Jun-20 Qtr
Waste Mined (t) 5,474,319 8,488,711
Ore Mined (t) 1,171,741 1,033,914
Total Mine Movement (t) 6,646,060 9,522,625
Table 9: Open Pit Movement
Mar-20 Qtr Jun-20 Qtr Total Ore (t) 1,171,741 1,033,914
Total Grade (gpt) 1.6 1.1
Contained gold (oz) 59,721 36,645 t=tonnes, gpt=grams per tonne, oz=ounces
Table 10: Open Pit Production – Ore Mined
Ore production for the quarter was sourced from the Golden Pike, Morrison and Brownhill areas of the open pit. KCGM open pit material movement increased by in excess of 40% in the June quarter over the previous quarter as focus turned to expanding the available open pit mining fronts.
Underground Production (Mt Charlotte)
Mine Development:
Mar-20 Qtr Jun-20 Qtr
Decline 0m 64m
Level 49m 66m
Operating 993m 1,192m
Total (metres) 1,042m 1,322m
Table 11: Underground Production – Mine Development
Mar-20 Qtr Jun-20 Qtr Total ore (t) 291,897 365,603
Total grade (gpt) 2.5 2.4
Contained gold (oz) 23,556 28,483 t=tonnes, gpt=grams per tonne, oz=ounces
Table 12: Underground Production – Ore Production
Underground ore production was sourced from the Mt Charlotte and Hidden Secret areas, with multiple work areas separated vertically through the mine allowing for good load and haul productivities. Mined tonnes from underground increased by 25% compared to the previous quarter.
Gold Production (50%)
Ore milled in the June quarter was 1,656,488 tonnes at 1.2gpt and 83% recovery for 53,397oz produced.
There was a total of 10,557oz in GIC.
Gold Sales (50%)
Northern Star’s gold sales were 55,621oz.
For
per
sona
l use
onl
y