recovery of molecules with healthy properties from orange
TRANSCRIPT
Recovery of molecules with healthy
properties from orange press liquor by
membrane fractionation
PhD Dissertation by
René Ruby-Figueroa
Supervisors
Prof. Bartolo Gabriele Department of Pharmaceutical Sciences
Faculty of Pharmacy, Nutritional and Health Sciences
University of Calabria
Dr. Alfredo Cassano National Research Council
Institute on Membrane Technology
(ITM-CNR)

ii


iv

v
Dedicated to my Family

vi
vii
SUMMARY
Fruits and vegetables are widely recognized as an important source of beneficial
compounds for the human nutrition. Citrus and juices are widely consumed in the
world. Their health benefits have been recognized for a long time now since first
cultivated in Asia. The market of oranges is growing constantly, because consumers
have become more convenience-oriented and health conscious. Consequently, efforts by
researchers and industrial organizations have been made to develop processes more
efficient, putting emphasis in food quality and safety. In addition, with the increasing
emphasis on water pollution control, industries are establishing programs that will
permit disposal of their wastewater without damaging the environment. The citrus fruit
industry is no exception. Citrus wastes, such as wet peels and whole rejected fruit,
which a great amount of organic matter that can be associated with environmental and
health problems due to water runoff and uncontrolled fermentation. Therefore, the
development of optimized systems for the treatment of citrus wastes is a crucial factor
in the rationalization of the traditional industrial cycle.
Membrane operations in the last years have shown their potentialities in the
rationalization of production systems. Their intrinsic characteristics of efficiency,
operational simplicity and flexibility, relatively high selectivity and permeability for the
transport of specific components, low energy requirements, good stability under a wide
spectrum of operating conditions, environment compatibility, easy control and scale-up
have been confirmed in a large variety of applications and operations in the food
industry.
Recent R&D efforts aim to convert the potential of wastes into profitable products
creating new segments of production and offsetting the disposal costs. Orange peels and
pulp contain several bioactive compounds, such as flavonoids and phenolic acids,
recognized for their beneficial implications in human health due to their antioxidant
activity and free radical scavenging ability. These semi-solid wastes can be pressed to
obtain a liquid rich in soluble sugars, named press liquor, that can be concentrated up to
citrus molasses grade or alternatively exploited as a natural source for the extraction of

viii
phenolic compounds which can be used as natural antioxidants mainly in
pharmaceutical, cosmetic and foods industry.
This PhD dissertation is based on the opportunity to develop a technical alternative to
solve some problems related to the disposal of citrus wastes from an economic and
environmental point of view, specifically in terms of recovery of attractive compounds
present in orange press liquor. The general aim of the work was devoted to the recovery
of phenolic compounds by using an integrated membrane process, in which
microfiltration (MF) or ultrafiltration (UF), nanofiltration (NF) and osmotic distillation
(OD) processes were involved.
MF or UF processes were used for the clarification of the press liquor in order to
separate macromolecules, such as pectins, and to obtain a clarified press liquor as
permeate stream. In the second step the clarified press liquor obtained from the MF/UF
process was treated by NF in order to obtain a retentate stream enriched in phenolic
compounds with a low content of sugars. Finally, OD was used as final step to
concentrate the NF retentate stream.
In the first Chapter, a general overview of membrane operations, including
methodologies to evaluate their performance, is reported. The industrial transformation
of citrus fruits and the associated production of citrus wastes is reported in Chapter 2. In
this Chapter the chemico-physical characterization of citrus press liquor used for the
experimental activities performed on membrane laboratory plants is also included.
Chapter 3 is focused on the experimental activities concerning the clarification of citrus
press liquor by using MF or UF processes. In Chapter 4 the fractionation of clarified
press liquor by using NF membranes is analysed and discussed. Experimental activities
related to the concentration of the NF retentate by using OD are described in Chapter 5

ix
ACKNOWLEDGEMENT
I would like to express my deepest appreciation to my direct supervisor Dr. Alfredo
Cassano for the useful comments, remarks and engagement through the learning process
of this doctoral thesis. Furthermore, I would also like to thank my supervisor Prof.
Bartolo Gabriele for the support on the way to obtaining my goals. Without their
guidance and persistent help this dissertation would not have been possible.
I would also like to thank the Ministero dell`Istruzione, dell`Università e della Ricerca
(MIUR) for their financial support granted through my doctoral fellowship. I would also
like to thank the Institute on Membrane Technology (ITM-CNR) who gave me the
space to develop my research.
A special thanks to Dr. Alessia Fazio, Dr. Monica Nardi and Dr. Pierluigi Plastina who
helped me in some of the analytical measurements. I appreciated the camaraderie of the
members of the ITM-CNR group; Carmela Conidi, Fitim Destani, Sabrina Prete, and
Serena Russo and many more, who contributed immensely to my personal and
professional growth during my time at University of Calabria.
I would like to thank my family, Monica Figueroa, Natalia Ruby, René Ruby,
Ana Alvear, and Nicolas for their endless love and support, despite the long distance. I
would also like to thank my partner, Maria Muro, for her love, kindness, and support
she has shown during my PhD studies.
Lastly, my time at UNICAL was made enjoyable in large part due to the many friends
that became a big part of my life. I would like to thank the friendship and support given
to me by Luciano Marquez, Alejandra Noriega and Ana Lucia Acevedo.
René Ruby-Figueroa
University of Calabria
November 2013

x

xi
INDEX
Summary…………...………………………………………………………………… vii
Acknowledgement………………………………………………………………….. ix
Chapter 1 Fundamentals of membrane separation processes………………..... 1
1.1 Membranes and Membrane Processes………………………………………... 1
1.2 Membrane materials…………………………………………………………… 2
1.3 Membrane structure…………………………………………………………… 4
1.4 Process design and operation………………………………………………….. 7
1.4.1 Membrane modules……………………………………………………… 7
1.4.2 Filtration methods……………………………………………………….. 10
1.4.3 Process configuration……………………………………………………. 12
1.5 Membrane performance……………………………………………………….. 13
1.5.1 Membrane rejection and volume reduction factor………………………. 14
1.5.2 Transport mechanisms…………………………………………………... 14
1.5.3 Concentration Polarization and membrane fouling……………………... 17
References……………………………………………………………………………... 23
Chapter 2 Citrus fruit processing and orange press liquor characterization… 27
2.1 Citrus fruits: properties and global market …………………………..……... 27
2.2 Citrus processing…………..…………………………………………………… 29
2.3 Press liquor characterization………………………………………………….. 33
2.3.1 Analysis of phenolic compounds………………………………………... 33
2.3.2 Analysis of Sugars……..………………………………………………... 34
2.3.3 Determination of total phenols content………………………….………. 34
2.3.4 Determination of the total antioxidant activity (TAA)………….………. 35
2.3.5 Analytical results………………………………………………………… 35
References…………………….……………………………………………………….. 38
Chapter 3 Orange press liquor clarification.……………………………………. 43
3.1 Clarification of orange press liquor: Evaluation of membrane
characteristics.......................................................................................................
44
3.2 Clarification of orange press liquor: Evaluation of operating conditions….. 49
3.2.1 Optimization of multiple responses……………………………………... 70
3.3 Clarification of orange press liquor: UF with tubular PS membrane……… 71
References……………………………………………………………………………... 75

xii
Chapter 4 Fractionation of clarified press liquor….………….……..……. 77
4.1 Introduction…………………………………………………………………….. 77
4.2 Nanofiltration with flat-sheet membranes……………………………………. 78
4.3 Nanofiltration with a spiral-wound membrane module……………………... 86
References……………………………………………………………………………... 90
Chapter 5 Concentration of NF retentate by osmotic distillation……………... 93
5.1 Introduction…………………………………………………………………….. 93
5.2 Experimental results…………………………………………………………… 97
References……………………………………………………………………………... 101
Conclusions……………............................................................................................... 103
Annex…………………………………………………………………………………. 105
xiii
List of Tables
1.1 Materials used for the manufacture of membranes……………………………… 3
1.2 Characteristics of different membrane modules………………………………… 10
2.1 Physico-chemical characteristics of raw orange press liquor…………………… 36
3.1 Agents used in the conventional fruit juice clarification………………………... 44
3.2 Characteristics of selected membranes………………………………………….. 46
3.3 Experimental range and levels of the independent variables for Box-Behnken
design……………………………………………………………………………. 51
3.4 Experimental design and results of Box-Behnken design……………………….. 52
3.5 Plot of residuals against predicted response of TAA in the permeate stream…… 71
3.6 Results obtained during UF of orange press liquor by using tubular PS
membrane………………………………………………………………………... 74
4.1 Characteristics of flat-sheet NF membranes…………………………………….. 80
4.2 Analytical determination of hesperidin and sugars in samples coming from the
treatment of clarified orange press liquor with flat-sheet membranes…………... 84
4.3 Properties of 2.5 x 40 in. spiral-wound NF-PES-10 membrane………………… 86
4.4 Results of hesperidin and sugars rejection obtained with the NF-PES-10
membrane. Operating conditions: TMP=17 bar, T=20.73±1.40°C……………... 89
5.1 Characteristics of Liqui-Cell Extra-Flow membrane contactor…………………. 96

xiv
List of Figures
1.1 Cross section of: (a) cellulose acetate asymmetric flat sheet membrane; (b)
polyamide hollow fibre asymmetric membrane………………………………… 5
1.2 Filtration capability of pressure-driven membrane operations………...……….. 6
1.3 Schematic representation of (a) plate and frame, (b) spiral-wound, (c) tubular,
(d) hollow fiber membrane module………………………………...…………… 8
1.4 Schematic representation of (a) dead-end and (b) cross-flow filtration…...……. 11
1.5 Schematic diagram of (a) total recycle, (b) batch concentration, (c) feed-and-
bleed and (d) diafiltration configuration……...………………………………… 12
1.6 Schematic representation of concentration polarization (cw = gel
concentration; cb = bulk concentration)………………………………………… 18
1.7
Schematic representation of (a) complete blocking, (b) intermediate blocking,
(c) cake filtration and (d) standard blocking in pressure-driven membrane
processes…………………………………………………………………………
19
2.1 Flowchart of industrial orange juice processing………………………………... 30
2.2
HPLC chromatogram of orange press liquor. black line at 280 nm (for
hydroxybenzoic acids and flavones) and pink line at 360 nm (for
hydroxycinnamic acids)…………………………………………………………
36
3.1
Schematic diagram of the experimental set-up: (1) feed tank; (2) feed pump;
(3,5) pressure gauges; (4) flat-sheet cell; (6) digital balance; (7) retentate valve;
(8) permeate tank; (9) thermometer……………………………………………..
45
3.2
Rejection of (a) sugar and (b) hesperidin obtained during MF-UF under TRC
and BC configuration using flat-sheet membranes. Operating conditions:
TMP= 1 bar, T= 25°C, feed flow rate= 185 L/h………………………………...
47
3.3
Time course of permeate flux for MF and UF processes using flat-sheet
membranes at TRC (a) and BCC (b). Operating conditions: TMP= 1 bar, T=
25°C, feed flow rate= 185 L/h…………………………………………………...
48
3.4 Scheme of UF experimental setup……………………………………………… 50
3.5 Standardized pareto chart for the permeate flux………………………………... 53
3.6 3D response surface with contour plot of permeate flux……………………….. 55
3.7 Plot of residuals against predicted response of permeate flux in the UF process. 56
3.8 Standardized Pareto chart for fouling index…………………………………….. 57
3.9 3D response surface with contour plot of fouling index………………………... 58
3.10 Plot of residuals against predicted response of fouling index…………………... 59
3.11 Plot of residuals against predicted response of blocking index………………… 60
3.12 Standardized Pareto chart for blocking index…………………………………... 61
3.13 3D response surface with contour plot of blocking index……………………… 62

xv
3.14 Plot of residuals against predicted response of total polyphenols rejection…….. 63
3.15 Standardized Pareto chart for total polyphenols rejection……………………… 64
3.16 3D response surface with contour plot for total polyphenols rejection………… 65
3.17 Standardized Pareto chart for TAA in the permeate stream……………………. 67
3.18 3D response surface with contour plot for TAA in the permeate stream……….. 68
3.19 Plot of residuals against predicted response of TAA in the permeate stream…... 70
3.20 Experimental set-up used for the clarification of raw press liquor by UF……… 72
3.21 Time course of permeate flux for press liquor with PS ultrafiltration membrane
of 100kDa, operating conditions: T=21.31±0.23°C; TMP = 1.2 bar)…………... 73
3.22 Samples coming from the UF treatment of orange press liquor………………... 73
4.1 Experimental set-up used for the NF with flat-sheet membranes………………. 78
4.2 Hydraulic permeability of NF membranes studied. Operating conditions:
Temperature=26.79±1.72°C, Qf=500 L/h………………………………………. 81
4.3
NF of clarified orange press liquor with flat-sheet membranes. Time course of
permeate flux. Operating conditions: TMP=17 bar; T=31.25±0.56°C; Qf=500
L/h……………………………………………………………………………….
82
4.4 Time course for NF process using flat-sheet membranes. Operating conditions:
35 bar; T=37.56±0.78°C and Qf=500 L/h………………………………………. 83
4.5 Experimental set-up used for the NF of clarified orange press liquor with a
spiral-wound membrane module………………………………………………... 85
4.6 Time course of NF process with NF-PES-10 spiral wound membrane.
Operating conditions: TMP=17 bar, T=20.73±1.40°C…………………………. 87
4.7 Time course of NF process with NF-PES-10 spiral wound membrane.
Operating conditions: TMP=17 bar, T=20.73±1.40°C…………………………. 88
5.1 Schematic representation of water vapour flux through an OD membrane…….. 94
5.2 Schematic diagram of OD experimental set-up………………………………… 95
5.3 Treatment of NF retentate by OD. Time course of (a) evaporation flux and TSS
content; (b) calcium chloride dehydrate concentration…………………………. 98
5.4 Evolution in concentration of hesperidin during OD…………………………… 99
5.5 Samples collected at different times during the concentration of the NF
retentate by OD…………………………………………………………………. 100
5.6 Conceptual process design for the treatment of citrus press liquor based on an
integrated membrane process…………………………………………………… 100

xvi

1
CHAPTER 1
Fundamentals of membrane separation processes
1.1 Membranes and Membrane Processes
The first commercial production of microporous membranes on small scale started in
1930 together with the first practical application of ion-exchange membranes and the
development of the theory on ionic transport through charged membranes [1]. However,
until the late 1960s membranes were used in a few laboratory and analytical
applications, but not for industrial applications because they were too slow, too
expensive and too unselective. The seminal discovery that transformed membrane
separation from a laboratory to an industrial process was the development of defect-free
ultrathin cellulose acetate membranes by Loeb-Sourirajan process in the 1960s [2,3].
Actually the situation is different because membranes are more robust, modules and
equipment are better designed and costs have come down significantly, partly because
of the maturing technology and partly because of competition from an increasing
number of membrane suppliers and original equipment manufacturers [4]. Membrane
technology is presently an established part of several industrial processes to produce
drinking water from the sea, to clean industrial effluents and recover valuable
constituents, to concentrate, purify, or fractionate macromolecular mixtures in the food
and drug industries, and to separate gases and vapours [5]. Membrane separation
technologies have attracted much attention in the food industries over recent decades as
low energy processes providing a gentle treatment of the products at low-moderate
temperatures and covering steps such as separation, fractionation, concentration,
purification and clarification of various streams.
Membrane processes are guided by four major driving forces such as temperature,
activity, electrical potential, and hydrostatic pressure gradients. Major applications of
membrane processes in the food industry are related with pressure-driven processes,
such as microfiltration (MF), ultrafiltration (UF), nanofiltration (NF) and reverse
CHAPTER 1
2
osmosis (RO). These processes are based on the use of a permselective barrier through
which fluids and solutes are selectively transported when a hydrostatic pressure is
applied across it. As a result, the feed solution is converted in a permeate containing all
the components which have permeated the membrane and a retentate containing all the
compounds rejected by the membrane. In addition, a relatively new process, called
osmotic distillation (OD), where the driving-force is a vapour pressure gradient between
two sides of a hydrophobic membrane, has gained the attention for concentrating liquid
foods because it works under normal pressure and temperature conditions, preserving
the nutritious characteristics of the food [6].
The first section of this chapter will provide an overview on materials and structures of
synthetic membranes. The last section is focused on membrane design and evaluation of
membrane performance.
1.2 Membrane materials
A large variety of synthetic membranes has been reported in scientific and patent
literature. The differences may be caused by material partitioning during membrane
formation or by some selected surface postformation treatments. Membrane chemistry
determines important properties as hydrophilicity or hydrophobicity, presence or
absence of ionic charges, chemical and thermal resistance, binding affinity for solutes or
particles, biocompatibility, etc. [4,5].
Membrane materials must be chemical resistant to both feed and cleaning solutions,
mechanically and thermally stable, and characterised by high selectivity and
permeability.
The materials used for the preparation of membranes can be synthetic polymers,
cellulose derivatives, ceramics, inorganic and metals; they may be neutral or carry
electrical charges. Although over 130 materials have been used to manufacture
membranes, only a few have achieved commercial status, and fewer still have to obtain
regulatory approval for use in food.

Fundamentals of membrane separation processes
3
A summary of typical materials suitable for pressure-driven membrane processes is
shown in Table 1.1.
Table 1.1. Materials used for the manufacture of membranes.
Material Processes
Alumina MF
Carbon-carbon composites MF
Cellulose esters (mixed) MF
Cellulose nitrate MF
Polyamide, aliphatic (e.g., nylon) MF
Polycarbonate (track-etch) MF
Polyester (track-etch) MF
Polypropylene MF
Polytetrafluoroethylene (PTFE) MF
Polyvinyl chloride (PCV) MF
Polyvinylidene fluoride (PVDF) MF
Sintered stainless steel MF
Cellulose (regenerated) MF, UF
Ceramic composites (zirconia on alumina) MF, UF
Polyacrylonitrile (PAN) MF, UF
Polyvinyl alcohol (PVA) MF, UF
Polysulfone (PS) MF, UF
Polyethersulfone (PES) MF, UF, NF
Cellulose acetate (CA) MF, UF, RO
Cellulose triacetate (CTA) MF, UF, RO
Polyamide, aromatic (PA) MF, UF, NF, RO
Polyamide (PI) UF, RO
CA/CTA blends RO
Composites
(e.g., polyacrylic acid on zirconia or stainless steel) RO
Composites, polymeric thin film
(e.g., PA or polyetherurea on polysulfone) RO
Polybenzimidazole (PBI) RO
Polyetherimide (PEI) RO
CHAPTER 1
4
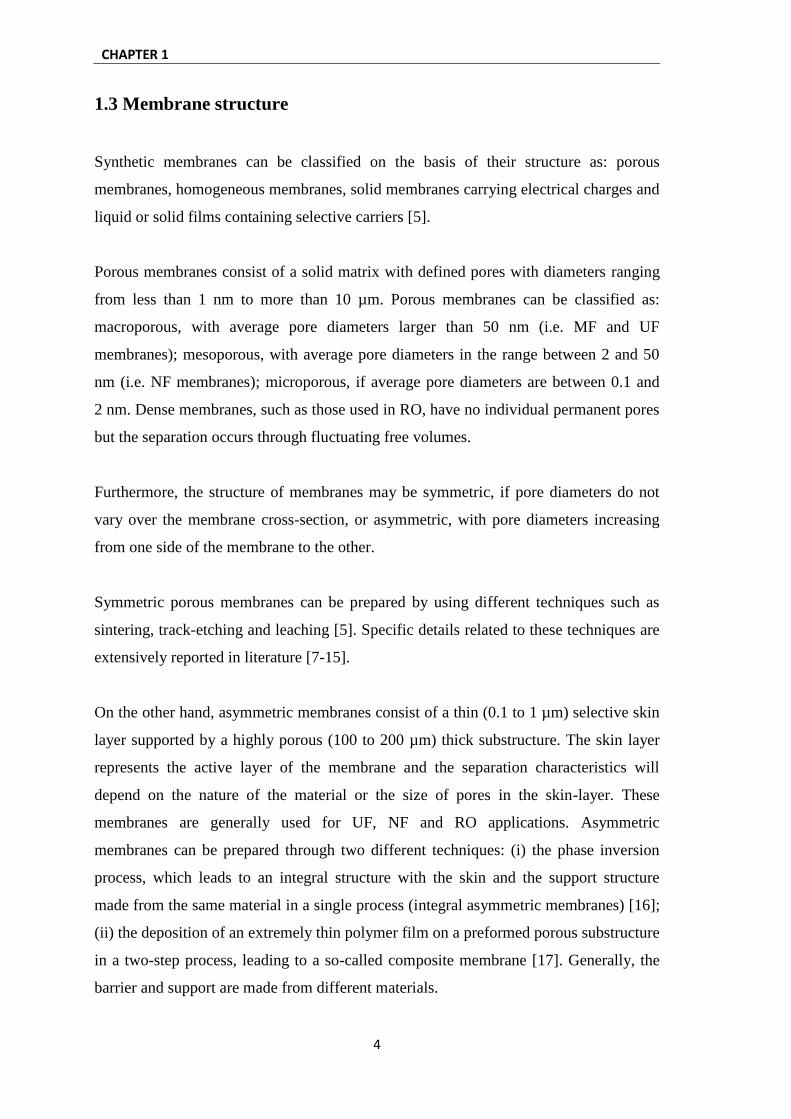
1.3 Membrane structure
Synthetic membranes can be classified on the basis of their structure as: porous
membranes, homogeneous membranes, solid membranes carrying electrical charges and
liquid or solid films containing selective carriers [5].
Porous membranes consist of a solid matrix with defined pores with diameters ranging
from less than 1 nm to more than 10 µm. Porous membranes can be classified as:
macroporous, with average pore diameters larger than 50 nm (i.e. MF and UF
membranes); mesoporous, with average pore diameters in the range between 2 and 50
nm (i.e. NF membranes); microporous, if average pore diameters are between 0.1 and
2 nm. Dense membranes, such as those used in RO, have no individual permanent pores
but the separation occurs through fluctuating free volumes.
Furthermore, the structure of membranes may be symmetric, if pore diameters do not
vary over the membrane cross-section, or asymmetric, with pore diameters increasing
from one side of the membrane to the other.
Symmetric porous membranes can be prepared by using different techniques such as
sintering, track-etching and leaching [5]. Specific details related to these techniques are
extensively reported in literature [7-15].
On the other hand, asymmetric membranes consist of a thin (0.1 to 1 µm) selective skin
layer supported by a highly porous (100 to 200 µm) thick substructure. The skin layer
represents the active layer of the membrane and the separation characteristics will
depend on the nature of the material or the size of pores in the skin-layer. These
membranes are generally used for UF, NF and RO applications. Asymmetric
membranes can be prepared through two different techniques: (i) the phase inversion
process, which leads to an integral structure with the skin and the support structure
made from the same material in a single process (integral asymmetric membranes) [16];
(ii) the deposition of an extremely thin polymer film on a preformed porous substructure
in a two-step process, leading to a so-called composite membrane [17]. Generally, the
barrier and support are made from different materials.

Fundamentals of membrane separation processes
5
Fig. 1.1 shows the cross section of asymmetric membranes in flat sheet and hollow fibre
configurations.
Fig. 1.1. Cross section of: (a) cellulose acetate asymmetric flat sheet membrane; (b)
polyamide hollow fibre asymmetric membrane.
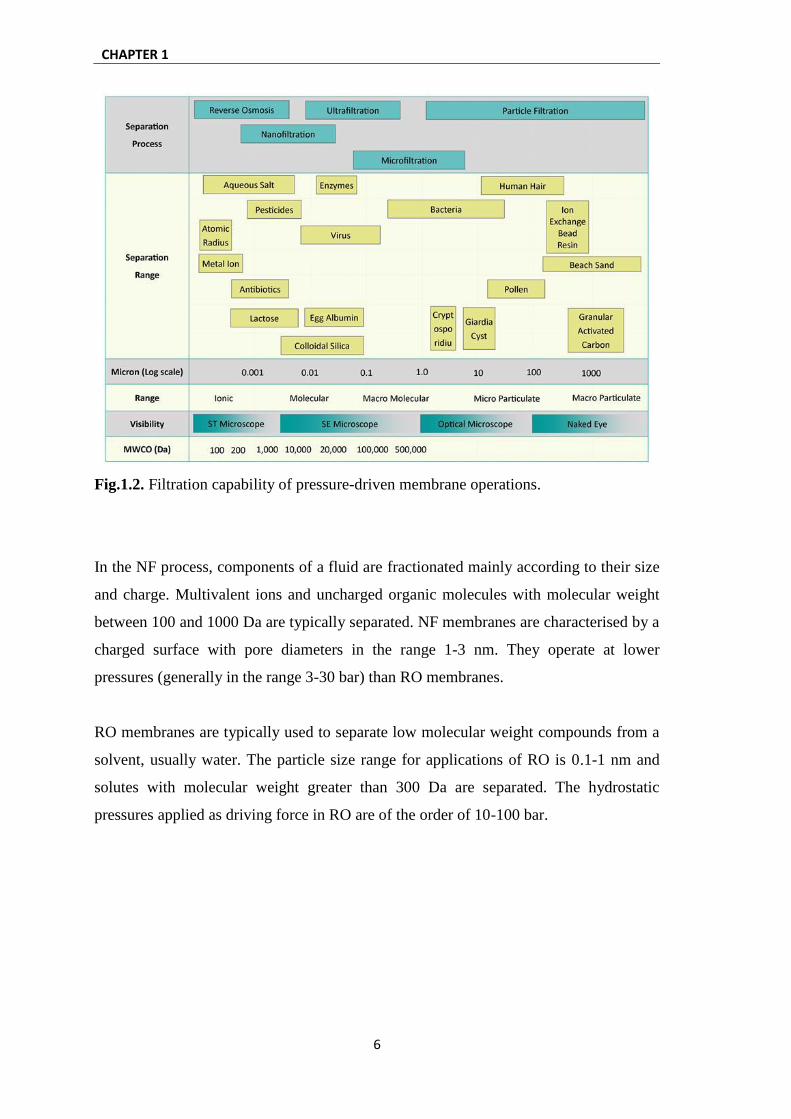
The filtration capability of pressure-driven membrane processes is shown in Fig. 1.2.
MF is used to separate particles with diameters of 0.1-10 m from a solvent or other
low molecular weight compounds. These particles are generally larger than those
separated by UF and RO. Consequently, the osmotic pressure for MF is negligible and
hydrostatic pressure differences used in MF are relatively small (in the range of 0.5-4
bar). UF is based on the use of asymmetric membranes with pore sizes in the skin layer
of 2-10 nm. Typically dissolved molecules or small particles not larger than 0.1 m in
diameter are retained. An UF membrane is typically characterized by its molecular
weight cut-off (MWCO), defined as the equivalent molecular weight of the smallest
species that exhibit 90% rejection. The MWCO of UF membranes is between 1 to 100
kDa. Hydrostatic pressures of 2-10 bar are typically used.
CHAPTER 1
6
Fig.1.2. Filtration capability of pressure-driven membrane operations.
In the NF process, components of a fluid are fractionated mainly according to their size
and charge. Multivalent ions and uncharged organic molecules with molecular weight
between 100 and 1000 Da are typically separated. NF membranes are characterised by a
charged surface with pore diameters in the range 1-3 nm. They operate at lower
pressures (generally in the range 3-30 bar) than RO membranes.
RO membranes are typically used to separate low molecular weight compounds from a
solvent, usually water. The particle size range for applications of RO is 0.1-1 nm and
solutes with molecular weight greater than 300 Da are separated. The hydrostatic
pressures applied as driving force in RO are of the order of 10-100 bar.

Fundamentals of membrane separation processes
7
1.4 Process design and operation
The selection of the most effective membrane for a specific application plays an
important role in determining the desired level of separation to be obtained. However,
for an efficient utilization of membranes the process design is equally important.
The process design is defined by different aspects concerning the membrane
configuration, filtration methods (dead-end and cross-flow configuration) and the
process configuration. It is also of importance for the control of concentration
polarization and fouling phenomena determining to a large extent the useful membrane
for a specific separation.
1.4.1 Membrane modules
The membrane module concept denotes the device where the membrane must be
installed to perform the separation process. On large industrial scale, membrane
modules are available in six basic designs: cartridge, hollow fibre, spiral-wound,
tubular, plate-and-frame and capillary. They are quite different in their design, mode of
operation, production costs and energy requirement for pumping the feed solution
through the module.
Pleated cartridge modules are used mainly in dead-end microfiltration; they consist of a
pleated membrane cartridge installed in a pressurized housing. These systems are
operated at relatively low pressures of 1 to 2 bar. The main applications are related with
the sterile filtration of water and beverages such as wine, beer and fruit juices, as well as
pharmaceutical solutions. At industrial scale they are used as pre-filters in RO water
desalination plants [5].
The plate-and-frame configuration (Fig. 1.3-a) is mainly used for small-scale
applications (production of pharmaceuticals, bioproducts or fine chemicals).
Membranes, feed flow spacers and porous permeate support plates are layered together
between two endplates and placed in a housing. The sheets are either in the form of
CHAPTER 1
8
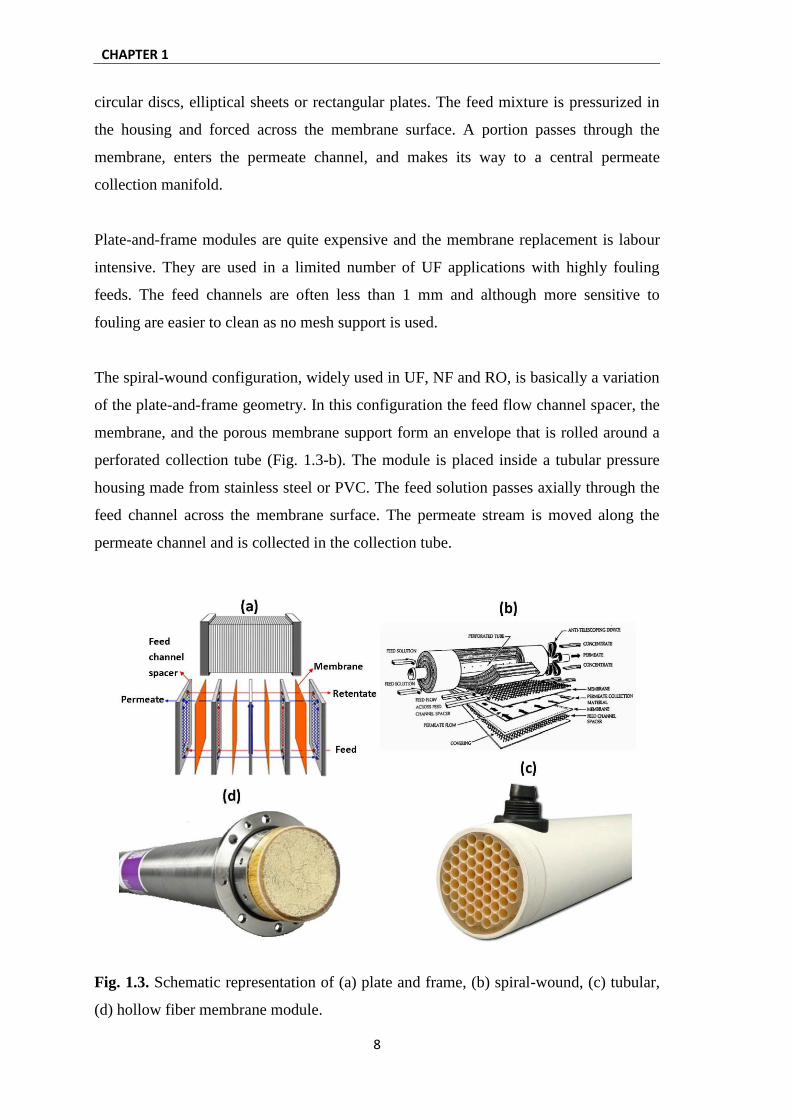
circular discs, elliptical sheets or rectangular plates. The feed mixture is pressurized in
the housing and forced across the membrane surface. A portion passes through the
membrane, enters the permeate channel, and makes its way to a central permeate
collection manifold.
Plate-and-frame modules are quite expensive and the membrane replacement is labour
intensive. They are used in a limited number of UF applications with highly fouling
feeds. The feed channels are often less than 1 mm and although more sensitive to
fouling are easier to clean as no mesh support is used.
The spiral-wound configuration, widely used in UF, NF and RO, is basically a variation
of the plate-and-frame geometry. In this configuration the feed flow channel spacer, the
membrane, and the porous membrane support form an envelope that is rolled around a
perforated collection tube (Fig. 1.3-b). The module is placed inside a tubular pressure
housing made from stainless steel or PVC. The feed solution passes axially through the
feed channel across the membrane surface. The permeate stream is moved along the
permeate channel and is collected in the collection tube.
Fig. 1.3. Schematic representation of (a) plate and frame, (b) spiral-wound, (c) tubular,
(d) hollow fiber membrane module.
Fundamentals of membrane separation processes
9
The spiral wound configuration is compact providing a relatively large area per unit
volume; so it is relatively inexpensive but prone to particulate fouling (thus pre-
filtration is needed).
Tubular membrane modules (Fig. 1.3-c) consist of membrane tubes placed into porous
stainless steel or fiberglass reinforced plastic pipes. The feed solution is pressurized
internally along the tubes and the permeate is collected on the outer side of the porous
support. Tube diameters are in the range of 1 to 2.5 cm and a number of tubes are
placed in one pressure housing in order to increase the module productivity.
The main advantage of the tubular configuration is that concentration polarization
effects and membrane fouling phenomena can be easily controlled; however, low
surface areas can be installed in a given unit volume resulting in high production costs.
Basically, tubular membrane modules are used to treat feed solutions characterised by
high viscosity and high content of solids.
Capillary and hollow fibre membrane modules have the same basic spinning process for
the preparation. The principal differences are related with the inner diameter and also
with the position of the selective layer. Capillary membrane modules are constituted by
a large number of capillaries with an inner diameter of 0.5-3 mm arranged in parallel as
a bundle in a shell tube. The feed is pumped in the lumen of the membranes while the
permeate is collected in the shell side This configuration is characterised by a high
membrane area per module volume and low production costs; another advantage is the
possibility to control concentration polarization and membrane fouling through a
physical process called back flushing in which the permeate flow is reversed allowing to
dislodge the fouling material from the membrane surface. The required low operating
pressure (4-6 bar as maximum values), due to the limited stability of the membranes, is
the main drawback.
Hollow fibre membrane modules consist of a bundle of several membrane fibres with
the free ends potted with an epoxy resin into a cylindrical housing. Typically the outer
diameter of fibres is between 50 and 200 µm; in this case the selective layer is on the
outside of the fibres where the feed fluid is applied, while the permeate is removed
down the fibre bore (Fig. 1.3-d).
CHAPTER 1
10
Hollow fibre membrane modules consisting of fibres with diameter between 200 and
500 m are also available. In these systems the solution is fed into the lumen of the
fibres and the permeate is removed from the shell side. Hollow fibre membrane
modules are characterised by the highest packing density if compared with other
configurations and their production is very cost effective. Drawbacks are related to the
difficult control of concentration polarization and membrane fouling. Consequently
extensive pre-treatments of the solution are needed in order to remove particles,
macromolecules or other materials which can precipitate at the membrane surface.
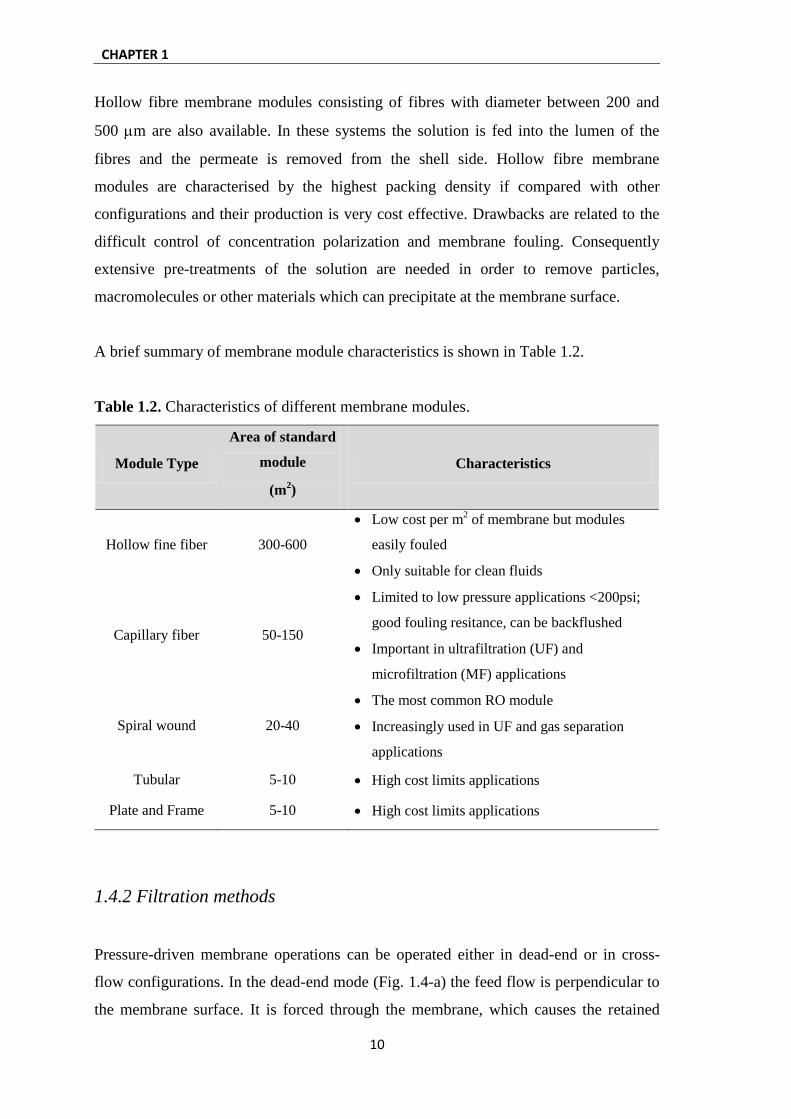
A brief summary of membrane module characteristics is shown in Table 1.2.
Table 1.2. Characteristics of different membrane modules.
Module Type
Area of standard
module
(m2)
Characteristics
Hollow fine fiber 300-600
Low cost per m2 of membrane but modules
easily fouled
Only suitable for clean fluids
Capillary fiber 50-150
Limited to low pressure applications <200psi;
good fouling resitance, can be backflushed
Important in ultrafiltration (UF) and
microfiltration (MF) applications
Spiral wound 20-40
The most common RO module
Increasingly used in UF and gas separation
applications
Tubular 5-10 High cost limits applications
Plate and Frame 5-10 High cost limits applications
1.4.2 Filtration methods
Pressure-driven membrane operations can be operated either in dead-end or in cross-
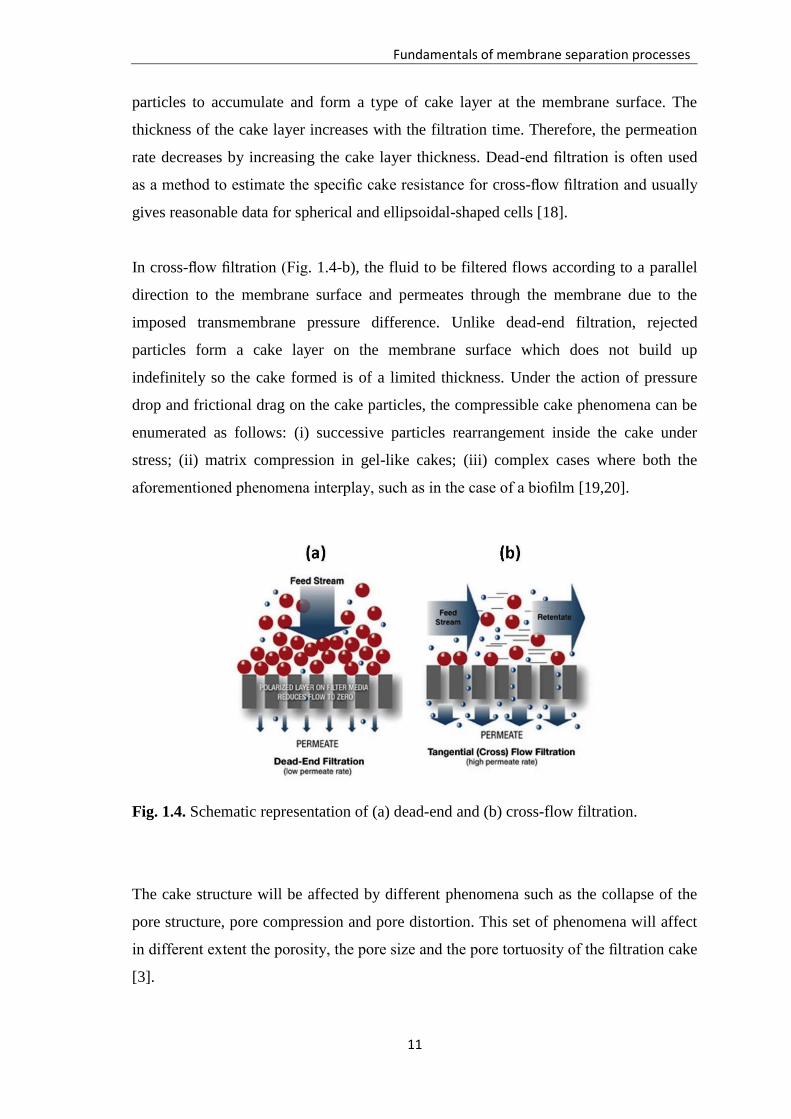
flow configurations. In the dead-end mode (Fig. 1.4-a) the feed flow is perpendicular to
the membrane surface. It is forced through the membrane, which causes the retained
Fundamentals of membrane separation processes
11
particles to accumulate and form a type of cake layer at the membrane surface. The
thickness of the cake layer increases with the filtration time. Therefore, the permeation
rate decreases by increasing the cake layer thickness. Dead-end filtration is often used
as a method to estimate the specific cake resistance for cross-flow filtration and usually
gives reasonable data for spherical and ellipsoidal-shaped cells [18].
In cross-flow filtration (Fig. 1.4-b), the fluid to be filtered flows according to a parallel
direction to the membrane surface and permeates through the membrane due to the
imposed transmembrane pressure difference. Unlike dead-end filtration, rejected
particles form a cake layer on the membrane surface which does not build up
indefinitely so the cake formed is of a limited thickness. Under the action of pressure
drop and frictional drag on the cake particles, the compressible cake phenomena can be
enumerated as follows: (i) successive particles rearrangement inside the cake under
stress; (ii) matrix compression in gel-like cakes; (iii) complex cases where both the
aforementioned phenomena interplay, such as in the case of a biofilm [19,20].
Fig. 1.4. Schematic representation of (a) dead-end and (b) cross-flow filtration.
The cake structure will be affected by different phenomena such as the collapse of the
pore structure, pore compression and pore distortion. This set of phenomena will affect
in different extent the porosity, the pore size and the pore tortuosity of the filtration cake
[3].

CHAPTER 1
12
1.4.3 Process configuration
The most common process configurations used in practical applications of pressure-
driven membrane processes are illustrated in Fig. 1.5.
In the total recycle configuration (Fig. 1.5-a), permeate and retentate streams are
recycled back to the feed reservoir so that a steady state is attained in fixed
concentration of the feed. This configuration is mainly used in order to study the effect
of different operating parameters (feed concentration, cross flow velocity,
transmembrane pressure, temperature) on steady state permeate flux and permeate
quality [21].
In the batch concentration configuration, the retentate is returned to the feed reservoir
and the permeate is collected separately (Fig. 1.5-b). This approach requires the least
membrane area to achieve a given separation/unit time. Batch operations are used when
the permeate is the product of interest, such as in fruit juice clarification or treatment of
effluents in which the retentate has to be discharged.
Fig. 1.5. Schematic diagram of (a) total recycle, (b) batch concentration, (c) feed-and-
bleed and (d) diafiltration configuration.

Fundamentals of membrane separation processes
13
The feed-and-bleed configuration is commonly used for continuous operation when a
higher recovery rate must be obtained (for example in the food industries). In this case
the permeate is removed from the system together with a small part of the retentate
(Fig. 1.5-c). Most of the retentate is recycled and mixed with the feed solution to
maintain a high tangential velocity in the membrane module. A feed pump and a
recirculation pump are required to provide the transmembrane pressure and the cross-
flow, respectively.
Diafiltration (Fig. 1.5-d) involves the addition of water to the retentate in order to
overcome low permeate fluxes at high concentrations or to improve the separation of
permeable compounds. It can be carried out in sequential form (by replacing the
permeate with an equal volume of pure solvent) or continuously (by replacing the
permeate with the same flow rate of added water). This configuration is often used
when a more complete separation of micro- and macrosolutes is required.
1.5 Membrane performance
The membrane performance in pressure-driven membrane systems is determined by the
filtration rate and membrane separation properties generally, evaluated in terms of
membrane rejection.
Several mathematical models are available in literature that attempt to describe the
mechanism of transport through membranes. Although the operating techniques of MF,
UF, NF and RO are similar, some considerations should be taken into account. In MF
and UF the convection of a bulk solution is the dominant form of transport, while
diffusion is generally insignificant. In NF and RO, matter is transported through the
membrane mainly by diffusion of individual molecules through a more or less
homogenous membrane matrix, but convection can become significant with high flux
membranes [5].

CHAPTER 1
14
In this section a brief description of separation capabilities of membranes, transport
mechanisms and concentration polarization and fouling phenomena in pressure-driven
membrane systems is reported.
1.5.1 Membrane rejection and volume reduction factor
The separation capability of MF, UF, NF and RO membranes can be expressed in terms
of membrane rejection according to the following equation:
(
) (1.1)
where R is the membrane rejection for a given component in defined conditions of
hydrostatic pressure and feed solution concentration, while Cp and Cf are the
concentrations of the component in the permeate stream and feed solution, respectively.
However, the concentrations in the retentate and permeate streams depend not only on
the membrane rejection but also on the recovery rate () which is given by:
(1.2)
where Vp=Vp(t) and V0 are the permeate volume and the initial feed volume,
respectively, and t is the time. The recovery rate ranges between 0 and 1. Sometimes
data are also presented as volume reduction factor (VRF):
(1.3)
where Vo is the initial volume (mL) of the feed, Vr(t) the final volume (mL) of the
retentate at particular time (t) and Vp(t) the volume collected on the permeate side at a
particular time [22].
1.5.2 Transport mechanisms
The transport mechanisms in membrane operations are generally described by
phenomenological equations such as Darcy´s law, Fick´s law, Hagen-Poisseuille´s law
and Ohm´s law [5]. In MF and UF processes components that permeate through the
Fundamentals of membrane separation processes
15
membrane are transported by a convective flow through the membrane pores under a
pressure gradient as driving force and the separation occurs through a size exclusion
mechanism. Darcy´s law [4,23] describes this type of transport:
(1.4)
where Jw is the volume flux (m/s), Am is the membrane cross sectional area (m2), Vp is
the filtrate volume (m3) collected on the permeate side at a particular time interval
dt (s), ΔP is the applied transmembrane pressure (Pa), μ is the viscosity (Pa·s) of the
permeate sample and RT is the total membrane resistance (m−1
). RT is given by:
(1.5)
where RC is the cake layer resistance (m−1
) due to the concentration polarization and the
deposition of solids on the membrane surface, RF is the fouling layer resistance (m−1
)
due to the internal fouling inside the pores and RM the intrinsic membrane resistance.
Experimentally, the resistances defined in Eq. (1.5) can be determined from the values
of the hydraulic permeability measured before and after the cleaning procedures. In
particular, RM can be calculated by measuring the hydraulic permeability of the new or
clean membrane as:
(1.6)
where µw is the viscosity of pure water [24,25] and Lp0=Jw/P is the hydraulic
permeability (m/s·Pa) of the new membrane. RT can be calculated as:
(1.7)
in which Lp1 is the hydraulic permeability of the membrane after the treatment with a
specific solution. RC is removed by cleaning the membrane with water. The hydraulic
permeability measured after such cleaning is Lp2, therefore:
(1.8)
Finally, the resistance caused by the cake layer formation can be estimated as:
[ ] (1.9)

CHAPTER 1
16
In an ideal situation (pores uniformly distributed, no fouling and negligible
concentration polarization) the fluid flow through a porous membrane can be described
by the Haugen-Poiseuille law:
(1.10)
where is the surface porosity of the membrane, dp the mean pore diameter, PT the
applied transmembrane pressure, x the length of the channel and the viscosity of the
fluid permeating the membrane.
The net driving force ∆P for an ideal membrane process should be (PT-∆ᴨ) where:
(1.11)
(1.12)
in which PF and PP are the pressures on the feed and permeate side of the membrane,
respectively; similarly, F and P are the osmotic pressures on the feed and permeate
side.
The cross flow mode gives rise to a pressure drop from the inlet to the outlet of the
membrane module, so that the feed side pressure is expressed as:
(1.13)
where Pi is the inlet pressure of the membrane module and Po the outlet pressure.
The Haugen-Poiseuille law assumes that the flow through the pores is laminar and
independent of time, the density is constant, the fluid is Newtonian and end-effects are
negligible.
According to the Equation (1.10), the flux is directly proportional to the applied
pressure and inversely proportional to the viscosity. Basically, viscosity is controlled by
solids concentration and temperature; for non-Newtonian liquids, it is also affected by
shear rate and velocity.

Fundamentals of membrane separation processes
17
The model is largely true under certain conditions such as low pressure, low feed
concentration and high feed velocity; when the process deviates from any of these
conditions, flux becomes independent of pressure. In these conditions mass transfer
limited models, such as the film theory, can effectively describe the process.
1.5.3 Concentration Polarization and membrane fouling
Concentration polarization is a natural consequence of the selectivity of a membrane.
When a feed solution containing a solvent and a solute or suspended solids is filtered
through a porous membrane, some components permeate the membrane under a given
driving force while others are retained. This leads to an accumulation of particles or
solutes in a mass transfer boundary layer adjacent to the membrane surface that can
affect the flux. A concentration gradient between the solution at the membrane surface
and the bulk is established which leads to a back transport of the material accumulated
at the membrane surface by diffusion and eventually other means. This phenomenon,
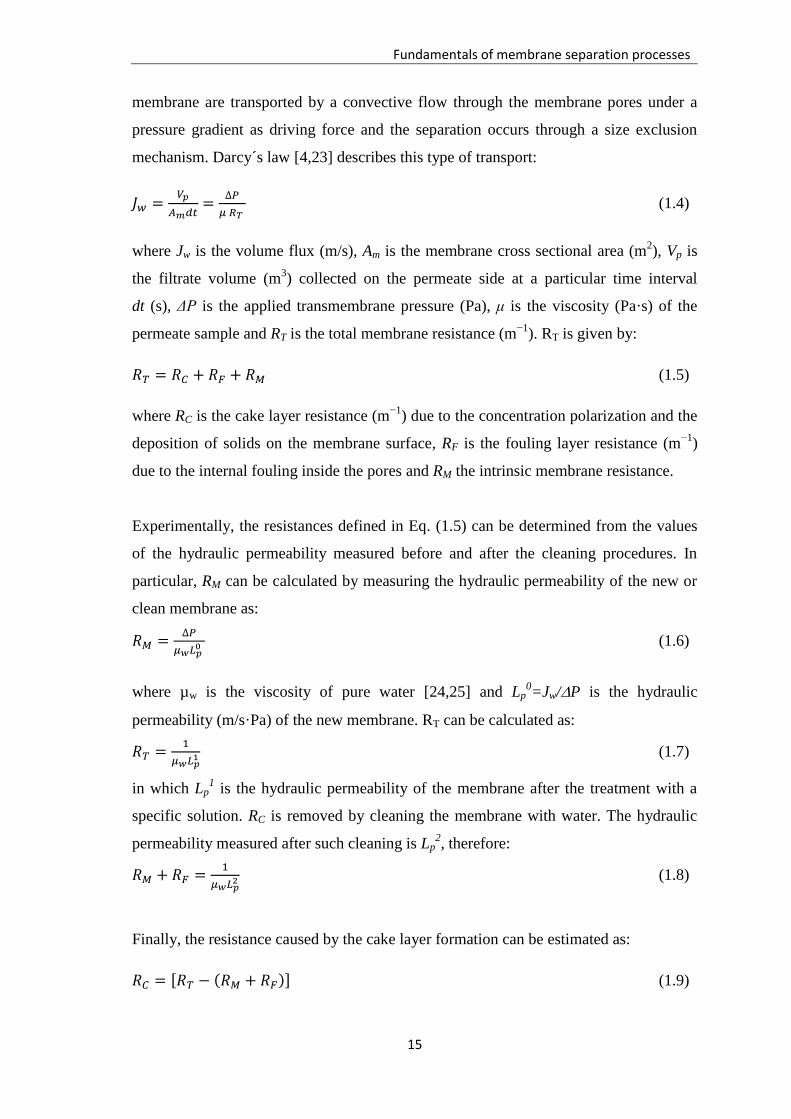
schematically represented in Fig. 1.6, is referred to as concentration polarization
[26,27]. It is not to be confused with the membrane fouling phenomenon that is
essentially due to a deposition of retained particles onto the membrane surface or in the
membrane pores.
In NF and RO, mainly low molecular weight materials are separated from a solvent
such as water producing an increase in the osmotic pressure which is directly
proportional to the solute concentration at the membrane surface and thus a decrease in
the membrane flux at constant applied hydrostatic pressures [28]. On the other hand in
MF and UF the mechanism is different due to the fact that macromolecules and particles
are retained by the membrane, thus osmotic pressure is generally quite low. The
retained components often are precipitated and form a solid layer at the membrane
surface. This layer, which often exhibits membrane properties itself, can affect the
membrane separation characteristics significantly by reducing the membrane flux and
by changing the rejection of lower molecular weight compounds [5].
CHAPTER 1
18
components
Fig. 1.6. Schematic representation of concentration polarization (cw = gel concentration;
cb = bulk concentration).
The term fouling is referred to a long term flux decline caused by the deposition of
retained particles (colloids, suspended particles, macromolecules, etc.) onto the
membrane surface and/or within the pores of the membrane. The fouling behavior is
strongly affected by the physico-chemical nature of the membrane, the solutes and the
fluid dynamic system design.
According to Bacchin et al. [29] the build-up of material may take different forms such
as: i) adsorption, when attractive interactions between the membrane and particles exist;
ii) pore blockage, with a reduction in flux due to the closure (or partial closure) of pores
(this phenomenon is predominant in porous membranes such as MF and UF
membranes); iii) a deposit of particles which can grow layer by layer at membrane
surface leading to an additional hydraulic resistance; iv) a gel formation due to
concentration polarization of macromolecules like pectins.
The type of fouling, described above, can be determined experimentally by using the
empirical model developed by Hermia [30-34]. The type of fouling is obtained from the
i value obtained in the equation 1.14.

Fundamentals of membrane separation processes
19
(
)
(1.14)
where the blocking index i and the resistance coefficient k are functions of the blocking
models. The model expressed by eq. 1.14 permits, on the basis of experimental data, to
point out the fouling mechanism involved in the filtration process, according the
estimated value for i; for example, i=2 is complete blocking, i=1.5 is standard blocking,
i=1 is intermediate blocking, and i=0 is cake filtration (Fig. 1.7). The blocking index
and the resistance coefficient can be calculated by plotting d2t/dv
2 versus dt/dv or
solving eq.1.14 [35].
Fig. 1.7. Schematic representation of (a) complete blocking, (b) intermediate blocking,
(c) cake filtration and (d) standard blocking in pressure-driven membrane processes.
In addition, fouling can be evaluated by comparing the hydraulic permeability before
and after the treatment according to the following equation:
(
) (1.15)
where L1
p and L0
p are the hydraulic permeabilities measured after and before the
treatment of the feed solution, respectively.
Although polarization concentration and fouling phenomena determine a reduction of
the permeate flux they can have an opposite effect on the observed rejection.
CHAPTER 1
20
The concentration polarization determines a reduction of the rejection; in case of
fouling, if the build-up of solids on the membrane is significant enough, it may act as a
secondary membrane and change the effective sieving and transport properties of the
system: consequently, the rejection can be increased or maintained constant. In addition,
while the concentration polarization is a reversible process based on diffusion taking
place over a few seconds, fouling is generally irreversible and the flux decline is a long
term process. Finally, the concentration polarization can be minimized by
hydrodynamic means, such as the feed flow velocity and the membrane module design;
on the contrary, the control of membrane fouling is more difficult.
Methods generally accepted to control and minimize fouling phenomena include feed
pre-treatment, modification of membrane properties, modification of operating
conditions, flow manipulation and membrane cleaning with proper chemical agents. A
mathematical model generally accepted to describe concentration polarization
phenomena is the well-known film theory. As previously reported, this model is more
useful in describing transport phenomena through membranes when a polarized layer is
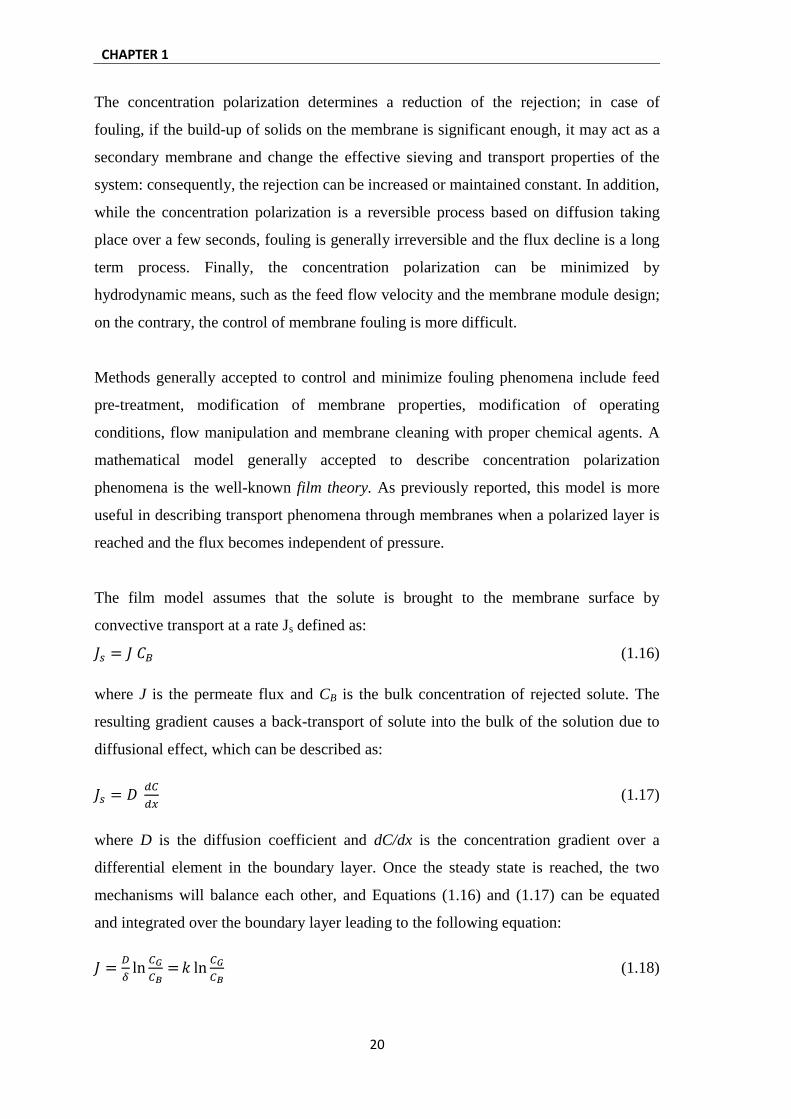
reached and the flux becomes independent of pressure.
The film model assumes that the solute is brought to the membrane surface by
convective transport at a rate Js defined as:
(1.16)
where J is the permeate flux and CB is the bulk concentration of rejected solute. The
resulting gradient causes a back-transport of solute into the bulk of the solution due to
diffusional effect, which can be described as:
(1.17)
where D is the diffusion coefficient and dC/dx is the concentration gradient over a
differential element in the boundary layer. Once the steady state is reached, the two
mechanisms will balance each other, and Equations (1.16) and (1.17) can be equated
and integrated over the boundary layer leading to the following equation:
(1.18)
Fundamentals of membrane separation processes
21
where CG is the gel concentration (solute concentration at the membrane surface), and k
is the mass transfer coefficient given by:
(1.19)
where δ is the thickness of the boundary layer over which the concentration gradient
exists.
Several relationships to correlate the mass-transfer coefficients with physical properties,
flow channel dimensions, and operating parameters have been reported in literature
[36-38]. These relationships generally adapted to specific applications are not
universally applicable.
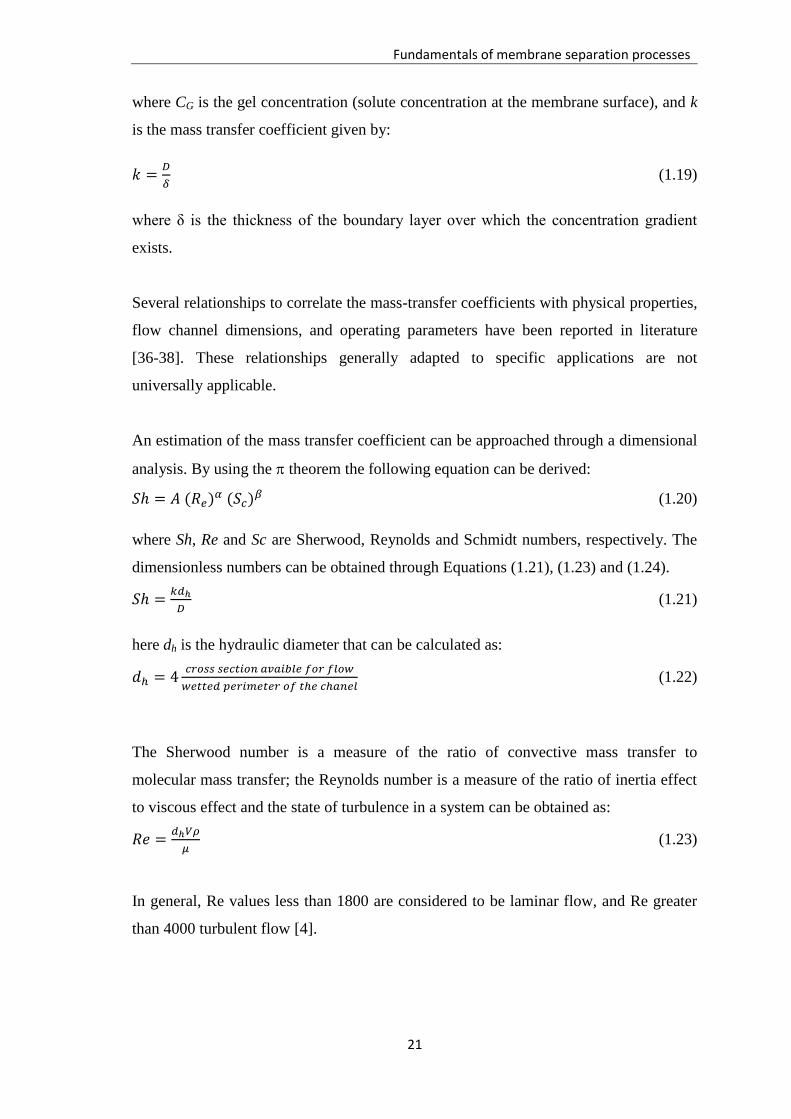
An estimation of the mass transfer coefficient can be approached through a dimensional
analysis. By using the theorem the following equation can be derived:
(1.20)
where Sh, Re and Sc are Sherwood, Reynolds and Schmidt numbers, respectively. The
dimensionless numbers can be obtained through Equations (1.21), (1.23) and (1.24).
(1.21)
here dh is the hydraulic diameter that can be calculated as:
(1.22)
The Sherwood number is a measure of the ratio of convective mass transfer to
molecular mass transfer; the Reynolds number is a measure of the ratio of inertia effect
to viscous effect and the state of turbulence in a system can be obtained as:
(1.23)
In general, Re values less than 1800 are considered to be laminar flow, and Re greater
than 4000 turbulent flow [4].

CHAPTER 1
22
The Schmidt number represents the ratio of momentum diffusivity (viscosity) and mass
transfer; it is given by:
(1.24)
The exponents α and β in equation (1.20) are constants determined by the state of
development of the velocity and concentration profiles along the channel.
On the other hand, in processes such as NF and RO where membranes are non-porous,
the separation occurs by means of a different solubility and diffusivity of components
across the membrane due to a concentration or chemical potential gradient. The
molecules diffusion through homogeneous dense membranes occurs through the free
volume elements, or empty spaces between polymer chains caused by thermal motion of
the polymer molecules, which fluctuate in position and volume on the same time scale
as the molecule permeates. This type of transport is described by the Fick’s law:
(1.25)
where Ci is the concentration and Di the diffusion coefficient of a component i.

Fundamentals of membrane separation processes
23
References
[1] S.P. Nunes, K.V. Peinemann. 2001. Membrane Technology in the Chemical
Industry. Weinheim: Wiley-VCH Verlag GmbH.
[2] S. Loeb, S. Sourirajan. 1962. Seawater demineralization by means of a
semipermeable membrane. In Advances in Chemistry, ed. R. Gould, 117-132.
Washington: American Chemical Society.
[3] M. Mota, J.A. Teixeira, A. Yelshin. Influence of cell-shape on the cake resistance
in dead-end and cross-flow filtrations. Separation and Purification Technology, 27
(2002) 137-44.
[4] M. Cheryan, 1998. Ultrafiltration and Microfiltration handbook. Lancaster:
Technomic Publishing Company.
[5] H. Strathmann, L. Giorno, E. Drioli. 2006. An introduction to membrane science
and technology. Roma: Consiglio Nazionale delle Ricerche.
[6] P. Hogan, R. Canning, P. Peterson, R. Johnson, A. Michaels, A new option:
osmotic distillation. Chemical Engineering Progress, 94 (1998) 49–61.
[7] R.R. Bhave. 1991. Inorganic Membranes: Synthesis, Characterization and
Application. New York: Van Nostrand Reinhold.
[8] J.E. Cadotte. 1985. Evolution of composite reverse osmosis membranes. In
Material Science of Synthetic Membranes, ed. D.R. Lloyd, ACS Symposium Series
269, 273-294. Washington: American Chemical Society.
[9] M.A. Frommer, I. Feiner O. Kedem, R. Bloch. Mechanism for formation of skinned
membranes: II. Equilibrium properties and osmotic flows determining membrane
structure. Desalination, 7 (1970) 393-402.
[10] W.C. Hiatt, G.H. Vitzthum, K:B. Wagner, K. Gerlach, C. Josefiak. 1985.
Microporous membranes via upper critical temperature phase separation. In
Material Science of Synthetic Membranes, ed. D.R. Lloyd, ACS Symposium Series
269, 229-244. Washington: American Chemical Society.
[11] K. Kamide, S. Manabe. 1985. Role of microphase separation phenomena in the
formation of porous polymeric membranes. In Material Science of Synthetic
Membranes, ed. D.R. Lloyd, ACS Symposium Series 269, 197-228. Washington:
American Chemical Society.

CHAPTER 1
24
[12] R.E. Kesting. 1985. Phase inversion membranes. In Material Science of Synthetic
Membranes, ed. D.R. Lloyd, ACS Symposium Series 269, 131-164. Washington:
American Chemical Society.
[13] J. Smid, C. Avci, V. Guenay, R.A. Terpstra, J.P.G.M. Van Eijk.. Preparation and
characterization of microporous ceramic hollow fiber membranes. Journal of
Membrane Science, 112 (1996) 85-90.
[14] S. Sourirajan, B. Kunst. 1977. Cellulose acetate and other cellulose ester
membranes. In Reverse osmosis and synthetic membranes, ed. S. Sourirajan, 129-
152. Ottawa: National Research Council Canada.
[15] H. Strathmann. 1985. Production of microporous media by phase inversion
processes. In Material Science of Synthetic Membranes, ed. D.R. Lloyd, ACS
Symposium Series 269, 165-195. Washington: American Chemical Society.
[16] R.E. Kesting. 1971. Synthetic polymeric membranes. New York: McGraw-Hill.
[17] J.E. Cadotte, R.I. Petersen. 1981. Thin film reverse osmosis membranes: Origin,
development, and recent advances. In: Synthetic membranes, ed. A.F. Turbak, ACS
Symposium series 153, 305-325. Washington: American Chemical Society.
[18] T. Tanaka, K.I. Abe, H. Asakawa, H. Yoshida, K. Nakanishi. Filtration
characteristics and structure of cake in cross-flow filtration of bacterial suspension.
Journal of Fermentation and Bioengineering, 78 (1994) 455-61.
[19] F.M. Tiller, H.R. Cooper. The role of porosity in filtration. Part V, Porosity
variation in filter cakes. American Institute of Chemical Engineers 8 (1962)445-9.
[20] F.M. Tiller, C.S. Yeh. The role of porosity in filtration. Part X. Deposition of
compressible cakes on external radial surface. American Institute of Chemical
Engineers, 31 (1985) 1241-8.
[21] P. Rai, G.C. Majumdar, G. Sharma, S. DasGupta, S. De. Effect of various cutoff
membranes on permeate flux and quality during filtration of mosambi (Citrus
sinensis L.) Osbeck juice. Food and Bioproducts Processing, 84 (2006) 213-9.
[22] V. Singh, P.K. Jain, C. Das. Performance of spiral wound ultrafiltration membrane
module for with and without permeate recycle: Experimental and theoretical
consideration. Desalination, 322 (2013) 94-103.
[23] S.F. Mexis, M.G. Kontominas. Effect of oxygen absorber, nitrogenflushing,
packaging material oxygen transmission rate and storage conditions on quality
retention of raw whole unpeeled almond kernels (Prunus dulcis). LWT-Food
Science and Technology, 43 (2010) 1-11.

Fundamentals of membrane separation processes
25
[24] C. Das, P. Patel, S. De, S. Das Gupta. Treatment of tanning effluent using
nanofiltration followed by reverse osmosis. Separation and Purification
Technology, 50 (2006) 291-9.
[25] K.S. Youn, J.H. Hong, D.H. Bae, S.J. Kim, S.D. Kim. Effective clarifying process
of reconstituted apple juice using membrane filtration with filter-aid pretreatment.
Journal of Membrane Science, 228 (2004) 179-86.
[26] P. Aimar, J.A. Howell, M. Turner. Effects of concentration boundary layer
development on the flux limitations of ultrafiltration. Chemical Engineering
Research and Design, 67 (1989) 255-61.
[27] M. Mulder. 1991. Basic Principles of Membrane Technology. Dordrecht: Kluwer
Academic Publishers.
[28] G. Belfort. Fluid mechanics in membrane filtration. Journal of Membrane Science,
40 (1989) 123-147.
[29] P. Bacchin, P. Aimar, R.W. Field. Critical and sustainable fluxes: Theory,
experiments and applications. Journal of Membrane Science, 281 (2006) 42–69.
[30] M.C. Vincent Vela, S. Alvarez Blanco, J. Lora García, E. Bergantiños Rodríguez,
Analysis of membrane pore blocking models adapted to crossflow ultrafiltration in
the ultrafiltration of PEG. Chemical Engineering Journal, 149 (2009) 232–241.
[31] R.W. Field, D. Wu, J.A. Howell, B.B. Gupta, Critical flux concept for
microfiltration fouling. Journal of Membrane Science, 100 (1995) 259–272.
[32] J. Hermia, Constant pressure blocking filtration law: application to power law non-
Newtonian fluids. Transaction of the Institution of Chemical Engineers, 60 (1982)
183–187.
[33] C. Duclos-Orsello, W. Li, C.C. Ho, A three mechanism model to describe fouling
of microfiltration membranes. Journal of Membrane Science, 280 (2006) 856–866.
[34] M.C. Vincent Vela, S. Alvarez Blanco, J. Lora García, E. Bergantiños Rodríguez,
Analysis of membrane pore blocking models applied to the ultrafiltration of PEG.
Separation and Purification Technology, 62 (2008) 489–498.
[35] K.J. Hwang, C.Y. Liao, K.L. Tung, Analysis of particle fouling during
microfiltration by use of blocking models. Journal of Membrane Science, 287
(2007) 287–293.

CHAPTER 1
26
[36] V. Gekas, B. Hallstrom. Mass transfer in the membrane concentration polarization
layer under turbulent dross flow: I. Critical literature review and adaptation of
existing Sherwood correlation to membrane operations. Journal of Membrane
Science, 30 (1987) 153-70.
[37] R.K. Sherwood, R.L. Pigford, C.R. Wilke. 1975. Mass transfer. New York:
McGraw-Hill.
[38] R.E. Treybal. 1981. Mass transfer operations. Ney York: McGraw-Hill.

27
CHAPTER 2
Citrus fruit processing and orange press liquor
characterization
2.1 Citrus fruits: properties and global market
Citrus fruits are probably the most known and extensive fruits around the world. Citrus
is the general terms referred to products such as oranges, lemons, grapefruits and limes.
Several authors have mentioned that the origin of citrus was in the southeast China and
Southeast Asia [1]. Today citrus is cultivated principally in subtropical areas, where the
environmental conditions are optimal for its productions. World citrus production and
consumption have grown strongly since the mid-1980s. Production of oranges,
tangerines, lemons and limes has expanded rapidly, and even faster growth has been
realized for processed citrus products as improvements in transportation and packaging
have lowered costs and improved quality. The projected orange production in 2010 was
66.4 million tonnes, approximately 14 percent greater than that realized over the 1997-
99 period. The projected production was expected to be utilized as 36.3 million tonnes
fresh and 30.1 million tonnes processed. Italy is an important orange producer in the EU
with a production equal to 2,393,660 tonnes/year that represents the 3.45% of the world
production according with the data published by the Food and Agriculture Organization
of the United Nations (FAOSTAT) [2].
Citrus is a product with many desirable characteristics for consumers who are health-
conscious, demand convenience and place a premium on food safety. Phenolic
compounds present in citrus fruits have gained a lot of importance due to their potential
as prophylactic and therapeutic agents in many diseases [3-9]. In human body reactive
oxygen species (ROS) and reactive nitrogen species (RNS) are constantly generated for
physiological purposes and often over-produced in pathological conditions, resulting in
oxidative stress which is defined as “an imbalance” between oxidants and antioxidants
in favour of the oxidants, potentially leading to damage [10-12]. Oxidative stress can
damage lipids, proteins, enzymes, carbohydrates and DNA in cells and tissues, resulting

CHAPTER 2
28
in membrane damage, fragmentation or random cross linking of molecules like DNA,
enzymes and structural proteins and even lead to cell death induced by DNA
fragmentation and lipid peroxidation [13]. These consequences of oxidative stress
construct the molecular basis in the development of cancer, neurodegenerative
disorders, cardiovascular diseases, diabetes and autoimmune disorders [3].
The antioxidant defence system in the human body consist of in several systems such as
enzymatic scavengers, hydrophilic scavengers and lipophilic radical scavengers [10,11].
Some of these agents are synthesized by cell itself; however the majority, including
ascorbic acid, polyphenols and carotenoids, are derived from dietary sources. For this
reason antioxidants have gained a great interest in recent year because of their potential
as prophylactic and therapeutic agents in many diseases. The discovery of the role of
free radicals in cancer, diabetes, cardiovascular diseases, autoimmune diseases,
neurodegenerative disorders, aging and other diseases has led to a medical revolution
that is promising a new paradigm of healthcare [3-9].
The global market of antioxidants is increasing rapidly, because of the increased health
risk in a constantly polluting environment. These agents also have cosmetic
applications, leading to the development of researchers at industrial and academic level
to explore these molecules and their analogues [3]. In this way there is a great
biomedical interest in the separation, purification and recovery of antioxidant
compounds from natural sources. In particular, the consumption of citrus fruits appears
to be associated with lower risk of colorectal, esophageal [14,15], gastric [16,17], and
stomach [18] cancers, and stroke [17,19-21]. Citrus fruits also appear to be associated
with improved blood lipid profiles [22], and improved survival in the elderly [23]. The
components responsible for these beneficial effects are unknown, but the citrus
flavonoids are one group of compounds that may be involved [24-38]. Some flavonoids
have been reported to possess a variety of biological activities and pharmacological
properties, including antiallergic, antidiabetic, antiinflammatory, antiviral,
antiproliferative, and anticarcinogenic activities, in addition to having effects on
mammalian metabolism [17,39].
Flavonoids are widely distributed in fruits, vegetables, fruit juices, cocoa, teas and
wines [40] where their distribution depends on several factors, including variation and
Citrus fruit processing and orange press liquor characterization
29
degree of light exposure [41]. Most Citrus species accumulate substantial quantities of
flavonoids during the development of their different organs [40].
More than 5000 different plant-derived flavonoids have been isolated from various
plants [42]. They are classified into at least 10 chemical groups. Flavanones, flavones,
isoflavonoids, flavans (flavanols), anthocyanins, and flavonols are particularly common
in the diet [42-44]. Flavanones are mainly found in citrus fruits [45]. The dominant
flavanone glycosides in sweet oranges (Citrus sinensis) are hesperidin and narirutin
[46].
Plant material wastes from industries contain high levels of phenolic compounds.
Importantly, most of this phytonutrients are found in the orange peel, in the inner white
pulp, rather than in the juice, so these beneficial compounds are too often removed by
the processing of orange into juice [4,47,48]. Membrane processes such as
microfiltration (MF) and ultrafiltration (UF) can be considered a valid approach for
separating and recovering valuable compounds from finely divided solid materials
present in orange wastes [49].
2.2 Citrus processing
The popularity of orange juice dramatically increased again with the development of the
commercial orange juice industry in the late 1920s. In its early days, the juice industry
primarily relied on salvaged fruit, which was unsuitable for regular consumption
because it was misshapen, badly coloured or blemished. In the 1930s, development of
porcelain-lined cans and advances in pasteurization techniques led to improved juice
quality and the industry expanded significantly. Then, in 1944, scientists found a way to
concentrate the juice by thermal and freezing system without destroying the flavour or
vitamin content. After the second world war, concentrated juices became the
predominant form.
An overview of the classical production process of orange juice is shown in Fig. 2.1.
The major unit operations will be described in the following.

CHAPTER 2
30
Fig. 2.1. Flowchart of industrial orange juice processing.
Cleaning/Grading: The fruit is transported along a conveyor belt where it is washed
with a detergent as it passes over roller brushes. This process removes debris and dirt
and reduces the number of microbes. The fruit is rinsed and dried. Graders remove bad
fruit as it passes over the rollers and the remaining quality pieces are automatically
segregated by size prior to extraction. Proper size is critical for the extraction process.
Extraction: Proper juice extraction is important to optimize the efficiency of the juice
production process as well as the quality of the finished drink. The latter is true because
oranges have thick peels, which contain bitter resins that must be carefully separated to
avoid tainting the sweeter juice. There are two automated extraction methods commonly
used by the industry. The first places the fruit between two metal cups with sharpened
metal tubes at their base. The upper cup descends and the fingers on each cup mesh to
express the juice as the tubes cut holes in the top and bottom of the fruit. The fruit solids
are compressed into the bottom tube between the two plugs of peel while the juice is

Citrus fruit processing and orange press liquor characterization
31
forced out through perforations in the tube wall. At the same time, a water spray washes
away the oil from the peel. This oil is reclaimed for later use.
The second type of extraction has the oranges cut in half before the juice is removed.
The fruits are sliced as they pass by a stationary knife and the halves are then picked up
by rubber suction cups and moved against plastic serrated reamers. The rotating reamers
express the juice as the orange halves travel around the conveyor line.
Some of the peel oil may be removed prior to extraction by needles which prick the
skin, thereby releasing the oil which is washed away. Modern extraction equipment of
this type can slice, ream, and eject a peel in about 3 seconds.
The extracted juice is filtered through a stainless steel screen before it is ready for the
next stage. At this point, the juice can be chilled or concentrated.
Pasteurization: Thanks to its low pH (about 4), orange juice has some natural protection
from bacteria, yeast, and mold growth. However, pasteurization is still required to
further retard spoilage. Pasteurization also inactivates certain enzymes which cause the
pulp to separate from the juice, resulting in an aesthetically undesirably beverage. This
enzyme related clarification is one of the reasons why fresh squeezed juice has a shelf
life of only a few hours. Flash pasteurization minimizes flavour changes from heat
treatment and is recommended for premium quality products. Several pasteurization
methods are commercially used. One common method passes juice through a tube next
to a plate heat exchanger, so the juice is heated without direct contact with the heating
surface. Another method uses hot, pasteurized juice to preheat incoming unpasteurized
juice. The preheated juice is further heated with steam or hot water to the pasteurization
temperature. Typically, reaching a temperature of 85-94°C for about 30 seconds is
adequate to reduce the microbe count.
Concentration: Concentrated juice is approximately five times more concentrated than
squeezed juice. Concentration is useful because it extends the shelf life of the juice and
makes storage and shipping more economical. Juice is commonly concentrated with a
piece of equipment known as a Thermally Accelerated Short-Time Evaporator

CHAPTER 2
32
(TASTE). Concentrated juice is discharged to a vacuum flash cooler, which reduces the
product temperature to about 13°C.
Packaging/filling: To ensure sterility, the pasteurized juice should be filled while still
hot. Where possible, metal or glass bottles and cans can be preheated. Packaging which
cannot withstand high temperatures (e.g., aseptic, multilayer plastic juice boxes which
do not require refrigeration) must be filled in a sterile environment. Instead of heat,
hydrogen peroxide or another approved sterilizing agent may be used prior to filling. In
any case, the empty packages are fed down a conveyor belt to liquid filling machinery,
which is fed juice from bulk storage tanks. The filling head meters the precise amount
of product into the container, and depending on the design of the package, it may
immediately invert to sterilize the lid. After filling, the containers are cooled as fast as
possible. Orange juice packaged in this manner has a shelf life of 6-8 months at room
temperature.
During the juice production two-thirds of the mass becomes juice. The wastes generated
consist basically in wet peels and whole rejected fruits that contain 82% of water [50].
These residues have a great amount of organic matter that can be associated with
environmental and health problems due to water runoff and uncontrolled fermentation;
consequently, their treatment is necessary. Recent R&D efforts aim to convert the
potential of wastes into profitable products creating new segments of production and
offsetting the disposal costs. Orange peels and pulp contain several bioactive
compounds, such as flavonoids and phenolic acids, recognized for their beneficial
implications in human health due to their antioxidant activity and free radical
scavenging ability [51]. These semi-solid wastes can be pressed to obtain a liquid rich in
soluble sugars, named press liquor, that can be concentrated up to citrus molasses grade
or alternatively exploited as a natural source for the extraction of phenolic compounds
which can be used as natural antioxidants mainly in foods to prevent the rancidity and
oxidation of lipids.

Citrus fruit processing and orange press liquor characterization
33
2.3 Press liquor characterization
The orange press liquor contains different components that could be summarised in
three principal groups: i) macromolecules (i.e. pectins); ii) high levels of phenolic
compounds, including flavonoids [4] and phenolic acids; iii) sugars such as fructose,
glucose and sucrose [52].
In this work experimental activities were performed starting from a raw orange press
liquor supplied by Gioia Succhi Srl (Rosarno, Reggio Calabria, Italy).
Several analysis, as described in the following, were performed to characterise the raw
press liquor as well as fractions (permeates and retentates) produced in experimental
activities performed by using membrane operations. Analysis were mainly focused in
the evaluation of phenolic compounds and sugars.
2.3.1 Analysis of phenolic compounds
The determination and quantification of flavonoids was carried out by using a HPLC
system (Shimadzu LC-20AB, Kyoto, Japan) equipped with a UV/vis detector (SPD-
20A), monitored at 284 nm and 360 nm. The system consisted of a binary pump and
auto sampler. The column used was a Discovery C18: 25cm x 4.6mm, 5μm. The mobile
phase consisted of two solvents: Solvent A, water/ phosphoric acid (0.1% v/v) and
Solvent B, acetonitrile. Phenolic compounds were eluted under the following
conditions: 1 mL/min flow rate and ambient temperature; gradient conditions from 0%
to 5% B in 0.01 min, from 5% to 10% B in 19.9 min, from 10% to 20% B in 20 min,
from 20% to 25% B in 20 min, from 25% to 35% B in 20 min, from 35% to 60% B in
15 min, from 60% to 5% B in 3 min, followed by washing and reconditioning the
column. The identification of phenolic compounds was obtained comparing the
retention times using authentic standards, while quantification of hesperidin was
performed by external calibration with standards.
CHAPTER 2
34
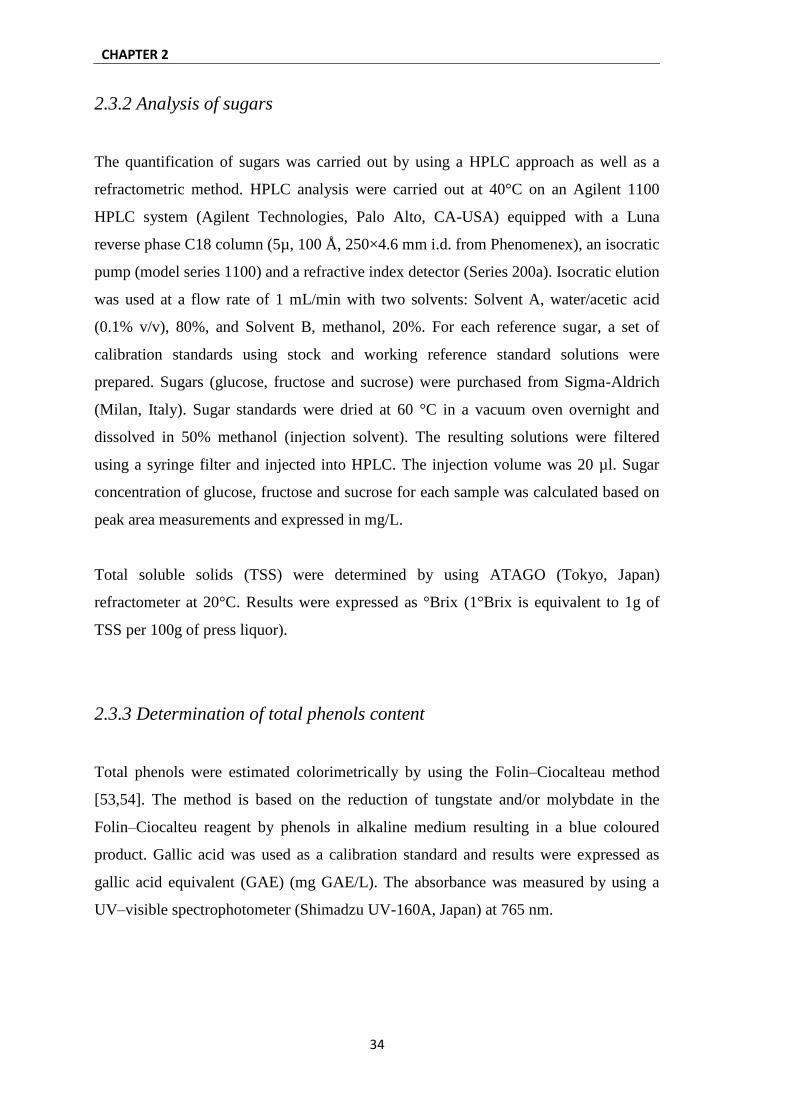
2.3.2 Analysis of sugars
The quantification of sugars was carried out by using a HPLC approach as well as a
refractometric method. HPLC analysis were carried out at 40°C on an Agilent 1100
HPLC system (Agilent Technologies, Palo Alto, CA-USA) equipped with a Luna
reverse phase C18 column (5µ, 100 Å, 250×4.6 mm i.d. from Phenomenex), an isocratic
pump (model series 1100) and a refractive index detector (Series 200a). Isocratic elution
was used at a flow rate of 1 mL/min with two solvents: Solvent A, water/acetic acid
(0.1% v/v), 80%, and Solvent B, methanol, 20%. For each reference sugar, a set of
calibration standards using stock and working reference standard solutions were
prepared. Sugars (glucose, fructose and sucrose) were purchased from Sigma-Aldrich
(Milan, Italy). Sugar standards were dried at 60 °C in a vacuum oven overnight and
dissolved in 50% methanol (injection solvent). The resulting solutions were filtered
using a syringe filter and injected into HPLC. The injection volume was 20 µl. Sugar
concentration of glucose, fructose and sucrose for each sample was calculated based on
peak area measurements and expressed in mg/L.
Total soluble solids (TSS) were determined by using ATAGO (Tokyo, Japan)
refractometer at 20°C. Results were expressed as °Brix (1°Brix is equivalent to 1g of
TSS per 100g of press liquor).
2.3.3 Determination of total phenols content
Total phenols were estimated colorimetrically by using the Folin–Ciocalteau method
[53,54]. The method is based on the reduction of tungstate and/or molybdate in the
Folin–Ciocalteu reagent by phenols in alkaline medium resulting in a blue coloured
product. Gallic acid was used as a calibration standard and results were expressed as
gallic acid equivalent (GAE) (mg GAE/L). The absorbance was measured by using a
UV–visible spectrophotometer (Shimadzu UV-160A, Japan) at 765 nm.

Citrus fruit processing and orange press liquor characterization
35
2.3.4 Determination of the total antioxidant activity (TAA)
Total Antioxidant Activity (TAA) was determined by an improved version of the ABTS
radical cation decolourisation assay in which the chromogenic ABTS (2,2-azino-bis-(3-
ethylbenzothiaz oline-6-sulfonic acid) radical cation is generated by oxidation of ABTS
with potassium persulphate before the addition of the antioxidant [55,56]. The ABTS
decolourisation was measured as inhibition percentage of the absorbance at 734 nm.
The concentration of antioxidant giving the same inhibition percentage of absorbance of
the radical cation as 1 mM 6-hydroxy-2,5,7,8-tetramethylchroman-2-carboxylic acid
(Trolox) was calculated in terms of the Trolox Equivalent Antioxidant Capacity
(TEAC) at 5 min contact.
2.3.5 Analytical results
Fig. 2.2 shows the chromatographic profile of phenolic compounds obtained for the raw
press liquor. Phenolic compounds were better appreciated at 280 nm. The highest peak
was found to be hesperidin with an intensity value of 105763µV and a retention time of
46.958 min. To quantify the hesperidin a calibration curve was developed using four
levels of concentration (20, 50, 100 and 200 mg/L). The calibration curve had
coefficient of linear correlation equal to 0.992 with y-intercept close to zero.
These results are in agreement with similar works, where hesperidin has been found as
the principal flavonoid present in the orange peel [46]. Although there are at least ten
phenolic compounds in the press liquor, hesperidin was selected to evaluate the
membrane performance in terms of selectivity towards flavonoids.
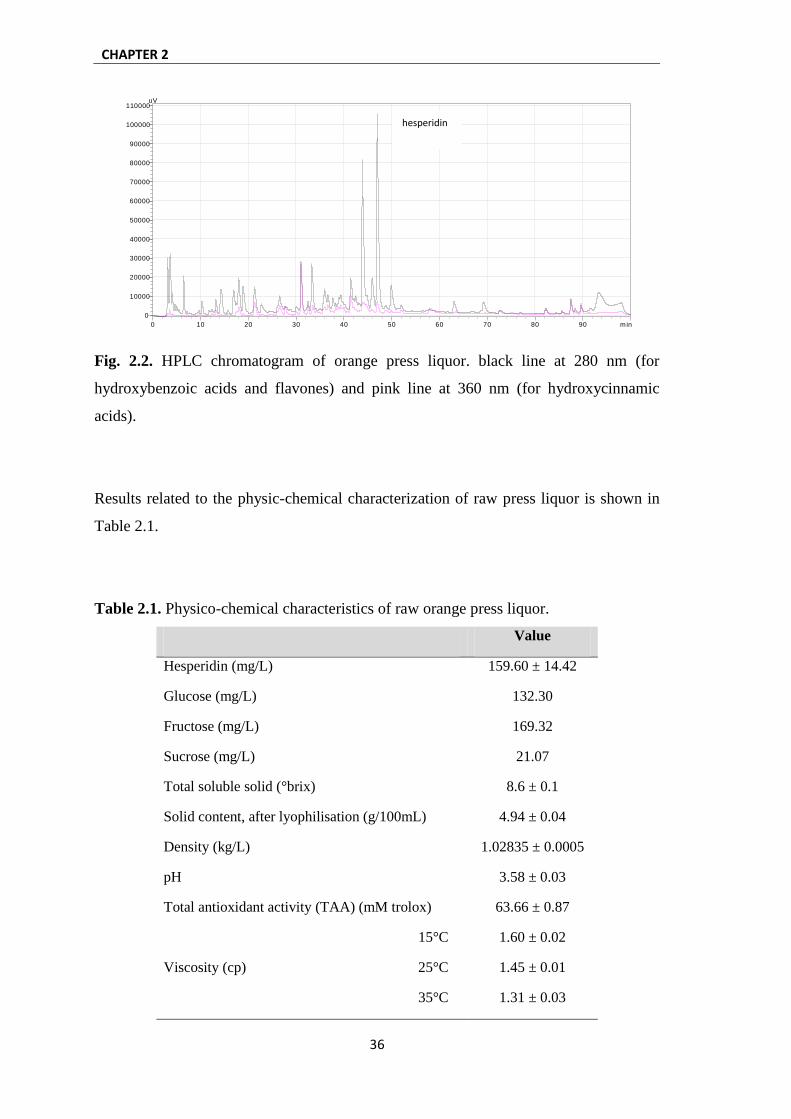
CHAPTER 2
36
Fig. 2.2. HPLC chromatogram of orange press liquor. black line at 280 nm (for
hydroxybenzoic acids and flavones) and pink line at 360 nm (for hydroxycinnamic
acids).
Results related to the physic-chemical characterization of raw press liquor is shown in
Table 2.1.
Table 2.1. Physico-chemical characteristics of raw orange press liquor.
Value
Hesperidin (mg/L) 159.60 ± 14.42
Glucose (mg/L) 132.30
Fructose (mg/L) 169.32
Sucrose (mg/L) 21.07
Total soluble solid (°brix) 8.6 ± 0.1
Solid content, after lyophilisation (g/100mL) 4.94 ± 0.04
Density (kg/L) 1.02835 ± 0.0005
pH 3.58 ± 0.03
Total antioxidant activity (TAA) (mM trolox) 63.66 ± 0.87
Viscosity (cp)
15°C 1.60 ± 0.02
25°C 1.45 ± 0.01
35°C 1.31 ± 0.03
0 10 20 30 40 50 60 70 80 90 min
0
10000
20000
30000
40000
50000
60000
70000
80000
90000
100000
110000uV
hesperidin
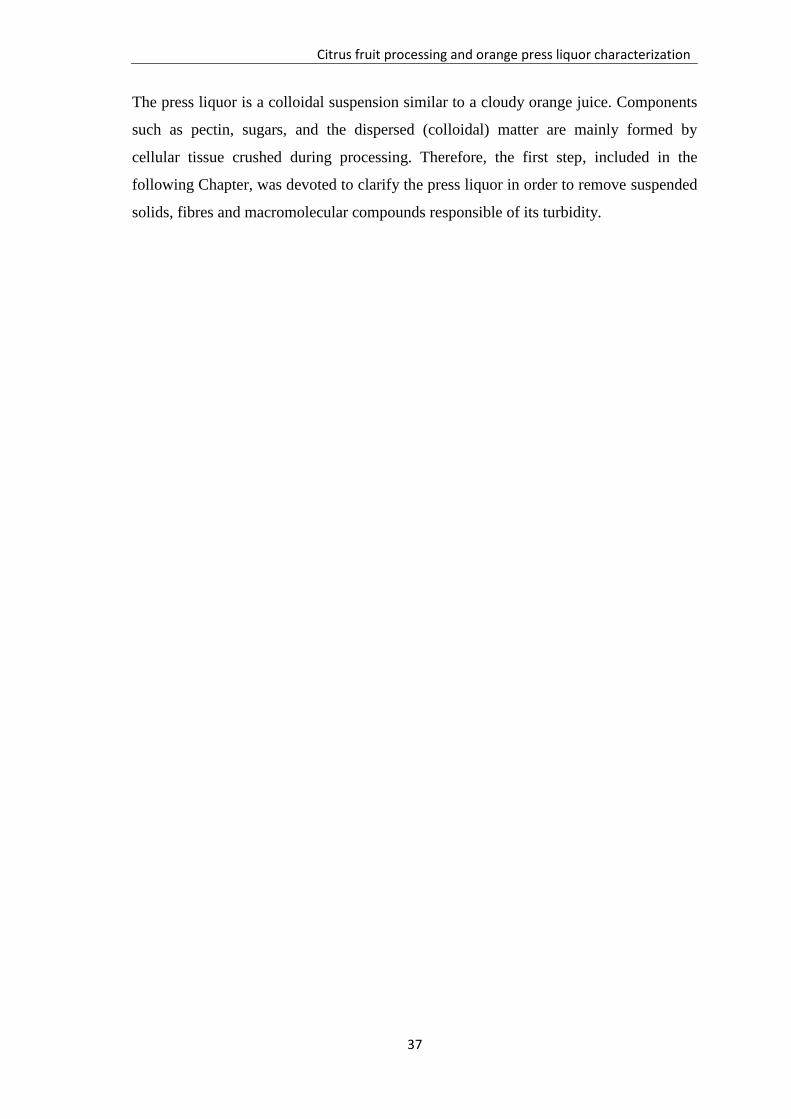
Citrus fruit processing and orange press liquor characterization
37
The press liquor is a colloidal suspension similar to a cloudy orange juice. Components
such as pectin, sugars, and the dispersed (colloidal) matter are mainly formed by
cellular tissue crushed during processing. Therefore, the first step, included in the
following Chapter, was devoted to clarify the press liquor in order to remove suspended
solids, fibres and macromolecular compounds responsible of its turbidity.

CHAPTER 2
38
References
[1] F. Gmitter, X. Hu. The possible role of Yunnan, China, in the origin of
contemporary citrus species (rutaceae).Economic Botany, 44 (1990) 267-277.
[2] FAOSTAT, 2010, Available at: http://faostat.fao.org/site/479/default.aspx
(accessed May 2012).
[3] D.V. Ratnam, D.D Ankola, V. Bharswaj, D.K Sahana, M.N.V Ravi Kumar, Role of
antioxidants in prophylaxis and therapy: A pharmaceutical perspective. Journal of
Controlled Release,113 (2006) 189-207
[4] S.M.S. Sawalha, D. Arráez-Román, A. Segura-Carretero, A. Fernández-Gutiérrez,
Quantification of main phenolic compound in sweet and bitter orange Peel using
CE-MS/MS. Food Chemistry, 116 (2009) 567-574
[5] P.M. Kris-Etherton, K.D. Hecker, A. Bonanome, S.M. Coval, A.E. Binkoski, K.F.
Hilpert. Bioactive compounds in foods: their role in the prevention of
cardiovascular disease and cancer. The American Journal of Medicine, 113(9)
(2002) 71–88.
[6] S. Liu, J.E. Manson, I.M. Lee, R.C. Stephen, C.H. Hennekens, W.C. Wilett. Fruit
and vegetable intake and risk of cardiovascular disease: the women’s health study.
American Journal of Clinical Nutrition, 72 (2000) 922–928.
[7] N. Salah, N.J. Miller, G. Paganga, L. Tijburg, G.P. Bolwell, C. Riceevans.
Polyphenolic flavanols as scavengers of aqueous phase radicals and as chain-
breaking antioxidants. Archives of Biochemistry and Biophysics, 322(2) (1995)
339–346.
[8] J.W. Lampe. Health effects of vegetables and fruits: assessing mechanisms of
action in human experimental studies. American Journal of Clinical Nutrition,70
(1999) 475s–490s.
[9] C.J. Guo, J.J. Yang. Progress in the study of antioxidant capacity of fruits and
vegetables. China Public Health, 17 (2001) 87–88.
[10] Y.Z.S. Fang, S. Yang, G.Y. Wu. Free radicals, antioxidants and nutrition, Nutrition,
18 (2002) 872–879.
[11] R.A. Jacob. The integrated antioxidant system. Nutrition Research, 15 (1995) 755–
766.

Citrus fruit processing and orange press liquor characterization
39
[12] H. Sies. Oxidative stress: oxidants and antioxidants. Experimental Physiology, 82
(1997) 291–295.
[13] K.B. Beckman, B.N. Ames. The free radical theory of aging matures. Physiological
Reviews, 78 (1998) 547–581.
[14] H. Chen, M. Ward, B. Graubard, E. Heineman, R. Markin, N. Potischman, R.
Russell, D. Weisenburger, L. Tucker. Dietary patterns and adenocarcinoma of the
esophagus and distal stomach. The American Journal of Clinical Nutrition, 75,
(2002) 137–144.
[15] F. Levi, C. Pasche, F. Lucchini, C. Bosetti, S. Franceschi, P. Monnier, C. La
Vecchia. Food groups and oesophageal cancer risk in Vaud, Switzerland. European
Journal of Cancer Prevention, 9 (2000) 257–263.
[16] D. Palli, A. Russo, L. Ottini, G. Masala, C. Saieva, A. Amorosi, A. Cama, C.
D’Amico, M. Falchetti, R. Palmirotta, A. Decarli, R.M. Costantini, J.F. Fraumeni
Jr. Red meat, family history, and increased risk of gastric cancer with microsatellite
instability. Cancer Research, 61 (2001) 5415–5419.
[17] R.S.R. Zand, D.J.A. Jenkins, E.P. Diamandis. Flavonoids and steroid hormone-
dependent cancers. Journal of Chromatography B, 777 (2002) 219– 232.
[18] M. McCullough, A. Robertson, E. Jacobs, A. Chao, E. Calle, M. Thun. A
prospective study of diet and stomach cancer mortality in United States men and
women. Cancer Epidemiology. Biomarkers and Prevention, 10 (2001) 1201–1205.
[19] E. Feldman. Fruits and vegetables and the risk of stroke. Nutrition Reviews, 59
(2001) 24–27.
[20] K. Joshipura, A. Ascherio, J. Manson, M. Stampfer, E. Rimm, F. Speizer, C.
Hennekens, D. Spiegelman, W. Willett. Fruit and vegetable intake in relation to risk
of ischemic stroke. JAMA, 282 (1999) 1233–1239.
[21] A.M. Hackett, (1986). The metabolism of flavonoid compounds in mammals. In
Plant Flavonoids in Biology and Medicine: Biochemical Pharmacological, and
Structural-Activity Relationships, p. 177-194, Alan R. Liss, New York, NY USA
[22] E. Kurowska, J. Spence, J. Jordan, S. Wetmore, D. Freeman, L. Piche, P. Serratore.
HDL-cholesterol-raising effect of orange juice in subjects with
hypercholesterolemia. The American Journal of Clinical Nutrition, 72 (2000) 1095–
1100.

CHAPTER 2
40
[23] C. Fortes, F. Forastiere, S. Farchi, E. Rapiti, G. Pastori, C. Perucci. Diet and overall
survival in a cohort of very elderly people. Epidemiology, 11 (2000) 440–445.
[24] F. Areias, A. Rego, C. Oliveira, R. Seabra. Antioxidant effect of flavonoids after
ascorbate/Fe(2+)-induced oxidative stress in cultured retinal cells. Biochemical
Pharmacology, 62 (2001) 111–118.
[25] E. Bae, M. Han, D. Kin. In vitro anti-helicobacter pylori activity of some
flavonoids and their metabolites. Planta Medica, 65 (1999) 442–443.
[26] W. Bear, R. Teel Effects of citrus phytochemicals on liver and drug cytochrome
P450 activity and on the in vitro metabolism of the tobacco-specific nitrosamine
NNK. Anticancer Research, 20 (2000) 3323–3329.
[27] W. Bear, R. Teel. Effects of citrus flavonoids on the mutagenicity of heterocyclic
amines and on cytochrome P450 1A2 activity. Anticancer Research, 20 (2000)
3609–3614.
[28] N. Borradaile, K. Carroll, E. Kurowska. Regulation of HepG2 cell apolipoprotein B
metabolism by the citrus flavanones hesperetin and naringenin. Lipids, 34 (1999)
591–598.
[29] C. de Gregorio Alapont, R. Garcia-Domenech, J. Galvez, M. Ros, S. Wolski, M.
Garcia. Molecular topology, a useful tool for the search of new antibacterials.
Bioorganic and Medicinal Chemistry Letters, 10 (2000) 2033–2036.
[30] S. Jeon, S. Bok, M. Jang, M. Lee, K. Nam, Y. Park, S. Rhee, M. Choi.
Antioxidative activity of naringin and lovastatin in high cholesterol-fed rabbits.
Life Sciences, 69 (2001) 2855–2866.
[31] Y. Kato, Y. Miyake, K. Yamamoto, Y. Shimomura, H. Ochi, Y. Mori, T. Osawa.
Preparation of a monoclonal antibody to N(epsilon)-(hexanonyl)lysine, application
to the evaluation of protective effects of flavonoid supplementation against
exercise-induced oxidative stress in rat skeletal muscle. Biochemical and
Biophysical Research Communications, 274 (2000) 389–393.
[32] D. Kim, M. Song, E. Bae, M. Han. Inhibitory effect of herbal medicines on
rotavirus infectivity. Biological and Pharmaceutical Bulletin, 23 (2000) 356–358.
[33] H. Kohno, M. Taima, T. Sumida, Y. Azuma, H. Ogawa, T. Tanaka. Inhibitory
effect of mandarin juice rich in beta-cryptoxanthin and hesperidin on 4-
(methylnitrosamino)-1-(3-pyridyl)-1-butanoneinduced pulmonary tumorigenesis in
mice. Cancer Letters, 174 (2001) 141–150.

Citrus fruit processing and orange press liquor characterization
41
[34] J. Manthey, K. Grohmann, N. Guthrie. Biological properties of citrus flavonoids
pertaining to cancer and inflammation. Current Medicinal Chemistry, 8 (2001)
135–153.
[35] Y. Miyagi, A. Om, K. Chee, M. Bennink. Inhibition of azoxymethane-induced
colon cancer by orange juice. Nutrition and Cancer, 36 (2000) 224–229.
[36] Y. Miyake, K. Shimoi, S. Kumazawa, K. Yamamoto, N. Kinae, T. Osawa.
Identification and antioxidant activity of flavonoid metabolites in plasma and urine
of eriocitrin-treated rats. Journal of Agricultural and Food Chemistry, 48 (2000)
3217–3224.
[37] L. Wilcox, N. Borradaile, L. de Dreu, M. Huff. Secretion of hepatocyte apoB is
inhibited by the flavonoids, naringenin and hesperetin, via reduced activity and
expression of ACAT2 and MTP. Journal of Lipid Research, 45 (2001) 725–734.
[38] M. Zhang, J. Zhang, H. Ji, J. Wang, D. Qian. Effect of six flavonoids on
proliferation of hepatic stellate cells in vitro. Acta Pharmacologica Sinica, 21
(2000) 253–256.
[39] W. Ren, Z. Qian, H. Wang, L. Zhu, L. Zhang. Flavonoids: Promising anticancer
agents. Medicinal Research Reviews, 23(4) (2003) 519–534.
[40] O. Benavente-Garcia, J. Castillo, J.A. Del Rio. Changes in neodiosmin levels
during the development of Citrus aurantium leaves and fruits postulation of a
neodiosmin biosynthetic pathway. Journal of Agricultural and Food Chemistry, 41
(1993) 1916–1919.
[41] M.T. Huang, T. Osawa, C.T. Ho, R.T. Rosen. (1994) Food Phytochemicals for
Cancer Prevention. I. Fruits and Vegetables. Austin, TX: American Chemical
Society.
[42] N.C. Cook, S. Samman. Review: Flavonoids—chemistry, metabolism,
cardioprotective effects, and dietary sources. Journal of Nutritional Biochemistry, 7
(1996) 66–76.
[43] L. Bravo. Polyphenols: Chemistry, dietary sources, metabolism, and nutritional
significance. Nutrition Reviews, 56 (1988) 317–333.
[44] A.S. Aherne, N.M. Obrien. Dietary flavonols: Chemistry, food content and
metabolism. Nutrition, 18 (2002) 75–81.
[45] L.H. Yao, Y.M. Jiang, J. Shi, F.A. Tomá, S. Barbera, N. Datta, R. Singanusong,
S.S. Chen. Flavonoids in Food and Their Health Benefits. Plant Foods for Human
Nutrition, 59 (2004) 113–122
CHAPTER 2
42
[46] J.J. Petersona, J.T. Dwyera, G.R. Beecherb, S.A. Bhagwatc, S.E. Gebhardtc, D.B.
Haytowitzc, J.M. Holdenc. Flavanones in oranges, tangerines (mandarins), tangors,
and tangelos: a compilation and review of the data from the analytical literature.
Journal of Food Composition and Analysis, 19 (2006) S66–S73
[47] D. Bagchi, M. Bagchi, S.J. Stohs, S.D. Ray, C.K. Sen, H.G. Preuss. Free radicals
and grape seed proanthocyanidin extract: importance in human health and disease
prevention. Toxicology, 148 (2) (2000) 187–189.
[48] R.P. Singh, K.N.C. Murthy, G.K. Jayaprakasha. Studies on the antioxidant activity
of pomegranate peel and seed extracts using in vitro models. Journal of Agricultural
and Food Chemistry, 50 (2002) 81–86.
[49] R.A. Ruby-Figueroa, A. Cassano, E. Drioli, Ultrafiltration of orange press liquor:
Optimization for permeate flux and fouling index by response surface
methodology. Separation and purification technology, 80 (2011) 1-10.
[50] R.M. Goodrich, R.J. Braddock. 2004. Major By-products of the Florida Citrus
Processing Industry, Series of the Food Science and Human Nutrition Department,
University of Florida, FSHN05-22.
[51] U. Imeh, S. Khokhar. Distribution of conjugated and free phenols in fruits:
antioxidant activity and cultivar variations. Journal of Agricultural and Food
Chemistry, 50 (2002) 6301-6306.
[52] E.M. Garcia-Castello, J. R. McCutcheon. Dewatering press liquor derived from
orange production by forward osmosis. Journal of Membrane Science, 372 (2011)
97–101.
[53] E. Roura, C. Andrés-Lacueva, R. Estruch, M.R. Lamuela-Raventós. Total
polyphenol intake estimated by modified Folin–Ciocalteu assay of urine. Clinical
Chemistry, 52 (2006) 749–752.
[54] V.L. Singleton, R. Orthofer, R.M. Lamuela-Raventos, Analysis of total phenols and
other oxidation substrates and antioxidants by means of Folin–Ciocalteu reagent.
Method in Enzymology, 299 (1999) 152.
[55] C.A. Rice-Evans, N.J. Miller. Total antioxidant status in plasma and body fluids.
Method in Enzymology, 243 (1994) 279–298.
[56] R. Re, N. Pellegrini, A. Proteggente, A. Pannala, M. Yang, C.A. Rice-Evans,
Antioxidant activity applying and improved ABTS radical cation decolorization
assay. Free Radical Biology and Medicine, 26 (1999) 1231–1237.

43
CHAPTER 3
Orange press liquor clarification
Orange press liquor is a colloidal suspension with physic-chemical properties similar to
that of cloudy orange juice. Components such as pectin, sugars, and the dispersed
(colloidal) matter are mainly formed by cellular tissue crushed during processing.
Particles in this cloudy press liquor adhere together and form aggregates of increasing
size (flocculation) which may be settle due to gravity. An irreversible process, named
coagulation, may be reached when the aggregates change to a much dense form. To
obtain a clear liquor the suspended particles have to be removed in a process called
clarification [1]. Clarification is an important step in the processing of fruit juices [1,2].
Traditional processes are carried out by using enzymatic treatments, clarifying agents or
centrifugation [3]. The enzyme depectinization has two effects: it degrades the viscous
soluble pectin and, at the same time, causes the aggregation of cloud particles. In acidic
conditions (press liquor has a pH of 3.58±0.03) pectin molecules carry a negative
charge allowing them to repel one another. Pectinases, enzymes typically used for this
process, degrade the pectin and expose part of the positively charged protein reducing
the electrostatic repulsion between cloud particles clumping together. These larger
particles will eventually settle out, but to improve the process, flocculating or fining
agents, as shown in Table 3.1, must to be added [1]. Fining agents work either by
sticking to particles, making them heavy enough to sink, or by using charged ions to
cause particles to stick to each other, making them settle to the bottom. Posteriorly, a
centrifugation and subsequent filtration (fining) are needed to give the clear juice [1].
The conventional process has several disadvantages. It is labour-intensive, time
consuming and requires a discontinuous operation. In addition, the use of additives
(fining agents and filter aids) can leave a sight after taste in the juice [4]. In this sense
membrane processes such as MF and UF have been proposed as a successfully
alternative, because compared with traditional juice processing methods, they are low-
cost and non-thermal separation techniques which involve no phase change or chemical
agents [5,6].

CHAPTER 3
44
Table 3.1. Agents used in the conventional fruit juice clarification (adapted from [1]).
Name Description
Sparkolloid A natural albuminous protein extracted from kelp and very finely
powdered
Gelatin Mixture of gelatins and silicon dioxide, with the active ingredient being
animal collagen
Kieselsol Suspension of small silica particles usually used in combination with
gelatins. This fining aids in pulling proteins out of suspension
Bentonite
Refined clay (montmorillonite) presented as powder or coarse granules.
Bentonite must be added to hot water: stir well and let it stand for 36–
48h before use, so that it swells and becomes almost gelatin-like
Isinglass Protein produced from sturgeon swim bladders. It is presented either as a
fine powder or as dry hard fragments
Considering the advantages of membrane processes MF and UF membranes were used
and tested for the clarification of orange press liquor. The effectiveness of the
membrane treatment was analysed experimentally evaluating the membrane
performance in terms of productivity and selectivity towards specific components. In
membrane process several factors, such as membrane characteristics and operating
conditions, affect the membrane performance. Therefore, MF and UF membranes were
evaluated for their characteristics and at different operating conditions in order to
determine a suitable membrane and the optimal conditions to reach a maximum
permeate flux and a minimum rejection towards components of interest (i.e. hesperidin).
3.1 Clarification of orange press liquor: Evaluation of membrane
characteristics
MF and UF membranes were tested to evaluate their performance in terms of permeate
flux and rejection of polyphenols. The results obtained in this step allow to select the
suitable membrane for the clarification of the raw press liquor. Experiments were
performed by using a laboratory bench plant (Fig. 3.1) equipped with a stainless steel

Orange press liquor clarification
45
cell suitable for containing a flat-sheet membrane with a membrane surface of 17.49
cm2. Experimental runs were performed by using three flat-sheet membranes, made in
PVDF and supplied by Microdyn-Nadir GmbH (Wiesbaden, Germany) the properties of
which are shown in Table 3.2.
Fig. 3.1. Schematic diagram of the experimental set-up: (1) feed tank; (2) feed pump;
(3,5) pressure gauges; (4) flat-sheet cell; (6) digital balance; (7) retentate valve; (8)
permeate tank; (9) thermometer.
Experimental runs were performed according to the total recycle configuration (TRC) in
which both permeate and retentate streams were continuously recycled back to the feed
tank. This configuration ensured a steady state in the volume and composition of the
feed. In order to evaluate the effect of feed concentration on the membrane
performance, experiments were also performed according to the batch concentration
configuration (BCC) in which the permeate stream was continuously removed. In both
configurations operating conditions such as transmembrane pressure (TMP),
temperature and feed flow rate were fixed at 1 bar, 25.26±0.3°C and 185 L/h,
respectively. Each run was stopped after 180 min of continuous operation. The analysis
of responses variables such as hesperidin, sugars were obtained according with the
procedure described in section 2.3.

CHAPTER 3
46
Table 3.2. Characteristics of selected membranes.
Membrane type
MV020T UV150T FMU6R2
Membrane process MF UF UF
Thickness (mm) 0.188±0.005**
0.212±0.004**
0.190±0.003**
Molecular weight cut-off (kDa) ˗ 150* 200
*
Pore size (µm) 0.2* - -
Maximum pore size distribution
(frequency %) 93.21
** 79.77
** 40.47
**
Diameter at maximum pore size
distribution (µm) 0.488±0.1970
** 0.195±0.0030
** 0.212±0.0004
**
Contact angle (°) 79.78±0.133**
74.60±0.356**
68.83±0.405**
* Values obtained from the manufacturer
** Values obtained experimentally
Results obtained under TRC showed that the FMU6R2 membrane, with a molecular
weight cut-off of 200 kDa, presented the lowest rejection for hesperidin and sugars
corresponding to 39.1% and 30.8%, respectively (Fig. 3.2-a and 3.2-b). The MV020 and
UV150 membranes having higher and lower pore size in comparison with the FMU6R2
membrane, respectively, showed higher values of rejection. This behaviour can be
attributed to different types of fouling characterising each membrane. For the MV020
membrane a complete or intermediate pore blocking is the dominant type of fouling,
producing a reduction in pore size that results in a higher rejection. On the other hand,
for the UV150 membrane, a cake layer formation due to the build-up of
macromolecules on the membrane surface, acts as an additional barrier which produces
an increase in the rejection of hesperidin and sugar.
Permeate fluxes are also strictly related with membrane characteristics as well as with
fouling phenomena. Fig. 3.3-a shows the time course of permeate flux observed for the
investigated membranes in selected operating conditions according with the total
recycle configuration (TRC). Results showed that differences between the investigated

Orange press liquor clarification
47
membranes are not statistically significant (p=0.1096; F-ratio=2.30). Different initial
permeate flux values were observed for different membranes. In particular, the MV020
membrane showed the highest initial permeate flux (Fig. 3.3-a), due to its highest pore
size. These effects can be appreciated until a steady-state permeate flux is reached; after
this point (around 50 min of process) the differences in permeate flux between different
membranes are not evident. Even though the MV020 membrane presented the highest
initial permeate flux, this membrane showed also a greater value of flux drop (about
51.4%) in comparison with UV150 and FMU6R2 membranes (36.1% and 38.4%,
respectively).
Fig. 3.2. Rejection of (a) sugar and (b) hesperidin obtained during MF-UF under TRC
and BC configuration using flat-sheet membranes. Operating conditions: TMP= 1 bar,
T= 25°C, feed flow rate= 185 L/h.
61.5 57.7
30.8
65.4 65.4
34.6
0.0
10.0
20.0
30.0
40.0
50.0
60.0
70.0
80.0
90.0
100.0
MV020 UV150 FMU6R2 MV020 UV150 FMU6R2
TRC BCC
Suga
r re
ject
ion
(%
)
64.0 63.1
39.1
64.4 64.2
44.7
0.0
10.0
20.0
30.0
40.0
50.0
60.0
70.0
80.0
90.0
100.0
MV020 UV150 FMU6R2 MV020 UV150 FMU6R2
TRC BCC
He
spe
rid
in r
eje
ctio
n (
%)
(a)
(b)
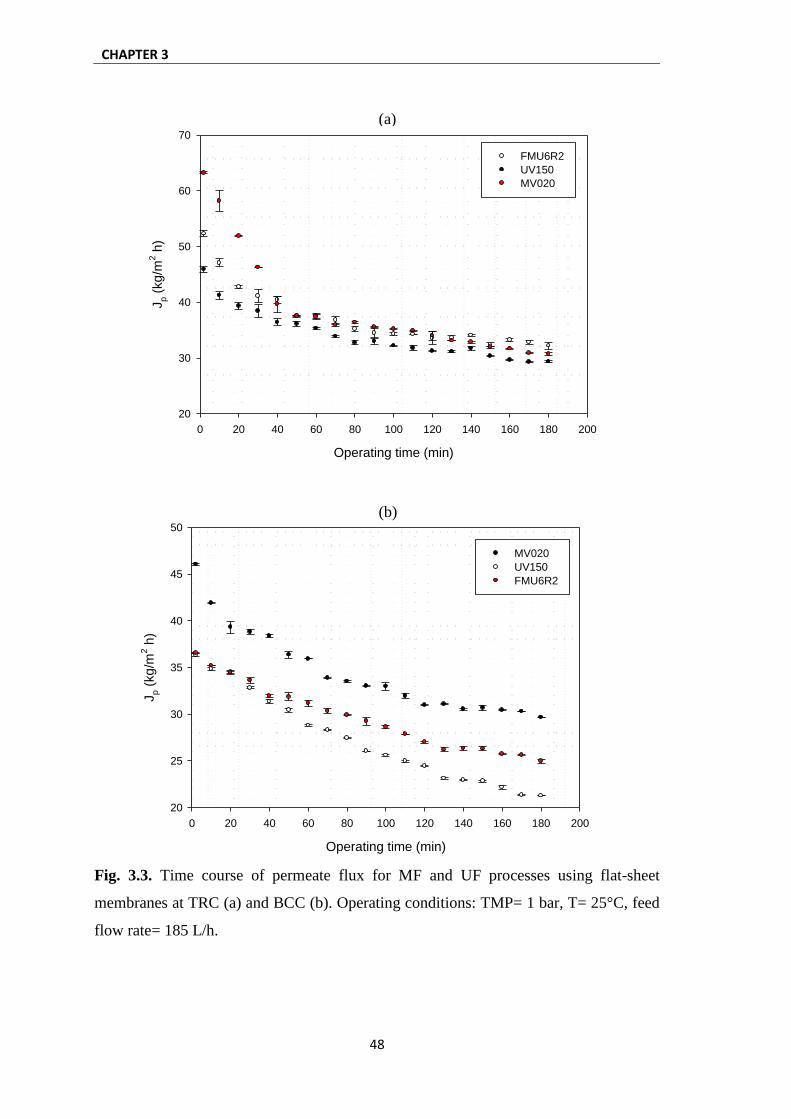
CHAPTER 3
48
Operating time (min)
0 20 40 60 80 100 120 140 160 180 200
Jp (
kg/m
2 h
)
20
30
40
50
60
70
FMU6R2
UV150
MV020
Operating time (min)
0 20 40 60 80 100 120 140 160 180 200
Jp (
kg
/m2 h
)
20
25
30
35
40
45
50
MV020
UV150
FMU6R2
Fig. 3.3. Time course of permeate flux for MF and UF processes using flat-sheet
membranes at TRC (a) and BCC (b). Operating conditions: TMP= 1 bar, T= 25°C, feed
flow rate= 185 L/h.
(a)
(b)

Orange press liquor clarification
49
Similar results were obtained during BCC experiments, where MV020 showed the
highest values of hesperidin and sugar rejection (Fig. 3.2-a and 3.2-b). Under BCC all
the investigated membranes showed higher values in hesperidin and sugar rejection in
comparison with TRC. This effect is associated with the increase of feed concentration
which produces an increasing of fouling phenomena. The increase in fouling can be also
appreciated through a permeate flux decay, where statistically significant differences
(p=0.000; F-ratio=13.38) were observed between the investigated membranes. These
differences were not appreciated between UV150 and FMU6R2 membranes (p=0.1075;
F-ratio=2.73). The permeate flux decay under BCC was higher when compared with
TRC, as shown in Fig. 3.3-b.
The results obtained with flat-sheet membranes showed a strong the relationship
between pore size and membrane performance in terms of permeate flux and rejection
towards polyphenols and sugars. According to these results UF membranes were
preferred in the treatment of orange press liquor since they allow to obtain an
appropriate combination of permeate flux and lower rejection of polyphenols. At this
purpose the effect of operating conditions on the membrane performance was studied by
using an UF membrane with a MWCO of 100 kDa, as reported in the following.
3.2 Clarification of orange press liquor: Evaluation of operating
conditions
The effect of operating variables such as transmembrane pressure (TMP), temperature
(T) and feed flow-rate (Qf) was evaluated on the performance of hollow fiber UF
membranes in terms of permeate flux, membrane fouling and blocking index. Similarly,
the effect of these parameters was also investigated in terms of recovery of antioxidant
compounds in the permeate stream. In both cases the Response Surface Methodology
(RSM) approach was used for the data analysis.
UF experiments were performed by using a laboratory unit (Fig. 3.4) equipped with a
hollow fiber polysulphone membrane module supplied by China Blue Star Membrane
Technology Co., Ltd (Beijing, China) with an effective membrane area of 0.16 m2 and a

CHAPTER 3
50
nominal molecular weight cut-off (MWCO) of 100 kDa. A heat exchanger, placed into
the feed tank, was used to keep the feed temperature constant.
Fig. 3.4. Scheme of UF experimental setup.
This study was performed according to the total recycle configuration in which both
permeate and retentate streams were continuously recycled back to the feed tank to
ensure a steady state in the volume and composition of the feed. Based on the capability
of the experimental set-up and the preliminary single-variable tests, the range of
operating conditions was chosen as follows: TMP = 0.2–1.4 bar, T= 15–35°C and
Qf= 85–245 L/h. The levels, code and intervals of variation of the operating variables
are given in Table 3.3. Experimental runs were performed according to the Box–
Behnken design (Table 3.4) which is composed of 30 runs divided in two blocks, each
one with three central points (runs 13, 14, 15 and 28, 29, 30). The mass of collected
permeate was measured with an accuracy of ±0.1g every 10 min. Each run was stopped
after 180 min of continuous operation.

Orange press liquor clarification
51
Table 3.3. Experimental range and levels of the independent variables for Box-Behnken
design.
Variation levels
Feed Factors Code -1 0 1
TMP (bar) X1 0.2 0.8 1.4
Temperature (°C) X2 15 25 35
Feed Flow Rate (L/h) X3 85 165 245
The response variables such as permeate flux, blocking index and fouling index were
obtained using equations (1.4), (1.14) and (1.15), respectively. On the other hand,
measurement of polyphenols rejection and total antioxidant activity (TAA) were
obtained following the procedure showed in section 2.3.4.
The obtained model could explain a 96.31% (expressed R-squared) of the variability in
the permeate flux. Analysis of lack-of-fit test showed that the model appears to be
adequate for the observed data at the 95% of confidence level with a p-value greater
than 0.05 (P= 0.0559, F-ratio 5.46). In addition, a lower values of standard error
(0.687447), was obtained. The presence of autocorrelation was evaluated by means of
Durbin–Watson (DW) statistic. Since the P-value was greater than 5.0% (P= 0.9699),
there is no indication of a serial autocorrelation in the residuals at the 5.0% significance
level.
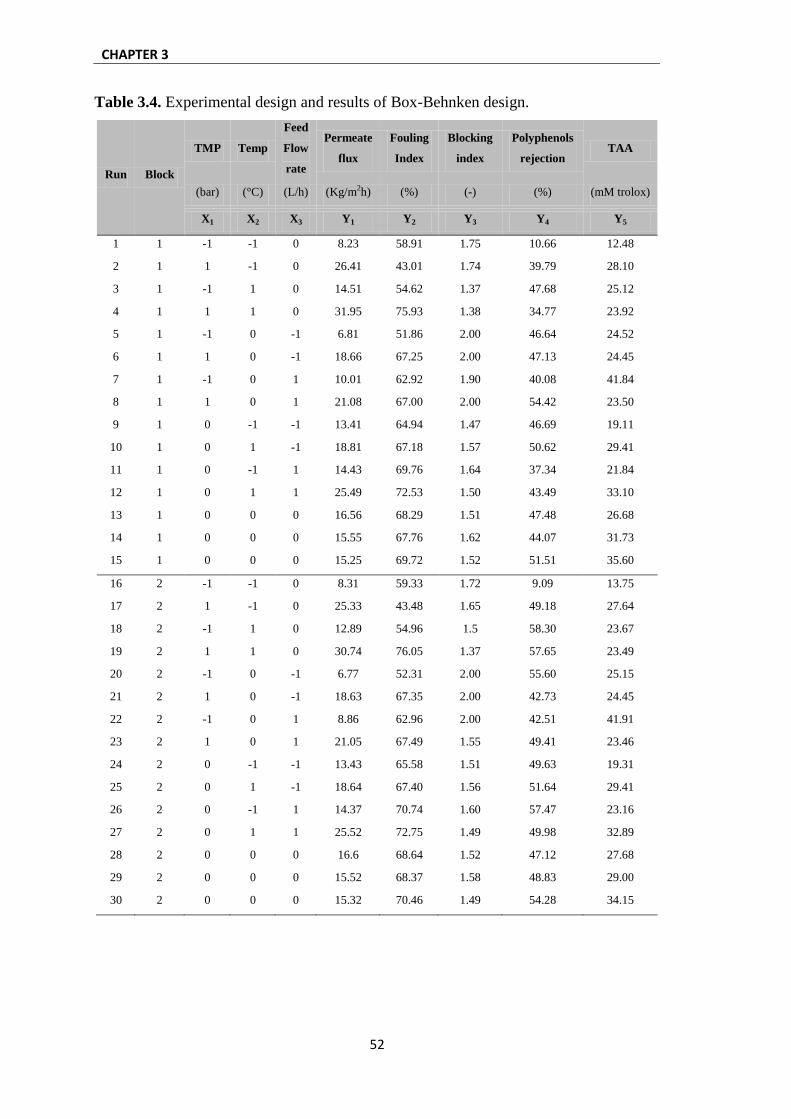
CHAPTER 3
52
Table 3.4. Experimental design and results of Box-Behnken design.
Run Block
TMP Temp
Feed
Flow
rate
Permeate
flux
Fouling
Index
Blocking
index
Polyphenols
rejection TAA
(bar) (°C) (L/h) (Kg/m2h) (%) (-) (%) (mM trolox)
X1 X2 X3 Y1 Y2 Y3 Y4 Y5
1 1 -1 -1 0 8.23 58.91 1.75 10.66 12.48
2 1 1 -1 0 26.41 43.01 1.74 39.79 28.10
3 1 -1 1 0 14.51 54.62 1.37 47.68 25.12
4 1 1 1 0 31.95 75.93 1.38 34.77 23.92
5 1 -1 0 -1 6.81 51.86 2.00 46.64 24.52
6 1 1 0 -1 18.66 67.25 2.00 47.13 24.45
7 1 -1 0 1 10.01 62.92 1.90 40.08 41.84
8 1 1 0 1 21.08 67.00 2.00 54.42 23.50
9 1 0 -1 -1 13.41 64.94 1.47 46.69 19.11
10 1 0 1 -1 18.81 67.18 1.57 50.62 29.41
11 1 0 -1 1 14.43 69.76 1.64 37.34 21.84
12 1 0 1 1 25.49 72.53 1.50 43.49 33.10
13 1 0 0 0 16.56 68.29 1.51 47.48 26.68
14 1 0 0 0 15.55 67.76 1.62 44.07 31.73
15 1 0 0 0 15.25 69.72 1.52 51.51 35.60
16 2 -1 -1 0 8.31 59.33 1.72 9.09 13.75
17 2 1 -1 0 25.33 43.48 1.65 49.18 27.64
18 2 -1 1 0 12.89 54.96 1.5 58.30 23.67
19 2 1 1 0 30.74 76.05 1.37 57.65 23.49
20 2 -1 0 -1 6.77 52.31 2.00 55.60 25.15
21 2 1 0 -1 18.63 67.35 2.00 42.73 24.45
22 2 -1 0 1 8.86 62.96 2.00 42.51 41.91
23 2 1 0 1 21.05 67.49 1.55 49.41 23.46
24 2 0 -1 -1 13.43 65.58 1.51 49.63 19.31
25 2 0 1 -1 18.64 67.40 1.56 51.64 29.41
26 2 0 -1 1 14.37 70.74 1.60 57.47 23.16
27 2 0 1 1 25.52 72.75 1.49 49.98 32.89
28 2 0 0 0 16.6 68.64 1.52 47.12 27.68
29 2 0 0 0 15.52 68.37 1.58 48.83 29.00
30 2 0 0 0 15.32 70.46 1.49 54.28 34.15

Orange press liquor clarification
53
Fig. 3.5 shows the linear, quadratic and interaction of each factor plotted in the form of
Pareto chart where the effect is significant if its corresponding bar crosses the vertical
line at the P= 0.05 level.
Fig. 3.5. Standardized pareto chart for the permeate flux.
The linear coefficients of TMP (b1) were found to be the most significant effect to
increase the permeate flux, followed by linear coefficient of temperature (b2), quadratic
effect of temperature (b22) and then the linear effect of feed flow-rate (b3). On the other
hand, the quadratic effect of feed flow rate (b33) produces a decrease in the permeate
flux with a significant effect (P≤0.05). The interaction factors as (b12), (b13) and the
quadratic effect of TMP (b11) do not produce a significant effect (P≥0.05) in the
permeate flux; therefore, for the next analyses these factors will not be included in the
regression model equation of the permeate flux. These results indicate that the
interaction of operating variables in the ultrafiltration of orange press liquor has to be
considered.
The quadratic regression equation describing the effect of the process variables on the
permeate flux in terms of coded levels is reported in the following:
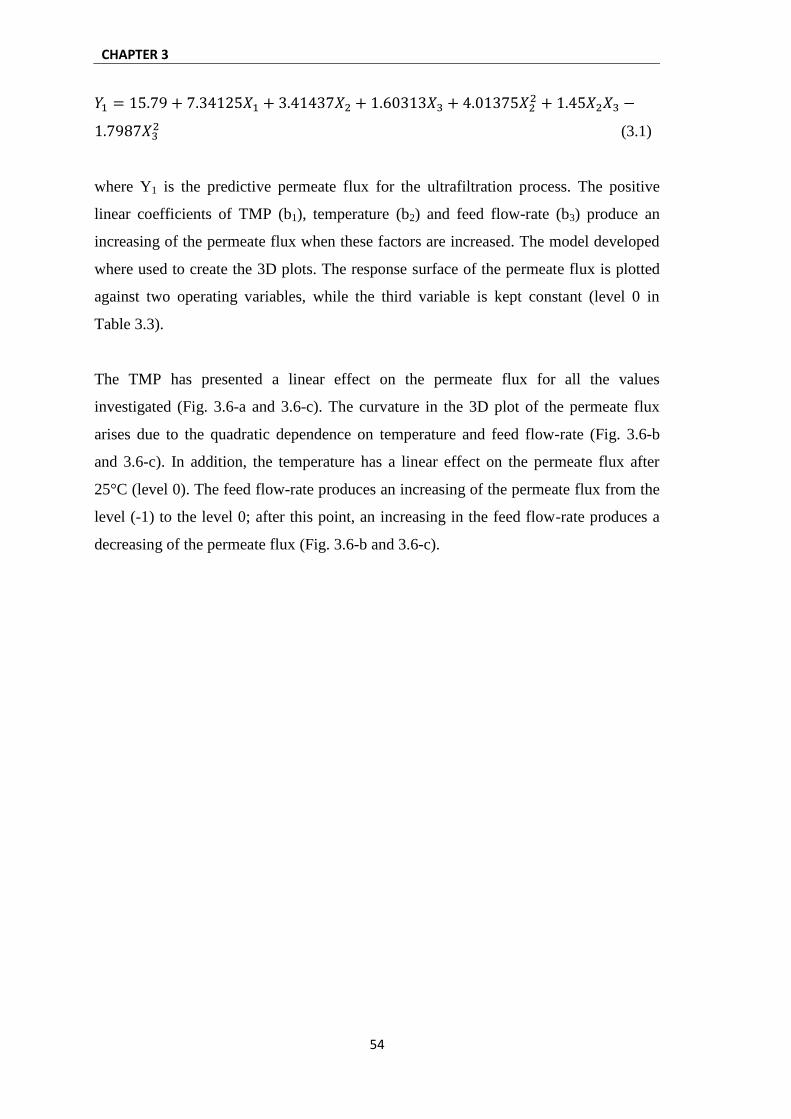
CHAPTER 3
54
(3.1)
where Y1 is the predictive permeate flux for the ultrafiltration process. The positive
linear coefficients of TMP (b1), temperature (b2) and feed flow-rate (b3) produce an
increasing of the permeate flux when these factors are increased. The model developed
where used to create the 3D plots. The response surface of the permeate flux is plotted
against two operating variables, while the third variable is kept constant (level 0 in
Table 3.3).
The TMP has presented a linear effect on the permeate flux for all the values
investigated (Fig. 3.6-a and 3.6-c). The curvature in the 3D plot of the permeate flux
arises due to the quadratic dependence on temperature and feed flow-rate (Fig. 3.6-b
and 3.6-c). In addition, the temperature has a linear effect on the permeate flux after
25°C (level 0). The feed flow-rate produces an increasing of the permeate flux from the
level (-1) to the level 0; after this point, an increasing in the feed flow-rate produces a
decreasing of the permeate flux (Fig. 3.6-b and 3.6-c).
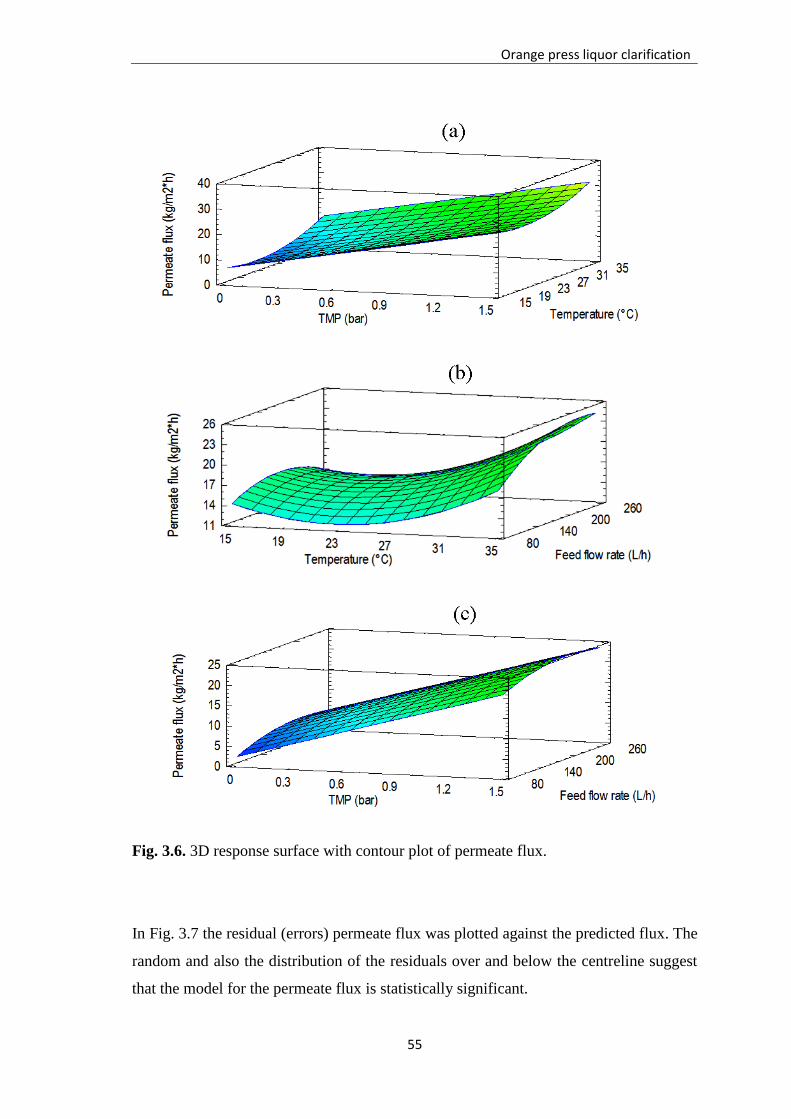
Orange press liquor clarification
55
Fig. 3.6. 3D response surface with contour plot of permeate flux.
In Fig. 3.7 the residual (errors) permeate flux was plotted against the predicted flux. The
random and also the distribution of the residuals over and below the centreline suggest
that the model for the permeate flux is statistically significant.

CHAPTER 3
56
Fig. 3.7. Plot of residuals against predicted response of permeate flux in the UF process.
In the case of fouling index the R-squared statistic obtained indicates that the model as
fitted explains 90.47% of its variability. Lack-of-fit test was equal to 0.0175 (F-ratio
10.5). This means that the model as fitted is not completely adequate to represent the
experimental data, and a more complex model including other factors should be used.
The Standard Error was equal to 1.07706. Since the P-value of the Durbin–Watson
statistic test is greater than 5.0% (P= 0.9700), there is no indication of serial
autocorrelation in the residuals at the 5.0% significance level.
The linear, quadratic and interaction effect depicted in Fig. 3.8 shows that the
interaction factor between TMP and temperature (b12) was found to be the most
significant effect to increase the fouling index, followed by quadratic effect of TMP
(b11) that produces a decreasing in the fouling index.
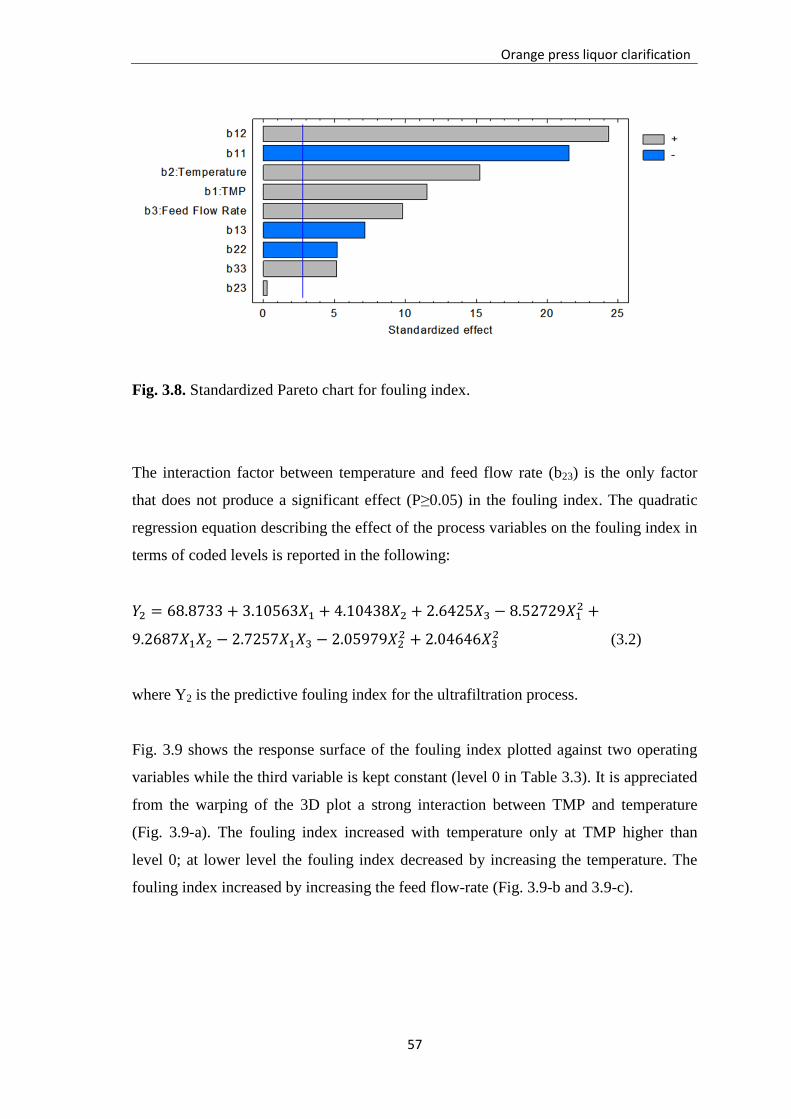
Orange press liquor clarification
57
Fig. 3.8. Standardized Pareto chart for fouling index.
The interaction factor between temperature and feed flow rate (b23) is the only factor
that does not produce a significant effect (P≥0.05) in the fouling index. The quadratic
regression equation describing the effect of the process variables on the fouling index in
terms of coded levels is reported in the following:
(3.2)
where Y2 is the predictive fouling index for the ultrafiltration process.
Fig. 3.9 shows the response surface of the fouling index plotted against two operating
variables while the third variable is kept constant (level 0 in Table 3.3). It is appreciated
from the warping of the 3D plot a strong interaction between TMP and temperature
(Fig. 3.9-a). The fouling index increased with temperature only at TMP higher than
level 0; at lower level the fouling index decreased by increasing the temperature. The
fouling index increased by increasing the feed flow-rate (Fig. 3.9-b and 3.9-c).
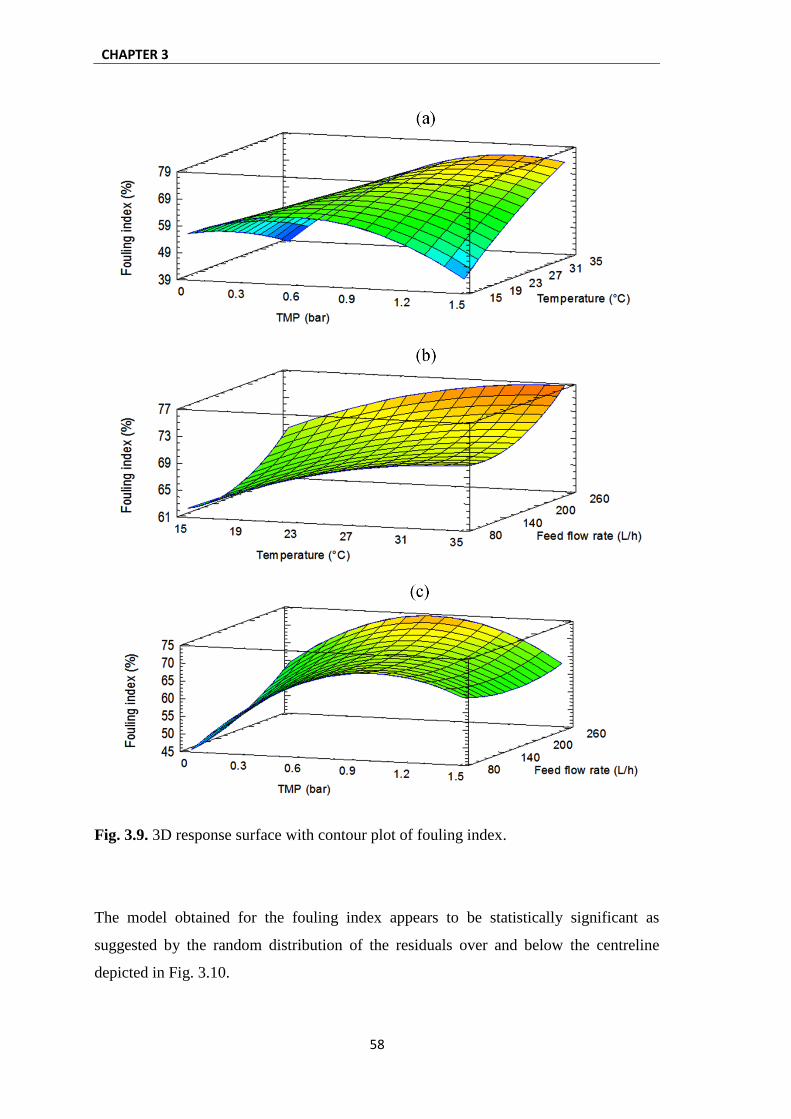
CHAPTER 3
58
Fig. 3.9. 3D response surface with contour plot of fouling index.
The model obtained for the fouling index appears to be statistically significant as
suggested by the random distribution of the residuals over and below the centreline
depicted in Fig. 3.10.

Orange press liquor clarification
59
Fig. 3.10. Plot of residuals against predicted response of fouling index.
On the other hand the results obtained for the blocking index have shown a strong
relationship between the operating conditions and the type of fouling produced. The
model obtained in this case explains 76.36% of the variability in the blocking index.
The lack-of-fit analysis showed a lower value in the F-ratio of 1.44 (p=0.2555);
therefore the model appears to adequate for the prediction of the observed data at the
95.0% confidence level. Serial autocorrelation, evaluated by Durbin–Watson statistic
test, was not detected (P= 0.4672) and the standard error was equal to 0.106816. In
addition, the model for the blocking index is statistically significant as suggested by the
random and the distribution of the residuals over and below the centreline (Fig. 3.11).
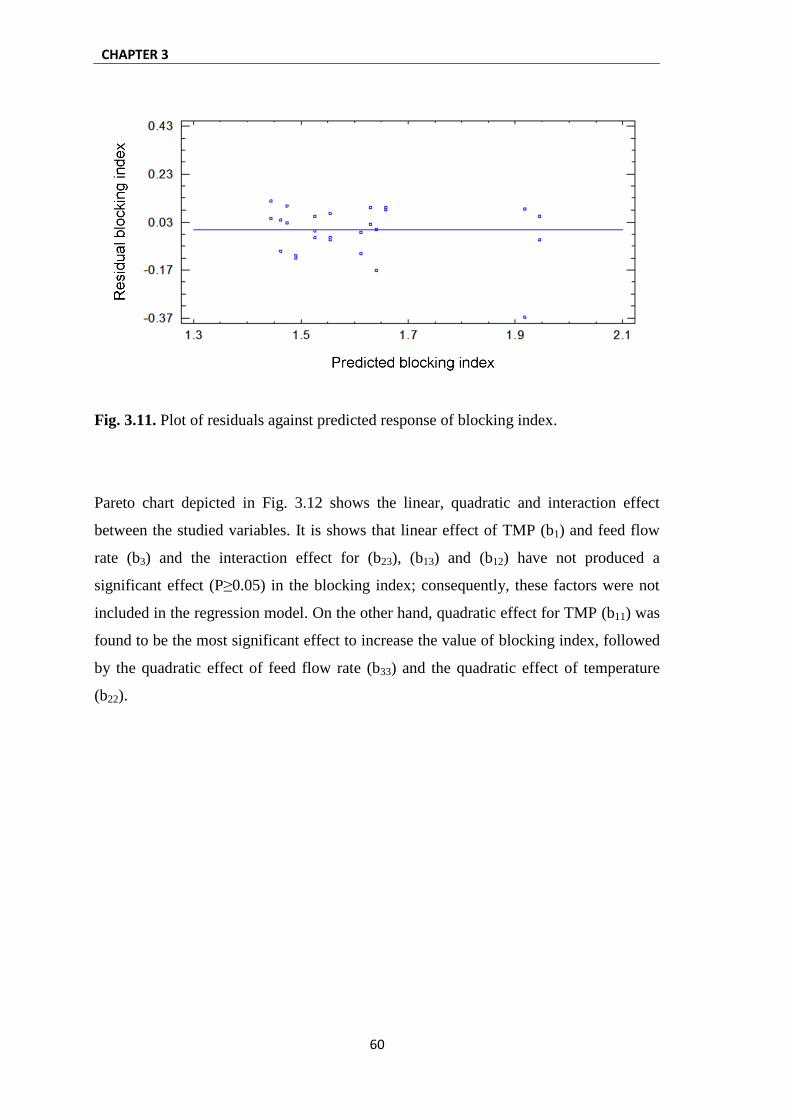
CHAPTER 3
60
Fig. 3.11. Plot of residuals against predicted response of blocking index.
Pareto chart depicted in Fig. 3.12 shows the linear, quadratic and interaction effect
between the studied variables. It is shows that linear effect of TMP (b1) and feed flow
rate (b3) and the interaction effect for (b23), (b13) and (b12) have not produced a
significant effect (P≥0.05) in the blocking index; consequently, these factors were not
included in the regression model. On the other hand, quadratic effect for TMP (b11) was
found to be the most significant effect to increase the value of blocking index, followed
by the quadratic effect of feed flow rate (b33) and the quadratic effect of temperature
(b22).

Orange press liquor clarification
61
Fig. 3.12. Standardized Pareto chart for blocking index.
The model attained, expressed in terms of quadratic regression, describes the effect of
the process variables on the blocking index in terms of coded levels as reported in the
following:
(3.3)
where Y3 is the predictive blocking index for the ultrafiltration process.
Membrane pore blocking is a complex phenomenon influenced by several factors.
Hwang et al., [7] have reported that the type of fouling produced is influenced by three
factors: (i) the amount of particles simultaneously arriving at the membrane surface, (ii)
the amount of accumulated particles, and (iii) the filtration rate. Fig. 3.13-b and 3.13-c
show the effect of the feed flow-rate on the i value. The response surface plots shown a
strong interaction between feed flow-rate, temperature and TMP.

CHAPTER 3
62
Fig. 3.13. 3D response surface with contour plot of blocking index.
It is appreciated that increases in feed flow-rate from 165 L/h (level 0) until 245 L/h
(level 1) produce an increasing on the i value; this means that at level 0 the principal
mechanism is a combination of intermediate blocking and standard blocking; however,
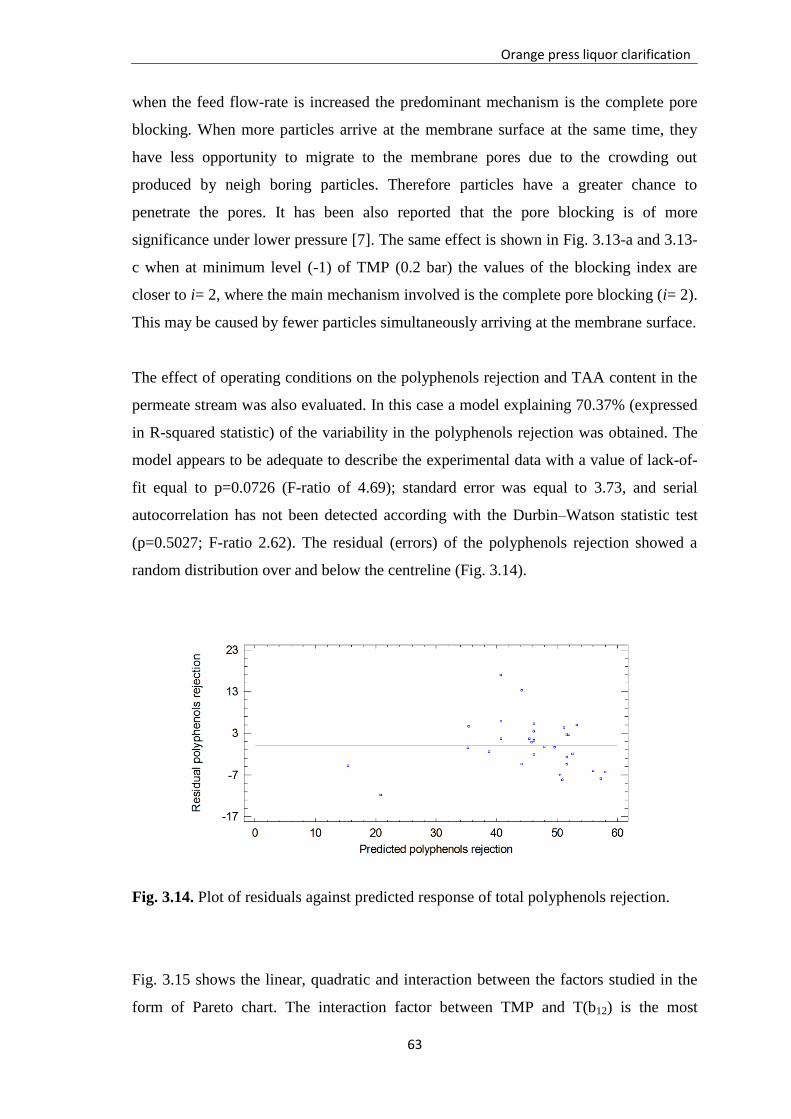
Orange press liquor clarification
63
when the feed flow-rate is increased the predominant mechanism is the complete pore
blocking. When more particles arrive at the membrane surface at the same time, they
have less opportunity to migrate to the membrane pores due to the crowding out
produced by neigh boring particles. Therefore particles have a greater chance to
penetrate the pores. It has been also reported that the pore blocking is of more
significance under lower pressure [7]. The same effect is shown in Fig. 3.13-a and 3.13-
c when at minimum level (-1) of TMP (0.2 bar) the values of the blocking index are
closer to i= 2, where the main mechanism involved is the complete pore blocking (i= 2).
This may be caused by fewer particles simultaneously arriving at the membrane surface.
The effect of operating conditions on the polyphenols rejection and TAA content in the
permeate stream was also evaluated. In this case a model explaining 70.37% (expressed
in R-squared statistic) of the variability in the polyphenols rejection was obtained. The
model appears to be adequate to describe the experimental data with a value of lack-of-
fit equal to p=0.0726 (F-ratio of 4.69); standard error was equal to 3.73, and serial
autocorrelation has not been detected according with the Durbin–Watson statistic test
(p=0.5027; F-ratio 2.62). The residual (errors) of the polyphenols rejection showed a
random distribution over and below the centreline (Fig. 3.14).
Fig. 3.14. Plot of residuals against predicted response of total polyphenols rejection.
Fig. 3.15 shows the linear, quadratic and interaction between the factors studied in the
form of Pareto chart. The interaction factor between TMP and T(b12) is the most

CHAPTER 3
64
significant effect on the polyphenols rejection, followed by linear effect of temperature
(b2) and linear effect of TMP (b1). The factors (b2), (b1), (b13) and (b33) appear to
produce an increase in the polyphenols rejection while the factors as (b12), (b11) and
(b22) produced a decrease in the same item. On the other hand, the factors (b3) and (b23)
did not produce a significant effect (p≥0.05) in the polyphenols rejection. Therefore the
interaction factor (b23) presenting the lowest effect was not included in the regression
model equation.
Fig. 3.15. Standardized Pareto chart for total polyphenols rejection.
The quadratic regression describing the effect of each factor on the polyphenols
rejection is shown in equation 3.4.
(3.4)
whereY4 is the predictive polyphenols rejection for the ultrafiltration process.
The 3D plot depicted in Fig. 3.16, shows the main effect of the studied variables and
their interaction on the polyphenols rejection. It is possible to appreciate the significant
variation in the polyphenols rejection when the operating conditions were modified in
the investigated range. In particular, the polyphenols rejection increased by increasing
TMP due to the effect of a solid layer compaction acting as an additional layer, reducing
the MWCO of the UF membranes [8].
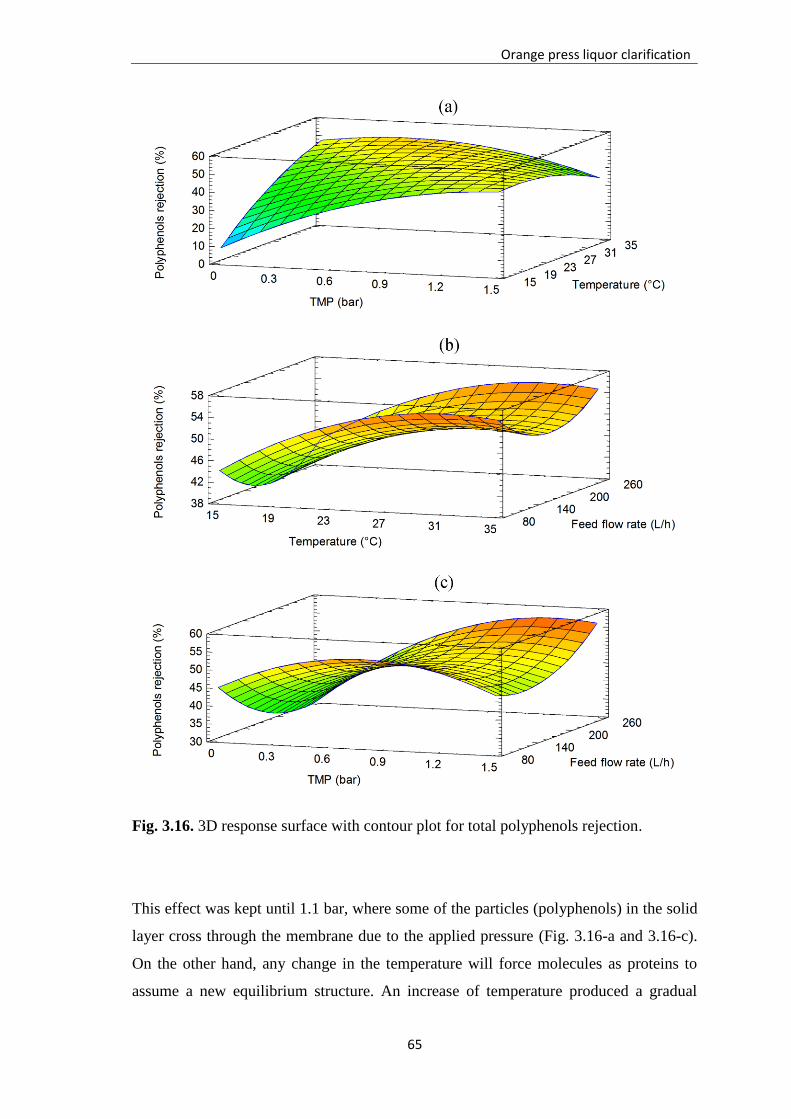
Orange press liquor clarification
65
Fig. 3.16. 3D response surface with contour plot for total polyphenols rejection.
This effect was kept until 1.1 bar, where some of the particles (polyphenols) in the solid
layer cross through the membrane due to the applied pressure (Fig. 3.16-a and 3.16-c).
On the other hand, any change in the temperature will force molecules as proteins to
assume a new equilibrium structure. An increase of temperature produced a gradual
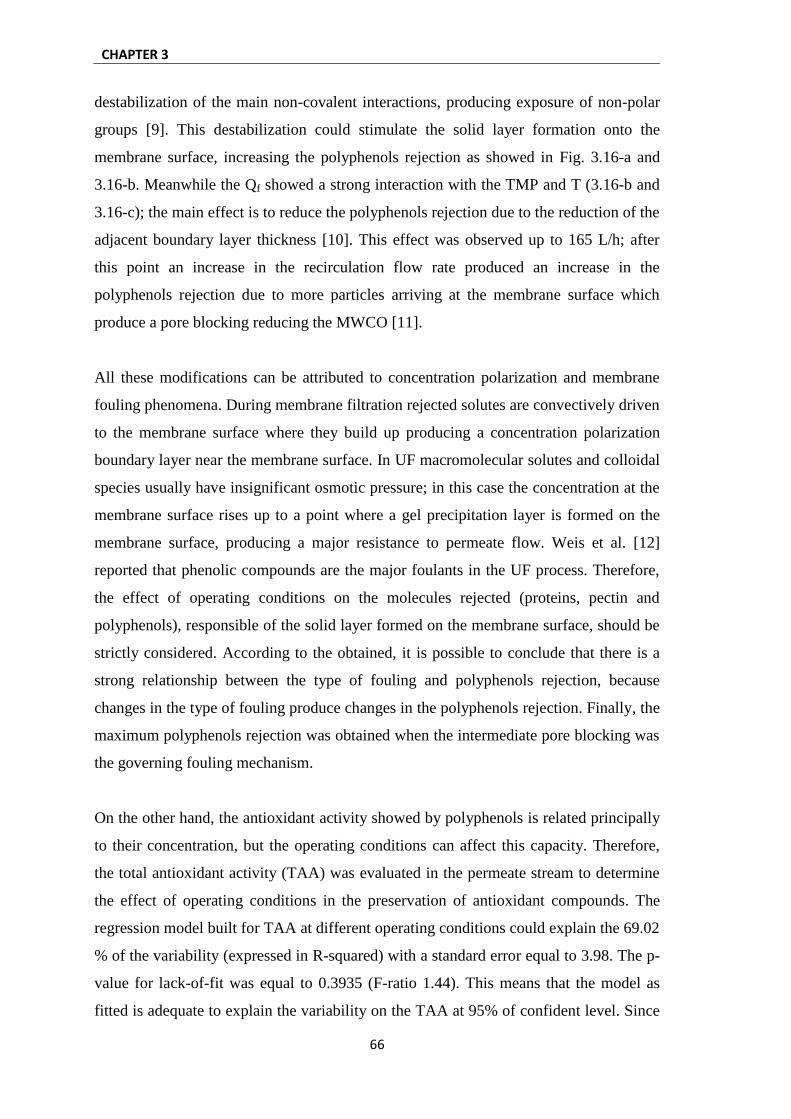
CHAPTER 3
66
destabilization of the main non-covalent interactions, producing exposure of non-polar
groups [9]. This destabilization could stimulate the solid layer formation onto the
membrane surface, increasing the polyphenols rejection as showed in Fig. 3.16-a and
3.16-b. Meanwhile the Qf showed a strong interaction with the TMP and T (3.16-b and
3.16-c); the main effect is to reduce the polyphenols rejection due to the reduction of the
adjacent boundary layer thickness [10]. This effect was observed up to 165 L/h; after
this point an increase in the recirculation flow rate produced an increase in the
polyphenols rejection due to more particles arriving at the membrane surface which
produce a pore blocking reducing the MWCO [11].
All these modifications can be attributed to concentration polarization and membrane
fouling phenomena. During membrane filtration rejected solutes are convectively driven
to the membrane surface where they build up producing a concentration polarization
boundary layer near the membrane surface. In UF macromolecular solutes and colloidal
species usually have insignificant osmotic pressure; in this case the concentration at the
membrane surface rises up to a point where a gel precipitation layer is formed on the
membrane surface, producing a major resistance to permeate flow. Weis et al. [12]
reported that phenolic compounds are the major foulants in the UF process. Therefore,
the effect of operating conditions on the molecules rejected (proteins, pectin and
polyphenols), responsible of the solid layer formed on the membrane surface, should be
strictly considered. According to the obtained, it is possible to conclude that there is a
strong relationship between the type of fouling and polyphenols rejection, because
changes in the type of fouling produce changes in the polyphenols rejection. Finally, the
maximum polyphenols rejection was obtained when the intermediate pore blocking was
the governing fouling mechanism.
On the other hand, the antioxidant activity showed by polyphenols is related principally
to their concentration, but the operating conditions can affect this capacity. Therefore,
the total antioxidant activity (TAA) was evaluated in the permeate stream to determine
the effect of operating conditions in the preservation of antioxidant compounds. The
regression model built for TAA at different operating conditions could explain the 69.02
% of the variability (expressed in R-squared) with a standard error equal to 3.98. The p-
value for lack-of-fit was equal to 0.3935 (F-ratio 1.44). This means that the model as
fitted is adequate to explain the variability on the TAA at 95% of confident level. Since

Orange press liquor clarification
67
the p-value of the Durbin–Watson statistic test is greater than 0.05 (p= 0.9986), there is
no indication of serial autocorrelation in the residuals at the 5.0% significance level.
Fig. 3.17 shows the linear, quadratic and interaction coefficients of each operating
variable plotted in the form of Pareto chart. It is possible to appreciate that the quadratic
effect of T was the most significant followed by (b2), (b13) and (b3), whereas the linear
effect (b1), interaction effect (b12, b23) and quadratic effect (b11, b33) did not show a
significant effect (p≥0.05) on the TAA.
Fig. 3.17. Standardized Pareto chart for TAA in the permeate stream.
The obtained model shown in equation (3.5) describes the linear, quadratic and
interaction effect of operating conditions on the TAA in the permeate stream.
(3.5)
where Y5 is the predictive TAA in the permeate stream for the UF process.
Fig. 3.18 shows the 3D response surface for the TAA in the permeate stream. For all Qf
values investigated, an increase in the T (until 28°C) produced an increase in the TAA
value of the permeate stream; at temperatures higher than 28°C an increase in the T
produced a decrease of the TAA value (Fig. 3.18-b). A similar effect was observed for

CHAPTER 3
68
the TMP in the range 0.2–0.4 bar; after this point an increase in the TMP produced a
decrease in the TAA value (Fig. 3.18-a).
Fig. 3.18. 3D response surface with contour plot for TAA in the permeate stream.

Orange press liquor clarification
69
In all the range of TMP values an increase in Qf enhanced the TAA of the clarified
liquor. At the maximum value of Qf (245 L/h) an increase in TMP produced a decrease
in the TAA (Fig. 3.18-c). At the minimum level of Qf (85 L/h) the increasing in the
TAA value took place up to a critical point of TMP where the TAA started to decrease
when TMP was increased. The differences in the TAA values at different operating
conditions can be correlated with the changes in the polyphenols rejection. The TAA is
strictly correlated to the content of polyphenols of the orange press liquor. Proteggente
et al. [13] analysed the phenolic composition and the TAA of fresh Sicilian orange juice
from pigmented and non-pigmented varieties of orange (Citrus sinensis L. Osbeck).
They found that concentrations of anthocyanins and hydroxycinnamic acids are highly
correlated to the TAA values, while ascorbic acid seems to play a minor role. Their
observations were consistent with a previous report in which the antioxidant action of
similar varieties was ascribed to the phenolic content [14].
Recent studies have also shown that total phenols determined by Folin–Ciocalteu
method can be correlated to the antioxidant activity determined by different methods
(ABTS and DPPH assays, for instance) [15]. For this reason, the method described by
Singleton et al. [16] has been proposed recently as a standardized method to be used in
the routine quality control and measurement of antioxidant capacity of food products
and dietary supplements [17]. It has been also reported that thermal treatments, such as
conventional and microwave cooking, frying and warm-holding of blanched products
produce a modification of polyphenols content and also of antioxidant activity [18,19].
The observed decreasing of TAA after 28°C, could only be attributed to the increasing
in polyphenols rejection when the temperature is raised (see also Fig. 3.18-b).
Fig. 3.19 shows the residual plot of TAA in the permeate stream: the dispersion is
random over and below the centreline suggesting that the model for the TAA is
statistically significant.
CHAPTER 3
70
Figure 3.19. Plot of residuals against predicted response of TAA in the permeate
stream.
3.2.1 Optimization of multiple responses
The RSM approach permitted to determine the interaction effect between the different
factors investigated. In addition, using the desirability function (DF) it was possible to
establish the combination of factors suitable to reach the target proposed for the
clarification process; this means maximize the permeate flux and minimize the
polyphenols rejection as well as the fouling index, simultaneously.
During the experiments performed at several combinations of operating parameters, as
depicted in Table 3.4, it was observed that the minimum and maximum limits obtained
for the permeate flux were 6.77 and 31.95 kg/m2h, respectively. In the case of fouling
index the minimum and maximum limits were 43.01 and 76.05, respectively. Finally,
for polyphenol minimum and maximum limits were 9.09% and 58.3%, respectively.
These limits were used for the multiple optimization where desirability function (DF)
was used to obtain the combination of variables to maximize the permeate flux and
minimize the polyphenols rejection as well as the fouling index.
For the maximum overall desirability of 0.52, the coded levels of the operating variables
and predicted variables are shown in the Table 3.5.

Orange press liquor clarification
71
Table 3.5. Optimization results for the UF of citrus press liquor
Optimized coded level of Variables
X1: TMP 1.4 bar
X2: Temperature 15°C
X3: Feed flow-rate 140.4 L/h
Predicted Responses
Permeate Flux (kg/m2h) 23.51
Fouling Index (%) 48.27
Polyphenols rejection (%) 46.04
Overall Desirability 0.52
The results obtained in this section permitted to determine the effect of each factor and
the interaction effect of operating conditions on the membrane performance. The results
of the optimization showed that a selected combination of operating parameters allow
the maximum permeate flux and minimum fouling index, as well as polyphenols
rejection.
3.3 Clarification of orange press liquor: UF with tubular PS membrane
Based on the results obtained in the optimization of operating conditions additional
experiences of UF by using a membrane with tubular configuration and a higher
membrane area, were carried out. The tests were performed by using a pilot laboratory
plant (Fig. 3.20) equipped with a tubular PS membrane supplied by China Blue Star
Membrane Technology Co., Ltd. (Beijing, China) having a nominal molecular weight
cut-off (MWCO) of 100 kDa and an effective membrane area of 1.2 m2. Experiments
were performed according to the batch concentration mode in which the retentate stream
is continuously recycled back to the feed tank.. The operating conditions were selected
as follows: TMP= 1.2 bar, T= 21.31±0.23°C and Qf = 1,140 L/h. The mass of permeate
collected, for each experience, was measured with an accuracy of ±0.1 g every 10 min
for periods of 345 min. In Table 2.1. physic-chemical characteristics of orange press
liquor used as feed in these activities are reported.

CHAPTER 3
72
Fig. 3.20. Experimental set-up used for the clarification of raw press liquor by UF.
The time course of permeate flux measured in two different experimental runs is
reported in Fig. 3.21.
The results showed that there is not a statistically significant difference (p=0.6715; F-
ratio=0.18) between the means of the two experiences at the 95% confidence level. This
means that there is a repetitive behaviour of the membrane in the clarification of orange
press liquor. A typical behaviour in the permeate flux, characterized by a drop in the
flux values during the process due to the fouling produced on the membrane surface
was observed (see section 1.5.3). The initial value of the permeate flux for the first and
second run was 5.21 and 5.17 kg/m2h, respectively. The fouling produced during 345
min of processing caused a reduction of permeate flux of 64.49 and 61.31% for the first
and second run, respectively, in comparison with the initial value.

Orange press liquor clarification
73
Operating time (min)
0 100 200 300 400
Jp (
kg
/m2*h
)
1
2
3
4
5
6
run 1
run 2
Fig. 3.21. Time course of permeate flux for press liquor with PS ultrafiltration
membrane of 100kDa, operating conditions: T=21.31±0.23°C; TMP = 1.2 bar).
A volume reduction factor (VRF) of 9.73 and 8.26 for the first and second run,
respectively, was reached.
The results obtained in terms of rejection of hesperidin and sugars content are depicted
in Table 3.6. The clarified press liquor, contained 91.49% of hesperidin and 72.83% of
sugars of the initial press liquor. Consequently, during UF part of the sugars (27.17%)
was retained by the UF membrane. Fig. 3.22 shows the differences between the
permeate and concentrate streams after the UF process.
Fig. 3.22. Samples coming from the UF treatment of orange press liquor.
Feed Retentate Permeate

CHAPTER 3
74
Table 3.6. Results obtained during UF of orange press liquor by using tubular PS membrane.
Hesperidin Sugars
ρ
(kg/L) Volume
*
(L)
VRF**
(-)
Concentration
(mg/L)
Total mass
(mg)
Concentration
(°brix)
Total
mass
(g)
First run
Feed 1.0121 22
9.73
161.67±6.78 3556.74 4.50 1001.98
Retentate 1.0214 1.2 198.88±7.87 238.66 6.00 73.54
Permeate 1.0070 19.74 164.84±2.47 3253.94 4.00 795.13
Second run
Feed 1.0131 22.14
8.26
158.17±14.29 3501.88 4.50 1009.35
Retentate 1.0195 1.8 195.83±10.79 352.49 5.75 105.52
Permeate 1.0073 19.46 154.83±3.96 3012.99 3.75 735.08
*Volume obtained after experimental run of 345 min
**Volume reduction factor reached after experimental run of 345 min
Orange press liquor clarification
75
References
[1] J.E. Lozano. 2003. Separation and Clarification. In: Encyclopedia of Food Science
and Nutrition, ed. B. Caballero, L. Trugo and P. Finglas, 5187-5196. Elsevier,
London, UK.
[2] R.C.C. Domingues, S.B. Faria Junior, R. Barnardes Silva, V.L. Cardoso, M.H.
Miranda Reis. Clarification of passion fruit juice with chitosan: Effects of
coagulation process variables and comparison with centrifugation and enzymatic
treatments. Process Biochemistry, 47 (2012) 467–471.
[3] Chatterjee S, Chatterjee S, Chatterjee BP, Guha AK. Clarification of fruit juice with
chitosan. Process Biochemistry, 39 (2004) 2229–32.
[4] Alvarez S, Riera FA, Alvarez R, Coca J, Cuperus FP, Bouwer ST, et al. A new
integrated membrane process for producing clarified apple juice and apple juice
aroma concentrate. Journal of Food Engineering, 46 (2000) 109–25.
[5] A. Cassano, B. Jiao and E. Drioli, Production of concentrated kiwifruit juice by
integrated membrane processes. Food Research International, 37(2) (2004) 139–
148.
[6] S.S. Koseoglu, J.T. Lawhon and E.W. Lusas, Use of membranes in citrus juice
processing. Food Technology, 44(12) (1990) 90–97.
[7] K.J. Hwang, C.Y. Liao, K.L. Tung, Analysis of particle fouling during
microfiltration by use of blocking models, Journal of Membrane Science, 287
(2007) 287–293.
[8] H. Strathmann, L. Giorno, E. Drioli, An introduction to membrane science and
technology, Consiglio Nazionale delle Ricerche, Roma, 2006.
[9] S. Domodaran, Aminoacids, Peptides and Proteins, in: O. Fennema (Ed.), Food
Chemistry, Marcel Dekker Inc., New York, 1997, pp. 321–430.
[10] M. Moresi, I. Sebastiani, Pectin recovery from model solutions using a laboratory-
scale ceramic tubular UF membrane module. Journal of Membrane Science, 322
(2008) 349–359.
[11] K.J. Hwang, C.Y. Liao, K.L. Tung, Analysis of particle fouling during
microfiltration by use of blocking models. Journal of Membrane Science, 287
(2007) 287–293.
CHAPTER 3
76
[12] A. Weis, M.R. Bir, M. Nyström, C. Wright, The influence of morphology,
hydrophobicity and charge upon the long-term performance of ultrafiltration
membranes fouled with spent sulphite liquor. Desalination, 175 (2005) 73–85.
[13] A.R. Proteggente, A. Saija, A. De Pasquale, C.A. Rice-Evans, The compositional
characterisation and antioxidant activity of fresh juices from Sicilian sweet orange
(Citrus sinensis L. Osbeck) varieties. Free Radical Research, 37 (2003) 681– 687.
[14] P. Rapisarda, A. Tomaino, R. Lo Cascio, F. Bonina, A. De Pasquale, A. Saija,
Antioxidant effectiveness as influenced by phenolic content of fresh orange juices,
Journal of Agricultural and Food Chemistry, 47 (1999) 4718–4723.
[15] V. Roginsky, A.E. Lissi, Review of methods to determine chainbreaking
antioxidant activity in food. Food Chemistry, 92 (2005) 235–254.
[16] V.L. Singleton, R. Orthofer, R.M. Lamuela-Raventos, Analysis of total phenols and
other oxidation substrates and antioxidants by means of Folin–Ciocalteu reagent.
Methods in Enzymology, 299 (1999) 152-178.
[17] R.L. Prior, X. Wu, K. Schaich, Standardized methods for the determination of
antioxidant capacity and phenolics in foods and dietary supplements. Journal of
Agricultural and Food Chemistry, 53 (2005) 4290–4302.
[18] C. Ewald, S. Fjelkner-Modig, K. Johansson, I. Sjöholm, B. Akesson, Effect of
processing on major flavonoids in processed onions, green beans, and peas. Food
Chemistry, 64 (1999) 231–235.
[19] D. Zhang, Y. Hamauzu, Phenolics, ascorbic acid, carotenoids and antioxidant
activity of broccoli and their changes during conventional and microwave cooking.
Food Chemistry, 88 (2004) 503–509.

77
CHAPTER 4
Fractionation of clarified press liquor
4.1 Introduction
NF membranes are characterized by typical pore sizes in the range 1-3nm which
correspond to molecular weight cut-off (MWCO) of 300-500 Da [1]. These membranes
in contact with aqueous solutions are also slightly charged due to dissociation of surface
functional groups or adsorption of charge solute [2]. NF membranes generally present
lower rejection of monovalent ions, higher rejection of divalent ions and higher flux
compared to RO membranes [3]. Processes using NF membranes have been found to be
extremely efficient for fractionation and concentration of solutes from complex
solutions [4]. Consequently, this technology has been widely applied in food and
beverage processing such as demineralization of dairy products, concentration of fruit
juice and treatment of wastewater in food industry [5-8]. In recent years, a large number
of potential applications of NF has been proposed. Mello et al. [9] investigated the
concentration of propolis extracts using water and ethanol as solvents by NF; for
aqueous solutions, the NF membrane retained around 94% of phenolic compounds and
99% of flavonoids showing high efficiency in the concentration of propolis extracts. In
2009 Diaz-Reínoso et al. [10] investigated the use of integrated membrane processes
including UF and NF to obtain fractions enriched in compounds having antioxidant
activity from pressed distilled grape pomace. Recently, an UF-NF integrated membrane
process has been also proposed by Cissé et al. [11] for the concentration of
anthocyanins from roselle extract.
In this work NF membranes were used for the fractionation of the clarified press liquor
obtained from the UF process. In particular, the NF process was used as approach to
separate phenolic compounds from sugars and low molecular weight compounds. In the
first step several flat-sheet membranes were tested, on laboratory scale, in order to
identify a suitable membrane with a good performance in terms of permeate flux, and
selectivity towards phenolic compounds and sugars. In particular, the investigated
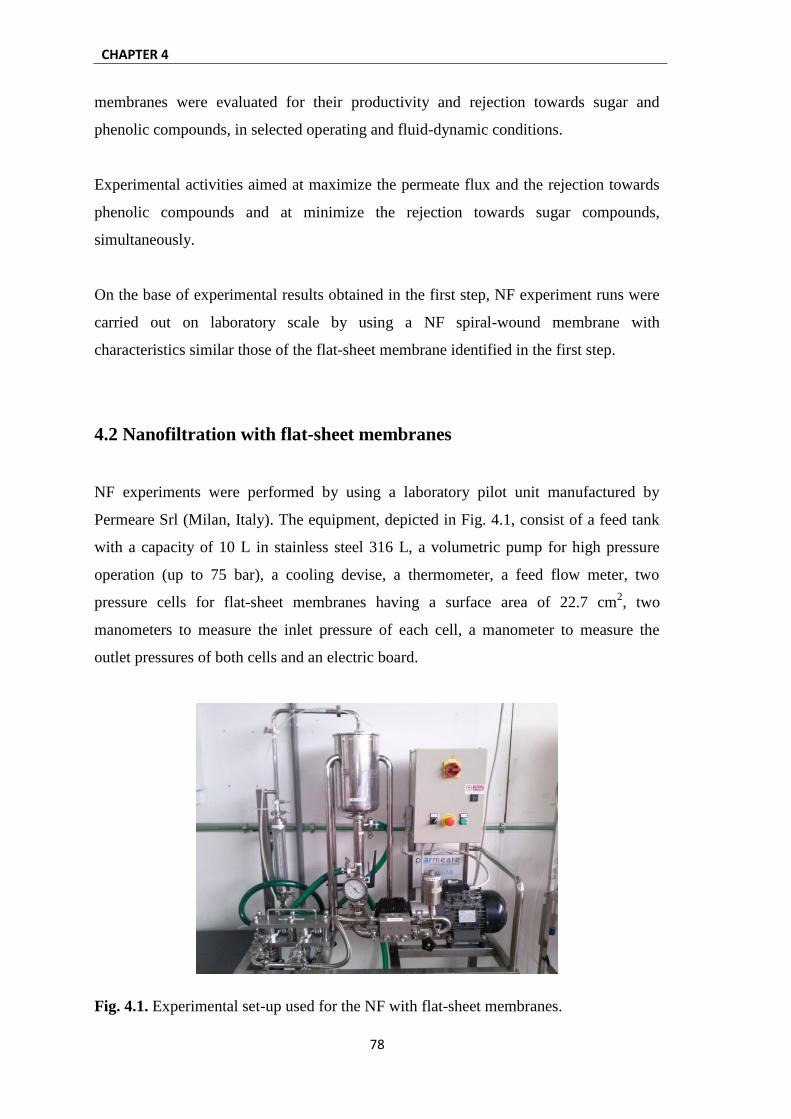
CHAPTER 4
78
membranes were evaluated for their productivity and rejection towards sugar and
phenolic compounds, in selected operating and fluid-dynamic conditions.
Experimental activities aimed at maximize the permeate flux and the rejection towards
phenolic compounds and at minimize the rejection towards sugar compounds,
simultaneously.
On the base of experimental results obtained in the first step, NF experiment runs were
carried out on laboratory scale by using a NF spiral-wound membrane with
characteristics similar those of the flat-sheet membrane identified in the first step.
4.2 Nanofiltration with flat-sheet membranes
NF experiments were performed by using a laboratory pilot unit manufactured by
Permeare Srl (Milan, Italy). The equipment, depicted in Fig. 4.1, consist of a feed tank
with a capacity of 10 L in stainless steel 316 L, a volumetric pump for high pressure
operation (up to 75 bar), a cooling devise, a thermometer, a feed flow meter, two
pressure cells for flat-sheet membranes having a surface area of 22.7 cm2, two
manometers to measure the inlet pressure of each cell, a manometer to measure the
outlet pressures of both cells and an electric board.
Fig. 4.1. Experimental set-up used for the NF with flat-sheet membranes.
Fractionation of clarified press liquor
79
Three flat-sheet membranes (Table 4.1) were selected to evaluate their performance in
terms of permeate flux as well as rejection towards hesperidin and sugars (described in
section 2.3). Experimental runs were performed according to the batch concentration
configuration (BCC) in which the retentate stream was continuously recycled back to
the feed tank while the permeate was collected separately. The operating conditions
were selected as follows: TMP=17 and 35 bar, T=34.40±3.75°C and Qf =500 L/h. A
total of six experiments (two for each membrane) were carried out. Measurements of
permeate flux were performed every 5 min during 200 min of continuous process.
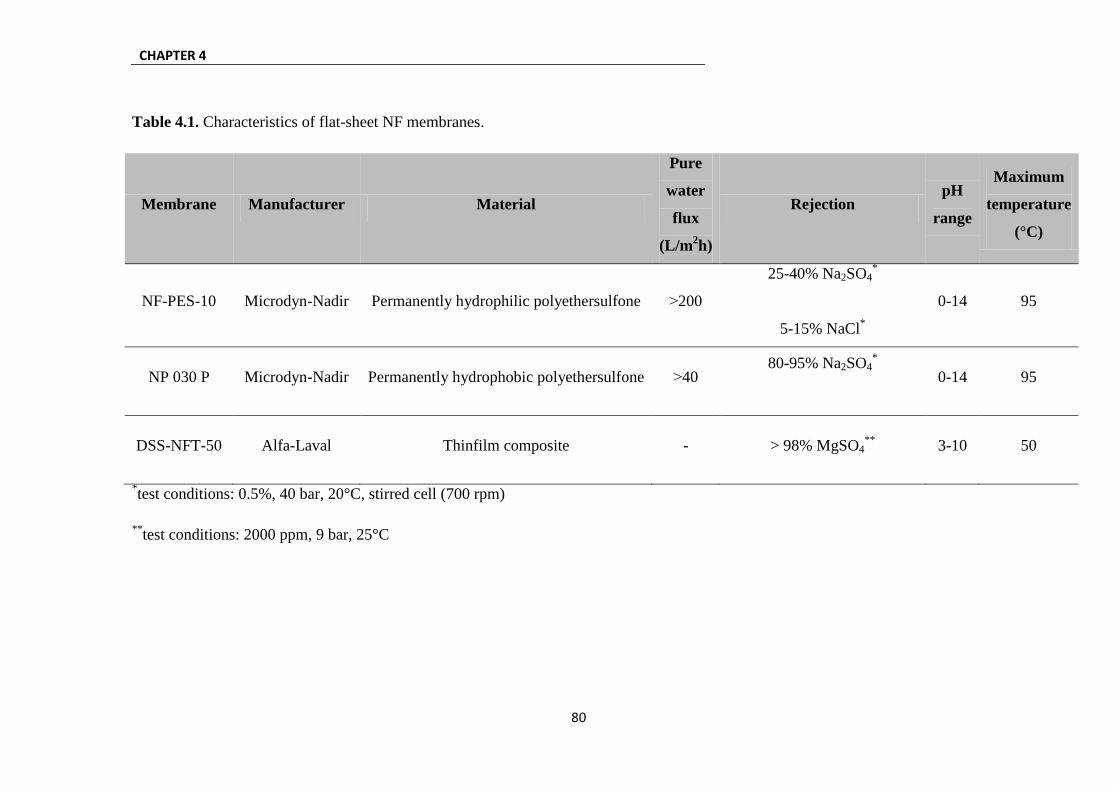
CHAPTER 4
80
Table 4.1. Characteristics of flat-sheet NF membranes.
Membrane Manufacturer Material
Pure
water
flux
(L/m2h)
Rejection pH
range
Maximum
temperature
(°C)
NF-PES-10 Microdyn-Nadir Permanently hydrophilic polyethersulfone ˃200
25-40% Na2SO4*
5-15% NaCl*
0-14 95
NP 030 P Microdyn-Nadir Permanently hydrophobic polyethersulfone ˃40 80-95% Na2SO4
*
0-14 95
DSS-NFT-50 Alfa-Laval Thinfilm composite - > 98% MgSO4**
3-10 50
*test conditions: 0.5%, 40 bar, 20°C, stirred cell (700 rpm)
**test conditions: 2000 ppm, 9 bar, 25°C

Fractionation of clarified press liquor
81
The hydraulic permeability of selected membranes was measured experimentally
(according with the procedure described in section 1.5.2), before each run, in order to
determine the resistance of each membrane at the water flux.
Fig. 4.2 shows the permeate flux variation with TMP for each membrane studied using
pure water. The results show that Jw increases linearly with TMP over the range of TMP
investigated (6.89–35 bar). In general, an increase in the hydraulic permeability is
observed by increasing the MWCO, because larger pore sizes lead to higher pure water
fluxes. However, it must be noted that water permeability is also affected by the internal
structure of the membrane; therefore, other factors in addition to MWCO, such as
morphology and hydrophobicity/hydrophilicity, also influence this value [4]. In
particular, the NF-PES-10 membrane presented the highest hydraulic permeability equal
to 12.79 L/m2·h·bar, whereas NP-030 and DSS-NFT-50 membranes presented values of
3.36 and 2.59 L/m2·h·bar, respectively. These differences are an intrinsic characteristics
of each membrane related with the polymeric material and structure.
Fig. 4.2. Hydraulic permeability of NF membranes studied. Operating conditions:
Temperature=26.79±1.72°C, Qf=500 L/h.
R² = 0.9848
R² = 0.9425
R² = 0.9811
0
50
100
150
200
250
300
350
400
450
500
0 10 20 30 40
J w (
L/m
2 h
)
TMP (bar)
DSS-NFT-50 membrane
NF-PES-10 membrane
NP-030 membrane

CHAPTER 4
82
The time course of the permeate flux at 17 bar for all investigated membranes, during
the process with clarified press liquor, is depicted in Fig. 4.3. Statistically significant
differences (p=0.000; F-ratio=857.87) between the average of permeate fluxes for the
three membranes investigated were found. According to the obtained results, the
NF-PES-10 membrane presented the highest permeate flux in comparison with the other
membranes studied.
Operating time (min)
0 50 100 150 200
Jp (
L/m
2 h
)
0
10
20
30
40
50
60
DSS-NFT-50
NF-PES-10
NP030
Fig. 4.3. NF of clarified orange press liquor with flat-sheet membranes. Time course of
permeate flux. Operating conditions: TMP=17 bar; T=31.25±0.56°C; Qf=500 L/h.
The differences appreciated between different membranes can be attributed to
differences in the type of fouling developed during the process which produced a drop
in the permeate flux equal to 21.0%, 31.7% and 35.9% for DSS-NFT-50, NF-PES-10
and NP-030 membranes, respectively.
Fig. 4.4 shows the time course of permeate flux when TMP is increase at 35 bar. Results
indicate that there are statistically significant differences (p=0.000; F-ratio=874.64)
between the means of the three membranes studied. The NP-030 membrane showed the
highest drop in the permeate flux (equal to 40.7%), whereas NF-PES-10 and
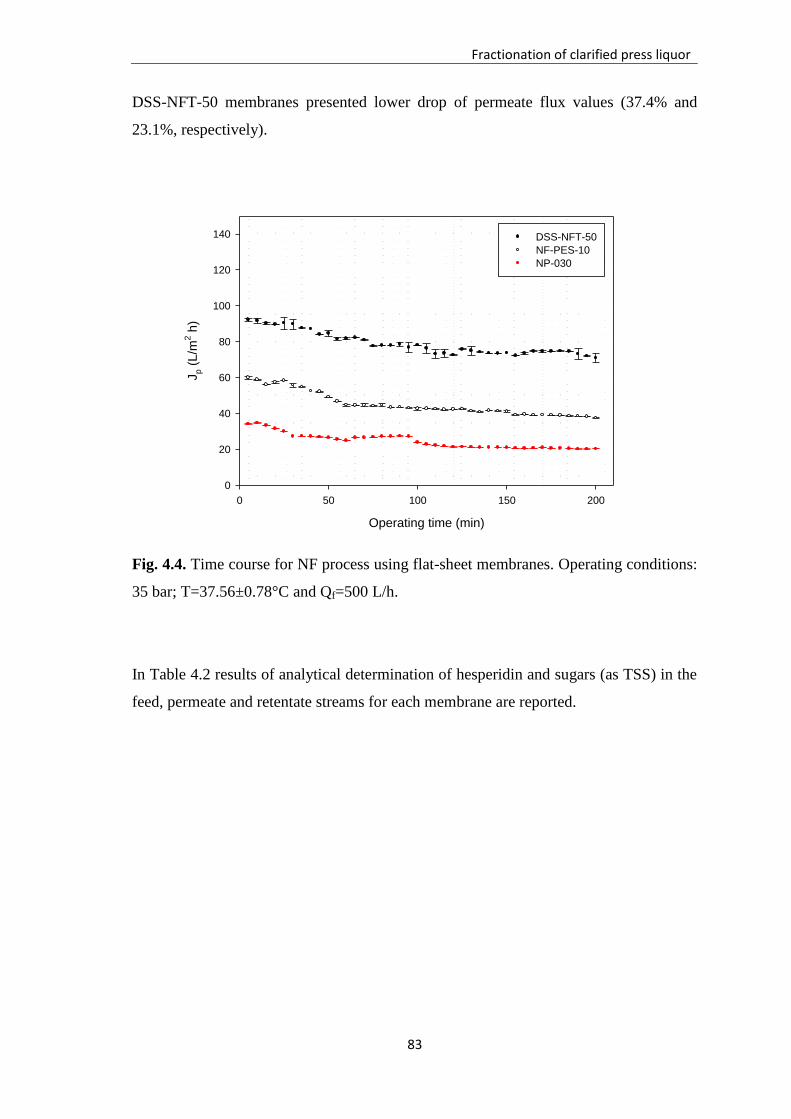
Fractionation of clarified press liquor
83
DSS-NFT-50 membranes presented lower drop of permeate flux values (37.4% and
23.1%, respectively).
Operating time (min)
0 50 100 150 200
Jp (
L/m
2 h
)
0
20
40
60
80
100
120
140 DSS-NFT-50
NF-PES-10
NP-030
Fig. 4.4. Time course for NF process using flat-sheet membranes. Operating conditions:
35 bar; T=37.56±0.78°C and Qf=500 L/h.
In Table 4.2 results of analytical determination of hesperidin and sugars (as TSS) in the
feed, permeate and retentate streams for each membrane are reported.

CHAPTER 4
84
Table. 4.2. Analytical determination of hesperidin and sugars in samples coming from
the treatment of clarified orange press liquor with flat-sheet membranes.
Membrane type Operating conditions Sample Hesperidin
(mg/L)
TSS
(°Brix)
DSS-NFT-50
17 bar / 31.25±0.56°C
Feed 73.66±0.87 4.0
Permeate 0 0.75
Retentate 61.77±1.29 3.75
35 bar / 37.56±0.78°C
Feed 89.15±2.04 3.0
Permeate 0 0.5
Retentate 146.02±5.75 3.5
NF-PES-10
17 bar / 31.25±0.56°C
Feed 59.74±5.53 3.1
Permeate 9.73±0.37 0.75
Retentate 79.90±1.64 2.5
35 bar / 37.56±0.78°C
Feed 110.34±1.94 4.0
Permeate 4.55±0.82 0.5
Retentate 122.69±3.35 0.5
NP-030
17 bar / 31.25±0.56°C
Feed 63.79±4.92 3.75
Permeate 0 0.75
Retentate 83.17±4.77 2.0
35 bar / 37.56±0.78°C
Feed 64.27±0.89 4.0
Permeate 0 0.5
Retentate 55.16±0.78 2.5
Hesperidin and sugar rejection were determined according to equation (1.1) reported in
Chapter 1. Results are shown in Fig. 4.5-a and 4.5-b.
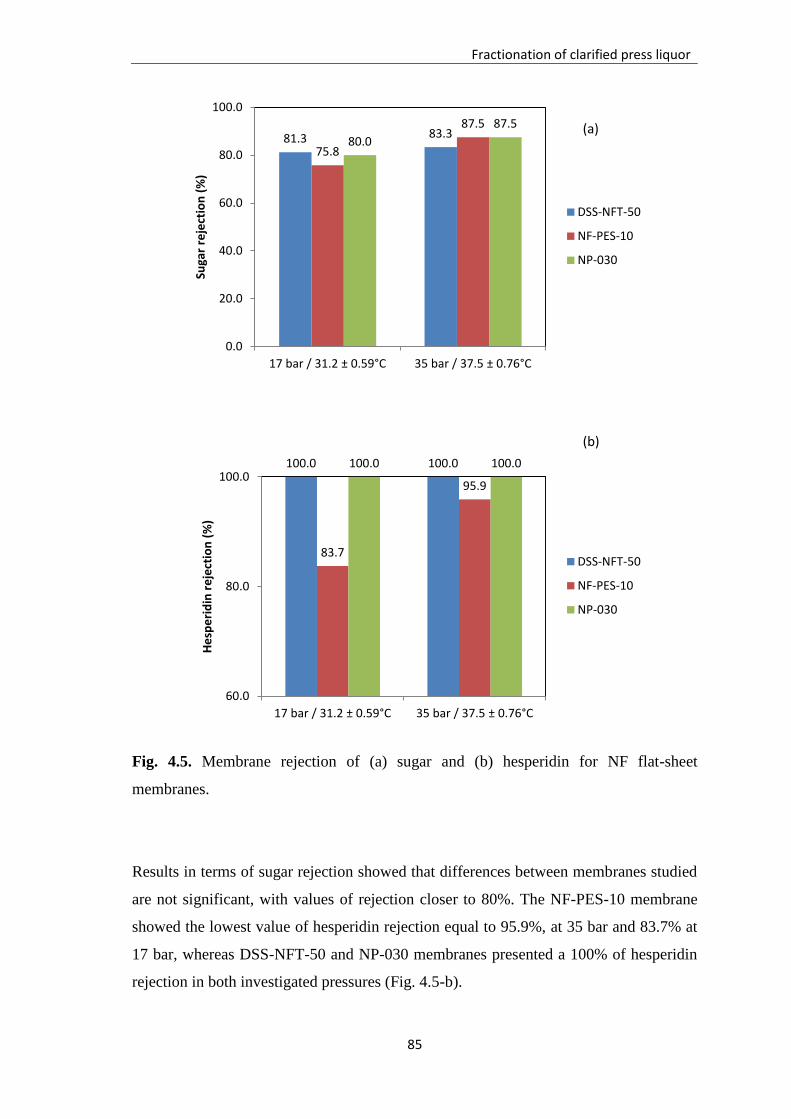
Fractionation of clarified press liquor
85
Fig. 4.5. Membrane rejection of (a) sugar and (b) hesperidin for NF flat-sheet
membranes.
Results in terms of sugar rejection showed that differences between membranes studied
are not significant, with values of rejection closer to 80%. The NF-PES-10 membrane
showed the lowest value of hesperidin rejection equal to 95.9%, at 35 bar and 83.7% at
17 bar, whereas DSS-NFT-50 and NP-030 membranes presented a 100% of hesperidin
rejection in both investigated pressures (Fig. 4.5-b).
81.3 83.3
75.8
87.5
80.0
87.5
0.0
20.0
40.0
60.0
80.0
100.0
17 bar / 31.2 ± 0.59°C 35 bar / 37.5 ± 0.76°C
Suga
r re
ject
ion
(%
) DSS-NFT-50
NF-PES-10
NP-030
100.0 100.0
83.7
95.9
100.0 100.0
60.0
80.0
100.0
17 bar / 31.2 ± 0.59°C 35 bar / 37.5 ± 0.76°C
He
spe
rid
in r
eje
ctio
n (
%)
DSS-NFT-50
NF-PES-10
NP-030
(b)
(a)
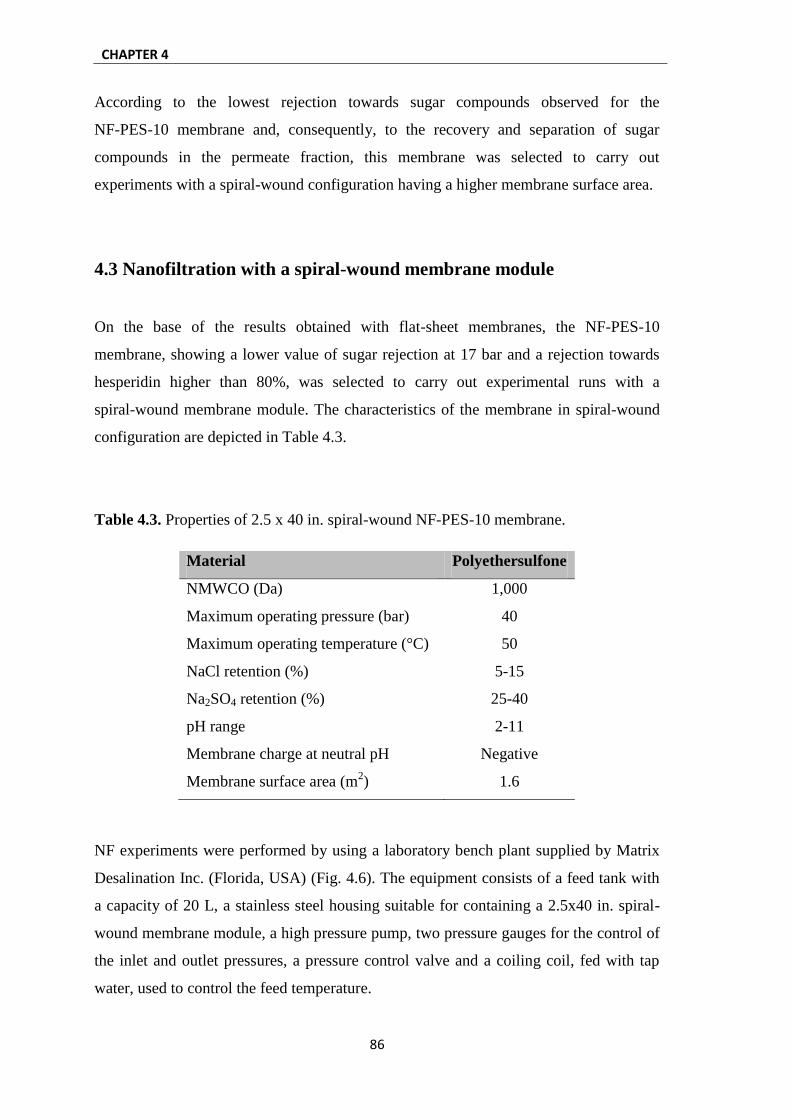
CHAPTER 4
86
According to the lowest rejection towards sugar compounds observed for the
NF-PES-10 membrane and, consequently, to the recovery and separation of sugar
compounds in the permeate fraction, this membrane was selected to carry out
experiments with a spiral-wound configuration having a higher membrane surface area.
4.3 Nanofiltration with a spiral-wound membrane module
On the base of the results obtained with flat-sheet membranes, the NF-PES-10
membrane, showing a lower value of sugar rejection at 17 bar and a rejection towards
hesperidin higher than 80%, was selected to carry out experimental runs with a
spiral-wound membrane module. The characteristics of the membrane in spiral-wound
configuration are depicted in Table 4.3.
Table 4.3. Properties of 2.5 x 40 in. spiral-wound NF-PES-10 membrane.
Material Polyethersulfone
NMWCO (Da) 1,000
Maximum operating pressure (bar) 40
Maximum operating temperature (°C) 50
NaCl retention (%) 5-15
Na2SO4 retention (%) 25-40
pH range 2-11
Membrane charge at neutral pH Negative
Membrane surface area (m2) 1.6
NF experiments were performed by using a laboratory bench plant supplied by Matrix
Desalination Inc. (Florida, USA) (Fig. 4.6). The equipment consists of a feed tank with
a capacity of 20 L, a stainless steel housing suitable for containing a 2.5x40 in. spiral-
wound membrane module, a high pressure pump, two pressure gauges for the control of
the inlet and outlet pressures, a pressure control valve and a coiling coil, fed with tap
water, used to control the feed temperature.
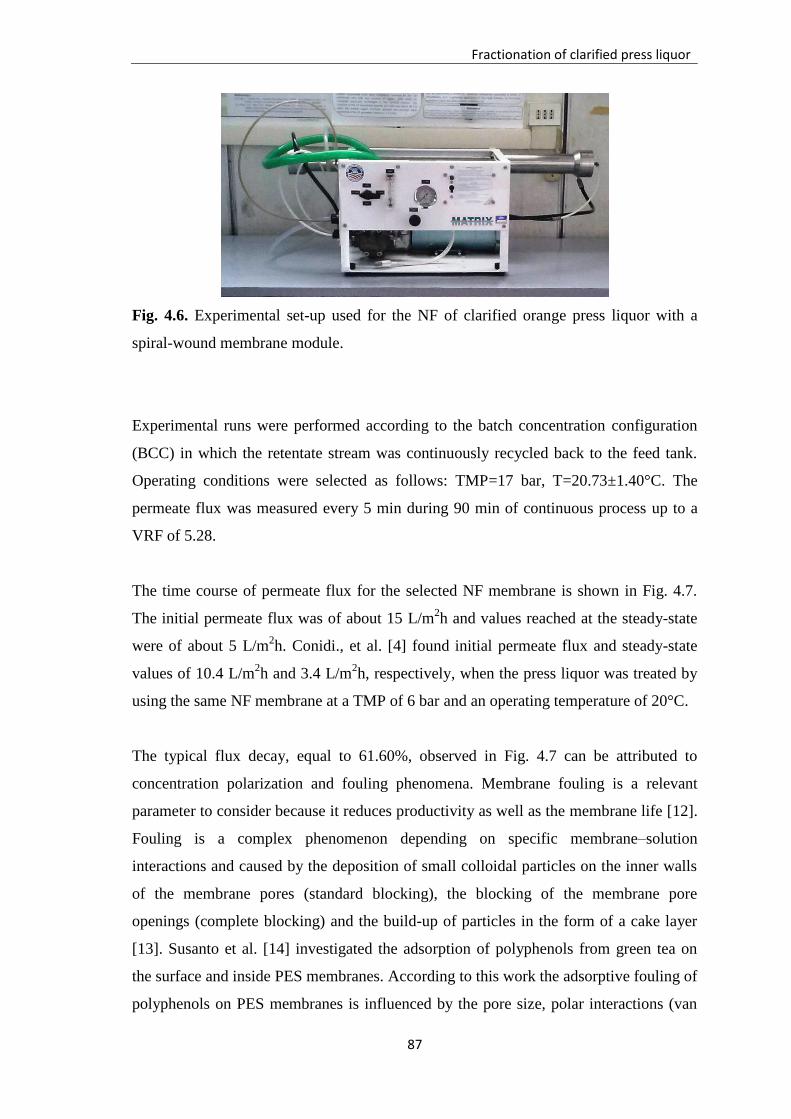
Fractionation of clarified press liquor
87
Fig. 4.6. Experimental set-up used for the NF of clarified orange press liquor with a
spiral-wound membrane module.
Experimental runs were performed according to the batch concentration configuration
(BCC) in which the retentate stream was continuously recycled back to the feed tank.
Operating conditions were selected as follows: TMP=17 bar, T=20.73±1.40°C. The
permeate flux was measured every 5 min during 90 min of continuous process up to a
VRF of 5.28.
The time course of permeate flux for the selected NF membrane is shown in Fig. 4.7.
The initial permeate flux was of about 15 L/m2h and values reached at the steady-state
were of about 5 L/m2h. Conidi., et al. [4] found initial permeate flux and steady-state
values of 10.4 L/m2h and 3.4 L/m
2h, respectively, when the press liquor was treated by
using the same NF membrane at a TMP of 6 bar and an operating temperature of 20°C.
The typical flux decay, equal to 61.60%, observed in Fig. 4.7 can be attributed to
concentration polarization and fouling phenomena. Membrane fouling is a relevant
parameter to consider because it reduces productivity as well as the membrane life [12].
Fouling is a complex phenomenon depending on specific membrane–solution
interactions and caused by the deposition of small colloidal particles on the inner walls
of the membrane pores (standard blocking), the blocking of the membrane pore
openings (complete blocking) and the build-up of particles in the form of a cake layer
[13]. Susanto et al. [14] investigated the adsorption of polyphenols from green tea on
the surface and inside PES membranes. According to this work the adsorptive fouling of
polyphenols on PES membranes is influenced by the pore size, polar interactions (van
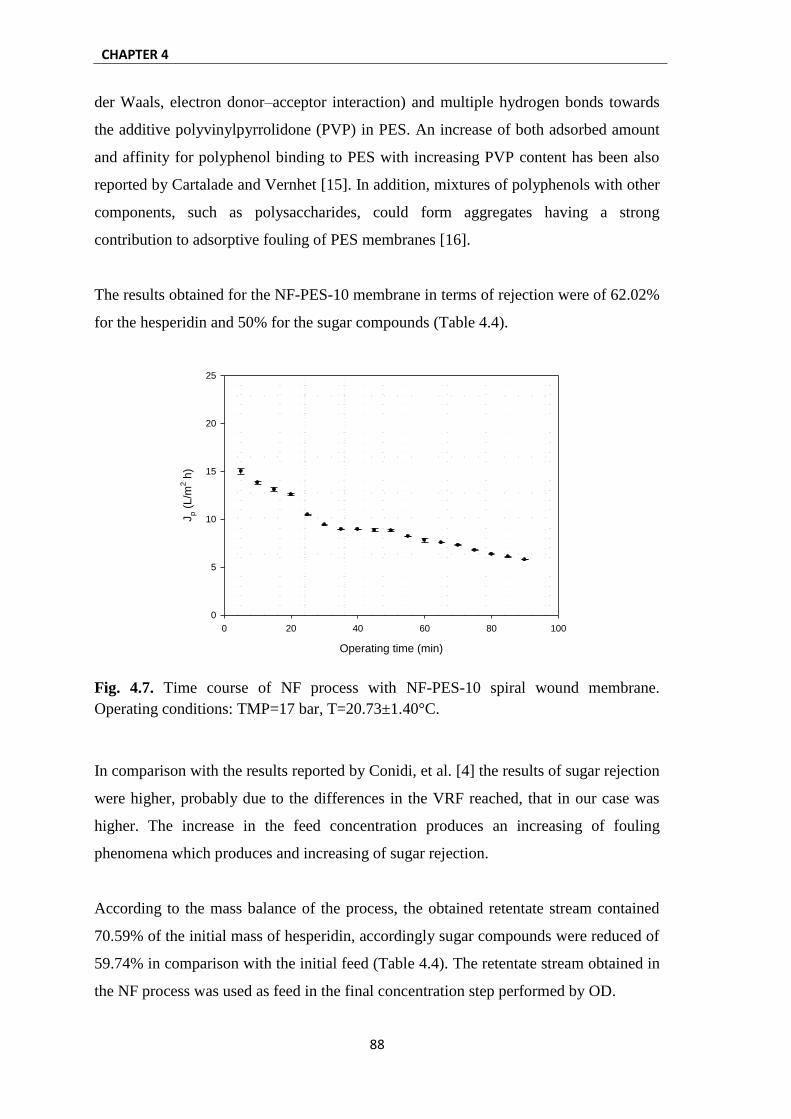
CHAPTER 4
88
der Waals, electron donor–acceptor interaction) and multiple hydrogen bonds towards
the additive polyvinylpyrrolidone (PVP) in PES. An increase of both adsorbed amount
and affinity for polyphenol binding to PES with increasing PVP content has been also
reported by Cartalade and Vernhet [15]. In addition, mixtures of polyphenols with other
components, such as polysaccharides, could form aggregates having a strong
contribution to adsorptive fouling of PES membranes [16].
The results obtained for the NF-PES-10 membrane in terms of rejection were of 62.02%
for the hesperidin and 50% for the sugar compounds (Table 4.4).
Operating time (min)
0 20 40 60 80 100
Jp (
L/m
2 h
)
0
5
10
15
20
25
Fig. 4.7. Time course of NF process with NF-PES-10 spiral wound membrane.
Operating conditions: TMP=17 bar, T=20.73±1.40°C.
In comparison with the results reported by Conidi, et al. [4] the results of sugar rejection
were higher, probably due to the differences in the VRF reached, that in our case was
higher. The increase in the feed concentration produces an increasing of fouling
phenomena which produces and increasing of sugar rejection.
According to the mass balance of the process, the obtained retentate stream contained
70.59% of the initial mass of hesperidin, accordingly sugar compounds were reduced of
59.74% in comparison with the initial feed (Table 4.4). The retentate stream obtained in
the NF process was used as feed in the final concentration step performed by OD.

Fractionation of clarified press liquor
89
Table 4.4. Results of hesperidin and sugars rejection obtained with the NF-PES-10 membrane. Operating conditions: TMP=17 bar,
T=20.73±1.40°C.
Hesperidin Sugars
Volume
(L)
ρ
(kg/L)
Concentration
(mg/L)
Weight of
Hesperidin
(mg)
Rejection
(%)
Concentration
°brix
Mass of
Sugars
(mg)
Rejection
%
Initial (feed) 33.92 1.008 135.48±0.83 4595.48
62.02
4 1367.65
50.00 Permeate 27.50 1.003 51.46±0.40 1415.15 2 551.65
Retentate 5.94 1.030 544.89±1.40 3236.65 9 550.64

CHAPTER 4
90
References
[1] J. Rautenbach, A. Gröschl. Separation potential of nanofiltration membranes.
Desalination, 77 (1990) 73–84.
[2] J.H. Tay, J. Liu, D.D. Sun. Effect of solution physic–chemistry on the charge
property of nanofiltration membranes. Water Research, 36 (2002) 585–598
[3] C.K. Diawara. Nanofiltration process efficiency in water desalination. Separation
and Purification Review, 37 (2008) 303–325.
[4] C. Conidi, A. Cassano, E. Drioli, Recovery of phenolic compounds from orange
press liquor by nanofiltration. Food and Bioproducts Processing, 90 (2012) 867–
874
[5] L.D. Barrantes, C.V. Morr. Partial deacidification and demineralization of cottage
cheese whey by nanofiltration. Journal of Food Science, 62 (1997) 338–341.
[6] L. Braeken, B. Van Der Bruggen, C. Vandecasteele. Regeneration of brewery waste
water using nanofiltration. Water Research, 38 (2004) 3075–3082.
[7] R. Ferrarini, A. Versari, S. Galassi. A preliminary comparison between
nanofiltration and reverse osmosis membrane for grape juice treatment. Journal of
Food Engineering, 50 (2001) 113–116.
[8] G. Rice, S. Kentish, V. Vivekanand, A. Barber, A. O’Connor, G. Stevens.
Membrane-based dairy separation: a comparison of nanofiltration and
electrodialysis. Developments in Chemical Engineering and Mineral Processing, 13
(2005) 43–54.
[9] B.C.B.S. Mello, J.C.C. Petrus, M.D. Hubinger. Concentration of flavonoids and
phenolic compounds in aqueous and ethanolic propolis extracts through
nanofiltration. Journal of Food Engineering, 96 (2010) 533–539.
[10] B. Diaz-Reínoso, A. Moure, H. Domínguez, J.C. Parajó. Ultra-and nanofiltration of
aqueous extracts from distilled fermented grape pomace. Journal of Food
Engineering, 91 (2009) 587–593.
[11] M. Cissé, F. Vaillant, D. Pallet, M. Dornier. Selecting ultrafitration and
nanofiltration membranes to concentrate anthocyanins from roselle extract
(Hibiscus sabdariffa L.). Food Research International, 44 (2011) 2607–2614.
[12] S.L. Nilsson. Protein fouling of UF membrane: causes and consequences. Journal
of Membrane Science, 52 (1990) 121–142.

Fractionation of clarified press liquor
91
[13] H.A. Mousa, S.A. Al-Hitmi. Treatability of wastewater and membrane fouling.
Desalination, 217 (2007) 65–73.
[14] H. Susanto, Y. Feng, M. Ulbricht. Fouling behavior during ultrafiltration of
aqueous solutions of polyphenolic compounds during ultrafiltration. Journal of
Food Engineering, 91 (2009) 333–340.
[15] D. Cartalade, A. Vernhet.. Polar interactions in flavan-3-ol adsorption on solid
surfaces. Journal of Agricultural and Food Chemistry, 54 (2006) 3086–3094.
[16] M. Ulbricht, W. Ansorge, I. Danielzik, M. König, O. Schuster. Fouling in
microfiltration of wine: the influence of the membrane polymer on adsorption of
polyphenols and polysaccharides. Separation and Purification Technology, 68
(2009) 335–342.

CHAPTER 4
92

93
CHAPTER 5
Concentration of NF retentate by osmotic distillation
5.1 Introduction
The concentration of fruit juices is a consolidated process in the food industry, because
it ensures a longer storage life and an easier transportation of the product. Generally,
this process is performed by thermal evaporation methods. Chen and Song [1]
developed a fresh-preserving concentrated pomegranate juice producing method
adopting a low temperature vacuum process for the concentration of the filtered juice.
Pang et al. [2] patented a method in which the clarified juice was concentrated by
thermal evaporation and then submitted to pasteurization before the aseptic packaging.
Although evaporation processes are widely used for juice concentration it is know that
thermal treatments produce a colour degradation and a reduction of most thermally
sensitive compounds, with a consequent remarkable quality decline of the final product
[3].
New tendencies associated with product quality improvement and energy saving have
guided the development of minimal processing techniques. In this context membrane
processes appear as suitable techniques since they are low-cost and athermal separation
techniques, which involve no phase change when compared with traditional evaporation
processes.
Membrane concentration processes, such as reverse osmosis (RO), membrane
distillation (MD) and osmotic distillation (OD), present some attractive options to
overcome limitations associated with vacuum evaporation. In particular, OD is a novel
athermal membrane-separation process based on the use of a macroporous hydrophobic
membrane separating two aqueous solutions having different solute concentration: a
dilute solution on one side and a hypertonic salt solution (concentrated brine stripper)
on the opposite side. The driving force of the process is given by a water vapour
pressure gradient across the membrane generated by the difference in water activity

CHAPTER 5
94
between the two sides of the membrane. The hydrophobic nature of the membrane
prevents penetration of the pores by aqueous solutions, creating air gaps within the
membrane. The water vapour pressure gradient across the membrane determines a
transfer of vapour across the pores from the high-vapour pressure phase to the low one
[4,5]. This migration of water vapour results in the concentration of the feed and
dilution of the osmotic agent solution (Fig. 5.1)
Fig. 5.1. Schematic representation of water vapour flux through an OD membrane.
The water transport through the membrane can be summarized in three steps: 1)
evaporation of water at the dilute vapour-liquid interface; 2) diffusional or convective
vapour transport through the membrane pore; 3) condensation of water vapour at the
membrane/brine interface.
Since the OD process is operated at room temperature and atmospheric pressure,
products can be concentrated without mechanical and thermal damage. Therefore OD is
an attractive process for the concentration of solutions containing thermo-sensitive
compounds such as fruit juices and pharmaceuticals. Several applications of OD in the
concentration of fruit juices have been investigated by different authors [6-11]. In these
works the potential of OD for a better preservation of the quality of the raw material has
been clearly confirmed.
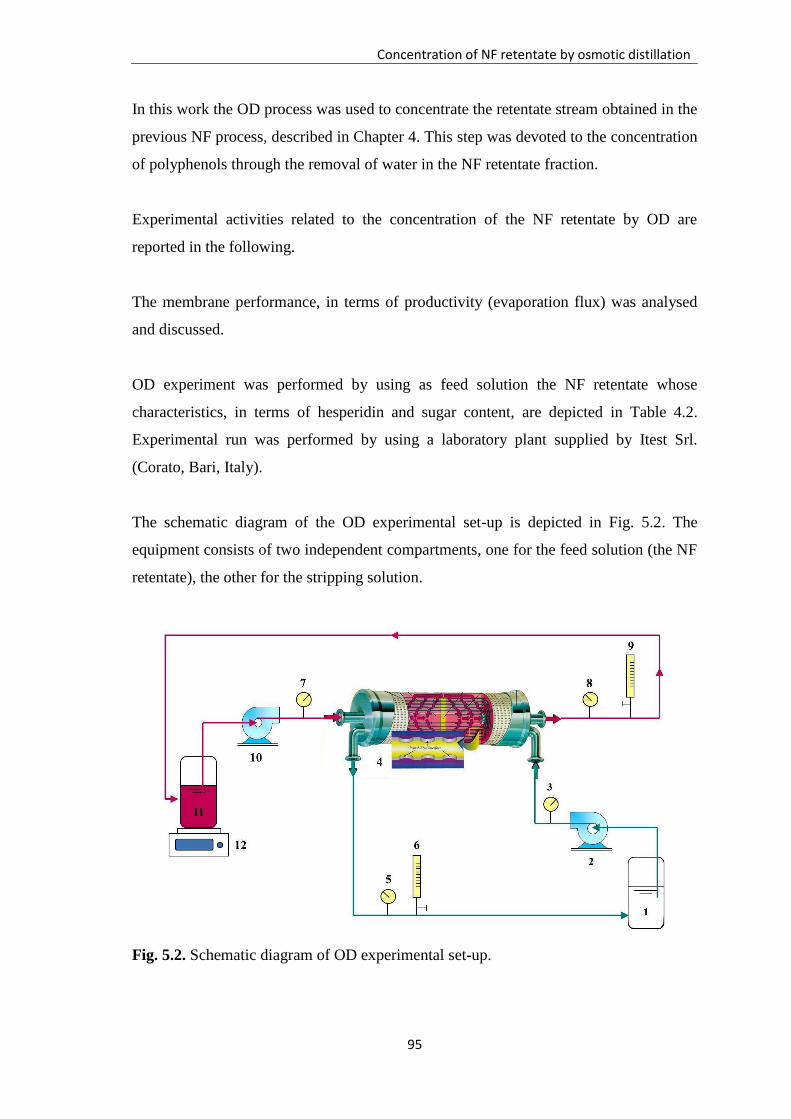
Concentration of NF retentate by osmotic distillation
95
In this work the OD process was used to concentrate the retentate stream obtained in the
previous NF process, described in Chapter 4. This step was devoted to the concentration
of polyphenols through the removal of water in the NF retentate fraction.
Experimental activities related to the concentration of the NF retentate by OD are
reported in the following.
The membrane performance, in terms of productivity (evaporation flux) was analysed
and discussed.
OD experiment was performed by using as feed solution the NF retentate whose
characteristics, in terms of hesperidin and sugar content, are depicted in Table 4.2.
Experimental run was performed by using a laboratory plant supplied by Itest Srl.
(Corato, Bari, Italy).
The schematic diagram of the OD experimental set-up is depicted in Fig. 5.2. The
equipment consists of two independent compartments, one for the feed solution (the NF
retentate), the other for the stripping solution.
Fig. 5.2. Schematic diagram of OD experimental set-up.
CHAPTER 5
96
The unit featured a Liqui-Cell Extra-Flow 2.5 x 8-in. membrane contactor (Membrana,
Charlotte, USA) containing microporous polypropylene hollow fibers (having external
and internal diameters of 300 µm and 220 µm, respectively) with an average pore
diameter of 0.2 µm and a total membrane surface area of 1.4 m2. Characteristics of OD
membrane module are reported in Table 5.1. The feed solution was pumped through the
shell side of the membrane module; a calcium chloride dihydrate solution of 60%w/w
was pumped through the fiber lumens (tube side). Feed and stripping solution were
recirculated through the contactor in a counter-current mode with an average flow-rate
of 1.5 L/min. TMP in both compartments were kept constants at 0.105 bar, whereas the
temperature was maintained almost constant in both compartments at 24.59±1.15°C and
24.89±1.12°C in the shell side and tube side, respectively.
Table 5.1. Characteristics of Liqui-Cell Extra-Flow membrane contactor.
Characteristics
Fiber
Fiber type Celgard
® Microporous Polypropylene
Hollow fiber
External diameter 0.30 mm
Internal diameter 0.22 mm
Length 160 mm
Pore diameter 30 nm
Porosity ~ 40%
Cartridge
Operating
Limits
Maximum transmembrane 4.13 bar
Temperature range 40°C
Cartridge
Characteristics
Cartridge Dimensions (DxL) 80x280 mm
Effective Surface Area 1.4 m2
Effective Area/Volume 29.3 cm2/cm
3
Fiber Potting Material Polyethylene
The volume ratio between feed solution and stripper was 1:2, in order to prevent a
significant dilution of the brine solution with a consequent decreasing of the driving
force during the process. Evaporation fluxes (Jw) were determined gravimetrically
measuring the weight of the water extracted from the NF retentate by means of a digital

Concentration of NF retentate by osmotic distillation
97
balance placed under the feed tank. After each trial, the pilot plant was cleaned first by
rinsing the tube side and shell side with de-ionized water. Then, the shell side was
cleaned with a KOH solution at 2% w/w for 1 h at 40°C. After a short rinsing with
de-ionized water a citric acid solution at 2% w/w was circulated for 1 h at 40°C. A final
rinsing with de-ionized water was carried out.
5.2 Experimental results
Fig. 5.3-a shows the time course of the evaporation flux and TSS content during the
concentration of NF retentate by OD. The initial evaporation flux equal to 0.59 kg/m2h,
decreased gradually up to reach a final value of 0.39 kg/m2h when the TSS content of
the press liquor was at 30.4°Brix. The flux decline can be attributed to the decrease in
brine concentration (Fig. 5.3-b). Alves et al. [12] reported that the dilution of the brine
solution leads the decrease in vapour pressure of the osmotic agent and, consequently,
to the reduction of the driving force for water transport through the membrane. In
addition, the increase of feed concentration is related with an increasing of the feed
viscosity that can raise the resistance to mass transfer in the liquid phase and,
consequently, to determine a polarization effect leading to a lower driving force [13,14].
Similar results were obtained in the OD concentration of different clarified juices
(kiwifruit, citrus, carrot, passion fruit, cactus pear, etc.) on laboratory and semi-
industrial scale [6,7,15-17].

CHAPTER 5
98
Operating time (min)
0 50 100 150 200 250
Jw (
kg/m
2 h
)
0.0
0.2
0.4
0.6
0.8
1.0
TS
S (
°brix)
0
5
10
15
20
25
30
35
Jw
TSS
Operating time (min)
0 50 100 150 200 250
Calc
ium
chlo
ride d
ihydra
te (
% w
/w)
0
20
40
60
80
100
Fig. 5.3. Treatment of NF retentate by OD. Time course of (a) evaporation flux and TSS
content; (b) calcium chloride dehydrate concentration.
The evolution of the hesperidin concentration during the OD process is shown in
Fig. 5.4. In the final OD sample with a TSS content of 30.5 °Brix the concentration of
hesperidin was 1020 mg/L. Traditional concentration methodologies such as
(a)
(b)
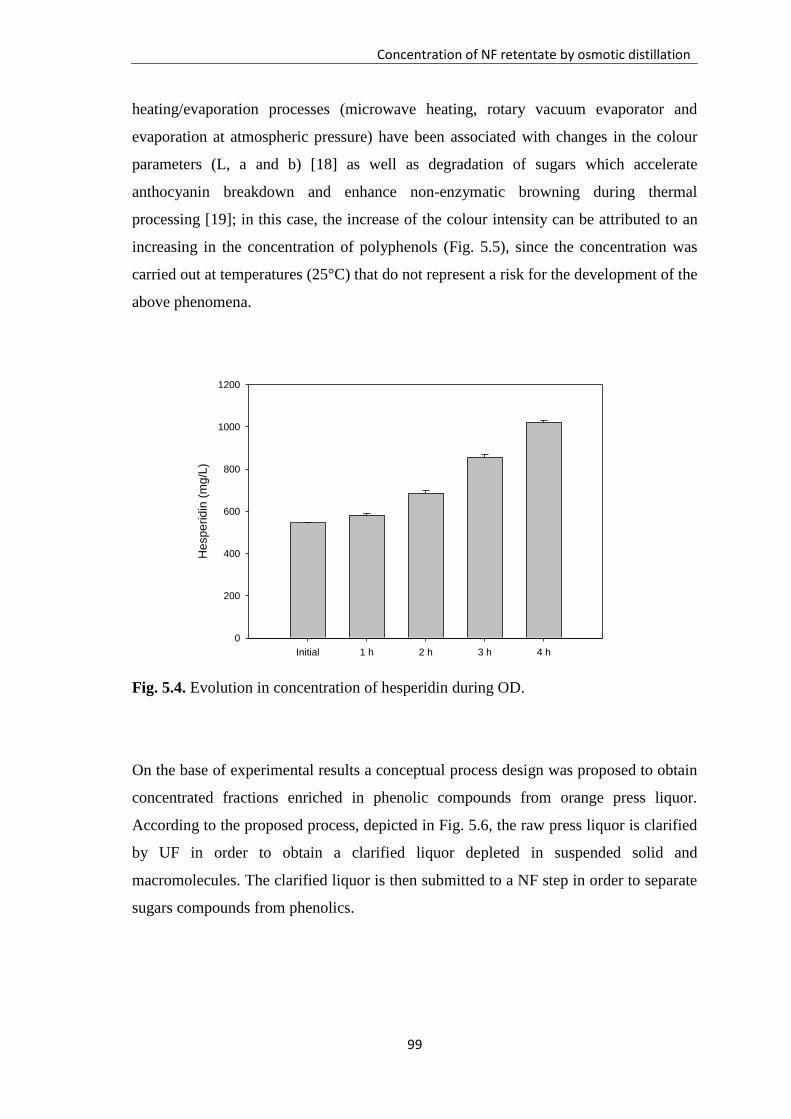
Concentration of NF retentate by osmotic distillation
99
heating/evaporation processes (microwave heating, rotary vacuum evaporator and
evaporation at atmospheric pressure) have been associated with changes in the colour
parameters (L, a and b) [18] as well as degradation of sugars which accelerate
anthocyanin breakdown and enhance non-enzymatic browning during thermal
processing [19]; in this case, the increase of the colour intensity can be attributed to an
increasing in the concentration of polyphenols (Fig. 5.5), since the concentration was
carried out at temperatures (25°C) that do not represent a risk for the development of the
above phenomena.
Initial 1 h 2 h 3 h 4 h
He
sp
eri
din
(m
g/L
)
0
200
400
600
800
1000
1200
Fig. 5.4. Evolution in concentration of hesperidin during OD.
On the base of experimental results a conceptual process design was proposed to obtain
concentrated fractions enriched in phenolic compounds from orange press liquor.
According to the proposed process, depicted in Fig. 5.6, the raw press liquor is clarified
by UF in order to obtain a clarified liquor depleted in suspended solid and
macromolecules. The clarified liquor is then submitted to a NF step in order to separate
sugars compounds from phenolics.

CHAPTER 5
100
Fig. 5.5. Samples collected at different times during the concentration of the NF
retentate by OD.
The NF permeate, enriched in sugar compounds, can be of interest for food
applications. The NF retentate fraction can be submitted to a final concentration step by
OD: the final product, with high antioxidant activity due to the concentration of
phenolic compounds is of potential interest for nutraceutical or food applications.
Fig. 5.6. Conceptual process design for the treatment of citrus press liquor based on an
integrated membrane process.
The proposed process leads to significant advantages in terms of reduction of
environmental impact, recovery of high-added value component, reduction of
depolluting costs, saving of water and energy requirements.
Concentration of NF retentate by osmotic distillation
101
References
[1] M. Chen, J. Song. 1994. Fresh-preservating concentrated pomegranate juice
producing method. Patent CN 1080492(A).
[2] F. Pang, H. Wang, G. Lu. 2008. Concentrated pomegranate clear juice
manufacturating technique. Patent CN 101283823(A).
[3] B. Jiao, A. Cassano, E. Drioli. Recent advances on membrane processes for the
concentration of fruit juices: a review. Journal of Food Engineering, 63 (2004)
303–324.
[4] P.A. Hogan, R.P. Canning, P.A. Peterson, R.A. Johnson, A.S. Michaels. A new
option: osmotic distillation. Chemical Engineering Progress, 94 (1998) 49–61.
[5] N. Nagaraj, B.S. Patil, P.M. Biradar.. Osmotic membrane distillation – A brief
review. International Journal of Food Engineering, 2 (2006), article 5.
[6] A. Cassano, E. Drioli. Concentration of clarified kiwifruit juice by osmotic
distillation. Journal of Food Engineering, 79 (2007) 1397–1404.
[7] A. Cassano, C. Conidi, R. Timpone, M. D’Avella, E. Drioli. A membrane-based
process for the clarification and the concentration of the cactus pear juice. Journal
of Food Engineering, 80 (2007) 914–921.
[8] C. Hongvaleerat, L.M.C. Cabral, M. Dornier, M. Reynes, S. Ningsanond.
Concentration of pineapple juice by osmotic evaporation. Journal of Food
Engineering, 88 (2008) 548–552.
[9] R.B. Rodrigues, H.C. Menezes, L.M.C. Cabral, M. Dornier, G.M. Rios, M. Reynes.
Evaluation of reverse osmosis and osmotic evaporation to concentrate camu–camu
juice (Myrciaria dubia). Journal of Food Engineering, 63 (2004) 97–102.
[10] P.E. Shaw, M. Lebrun, M. Dornier, M.N Ducamp, M. Courel, M. Reynes.
Evaluation of concentrated orange and passionfruit juices prepared by osmotic
distillation. LWT-Food Science and Technology, 34 (2001) 60–65.
[11] A. Kozák, A. Rektor, G. Vatai. Integrated large-scale membrane process for
producing concentrated fruit juices. Desalination, 200 (2006) 540–542.
[12] V.D. Alves, B. Koroknai, K. Bélafi-Bakó, I.M. Coelhoso. Using membrane
contactors for fruit juice concentration. Desalination, 162 (2004) 263–270.
[13] A. Altan, M. Maskan. Rheological behavior of pomegranate (Punica granatum L.)
juice and concentrate. Journal of Texture Studies, 36 (2005) 68–77.
CHAPTER 5
102
[14] M.A. Magerramov, A.I. Abdulagatov, N.D. Azizov, I.M. Abdulagatov. Effect of
temperature, concentration, and pressure on the viscosity of pomegranate and pear
juice. Journal of Food Engineering, 80 (2007) 476–489.
[15] A. Cassano, E. Drioli, G. Galaverna, R. Marchelli, G. Di Silvestro, P. Cagnasso.
Clarification and concentration of citrus and carrot juices by integrated membrane
processes. Journal of Food Engineering, 57 (2003) 153–163.
[16] F. Vaillant, E. Jeanton, M. Dornier, G.M. O’Brien, M. Reynes, M. Decloux.
Concentration of passion fruit juice on an industrial pilot scale using osmotic
evaporation. Journal of Food Engineering, 47 (2001) 195–202.
[17] F. Vaillant, M. Cisse, M. Chaverri, A. Perez, M. Dornier, F. Viquez, C. Dhuique-
Mayer. Clarification and concentration of melon juice using membrane process.
Innovative Food Science and Emerging Technology, 6 (2005) 213–220.
[18] M. Maskan. Production of pomegranate (Punica granatum L.) juice concentrate by
various heating methods: colour degradation and kinetics. Journal of Food
Engineering, 72 (2006) 218–224.
[19] H.J. Suh, D.O. Noh, C.S. Kang, J.M. Kim, S.W. Lee. Thermal kinetics of color
degradation of mulberry fruit extract. Nahrung, 47 (2003) 132–135.
103
CONCLUSIONS
This PhD dissertation aimed at evaluating the potential of an integrated membrane
system in the recovery of high-added value compounds, as polyphenols, from the
orange press liquor, a by-product of the citrus industry. The strategy was focused on the
use of three different membrane operations such as UF, NF and OD in order to obtain a
final product enriched in phenolic compounds with a reduction in the sugar content.
Different MF and UF membranes were analysed for their potential in the clarification of
the raw press liquor. The study of membrane characteristics and operating conditions on
laboratory scale permitted to select a suitable membrane and the combination of
operating parameters to maximize the permeate flux and minimize the rejection of
polyphenols. Experiments on larger scale were carried out, on the base of previous
results, by using a tubular PS membrane producing a clarified press liquor containing
91% and 72.83% of hesperidin and sugars present in the raw liquor, respectively.
The clarified liquor was submitted to a fractionation step performed by using a NF
process. Studies performed with three flat-sheet NF membranes allowed to identify
suitable membrane to concentrate phenolic compounds reducing the sugar content
simultaneously. Experimental activities performed with this membrane in spiral-wound
configuration permitted to obtain a retentate stream containing 70.43% of the hesperidin
contained in the clarified liquor with a sugar reduction equal to 59.74%.
The NF retentate was submitted to a final concentration step by in which a concentrated
solution with a content of hesperidin 6.39 times higher than the initial one was
produced.
On the base of experimental results a conceptual process design for the treatment of
orange press liquor was formulated. The proposed process offers new perspectives for
the valorisation of by-products coming from the citrus industry.
According to their composition in phenolic and sugar compounds, different fractions
produced in the proposed integrated membrane system appear of interest to develop
104
new formulations for nutraceutical and food applications. Significant advantages can be
achieved in terms of reduction of environmental impact, recovery of high-added value
compounds, saving of water and energy consumption.
The present PhD dissertation can be considered a starting point for further
investigations devoted to improve the purification of phenolic compounds from citrus
by-products (i.e. evaluating the fractionation of clarified press liquor with NF
membranes in a sequential design) and to evaluate the bioactive properties (including
antiallergic, antidiabetic, antiinflammatory, antiviral, antiproliferative, and
anticarcinogenic activities) of the produced fractions.

105
ANNEX
Publications.
International Journals:
René Ruby-Figueroa, Alfredo Cassano, Enrico Drioli. Ultrafiltration of orange press
liquor. Optimization of operating conditions for the recovery of antioxidant compounds
by response surface methodology, Separation and Purification Technology 98 (2012)
255-261
Beatriz Cancino-Madariaga, Rene Ruby, Carolina Luisa Astudillo, Jorge Saavedra,
Mariane Lutz, Analysis of the membrane fouling mechanisms involved in clarified
grape juice ultrafiltration using statisticals tools. Industrial and Engineering Chemistry
Research, 51 (2012) 4017−4024
René Ruby-Figueroa, Alfredo Cassano, Enrico Drioli, Ultrafiltration of orange press
liquor: Optimization for permeate flux and fouling index by response surface
methodology. Separation and Purification Technology, 80 (2011) 1-10.
Beatriz Cancino-Madariaga, Carlos Felipe Hurtado, Rene Ruby. Effect of pressure and
pH in ammonium retention for nanofiltration and reverse osmosis membranes to be
used in recirculation aquaculture Systems (RAS). Aquacultural Engineering, 45 (2011)
103-108
Mariane Lutz, Katterin Jorquera, Beatriz Cancino, Rene Ruby, Carolina Henriquez.
Phenolics and antioxidant capacity of Table grape (Vitis vinifera L.) Cultivars Grown in
Chile. Journal of Food Science, 76 (7) (2011) C1088-C1093

106
Book chapters:
Frank Lipnizki, René Ruby-Figueroa. 2013. Membrane operations in the brewing and
sugar production. In Integrated Membrane Operations in the Food Production, ed. A.
Cassano and E. Drioli, published by Verlag Walter de Gruyter & Co., Berlin
Alfredo Cassano, René Ruby-Figueroa, Enrico Drioli. Membrane Separation. In Food
Processing, ed. Theodoros Varzakas. Taylor and Francis Group (Boca Raton, Florida)
Conferences
Oral Presentation:
R. Mazzei, E. Piacentini, E. Drioli, R.A. Ruby-Figueroa, L. Giorno. Olive mil waste
water processed by intensified biocatalytic membrane reactor as source of
phytotherapics. VIII Congreso Ibero-Americano en Ciencia y Tecnologia de
Membranas, Salta, Argentina, 24-27 aprile 2012
Poster presentation:
R.A. Ruby-Figueroa, A. Cassano, E. Drioli. Effect of operating conditions on permeate
flux and total resistance during the ultrafiltration of orange press liquor. ITM seminar
day, Rende (CS), 14 luglio 2011.
R.A. Ruby-Figueroa, Alfredo Cassano, Enrico Drioli. Analysis of performance of MF
and UF membranes in the clarification of citrus wastewaters by Multivariate Analysis.
2nd
Training Workshop on “Functionalized membranes for wastewater treatment –
nanoparticles and surface modifications”, Cetraro (CS), 15-17 maggio 2013.