recreation carrying capacity - department of ... recreation carrying capacity (r-8) oroville...
TRANSCRIPT
State of CaliforniaThe Resources Agency
Department of Water Resources
RECREATION CARRYING CAPACITY
FINAL
R-8
Oroville Facilities Relicensing FERC Project No. 2100
JUNE 2004
ARNOLDSCHWARZENEGGER
Governor State of California
MIKE CHRISMAN Secretary for Resources The Resources Agency
LESTER A. SNOW Director
Department of Water Resources


Final Recreation Carrying Capacity (R-8) Oroville Facilities P-2100 Relicensing
Proposed Final Report – For Distribution to Collaborative
Oroville Facilities Relicensing Team June 2004
State of CaliforniaThe Resources Agency
Department of Water Resources
RECREATION CARRYING CAPACITY
FINAL
R-8
Oroville Facilities Relicensing FERC Project No. 2100
This report was prepared under the direction of
Douglas Rischbieter ......... Staff Environmental Scientist, Resource Area Manager, DWR
by
Bill Spain ...................................................................Environmental Planner, EDAW, Inc. Sergio Capozzi ..........................................................Environmental Planner, EDAW, Inc. Chuck Everett................................................ Senior Environmental Planner, EDAW, Inc.

Final Recreation Carrying Capacity (R-8) Oroville Facilities P-2100 Relicensing
Proposed Final Report – For Distribution to Collaborative
Oroville Facilities Relicensing Team June 2004
This report was prepared under the general direction of DWR staff. Opinions, findings, and conclusions expressed in this report are those of the authors. This report does not express the official position of DWR unless specifically approved by the Director or his designee.
Final Recreation Carrying Capacity (R-8) Oroville Facilities P-2100 Relicensing
Proposed Final Report – For Distribution to Collaborative
Oroville Facilities Relicensing Team RS-1 June 2004
REPORT SUMMARY
The California Department of Water Resources (DWR) operates the Oroville Facilities, a multipurpose water supply, flood management, power generation, fish and wildlife enhancement and recreation project. The hydroelectric facilities operate under a license from the Federal Energy Regulatory Commission (FERC), which expires on January 31, 2007. Pursuant to the Federal Power Act, DWR is required to file an application for a new license on or before January 31, 2005.
FERC regulations require a comprehensive recreation plan; this study is being conducted in support of this plan development. Relicensing Study R-8 – RecreationCarrying Capacity helps address “Issue Statement R1—adequacy of existing Project recreation facilities, opportunities, and access to accommodate current use and future demand.” This study investigates the existing capacity of recreation resources in the study area by analyzing four capacity types including ecological, spatial, facility, and social.
Relicensing Study R-8 assesses the types and levels of recreational use in the study area to determine if use levels are compatible with the capacity of the study area, both currently and during the term of the expected new license. Maintaining use levels within a recreation site’s capacity is important in terms of protecting natural, cultural, and recreation resources, as well as “helping to assure public safety, providing predictability to private sector permittees and local communities, allocating opportunities among public and private sector providers, contributing to planning at a local or regional ecosystem scale, and helping to assess the consequences of management alternatives” (Haas 2002).
Quantitative and qualitative data were used to identify ecological, spatial, facility, and social capacity impacts and management parameters at each developed recreation site in the study area. One or multiple capacity types were identified as the primary limiting factor(s) at each recreation site based on the level of concern for each individual capacity type. A limiting factor is defined as an indicator that constrains the level of recreational use (capacity) at a site or area. The limiting factor often drives future decision-making regarding management priorities and monitoring programs and is often the “trigger” that determines when recreation use has reached a specific level of capacity.
After evaluating the capacity level for each indicator variable, an overall capacity conclusion was determined for each developed recreation facility and for the study area as a whole. Exploring different levels of capacity are important in determining where capacity concerns may exist and where management priorities and monitoring programs should be directed. Potential options to address any capacity concerns at study area recreation sites are briefly discussed. The results and options listed in this analysis will be elaborated in another relicensing study (Relicensing Study R-17—Recreation Needs Analysis), but are not necessarily study area needs, nor should they

Final Recreation Carrying Capacity (R-8) Oroville Facilities P-2100 Relicensing
Proposed Final Report – For Distribution to Collaborative
Oroville Facilities Relicensing Team RS-2 June 2004
be assumed to be protection, mitigation, or enhancement measures (PM&Es). Instead, these results, as well as the results from the other recreation relicensing studies, should be considered in aggregate and used to help formulate potential recreation needs for the study area.
Overall, recreational use in the study area is considered to be approaching capacity (Table 5.1-1). While all of the capacity indicator variables, except ecological capacity, are considered to be approaching capacity, the primary capacity-related limiting factors to recreational use in the study area include spatial and facility capacities. Spatial capacity is considered a limiting factor because of limited expansion area available at many of the existing developed recreation sites, as well as the high percentage of study area lands classified as “low” in terms of potential recreation development suitability.Facility capacity is a limiting factor because of percent occupancy constraints, as well as reservoir pool elevation variability, among other concerns. The capacity indicator variables in aggregate suggest that capacity-related decisions regarding recreation in the study area are a “moderate” priority at this time. The fact that both spatial and facility capacities are considered limiting factors is important for future capacity-related decision-making, as excess spatial capacity is usually necessary to expand the facility capacity of a developed recreation site. In the event that facility capacity must be expanded in the future, but potential spatial capacity is not available for expansion, other capacity-related management options will need to be considered.

Final Recreation Carrying Capacity (R-8) Oroville Facilities P-2100 Relicensing
Proposed Final Report – For Distribution to Collaborative
Oroville Facilities Relicensing Team i June 2004
TABLE OF CONTENTS
REPORT SUMMARY................................................................................................ RS-1
1.0 INTRODUCTION............................................................................................... 1-1 1.1 Background Information ............................................................................. 1-1 1.2 Study Area.................................................................................................. 1-2 1.3 Description of Facilities............................................................................... 1-2 1.4 Current Operational Constraints ................................................................. 1-7
1.4.1 Downstream Operation ................................................................. 1-8 1.4.1.1 Instream Flow Requirements .......................................... 1-8 1.4.1.2 Temperature Requirements ............................................ 1-8 1.4.1.3 Water Diversions............................................................. 1-9 1.4.1.4 Water Quality ................................................................ 1-10
1.4.2 Flood Management .................................................................... 1-10
2.0 NEED FOR STUDY........................................................................................... 2-1
3.0 STUDY OBJECTIVE(S)..................................................................................... 3-1
4.0 METHODOLOGY .............................................................................................. 4-1 4.1 Recreation Carrying Capacity..................................................................... 4-3
4.1.1 Ecological Capacity....................................................................... 4-3 4.1.1.1 Ecological Variables ......................................................... 4-4 4.1.1.2 Ecological Capacity Field Observations ........................... 4-6
4.1.2 Spatial Capacity ............................................................................ 4-7 4.1.3 Facility Capacity............................................................................ 4-9 4.1.4 Social Capacity ........................................................................... 4-10
4.2 Overall Site Capacity and Priority Synthesis............................................. 4-11
5.0 STUDY RESULTS................................................................................................. 5-1 5.1 Overall Study Area Capacity Summary ...................................................... 5-1
5.1.1 Ecological Capacity....................................................................... 5-1 5.1.2 Spatial Capacity ............................................................................ 5-4 5.1.3 Facility Capacity............................................................................ 5-5 5.1.4 Social Capacity ............................................................................. 5-6 5.1.5 Overall Capacity Conclusion......................................................... 5-7
5.2 Study Area Campground Capacity Summary ............................................. 5-7 5.2.1 Overall Capacity Summary of Developed Campgrounds.............. 5-7
5.2.1.1 Ecological Capacity .......................................................... 5-7 5.2.1.2 Spatial Capacity................................................................ 5-9 5.2.1.3 Facility Capacity ............................................................... 5-9 5.2.1.4 Social Capacity............................................................... 5-10

Final Recreation Carrying Capacity (R-8) Oroville Facilities P-2100 Relicensing
Proposed Final Report – For Distribution to Collaborative
Oroville Facilities Relicensing Team ii June 2004
TABLE OF CONTENTS (Cont.)
5.2.1.5 Overall Capacity Conclusion........................................... 5-10 5.2.2 Site-Specific Capacity of Campgrounds...................................... 5-11
5.2.2.1 Bidwell Canyon Campground ......................................... 5-115.2.2.2 Lime Saddle Campground and Group Campground ...... 5-13 5.2.2.3 Loafer Creek Campground, Group Campground, and
Equestrian Campground ................................................ 5-16 5.2.2.4 OWA Primitive Camping Area ........................................ 5-195.2.2.5 North Thermalito Forebay RV “En Route”
Campground .................................................................. 5-21 5.2.2.6 Spillway RV “En Route” Campground ............................ 5-21
5.3 Study Area Boat-In and Floating Campsite Capacity Summary ............... 5-22 5.3.1 Overall Capacity Summary of Boat-In and Floating Campsites .. 5-22
5.3.1.1 Ecological Capacity ........................................................ 5-22 5.3.1.2 Spatial Capacity.............................................................. 5-22 5.3.1.3 Facility Capacity ............................................................. 5-24 5.3.1.4 Social Capacity............................................................... 5-24 5.3.1.5 Overall Capacity Conclusion........................................... 5-25
5.3.2 Site-Specific Capacity of Boat-In and Floating Campsites .......... 5-25 5.3.2.1 Bloomer Area Boat-in Campsites ................................... 5-25 5.3.2.2 Craig Saddle Boat-in Campsites..................................... 5-27 5.3.2.3 Foreman Creek Boat-in Campsites ................................ 5-29 5.3.2.4 Goat Ranch Boat-in Campsites ...................................... 5-30 5.3.2.5 Floating Campsites......................................................... 5-32
5.4 Study Area Day Use Area Capacity Summary ......................................... 5-34 5.4.1 Overall Capacity Summary of Day Use Areas ............................ 5-34
5.4.1.1 Ecological Capacity ........................................................ 5-34 5.4.1.2 Spatial Capacity.............................................................. 5-34 5.4.1.3 Facility Capacity ............................................................. 5-36 5.4.1.4 Social Capacity............................................................... 5-37 5.4.1.5 Overall Capacity Conclusion........................................... 5-37
5.4.2 Site-Specific Capacity of Day Use Areas .................................... 5-37 5.4.2.1 Lake Oroville Visitors Center .......................................... 5-38 5.4.2.2 Feather River Fish Hatchery........................................... 5-40 5.4.2.3 Oroville Dam DUA and Overlook .................................... 5-42 5.4.2.4 Floating Restrooms ........................................................ 5-44 5.4.2.5 Diversion Pool DUA........................................................ 5-45 5.4.2.6 Aquatic Center................................................................ 5-47 5.4.2.7 Model Aircraft Flying Area .............................................. 5-47 5.4.2.8 Clay Pit State Vehicular Recreation Area (SVRA) ......... 5-49 5.4.2.9 Rabe Road Shooting Area.............................................. 5-51 5.4.2.10 Riverbend Park............................................................. 5-53
Final Recreation Carrying Capacity (R-8) Oroville Facilities P-2100 Relicensing
Proposed Final Report – For Distribution to Collaborative
Oroville Facilities Relicensing Team iii June 2004
TABLE OF CONTENTS (Cont.)
5.5 Study Area Boat Ramp and Day Use Area Capacity Summary................ 5-55 5.5.1 Overall Capacity Summary of Boat Ramps
and Associated Day Use Areas................................................... 5-55 5.5.1.1 Ecological Capacity ........................................................ 5-55 5.5.1.2 Spatial Capacity.............................................................. 5-56 5.5.1.3 Facility Capacity ............................................................. 5-56 5.5.1.4 Social Capacity............................................................... 5-59 5.5.1.5 Overall Capacity Conclusion........................................... 5-59
5.5.2 Site-Specific Capacity of Boat Ramps and Day Use Areas ........ 5-60 5.5.2.1 Bidwell Canyon BR/DUA ................................................ 5-61 5.5.2.2 Lime Saddle BR/DUA ..................................................... 5-64 5.5.2.3 Loafer Creek BR/DUA .................................................... 5-66 5.5.2.4 Monument Hill BR/DUA .................................................. 5-69 5.5.2.5 North Thermalito Forebay BR/DUA ................................ 5-72 5.5.2.6 South Thermalito Forebay BR/DUA................................ 5-74 5.5.2.7 Spillway BR/DUA............................................................ 5-76 5.5.2.8 Afterbay Outlet BR.......................................................... 5-79 5.5.2.9 Enterprise BR ................................................................. 5-81 5.5.2.10 Wilbur Road BR............................................................ 5-83 5.5.2.11 Dark Canyon Car-top BR.............................................. 5-85 5.5.2.12 Foreman Creek Car-top BR.......................................... 5-87 5.5.2.13 Larkin Road Car-top BR ............................................... 5-89 5.5.2.14 Nelson Bar Car-top BR................................................. 5-91 5.5.2.15 Stringtown Car-top BR.................................................. 5-93 5.5.2.16 Vinton Gulch Car-top BR .............................................. 5-95
5.6 Study Area Trails Capacity Summary....................................................... 5-97 5.6.1 Ecological Capacity..................................................................... 5-98 5.6.2 Spatial Capacity .......................................................................... 5-99 5.6.3 Facility Capacity.......................................................................... 5-99 5.6.4 Social Capacity ......................................................................... 5-101 5.6.5 Overall Capacity Conclusion..................................................... 5-101
6.0 CONCLUSIONS................................................................................................... 6-1 6.1 Ecological Capacity .................................................................................... 6-2 6.2 Spatial Capacity.......................................................................................... 6-2 6.3 Facility Capacity ......................................................................................... 6-2 6.4 Social Capacity........................................................................................... 6-3 6.5 Summary .................................................................................................... 6-3
7.0 REFERENCES..................................................................................................... 7-1

Final Recreation Carrying Capacity (R-8) Oroville Facilities P-2100 Relicensing
Proposed Final Report – For Distribution to Collaborative
Oroville Facilities Relicensing Team iv June 2004
LIST OF TABLES
Table 4.1-1. Level of impact and corresponding overall ecological capacity level for study area developed and dispersed recreation sites............................. 4-7
Table 4.1-2. Spatial capacity levels for developed recreation sites ............................. 4-8 Table 4.1-3. Facility capacity levels for developed recreation sites
in the study area ................................................................................... 4-10 Table 4.1-4. Social capacity levels for developed recreation sites ............................ 4-11 Table 4.2-1. Overall capacity priority levels for developed recreation facilities at
Lake Oroville Facilities .......................................................................... 4-12Table 5.1-1. Summary of study area capacity by facility or site type........................... 5-2 Table 5.2-1. Summary of study area developed campground capacity....................... 5-8 Table 5.3-1. Summary of study area boat-in campground and floating campsites
capacity................................................................................................. 5-23 Table 5.4-1. Summary of study area day use area capacity .................................... 5-35 Table 5.5-1. Summary of study area boat ramp and associated day use area
capacity................................................................................................. 5-58
LIST OF FIGURES
Figure 1.2-1 Project Area and Associated Recreation Sites........................................ 1-3 Figure 1.2-2 Oroville Facilities FERC Project 2100 boundary ..................................... 1-5
Final Recreation Carrying Capacity (R-8) Oroville Facilities P-2100 Relicensing
Proposed Final Report – For Distribution to Collaborative
Oroville Facilities Relicensing Team v June 2004
ACRONYMS
ADA Americans with Disabilities Act af acre-feet ATV all terrain vehicle BIC Boat-in Campsite BR Boat Ramp cfs cubic feet per second DFG California Department of Fish and Game DPR California Department of Parks and Recreation DUA Day Use Area DWR California Department of Water Resources F Fahrenheit FERC Federal Energy Regulatory Commission FRRPD Feather River Recreation and Park District FRSA Feather River Scenic Area ISO Independent System Operator LFC low flow channel LOSRA Lake Oroville State Recreation Area maf million acre-feet msl mean sea level MW megawatt NOAA Fisheries National Oceanic and Atmospheric Administration National Marine
Fisheries Service OHV off-highway vehicle OWA Oroville Wildlife Area PAOT people-at-one-time PG&E Pacific Gas and Electric PM&E protection, mitigation, and enhancement PWC personal watercraft RD recreation day RM river mile ROS Recreation Opportunity Spectrum SVRA State Vehicular Recreation Area SWP State Water Project USACE U.S. Army Corps of Engineers VAOT vehicles-at-one-time

Final Recreation Carrying Capacity (R-8) Oroville Facilities P-2100 Relicensing
Proposed Final Report – For Distribution to Collaborative
Oroville Facilities Relicensing Team vi June 2004
This page intentionally left blank.

Final Recreation Carrying Capacity (R-8) Oroville Facilities P-2100 Relicensing
Proposed Final Report – For Distribution to Collaborative
Oroville Facilities Relicensing Team 1-1 June 2004
1.0 INTRODUCTION
This document presents an analysis of Recreation Carrying Capacity, one of several recreation studies conducted for Oroville Facilities relicensing. This study assesses the types and levels of recreational use in the study area to determine if use levels are compatible with the capacity of the study area both currently and during the forecasted term of the new license. Maintaining use levels within a recreation site’s capacity is important in terms of protecting natural, cultural, and recreation resources, as well as “helping to assure public safety, providing predictability to private sector permittees and local communities, allocating opportunities among public and private sector providers, contributing to planning at a local or regional ecosystem scale, and helping to assess the consequences of management alternatives” (Haas 2002).
At reservoir recreation areas, particularly near urban areas, there are limits as to how much recreation use and impacts that existing facilities and areas can accommodate. At some point, recreation demand cannot be met without negatively affecting sensitive resources in the area and/or the recreation experience that people expect when they come to the study area. The goal for decision-makers is to manage recreation use levels and impacts so that they do not exceed overall capacity standards set for the study area.
The primary purpose of this study is to investigate the existing and potential future capacity of recreation resources in the Project area. Recreation carrying capacity has been defined in a number of ways, but a useful definition is “the level of use beyond which impacts exceed standards” (Shelby and Heberlein 1986). This study consists of an analysis of recreation capacity using four capacity indicators: ecological capacity, spatial capacity, facility capacity, and social capacity.
Exploring different levels of capacity are important in determining where capacity concerns may exist and where management priorities and monitoring programs should be directed. Two levels of capacity need to be assessed: site-specific level and Project-wide level. Once these levels have been assessed, overall capacity can be determined for the study area.
1.1 BACKGROUND INFORMATION
The California Department of Water Resources (DWR), guided by the Oroville Facilities Relicensing Collaborative, commissioned this study as part of the relicensing process for the preparation of a license application to be submitted to the Federal Energy Regulatory Commission (FERC) for the Oroville Facilities (FERC Project No. 2100). As part of this relicensing process, a series of related studies are being conducted to assess and evaluate recreation resources associated with the Oroville Facilities.

Final Recreation Carrying Capacity (R-8) Oroville Facilities P-2100 Relicensing
Proposed Final Report – For Distribution to Collaborative
Oroville Facilities Relicensing Team 1-2 June 2004
Lake Oroville is the second largest reservoir in California, after Shasta Lake. Numerous existing facilities at Lake Oroville offer a variety of recreational opportunities, including boating, fishing, and camping. Opportunities to camp in the area range from fully developed campgrounds to primitive, less-developed sites. Boat-in and floating campsites also exist. There are two full-service marinas, six boat launches, eight car-top boat launches, ten floating campsites, seven floating toilets, and a visitor center located in the vicinity of Lake Oroville. At Lake Oroville itself, there are major developed recreation facilities at Loafer Creek, Bidwell Canyon, Spillway, and Lime Saddle. Other recreation opportunities include picnicking, swimming, horseback riding, hiking, off-road bicycle riding, personal watercraft (PWC) use, wildlife watching, and hunting. The area also offers visitor information sites with cultural and informational displays about Project facilities and the area’s natural and cultural environment. Additional recreational and visitor facilities are located at Thermalito Diversion Pool, Thermalito Forebay, Thermalito Afterbay, and the Oroville Wildlife Area (OWA).
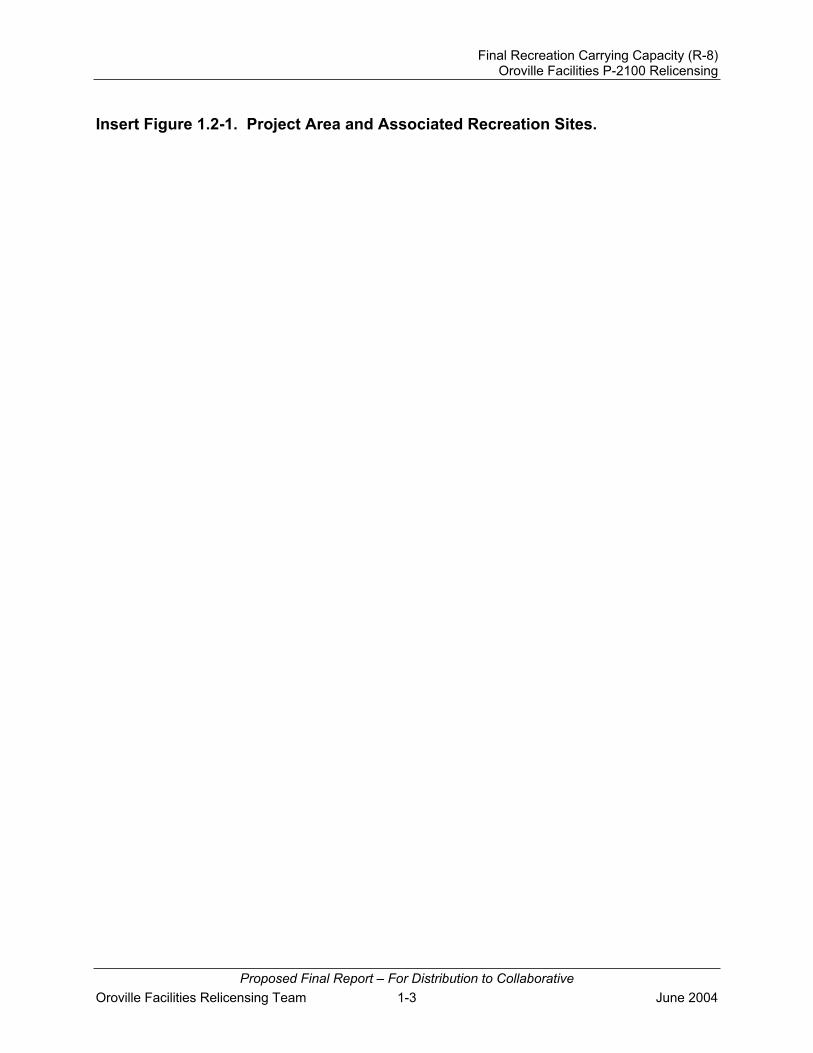
1.2 STUDY AREA
All public recreation sites included in the study area are depicted in Figure 1.2-1. The study area also includes all lands and waters within 0.25 mile of the Project boundary, which extends from south of the City of Oroville to reaches of the South Fork, Middle Fork, and North Fork of the Feather River (Figure 1.2-2). Encompassed within the study area are Lake Oroville, Thermalito Diversion Pool, Thermalito Forebay, Thermalito Afterbay, Lake Oroville Visitors Center, and the OWA. Lake Oroville, the Thermalito Diversion Pool, and the Thermalito Forebay are within the Lake Oroville State Recreation Area (LOSRA), which is managed by California Department of Parks and Recreation (DPR). Project facilities such as the Oroville Dam, Hyatt Powerplant, Thermalito Diversion Dam and Powerplant, Thermalito Power Canal, and the Thermalito Pumping-Generating Plant are excluded from this analysis as the public is generally discouraged or prohibited from using these Project facilities for recreation purposes.
1.3 DESCRIPTION OF FACILITIES
The Oroville Facilities were developed as part of the State Water Project (SWP) – a water storage and delivery system of reservoirs, aqueducts, power plants, and pumping plants. The main purpose of the SWP is to store and distribute water to supplement the needs of urban and agricultural water users in Northern California, the San Francisco Bay area, the San Joaquin Valley, and Southern California. The Oroville Facilities are also operated for flood control power generation, to improve water quality in the Sacramento-San Joaquin Delta, enhance fish and wildlife, and provide recreation.
FERC Project No. 2100 (Figure 1.2-2) encompasses 41,100 acres and includes Oroville Dam and Reservoir, three power plants (Hyatt Pumping-Generating Plant, Thermalito Diversion Dam Power Plant, and Thermalito Pumping-Generating Plant), Thermalito Diversion Dam, the Feather River Fish Hatchery and Fish Barrier Dam, Thermalito Power Canal, the OWA, Thermalito Forebay and Forebay Dam, Thermalito Afterbay
Final Recreation Carrying Capacity (R-8) Oroville Facilities P-2100 Relicensing
Proposed Final Report – For Distribution to Collaborative
Oroville Facilities Relicensing Team 1-3 June 2004
Insert Figure 1.2-1. Project Area and Associated Recreation Sites.


Final Recreation Carrying Capacity (R-8) Oroville Facilities P-2100 Relicensing
Proposed Final Report – For Distribution to Collaborative
Oroville Facilities Relicensing Team 1-4 June 2004
Back of Figure 1.2-1.

Final Recreation Carrying Capacity (R-8) Oroville Facilities P-2100 Relicensing
Proposed Final Report – For Distribution to Collaborative
Oroville Facilities Relicensing Team 1-5 June 2004
FISH HATCHERY
OROVILLE WILDLIFE AREA
Figure 1.2-2. Oroville Facilities FERC Project 2100 boundary.
HYATT PUMPING-
GENERATING
PLANT

Final Recreation Carrying Capacity (R-8) Oroville Facilities P-2100 Relicensing
Proposed Final Report – For Distribution to Collaborative
Oroville Facilities Relicensing Team 1-6 June 2004
and Afterbay Dam, transmission lines, and a relatively large number of recreational facilities. Oroville Dam, along with two small saddle dams, impounds Lake Oroville, a 3.5-million-acre-foot (maf) capacity storage reservoir with a surface area of 15,810 acres at its maximum normal operating level of 900 feet above mean sea level (msl).
The hydroelectric facilities have a combined licensed generating capacity of approximately 762 megawatts (MW). The Hyatt Pumping-Generating Plant is the largest of the three power plants with a capacity of 645 MW. Water from the six-unit underground power plant (three conventional generating and three pumping-generating units) is discharged through two tunnels into the Feather River just downstream of Oroville Dam. The plant has a generating and pumping flow capacity of 16,950 cubic feet per second (cfs) and 5,610 cfs, respectively. Other generation facilities include the 3-MW Thermalito Diversion Dam Power Plant and the 114-MW Thermalito Pumping-Generating Plant.
Thermalito Diversion Dam, 4 miles downstream of the Oroville Dam, creates a tailwater pool for the Hyatt Pumping-Generating Plant and is used to divert water into the Thermalito Power Canal. Thermalito Diversion Dam Power Plant is located on the left abutment of the Diversion Dam. The power plant releases a maximum of 615 cfs into the river.
The Power Canal is a 10,000-foot-long channel designed to convey generating flows of 16,900 cfs to the Thermalito Forebay and pump-back flows to the Hyatt Pumping-Generating Plant. Thermalito Forebay is an off-stream regulating reservoir for the 114-MW Thermalito Pumping-Generating Plant. The Thermalito Pumping-Generating Plant is designed to operate in tandem with the Hyatt Pumping-Generating Plant and has generating and pump-back flow capacities of 17,400 cfs and 9,120 cfs, respectively.When in generating mode, the Thermalito Pumping-Generating Plant discharges into Thermalito Afterbay, which is contained by a 42,000-foot-long earth-fill dam. The Afterbay, which is used to release water into the Feather River downstream of the Oroville Facilities, helps regulate the power system, provides storage for pump-back operations, provides recreational opportunities, and provides local irrigation water.Several local irrigation districts also receive Lake Oroville water via the Afterbay.
The Feather River Fish Barrier Dam is downstream of the Thermalito Diversion Dam and immediately upstream of the Feather River Fish Hatchery. The flow over the dam maintains fish habitat in the low-flow channel of the Feather River between the dam and the Afterbay outlet, and provides attraction flow for the hatchery. The hatchery is an anadromous fish hatchery intended to compensate for salmon and steelhead spawning grounds made unreachable by construction of Oroville Dam. Hatchery facilities have a production capacity of 10 million fall-run salmon, 5 million spring-run salmon, and 450,000 steelhead annually (pers. comm., Kastner 2003). Diseases have occasionally reduced hatchery production in recent years, however.

Final Recreation Carrying Capacity (R-8) Oroville Facilities P-2100 Relicensing
Proposed Final Report – For Distribution to Collaborative
Oroville Facilities Relicensing Team 1-7 June 2004
The Oroville Facilities support a wide variety of recreational opportunities. These include several types of boating and fishing, fully developed and primitive camping (including boat-in and floating sites), picnicking, swimming, horseback riding, hiking, off-road bicycle riding, wildlife watching, hunting, and visitor information sites with cultural and informational displays about the developed facilities and the natural environment. There are major recreation facilities at Loafer Creek, Bidwell Canyon, Spillway, Lime Saddle, and Thermalito Forebay. Lake Oroville has two full-service marinas, five car-top boat launch ramps, ten floating campsites, and seven two-stalled floating toilets.There are also recreation facilities at the Lake Oroville Visitors Center, Thermalito Afterbay, and the OWA.
The OWA comprises approximately 11,000 acres west of city of Oroville that is managed for wildlife habitat and related recreational activities. It includes the Thermalito Afterbay and surrounding lands (approximately 6,000 acres), along with 5,000 acres adjoining the Feather River. This 5,000-acre area is adjacent to or straddles 12 miles of the Feather River, and includes willow and cottonwood-lined ponds, islands, and channels. Recreation areas include dispersed recreation (hunting, fishing, and bird watching), plus recreation at developed sites, including Monument Hill Day Use Area (DUA), model airplane area, a primitive camping area, and three boat launches on the Afterbay and two on the river. California Department of Fish and Game’s (DFG) habitat enhancement program includes a wood duck nest-box program and dry land farming for nesting cover and improved wildlife forage. Limited gravel extraction also occurs in a few locations.
1.4 CURRENT OPERATIONAL CONSTRAINTS
Operation of the Oroville Facilities varies seasonally, weekly, and hourly, depending on hydrology and the objectives that DWR is trying to meet. Typically, releases to the Feather River are managed to conserve water while meeting a variety of water delivery requirements, including flow, temperature, fisheries, diversion, and water quality. Lake Oroville stores winter and spring runoff for release to the Feather River as necessary for Project purposes. Meeting the water supply objectives of the SWP has always been the primary consideration for determining Oroville Facilities operation (within the regulatory constraints specified for flood control, instream fisheries, and downstream uses). Power production is scheduled within the boundaries specified by the water operations criteria noted above. Annual operations planning is conducted for multi-year carryover storage.The current methodology is to retain half of the Lake Oroville storage above a specific level for subsequent years. Currently, that level has been established at 1,000,000 acre-feet (af); however, this does not limit drawdown of the reservoir below that level. If hydrology is drier or requirements greater than expected, additional water could be released from Lake Oroville. The operations plan is updated regularly to reflect forecast changes in hydrology and downstream operations. Typically, Lake Oroville is filled near its maximum operating level of 900 feet above msl in June and then lowered as necessary to meet downstream requirements, to a minimum level in December or

Final Recreation Carrying Capacity (R-8) Oroville Facilities P-2100 Relicensing
Proposed Final Report – For Distribution to Collaborative
Oroville Facilities Relicensing Team 1-8 June 2004
January (occasionally below 700 feet msl). During drier years, the reservoir may be drawn down more and may not fill to desired levels the following spring. Project operations are directly constrained by downstream operational demands and flood management criteria, as described below.
1.4.1 Downstream Operation
An August 1983 agreement between DWR and DFG, entitled “Agreement Concerning the Operation of the Oroville Division of the State Water Project for Management of Fish & Wildlife,” sets criteria and objectives for flow and temperatures in the low-flow channel and the reach of the Feather River between Thermalito Afterbay and Verona. This agreement: (1) establishes minimum flows between Thermalito Afterbay outlet and Verona, which vary by water year type; (2) requires flow changes under 2,500 cfs to be reduced by no more than 200 cfs during any 24-hour period (except for flood management, failures, etc.); (3) requires flow stability during the peak of the fall-run Chinook salmon spawning season; and (4) sets an objective of suitable temperature conditions during the fall months for salmon and during the later spring/summer for shad and striped bass.
1.4.1.1 Instream Flow Requirements
The Oroville Facilities are operated to meet minimum flows in the lower Feather River as established by the aforementioned 1983 agreement. The agreement specifies that the Oroville Facilities release a minimum of 600 cfs into the Feather River from the Thermalito Diversion Dam for fisheries purposes. This is the total volume of normal flow from the Diversion Dam outlet, Diversion Dam powerplant, and the Feather River Fish Hatchery pipeline.
Generally, the instream flow requirements below Thermalito Afterbay are 1,700 cfs from October through March, and 1,000 cfs from April through September. However, if runoff for the previous April through July period is less than 1,942,000 af (i.e., the 1911-1960 mean unimpaired runoff near Oroville), the minimum flow can be reduced to 1,200 cfs from October to February, and 1,000 cfs for March. A maximum flow of 2,500 cfs is not exceeded from October 15 through November 30 to prevent spawning in overbank areas that might become dewatered.
1.4.1.2 Temperature Requirements
The Diversion Pool provides the water supply for the Feather River Fish Hatchery. The
hatchery temperature objectives are 52 F for September, 51 F for October and
November, 55 F for December through March, 51 F for April through May 15, 55 F for
last half of May, 56 F for June 1-15, 60 F for June 16 through August 15, and 58 F for
August 16-31. In April through November, a temperature range of plus or minus 4 F is allowed for objectives.

Final Recreation Carrying Capacity (R-8) Oroville Facilities P-2100 Relicensing
Proposed Final Report – For Distribution to Collaborative
Oroville Facilities Relicensing Team 1-9 June 2004
There are several temperature objectives for the Feather River downstream of the Afterbay outlet. During the fall months, after September 15, the temperatures must be suitable for fall-run Chinook salmon. From May through August, the temperatures must be suitable for shad, striped bass, and other fish.
The National Oceanic and Atmospheric Administration National Marine Fisheries Service (NOAA Fisheries) has also established an explicit criterion for steelhead trout and spring-run Chinook salmon, included in a biological opinion on the effects of the Central Valley Project and SWP on Central Valley spring-run Chinook and steelhead.As a reasonable and prudent measure, DWR attempts to control water temperature at Feather River Mile (RM) 61.6 (Robinson’s Riffle in the low-flow channel) from June 1 through September 30. This measure attempts to maintain water temperatures less
than or equal to 65 F on a daily average. The requirement is not intended to preclude pump-back operations at the Oroville Facilities needed to assist the State of California with supplying energy during periods when the California Independent System Operator (ISO) anticipates a Stage 2 or higher alert.
The hatchery and river water temperature objectives sometimes conflict with temperatures desired by agricultural diverters. Under existing agreements, DWR provides water for the Feather River Service Area (FRSA) contractors. The contractors claim a need for warmer water during spring and summer for rice germination and
growth (i.e., minimum 65 F from approximately April through mid-May, and minimum
59 F during the remainder of the growing season), though there is no explicit obligation for DWR to meet the rice water temperature goals. However, to the extent practical, DWR does use its operational flexibility to accommodate the FRSA contractors’ temperature goals.
1.4.1.3 Water Diversions
Monthly irrigation diversions of up to 190,000 af (e.g., in July 2002) are made from the Thermalito Complex during the May through August irrigation season. Total annual entitlement of the Butte and Sutter County agricultural users is approximately 1 maf. After meeting these local demands, flows into the lower Feather River (and outside of the FERC Project boundary) continue into the Sacramento River and into the Sacramento-San Joaquin Delta. In the northwestern portion of the Delta, water is pumped into the North Bay Aqueduct. In the south Delta, water is diverted into Clifton Court Forebay and stored until it is pumped into the California Aqueduct.

Final Recreation Carrying Capacity (R-8) Oroville Facilities P-2100 Relicensing
Proposed Final Report – For Distribution to Collaborative
Oroville Facilities Relicensing Team 1-10 June 2004
1.4.1.4 Water Quality
Flows through the Delta are maintained to meet Bay-Delta water quality standards arising from DWR’s water rights permits. These standards are designed to meet several water quality objectives such as salinity, Delta outflow, river flows, and export limits. The purpose of these objectives is to attain the highest reasonable water quality, considering all demands being made on the Bay-Delta waters. In particular, they protect a wide range of fish and wildlife including Chinook salmon, Delta smelt, striped bass, and the habitat of estuarine-dependent species.
1.4.2 Flood Management
The Oroville Facilities are an integral component of the flood management system for the Sacramento Valley. During the winter, the Oroville Facilities are operated under flood control requirements specified by the U.S. Army Corps of Engineers (USACE).Under these requirements, Lake Oroville is operated to maintain up to 750,000 af of storage space to allow for the capture of significant inflows. Flood control releases are based on the release schedule in the flood control diagram or the emergency spillway release diagram prepared by the USACE, whichever requires the greater release.Decisions regarding such releases are made in consultation with the USACE. The flood control requirements are an example of multiple use of reservoir space.When flood management space is not required to accomplish flood management objectives, the reservoir space can be used for storing water. From October through March, the maximum allowable storage limit (point at which specific flood release would have to be made) varies from about 2.8 to 3.2 maf to ensure adequate space in Lake Oroville to handle flood flows. The actual encroachment demarcation is based on a wetness index, computed from accumulated basin precipitation. This allows higher levels in the reservoir when the prevailing hydrology is dry. When the wetness index is high in the basin (i.e., high potential runoff from the watershed above Lake Oroville), required flood management space is at its greatest to provide the necessary flood protection. From April through June, the maximum allowable storage limit is increased as the flooding potential decreases, which allows capture of the higher spring flows for use later in the year. During September, the maximum allowable storage decreases again to prepare for the next flood season. During flood events, actual storage may encroach into the flood reservation zone to prevent or minimize downstream flooding along the Feather River.

Final Recreation Carrying Capacity (R-8) Oroville Facilities P-2100 Relicensing
Proposed Final Report – For Distribution to Collaborative
Oroville Facilities Relicensing Team 2-1 June 2004
2.0 NEED FOR STUDY
FERC regulations require a comprehensive recreation plan; this study is being conducted in support of this plan development. Relicensing Study R-8 – RecreationCarrying Capacity helps address “Issue Statement R1—adequacy of existing Project recreation facilities, opportunities, and access to accommodate current use and future demand.” This study investigates the existing capacity of recreation resources within the study area by analyzing four types of capacity including ecological, spatial, facility, and social.

Final Recreation Carrying Capacity (R-8) Oroville Facilities P-2100 Relicensing
Proposed Final Report – For Distribution to Collaborative
Oroville Facilities Relicensing Team 2-2 June 2004
This page intentionally left blank.

Final Recreation Carrying Capacity (R-8) Oroville Facilities P-2100 Relicensing
Proposed Final Report – For Distribution to Collaborative
Oroville Facilities Relicensing Team 3-1 June 2003
3.0 STUDY OBJECTIVE(S)
The objectives of this study is to determine a sustainable level of recreational facility development and use which will provide high quality recreational opportunities to the project’s primary recreational groups, protect the study area’s sensitive and natural resources, and be consistent with the planned operation of the project. This study assesses what level of public recreational use is sustainable, compatible, and within the overall capacity of the land-based study area throughout the anticipated term of the new license. Existing surface water boating carrying capacity is addressed in Relicensing Study R-7 – Reservoir Boating.

Final Recreation Carrying Capacity (R-8) Oroville Facilities P-2100 Relicensing
Proposed Final Report – For Distribution to Collaborative
Oroville Facilities Relicensing Team 3-2 June 2003
This page intentionally left blank.

Final Recreation Carrying Capacity (R-8) Oroville Facilities P-2100 Relicensing
Proposed Final Report – For Distribution to Collaborative
Oroville Facilities Relicensing Team 4-1 June 2004
4.0 METHODOLOGY
The primary purpose of the Recreation Carrying Capacity study is to investigate the existing and future capacity of recreation resources in the study area (surface water and boating capacity were researched separately in Relicensing Study R-7 – ReservoirBoating). The concept of recreation carrying capacity was originally developed out of biological models that attempted to determine the capability of a given environment (e.g., range, pasture) to sustain a specific number of animals over time. As such, undue attention has been placed on developing a specific number of visitors that represents the ideal carrying capacity of a recreation facility. In actuality, many management issues regarding recreation carrying capacity decision-making are not necessarily density dependent; rather, recreation carrying capacity issues are also related to the ecological, social, and managerial aspects of recreational opportunities (McCool 1996). Visitor use should thus be evaluated “in relationship to its potential effect on natural, cultural, aesthetic, and recreation resources, as well as overall visitor experience” (DPR 2002).
Recreation “carrying capacity” has been defined in a number of ways, but a useful definition is “the level of use beyond which impacts exceed standards” (Shelby and Heberlein 1986). Indicators and standards of quality are integral components of determining the recreation carrying capacity of an area. Indicators are defined as, “measurable, manageable variables that help define the quality of the visitor experience; standards of quality are defined as, “the minimum acceptable condition of indicator variables” (Manning et al. 2001).
Capacities expressed in absolute numbers of users or vehicles are unlikely results of this study. While quantitative data collection is a vital component of the capacity decision-making process, of equal importance is qualitative professional judgment (e.g., prior experience, management context and priorities, public values, judicial rulings, park legislation, tradition, history, etc.). As such, capacities discussed in this report are generally expressed in qualitative terms, such as “below”, “approaching”, “at”, or “exceeding capacity.”
This analysis focuses on the capacity of developed recreation facilities in the study area because they tend to receive the greatest amount of visitation and are subject to increased visitor impacts (e.g., crowding issues, ecological degradation, visitor displacement, etc.). The analysis provides an understanding of recreation facilities, existing use patterns, perceived crowding, facility capacity, and user impacts and conflicts in the study area. In general, no new data were collected as part of this analysis. Instead, existing data from other relicensing studies were used to determine recreation capacity-related conclusions in this study.
There is a large body of research on crowding and resource deterioration in recreation settings, including a recent summary on the state of art regarding carrying capacity

Final Recreation Carrying Capacity (R-8) Oroville Facilities P-2100 Relicensing
Proposed Final Report – For Distribution to Collaborative
Oroville Facilities Relicensing Team 4-2 June 2004
decisions (Haas 2002). In such research, four types of carrying capacities are typically delineated (Shelby and Heberlein 1986):
Ecological Capacity – Concerned with the impacts of recreation on the ecosystem, such as the percent of impacted ground cover and the amount of observed soil compaction and soil erosion;
Spatial Capacity – Concerned with the impact of available space on recreation, such as number of visitors in a given area, or the availability of adjacent areas for site expansion;
Facility Capacity – Concerned with facility impacts, such as number of people, groups, or vehicles per boat ramp, restroom, parking lot or campground, percent occupancy for various facilities, waiting time to use facilities, and the number of campground refusals; and
Social Capacity – Concerned with visitors’ perceptions of surrounding recreational use.Considers factors such as perceived crowding, number of encounters with groups of a particular size or type, and other conflicts.
Each of these four capacity types or indicators was investigated for each developed recreation facility and facility type (e.g., campground, day use area, boat ramp, etc), as well as the study area as a whole. It should be noted, however, that because of study plan data collection protocols, not all capacity indicator variables were investigated at all of the developed recreation facilities in the study area. Additionally, a few capacity indicator variables were not specifically investigated at some developed recreation facilities because they are impractical or unfeasible for capacity-related decision-making (e.g., ecological impacts at floating restrooms, people-at-one-time [PAOT] and/or vehicle-at-one-time [VAOT] counts at campgrounds, percent occupancy at trails, etc.).Also, on-water boating capacity and the capacity of related sites (e.g., boat ramps, boat-in-campgrounds, etc.) were explored in Relicensing Study R-7 – Reservoir Boating.
Quantitative and qualitative data were used to identify ecological, spatial, facility, and social capacity impacts and management parameters at each facility. One or more capacity types were identified as the primary limiting factor(s) at each recreation site based on the level of concern for each individual capacity type. A limiting factor is defined as an indicator that constrains the level of recreational use (capacity) at a site or area. The limiting factor often drives future decision-making regarding management priorities and monitoring programs and is often the “trigger” that determines when recreation use has reached a specific level (below, approaching, at, or exceeding) of capacity.
It should be noted that the concept and practical application of establishing recreation carrying capacity is a work in progress and continues to be researched extensively

Final Recreation Carrying Capacity (R-8) Oroville Facilities P-2100 Relicensing
Proposed Final Report – For Distribution to Collaborative
Oroville Facilities Relicensing Team 4-3 June 2004
(Haas 2001). Recreation carrying capacity frameworks have been researched and applied in a variety of settings and several are commonly used as recreation management tools, though none are universally accepted. These frameworks include the Limits of Acceptable Change (Stankey et al. 1985), Visitor Impact Management (Graefe et al. 1990), and Visitor Experience and Resource Protection (National Park Service 1997), among others. Each of these frameworks share three important elements: (1) indicator variables and standards of quality are used to specifically define the types of recreation opportunities to be provided, (2) indicator variables are monitored to determine whether standards of quality are being met, and (3) management actions are initiated if/when standards of quality are violated (Manning 1999).
The establishment of capacity triggers or thresholds (i.e., standards of quality) in order to alert outdoor recreation managers that “actions may be necessary to sustain the area’s resources, visitor experiences, and management effectiveness,” is inherent in developing the recreation carrying capacity of an area (Haas 2001). Four commonly researched indicator variables (i.e., capacity types) were investigated during this study. Standards of quality, which “define the minimum acceptable condition” of each capacity type, were also used to determine whether a site was below, approaching, at, or exceeding one or more of the capacity types, as well as overall study area capacity (Manning 1999). Commonly-used qualitative and quantitative standards from existing management plans and other similar recreation carrying capacity studies were employed in this study (standards of quality should be built into a management plan to ensure consistent carrying capacity monitoring and decision-making over time). These standards of quality were also tailored to the study area based on issues unique to Lake Oroville and its surroundings. Triggers/thresholds should not be confused with visitor limits or site closures; rather, indicator variables (capacity types) and standards of quality (triggers) are a management tool that can be used to prescribe a range of potential responses.
4.1 RECREATION CARRYING CAPACITY
Each of the four capacity indicator variables that were researched during this relicensing study are described below.
4.1.1 Ecological Capacity
Visitor impacts at developed and dispersed recreation sites were assessed during Relicensing Study R-11 – Recreation and Public Use Impact Assessment. Results from the assessment were used to characterize the ecological capacity of each developed and dispersed recreation site in the study area. Developed recreation sites generally have “hardened” facilities (e.g., paved roads and parking areas, designated picnic sites, trash receptacles, restrooms, etc.) that tend to limit potential ecological impacts to a

Final Recreation Carrying Capacity (R-8) Oroville Facilities P-2100 Relicensing
Proposed Final Report – For Distribution to Collaborative
Oroville Facilities Relicensing Team 4-4 June 2004
site. At dispersed recreation sites, however, ecological impacts can be more pronounced due to the lack of hardened facilities.
4.1.1.1 Ecological Variables
To assess visitor impacts on the natural setting of the study area, the following variables (Hammitt and Cole 1998) were investigated at each of the developed recreation sites, as well as at all identified dispersed recreation areas, during Relicensing Study R-11—Recreation and Public Use Impact Assessment.
Soil Compaction
Soil compaction causes an increase in soil density (the amount of soil particles remains the same, but soil volume decreases as pore space within the soil diminishes) that often decreases its ability to absorb water. Soil compaction is often caused by heavy trampling or by vehicular use. Compaction and soil erosion (another variable) can expose tree roots (compaction and erosion cause a reduction in the depth of the soil profile, which can expose tree roots). Site recovery from soil compaction can occur in the off season as frost, rain, or non-use may allow for soil density to decrease (soil volume increases as pore space within the soil is restored). A certain level of soil compaction is inevitable at recreation sites, but it is worth monitoring sites to make sure that compacted areas do not become too large. Soil compaction can often lead to erosion and plant loss (by hindering soil water absorption, preventing plant root elongation, and inhibiting seed germination).
Soil Erosion
Soil erosion is the loss of soil often caused by the lack of stabilizing organic material. Erosion is most often caused by wind or water; however, recreational activities may increase erosion by removing vegetation that stabilizes the soil. Soil erosion is important to note since eroded soil will not “recover” during the low use season. Ideally, vegetation will grow in the off season in order to stabilize zones affected by erosion. Some erosion at developed sites is inevitable as water runs off of hardened surfaces (such as paved roads), though water erosion can also occur without running off a hardened surface. The most serious concerns regarding erosion are the formation of gullies that may spread and cause an area to lose valuable topsoil and the undermining of hardened surfaces that can destabilize and lead to the deterioration of these surfaces. Although developed recreation sites are generally hardened, some areas of bare ground and erosion are found near picnic tables, fire rings, and user-defined trails.
Trash Accumulation
Trash accumulation can have both visual and environmental impacts. It can impact visitor experience at recreation sites if trash becomes unsightly. Additionally, trash can

Final Recreation Carrying Capacity (R-8) Oroville Facilities P-2100 Relicensing
Proposed Final Report – For Distribution to Collaborative
Oroville Facilities Relicensing Team 4-5 June 2004
impact wildlife and/or water quality if it is near the shoreline. The presence of litter at recreation sites may result from a lack of trash receptacles, an inadequate maintenance program, a lack of visitor education, or simply from visitors discarding trash on the ground without using provided trash receptacles.
Vegetation Damage
Damage to trees and vegetation can be common at recreation sites. Examples of vegetation damage include exposed roots, broken branches and limbs, and graffiti (i.e., carvings in tree bark). Recovery of trees and shrubs may take several years; therefore, recovery in the off-season may not be possible. Some impact at developed sites is acceptable, yet measures such as mulching around the roots and educating visitors about impacts can be effective at reducing impacts to trees.
Lack of Sanitation
Sanitation problems at recreation sites most frequently are related to the proper disposal of human waste, or lack thereof. Although toilets are often provided at developed recreation sites, visitors may occasionally choose their own site when these facilities are closed, not properly maintained, or are too far away. In addition to signaling potential high use levels, sanitation problems can also become a health problem to visitors and water quality.
Lack of Downed Wood
Wood collection for firewood can deplete an area of valuable downed wood, which may provide wildlife habitat as well as nutrients for soil as it breaks down. Pieces of wood greater than 3 inches in diameter can provide the greatest benefit. Conversely, a lot of downed wood in the vicinity of recreation sites can be a fire hazard.
Creation of User-Defined Trails
Visitors often create user-defined trails at recreation sites to connect existing elements or to access adjacent areas. User-defined trails are often created by visitors at dispersed undeveloped recreation sites to access a river or reservoir shoreline, or to access other use areas adjacent to the site. The number and condition of user-defined trails may indicate that trails should be hardened or defined. Vegetation loss and erosion may result from the creation of informal, user-defined side trails. In general, user-defined trails are an acceptable impact at recreation sites if their impact is minimal.

Final Recreation Carrying Capacity (R-8) Oroville Facilities P-2100 Relicensing
Proposed Final Report – For Distribution to Collaborative
Oroville Facilities Relicensing Team 4-6 June 2004
Shoreline and Water Quality
Shoreline and water quality impacts include erosion near the water, trash in the water and along the shore, and an oily sheen caused by motor boating. These impacts may reduce water quality.
OHV Use Impacts (Evaluated at Dispersed Sites Only)
Off-highway vehicle (OHV) impacts include compacted soil, erosion, and damaged vegetation. It is important to track areas that receive OHV use as these areas may receive significant impacts. OHV impacts are of special concern near the shoreline and wetland areas.
Proximity of Use to Riparian Zones
Due to the sensitive ecological components of riparian vegetation, documenting site use in proximity to riparian areas is important. Similar to the presence of wetlands, the presence of a riparian area was based on GIS data as well as field observations of riparian vegetation indicator species.
Proximity of Use to Wetlands
Documenting sites that are in proximity to seasonal or permanent wetlands is important due to their sensitive ecological components. The presence of a wetland was based on GIS data and field observations of the occurrence of wetland vegetation indicator species at the sites. All field-based judgments regarding proximity to wetlands were compared with wetland vegetation maps for verification. Impacts to wetlands include trampling, which may damage vegetation and organic layers.
4.1.1.2 Ecological Capacity Field Observations
A winter observation (February 2003) and a summer observation (July 2003) were made regarding ecological field conditions at developed and dispersed recreation sites in the study area. The two field visits evaluated the potential for recovery at a site when recreation use is limited (i.e., lower than during the peak summer recreation season).This schedule also allowed the sites to be observed at different pool levels. The pool level at Lake Oroville during the winter observation was just over 800 feet above msl, while the summer observation occurred when the reservoir was within 15 feet of full pool (900 feet above msl).
During the field observations, impact assessment forms (Appendix A of Relicensing Study R-11) were filled out at each developed and dispersed recreation site. All sites were also photographed, with particular attention given to capturing visitor impacts

Final Recreation Carrying Capacity (R-8) Oroville Facilities P-2100 Relicensing
Proposed Final Report – For Distribution to Collaborative
Oroville Facilities Relicensing Team 4-7 June 2004
(Appendix B of Relicensing Study R-11). Where needed, wetland and riparian field estimations were confirmed using existing GIS wetland/riparian area data layers.
The full suite of ecological indicator variables was considered in determining the ecological capacity of a site. Based on level-of-impact assessments for each ecological variable, an overall level of impact was determined for each developed and dispersed site in the study area. The observed level of impact and corresponding overall capacity level on a site-by-site basis are described in Table 4.1-1.
Table 4.1-1. Level of impact and corresponding overallecological capacity level for study area developed and
dispersed recreation sites. Capacity Level Observed Level of Impact
Below Low or No Concern
Approaching Moderate Concern
At High Concern
Exceeding Extreme Concern
Source: EDAW 2004.
4.1.2 Spatial Capacity
For spatial capacity, site expansion potential and use/facility density at each developed recreation site was investigated. Site expansion potential was determined by comparing existing maps (topography and ownership) of the study area and the results of Relicensing Study R-15 – Recreation Suitability with observations from field visits.Use/facility density, defined as the ability of a site to absorb additional use and facilities, was determined by evaluating the at-one-time counts (as reported in Relicensing Study R-9 – Existing Recreation Use) in conjunction with the number of existing site facilities (e.g., parking spaces, picnic tables, campsites). Current recreation research (McCool 1996) has moved away from providing visitor density estimates (e.g., people per acre) to judge spatial capacity because, in general, recreation “management problems are not density dependent” (i.e., management problems are generally not dependent on people [or vehicle, watercraft, etc.] per acre estimates and instead are more dependent on ecological and social features). Nonetheless, PAOT and VAOT (when available) are reported to provide context.
Per Relicensing Study R-9 – Existing Recreation Use methodology, PAOT and VAOT were not investigated at campgrounds, boat-in campgrounds, or several boat ramps and day use areas in the study area. PAOT was calculated only at those sites that provide day-use opportunities and where an accurate number of people at the site could be counted; access points or places of dispersal use were not included. VAOT was calculated only at those sites that are directly accessible by vehicle and provide parking facilities; the Lake Oroville Visitors Center and dispersed sites were not included (DWR 2004b). Sites where either PAOT or VAOT were not collected include the following:
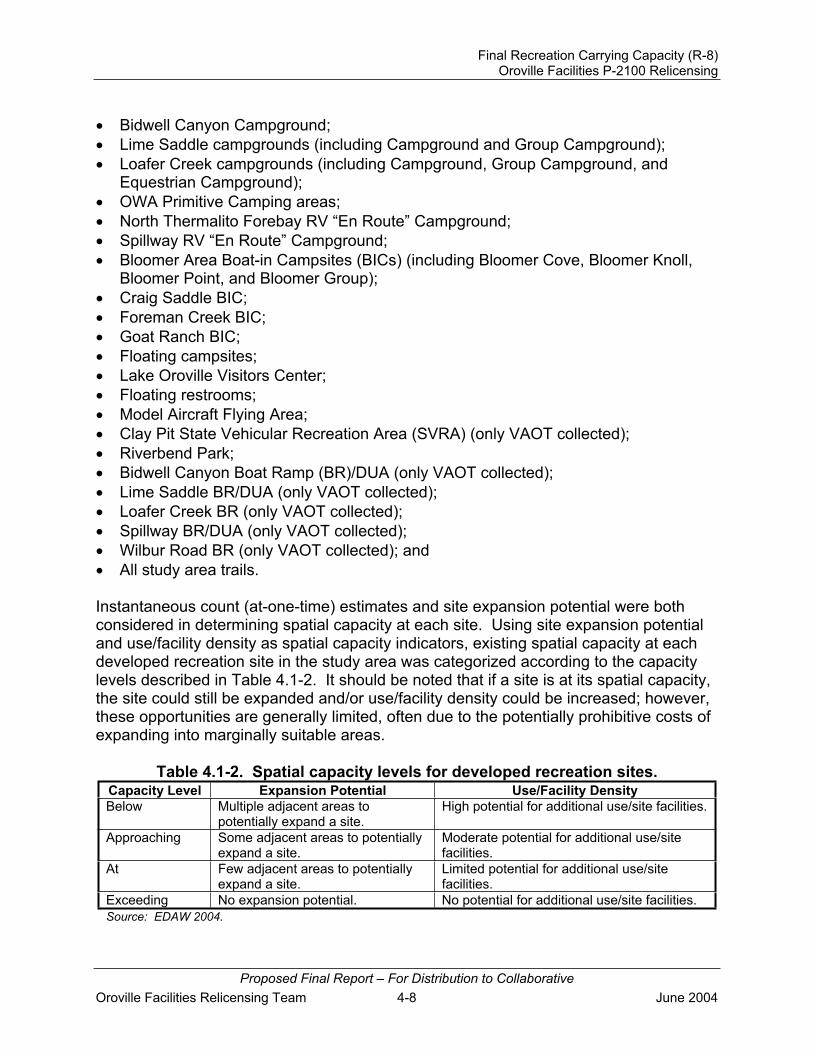
Final Recreation Carrying Capacity (R-8) Oroville Facilities P-2100 Relicensing
Proposed Final Report – For Distribution to Collaborative
Oroville Facilities Relicensing Team 4-8 June 2004
Bidwell Canyon Campground;
Lime Saddle campgrounds (including Campground and Group Campground);
Loafer Creek campgrounds (including Campground, Group Campground, and Equestrian Campground);
OWA Primitive Camping areas;
North Thermalito Forebay RV “En Route” Campground;
Spillway RV “En Route” Campground;
Bloomer Area Boat-in Campsites (BICs) (including Bloomer Cove, Bloomer Knoll, Bloomer Point, and Bloomer Group);
Craig Saddle BIC;
Foreman Creek BIC;
Goat Ranch BIC;
Floating campsites;
Lake Oroville Visitors Center;
Floating restrooms;
Model Aircraft Flying Area;
Clay Pit State Vehicular Recreation Area (SVRA) (only VAOT collected);
Riverbend Park;
Bidwell Canyon Boat Ramp (BR)/DUA (only VAOT collected);
Lime Saddle BR/DUA (only VAOT collected);
Loafer Creek BR (only VAOT collected);
Spillway BR/DUA (only VAOT collected);
Wilbur Road BR (only VAOT collected); and
All study area trails.
Instantaneous count (at-one-time) estimates and site expansion potential were both considered in determining spatial capacity at each site. Using site expansion potential and use/facility density as spatial capacity indicators, existing spatial capacity at each developed recreation site in the study area was categorized according to the capacity levels described in Table 4.1-2. It should be noted that if a site is at its spatial capacity, the site could still be expanded and/or use/facility density could be increased; however, these opportunities are generally limited, often due to the potentially prohibitive costs of expanding into marginally suitable areas.
Table 4.1-2. Spatial capacity levels for developed recreation sites. Capacity Level Expansion Potential Use/Facility Density
Below Multiple adjacent areas to potentially expand a site.
High potential for additional use/site facilities.
Approaching Some adjacent areas to potentially expand a site.
Moderate potential for additional use/site facilities.
At Few adjacent areas to potentially expand a site.
Limited potential for additional use/site facilities.
Exceeding No expansion potential. No potential for additional use/site facilities.
Source: EDAW 2004.
Final Recreation Carrying Capacity (R-8) Oroville Facilities P-2100 Relicensing
Proposed Final Report – For Distribution to Collaborative
Oroville Facilities Relicensing Team 4-9 June 2004
Additionally, Relicensing Study R-15 – Recreation Suitability Analysis involved a GIS-based investigation of opportunities and constraints to potential recreation development in the study area; however, due to the GIS pixel size and macro-scale of some of the GIS data layers used in the analysis, recreation development suitability results are less successful at locating linear lines, such as potential trail corridors, than larger polygons, such as potential campgrounds or day use areas. While preliminary trail siting can be performed through similar GIS analyses, Relicensing Study R-15 focused more on identifying larger polygons that could potentially accommodate larger developed recreation facilities than on areas that could potentially accommodate additional miles of trails. As such, Relicensing Study R-15 was generally not used to help determine the spatial capacity of trails and trailheads in the study area.
4.1.3 Facility Capacity
The primary indicator of facility capacity is percent occupancy. In general, percent occupancy is defined as the average percentage of occupied facilities (e.g., parking spaces, campsites, picnic tables, etc.) at a developed recreation site. Percent capacity at developed recreation sites in the study area was determined as a component of Relicensing Study R-9 – Existing Recreation Use. As with spatial capacity, current recreation research has moved away from providing visitor density estimates (e.g., people per acre, percent occupancy, etc.) to judge facility capacity because recreation “management problems are not density dependent” and many recreation “management problems that relate to the number of people using an area tend to be those that have relatively simple technological solutions” (McCool 1996). Additionally, sewer and water infrastructure generally have cost-based limitations and should be coordinated with DPR during the LOSRA General Plan update process. Nonetheless, when available, percent occupancy for developed recreation facilities are reported to provide context.
Basing developed recreation site utilization on the theoretical maximum occupancy of a site (i.e., 100 percent occupancy), while important for considering the maximum possible use the site could potentially accommodate during the recreation season (May 15 through September 15), is less useful as a day-to-day management indicator. In order to plan potential expansion or take other non-construction management actions to avoid impacts related to crowding and facility overuse, actions are typically necessary long before recreation site percent occupancy reaches 100 percent. For purposes of this analysis and future monitoring, two distinct percent-occupancy thresholds (i.e., indicators) were considered in term of categorizing existing and future use of developed recreation sites in the study area. A 60 percent occupancy level was used as an indicator that a developed site was at its recreation season weekday capacity and an 80 percent level was used as an indicator that a developed site was at its recreation season weekend and holiday occupancy capacity. Using these percent occupancy levels as indicators, existing percent occupancy at each developed recreation site in the study area was categorized according to the capacity levels described in Table 4.1-3.

Final Recreation Carrying Capacity (R-8) Oroville Facilities P-2100 Relicensing
Proposed Final Report – For Distribution to Collaborative
Oroville Facilities Relicensing Team 4-10 June 2004
Table 4.1-3. Facility capacity levels for developed recreation sites in the study area.
Capacity Level Recreation Season Weekday
Percent Occupancy Recreation Season Weekend and
Holiday Percent Occupancy
Below <40% <60%
Approaching 40 to 59% 60 to 79%
At 60% 80%
Exceeding >60% >80%
Source: EDAW 2004.
It should be noted that percent occupancy related management actions should not be based only on one year’s worth of count data. Professional judgment, anecdotal observations, multi-year trend data, and the other capacity types (ecological, spatial, and social) should also be considered before capacity-related management actions are taken. This additional information helps to account for other influences (e.g., poor weather, drought conditions, wildfires, economic recession, etc.) that may affect recreation use levels in the study area.
4.1.4 Social Capacity
Social capacity is widely studied in recreational settings and is generally concerned with visitors’ perceptions of crowding, and user conflicts. Relicensing Study R-13 – Recreation Surveys was used to collect general information regarding visitors to the study area, to address social capacity at study area recreation sites, and to gather public input on recommendations for management actions.
Several questions related to social capacity were included in the recreation surveys. At the site level, the primary social capacity question was about perceived crowding at developed recreation sites in the study area. Visitors were asked to rate how crowded they felt at the recreation site where they were surveyed using the following 9-point scale (Shelby and Heberlein 1986):
1----------2--------------3--------------4--------------5--------------6--------------7--------------8--------------9 Not at all
Crowded Slightly
Crowded Moderately
Crowded Extremely
Crowded
Results from this question were used to develop perceived crowding scores for each developed recreation site both annually and during the recreation season. In general, the social capacity level of a developed recreation site was based primarily on the recreation season crowding score, as it tends to be when most recreation sites receive the highest amount of use. Using perceived crowding scores as an indicator, each developed recreation site in the study area was categorized according to the capacity levels described in Table 4.1-4. At the site-type and study area wide levels, other social capacity indicator variables, such as perceived and/or actual conflict, were also considered.

Final Recreation Carrying Capacity (R-8) Oroville Facilities P-2100 Relicensing
Proposed Final Report – For Distribution to Collaborative
Oroville Facilities Relicensing Team 4-11 June 2004
Table 4.1-4. Social capacity levels for developed recreation sites.
Overall Capacity Level Perceived
Crowding Score
Below <3.0
Approaching 3.1 to 4.5
At 4.6 to 6.0
Exceeding >6.0
Source: EDAW 2004.
It should be noted that while social capacity is frequently studied in outdoor recreation research, a definitive perceived crowding scale (i.e., a standard measurement, methodology, and point at which a site is considered to have exceeded its social capacity) has yet to be commonly accepted. Social capacity is a complex issue that is influenced by multiple factors including recreation setting (developed versus dispersed), demographics, and activity-type, among others. Additionally, empirical studies (Manning 1999) have shown that a typical inverse relationship does not always exist between perceived crowding and satisfaction with a recreation experience (i.e., as perceived crowding increases, satisfaction decreases). It is nonetheless important to develop a social capacity standard on a site-by-site basis based on specific conditions at each site (i.e., perceived crowding standard may likely be higher for a developed recreation site compared to a wilderness area).
4.2 OVERALL SITE CAPACITY AND PRIORITY SYNTHESIS
After evaluating the capacity level for each indicator variable (ecological, spatial, facility, and social capacities), an overall capacity conclusion was determined for each developed recreation facility and for the study area as a whole. In order to determine the overall capacity of a developed recreation facility, the four capacity types were considered in aggregate. No attempt was made to prioritize one capacity type over another; rather, all capacity types were considered equally. Field observations, available recreation use data, and input from site managers and agency personnel was also reviewed. Generally, if at least one capacity type was characterized as being at or exceeding capacity, then the facility was considered to be at least approaching its overall capacity.
Estimating the overall recreational capacity of a developed recreation facility or reservoir relies on quantitative data, but can also be subjective. In this analysis, because capacity indicator variables were not prioritized, site-specific conditions, study results, past experience with similar reservoirs, and professional judgment, were also used to help characterize the overall capacity of each developed recreation facility and the study area. This methodology is considered reasonable since this characterization involved a synthesis of both detailed site information and subjective knowledge to draw overall capacity conclusions.

Final Recreation Carrying Capacity (R-8) Oroville Facilities P-2100 Relicensing
Proposed Final Report – For Distribution to Collaborative
Oroville Facilities Relicensing Team 4-12 June 2004
Using the overall capacity level as an indicator, each developed recreation facility and the study area as a whole was categorized according to the overall capacity priorities described in Table 4.2-1. The overall capacity priority level of a developed recreation facility is provided to guide future management decisions. When determining the overall study area capacity priority level, consideration was given not only to the capacity of developed recreation facilities in aggregate, but also to dispersed recreation use sites, potential areas of development (or lack thereof), population and recreation activity trends in the region, input from site managers and agency personnel, and professional judgment.
Table 4.2-1. Overall capacity priority levels for developed recreation facilities at
Lake Oroville Facilities.
Overall Capacity Level Overall Capacity Priority
Below Low
Approaching Moderate
At or Exceeding High
Source: EDAW 2004.

Draft Recreation Carrying Capacity (R-8) Oroville Facilities P-2100 Relicensing
Proposed Final Report– For Distribution to Collaborative
Oroville Facilities Relicensing Team 5-1 June 2004
5.0 STUDY RESULTS
Recreation carrying capacity at outdoor recreation sites and use areas is generally associated with determining the level of use a given site or area can accommodate and then comparing the use level to established standards. However, capacity is a complex issue and often requires more than an estimate of how many people can use a given site at any time. Capacity is also dependent on the type and severity of ecological impacts, available space or facilities for recreation, and the social perceptions of visitors to the site, among other variables. In order to account for the complexity of capacity at recreation sites, four types of capacity were investigated at each recreation site in the study area: ecological, spatial, facility, and social. An overall estimate of site capacity was determined based on identifying limiting factors to each type of capacity.
For each site-type, a summary table is provided describing the existing capacity level of each developed recreation site, as well as the overall site capacity priority. Additionally, substitute sites (if any) are listed for each recreation site. A substitute site is a developed recreation site that offers similar recreation opportunities and settings as another site in a specific area. Spatial and temporal substitutability (e.g., visiting a recreation site during non-peak hours and/or days) is a popular coping mechanism that some visitors may use to avoid crowding and/or degraded resource settings (Manning 1999). Understanding which recreation sites may act as substitute sites is also important in determining which sites may be able to absorb additional use, as well as in directing (through information and education) visitors to appropriate sites for their activities and preferences.
Capacity in this section is discussed broadly for the entire study area, followed by a more detailed discussion organized by site type (e.g., campground, boat ramp, day use area, etc.), as well as site-by-site. Overall study area capacity results are discussed in Section 6.0.
5.1 OVERALL STUDY AREA CAPACITY SUMMARY
The overall capacity of recreation sites and facilities in the study area is summarized in Table 5.1-1 by type of site. Section 5.2 includes the detailed discussion of capacity on a site-by-site basis. Potential future recreation opportunities and sites are discussed in Relicensing Study R-17 – Recreation Needs Analysis. Additional capacity-related conclusions, especially for on-water and water dependent recreation sites, are reported in Relicensing Study R-7 – Reservoir Boating.
5.1.1 Ecological Capacity
In general, recreational use of study area recreation facilities does not appear to have a widespread impact on the ecological integrity of the study area. Most observed
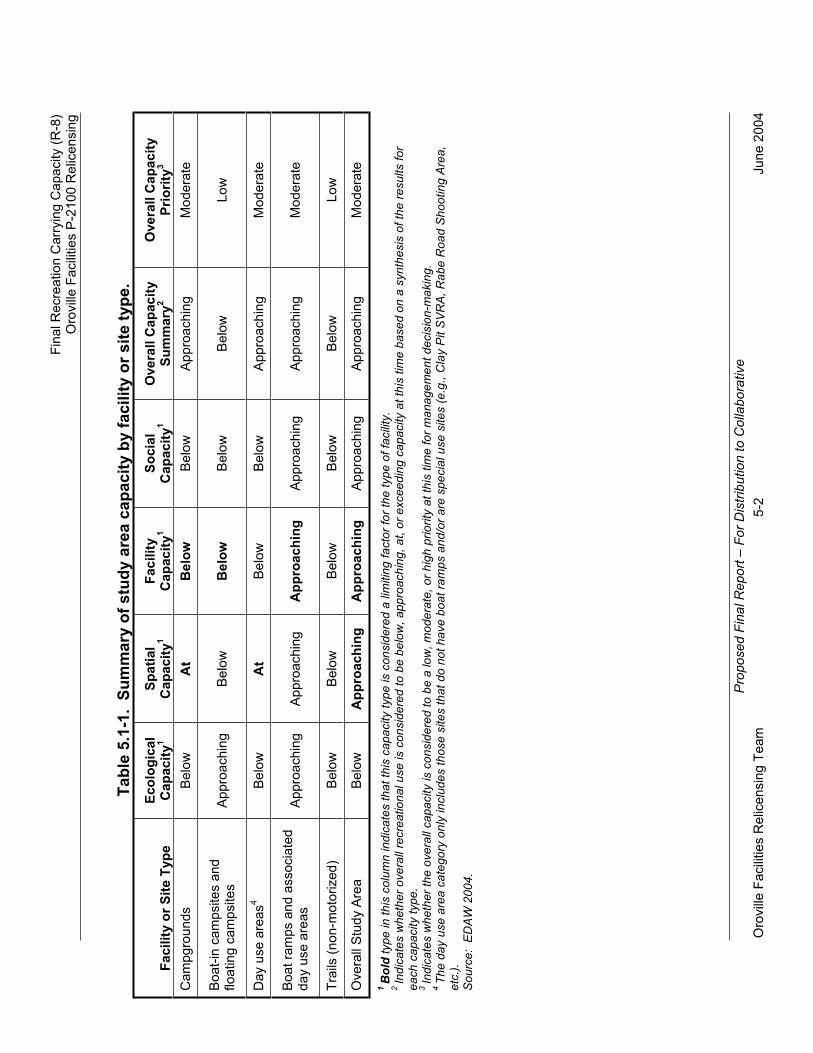
Fin
al R
ecre
atio
n C
arr
yin
g C
apa
city (
R-8
) O
rovill
e F
acili
ties P
-2100 R
elic
ensin
g
Pro
posed
Fin
al R
epo
rt –
Fo
r D
istr
ibu
tio
n to
Co
llab
ora
tive
Oro
vill
e F
acili
ties R
elic
ensin
g T
eam
5-2
June 2
004
Ta
ble
5.1
-1.
Su
mm
ary
of
stu
dy
are
a c
ap
ac
ity b
y f
ac
ilit
y o
r s
ite t
yp
e.
Facilit
y o
r S
ite T
yp
e
Eco
log
ical
Ca
pac
ity
1S
pati
al
Ca
pac
ity
1F
acilit
y
Ca
pac
ity
1S
ocia
lC
ap
ac
ity
1O
vera
ll C
ap
acit
y
Su
mm
ary
2O
vera
ll C
ap
acit
y
Pri
ori
ty3
Ca
mpg
rou
nds
Be
low
A
t B
elo
w
Be
low
A
pp
roa
ch
ing
Mo
dera
te
Bo
at-
in c
am
psite
s a
nd
flo
atin
g c
am
psite
s
Appro
achin
g
Belo
w
Belo
w
Be
low
B
elo
w
Lo
w
Day u
se a
reas
4B
elo
wA
tB
elo
w
Belo
w
Appro
achin
g
Modera
te
Bo
at ra
mps a
nd
associa
ted
d
ay u
se
are
as
Appro
achin
g
Appro
achin
g
Ap
pro
ac
hin
g
Ap
pro
ach
ing
Ap
pro
ach
ing
Mo
dera
te
Tra
ils (
no
n-m
oto
rize
d)
Be
low
B
elo
w
Be
low
B
elo
w
Be
low
L
ow
Overa
ll S
tudy A
rea
Belo
w
Ap
pro
ac
hin
g
Ap
pro
ac
hin
g
Ap
pro
ach
ing
Ap
pro
ach
ing
Mo
dera
te
1B
old
type in t
his
colu
mn indic
ate
s t
hat
this
capacity t
ype is c
onsid
ere
d a
lim
itin
g f
acto
r fo
r th
e t
ype o
f fa
cili
ty.
2In
dic
ate
s w
heth
er
overa
ll re
cre
ational use is c
onsid
ere
d t
o b
e b
elo
w,
appro
achin
g,
at, o
r exceedin
g c
apacity a
t th
is t
ime b
ased o
n a
synth
esis
of
the r
esults f
or
each c
apacity t
ype.
3In
dic
ate
s w
he
ther
the o
vera
ll capacity is c
onsid
ere
d t
o b
e a
low
, m
od
era
te,
or
hig
h p
riori
ty a
t th
is t
ime f
or
ma
na
ge
me
nt
decis
ion-m
akin
g.
4T
he d
ay u
se a
rea c
ate
gory
only
inclu
des t
hose s
ites t
hat
do n
ot ha
ve b
oat
ram
ps a
nd/o
r are
specia
l use s
ites (
e.g
., C
lay P
it S
VR
A,
Rabe R
oad S
hooting A
rea,
etc
.).
Sourc
e:
ED
AW
2004.

Final Recreation Carrying Capacity (R-8) Oroville Facilities P-2100 Relicensing
Proposed Final Report – For Distribution to Collaborative
Oroville Facilities Relicensing Team 5-3 June 2004
ecological concerns tended to be minor and localized (e.g., accumulated litter, user-defined trails, etc.). This is typical of large recreation areas. For example, user-defined trails in a developed campground may represent a high ecological concern for the campground area itself; however, on a larger scale (such as by resource area or study area), these same user-defined trails likely have little to no effect on the overall ecological quality of the area. This is not to say that ecological impacts should not be monitored; rather, many of recreation-related ecological impacts that were investigated during this analysis tend to have a greater localized effect than a more regional effect.
Ecological capacity is not considered a limiting factor at any of the major facility types (e.g., campgrounds, boat ramps, day use areas, trails, etc.) in the study area (Table 5.1-1). Two recreation facility types (BR/DUA and BIC) are considered to be approaching their ecological capacity, while the remaining three types (campgrounds, DUA, and trails) are considered below their ecological capacity. Ecological concerns at many of the developed recreation facilities in the study area are likely minimized by the presence of well-designed and hardened facilities, routine maintenance, and on-site management, among other factors.
While dispersed recreation sites were generally not investigated to the same level of detail as developed recreation sites in terms of overall recreation capacity, ecological capacity was nonetheless researched at identified dispersed use areas (DWR 2004c).Dispersed recreation sites and use areas in the study area have a higher percentage of ecological concerns compared to developed recreation sites. This is especially true in the OWA; of the 12 identified dispersed use areas, four are located within the OWA and three are categorized as areas of high concern. Common ecological concerns at the identified dispersed recreation sites and use areas in the study area included trash accumulation, vegetation damage, wetland and/or riparian impacts, user-defined trails, OHV-use, and water/shoreline impacts. However, considering the study area in its entirety, 12 dispersed sites and use areas is a relatively small number of sites.Additionally, similar to developed recreation sites, the observed ecological impacts at identified dispersed sites and use areas tended to be localized and generally do not pose a risk to the overall ecological integrity of the study area.
Overall, ecological capacity is not considered a limiting factor in the study area at this time. This conclusion comes because of the relatively minor recreation-related ecological impacts observed at most of the developed recreation facilities in the study area and the relatively small number of dispersed recreation sites and use areas with high levels of ecological concern. However, if use of study area recreation facilities increases in the future, additional potential recreation-related ecological impacts could occur.

Final Recreation Carrying Capacity (R-8) Oroville Facilities P-2100 Relicensing
Proposed Final Report – For Distribution to Collaborative
Oroville Facilities Relicensing Team 5-4 June 2004
5.1.2 Spatial Capacity
In general, spatial capacity is a constraint in the study area. Spatial capacity is considered at capacity and a limiting factor at campgrounds and day use areas in the study area (Table 5.1-1). Spatial capacity is approaching capacity at boat ramps/day use areas, but is below capacity at both boat-in campsites and trails. Common spatial constraints at many of the existing developed recreation sites, especially campgrounds and day use areas and other recreation area facilities, include the lack of easily developable, suitable adjacent areas for potential expansion and the lower feasibility of increasing use density through the addition of new site facilities.
According to findings from Relicensing Study R-15 – Recreation Suitability Analysis,areas of high and moderate suitability for potential recreation site development make up only about 12 percent of the study area, while areas of low suitability comprise approximately 58 percent of the study area (the remaining 30 percent of the study area is categorized as “excluded areas,” which include inundated areas, water, and Project facilities). The major spatial constraints in the study area include steep slopes and private property. Other spatial constraints include sensitive habitat and cultural resource concerns, as well as reservoir pool elevation variability. While the majority of lands within the study area are categorized as low suitability, this should not be taken to mean that potential recreation development cannot occur in areas of low suitability.Instead, construction and mitigation costs in areas of low suitability are likely prohibitively expensive, making recreation development economically infeasible.
Despite many lands within the study area being classified as low suitability in terms of potential recreation development, several areas were identified as high to moderate in Relicensing Study R-15 – Recreation Suitability Analysis. Many of these areas are adjacent to existing developed recreation sites. As a result, the most efficient future recreation development in the study area will likely entail infill and/or expansion of existing recreation sites, instead of the creation of new recreation sites within undeveloped property. Areas that are most suitable for potential future recreation development include the following:
Lands near the Lime Saddle Campground and Lime Saddle BR/DUA;
Lands near and adjacent to the Bloomer Area BICs;
Lands near the Spillway BR/DUA and Oroville Dam DUA and Overlook;
Lands adjacent to the Loafer Creek and Bidwell Canyon developed recreation sites;
A thin strip of land near the Bald Rock Canyon Access;
A large inland area to the east of the Craig Saddle BICs;
Lands near the western end of the Diversion Pool;
Lands adjacent to the North and South Thermalito Forebay developed recreation facilities;
Lands on the northern end of the Thermalito Afterbay;

Final Recreation Carrying Capacity (R-8) Oroville Facilities P-2100 Relicensing
Proposed Final Report – For Distribution to Collaborative
Oroville Facilities Relicensing Team 5-5 June 2004
Lands near the OWA Headquarters entrance;
Lands adjacent to the Clay Pit SVRA and Rabe Road Shooting Area (outside of the existing Project boundary);
Lands along the western side of the Feather River in the OWA; and
Lands in the vicinity of Riverbend Park (outside of the existing Project boundary).
A more in-depth on-site verification and extensive environmental review should be undertaken prior to initiating future recreation development in any of these areas or others that may prove suitable for recreation development. Also, as noted in Relicensing Study R-15 – Recreation Suitability Analysis, GIS mapping is not the best method for identifying smaller areas that may be suitable for potential future recreation opportunities, especially dispersed recreation sites and use areas. Many areas along the Lake Oroville shoreline may likely be adequate for dispersed recreation use (depending on reservoir pool elevations), specifically areas along the western shoreline of the lower North Fork portion of the reservoir and shoreline areas in the vicinity of the Kelly Ridge area. Additionally, areas along Thermalito Afterbay and the Feather River may also be appropriate for dispersed recreation use.
Overall, existing recreation use is considered to be approaching the spatial capacity of the study area. Spatial capacity is approaching capacity because of the lack of expansion potential at many of the existing developed recreation sites, as well as the high percentage of study area lands classified as low in terms of potential recreation development suitability. As a result, spatial capacity is considered a limiting factor in the study area.
5.1.3 Facility Capacity
Recreational use in the study area is estimated to account for approximately 1.7 million recreation days (RDs) on an annual basis (DWR 2004b). A RD is defined as “a visit by a person to a development for recreational purposes during any portion of a 24-hour period” and is FERC’s preferred unit of recreation measurement (FERC 2004). More than half of this existing use occurs during the four months that are defined as the recreation season (mid-May through mid-September). By 2050, recreation use in the study area is projected to increase about 103 percent to more than 3.5 million RD annually (DWR 2004d). This anticipated increase in use will likely lead to facility capacity constraints in the future. However, percent occupancy levels are currently considered below capacity at many of the developed recreation sites in the study area.
Currently, facility capacity is considered below capacity at all developed site types, except for boat ramps and day use areas (Table 5.1-1). Facility is a limiting factor, though, at three of the developed site types (campgrounds, boat-in campsites, and boat ramps/day use areas). Facility capacity is a limiting factor for several reasons at these types of sites. First, estimated high occupancy percentages at some sites during higher reservoir pool elevations, especially on weekends and holidays during the recreation

Final Recreation Carrying Capacity (R-8) Oroville Facilities P-2100 Relicensing
Proposed Final Report – For Distribution to Collaborative
Oroville Facilities Relicensing Team 5-6 June 2004
season, are a facility constraint. Second, reservoir pool elevation (when low) limits access to and the functionality of several sites in the study area. Third, visitor survey results indicate a desire for some new and/or improved recreation sites and facilities (DWR 2004e). Lastly, recreation use in the study area is anticipated to increase more than 100 percent by 2050 and new sites and facilities may be needed during this time in order to preserve visitor satisfaction and minimize potential resource impacts.
Overall, while existing percent occupancy tends to be relatively low at most developed recreation sites in the study area, facility capacity is considered to be approaching capacity and thus a limiting factor at this time.
5.1.4 Social Capacity
The overall mean perceived crowding score of visitors to the study area was 3.3 during the recreation season and 3.2 annually (DWR 2004e). These scores are relatively low and indicate that visitors to the study area only feel slight levels of crowding.Additionally, approximately 67 and 18 percent of respondents felt that the number of people was either “not a problem” or a “slight problem,” respectively, further indicating that visitors to the study area are generally comfortable with existing levels of use and crowding (DWR 2004e). Social capacity was generally below capacity at many of the developed recreation sites and site types in the study area (Table 5.1-1). Social capacity was approaching capacity at boat ramps and their associated day use areas, but not a limiting factor at these sites. Higher levels of perceived crowding are generally expected at boat ramps and their associated day use areas due to the type of use these sites experience. Social capacity is especially constrained at boat ramps, as these sites tend to focus many visitors in one area (the boat ramp itself) for brief periods of time. Overall, social capacity is considered to be approaching capacity, but not a limiting factor at this time in the study area.
An additional component of social capacity that was investigated for Relicensing Study R-13 – Recreation Surveys was the desired experience of visitors to the study area.Desired experiences are based on the Recreation Opportunity Spectrum (ROS) and range from wilderness to urban experiences (Clark and Stankey 1979; Driver et al. 1987). In the study area, survey respondents indicated that the sights and sounds of civilization should be “rare” (40 percent) or “unusual” (26 percent). Additionally, a combined 78 percent of survey respondents indicated that the landscape should be “predominantly natural in appearance” or “modified on a small scale” (DWR 2004e).These results indicate that visitors to the study area tend to favor more natural settings and experiences. While desired ROS setting-based experiences were generally not considered in determining existing social capacity, they will be used to help determine future needs in the study area (DWR 2004g) and should also be an integral component of the Oroville Facilities Draft Recreation Management Plan to be developed by DWR in 2004.
Final Recreation Carrying Capacity (R-8) Oroville Facilities P-2100 Relicensing
Proposed Final Report – For Distribution to Collaborative
Oroville Facilities Relicensing Team 5-7 June 2004
5.1.5 Overall Capacity Conclusion
Overall, recreational use in the study area is considered to be approaching capacity (Table 5.1-1). While all of the capacity indicator variables, except ecological capacity, are considered to be approaching capacity, the primary capacity-related limiting factors to recreational use in the study area include spatial and facility capacities. Spatial capacity is considered a limiting factor because of limited expansion potential at many of the existing developed recreation sites, as well as the high percentage of study area lands classified as low in terms of potential recreation development suitability. Facility capacity is a limiting factor because of percent occupancy constraints, as well as reservoir pool elevation limitation, among other concerns. Considering the capacity indicator variables in aggregate, capacity-related decisions regarding recreation in the study area should be regarded as a moderate priority at this time. The fact that both spatial and facility capacities are considered limiting factors is important for future capacity-related decision-making, as excess spatial capacity is necessary to expand the facility capacity of a developed recreation site. In the event that facility capacity must be expanded in the future, but potential spatial capacity is not available for expansion, other capacity-related management options will need to be considered. Additional existing and future capacity-related opportunities and constraints for the study area, as well as each resource area (Lake Oroville, Diversion Pool, low flow channel (LFC), Thermalito Forebay, Thermalito Afterbay, and OWA), are discussed in more detail in Relicensing Study R-17 – Recreation Needs Analysis.
5.2 STUDY AREA CAMPGROUND CAPACITY SUMMARY
In this section, the overall capacity of developed campgrounds in the study area is presented first, followed by the discussion of site-specific recreation carrying capacity.
5.2.1 Overall Capacity Summary of Developed Campgrounds
The overall capacity of developed campgrounds in the study area is summarized in Table 5.2-1.
5.2.1.1 Ecological Capacity
In general, recreational use of the developed campgrounds does not appear to have a widespread impact on the ecological integrity of the study area. Most observed ecological concerns tended to be relatively minor and localized (e.g., soil erosion, trash accumulation, etc.). Ecological capacity is not a limiting factor at any of the developed campgrounds in the study area except at the OWA Primitive Camping Areas (Table 5.2-1). Ecological concerns at many of the developed recreation facilities in the study area are likely minimized by the presence of well-designed and hardened facilities, routine maintenance, and on-site management, among other factors.

Fin
al R
ecre
atio
n C
arr
yin
g C
apa
city (
R-8
) O
rovill
e F
acili
ties P
-2100 R
elic
ensin
g
Pro
posed
Fin
al R
epo
rt –
Fo
r D
istr
ibu
tio
n to
Co
llab
ora
tive
O
rovill
e F
acili
ties R
elic
ensin
g T
eam
5-8
Ju
ne
20
04
Ta
ble
5.2
-1.
Su
mm
ary
of
stu
dy a
rea
de
ve
lop
ed
ca
mp
gro
un
d c
ap
ac
ity.
Facilit
y
Eco
log
ical
Ca
pac
ity
1S
pati
al
Ca
pac
ity
1F
acilit
y
Ca
pac
ity
1S
ocia
lC
ap
ac
ity
1O
vera
ll C
ap
acit
y
Su
mm
ary
2O
vera
ll C
ap
acit
y
Pri
ori
ty3
Su
bs
titu
te
Facilit
y(t
ies)4
Bid
we
ll C
an
yo
n C
am
pgro
un
d
Be
low
A
t A
pp
roa
ch
ing
A
pp
roa
ch
ing
Ap
pro
ach
ing
Mo
dera
te
Lo
afe
r C
reek
Ca
mpg
rou
nd
Lim
e S
ad
dle
Ca
mpg
rou
nd
Be
low
A
t B
elo
w
Be
low
A
pp
roa
ch
ing
Mo
dera
te
-
Lim
e S
ad
dle
Gro
up
C
am
pg
rou
nd
Be
low
At
Be
low
B
elo
w
Be
low
L
ow
-
Lo
afe
r C
reek C
am
pg
rou
nd
Be
low
A
pp
roa
ch
ing
Belo
w
Be
low
B
elo
w
Lo
w
Bid
we
ll C
an
yo
n
Ca
mpg
rou
nd
Lo
afe
r C
reek G
roup
C
am
pg
rou
nd
Belo
w
Appro
achin
gA
tB
elo
w
Ap
pro
ach
ing
Mo
dera
te
-
Lo
afe
r C
reek E
qu
estr
ian
C
am
pg
rou
nd
Be
low
A
pp
roa
ch
ing
Be
low
B
elo
w
Be
low
L
ow
-
OW
A P
rim
itiv
e C
am
pin
g
At
At
Be
low
At
At
Hig
h
-
No
rth
Th
erm
alit
o F
ore
ba
y R
V
“En R
oute
” C
am
pgro
un
d5
Be
low
B
elo
w
Be
low
A
pp
roa
ch
ing
B
elo
w
Lo
w
Spill
way R
V “
En
Ro
ute
” C
am
pg
roun
d
Spill
way R
V “
En R
oute
” C
am
pg
rou
nd
5B
elo
wA
tB
elo
w
Ap
pro
ach
ing
Ap
pro
ach
ing
Mo
dera
te
No
rth
Th
erm
alit
o
Fore
bay R
V “
En
Ro
ute
” C
am
pg
roun
d
Overa
ll S
tudy A
rea
Ca
mpg
rou
nd
Su
mm
ary
B
elo
wA
t B
elo
w
Be
low
A
pp
roa
ch
ing
Mo
dera
te
NA
1B
old
in t
his
colu
mn indic
ate
s t
hat
this
capacity t
ype is c
onsid
ere
d a
lim
itin
g f
acto
r fo
r th
is f
acili
ty.
2In
dic
ate
s w
heth
er
overa
ll re
cre
ational use is c
onsid
ere
d t
o b
e b
elo
w,
appro
achin
g,
at, o
r exceedin
g c
apacity a
t th
is t
ime b
ased o
n a
synth
esis
of
the r
esults f
or
each c
apacity
type.
3In
dic
ate
s w
heth
er
the o
vera
ll capacity is c
onsid
ere
d t
o b
e a
low
, m
od
era
te,
or
hig
h p
riori
ty a
t th
is t
ime f
or
managem
ent
decis
ion-m
akin
g.
4In
dic
ate
s w
hic
h (
if a
ny)
facili
ty m
ay a
ct
as a
substitu
te f
acili
ty t
hat
may b
e a
ble
to a
bsorb
recre
ational use t
o h
elp
ease o
vera
ll capacity c
oncern
s.
5T
he r
ecre
atio
n c
arr
yin
g c
ap
acity ind
icato
r varia
ble
s w
ere
gen
era
lly investigate
d f
or
the e
ntire
Nort
h T
herm
alit
o F
ore
bay a
nd S
pill
way r
ecre
ation s
ites,
not
just
the R
V “
en r
oute
” cam
pgro
un
ds.
Capacity-r
ela
ted d
eta
il a
bout
the N
ort
h T
herm
alit
o F
ore
bay a
nd S
pill
way r
ecre
ation s
ites c
an b
e f
ound in S
ection 5
.5.
Sourc
e:
ED
AW
2004.

Final Recreation Carrying Capacity (R-8) Oroville Facilities P-2100 Relicensing
Proposed Final Report – For Distribution to Collaborative
Oroville Facilities Relicensing Team 5-9 June 2004
Overall, ecological capacity is considered to be below capacity at this time and is not considered a limiting factor at developed campgrounds because of the relatively minor recreation-related ecological impacts observed at most of the developed campgrounds. Potential ecological impacts may change, however, especially as use of study area developed campgrounds increases in the future. Additionally, existing ecological capacity-related management decisions are warranted at the OWA primitive camping area.
5.2.1.2 Spatial Capacity
Overall, spatial capacity is considered to be at capacity and a limiting factor at the developed campgrounds in the study area. Individually, spatial capacity is considered at capacity at five of the campgrounds (Table 5.2-1). The Loafer Creek area campgrounds, while currently considered to be approaching their spatial capacity, could either be expanded and/or redesigned to include additional site facilities in order to accommodate increased recreational use. Additionally, some adjacent lands at Lime Saddle Campground could also likely be used for potential campground expansion, and both the Bidwell Canyon Campground and the Spillway RV “En Route” Campground could likely be slightly expanded and/or redesigned to increase use density. While most existing campgrounds are at their spatial capacity, some areas identified in Relicensing Study R-15 – Recreation Suitability Analysis may be suitable for new campground development in the future, if demand warrants their construction.
5.2.1.3 Facility Capacity
In general, the developed campgrounds experience higher levels of use during the recreation season, with use declining and leveling out during the fall and winter months before rising again in the spring. For all of the developed campgrounds in the study area, occupancy was higher in the recreation season than in the off-season. Also, percent occupancy was higher at all of the developed campgrounds during weekends compared to weekdays during the recreation season (DWR 2004b). Nearly all of the developed campgrounds in the study area are currently considered to be below their facility capacity. The two developed campgrounds that are not below their facility capacity are the Bidwell Canyon Campground, which is approaching its facility capacity, and the Loafer Creek Group Campground, which is at its facility capacity (Table 5.2-1).However, facility capacity is a limiting factor at four developed campgrounds in the study area, because of either existing and/or future percent occupancy constraints.
In addition to investigating percent occupancy at the developed campgrounds in the study area, demand for additional campgrounds and associated facilities was also investigated as a component of Relicensing Study R-13 – Recreation Surveys. Survey respondents at Lake Oroville indicated that there were too few campgrounds (21 percent), too few campsites with RV hookups (38 percent), and too few group campsites (33 percent). These percentages are relatively low and indicate that most

Final Recreation Carrying Capacity (R-8) Oroville Facilities P-2100 Relicensing
Proposed Final Report – For Distribution to Collaborative
Oroville Facilities Relicensing Team 5-10 June 2004
visitors at Lake Oroville are satisfied with the currently level of camping-related development. However, while these percentages are relatively low, they do indicate some demand for additional camping-related facilities, especially campsites with RV hookups and group campsites. Additionally, demand for these types of campgrounds and facilities was generally higher among survey respondents at Thermalito Forebay and Afterbay, where there are fewer (or no) existing opportunities for developed camping; survey respondents at these locations indicated there were too few campgrounds (36 and 54 percent respectively), too few campsites with RV hookups (43 and 47 percent respectively), and too few group campsites (32 and 58 percent respectively).
Overall, existing facility capacity at the campgrounds in the study area is considered to be below capacity based on relatively low levels of existing percent occupancy at many sites. However, considering existing and future percent occupancy constraints (i.e., reaching and/or exceeding preliminary capacity thresholds), as well as some respondents’ perceptions of needed campground facilities (especially in resource areas that are currently underdeveloped in terms of camping facilities), facility capacity at the developed campgrounds in the study area is considered to be a limiting factor.
5.2.1.4 Social Capacity
Overall, developed campgrounds in the study area are considered to be below their social capacity (Table 5.2-1). On an individual basis, most of the developed campgrounds were either below or approaching their social capacity. Only the OWA primitive camping area was considered to be at social capacity. On both an annual and recreation season basis, the mean perceived crowding score for all of the developed campgrounds was 2.7 on a 9-point scale (DWR 2004e). This score is relatively low and indicates that visitors to these sites generally do not feel crowded. Given the low aggregate crowding scores at developed campgrounds in the study area, overall social capacity is not a limiting factor at this time.
5.2.1.5 Overall Capacity Conclusion
Overall, spatial and facility capacities are the primary limiting factors at the developed campgrounds in the study area (Table 5.2-1). While all of the capacity indicator variables, except spatial, were below capacity, existing and future percent occupancy constraints are considered facility capacity limitations at several of the campgrounds in the study area. Future capacity-related decision-making will likely need to focus more on alternate management strategies than spatial/facility expansion at existing campgrounds because facility and spatial capacity are related (i.e., excess spatial capacity is needed to expand the physical area of a site and increase the facility capacity).
Final Recreation Carrying Capacity (R-8) Oroville Facilities P-2100 Relicensing
Proposed Final Report – For Distribution to Collaborative
Oroville Facilities Relicensing Team 5-11 June 2004
While some of the campgrounds have substitute sites that could potentially relieve capacity concerns at specific sites, geographical constraints likely limit the amount of use that could potentially be transferred from one site to another (Table 5.2-1). As a result, while some substitute sites may ease capacity constraints at similar type sites (e.g., Bidwell Canyon and Loafer Creek campgrounds), they likely have a minimal effect on easing overall capacity constraints at campgrounds at this time. Additionally, the specialized use campgrounds (i.e., group and equestrian campgrounds) generally do not have substitute sites.
5.2.2 Site-Specific Capacity of Campgrounds
Recreation facilities discussed in this section include:
Bidwell Canyon Campground;
Lime Saddle Campground and Group Campground;
Loafer Creek Campground, Group Campground, and Equestrian Campground;
OWA primitive camping area;
North Thermalito Forebay RV “En Route” Campground; and
Spillway RV “En Route” Campground.
5.2.2.1 Bidwell Canyon Campground
Bidwell Canyon Campground is located along the southern shoreline of Lake Oroville and to the west of Oroville Dam (Figure 1.2-1). This facility has 75 campsites for recreational vehicles (RVs) or tents, all with full hookups. Two flush restrooms, piped water, 6 showers, a picnic area with 21 tables, shade trees, and fire grills are also available. There is a seasonally-staffed booth at the entrance of the campground to greet visitors and collect fees.
Ecological Capacity
During the winter field observation, all of the ecological variables were described as being of low concern. During the summer field observation, only one variable (trash accumulation) was described as being of moderate concern, while the others were of low concern. Overall, the site’s level of ecological impact is characterized as being of low concern; therefore, ecological capacity at Bidwell Canyon Campground is considered to be below capacity and not a limiting factor based on the low level of concern regarding ecological impacts at the site.
Spatial Capacity
In general, the potential to physically expand the Bidwell Canyon Campground is limited. Expansion is constrained by private land to the west, the reservoir to the east, the Bidwell Canyon BR/DUA to the north, and an unfavorable slope to the south.

Final Recreation Carrying Capacity (R-8) Oroville Facilities P-2100 Relicensing
Proposed Final Report – For Distribution to Collaborative
Oroville Facilities Relicensing Team 5-12 June 2004
Additionally, most adjacent lands are categorized as moderate- to low-suitability in terms of future recreation development (DWR 2004f). However, some marginal areas or parts of the existing Bidwell Canyon BR/DUA could be used to slightly increase the physical area of this site. Specifically, the area between the kiosk and existing campground could likely be redeveloped to accommodate an additional campground loop with approximately 35 campsites.
Overall, spatial capacity is considered to be at capacity. Some potential exists to increase the use/facility density at this site by expanding the physical area of the site (into marginal adjacent areas and/or in the vicinity of the Bidwell Canyon BR/DUA) or by redesigning the site, including portions of the BR/DUA parking areas. As such, spatial capacity is considered a limiting factor at this time.
Facility Capacity
Annual recreation use at the Bidwell Canyon Campground accounted for over 22,200 RD during field studies (DWR 2004b). During the recreation season (May 15 to September 15), existing recreational use of this site accounted for over 16,000 RD, of which nearly 6,500 RD are attributed to weekend use. According to Relicensing Study R-12 – Projected Recreation Use, by 2050, annual recreation use at this site is estimated to be approximately 41,310 RD. This would be a potential 86 percent increase by 2050 from existing use levels.
The existing recreation season percent occupancy at this site during weekdays was 33 percent and 62 percent of capacity during weekends (DWR 2004b). The recreation season weekday percent occupancy is considered below capacity, while the recreation season weekend percent occupancy is considered to be approaching capacity. Additionally, this site reached 100 percent occupancy once during recreation season weekdays and once during weekends.
Given existing use levels and the fact that annual recreation use at this site is predicted to increase approximately 86 percent by 2050, additional capacity will likely be necessary at this site. It is estimated that by 2020, recreation season weekend percent occupancy at the Bidwell Canyon Campground will exceed 80 percent. This level of use is considered to be exceeding the facility capacity of this site. As a result, while facility capacity is currently considered to be approaching capacity, this capacity type is considered a limiting factor because of future percent occupancy constraints.
Social Capacity
According to Relicensing Study R-13 – Recreation Surveys, the annual mean perceived crowding score at the Bidwell Canyon Campground was 3.2 on a scale of 1 to 9. This is the highest annual crowding score of developed campgrounds in the study area; however, this score is still relatively low and indicates that visitors only feel slightly

Final Recreation Carrying Capacity (R-8) Oroville Facilities P-2100 Relicensing
Proposed Final Report – For Distribution to Collaborative
Oroville Facilities Relicensing Team 5-13 June 2004
crowded at this site. During the recreation season (May 15 through September 15), the mean perceived crowding score was about 3.4. This score is also relatively low and again indicates that visitors only feel slightly crowded at this site. Based on these perceived crowding scores, this site is considered to be approaching its social capacity; however, social capacity is not considered a limiting factor at this time.
Overall Site Capacity Conclusion
Overall, existing recreation use at the Bidwell Canyon Campground is considered to be approaching capacity. Of the four capacity types, only spatial capacity is considered to be at capacity. Both facility and social capacities are approaching capacity, while ecological capacity is below capacity. Currently, both spatial and facility are considered limiting factors. However, because facility and spatial capacity are related (i.e., excess spatial capacity is needed to expand the physical area of a site and increase the facility capacity), future capacity-related decision-making at this site will likely need to focus on alternate management strategies rather than relying solely on spatial/facility expansion. Considering the capacity types in aggregate, capacity-related decisions at the Bidwell Canyon Campground should be regarded as a moderate management priority.
5.2.2.2 Lime Saddle Campground and Group Campground
Lime Saddle Campground is located on the western shoreline of the West Branch of the North Fork arm of Lake Oroville (Figure 1.2-1). The campground has 44 individual campsites (28 tent sites and 16 RV sites with full hookups) and a group campground.Each individual campsite has a picnic table and a fire ring. There are 2 restroom/shower buildings located among the 44 campsites, as well as numerous water spigots and gray water sumps. Other site facilities include a staffed visitor information and fee collection kiosk, two pay telephones, and an RV dump station.
Located within Lime Saddle Campground, the Group Campground is closer to the entrance kiosk than the individual campsites. The group campsite is split into two areas, each with a covered shelter, three picnic tables, a trash receptacle, large barbecue, and a water fountain/spigot. Six campsites, three of which are Americans with Disabilities Act (ADA)-accessible, are located among the two group areas.
Ecological Capacity
During both the winter and summer field observations, all of the ecological variables were characterized as low concerns at both the Lime Saddle Campground and the Group Campground. Overall, the level of ecological impact is characterized as being of low concern at both sites. Therefore, ecological capacity at the Lime Saddle Campground and Group Campground is considered below capacity and not a limiting factor.

Final Recreation Carrying Capacity (R-8) Oroville Facilities P-2100 Relicensing
Proposed Final Report – For Distribution to Collaborative
Oroville Facilities Relicensing Team 5-14 June 2004
Spatial Capacity
The potential to physically expand either the Lime Saddle Campground or the Group Campground is limited. Expansion is primarily constrained by unfavorable slopes in all directions. Additionally, most existing site lands, as well as adjacent lands, are categorized as moderate to low suitability in terms of future recreation development (DWR 2004f). However, some marginal areas could be used (through infill and/or re-grading) to slightly increase the physical area or use/facility density at this site. However, these expansion areas would likely be relatively expensive to develop.
Overall, spatial capacity is considered to be at capacity at these sites. Some potential exists to increase the use density at this site by expanding into marginal adjacent areas (to the west/northwest) through infill and re-grading or by converting part of the Lime Saddle BR/DUA into camping areas. Nonetheless, spatial capacity is considered a limiting factor at this time.
Facility Capacity
Facility capacity was investigated separately at the Lime Saddle Campground and the Group Campground. At the Lime Saddle Campground, existing annual recreation use accounted for over 7,700 RD (DWR 2004b). During the recreation season, existing recreational use of this site accounted for nearly 6,000 RD with weekends use accounting for over 2,500 RD. By 2050, annual recreation use at this site is estimated to be approximately 14,400 RD (DWR 2004d). This would be an 86 percent increase from existing use levels.
Existing recreation use at the Lime Saddle Campground during the recreation season was 16 percent of capacity on weekdays and 48 percent of capacity on weekends.Both of these percent occupancies are considered below capacity. Percent occupancy at this site never reached or exceeded 100 percent during the recreation season.
Given existing use levels and the fact that annual recreation use at this site is predicted to increase approximately 86 percent by 2050, additional capacity will likely be necessary at this site in the future. It is estimated that by 2040, recreation season weekend percent occupancy at the Lime Saddle Campground will be at or exceed 80 percent. This level of use is considered to be exceeding the facility capacity of this site. As a result, while facility capacity is currently considered to be below capacity, this capacity type is considered a limiting factor because of future percent occupancy constraints.
At the Group Campground, existing use accounted for less than 1,000 RD during the recreation season, the only time this site is open (DWR 2004b). Weekend use of this site during the recreation season accounted for approximately 425 RD. By 2050,

Final Recreation Carrying Capacity (R-8) Oroville Facilities P-2100 Relicensing
Proposed Final Report – For Distribution to Collaborative
Oroville Facilities Relicensing Team 5-15 June 2004
annual recreation use at this site is predicted to increase approximately 86 percent to about 1,710 RD (DWR 2004d).
Existing recreation use at the Group Campground during the recreation season was only 2 percent of capacity on weekdays and 14 percent of capacity on weekends. Both of these percent occupancies are considered below capacity. Percent occupancy at this site never reached and/or exceeded 100 percent during the recreation season.
By 2050, while recreational use at this site is estimated to increase by 86 percent, recreation season weekend percent occupancy is not expected to reach capacity at the Lime Saddle Group Campground. As a result, facility capacity is not considered to be a limiting factor.
Social Capacity
Annually and during the recreation season, the mean perceived crowding score at the Lime Saddle Campground and the Group Campground was 2.3 (DWR 2004e). Aside from the Loafer Creek Equestrian Campground, this was the lowest crowding score of all the developed campgrounds in the study area, indicating that visitors do not feel crowded at either of these sites. Based on this low perceived crowding score, social capacity is considered to be below capacity and is not a limiting factor at this time at the Lime Saddle Campground or the Group Campground.
Overall Site Capacity Conclusion
Overall, existing recreation use at the Lime Saddle Campground is considered to be approaching capacity, though use of the Group Campground is considered below capacity. Of the four capacity types, only spatial capacity is considered to be at capacity at both sites. The remaining capacity types are all below capacity at this time.At the Lime Saddle Campground, both spatial and facility are considered limiting factors, though facility capacity is not estimated to be at capacity until approximately 2040. At the Group Campground, only spatial capacity is considered to be a limiting factor at this time. Because facility capacity is not anticipated to reach capacity by 2050, the necessary spatial capacity required to increase facility capacity will likely not be needed in the future. Considering the capacity indicator variables in aggregate, capacity-related decisions at the Lime Saddle Campground should be regarded as a moderate management priority at this time; however, while spatial capacity is considered to be at capacity, capacity-related decisions at the Group Campground should be regarded as only a low management priority at this time. Additionally, while spatial capacity is at capacity, marginal adjacent areas could likely be used for campground expansion, though the potential cost would be high compared to flatter terrain.

Final Recreation Carrying Capacity (R-8) Oroville Facilities P-2100 Relicensing
Proposed Final Report – For Distribution to Collaborative
Oroville Facilities Relicensing Team 5-16 June 2004
5.2.2.3 Loafer Creek Campground, Group Campground, and Equestrian Campground
The Loafer Creek Campground (which includes the Group Campground and Equestrian Campground), is located on the southern shoreline of Lake Oroville (Figure 1.2-1). The campground includes 137 campsites (6 ADA-accessible) for RVs or tents. Each campsite has a picnic table, fire ring, tent pad, and nearby shade trees. There are also 20 flush toilets (12 ADA-accessible), 16 showers, 12 gray water sumps, a pay telephone, and a staffed entrance booth for visitor information and fee collection.
At the Group Campground, there are 6 group campsites, each able to accommodate approximately 25 people. Each group campsite has several picnic tables, a sink with running water, shade trees, 5 large tent pads, nearby water spigots, and parking spaces for 8 vehicles. The group campground also has 8 flush toilets (4 ADA-accessible) and 8 showers (all ADA-accessible).
The Equestrian Campground has 15 sites, each with trailer parking, a fire ring with cooking grill, and a picnic table. Each site also has a corral to feed and secure horses.Additionally, the site has 2 flush toilets (1 ADA-accessible), 2 showers (1 ADA-accessible), a horse washing area, and an equestrian exercise ring. The Dan Beebe Trail (Section 5.2.6) can be accessed from the Loafer Creek Equestrian Campground.
Ecological Capacity
All of the ecological variables were characterized as low concerns at the Loafer Creek Campground and Group Campground during the winter field observation. During the summer field observation, all of the ecological variables were also described as low concerns, except trash accumulation (moderate concern). During both the winter and summer field observations, two ecological variables (soil erosion and soil compaction) were described as being of moderate concern at the Equestrian Campground. Overall, the sites’ levels of ecological impact are characterized as being of low concern. As a result, ecological capacity at the Loafer Creek campgrounds is considered to be below capacity and not a limiting factor at this time.
Spatial Capacity
The potential exists to physically expand the Loafer Creek campgrounds. While most existing developed areas at these sites cannot accommodate additional facilities, several adjacent areas in all directions could be used for expansion. Additionally, most existing site lands, as well as adjacent lands, are categorized as moderate to high in terms of future recreation development suitability (DWR 2004f).
Overall, spatial capacity is considered to be approaching capacity at the Loafer Creek campgrounds. While there is little potential to increase the use density at the existing
Final Recreation Carrying Capacity (R-8) Oroville Facilities P-2100 Relicensing
Proposed Final Report – For Distribution to Collaborative
Oroville Facilities Relicensing Team 5-17 June 2004
site (i.e., add new facilities within the existing footprint of the site), spatial capacity is not considered a limiting factor at this time, as the potential exists to physically expand the site into adjacent areas.
Facility Capacity
Facility capacity was investigated separately at the Loafer Creek Campground, Group Campground, and Equestrian Campground.
Annual recreational use of the Loafer Creek Campground accounted for over 23,500 RD, nearly 90 percent (approximately 21,000 RD) of which occurred during the recreation season (DWR 2004b). During recreation season weekends, existing use of this site accounted for nearly 10,000 RD. By 2050, annual recreation use at this site is estimated to be approximately 43,700 RD (DWR 2004d), representing an 86 percent increase from existing use levels.
The existing percent occupancy at the Loafer Creek Campground during recreation season weekdays was 14 percent of capacity, and 51 percent of capacity during weekends (DWR 2004b). Both of these percent occupancies are considered to be below capacity. Additionally, percent occupancy at this site never reached or exceeded 100 percent during the recreation season.
Given existing use levels and the fact that annual recreation use at the Loafer Creek Campground is predicted to increase approximately 86 percent by 2050, additional capacity will likely be necessary at this site in the future. It is estimated that by 2040, recreation season weekend percent occupancy at this site will exceed 80 percent. This level of use is considered to be exceeding the facility capacity of this site. As a result, while facility capacity is currently considered to be below capacity, this capacity type is considered a limiting factor because of future percent occupancy constraints.
Annual recreation use at the Loafer Creek Group Campground accounted for over 5,800 RD (DWR 2004b). Nearly 94 percent (5,445 RD) of this use occurred during the recreation season. During recreation season weekends, use at this site accounted for approximately 2,150 RD. By 2050, annual recreation use at this site is estimated to be nearly 11,000 RD, of which approximately 4,000 RD will be attributable to recreation season weekends (DWR 2004d). This represents an 86 percent increase from existing use levels.
Existing recreation use at the Loafer Creek Group Campground during the recreation season was only 29 percent of capacity on weekdays, but rose to 82 percent of capacity on weekends. Recreation season weekday percent occupancy at this site is considered below capacity, while recreation season weekend percent occupancy is considered to be exceeding capacity. Additionally, this site reached and/or exceeded 100 percent

Final Recreation Carrying Capacity (R-8) Oroville Facilities P-2100 Relicensing
Proposed Final Report – For Distribution to Collaborative
Oroville Facilities Relicensing Team 5-18 June 2004
occupancy 6 times during recreation season weekdays and on 26 occasions during weekends.
Given the high existing recreation season weekend use levels and the fact that annual recreation use at this site is predicted to increase approximately 86 percent by 2050, additional capacity will likely be necessary at the Loafer Creek Group Campground.Facility capacity is currently considered to be exceeding recreation season weekend capacity and it is estimated that by 2050 recreation season weekend percent occupancy at this site will exceed 150 percent (assuming no additional facilities are constructed and use is allowed to continue beyond 100 percent). As a result, facility capacity is currently considered to be at capacity (not “exceeding,” due to weekday capacity) and is a limiting factor.
Annual recreation use of the Loafer Creek Equestrian Campground accounted for nearly 2,000 RD (DWR 2004b). Approximately half of this use occurred during the recreation season. During recreation season weekends, existing recreation use at this site accounted for less than 500 RD. By 2050, annual recreation use at this site is estimated to be approximately 3,580 RD (DWR 2004d), representing an 86 percent increase from existing use levels.
Existing recreation use at the Loafer Creek Equestrian Campground during recreation season was only 11 percent of capacity on weekdays and 33 percent of capacity on weekends. Both of these percent occupancies are considered to be below capacity for the recreation season. However, percent occupancy at this site reached and/or exceeded 100 percent 3 times during weekdays and 4 times during weekends during the off-season (September 16 through May 14).
By 2050, while recreational use at the Loafer Creek Equestrian Campground is also estimated to increase by 86 percent, neither recreation season weekday or weekend percent occupancy is expected to reach and/or exceed capacity at this site. As a result, facility capacity is currently considered to be below capacity and not a limiting factor.
Social Capacity
Annually and during the recreation season, the mean perceived crowding score at the Loafer Creek Campground and Group Campground was 2.5 (DWR 2004e). Annually and during the recreation season, the mean perceived crowding score at the Loafer Creek Equestrian Campground was approximately 2.3. Based on these low perceived crowding scores, social capacity is considered to be below capacity at these sites and is not a limiting factor at this time.

Final Recreation Carrying Capacity (R-8) Oroville Facilities P-2100 Relicensing
Proposed Final Report – For Distribution to Collaborative
Oroville Facilities Relicensing Team 5-19 June 2004
Overall Site Capacity Conclusion
Overall, existing recreation use is considered below capacity at the Loafer Creek Campground and Equestrian Campground, but approaching capacity at the Group Campground. All of the capacity indicators are considered to be below capacity at the Loafer Creek Campground and Equestrian Campground at this time, except spatial capacity, which is approaching capacity. Facility capacity is the only capacity indicator variable that is currently considered to be at capacity at the Group Campground. Facility capacity is considered a limiting factor at both the Loafer Creek Campground and Group Campground. At the Loafer Creek Campground, recreation season weekend percent occupancy is anticipated to exceed 80 percent by 2040. The Group Campground currently experiences high levels of recreation season weekend percent occupancy and is anticipated to continue to experience high levels of use in the future. Considering the capacity indicator variables in aggregate, capacity-related decisions at both the Loafer Creek Campground and Equestrian Campground should be regarded as a low management priority at this time. At the Group Campground, however, capacity-related decisions should be regarded as a moderate priority at this time.
5.2.2.4 OWA Primitive Camping Area
There are an undetermined number of primitive campsites located in the OWA in a designated camping area (Afterbay outlet area). In general, the primitive campsites do not have improved facilities.
Ecological Capacity
During the winter field observation, three ecological variables (soil erosion, soil compaction, and lack of sanitation) were described as being of high concern at OWA camping areas. Additionally, trash accumulation, vegetation damage, user-defined trails, riparian impact, and water/shoreline impact were described as being of moderate concern. The remaining three ecological variables (lack of downed wood, OHV impacts, and proximity to wetlands) were low concerns during the winter field observation. During the summer field observation, four ecological variables (soil erosion, soil compaction, trash accumulation, and sanitation issues) were high concerns, while four ecological variables (vegetation damage, user-defined trails, riparian impact, and water/shoreline impact) were moderate concerns. Once again, the remaining three ecological variables were low concerns during the summer field observation. Overall, the site’s level of ecological impact is characterized as being of high concern. Ecological capacity at OWA camping areas is considered to be at capacity based on the high level of concern regarding ecological impacts at the site and is considered a limiting factor at this time. Additionally, ecological resources are a management priority within the OWA; priority is given to protecting these resources first and providing recreation and public use opportunities, where appropriate, as a secondary priority.

Final Recreation Carrying Capacity (R-8) Oroville Facilities P-2100 Relicensing
Proposed Final Report – For Distribution to Collaborative
Oroville Facilities Relicensing Team 5-20 June 2004
Spatial Capacity
The potential exists to expand most of the existing use areas within the OWA, including the camping area. Around most of the camping area, adjacent areas are suitable for potential future site expansion. However, ecological constraints and management priorities likely limit this expansion potential. Additionally, most lands within the OWA, including areas adjacent to existing use sites, are categorized as low in terms of future recreation development (DWR 2004f). Given the sensitive habitat constraints within the OWA, spatial capacity is considered to be at capacity and a limiting factor at the existing camping area.
Facility Capacity
As a separate unit, recreational use of the OWA primitive camping area was not specifically investigated during Relicensing Study R-9 – Existing Recreation Use.Because the OWA has only semi-developed recreation sites, recreational use was observed at various access points and summarized for the area as a whole. On an annual basis, public use of the OWA accounted for nearly 320,000 RD, with approximately 60 percent of use occurring during the recreation season and 40 percent during the off-season. During the recreation season, recreational use accounted for more than 191,000 RD, with approximately 58 percent of this use attributable to weekday use.
Field observations indicate that less than 1 percent of observed visitors were camping in the OWA (DWR 2004b); visitor survey results also point to the fact that camping is not a very popular primary activity in the OWA. According to completed visitor surveys, tent and RV camping each account for less than 2 percent of responses regarding the primary activity of visitors to the OWA (DWR 2004e). Given this very low level of camping participation within the OWA, the camping area is below facility capacity.Correspondingly, facility capacity is not considered a limiting factor at this time, nor will it likely be a limiting factor in the future.
Social Capacity
Perceived crowding in the OWA was not investigated on a site-by-site basis (DWR 2004e). Instead, a mean perceived crowding score was developed for all recreation areas within the OWA. The annual mean perceived crowding score for the OWA was approximately 5.2; during the recreation season, the score was slightly higher at about 5.4. These crowding scores are some of the highest in the study area and indicate that visitors to the OWA feel moderately crowded. Based on these higher crowding scores, recreation sites within the OWA are considered to be at their social capacity. As such, social capacity is considered a limiting factor at recreation sites within the OWA.

Final Recreation Carrying Capacity (R-8) Oroville Facilities P-2100 Relicensing
Proposed Final Report – For Distribution to Collaborative
Oroville Facilities Relicensing Team 5-21 June 2004
Overall Site Capacity Conclusion
Overall, existing recreational use at the OWA primitive camping area is considered to be at capacity. Ecological, spatial, and social capacities are currently considered to be at capacity. While all three of these capacity indicators are considered limiting factors, ecological capacity is likely the primary limiting factor based on the management priorities of the OWA, which emphasize sensitive species and habitat preservation.Given existing management conditions and capacity constraints, recreation capacity-related decisions at the OWA, including the camping area, should be regarded as a high management priority.
5.2.2.5 North Thermalito Forebay RV “En Route” Campground
The North Thermalito Forebay RV “En Route” Campground is located at the northeastern end of the Thermalito Forebay, near SR 70, within the North Thermalito Forebay BR/DUA developed recreation site (Figure 1.2-1). The campground portion of the site contains 15 “en route” (self-contained) RV parking spaces with no hookups.The recreation carrying capacity indicator variables were generally investigated for the entire North Thermalito Forebay recreation site, not just the RV “En Route” Campground. Additionally, very little use at the North Thermalito Forebay developed recreation site is attributable to the RV “En Route” Campground portion of the site.Camping accounted for less than 1 percent of observed use and is estimated to have accounted for only approximately 40 RD annually at this site (DWR 2004b). According to completed visitor surveys, RV camping accounted for less than 2 percent of responses regarding the primary activity of visitors to the North Thermalito Forebay developed recreation site (DWR 2004e). As such, a complete discussion of recreation capacity indicator variables at this site can be found in Section 5.5.2.5 (North Thermalito Forebay BR/DUA).
5.2.2.6 Spillway RV “En Route” Campground
The Spillway RV “En Route” Campground is located adjacent to the Oroville Dam spillway (Figure 1.2-1). The campground consists of 40 parking spaces that are designated as RV campsites. These parking spaces are located in the upper parking lot of the Spillway BR/DUA (Section 5.5.2.7). There are no hook-ups at these RV campsites. Similar to the North Thermalito Forebay RV “En Route” Campground, carrying capacity was generally investigated for the entire Spillway recreation site, not just the RV “En Route” Campground portion of the site. Additionally, very little use at the Spillway developed recreation site is attributable to the RV “En Route” Campground portion of the site. Camping accounted for less than 1 percent of observed use at this site and is estimated to have accounted for only approximately 90 RD annually (DWR 2004b). According to completed visitor surveys, RV camping accounted for less than 1 percent of responses regarding the primary activity of visitors to the Spillway Recreation

Final Recreation Carrying Capacity (R-8) Oroville Facilities P-2100 Relicensing
Proposed Final Report – For Distribution to Collaborative
Oroville Facilities Relicensing Team 5-22 June 2004
Area (DWR 2004e). As such, a complete discussion of capacity at this site can be found in Section 5.5.2.7 (Spillway BR/DUA).
5.3 STUDY AREA BOAT-IN AND FLOATING CAMPSITE CAPACITY SUMMARY
In this section, the overall capacity of boat-in and floating campsites in the study area is presented first, followed by the discussion of site-specific recreation carrying capacity.BICs and floating campsites are only available at the Lake Oroville resource area, and not at other Project reservoirs.
5.3.1 Overall Capacity Summary of Boat-In and Floating Campsites
The overall capacity of boat-in and floating campsites in the study area is summarized in Table 5.3-1.
5.3.1.1 Ecological Capacity
In general, recreational use of BICs and floating campsites does not appear to have a widespread impact on the ecological integrity of the study area. However, while most observed ecological concerns tended to be minor and localized, the quantity and severity of several observed impacts commonly observed during the field observations lead many of the BICs to be characterized as approaching their ecological capacity.Common recreation-related ecological impacts observed during field observations included soil erosion, soil compaction, trash accumulation, and user-defined trails for BICs. Three of the BICs are characterized as approaching their ecological capacity, but ecological capacity is not a limiting factor at these sites at this time (Table 5.3-1).Foreman Creek BICs and the floating campsites are both below their ecological capacity.
Overall, ecological capacity is considered to be approaching capacity at the boat-in campsites and floating campsites, but is not considered a limiting factor at this time. Ecological capacity is considered to be approaching capacity because of the number of boat-in campsites that are individually described as approaching their ecological capacity. However, if use of study area recreation facilities increases in the future, additional potential recreation-related ecological impacts could occur.
5.3.1.2 Spatial Capacity
Overall, spatial capacity is considered to be below capacity and not a limiting factor at the BICs and floating campsites in the study area. Individually, spatial capacity is considered below capacity at all of the BICs and floating campsites except at the Craig Saddle BICs (Table 5.3-1). Most of the existing BICs could either be expanded and/or redesigned to include additional site facilities in order to accommodate increased recreational use. Additionally, as noted in Relicensing Study R-15 – Recreation

Fin
al R
ecre
atio
n C
arr
yin
g C
apa
city (
R-8
) O
rovill
e F
acili
ties P
-2100 R
elic
ensin
g
Pro
posed
Fin
al R
epo
rt –
Fo
r D
istr
ibu
tio
n to
Co
llab
ora
tive
Oro
vill
e F
acili
ties R
elic
ensin
g T
eam
5-2
3
June 2
004
Ta
ble
5.3
-1.
Su
mm
ary
of
stu
dy a
rea
bo
at-
in c
am
pg
rou
nd
an
d f
loa
tin
g c
am
ps
ite
s c
ap
ac
ity.
Facilit
y
Eco
log
ical
Ca
pac
ity
1S
pati
al
Ca
pac
ity
1F
acilit
y
Ca
pac
ity
1S
ocia
lC
ap
ac
ity
1O
vera
ll C
ap
acit
y
Su
mm
ary
2O
vera
ll C
ap
acit
y
Pri
ori
ty3
Su
bs
titu
te
Facilit
y(i
es)4
Blo
om
er
Are
a B
ICs
5A
ppro
achin
g
Belo
w
Belo
w
Be
low
B
elo
w
Lo
w
Goat R
anch
Fo
rem
an
Cre
ek
Cra
ig S
ad
dle
BIC
s
Ap
pro
ach
ing
Ap
pro
ach
ing
Belo
w
Be
low
A
pp
roa
ch
ing
Mo
dera
te
-
Fore
man C
reek B
ICs
Belo
w
Belo
w
Belo
w
Belo
w
Belo
w
Low
B
loom
er
Are
a B
ICs
Go
at R
an
ch
Are
a B
ICs
Ap
pro
ach
ing
Be
low
B
elo
w
Belo
w
Belo
w
Low
B
loom
er
Are
a B
ICs
Flo
atin
g C
am
psites
Be
low
B
elo
w
At
NA
A
pp
roa
ch
ing
Mo
dera
te
-
Overa
ll S
tudy A
rea B
IC
an
d F
loa
ting
Ca
mpsites
Sum
mary
Appro
achin
g
Belo
w
Belo
w
Be
low
B
elo
w
Lo
w
NA
1B
old
type in t
his
colu
mn indic
ate
s t
hat
this
capacity t
ype is c
onsid
ere
d a
lim
itin
g f
acto
r fo
r th
is f
acili
ty.
2In
dic
ate
s w
heth
er
overa
ll re
cre
ational use is c
onsid
ere
d t
o b
e b
elo
w,
appro
achin
g,
at, o
r exceedin
g c
apacity a
t th
is t
ime b
ased o
n a
synth
esis
of
the r
esults f
or
each
capacity t
ype.
3In
dic
ate
s w
heth
er
the o
vera
ll capacity is c
onsid
ere
d t
o b
e a
low
, m
od
era
te,
or
hig
h p
riori
ty a
t th
is t
ime f
or
managem
ent
decis
ion-m
akin
g.
4In
dic
ate
s w
hic
h (
if a
ny)
facili
ty m
ay a
ct
as a
substitu
te f
acili
ty t
hat
may b
e a
ble
to a
bsorb
recre
ational use t
o h
elp
ease o
vera
ll capacity c
oncern
s.
5T
he B
loo
mer
Are
a B
ICs inclu
de B
loo
mer
Cove,
Blo
om
er
Knoll,
Blo
om
er
Poin
t, a
nd B
loo
mer
Gro
up.
Sourc
e:
ED
AW
2004.
Final Recreation Carrying Capacity (R-8) Oroville Facilities P-2100 Relicensing
Proposed Final Report – For Distribution to Collaborative
Oroville Facilities Relicensing Team 5-24 June 2004
Suitability Analysis, shoreline areas around Lake Oroville that may be suitable for dispersed recreation use areas could also likely accommodate new BICs (depending on reservoir pool elevations). Specific shoreline areas that may be suitable for new BICs include areas along the western shoreline of the lower North Fork portion of the reservoir and shoreline areas in the vicinity of the Kelly Ridge area. Also, several locations around Lake Oroville could likely accommodate new floating campsites, though the logistics of anchoring and other siting concerns need to be reviewed on a site-by-site basis.
5.3.1.3 Facility Capacity
All of the BICs in the study area are considered to be below their facility capacity (Table 5.3-1). As reported in Relicensing Study R-7 – Reservoir Boating, recreation use at the Lake Oroville BICs was low during the 12-month data collection period. During recreation season weekdays, cumulative percent occupancy at the BICs was less than 2 percent of capacity; percent occupancy was only slightly higher (3 percent) during recreation season weekends. Despite having low levels of use, approximately 45 percent of survey respondents at Lake Oroville felt that there were too few BICs (DWR 2004e).
Unlike the BICs, the floating campsites in the study area are considered to be at their facility capacity (Table 5.3-1). Percent occupancy during recreation season weekdays and weekends was approximately 74 percent and 79 percent of capacity respectively at these sites (DWR 2004a). Each of these occupancy rates is high and indicates that the floating campsites receive a considerable amount of use, especially during the recreation season. Additionally, nearly 50 percent of survey respondents at Lake Oroville felt that there were too few floating campsites. Demand for floating campsites in areas currently without these facilities was also high, especially at the Thermalito Afterbay, where nearly 60 percent of survey respondents replied that there were too few floating campsites; however, potential new floating campsites are likely not appropriate in these areas (DWR 2004e). The popularity of the floating campsites is expected to continue in the future.
Based solely on percent occupancy, overall facility capacity for BICs would be considered below capacity; however, pool level significantly influences access to the boat-in campsites and percent occupancy is currently high at the floating campsites.These facility limitations are existing constraints to facility capacity and will likely continue to be in the future. As such, while cumulative percent occupancy is considered low at the BICs, facility capacity is considered to be a limiting factor at this time.
5.3.1.4 Social Capacity
Overall, the BICs are considered to be below their social capacity (Table 5.3-1). On both an annual and recreation season basis, the mean perceived crowding score for all

Final Recreation Carrying Capacity (R-8) Oroville Facilities P-2100 Relicensing
Proposed Final Report – For Distribution to Collaborative
Oroville Facilities Relicensing Team 5-25 June 2004
of the BICs was 3.0 on a 9-point scale. This score is relatively low and indicates that visitors to these sites only feel slightly crowded. Social capacity was not investigated at the floating campsites in the study area and is likely not a practical measure of capacity at these sites (DWR 2004e). Given the low aggregate crowding scores at the BICs in the study area, overall social capacity is not a limiting factor at this time.
5.3.1.5 Overall Capacity Conclusion
Overall, facility capacity is the primary limiting factor at the BICs and floating campsites in the study area (Table 5.3-1). While all of the capacity indicator variables, except ecological, were below capacity, existing access constraints at the BICs and high occupancy rates at the floating campsites are considered facility capacity limitations. However, facility capacity-related decisions should be regarded as a low management priority due to the complexity of factors that contribute to facility access constraints at the BICs and the spatial opportunity for new floating campsites in the study area.
While many of the BICs have substitute sites that could potentially relieve capacity concerns at specific sites, all of the sites share the same facility access constraint (Table 5.3-1). As a result, the substitute sites do not ease capacity constraints at specific BICs at this time. Additionally, the floating campsites do not have substitute sites on other reservoirs.
5.3.2 Site-Specific Capacity of Boat-In and Floating Campsites
BICs at Lake Oroville, the only resource area with this type of facility, are most usable at higher pool levels; at lower pool levels, these sites are typically an inconvenient, upslope distance from the water. When pool levels are lower, accessing the BICs sometimes requires walking up steep hillsides, as there are no developed trails or pathways to these sites. As a result, BICs around the Lake Oroville shoreline generally receive few visitors when the reservoir is below 850 feet above msl. The floating campsites do not experience this access concern.
Recreation facilities discussed in this section include:
Bloomer Area BICs;
Craig Saddle BICs;
Foreman Creek BICs;
Goat Ranch Area BICs; and
Floating campsites.
5.3.2.1 Bloomer Area Boat-in Campsites
The Bloomer Area BICs are located on the Lower North Fork arm of Lake Oroville (Figure 1.2-1). The BICs in the Bloomer Area include Bloomer Cove, Bloomer Knoll,

Final Recreation Carrying Capacity (R-8) Oroville Facilities P-2100 Relicensing
Proposed Final Report – For Distribution to Collaborative
Oroville Facilities Relicensing Team 5-26 June 2004
Bloomer Point, and Bloomer Group Campsite. All four of these BICs were investigated in aggregate due to their proximity to each other. The Bloomer Cove BICs consist of five individual campsites, each with a picnic table and fire ring with a cooking grill. The site has many shade trees, two vault toilets, and six trash receptacles. The Bloomer Knoll BICs have six individual campsites, each with a picnic table and fire ring with cooking grill. The site also has shade trees, two vault toilets, and four trash receptacles.The Bloomer Point BICs have 25 individual campsites, each with a picnic tables and fire ring with a cooking grill. The site also has shade trees, 4 vault toilet buildings, 14 trash receptacles, and a self-registration pay station. The final Bloomer Area BIC is the Group Campsite, which consists of a large group campsite that can accommodate approximately 75 people, as well as several group barbecue cooking grills, shade trees, 2 vault toilets, and 9 trash receptacles.
Ecological Capacity
During both the winter and summer field observations, four ecological variables (soil erosion, soil compaction, trash accumulation, and user-defined trails) were described as a moderate concern at all of the Bloomer Area BICs. All of the other ecological variables were described as low concerns during both field observations. Overall, the sites’ levels of ecological impact are characterized as being of moderate concern; therefore, ecological capacity is considered to be approaching capacity, but is not a limiting factor at this time.
Spatial Capacity
The potential exists to physically expand all of the Bloomer Area BICs. Adjacent areas are well suited to additional recreation development and could be used to increase spatial capacity at this site. Additionally, most adjacent lands are categorized as high to moderate suitability in terms of future recreation development (DWR 2004f). A few new facilities could also be added to these sites; however, adjacent areas are likely better suited for accommodating new facilities in order to increase use/facility density.
Overall, spatial capacity is considered to be below capacity at the Bloomer Area BICs.The potential exists to expand the physical area of the site into adjacent areas and to add some additional facilities to the existing site. As such, spatial capacity is not considered a limiting factor at this time at these sites.
Facility Capacity
As reported in Relicensing Study R-7 – Reservoir Boating, recreation use at the Lake Oroville BICs was low during the 12-month data collection period; for most of the data collection period, the reservoir pool level was too low to provide convenient access.While recorded use was higher during June 2003 when the reservoir pool level was
Final Recreation Carrying Capacity (R-8) Oroville Facilities P-2100 Relicensing
Proposed Final Report – For Distribution to Collaborative
Oroville Facilities Relicensing Team 5-27 June 2004
higher, overall use was still low. Because use was so low, all of the BICs were considered in aggregate in terms of percent occupancy.
During the recreation season weekday, percent occupancy at the BICs was less than 2 percent of capacity, and only slightly higher (3 percent) during weekends (DWR 2004a).Weekday and weekend capacity are extremely low at the BICs in the study area.Based solely on percent occupancy, facility capacity would be considered below capacity at the BICs; however, variable pool level significantly influences access to these sites. This facility limitation is an existing constraint to facility capacity and will likely continue to be in the future. As such, facility capacity at the BICs is considered to be below capacity, but is considered to be a limiting factor at this time because of facility access constraints.
Social Capacity
All of the BICs receive a very low amount of use (DWR 2004a); as a result, an insufficient number of completed surveys were obtained from each individual BIC to draw statistically valid results on a site-by-site basis (DWR 2004e). All of the BICs were thus considered in aggregate in terms of social capacity. On both an annual and recreation season basis, the mean perceived crowding score for the BICs was 3.0. This score is relatively low and indicates that visitors to these sites only feel slightly crowded.Social capacity is considered to be below capacity based on this perceived crowding score. Additionally, social capacity is not considered a limiting factor at this time.
Overall Site Capacity Conclusion
Overall, existing recreational use at the Bloomer Area BICs is considered to be below capacity. Both spatial and social capacities are considered below capacity, while ecological capacity is considered to be approaching capacity at this site. Currently, the primary limiting factor is facility capacity, even though this capacity type is considered below capacity. While use of these sites is low, access to the sites is a major constraint during lower pool levels (under 850 feet above msl). However, improving access to these sites (and thereby minimizing this constraint) would likely require changes in reservoir operations (pool level). Capacity-related decisions, including minimizing this facility capacity constraint, at the Bloomer Area BICs should thus be regarded as a low management priority at this time.
5.3.2.2 Craig Saddle Boat-in Campsites
The Craig Saddle BICs are located between the Middle and South Fork arms of Lake Oroville (Figure 1.2-1). The site has 18 individual campsites, each with a picnic table and fire ring with a cooking grill. The site also has shade trees, 4 vault toilet buildings, 19 trash receptacles, potable water, and a self-registration pay station.

Final Recreation Carrying Capacity (R-8) Oroville Facilities P-2100 Relicensing
Proposed Final Report – For Distribution to Collaborative
Oroville Facilities Relicensing Team 5-28 June 2004
Ecological Capacity
During the winter field observation, three ecological variables (soil erosion, soil compaction, and user-defined trails) were described as being of moderate concern at Craig Saddle BICs; all of the other ecological variables were characterized as low concerns. During the summer field observation, five ecological variables (soil erosion, soil compaction, trash accumulation, sanitation issues, and user-defined trails) were described as moderate concerns, while the other ecological variables remained low concerns. Overall, the site’s level of ecological impact is characterized as being of moderate concern; therefore, ecological capacity is considered to be approaching capacity, but is not a limiting factor at this time.
Spatial Capacity
The potential exists to physically expand the Craig Saddle BICs. Based on field observations, adjacent areas are likely suitable for expansion. However, most adjacent lands are categorized as low suitability in terms of future recreation development (DWR 2004f). These adjacent lands are categorized as low suitability due to sensitive habitat constraints. A few new facilities could also be added to this site; however, adjacent areas are probably better physically suited to accommodating new facilities.
Overall, spatial capacity is considered to be approaching capacity at this site. The potential exists to expand the physical area of the site into adjacent areas, though sensitive resource concerns should be fully investigated prior to potential future site expansion. Spatial capacity, however, is not considered a limiting factor at this time at the Craig Saddle BICs.
Facility Capacity
As described in the Facility Capacity discussion at the Bloomer Area BICs, facility capacity at all of the BICs in the study area was considered in aggregate because of low use levels. Similar to the Bloomer Area BICs, facility capacity at this site is considered to be below capacity. However, despite low percent occupancy, facility capacity is considered a limiting factor at this time because of facility access constraints caused by frequent low reservoir pool levels.
Social Capacity
As described in the Social Capacity discussion at the Bloomer Area BICs, social capacity at BICs in the study area was considered in aggregate due to low use. On both an annual and recreation season basis, the mean perceived crowding score for BICs was 3.0 (DWR 2004e). Based on this low score, all of the BICs in the study area are considered to be below their social capacity. Additionally, social capacity is not considered a limiting factor.

Final Recreation Carrying Capacity (R-8) Oroville Facilities P-2100 Relicensing
Proposed Final Report – For Distribution to Collaborative
Oroville Facilities Relicensing Team 5-29 June 2004
Overall Site Capacity Conclusion
Overall, existing recreational use at the Craig Saddle BICs is considered to be approaching capacity. Both ecological and spatial capacities are considered to be approaching capacity. Facility and social capacities, however, are below capacity at this site. Currently, the primary limiting factor is facility capacity, even though this capacity type is considered below capacity. While use of this area is low, access to the site is a major constraint during lower pool levels (under 850 feet above msl). However, improving access to this site (and thereby minimizing this constraint) would likely require changes in reservoir pool level operations. Considering the capacity indicators in aggregate, capacity-related decisions at the Craig Saddle BICs should be regarded as a moderate management priority. However, sensitive resources must also be considered at this site, which may limit or preclude its use in the future.
5.3.2.3 Foreman Creek Boat-in Campsites
The Foreman Creek BICs are located on the northern shoreline of the main basin area of Lake Oroville (Figure 1.2-1). The site consists of 26 individual campsites. Each with a picnic table and fire pit with a cooking grill. Other site facilities include shade trees, 4 vault toilet buildings, 16 trash receptacles, potable water, a gray water sump, and a self-registration pay station.
Ecological Capacity
During the winter field observation and the summer field observation, three ecological variables (soil erosion, soil compaction, and water/shoreline impact) were described as being of moderate concern at the Foreman Creek BICs. All of the other ecological variables were described as being of low concern during both field observations.Overall, the site’s level of ecological impact is characterized as being of low concern.Ecological capacity at the Foreman Creek BICs is considered to be below capacity and not a limiting factor.
Spatial Capacity
At the Foreman Creek BICs, adjacent areas appear to be well suited for additional recreation development and could potentially be used to increase spatial capacity at this site. Additionally, most adjacent lands to this site are categorized as high to moderate suitability in terms of future recreation development, though an area to the north of the site is categorized as low suitability (DWR 2004f). A few new facilities could also be added to this site; however, adjacent areas are likely better suited to accommodating new facilities.
Final Recreation Carrying Capacity (R-8) Oroville Facilities P-2100 Relicensing
Proposed Final Report – For Distribution to Collaborative
Oroville Facilities Relicensing Team 5-30 June 2004
Overall, spatial capacity is considered to be below capacity at this site. The potential exists to expand the physical area of the site into adjacent areas and to add some additional facilities to the existing site. As such, spatial capacity is not considered a limiting factor at this time at the Foreman Creek BICs.
Facility Capacity
As described in the Facility Capacity section of the Bloomer Area BICs, facility capacity at all of the BICs in the study area was considered in aggregate because of low use levels. Similar to the Bloomer Area BICs, facility capacity at this site is considered to be below capacity. However, despite low percent occupancy, facility capacity is considered a limiting factor at this time because of facility access constraints caused by frequent low reservoir pool levels.
Social Capacity
As described in the Social Capacity section of the Bloomer Area BICs, social capacity at BICs in the study area was considered in aggregate due to low use. On both an annual and recreation season basis, the mean perceived crowding score for BICs was 3.0 (DWR 2004e). Based on this low score, all of the BICs in the study area are considered to be below their social capacity. Additionally, social capacity is not considered a limiting factor.
Overall Site Capacity Conclusion
Overall, existing recreational use at the Foreman Creek BICs is considered to be below capacity. All of the capacity indicator variables at this site are considered below capacity at this time. Currently, the primary limiting factor is facility capacity, even though this capacity type is considered below capacity. Similar to the other BICs in the study area, while use of this site is low, access to the site is a major constraint during lower pool levels (under 850 feet above msl). Improving access to this site (and thereby minimizing this constraint) would likely require changes in reservoir pool level operations. As a result, capacity-related decisions, including minimizing this facility capacity constraint, at the Foreman Creek BICs should be regarded as a low management priority; however, cultural resource concerns in the vicinity of this site may limit future use and/or expansion, and should be investigated prior to potential new recreation development.
5.3.2.4 Goat Ranch Boat-in Campsites
The Goat Ranch BICs are located on the North Fork arm of Lake Oroville, north of the Bloomer Cove Boat-in campgrounds near where the West Branch arm splits from the Lower North Fork arm of the reservoir (Figure 1.2-1). The site has five individual

Final Recreation Carrying Capacity (R-8) Oroville Facilities P-2100 Relicensing
Proposed Final Report – For Distribution to Collaborative
Oroville Facilities Relicensing Team 5-31 June 2004
campsites, each with a picnic table and fire pit with a cooking grill. The site also has shade trees, 4 vault toilet buildings, and five trash receptacles.
Ecological Capacity
At the Goat Ranch BICs, soil erosion, soil compaction, and trash accumulation were considered moderate concerns during both the winter and summer field observations; all of the other ecological variables were described as low concerns. Overall, the site’s level of ecological impact is characterized as being of moderate concern. Ecological capacity at the Goat Ranch BICs is considered to be approaching capacity based on the moderate level of concern regarding ecological impacts at the site, but is not considered a limiting factor at this time.
Spatial Capacity
The potential exists to physically expand the Goat Ranch BICs. Adjacent areas on the same point of land as this site appear to be usable for potential site expansion. Additionally, most adjacent lands are categorized as moderate suitability in terms of future recreation development (DWR 2004f). A few new facilities could also be added to this site; however, adjacent areas are better suited to accommodating new facilities.
Overall, spatial capacity is considered to be below capacity at this site. The potential exists to expand the physical area of the site into adjacent areas and to add some additional facilities to the existing site. As such, spatial capacity is not considered a limiting factor at this time at the Goat Ranch BICs.
Facility Capacity
As described in the Facility Capacity section of the Bloomer Area BICs, facility capacity at all of the BICs in the study area was considered in aggregate because of low use levels. Similar to the Bloomer Area BICs, facility capacity at this site is considered to be below capacity. However, despite low percent occupancy, facility capacity is considered a limiting factor at this time because of facility access constraints caused by frequent low reservoir pool levels.
Social Capacity
As described in the Social Capacity section of the Bloomer Area BICs, social capacity at BICs in the study area was considered in aggregate due to low use. On both an annual and recreation season basis, the mean perceived crowding score for BICs was 3.0 (DWR 2004e). Based on this low score, all of the BICs in the study area are considered to be below their social capacity. Additionally, social capacity is not considered a limiting factor.

Final Recreation Carrying Capacity (R-8) Oroville Facilities P-2100 Relicensing
Proposed Final Report – For Distribution to Collaborative
Oroville Facilities Relicensing Team 5-32 June 2004
Overall Site Capacity Conclusion
Overall, existing recreational use at the Goat Ranch BICs is considered to be below capacity. All of the capacity indicator variables at this site, except ecological capacity, are considered below capacity at this time. Ecological capacity is considered to be approaching capacity. Similar to the other BICs in the study area, currently the primary limiting factor at this site is facility capacity, even though this capacity type is considered below capacity. While use of this site is low, access to the site is a major constraint during lower pool levels (under 850 feet above msl). However, improving access to this site (and thereby minimizing this constraint) would likely require changes in reservoir operations (pool level). Capacity-related decisions at the Goat Ranch BICs, including minimizing this facility capacity constraint, should thus be regarded as a low management priority.
5.3.2.5 Floating Campsites
There are 10 floating campsites anchored in several areas of Lake Oroville, the only resource area with this type of facility. Each floating campsite consists of a two-story structure that can accommodate up to 15 people. The floating campsites include a living space and other amenities, such as a gas cooking grill, camp table, sink, restroom, shelves, storage room, cabinets, and a sleeping area. Visitors to the floating campsites must bring potable water, although sink water is provided (DPR 2000a). The floating campsites may be used by reservation only.
Ecological Capacity
The floating campsites are fully developed, hardened recreation facilities that probably contribute to reduced recreation-related ecological impacts at shoreline areas around the reservoir, by transferring use to a facility that is better able to absorb potential impacts. As such, the site’s overall level of ecological impact is characterized as being of low concern. Ecological capacity at the floating campsites is considered to be below capacity based on the low level of concern regarding ecological impacts at the site. It should be noted that for boat-in sites, ecological capacity at the floating campsites in the study area was generally not investigated during Relicensing Study R-11 – Recreationand Public Use Impact Assessment. Additionally, water quality impacts resulting from boating use were beyond the scope of this study. Ecological capacity was not investigated because of the lack of natural setting features (e.g., soil, vegetation, etc.) that are common at other land-based recreation facilities in the study area.
Spatial Capacity
Spatial capacity at the floating campsites is less feasible to measure than at land-based developed recreation sites. While it is not practical to expand the existing floating campsites, there are some locations around the reservoir that could potentially
Final Recreation Carrying Capacity (R-8) Oroville Facilities P-2100 Relicensing
Proposed Final Report – For Distribution to Collaborative
Oroville Facilities Relicensing Team 5-33 June 2004
accommodate new floating campsites. However, the placement and anchoring of floating campsites is a complex undertaking that involves consideration of bathymetry, prevailing winds, and other physical and engineering parameters. Nevertheless, the spatial capacity of the floating campsites is considered to be below capacity and not a limiting factor at this time.
Facility Capacity
As reported in Relicensing Study R-7 – Reservoir Boating, the floating campsites received relatively high levels of use during the recreation season, with particularly high occupancy rates during the summer months of June, July, and August; percent occupancy of the floating campsites during weekdays and weekends for this period was approximately 74 percent and 79 percent of capacity respectively. Each of these occupancy rates is high and indicates that the floating campsites receive a considerable amount of use, especially during the recreation season. The recreation season weekday percent occupancy is considered to be exceeding capacity, while the weekend percent occupancy is considered to be at capacity. The popularity of the floating campsites is expected to continue in the future. As such, facility capacity is considered a limiting factor at this time.
Social Capacity
Social capacity was not investigated at the floating campsites in the study area (DWR 2004e). Measuring social capacity at floating campsites is likely not a practical measure of capacity, based on the type of use these sites receive. The floating campsites act essentially as a group campsite that can only be used by one group at a time. Because multiple groups cannot use a floating campsite at the same time, there is no opportunity for members of a group to perceive crowding from other groups (it is assumed that all members of a group want to be with the group they share the floating campsite with).As a result, the measurement of social capacity is not applicable to floating campsites.
Overall Site Capacity Conclusion
Overall, existing recreational use of the floating campsites in the study area is considered to be approaching capacity. Facility capacity is currently considered to be at capacity based on high levels of percent occupancy, while both ecological and spatial capacities are considered to be below capacity at these sites. Social capacity was not investigated at the floating campsites and may not be a practical capacity indicator for future monitoring. Given the existing high occupancy rates at the floating campsites, facility capacity is considered a limiting factor at this time and will likely continue to be a limiting factor in the future. However, facility capacity constraints may potentially be reduced in the future by providing additional floating campsites in the study area. This conclusion should be qualified by recognition that floating campsites are inherently low in number (10), and even a doubling of sites (to 20, for example) is likely to generate

Final Recreation Carrying Capacity (R-8) Oroville Facilities P-2100 Relicensing
Proposed Final Report – For Distribution to Collaborative
Oroville Facilities Relicensing Team 5-34 June 2004
use levels consistently close to capacity, based on these facilities’ apparent popularity. It should also be noted that use of the Lake Oroville floating campsites was lower in the mid-1990s, when fees for use were higher. Considering the capacity indicators in aggregate, capacity-related decisions at the floating campsites should be regarded as a moderate management priority.
5.4 STUDY AREA DAY USE AREA CAPACITY SUMMARY
In this section, the overall capacity of day use areas in the study area is presented first, followed by the discussion of site-specific recreation carrying capacity. DUAs in this section include only those sites not associated with a boat ramp or those sites with specialized uses. DUAs associated with boat ramps are discussed separately in Section 5.5.
5.4.1 Overall Capacity Summary of Day Use Areas
The overall capacity of day use areas in the study area is summarized in Table 5.4-1.
5.4.1.1 Ecological Capacity
In general, recreational use of developed DUAs does not appear to have a widespread impact on the ecological integrity of the study area. Most observed ecological concerns tended to be minor and localized (e.g., soil erosion, trash accumulation, user-defined trails, etc.). Ecological capacity is not a limiting factor at any of the DUAs in the study area except at the Clay Pit SVRA and Rabe Road Shooting Range (Table 5.4-1).Observed recreation-related ecological impacts at these two facilities were more significant than those observed at other recreation facilities. Ecological concerns at many of the developed recreation facilities in the study area are likely minimized by the presence of hardened facilities, routine maintenance, and on-site management, among other factors.
Overall, ecological capacity is considered to be below capacity at this time and is not considered a limiting factor at DUAs because of the relatively minor recreation-related ecological impacts observed at most of the facilities. Potential ecological impacts should continue to be monitored, however, especially as use of study area increases in the future. Additionally, existing ecological capacity-related management decisions should be considered a priority at both the Clay Pit SVRA and the Rabe Road Shooting Range.
5.4.1.2 Spatial Capacity
Overall, spatial capacity is considered to be at capacity and a limiting factor at the DUAs in the study area. Individually, spatial capacity is mixed on a site-by-site basis and is considered to be exceeding capacity at two sites, at capacity at four sites, approaching

Fin
al R
ecre
atio
n C
arr
yin
g C
apa
city (
R-8
) O
rovill
e F
acili
ties P
-2100 R
elic
ensin
g
Pro
posed
Fin
al R
epo
rt –
Fo
r D
istr
ibu
tio
n to
Co
llab
ora
tive
Oro
vill
e F
acili
ties R
elic
ensin
g T
eam
5-3
5
June 2
004
Tab
le 5
.4-1
. S
um
mary
of
stu
dy a
rea d
ay u
se a
rea c
ap
acit
y.
Facilit
y
Eco
log
ical
Ca
pac
ity
1S
pati
al
Ca
pac
ity
1F
acilit
y
Ca
pac
ity
1S
ocia
lC
ap
ac
ity
1O
vera
ll C
ap
acit
y
Su
mm
ary
2O
vera
ll C
ap
acit
y
Pri
ori
ty3
Su
bs
titu
te
Facilit
y(i
es)4
Lake O
rovill
e V
isitors
Cente
r B
elo
w
At
Ap
pro
ac
hin
g
Be
low
A
pp
roa
ch
ing
Mo
dera
te
-
Feath
er
Riv
er
Fis
h H
atc
hery
B
elo
w
Exceed
ing
Ap
pro
ach
ing
Ap
pro
ach
ing
Ap
pro
ach
ing
Mo
dera
te
-
Oro
vill
e D
am
DU
A a
nd
Ove
rlo
ok
Be
low
Exceed
ing
B
elo
w
Be
low
A
pp
roa
ch
ing
Mo
dera
te
-
Flo
atin
g R
estr
oo
ms
Be
low
B
elo
w
Belo
w
NA
B
elo
w
Lo
w
-
Div
ers
ion P
ool D
UA
B
elo
w
At
Be
low
B
elo
w
Be
low
L
ow
-
Aquatic C
ente
r5-
- -
- -
- -
Mo
de
l A
ircra
ft F
lyin
g A
rea
B
elo
w
Ap
pro
ach
ing
Be
low
B
elo
w
Be
low
L
ow
-
Cla
y P
it S
VR
A
At
At
Belo
w
Belo
w
Appro
achin
g
Modera
te
-
Ra
be
Roa
d S
ho
otin
g R
ange
A
t A
t B
elo
w
Belo
w
Appro
achin
g
Modera
te
-
Riv
erb
en
d P
ark
B
elo
w
Ap
pro
ach
ing
Be
low
B
elo
w
Be
low
L
ow
-
Overa
ll S
tudy A
rea D
UA
S
um
mary
Be
low
At
Belo
w
Belo
w
Appro
achin
g
Modera
te
NA
1B
old
type in t
his
colu
mn indic
ate
s t
hat
this
capacity t
ype is c
onsid
ere
d a
lim
itin
g f
acto
r fo
r th
is f
acili
ty.
2In
dic
ate
s w
heth
er
overa
ll re
cre
ational use is c
onsid
ere
d t
o b
e b
elo
w,
appro
achin
g,
at, o
r exceedin
g c
apacity a
t th
is t
ime b
ase
d o
n a
synth
esis
of
the r
esults f
or
each c
apacity
type.
3In
dic
ate
s w
heth
er
the o
vera
ll capacity is c
onsid
ere
d t
o b
e a
low
, m
od
era
te,
or
hig
h p
riori
ty a
t th
is t
ime f
or
managem
ent
decis
ion-m
akin
g.
4In
dic
ate
s w
hic
h (
if a
ny)
facili
ty m
ay a
ct
as a
substitu
te f
acili
ty t
hat
may b
e a
ble
to a
bsorb
recre
ational use t
o h
elp
ease o
vera
ll capacity c
oncern
s.
5R
ecre
ation c
apacity w
as n
ot
investigate
d s
epara
tely
at
the A
quatic C
ente
r.
Inste
ad,
it w
as inclu
ded in t
he d
iscussio
n o
f th
e N
ort
h T
herm
alit
o F
ore
bay B
R/D
UA
. S
ourc
e:
ED
AW
2004.

Final Recreation Carrying Capacity (R-8) Oroville Facilities P-2100 Relicensing
Proposed Final Report – For Distribution to Collaborative
Oroville Facilities Relicensing Team 5-36 June 2004
capacity at two sites, and below capacity at only one site (Table 5.4-1). Also, the floating restrooms are the only sites in this site-type category that are below their spatial capacity because multiple locations around the reservoir surface area could likely accommodate additional floating restrooms, if demand warrants their placement.
In general, spatial capacity is a limiting factor at DUAs in the study area due to the lack of adjacent areas that could potentially be used to expand the existing footprint of these sites. Additionally, many of these sites are considered built-out and could not accommodate new site facilities in order to increase use density. However, some areas identified in the Relicensing Study R-15 – Recreation Suitability Analysis may be suitable for a new day use area or other recreational facility development in the future, if demand warrants their development.
5.4.1.3 Facility Capacity
In general, the DUAs included in this analysis are considered below their facility capacity (Table 5.4-1). Recreation season use at these sites was generally low, though many of the sites do experience brief periods of heavier use, especially during special events. Only two sites (Lake Oroville Visitors Center and Feather River Fish Hatchery) are currently considered to be approaching their facility capacity. Additionally, facility capacity is a limiting factor at three sites (Lake Oroville Visitors Center, Oroville Dam, and floating restrooms). However, facility-specific concerns and not percent occupancy issues constrain facility capacity at two of these sites (security at the Oroville Dam and storage capacity at the floating restrooms).
Demand for additional DUAs and associated facilities was measured as a component of Relicensing Study R-13 – Recreation Survey. Visitors were asked whether there were “too few, about right, or too many” day use areas and associated facilities. Study area-wide demand for shoreline day use areas (measured by the percent of “too few” survey responses) was high; approximately 57 percent of survey respondents in the study area felt there were too few. Survey respondents in the study area also indicated that there were too few swimming areas (48 percent), interpretive facilities (46 percent), restrooms (40 percent), and group picnic sites (34 percent). While demand for these types of sites and facilities does not necessarily correspond to a lack of available facility capacity, it may indicate that some new DUAs or associated facilities are needed in order to help improve visitor satisfaction and minimize potential capacity-related concerns, including resource degradation, perceived crowding, and visitor conflict.
Overall, existing facility capacity at DUAs in the study area is considered below capacity. Facility capacity is generally not considered a limiting factor at this time.However, additional DUAs and associated facilities may be needed in the future, based on visitor survey results and existing high levels of percent occupancy during special events at several sites.

Final Recreation Carrying Capacity (R-8) Oroville Facilities P-2100 Relicensing
Proposed Final Report – For Distribution to Collaborative
Oroville Facilities Relicensing Team 5-37 June 2004
5.4.1.4 Social Capacity
Overall, DUAs in the study area are considered to be below their social capacity (Table 5.4-1). On an individual basis, all of the DUAs were either below or approaching their social capacity. On an annual and recreation season basis, the mean perceived crowding score for all of the DUAs was 2.9 and 3.0, respectively (DWR 2004e). These score are relatively low and indicate that visitors to these sites generally do not feel crowded or are beginning to feel slightly crowded. Given the low aggregate crowding scores at DUAs in the study area, overall social capacity is not a limiting factor at this time.
5.4.1.5 Overall Capacity Conclusion
Overall, spatial capacity is the primary limiting factor at the DUAs in the study area because of a lack of expansion potential at existing sites included in this site-type category (Table 5.4-1). However, areas identified in the Relicensing Study R-15 – Recreation Suitability Analysis as suitable for recreation development could potentially be used for new DUA development. All of the other capacity indicator variables were below capacity and are not considered limiting factors at this time. Considering the capacity indicator variables in aggregate, capacity-related decisions at DUAs should be regarded as a moderate management priority at this time.
None of the DUAs included in this analysis have substitute sites that could potentially relieve capacity concerns at specific sites (Table 5.4-1). Most of the sites included in this site-type category are specialized sites that offer specific settings or activities that are not duplicated at other sites in the study area. As a result, substitute sites are generally not a viable option at this time to ease capacity constraints at specific DUAs in the study area.
5.4.2 Site-Specific Capacity of Day Use Areas
Recreation facilities discussed in this section include:
Lake Oroville Visitors Center;
Feather River Fish Hatchery;
Oroville Dam DUA and Overlook;
Floating restrooms;
Diversion Pool DUA;
Aquatic Center;
Model Aircraft Flying Area;
Clay Pit SVRA;
Rabe Road Shooting Range; and
Riverbend Park.

Final Recreation Carrying Capacity (R-8) Oroville Facilities P-2100 Relicensing
Proposed Final Report – For Distribution to Collaborative
Oroville Facilities Relicensing Team 5-38 June 2004
Day use areas associated with boat ramps are discussed separately in Section 5.5.Clay Pit SVRA, Rabe Road Shooting Range, and Riverbend Park are included in this analysis for context and because all but the latter are inside the OWA boundary, but none are within the existing Project boundary.
5.4.2.1 Lake Oroville Visitors Center
Located east of Oroville Dam on Kelly Ridge, the 10,000 square-foot, award-winning Lake Oroville Visitors Center features exhibits on the engineering and construction of the hydroelectric facilities (Figure 1.2-1). In addition to the informational exhibits, there is also a 47-foot viewing tower adjacent to the Visitors Center that provides a panoramic view of Lake Oroville and its surroundings. The Visitors Center is universally accessible and has 18 picnic tables (10 ADA-accessible), shade trees and sun shelters, drinking fountains, a gift shop, a telephone, ADA-accessible restrooms, parking for 90 vehicles, and 17 parking spaces for either vehicles with trailers or buses. The Dan Beebe Trail is accessible from the Visitors Center.
Ecological Capacity
All of the ecological variables at the Lake Oroville Visitors Center were described as being of low concern during the winter and summer field observations. Overall, the site’s level of ecological impact is characterized as being of low concern. Ecological capacity at the Lake Oroville Visitors Center is considered to be below capacity and not a limiting factor based on the low level of concern regarding ecological impacts at the site.
Spatial Capacity
In general, the potential to physically expand the Lake Oroville Visitors Center is somewhat limited. Expansion is constrained primarily by adjoining private land.Additionally, most adjacent lands, especially to the east and west of the existing site, are categorized as moderate to low suitability in terms of future recreation development (DWR 2004f). The existing site is generally built out and it would be difficult to add new site facilities. However, some small areas to the north and south of the existing site could be developed to slightly increase the physical area of this site.
Overall, spatial capacity is considered to be at capacity at the Lake Oroville Visitors Center. Some potential exists to increase the physical area of this site by expanding into adjacent areas to the north and south. Nonetheless, spatial capacity is considered a limiting factor at this time.

Final Recreation Carrying Capacity (R-8) Oroville Facilities P-2100 Relicensing
Proposed Final Report – For Distribution to Collaborative
Oroville Facilities Relicensing Team 5-39 June 2004
Facility Capacity
Annual recreation use of the Lake Oroville Visitors Center accounted for more than 93,500 RD, with only about a third of this use occurring during the recreation season (DWR 2004b). This difference in use is likely due to the frequency of school group tours in the off-season. During the recreation season, weekday use at this site accounted for over 22,000 RD and weekend use accounted for more than 14,200 RD. By 2050, annual recreation use at this site is estimated to be approximately 241,850 RD (DWR 2004d). This represents approximately a 160 percent increase from existing use levels.
Due to the fact that this site tends to receive greater use during the off-season, recreation season weekday and weekend percent occupancy were not specifically investigated (DWR 2004b). However, using existing use figures and available parking spaces, it is estimated that existing recreation season weekday and weekend percent occupancies are approximately 23 and 32 percent of capacity, respectively. While this level of use is relatively low, this site does receive higher levels of use, especially during the off-season. Additionally, with an anticipated increase in visitation of nearly 160 percent, additional facility capacity will likely be needed by 2050. Assuming visitation increases at the expected rate, it is estimated that this site will reach and/or exceed 80 percent occupancy during recreation season weekends by 2050. The site will likely reach and exceed 80 percent occupancy during the off-season before 2050, as existing use is already higher during this period of time.
Given existing use levels and the fact that annual recreation use at this site is predicted to increase approximately 160 percent by 2050, additional facility capacity will likely be necessary at this site. It is estimated that by 2050, recreation season weekend percent occupancy at the Lake Oroville Visitors Center will exceed 80 percent. Additionally, off-season percent occupancy will also likely reach and/or exceed this level of percent occupancy by 2050. This level of use is considered to be exceeding the facility capacity of this site. As a result, while facility capacity is currently considered to be approaching capacity (due to higher use in the off-season), this capacity type is considered a limiting factor because of future percent occupancy constraints.
Social Capacity
A site-specific perceived crowding score was not determined for this site. Instead, the mean perceived crowding score for all day use areas was used at this site. The annual and recreation season mean perceived crowding scores at DUAs were 2.9 and 3.0, respectively. These crowding scores are relatively low and indicate that visitors generally do not feel crowded at DUAs in the study area. As a result, it is estimated that the Lake Oroville Visitors Center is below its social capacity. Additionally, social capacity is not considered a limiting factor at this time.
Final Recreation Carrying Capacity (R-8) Oroville Facilities P-2100 Relicensing
Proposed Final Report – For Distribution to Collaborative
Oroville Facilities Relicensing Team 5-40 June 2004
Overall Site Capacity Conclusion
Overall, existing recreation use at the Lake Oroville Visitors Center is considered to be approaching capacity. Of the four capacity types, only spatial capacity is considered to be at capacity. Existing recreation use at this site is considered to be approaching facility capacity and below ecological and social capacities. However, both spatial and facility capacities are currently considered limiting factors due to expansion and percent occupancy constraints. Considering the capacity indicator types in aggregate, capacity-related decisions at this site should be regarded as a moderate management priority.
5.4.2.2 Feather River Fish Hatchery
Located below the Oroville Dam on the northern bank of the Feather River adjacent to the Diversion Dam, the Feather River Fish Hatchery provides public observation areas of the fish hatchery facility (Figure 1.2-1). The public use area of the site consists of a parking area, restrooms, an observation platform, and fish ladder viewing areas. An additional parking area associated with the fish hatchery is provided on the west side of Table Mountain Boulevard.
Ecological Capacity
During the winter field observation, two ecological variables (trash accumulation and user-defined trails) were described as being of moderate concern at the Feather River Fish Hatchery. During the summer field observation, all of the ecological variables were described as being of low concern, except user-defined trails which was a moderate concern. Overall, the site’s level of ecological impact is characterized as being of low concern. Ecological capacity at the Feather River Fish Hatchery is considered to be below capacity and not a limiting factor based on the low level of concern regarding ecological impacts at the site.
Spatial Capacity
In general, there is no potential to physically expand the Feather River Fish Hatchery. Expansion is highly constrained by existing roads, land ownership, and the river.Additionally, most adjacent lands are categorized as low suitability in terms of future recreation development (DWR 2004f).
An average of 1 PAOT and 2 PAOT were observed on weekdays and weekends, respectively, during the recreation season at this site. The maximum number of PAOT observed during the recreation season on weekdays was 2 and on weekends was 4. On average, 4 VAOT were observed on weekdays and 3 VAOT were observed on weekends during the recreation season at this site. The maximum number of VAOT observed during the recreation season was 11 on weekdays and 4 on weekends (DWR

Final Recreation Carrying Capacity (R-8) Oroville Facilities P-2100 Relicensing
Proposed Final Report – For Distribution to Collaborative
Oroville Facilities Relicensing Team 5-41 June 2004
2004b). In general, this site is built out and cannot accommodate significant additional new site facilities that could increase at-one-time use.
Overall, spatial capacity is considered to be exceeding capacity at the Feather River Fish Hatchery. No potential exists to increase the physical area of this site. Also, the existing site is built out and cannot accommodate additional site facilities. As such, spatial capacity is considered a limiting factor at this time.
Facility Capacity
Annually, the Feather River Fish Hatchery receives a high level of use. Existing recreation use is estimated to account for approximately 160,400 RD (DWR 2004b).About 60 percent of use occurred during the off-season, because of the timing of the salmon runs (the major runs are in the fall and spring). During the recreation season, existing recreation use is estimated to account for nearly 66,000 RD. Weekday use during the recreation season accounted for nearly 45,000 RD, while weekend use accounted for more than 21,000 RD. By 2050, annual recreation use at this site is estimated to be approximately 367,000 RD (DWR 2004d); this represents an increase of approximately 129 percent from existing use levels.
Similar to the Lake Oroville Visitors Center, this site also tends to receive greater use during the off-season and, as a result, recreation season weekday and weekend percent occupancy were not specifically investigated (DWR 2004b). However, using existing use figures and available parking spaces, it is estimated that existing recreation season weekday and weekend percent occupancies are approximately 4 and 3 percent of capacity, respectively. These levels are very low, but not unexpected considering this site does receive high levels of use during the off-season. With an anticipated increase in visitation of 129 percent, additional facility capacity will likely be needed by 2050, specifically to accommodate off-season use during the fish migration periods.
Given existing use levels, recreation season percent occupancy is considered to be below capacity. However, this site does experience periods of heavy use during the off-season. Because of these higher levels of use during the off-season and an anticipated increase of 129 percent in annual recreational use, overall facility capacity is considered to be approaching capacity, but is not a limiting factor at this time. Additionally, while facility capacity may be a concern during the off-season in the future, this concern will likely not translate into a need for additional facilities, as facility capacity will likely be reached and/or exceed only during brief periods of time associated with fish migrations.
Social Capacity
The annual perceived crowding score at this site was 3.5 (DWR 2004e). During the recreation season, an insufficient number of completed surveys were collected at the Feather River Fish Hatchery to develop a statistically valid perceived crowding score.
Final Recreation Carrying Capacity (R-8) Oroville Facilities P-2100 Relicensing
Proposed Final Report – For Distribution to Collaborative
Oroville Facilities Relicensing Team 5-42 June 2004
However, this site tends to receive higher levels of use during the off-season, so the annual perceived crowding score is likely a better indicator of social capacity at this site.This crowding score is relatively low and indicates that visitors to this site only feel slightly crowded. Based on this perceived crowding score, the Feather River Fish Hatchery is considered to be approaching its social capacity; however, social capacity is not a limiting factor at this time.
Overall Site Capacity Conclusion
Overall, existing recreation use at the Feather River Fish Hatchery is considered to be approaching capacity. Currently, spatial capacity is considered to be exceeding capacity and a limiting factor due to the lack of expansion potential at this site. As a result, future capacity-related decision-making at this site will likely need to focus on management strategies other than spatial expansion. The remaining capacity types are either approaching (facility and social capacities) or below (ecological) capacity at this time. Considering the four capacity types in aggregate, capacity-related decisions at the Feather River Fish Hatchery should be regarded as a moderate management priority at this time.
5.4.2.3 Oroville Dam DUA and Overlook
Located on the southwest shoreline of the reservoir, the crest of Oroville Dam is used for driving, sightseeing, walking, jogging, bicycling, and other similar recreation activities (Figure 1.2-1). The developed day use area’s facilities are located on the east and west ends of the dam. This day use area consists of picnic tables, flush toilets, and a drinking fountain. Previously, there were approximately 400 parking spaces on top of the dam (parking is not currently allowed due to heightened security).
Ecological Capacity
All of the ecological variables, except user-defined trails (moderate concern), were characterized as a low concern at the Oroville Dam DUA and Overlook during the winter and summer field observations. Overall, the site’s level of ecological impact is characterized as being of low concern. Ecological capacity at the Oroville Dam DUA and Overlook is considered to be below capacity and not a limiting factor based on the low level of concern regarding ecological impacts at the site.
Spatial Capacity
In general, there is no additional space for potential site expansion at the Oroville Dam DUA and Overlook. The majority of the site is located on top of the dam and thus cannot be expanded. Safety and security also limit any expansion at this site.
Final Recreation Carrying Capacity (R-8) Oroville Facilities P-2100 Relicensing
Proposed Final Report – For Distribution to Collaborative
Oroville Facilities Relicensing Team 5-43 June 2004
On average during the recreation season, 2 PAOT were observed on weekdays and 4 PAOT were observed on weekends at the Oroville Dam DUA and Overlook. The maximum number of PAOT observed during the recreation season on weekdays was 4 and on weekends was 15. On average, 4 VAOT were observed on weekdays and 7 VAOT were observed on weekends during the recreation season at this site. The maximum number of VAOT observed during the recreation season was 8 on weekdays and 16 on weekends (DWR 2004b). Due to its location on the top of the dam, this site is completely built-out and cannot accommodate additional site facilities that could otherwise increase at-one-time use.
Overall, spatial capacity is considered to be exceeding capacity at the Oroville Dam DUA and Overlook. However, no potential exists to increase the physical area of this site. As such, spatial capacity is considered a limiting factor at this time.
Facility Capacity
The Oroville Dam DUA and Overlook is one of the highest-use recreation sites in the study area. Annual recreation use at the site accounted for nearly 190,000 RD (DWR 2004b). Over half of this use (105,000 RD) occurred during the off-season. During the recreation season, weekday use of this site accounted for approximately 58,500 RD, while weekend use accounted for over 26,300 RD. By 2050, it is estimated that recreational use of this site will approach 466,800 RD annually (DWR 2004d). This represents approximately a 146 percent increase from existing use levels.
Existing recreation use at this site was approximately 20 percent of capacity during recreation season weekdays and 35 percent of capacity during recreation season weekends. During holidays, percent occupancy at this site increased slightly to 40 percent of capacity (DWR 2004b). These percent occupancies are considered to be below capacity for the recreation season. These lower levels of use were expected though because of the relatively brief length of stay of typical visitors to this site. Based on field observations, visitors tended to drive in, look around from their vehicle, and drive out, often spending less than 10 minutes total at the site. By 2050, however, it is anticipated that percent occupancy will reach and/or exceed 80 percent during recreation season weekends.
While existing use at this site is considered to be below its facility capacity, percent occupancy will likely be a facility constraint in the future. Additionally, existing security concerns at this site are a facility constraint. As a result, facility capacity is currently considered to be below capacity, but a limiting factor.
Social Capacity
The annual and recreation season perceived crowding score at the Oroville Dam DUA and Overlook is approximately 1.6 (DWR 2004e). This crowding score is very low and

Final Recreation Carrying Capacity (R-8) Oroville Facilities P-2100 Relicensing
Proposed Final Report – For Distribution to Collaborative
Oroville Facilities Relicensing Team 5-44 June 2004
indicates that visitors do not feel crowded at this site. Based on this low crowding score, social capacity is considered to be below capacity at this site and not a limiting factor at this time.
Overall Site Capacity Conclusion
Overall, existing recreation use at the Oroville Dam DUA and Overlook is considered to be approaching capacity. Currently, spatial capacity is considered to be exceeding capacity and a limiting factor due to the lack of expansion potential at this site. As a result, future capacity-related decision-making at this site will likely need to focus on management strategies other than spatial expansion. The remaining capacity types are all below capacity at this time. However, facility capacity is also considered a limiting factor because of existing security concerns and future percent occupancy constraints at this site. Considering the four capacity types in aggregate, capacity-related decisions at this site should be regarded as a moderate management priority at this time.
5.4.2.4 Floating Restrooms
To help preserve water quality and as a convenience to boaters, DPR maintains seven floating restrooms on Lake Oroville. There are no floating restrooms in any of the other resource areas. The floating restrooms are located throughout the reservoir and are constructed on floating docks that allow temporary moorage for several boats at a time. Each floating restroom has two individual restrooms with vault toilets. The floating restrooms are removed from the reservoir during the off-season.
Ecological Capacity
The floating restrooms are fully developed, hardened recreation facilities that clearly help reduce recreation-related ecological impacts (especially sanitation issues) at shoreline areas around the reservoir by transferring use to a facility that is better able to absorb potential impacts. As such, the site’s overall level of ecological impact is characterized as being of low concern. Ecological capacity at the floating restrooms is considered to be below capacity based on the low level of concern regarding ecological impacts at the site.
Spatial Capacity
Spatial capacity at the floating restrooms is less feasible to measure than at land-based developed recreation sites. While it is not practical to expand the existing floating restrooms, there are likely additional locations around the reservoir that could accommodate new floating restrooms. As such, the spatial capacity of the floating restrooms is considered to be below capacity and not a limiting factor at this time.

Final Recreation Carrying Capacity (R-8) Oroville Facilities P-2100 Relicensing
Proposed Final Report – For Distribution to Collaborative
Oroville Facilities Relicensing Team 5-45 June 2004
Facility Capacity
Percent occupancy at the floating restrooms is likely not a practical measure of facility capacity based on the type and length of use these facilities receive. Instead, a better measure of facility capacity at the floating restrooms is likely utilization storage capacity and pump-out frequency. Neither of these facility capacity indicators was specifically investigated during field observations. However, utilization storage capacity and pump-out frequency are facility capacity constraints. As such, while facility capacity is currently considered to be below capacity at the floating restrooms, it is a limiting factor at this time that could constrain recreation use of these facilities in the future.
Social Capacity
Measuring social capacity at floating restrooms is not a practical measure of capacity based on the type of use these sites receive. By design, the floating restrooms can only be used by one visitor at a time. As a result, the measurement of social capacity is not applicable to the floating restrooms.
Overall Site Capacity Conclusion
Overall, recreational use of the floating restrooms is considered to be below capacity. All of the capacity indicator variables are considered to be below capacity at this time. Also, social capacity is likely not a practical measure of overall capacity due to the type of use these facilities receive. The only capacity type that is currently considered a limiting factor is facility capacity due to utilization storage capacity and pump-out frequency constraints. Considering the four capacity types in aggregate, capacity-related decisions at this site should be regarded as a low management priority at this time.
5.4.2.5 Diversion Pool DUA
The Diversion Pool DUA is located along Burma Road, which runs along the northern/western shoreline of the Diversion Pool (Figure 1.2-1). The only developed facility at this site is a vault toilet building, though two shoreline areas have been enhanced with gravel to facilitate non-motorized boat launching. Parking spaces are undefined along the Burma Road, though pull-outs along the gravel road could likely accommodate approximately 25 to 30 vehicles at one time.
Ecological Capacity
During the winter field observation and the summer field observation, soil erosion was described as a moderate concern at the Diversion Pool DUA; all other ecological variables were characterized as low concerns. Overall, the site’s level of ecological impact is characterized as being of low concern. Ecological capacity at the Diversion

Final Recreation Carrying Capacity (R-8) Oroville Facilities P-2100 Relicensing
Proposed Final Report – For Distribution to Collaborative
Oroville Facilities Relicensing Team 5-46 June 2004
Pool DUA is considered to be below capacity and not a limiting factor based on the low level of concern regarding ecological impacts at the site.
Spatial Capacity
There are a few small areas along the access road to the Diversion Pool DUA that could potentially be used to physically expand the existing site. Additionally, an area to the south of the Union Pacific Railroad Bridge on the west side of the existing Brad Freeman Trail could also be used to potentially expand this site. However, in other directions, expansion is constrained by existing roads, private property, steep slopes, and water surface. Also, most adjacent lands, especially to the west, are categorized as low suitability in terms of future recreation development (DWR 2004f).
On average, 1 PAOT was observed on weekdays and 3 PAOT were observed on weekends during the recreation season at the Diversion Pool DUA. The maximum number of PAOT observed during the recreation season on weekdays was 4 and on weekends was 5. On average, 2 VAOT were observed on weekdays and weekends during the recreation season. The maximum number of VAOT observed during the recreation season was 5 on weekdays and 4 on weekends (DWR 2004b).
Overall, spatial capacity is considered to be at capacity at the Diversion Pool DUA.Some marginal adjacent areas could likely be used to expand the footprint of the exist site; however, these areas are generally small and not ideal in terms of recreation development. However, a few hardened facilities (e.g., defined parking spaces) could likely be added along Burma Road to better delineate use areas. Nonetheless, spatial capacity is considered a limiting factor at this time.
Facility Capacity
Existing annual recreation use at the Diversion Pool DUA accounted for over 14,550 RD (DWR 2004b). Approximately 40 percent of this use (5,825 RD) occurred during the recreation season. During the recreation season, weekday use of this site accounted for approximately 3,682 RD, while weekend use accounted for over 2,140 RD. By 2050, it is estimated that recreational use of this site will approach 26,450 RD annually (DWR 2004d). This represents an approximately 81 percent increase from existing use levels.
The Burma Road has undeveloped areas that are currently used for parking, but the exact number of vehicles that could potentially use the area is variable. However, it is estimated that between 25 and 30 vehicles could potentially be parked along the Burma Road at one time. Using this estimate, both weekday and weekend percent occupancy is below 10 percent of capacity during the recreation season. Percent occupancy is not anticipated to reach and/or exceed the established capacity thresholds by 2050.Additionally, existing recreation use at this site is estimated to be low based on field

Final Recreation Carrying Capacity (R-8) Oroville Facilities P-2100 Relicensing
Proposed Final Report – For Distribution to Collaborative
Oroville Facilities Relicensing Team 5-47 June 2004
observations completed for Relicensing Study R-9 – Existing Recreation Use and is considered below capacity for purposes of this analysis. Facility capacity is also not considered a limiting factor at this time. Even with a potential increase of approximately 81 percent, it is unlikely that facility capacity will be a limiting factor in the future.
Social Capacity
The annual and recreation season perceived crowding score at the Diversion Pool DUA is 1.3 and 1.2, respectively (DWR 2004e). These crowding scores are very low and indicate that visitors do not feel crowded at this site. As a result, the Diversion Pool DUA is below its social capacity. Additionally, social capacity is not considered a limiting factor at this time.
Overall Site Capacity Conclusion
Overall, existing recreation use at this site is considered below capacity. Ecological and/or spatial indicator variables are often the capacity limiting factor at undefined recreation sites, such as the Diversion Pool DUA. While ecological capacity is currently considered below capacity, spatial capacity is at capacity and a limiting factor at this time. While spatial capacity is currently a limiting factor, a few additional hardened facilities could potentially be added at this site to better accommodate recreational use. The remaining capacity types (facility and social) are also considered below capacity and not limiting factors at this time. Considering the four capacity types in aggregate, capacity-related decisions at this site should be regarded as a low management priority at this time.
5.4.2.6 Aquatic Center
Located on the North Thermalito Forebay on Garden Drive, the Aquatic Center provides non-motorized boat storage for sailing and rowing clubs (Figure 1.2-1). The site consists of a boathouse and shares additional site facilities (parking, picnic areas, etc.) with the North Thermalito Forebay BR/DUA.
Recreation capacity at the Aquatic Center was not specifically investigated during field studies, but was considered in the overall capacity of the North Thermalito Forebay BR/DUA. Capacity conclusions for the North Thermalito Forebay BR/DUA are discussed in Section 5.5.2.5.
5.4.2.7 Model Aircraft Flying Area
Located on the Thermalito Afterbay off Wilbur Road, the Model Aircraft Flying Area provides a paved runway for model aircraft take-offs and landings (Figure 1.2-1). The site also has a portable toilet, 6 picnic tables, a barbeque, 2 covered shade structures, and parking for approximately 20 vehicles.

Final Recreation Carrying Capacity (R-8) Oroville Facilities P-2100 Relicensing
Proposed Final Report – For Distribution to Collaborative
Oroville Facilities Relicensing Team 5-48 June 2004
Ecological Capacity
All of the ecological variables were characterized as low concerns at the Model Aircraft Flying Area during the winter field observation. During the summer field observation, all of the ecological variables were also described as low concerns, except trash accumulation (moderate concern). Overall, the site’s level of ecological impact is characterized as being of low concern. Therefore, ecological capacity at the Model Aircraft Flying Area is considered to be below capacity and not a limiting factor.
Spatial Capacity
In general, the potential to physically expand the Model Aircraft Flying Area is somewhat limited. Expansion is constrained primarily by sensitive vegetation, private land, and the Afterbay. Additionally, some adjacent lands, especially to the east of the existing site, are categorized as low suitability in terms of future recreation development (DWR 2004f). However, some small areas to the north and east of the existing site could be developed to slightly increase the physical area of this site. Also, some additional site facilities could likely be added to the existing site, though some infill may be required.
Overall, spatial capacity is considered to be approaching capacity at the Model Aircraft Flying Area. Some potential exists to increase the physical area of this site by expanding into adjacent areas to the north and east. Also, some additional site facilities could likely be added to increase the existing use density at this site. As such, spatial capacity is not considered a limiting factor at this time.
Facility Capacity
Facility capacity was generally not investigated at the Model Aircraft Flying Area. Based on field observations for Relicensing Study R-9 – Existing Recreation Use, use at this site is estimated to be low and only experiences heavy use during special events. Percent occupancy is likely not a practical indicator of capacity at this site because it only receives a large number of visitors during special events. Capacity concerns related to model aircraft operation and safety are likely better indicators of facility capacity at this site. These concerns were not investigated during this analysis, but should likely be considered for future monitoring efforts. Overall, based on the low levels of use this site currently experiences, current facility capacity is characterized as below capacity. Additionally, facility capacity is not considered a limiting factor at this time, nor is it expected to be in the future.

Final Recreation Carrying Capacity (R-8) Oroville Facilities P-2100 Relicensing
Proposed Final Report – For Distribution to Collaborative
Oroville Facilities Relicensing Team 5-49 June 2004
Social Capacity
The annual mean perceived crowding score at the Model Aircraft Flying Area is 1.7 (DWR 2004e). An insufficient number of surveys were collected at this site to determine a statistically valid recreation season crowding score. However, the annual crowding score is low and indicates that visitors to this site do not feel crowded. Based on this low perceived crowding score, social capacity is below capacity at this site and is not considered a limiting factor at this time.
Overall Site Capacity Conclusion
Overall, existing recreation use at the Model Aircraft Flying Area is considered below capacity. Currently, all of the capacity indicators are below capacity and none are anticipated to be limiting factors in the future. This does not mean that there is no existing and/or future limiting factor at this site; rather, the lack of a limiting factor indicates that the capacity indicators employed during this analysis may not be appropriate at this site and others should be considered for long-term monitoring. Considering the capacity indicator variables in aggregate, capacity-related decisions at the Model Aircraft Flying Area should be regarded as a low management priority at this time.
5.4.2.8 Clay Pit State Vehicular Recreation Area (SVRA)
Located adjacent to the OWA and outside the Project boundary, the Clay Pit SVRA provides a 220-acre recreation area for motorcycle, all-terrain vehicle (ATV), and dune buggy use (Figure 1.2-1). Aside from the entrance road and a paved staging area, there are no other developed facilities at this site.
Ecological Capacity
During the winter field observation, two ecological variables (soil compaction and user-defined trails) were described as being of extreme concern at the Clay Pit SVRA.Additionally, soil erosion was a high concern and trash accumulation was a moderate concern. The remaining seven ecological variables were low concerns during the winter field observation. During the summer field observation, three ecological variables (soil compaction, trash accumulation, and user-defined trails) were extreme concerns, while soil erosion was a high concern. The remaining seven ecological variables were low concerns during the summer field observation. Overall, the site’s level of ecological impact is characterized as being of high concern. Ecological capacity at the Clay Pit SVRA is considered to be at capacity based on the high level of concern regarding ecological impacts at the site and is considered a limiting factor at this time. However, the site was already significantly impacted during dam construction. Thus, it makes a logical location for OHV use and is a place where such activity can be contained and managed.

Final Recreation Carrying Capacity (R-8) Oroville Facilities P-2100 Relicensing
Proposed Final Report – For Distribution to Collaborative
Oroville Facilities Relicensing Team 5-50 June 2004
Spatial Capacity
In general, the potential to physically expand the Clay Pit SVRA is limited. Expansion is primarily constrained by existing roads, land ownership, and the nearby Rabe Road Shooting Area (unless the latter was relocated). Additionally, most adjacent lands are categorized as moderate suitability in terms of future recreation development, though some small marginal areas to the south and east could potentially be used to slightly increase the physical area of the site (DWR 2004f).
On average, 1 VAOT and 2 VAOT were observed respectively on weekdays and weekends during the recreation season at this site. The maximum number of VAOT observed during the recreation season was also 1 on weekdays and 2 on weekends (DWR 2004b). This site is generally built-out and new OHV use areas could likely not be accommodated within the existing footprint of the site.
Overall, spatial capacity is considered to be at capacity at the Clay Pit SVRA. Very little potential exists to increase the physical area of this site and additional site facilities are likely not feasible. As such, spatial capacity is considered a limiting factor at this time.
Facility Capacity
Annually, existing recreation use at the Clay Pit SVRA is estimated to account for more than 18,000 RD (DWR 2004b). This site receives more use during the off-season (nearly 13,000) than the recreation season (almost 5,500). During the recreation season, weekday use accounted for more than 3,200 RD, while weekend use accounted for nearly 2,200 RD. By 2050, it is estimated that recreational use of this site will approach 25,610 RD annually (DWR 2004d). This represents approximately a 40 percent increase from existing use levels.
Existing recreation use at this site was approximately 5 percent of capacity during recreation season weekdays and 10 percent of capacity during recreation season weekends (DWR 2004b). By 2050, it is anticipated that percent occupancy will not reach and/or exceed 80 percent during recreation season weekends. The existing and future percent occupancies are considered below capacity for the recreation season.However, percent occupancy may not be the most practical indicator of facility capacity at this site. Capacity concerns related to OHV safety requirements are likely better indicators of facility capacity at this site. These concerns were not investigated during this analysis. Overall, based on the low levels of use this site currently experiences, current facility capacity is characterized as below capacity. Additionally, facility capacity is not considered a limiting factor at this time, nor is it expected to be in the future.

Final Recreation Carrying Capacity (R-8) Oroville Facilities P-2100 Relicensing
Proposed Final Report – For Distribution to Collaborative
Oroville Facilities Relicensing Team 5-51 June 2004
Social Capacity
Perceived crowding was investigated at the Clay Pit SVRA and the Rabe Road Shooting Area in aggregate. Both the annual and recreation season mean perceived crowding scores were 1.9 (DWR 2004e). This crowding score is low and indicates that visitors to these sites do not feel crowded. Both the Clay Pit SVRA and Rabe Road Shooting Area are currently below their social capacity. Additionally, social capacity is not a limiting factor at either site.
Overall Site Capacity Conclusion
Overall, existing recreation use at the Clay Pit SVRA is considered to be approaching capacity. Currently, both ecological and spatial capacities are at capacity and considered limiting factors. Facility and social capacities are below capacity at this time. Ecological capacity is a limiting factor because of the number and severity of observed ecological impacts at this site. However, while ecological capacity is considered a limiting factor, a higher level of ecological impacts is expected due to the OHV-use this site receives. Spatial capacity is also considered a limiting factor because of expansion constraints. While facility capacity is not currently considered a limiting factor, capacity concerns related to OHV safety should likely be incorporated into future monitoring efforts. Considering these capacity indicator variables in aggregate, capacity-related decisions at the Clay Pit SVRA should be regarded as a moderate management priority at this time.
5.4.2.9 Rabe Road Shooting Area
Located inside the OWA but outside the Project boundary on Rabe Road, adjacent to the Clay Pit SVRA, the Rabe Road Shooting Area is a public rifle and pistol range (Figure 1.2-1). The site consists of unmarked backstops (undefined places to place paper targets), 7 concrete picnic tables, a vault toilet building, and gravel parking for approximately 20 vehicles.
Ecological Capacity
During the winter and summer field observations, trash accumulation was an extreme concern and both soil erosion and soil compaction were high concerns at the Rabe Road Shooting Area. The remaining eight ecological variables were low concerns during both field observations. Overall, the site’s level of ecological impact is characterized as being of high concern. Ecological capacity at the Rabe Road Shooting Area is considered to be at capacity based on the high level of concern regarding ecological impacts at the site and is considered a limiting factor at this time.
Final Recreation Carrying Capacity (R-8) Oroville Facilities P-2100 Relicensing
Proposed Final Report – For Distribution to Collaborative
Oroville Facilities Relicensing Team 5-52 June 2004
Spatial Capacity
In general, the potential to physically expand the Rabe Road Shooting Area is limited.Expansion is primarily constrained by existing roads and the nearby Clay Pit SVRA.While most adjacent lands are categorized as high suitability in terms of future recreation development, physical expansion of the site is likely not feasible without first investigating safety concerns (DWR 2004f). This site is generally built-out and new shooting areas could likely not be accommodated within the existing footprint of the site without compromising visitor safety.
At the Rabe Road Shooting Area, an average of 6 PAOT were observed on weekdays and weekends during the recreation season. The maximum number of PAOT observed during the recreation season on weekdays was 11 and on weekends was 8. An average of 4 VAOT were observed on weekdays and weekends during the recreation season at this site. The maximum number of VAOT observed during the recreation season was 6 on weekdays and 4 on weekends (DWR 2004b).
Overall, spatial capacity is considered to be at capacity at the Rabe Road Shooting Area. Very little potential exists to increase the physical area of this site and additional site facilities are likely not feasible. As such, spatial capacity is considered a limiting factor at this time.
Facility Capacity
Existing recreation use at the Rabe Road Shooting Area is estimated at more than 20,500 RD on an annual basis (DWR 2004b). This site received more use during the off-season (about 39,000 RD) than the recreation season (approximately 30,000 RD).Weekday use during the recreation season accounted for more than 17,800 RD, while weekend use accounted for nearly 12,300 RD. By 2050, it is estimated that recreational use of this site will approach 28,780 RD annually (DWR 2004d). This represents approximately a 40 percent increase from existing use levels.
Existing recreation use at this site was approximately 20 percent of capacity during both recreation season weekdays and weekends (DWR 2004b). By 2050, it is anticipated that percent occupancy will not reach and/or exceed 80 percent during recreation season weekends. The existing and future percent occupancies are considered below capacity for the recreation season. However, this site does experience much higher levels of use during special events. Percent occupancy may not be the most practical indicator of facility capacity at this site because it only receives a large number of visitors during special events. Capacity concerns related to gun shooting and safety requirements are likely better indicators of facility capacity at this site. These concerns were not investigated during this analysis.

Final Recreation Carrying Capacity (R-8) Oroville Facilities P-2100 Relicensing
Proposed Final Report – For Distribution to Collaborative
Oroville Facilities Relicensing Team 5-53 June 2004
Overall, based on the low levels of use this site currently experiences, current facility capacity is characterized as below capacity. Additionally, facility capacity is not considered a limiting factor at this time, nor is it expected to be in the future.
Social Capacity
Perceived crowding at the Rabe Road Shooting Area was investigated in conjunction with the Clay Pit SVRA (DWR 2004e). As described in the Social Capacity section of the Clay Pit SVRA, social capacity at this site is below capacity and not a limiting factor at this time.
Overall Site Capacity Conclusion
Similar to the Clay Pit SVRA, existing recreational use at the Rabe Road Shooting Area is considered to be approaching capacity. Currently, both ecological and spatial capacities are at capacity and considered limiting factors. Facility and social capacities are below capacity at this time. Ecological capacity is a limiting factor because of the number and severity of observed ecological impacts at this site. Spatial capacity is also considered a limiting factor because of expansion constraints. While facility capacity is not currently considered a limiting factor, capacity concerns related to gun shooting and safety should likely be incorporated into future monitoring efforts. Considering these capacity indicator variables in aggregate, capacity-related decisions at the Rabe Road Shooting Area should be regarded as a moderate management priority at this time.
5.4.2.10 Riverbend Park
Riverbend Park, located outside the Project boundary opposite Montgomery Street west of Highway 70, straddles Highway 162 on the eastern shoreline of the Feather River (Figure 1.2-1). The main day use area of the park is located to the north of Highway 162, while the OWA fishing ponds are located to the south of this road. Construction of the park improvements and enhancements was initiated during the recreation relicensing field studies. The park is minimally developed but generally consists of picnic sites, an 18-hole disc (“Frisbee”) golf course, a workout activity par course with multiple stations, and a gravel parking area for approximately 40 vehicles. There is also an additional parking area near the OWA fishing ponds. The Feather River Recreation and Park District (FRRPD) operates Riverbend Park, by agreement with DFG, and has plans to further improve the site (FRRPD 2004).
Ecological Capacity
During the winter field observation, riparian impact and water/shoreline impact were described as being of moderate concern and trash accumulation was described as being a high concern at Riverbend Park. During the summer field observation, two ecological variables (riparian impact and water/shoreline impact) were described as

Final Recreation Carrying Capacity (R-8) Oroville Facilities P-2100 Relicensing
Proposed Final Report – For Distribution to Collaborative
Oroville Facilities Relicensing Team 5-54 June 2004
being of moderate concern at this site. All of the remaining ecological variables were considered low concerns during the winter and summer field observations. Overall, the site’s level of ecological impact is characterized as being of low concern. Ecological capacity at Riverbend Park is considered to be below capacity and not a limiting factor based on the low level of concern regarding ecological impacts at the site.
Spatial Capacity
Riverbend Park is in the process of being further developed. Nonetheless, there are some adjacent areas that could potentially be used to expand the existing footprint of the site. Expansion is primarily constrained by SR 70 to the east and the river to the west, but there are areas to the north and south of the existing developed area that could potentially be used for expansion (based on field observations). However, according to results from Relicensing Study R-15 – Recreation Suitability Analysis,adjacent lands are generally characterized as low suitability in terms of future recreation development. While the site is still being developed, there are also some opportunities to add additional facilities to the developed area of this site. As a result, spatial capacity is considered to be approaching capacity at Riverbend Park, but is not a limiting factor at this time. Spatial capacity should be reassessed when planned improvements and enhancements are complete.
Facility Capacity
Existing annual recreation use at Riverbend Park is estimated to account for approximately 30,230 RD (DWR 2004b). Recreation season use at this site accounted for an estimated 17,500 RD, while off-season use accounted for about 12,730 RD. Weekday use during the recreation season accounted for 10,500 RD, while weekend use accounted for about 7,000 RD. By 2050, it is estimated that recreational use of this site will exceed 52,000 RD annually (DWR 2004d). During the recreation season, use is expected to account for over 12,000 RD in 2050. This represents approximately a 73 percent increase from existing use levels.
Existing utilization of this site was approximately 30 percent of capacity during recreation season weekdays and increased to 43 percent of capacity on weekends (DWR 2004b). During recreation season holidays, the percent occupancy at Riverbend Park was 55 percent of capacity. Both the weekday and weekend percent occupancies are relatively low and indicate that facility capacity is below capacity and not a limiting factor at this time. Recreation season weekend percent occupancy is projected to be approximately 74 percent by 2050, which is considered to be approaching capacity and would likely qualify as a limiting factor. However, the additional parking area located near the OWA fishing ponds was not included in the existing and the projected percent occupancy estimates. Considering this additional capacity, it is unlikely that available parking spaces will be a constraint in the future. It should be noted that some use at this site is from visitors who walk or ride into the park. This type of use was not included

Final Recreation Carrying Capacity (R-8) Oroville Facilities P-2100 Relicensing
Proposed Final Report – For Distribution to Collaborative
Oroville Facilities Relicensing Team 5-55 June 2004
in the percent occupancy estimates that are based on parking capacity. Additionally, facility capacity should be reassessed when planned improvements and enhancements have been completed at Riverbend Park.
Social Capacity
The annual and recreation season mean perceived crowding score was 2.1 at Riverbend Park (DWR 2004e). This crowding score is relatively low and indicates that visitors do not feel crowded. This site is considered to be below its social capacity because of this low crowding score. As a result, social capacity is not a limiting factor at this time.
Overall Site Capacity Conclusion
Overall, existing recreation use at Riverbend Park is considered below capacity. Currently, all of the capacity indicators, except spatial, are below capacity. Spatial capacity is considered to be approaching capacity. None of the capacity indicator variables investigated during this analysis are considered limiting factors at this time. However, the FRRPD is currently improving this site and some capacity types should be reassessed when the improvements have been completed. Additionally, the lack of an existing limiting factor does not mean that there will not be one in the future; instead, an existing limiting factor could not be identified based on the existing and projected use levels at this site. Also, other capacity indicators may be appropriate at this site and should potentially be considered for long-term monitoring. Considering the capacity indicator variables in aggregate, capacity-related decisions at Riverbend Park should be regarded as a low management priority at this time.
5.5 STUDY AREA BOAT RAMP AND DAY USE AREA CAPACITY SUMMARY
In this section, the overall capacity of boat ramps and associated day use areas in the study area is presented first, followed by the discussion of site-specific recreation carrying capacity. DUAs in this section include only those sites associated with a boat ramp. DUAs not associated with boat ramps are discussed separately in Section 5.4.
5.5.1 Overall Capacity Summary of Boat Ramps and Associated Day Use Areas
The overall capacity of boat ramps and associated day use areas in the study area is summarized in Table 5.5-1.
5.5.1.1 Ecological Capacity
In general, recreational use of boat ramps and their associated day use areas does not appear to have a widespread impact on the ecological integrity of the study area. Most observed ecological concerns tended to be minor and localized (e.g., soil erosion, trash

Final Recreation Carrying Capacity (R-8) Oroville Facilities P-2100 Relicensing
Proposed Final Report – For Distribution to Collaborative
Oroville Facilities Relicensing Team 5-56 June 2004
accumulation, etc.), though observed impacts at several sites were more pronounced. Ecological capacity is considered a limiting factor at two boat ramps (Foreman Creek Car-top BR and Afterbay Outlet BR). Additionally, five other boat ramps (Enterprise BR, Wilbur Road BR, Larkin Road Car-top BR, Stringtown Car-top BR, and Vinton Gulch Car-top BR) are considered to be approaching their ecological capacity (Table 5.5-1). However, ecological capacity is not considered a limiting factor at these facilities.Ecological capacity is considered a low concern at the remaining boat ramps and day use areas. Similar to other developed recreation facilities in the study area, ecological concerns at many of the boat ramps and day use areas are likely minimized by the presence of hardened facilities, routine maintenance, and on-site management, among other factors (boat ramps and day use areas without hardened facilities generally had more observed ecological impacts than those with hardened facilities).
Overall, ecological capacity is considered to be approaching capacity at boat ramps and their associated day use areas, but is not considered a limiting factor at this time.Potential ecological impacts should continue to be monitored, however, especially at more primitive or unimproved facilities and as use of study area increases in the future. Additionally, existing ecological capacity-related management decisions are a relatively high priority at the Foreman Creek Car-top BR and the Afterbay Outlet BR.
5.5.1.2 Spatial Capacity
Overall, spatial capacity is considered to be approaching capacity and a limiting factor at boat ramps and their associated day use areas in the study area at this time.Individually, spatial capacity is mixed on a site-by-site basis and is considered to be exceeding capacity at three sites, at capacity at five sites, approaching capacity at six sites, and below capacity at two sites (Table 5.5-1). Additionally, spatial capacity is a limiting factor at eight of the developed boat ramps and their associated day use areas in the study area. At most boat ramps and their associated day use areas, the lack of expansion potential is the primary spatial constraint, though in some cases, the inability to accommodate additional facilities within the existing site footprint is also a constraint.
While Relicensing Study R-15 – Recreation Suitability Analysis investigated areas that may be suitable for new facility development, including boat ramps and their associated day use areas, it did not specifically research shoreline areas that could potentially accommodate new boat ramp construction. As such, while some shoreline areas may be categorized as suitable for potential recreation development, these areas may not be suitable for new boat ramps.
5.5.1.3 Facility Capacity
Boat ramps and their associated day use areas are some of the most popular developed recreation sites in the study area. Similar to many other developed recreation sites in the study area, these sites experience higher levels of use during the

Fin
al R
ecre
atio
n C
arr
yin
g C
apa
city (
R-8
) O
rovill
e F
acili
ties P
-2100 R
elic
ensin
g
Pro
posed
Fin
al R
epo
rt –
Fo
r D
istr
ibu
tio
n to
Co
llab
ora
tive
Oro
vill
e F
acili
ties R
elic
ensin
g T
eam
5-5
7
June 2
004
Ta
ble
5.5
-1.
Su
mm
ary
of
stu
dy
are
a b
oa
t ra
mp
an
d a
ss
oc
iate
d d
ay u
se
are
a c
ap
ac
ity.
Facilit
y
Eco
log
ical
Ca
pac
ity
1S
pati
al
Ca
pac
ity
1F
acilit
y
Ca
pac
ity
1S
ocia
lC
ap
ac
ity
1O
vera
ll C
ap
acit
y
Su
mm
ary
2O
vera
ll C
ap
acit
y
Pri
ori
ty3
Su
bsti
tute
Facilit
y(i
es)4
Bid
well
Canyon B
R/D
UA
B
elo
w
At
Ap
pro
ac
hin
g
Appro
achin
gA
t H
igh
Spill
way B
R/D
UA
and
Lo
afe
r C
reek B
R/D
UA
Lim
e S
ad
dle
BR
/DU
A
Be
low
A
pp
roa
ch
ing
Belo
w
Be
low
A
pp
roa
ch
ing
Mo
dera
te
-
Lo
afe
r C
reek B
R/D
UA
B
elo
w
Ap
pro
ach
ing
Belo
w
Ap
pro
ach
ing
Ap
pro
ach
ing
Mo
dera
te
Bid
well
Canyon B
R/D
UA
and S
pill
way B
R/D
UA
Mo
nu
me
nt H
ill B
R/D
UA
B
elo
w
Ap
pro
ach
ing
Belo
w
Ap
pro
ach
ing
Ap
pro
ach
ing
Mo
dera
te
Wilb
ur
Roa
d B
R a
nd
L
ark
in R
oa
d C
ar-
top
BR
No
rth
Th
erm
alit
o F
ore
ba
y
BR
/DU
AB
elo
w
Be
low
B
elo
w
Ap
pro
ach
ing
Be
low
L
ow
-
South
Therm
alit
o F
ore
bay
BR
/DU
AB
elo
w
Be
low
B
elo
w
Be
low
B
elo
w
Lo
w
-
Sp
illw
ay B
R/D
UA
B
elo
w
At
Be
low
A
pp
roa
ch
ing
Ap
pro
ach
ing
Mo
dera
te
Bid
well
Canyon B
R/D
UA
a
nd
Loa
fer
Cre
ek
BR
/DU
A
En
terp
rise
BR
A
pp
roa
ch
ing
At
Be
low
A
pp
roa
ch
ing
Ap
pro
ach
ing
Mo
dera
te
-
Wilb
ur
Road B
R
Appro
achin
g
Appro
achin
g
Ap
pro
ac
hin
g
Appro
achin
gA
ppro
achin
g
Modera
te
Monum
ent H
ill B
R/D
UA
Da
rk C
an
yo
n C
ar-
top
BR
B
elo
w
Exceed
ing
Be
low
B
elo
w
Ap
pro
ach
ing
L
ow
-
Fo
rem
an
Cre
ek C
ar-
top
BR
A
t A
t E
xc
ee
din
g
Be
low
A
t H
igh
-
La
rkin
Ro
ad
Ca
r-to
p B
R
Ap
pro
ach
ing
Ap
pro
ach
ing
Belo
w
Appro
achin
gA
ppro
achin
g
Low
M
onum
ent H
ill B
R/D
UA
Nels
on B
ar
Car-
top B
R
Belo
w
Exceed
ing
Be
low
A
pp
roa
ch
ing
Ap
pro
ach
ing
Lo
w
Vin
ton
Gu
lch
Ca
r-to
p B
R
Str
ingto
wn C
ar-
top B
R
Appro
achin
g
At
Ex
ce
ed
ing
A
ppro
achin
gA
t H
igh
-
Vin
ton G
ulc
h C
ar-
top B
R
Appro
achin
g
Exceed
ing
Be
low
B
elo
w
Ap
pro
ach
ing
Lo
w
Ne
lso
n B
ar
Ca
r-to
p B
R
Afterb
ay O
utlet B
R
At
Appro
achin
g
Ex
ce
ed
ing
A
t A
t H
igh
Un
impro
ved
ra
mp
s
within
the O
WA
Overa
ll S
tudy A
rea
BR
/DU
A S
um
mary
A
ppro
achin
g
Ap
pro
ac
hin
g
Ap
pro
ac
hin
g
Ap
pro
ach
ing
Ap
pro
ach
ing
Mo
dera
te
NA
1B
old
type in t
his
colu
mn indic
ate
s t
hat
this
capacity t
ype is c
onsid
ere
d a
lim
itin
g f
acto
r fo
r th
is f
acili
ty.
2 I
ndic
ate
s w
heth
er
overa
ll re
cre
ational use is c
onsid
ere
d t
o b
e b
elo
w,
appro
achin
g,
at, o
r exceedin
g c
apacity a
t th
is t
ime b
ased o
n a
synth
esis
of
the r
esults f
or
each c
apacity t
ype.
3 I
ndic
ate
s w
heth
er
the o
vera
ll capacity is c
onsid
ere
d t
o b
e a
low
, m
odera
te,
or
hig
h p
riori
ty a
t th
is t
ime f
or
managem
ent
decis
ion-m
akin
g.
4 I
ndic
ate
s w
hic
h (
if a
ny)
facili
ty m
ay a
ct as a
substitu
te f
acili
ty t
hat
may b
e a
ble
to a
bsorb
recre
ational use t
o h
elp
ease o
vera
ll capacity c
oncern
s.
Sourc
e:
ED
AW
2004.
Final Recreation Carrying Capacity (R-8) Oroville Facilities P-2100 Relicensing
Proposed Final Report – For Distribution to Collaborative
Oroville Facilities Relicensing Team 5-58 June 2004
recreation season, especially on weekends and holidays. In general, most of the boat ramps and their associated day use areas are currently considered below their facility capacity based on percent occupancy during the recreation season, while facility capacity at the more primitive boat ramps is more variable, ranging from below to exceeding capacity (Table 5.5-1). While existing or future percent occupancy are constraints at several of the boat ramps and their associated day use areas, reservoir pool levels also constrain facility capacity at many of these sites. As a result, facility capacity is a limiting factor at all but three of the boat ramps and their associated day use areas in the study area, and is also considered an overall limiting factor for this category of sites.
Data collection for both Relicensing Study R-9 – Existing Recreation Use andRelicensing Study R-7 – Reservoir Boating studies was completed early in the 2003 recreation season, limiting most observations and counts to periods of time when the reservoir pool elevation was lower. However, unscheduled counts and aerial photographs of Lake Oroville boat ramps and their associated day use areas during 2003, when the reservoir pool elevation was higher, indicate that many of these sites are currently experiencing high levels of use that would likely be considered at and/or exceeding facility capacity, specifically during weekends and holidays. Additionally, at the less developed boat ramps, especially those located along the Lake Oroville shoreline, facility capacity is also dependent on reservoir pool elevation. At these sites, there tends to be less parking capacity at higher reservoir pool elevations compared to lower elevations. As such, both percent occupancy and reservoir pool elevation constraints limit facility capacity at boat ramps and their associated day use areas in the study area.
Another commonly observed facility capacity constraint at many of the boat ramps and their associated day use areas, especially those located adjacent to marinas, was the lack of specifically designated single vehicle and vehicle-with-trailer parking spaces. At many sites, single vehicles were parked in vehicle-with-trailer parking spaces, thus limiting the ability of the site to accommodate vehicles-with-trailers. Relicensing Study R-7 – Reservoir Boating specifically investigated single vehicle and vehicle-with-trailer percent occupancy at boat ramps and their associated day use areas. At many sites, single vehicles are limiting available vehicle-with-trailer capacity and represent a facility capacity constraint.
Demand for additional boat ramps and day use areas was measured as a component of Relicensing Study R-13 – Recreation Surveys. Visitors were asked whether there were “too few, about right, or too many” boat ramps and day use areas and associated facilities. Study area-wide demand specifically for day use areas and associated facilities is summarized in Section 5.4. Area-wide demand for boat ramps (measured by the percent of “too few” survey responses) was relatively high. Approximately 37 percent of survey respondents in the study area felt there were too few existing boat ramps. Survey respondents in the study area also indicated that there were too few

Final Recreation Carrying Capacity (R-8) Oroville Facilities P-2100 Relicensing
Proposed Final Report – For Distribution to Collaborative
Oroville Facilities Relicensing Team 5-59 June 2004
docks (52 percent), fish-cleaning stations (47 percent), boat-in gas stations (38 percent), and marinas (35 percent). While demand for these types of sites and facilities does not necessarily correspond to a lack of available facility capacity, it may indicate that some new boat ramps and associated facilities may be needed in order to help minimize potential capacity-related concerns, including resource degradation, perceived crowding, and visitor conflict.
Overall, existing facility capacity at boat ramps and their associated day use areas in the study area is considered to be approaching capacity. Considering existing and future percent occupancy constraints, vehicle parking constraints, and the effects of reservoir pool elevation on site functionality, facility capacity at these sites is considered to be a limiting factor.
5.5.1.4 Social Capacity
Overall, combined boat ramps and their associated day use areas in the study area are considered to be approaching their social capacity (Table 5.5-1). On an individual basis, most of the boat ramps and their associated day use areas were also categorized as approaching their social capacity. Additionally, the Afterbay Outlet BR and the OWA unimproved boat ramps were considered to be at their social capacity. It is not uncommon for a boat ramp to have a higher perceived crowding score than a campground or day use area because boat ramps tend to concentrate visitors at one access point for a limited time.
On an annual and recreation season basis, the mean perceived crowding score for all of the boat ramps and their associated day use areas on Lake Oroville was 3.2 and 3.4, respectively. At boat ramps and their associated day use areas on the Thermalito Forebay and Afterbay, the mean perceived crowding score was 3.0 annually and 3.1 during the recreation season. At all car-top boat ramps in the study area, both the annual and recreation season mean perceived crowding score was 2.9 (DWR 2004e). Considered in aggregate, these scores indicate that visitors are beginning to feel slightly crowded at these sites. While social capacity is considered to be approaching capacity based on the aggregate crowding scores at boat ramps and their associated day use areas in the study area, it is not a limiting factor at this time.
5.5.1.5 Overall Capacity Conclusion
Overall, both spatial and facility capacities are the primary limiting factors at the boat ramps and their associated day use areas in the study area (Table 5.5-1). All four capacity indicator variables were categorized as approaching capacity, though only spatial and facility capacities are limiting factors at this time. Spatial capacity is a limiting factor due to the general lack of expansion potential at existing sites and the inability to accommodate additional facilities within the existing footprint of these sites.However, areas identified in Relicensing Study R-15 – Recreation Suitability Analysis as

Final Recreation Carrying Capacity (R-8) Oroville Facilities P-2100 Relicensing
Proposed Final Report – For Distribution to Collaborative
Oroville Facilities Relicensing Team 5-60 June 2004
suitable for recreation development could potentially be used for new boat ramps and their associated day use areas in the study area, though shoreline conditions for boat ramps was not specifically investigated. Facility capacity is a limiting factor because of existing and future percent occupancy constraints, vehicle parking constraints, and the effects of reservoir pool elevation on site functionality. Considering the capacity indicator variables in aggregate, capacity-related decisions at boat ramps and their associated day use areas should be regarded as a moderate management priority at this time.
Unlike some of the other site types, substitute sites within the boat ramp and associated day use area category could likely help ease capacity concerns at specific sites (Table 5.5-1). Specifically, percent occupancy constraints, as well as reservoir pool level limitations, could potentially be ameliorated by redirecting visitors to sites that have available capacity or that function at lower pool levels. However, an effective interpretation and education program would likely help educate and redirect visitors to these sites.
5.5.2 Site-Specific Capacity of Boat Ramps and Day Use Areas
The following recreation sites with boat ramps and day use areas are discussed in this section:
Bidwell Canyon BR/DUA;
Lime Saddle BR/DUA;
Loafer Creek BR/DUA;
Monument Hill BR/DUA;
North Thermalito Forebay BR/DUA;
South Thermalito Forebay BR/DUA; and
Spillway BR/DUA.
The following recreation sites with boat ramps only are also discussed in this section:
Enterprise BR;
Wilbur Road BR;
Dark Canyon Car-top BR;
Foreman Creek Car-top BR;
Larkin Road Car-top BR;
Nelson Bar Car-top BR;
Stringtown Car-top BR;
Vinton Gulch Car-top BR; and
Afterbay Outlet BR.

Final Recreation Carrying Capacity (R-8) Oroville Facilities P-2100 Relicensing
Proposed Final Report – For Distribution to Collaborative
Oroville Facilities Relicensing Team 5-61 June 2004
Relicensing Study R-7 – Reservoir Boating discusses boating and on-water capacity in relation to many of these sites. In this analysis, a broader approach to site capacity was used to categorize use at each boat ramp (i.e., boating-related use at each site was one of many activities and uses that were investigated in aggregate). As such, results from this analysis are less specific to boating and/or boat ramp facility use and more specific to the entire site and/or use area. Nonetheless, where applicable, results from R-7 are summarized here as they relate to land-based capacity.
Additionally, while the car-top boat ramps in the study area are included in this analysis, the level of development at these sites is generally characterized as semi-primitive. The developed facilities at most of these sites are limited to restrooms. Often, the available area for parking is undefined and depends on the reservoir pool level. Often, additional parking areas are available at lower pool levels. As such, parking capacity (a component of facility capacity) is generally estimated based on available areas for parking at each site at full pool. At sites where all available areas for parking could not be positively identified, facility capacity is discussed in more qualitative terms. Also, at many of the car-top boat ramps in the study area, boat launching is only one of many activities that occur at these sites.
5.5.2.1 Bidwell Canyon BR/DUA
The Bidwell Canyon BR/DUA is located adjacent to the Bidwell Canyon Campground along the southern shoreline of Lake Oroville (Figure 1.2-1). The boat ramp has seven lanes that are useable at higher pool elevations. The site also has a visitor information station and fee collection booth and a marina. The concessionaire-operated marina offers boat rentals, groceries, fishing supplies, a snack bar, 500 berths and 300 mooring buoys, a fuel dock, a pumping station for boat holding tanks, boat storage, and trailer facilities with hookups. The DUA portion of the site has 2 shade structures, barbecues, picnic tables (21 total), potable water, 8 flush toilets, a gray water sump, a pay telephone, and 2 fish-cleaning stations. Additionally, the site has parking for 451 vehicles (283 for vehicles-with-trailers and 168 for single vehicles).
Ecological Capacity
During the winter field observation, two ecological variables (soil erosion and riparian impact) were described as being of moderate concern at the boat ramp area of this site, while trash accumulation was a moderate concern at the marina. At the day use portion of the site, only soil compaction was described as being of moderate concern. During the summer field observation, all of the ecological variables were described as being of low concern at the boat ramp. However, at the day use area, soil compaction was described as being of moderate concern. Overall, the site’s level of ecological impact is characterized as being of low concern. Ecological capacity at Bidwell Canyon BR/DUA is considered to be below capacity and not a limiting factor based on the low level of concern regarding ecological impacts at the site.

Final Recreation Carrying Capacity (R-8) Oroville Facilities P-2100 Relicensing
Proposed Final Report – For Distribution to Collaborative
Oroville Facilities Relicensing Team 5-62 June 2004
Spatial Capacity
In general, the potential to physically expand the Bidwell Canyon BR/DUA is limited.Expansion is constrained by private land to the west, the reservoir to the north and east, and the Bidwell Canyon Campground to the south. Additionally, most adjacent lands are categorized as moderate to low suitability in terms of future recreation development (DWR 2004f). However, some marginal areas or parts of the existing Bidwell Canyon BR/DUA could be used to increase the physical area of this site. Additionally, there are some limited opportunities to add additional facilities to this site.
On average, 83 VAOT and 189 VAOT were observed respectively on weekdays and weekends during the recreation season at this site. The maximum number of VAOT observed during the recreation season was 213 on weekdays and 228 on weekends (DWR 2004b). Relicensing Study R-7 – Reservoir Boating also investigated VAOT at this site, but differentiated between single vehicle and vehicle-with-trailer counts. On average, 65 single vehicles and 178 vehicles with trailers were observed at this site during recreation season weekends and holidays. The maximum observed was 117 single vehicles and 315 vehicles-with-trailers during recreation season weekends and holidays.
Overall, spatial capacity is considered to be at capacity. Some potential exists to increase the use density at this site by expanding the physical area of the site (into marginal adjacent areas) or by adding additional site facilities. Nonetheless, spatial capacity is considered a limiting factor at this time.
Facility Capacity
With nearly 195,500 RD, the Bidwell Canyon BR/DUA (including the marina) had the greatest annual amount of recreational use of all of the recreation facilities in the study area (DWR 2004b). More than half of this use (approximately 117,200 RD) occurred during the recreation season, of which approximately half is attributable to the marina at this site. During the recreation season, existing weekend recreational use at this site accounted for more than 23,300 RD. By 2050, annual recreation use is estimated to increase by approximately 117 percent to 423,300 RD (DWR 2004d).
Percent occupancy at the Bidwell Canyon BR/DUA was investigated as a component of Relicensing Study R-7 – Reservoir Boating. Individually, recreation season weekend percent occupancy for vehicles with trailers was 64 percent of capacity. Single vehicle occupancy was not calculated separately at this site, as single-vehicle parking spaces are not provided at this site. However, combined overall parking occupancy (single vehicle and vehicle with trailer) during recreation season weekdays and weekends is approximately 30 and 68 percent of capacity, respectively. During holiday weekends, percent occupancy is currently over 100 percent of capacity (DWR 2004b). Parking

Final Recreation Carrying Capacity (R-8) Oroville Facilities P-2100 Relicensing
Proposed Final Report – For Distribution to Collaborative
Oroville Facilities Relicensing Team 5-63 June 2004
capacity was actually exceeded on all three major recreation season holidays (Memorial Day, Independence Day, and Labor Day) during 2002.
Data collection for Relicensing Study R-9 – Existing Recreation Use and Relicensing Study R-7 – Reservoir Boating studies was completed early during the 2003 recreation season. However, due to a lack of parking, unscheduled observations during the 2003 recreation season indicate that visitors were commonly turned away by mid-morning during weekends when reservoir pool levels were higher. Vehicles that were turned away (generally marina users) could park in the adjacent residential area, while vehicles with trailers (typically boat ramp users) were directed to the Spillway BR/DUA. These conditions are likely more typical of recreation season weekends when the reservoir pool elevation is higher, as it was in 2003.
Currently, recreational use is considered to be approaching capacity based on percent occupancy, though facility capacity is likely being exceeded on recreation season weekends and holidays, especially when the reservoir pool elevation is higher. Additionally, by 2010 recreation season percent occupancy is expected to exceed 80 percent during weekends based on existing levels. As such, while weekend percent occupancy is currently considered to be approaching capacity, facility capacity is considered to be at capacity and a limiting factor because of existing holiday and future weekend percent occupancy constraints.
Social Capacity
The annual mean perceived crowding score at the Bidwell Canyon BR/DUA was 3.6.The mean perceived crowding score increased slightly during the recreation season to 4.2 (DWR 2004e). These scores, especially the recreation season score, indicate that visitors feel slightly crowded at this site. While visitors may feel slightly crowded, this site is considered to only be approaching its social capacity. As a result, social capacity is not considered to be a limiting factor at this time, but may be in the future.
Overall Site Capacity Conclusion
Overall, existing recreation use at the Bidwell Canyon BR/DUA is considered to be at capacity. Currently, both spatial and facility capacities are at capacity, while social capacity is approaching capacity and ecological capacity is below capacity. Spatial and facility capacities are the primary limiting factors at this time, though social capacity may be a limiting factor in the future. Spatial capacity is currently a limiting factor due to the lack of large areas to physically expand the existing footprint of the site, though site redesign and some limited expansion could likely be accommodated. Facility capacity is a limiting factor because of existing, as well as projected, high levels of recreation season weekend and holiday percent occupancy during higher reservoir pool elevations. Considering these capacity indicator variables in aggregate, capacity-related decisions at the Bidwell Canyon BR/DUA should be regarded as a high

Final Recreation Carrying Capacity (R-8) Oroville Facilities P-2100 Relicensing
Proposed Final Report – For Distribution to Collaborative
Oroville Facilities Relicensing Team 5-64 June 2004
management priority at this time. Relicensing Study R-7 – Reservoir Boating discussesadditional capacity concerns at this site.
5.5.2.2 Lime Saddle BR/DUA
The Lime Saddle BR/DUA is located on the western shoreline of the West Branch of the North Fork arm of Lake Oroville (Figure 1.2-1). There is a staffed kiosk at the entrance of the site to collect fees and provide information. The boat ramp consists of four lanes and a concessionaire-operated full-service marina. The marina offers gas, a boat repair and supply shop, a general store with fishing supplies, a pumping station, and boat rentals (houseboats, patio boats, fishing boats, and ski boats). Short- and long-term overnight moorage, docks, and covered and open slips are also available at the marina.The day use portion of the site consists of 13 picnic tables, 7 shade structures, 4 flush toilets, a drinking fountain, a pay telephone, a fish cleaning station, 2 trash dumpsters, and 2 large parking areas. The main parking area has 43 single-vehicle parking spaces and 127 vehicle-with-trailer parking spaces. The overflow parking area has 64 single-vehicle parking spaces and approximately 100 vehicle-with-trailer parking spaces.
Ecological Capacity
During both the winter and summer field observations, three ecological variables (soil erosion, soil compaction, and user-defined trails) were described as being of moderate concern at the Lime Saddle BR/DUA, while all the other ecological variables were described as low concerns. Overall, the site’s level of ecological impact is characterized as being of low concern. Ecological capacity at the Lime Saddle BR/DUA is considered to be below capacity and not a limiting factor based on the low level of concern regarding ecological impacts at the site.
Spatial Capacity
The potential exists to expand the physical area of Lime Saddle BR/DUA. Areas to the west and northwest of the existing site could be used to expand the area available for recreation. Expansion in other directions is constrained primarily by the reservoir, existing roads, and private property (though the adjacent Pacific Gas and Electric Company [PG&E] property offers good opportunities for parking expansion). According to results from Relicensing Study R-15 – Recreation Suitability Analysis, adjacent lands are characterized as a mix of high, moderate, and low suitability in terms of future recreation development. In general, there are also very limited opportunities to add additional facilities to this site. However, the DUA overlooking the marina could likely accommodate some additional facilities.
On average, 52 VAOT and 126 VAOT were observed respectively on weekdays and weekends during the recreation season at this site (in the main parking area only). The maximum number of VAOT observed during the recreation season was 76 on

Final Recreation Carrying Capacity (R-8) Oroville Facilities P-2100 Relicensing
Proposed Final Report – For Distribution to Collaborative
Oroville Facilities Relicensing Team 5-65 June 2004
weekdays and 183 on weekends (DWR 2004b). Relicensing Study R-7 – ReservoirBoating also investigated VAOT at this site, but differentiated between single vehicle and vehicle with trailer counts. On average, 76 single vehicles and 78 vehicles with trailers were observed at this site during recreation season weekends and holidays. The maximum observed was 151 single vehicles and 168 vehicles with trailers during recreation season weekends and holidays.
Overall, spatial capacity is considered to be approaching capacity at the Lime Saddle BR/DUA. Some potential exists to increase the use density at this site by expanding the physical area of the site (into adjacent areas) or by adding additional site facilities. As such, spatial capacity is not considered a limiting factor at this time.
Facility Capacity
The Lime Saddle BR/DUA (including the marina) is one of the most frequently-used recreation facilities in the study area. Annually, existing recreational use of this facility accounted for over 153,500 RD (DWR 2004b). Nearly 70 percent of annual recreation use (approximately 106,300 RD) occurred during the recreation season. During the recreation season, weekday use of this site accounted for almost 68,200 RD, while weekend use accounted for more than 38,100 RD. By 2050, annual recreation use is estimated to increase by approximately 117 percent to 332,470 RD (DWR 2004d).During recreation season weekends, projected recreation use at this site is anticipated to reach approximately 82,500 RD by 2050.
Similar to other developed boat ramps in the study area, percent occupancy at the Lime Saddle BR/DUA was investigated as a component of Relicensing Study R-7 – Reservoir Boating. Individually, recreation season weekend and holiday percent occupancy for vehicles was 169 percent of capacity, while vehicles-with-trailer occupancy was 60 percent of capacity(not including the overflow parking area capacity). Vehicle and vehicle-with-trailers occupancies were calculated separately, as both types of parking spaces are provided at this site. Combined, overall parking occupancy during recreation season weekdays and weekends is approximately 21 and 51 percent of capacity, respectively (including the overflow parking capacity). During holiday weekends, percent occupancy is currently about 80 percent of capacity (DWR 2004b).
As noted in Relicensing Study R-7 – Reservoir Boating, parking capacity at the Lime Saddle BR/DUA exceeded 100 percent on July 5, 2002 (the Friday after the Fourth of July) in both the main parking area and the overflow lot. Aerial photographs taken on July 28, 2003, indicate a similar occurrence of both parking areas being used to full capacity. This level of use may be more indicative of recreation season weekend occupancy when pool levels are higher.
Existing recreational use is considered to be below capacity based on percent occupancy, though facility capacity is reaching and likely exceeding 80 percent
Final Recreation Carrying Capacity (R-8) Oroville Facilities P-2100 Relicensing
Proposed Final Report – For Distribution to Collaborative
Oroville Facilities Relicensing Team 5-66 June 2004
occupancy on recreation season weekends and holidays when reservoir pool levels are higher. Additionally, by 2030, recreation season percent occupancy is predicted to exceed 80 percent during weekends. As such, while facility capacity is currently below capacity, this capacity type is considered a limiting factor because of existing recreation season weekend and holiday occupancy constraints when the reservoir pool level is higher.
Social Capacity
At the Lime Saddle BR/DUA, a sufficient number of completed surveys were returned to determine separate perceived crowding scores for both the boat ramp and day use area. At the day use area, the annual and recreation season mean crowding score was 2.9. At the boat ramp, the annual crowding score was slightly lower at 2.8, while the recreation season crowding score was slightly higher at 3.0 (DWR 2004e). The crowding scores at both the boat ramp and day use area are relatively low and generally indicate that visitors may feel slightly crowded at this site. Because of these low scores, social capacity is estimated to be below capacity at the Lime Saddle BR/DUA and is not considered a limiting factor at this time.
Overall Site Capacity Conclusion
Overall, existing recreation use at the Lime Saddle BR/DUA is considered to be approaching capacity. Currently, ecological, facility, and social capacities are below capacity, while spatial capacity is approaching capacity. However, facility capacity is the primary limiting factor at this time. Facility capacity is a limiting factor because of existing, as well as projected, high levels of recreation season weekend and holiday percent occupancy during higher reservoir pool elevations. Considering these capacity indicator variables in aggregate, capacity-related decisions at the Lime Saddle BR/DUA should be regarded as a moderate management priority at this time. Relicensing Study R-7 – Reservoir Boating discusses additional capacity concerns at this site.
5.5.2.3 Loafer Creek BR/DUA
The Loafer Creek BR/DUA is located adjacent to the Loafer Creek Campground and both share a visitor information and fee collection booth (Figure 1.2-1). The boat ramp consists of 8 lanes, a large parking area with 192 vehicle-with-trailer spaces, 2 flush toilets, and a pay telephone. The day use area portion of the site consists of 80 picnic tables, barbecues (including several large group grills), shade trees, a swimming cove area with a beach (when pool levels are high), a playground area, 8 flush toilets, drinking fountains, showers, and a large parking area with 251 single vehicle spaces.

Final Recreation Carrying Capacity (R-8) Oroville Facilities P-2100 Relicensing
Proposed Final Report – For Distribution to Collaborative
Oroville Facilities Relicensing Team 5-67 June 2004
Ecological Capacity
All of the ecological variables were characterized as low concerns at the Loafer Creek BR/DUA during both the winter and summer field observations. Overall, the site’s level of ecological impact is characterized as being of low concern. Ecological capacity at the Loafer Creek BR/DUA is considered to be below capacity and not a limiting factor based on the low level of concern regarding ecological impacts at the site.
Spatial Capacity
The potential exists to physically expand the developed recreation site at Loafer Creek in most directions, including the boat ramp and day use area, except in the direction of the reservoir. Additionally, most existing site lands, as well as adjacent lands, are categorized as moderate to high in terms of future recreation development (DWR 2004f). There are limited opportunities to add additional facilities to the existing site. However, the day use area could likely accommodate some additional facilities.
On average, 6 PAOT were observed on weekdays and 10 PAOT were observed on weekends during the recreation season at the Loafer Creek DUA. The maximum number of PAOT observed during the recreation season was 24 on both weekdays and weekends. PAOT were not investigated at the boat ramp portion of this site. During the recreation season at the day use area portion of this site, the average VAOT observed on weekdays and weekends was 4, while the maximum VAOT was 8 on both weekdays and weekends. At the boat ramp, on average 12 VAOT were observed on weekdays and 82 VAOT were observed on weekends during the recreation season. The maximum number of VAOT observed during the recreation season at the boat ramp was 17 on weekdays and 126 on weekends (DWR 2004b). Relicensing Study R-7 – Reservoir Boating also investigated VAOT at the boat ramp at of this site, but differentiated between single vehicle and vehicle-with-trailer counts. On average, 26 single vehicles and 72 vehicles-with-trailers were observed at this site during recreation season weekends and holidays. The maximum observed was of 57 single vehicles and 138 vehicles-with-trailers during recreation season weekends and holidays.
Overall, spatial capacity is considered to be approaching capacity at the Loafer Creek BR/DUA. There is some potential to increase the use density at the existing site (i.e., add new facilities within the existing footprint of the site) and the potential also exists to physically expand the site into adjacent areas. As such, spatial capacity is not considered a limiting factor at this time.
Facility Capacity
Annual recreation use of the Loafer Creek BR/DUA accounted for over 58,200 RD (DWR 2004b). Unlike some of the other boat ramp and day use area combination sites in the study area, the facilities at Loafer Creek are located in separate areas. As such,

Final Recreation Carrying Capacity (R-8) Oroville Facilities P-2100 Relicensing
Proposed Final Report – For Distribution to Collaborative
Oroville Facilities Relicensing Team 5-68 June 2004
facility capacity was investigated in total, but also individually for the boat ramp and day use area. Individually, the boat ramp accounted for 29,250 RD and the day use area accounted for 29,000 RD on an annual basis. During the recreation season, existing use of the boat ramp accounted for 25,160 RD and the day use area accounted for over 11,000 RD. By 2050, it is projected that recreational use of the Loafer Creek BR/DUA will account for a total of over 119,300 RD annually. Annual recreational use of the boat ramp is projected to be approximately 64,850 RD, while use of the day use area is projected to be about 54,470 RD by 2050 (DWR 2004d). At the boat ramp and day use area, this represents an increase in use from existing levels of 122 and 88 percent respectively.
Percent occupancy at the Loafer Creek BR/DUA was investigated as a component of Relicensing Study R-7 – Reservoir Boating, though only for the boat ramp portion of the site. Recreation season weekend percent occupancy for vehicles-with-trailers was 38 percent of capacity. Only vehicles-with-trailers occupancy was calculated at this site, as there are no specific single vehicle parking spaces in the boat ramp parking area.Overall parking occupancy (combined single vehicle and vehicles-with-trailers) during recreation season weekdays and weekends is approximately 6 and 43 percent of capacity, respectively. During holiday weekends, percent occupancy is currently about 40 percent of capacity (DWR 2004b). These existing percent occupancies are relatively low; however, counts at this site were completed primarily during a period of lower pool elevation, including times when this ramp was unusable due to reservoir pool level.
During Memorial Day weekend of 2003, when the reservoir pool elevation was higher and the ramp was usable, the parking area of the boat ramp was at or near 100 percent capacity, including single vehicles parked in vehicle-with-trailer spaces (DWR 2004a).This level of use may be more indicative of recreation season weekend and holiday occupancy when pool levels are higher.
At the day use area portion of this site, parking occupancy was only about 2 percent of capacity during both recreation season weekdays and weekends (DWR 2004b). These percent occupancies are very low. Similar to the boat ramp portion of this site, however, counts were completed primarily at lower reservoir pool elevations when the swim area was unusable. Regardless of pool level, this site appears underused based on available capacity.
Based on existing use, the boat ramp is projected to reach and/or exceed 80 percent recreation season weekend percent occupancy by 2030, while the day use area is not anticipated to reach and/or exceed any of the established facility capacity thresholds (DWR 2004d). While existing use levels are considered below capacity, facility capacity is considered a limiting factor at the Loafer Creek BR/DUA. At the boat ramp, facility capacity is reaching and likely exceeding 80 percent occupancy on recreation season weekends and holidays when reservoir pool levels are higher. By 2030, recreation season percent occupancy at the boat ramp is predicted to exceed 80 percent during

Final Recreation Carrying Capacity (R-8) Oroville Facilities P-2100 Relicensing
Proposed Final Report – For Distribution to Collaborative
Oroville Facilities Relicensing Team 5-69 June 2004
weekends. Additionally, the boat ramp is not usable at lower pool elevations. At the day use area, existing use levels are low, but the reservoir pool elevation often limits the amount of use the site receives. As such, while facility capacity is currently below capacity, this capacity type is considered a limiting factor.
Social Capacity
Similar to the Lime Saddle BR/DUA, a sufficient number of completed surveys were obtained at both the boat ramp and day use area at Loafer Creek to determine separate crowding scores for each. The annual and recreation mean perceived crowding score at the day use area was 2.6 and 2.7, respectively (DWR 2004e). These scores are low and indicate that visitors to the day use area generally do not feel crowded. At the boat ramp, the crowding scores were higher at 4.4 annually and 4.5 during the recreation season. These scores indicate that visitors to the boat ramp tend to feel slightly crowded. It is not uncommon for a boat ramp to have a higher perceived crowding score than a day use area because boat ramps tend to concentrate visitors at one access point. Considered in aggregate, the crowding scores at the day use area and boat ramp are still relatively low. Social capacity is considered to be approaching capacity at this site because of these crowding scores; social capacity is not a limiting factor at this time, but may be in the future.
Overall Site Capacity Conclusion
Overall, existing recreation use at this site is considered to be approaching capacity. Currently, spatial and social capacities are approaching capacity, while ecological and facility capacities are considered below capacity. Facility capacity is the primary limiting factor at this time, though spatial and social capacities may be in the future. Facility capacity is a limiting factor because of existing, as well as projected high levels of recreation season weekend and holiday percent occupancy during higher reservoir pool elevations at the boat ramp and reservoir pool level constraints at both the boat ramp and day use area. Considering these capacity indicator variables in aggregate, capacity-related decisions at the Loafer Creek BR/DUA should be regarded as a moderate management priority at this time. Relicensing Study R-7 – Reservoir Boatingdiscusses additional capacity concerns at this site.
5.5.2.4 Monument Hill BR/DUA
Located on the eastern shoreline of the Thermalito Afterbay, the Monument Hill BR/DUA has two boat ramp lanes and a floating dock (Figure 1.2-1). There are 10 picnic tables, nine barbecues, four flush toilets, a fish cleaning station, and a swimming beach associated with the day use portion of this site. The parking area at this site has 10 single-vehicle parking spaces, 39 vehicle-with-trailer spaces, and a gravel overflow parking area with room for about 50 vehicles adjacent to the site.

Final Recreation Carrying Capacity (R-8) Oroville Facilities P-2100 Relicensing
Proposed Final Report – For Distribution to Collaborative
Oroville Facilities Relicensing Team 5-70 June 2004
Ecological Capacity
All of the ecological variables, except wetland impact (moderate concern), were characterized as low concerns at the Monument Hill BR/DUA during both the winter and summer field observations. Overall, the site’s level of ecological impact is characterized as being of low concern. Ecological capacity at the Monument Hill BR/DUA is considered to be below capacity and not a limiting factor based on the low level of concern regarding ecological impacts at the site.
Spatial Capacity
Several adjacent areas to the north and east of the existing site could be used to physically expand the Monument Hill BR/DUA. Additionally, most existing site lands, as well as adjacent lands to the north and east, are categorized as high in terms of future recreation development (DWR 2004f). Low suitability potential and the Afterbay constrain potential expansion of this site to the west and south, respectively. Also, this site could likely accommodate some additional facilities within the existing footprint of use.
During the recreation season, an average of 13 PAOT and 36 PAOT were observed on weekdays and weekends, respectively, at the Monument Hill BR/DUA. The maximum number of PAOT observed during the recreation season on weekdays was 36 and on weekends was 54. On average, 11 VAOT were observed on weekdays and 25 VAOT were observed on weekends during the recreation season at this site. The maximum number of VAOT observed during the recreation season was 20 on weekdays and 47 on weekends (DWR 2004b). Relicensing Study R-7 – Reservoir Boating also investigated VAOT at this site, but differentiated between single vehicle and vehicle-with-trailer counts. On average, 21 single vehicles and 24 vehicles-with-trailers were observed at this site during recreation season weekends and holidays. Additionally, a maximum of 40 single vehicles and 47 vehicles-with-trailers were observed during recreation season weekends and holidays (including the overflow parking area).
Overall, spatial capacity is considered to be approaching capacity at the Monument Hill BR/DUA. There is some potential to increase the use density at the existing site (i.e., add new facilities within the existing footprint of the site). Also, the potential exists to physically expand the site into adjacent areas, specifically to the north and east. For these reasons, spatial capacity is not considered a limiting factor at this time.
Facility Capacity
Annually, existing recreation use of the Monument Hill BR/DUA is estimated to account for almost 56,800 RD (DWR 2004b). More than 65 percent (about 38,000 RD) of annual use at this site occurred during the recreation season. Weekday use during the recreation season accounted for nearly 21,000 RD, while weekend use accounted for

Final Recreation Carrying Capacity (R-8) Oroville Facilities P-2100 Relicensing
Proposed Final Report – For Distribution to Collaborative
Oroville Facilities Relicensing Team 5-71 June 2004
almost 17,000 RD at this site. By 2050, annual recreation use is estimated to increase by approximately 95 percent to 110,440 RD (DWR 2004d). During recreation season weekends, projected recreation use at this site is anticipated to reach over 33,000 RD by 2050.
Similar to other developed BRs in the study area, percent occupancy at the Monument Hill BR/DUA was investigated as a component of Relicensing Study R-7 – ReservoirBoating. Individually, recreation season weekend and holiday percent occupancy for vehicles was 210 percent of capacity, while vehicles-with-trailer occupancy was 62 percent of capacity (not including the overflow parking area capacity). Combined, overall parking occupancy during recreation season weekdays and weekends is approximately 13 and 30 percent of capacity, respectively (including the overflow parking capacity). During holiday weekends, percent occupancy is currently about 75 percent of capacity (DWR 2004b).
Existing recreational use is considered to be below capacity based on percent occupancy, though facility capacity is nearing 80 percent occupancy on recreation season holidays. Recreation season weekend capacity is not expected to reach and/or exceed 80 percent occupancy by 2050. However, without the overflow parking area, this site would likely be considered approaching and/or at capacity on recreation season weekends. As such, while facility capacity is currently below capacity based on existing percent occupancy, facility capacity is considered a limiting factor at this time.
Social Capacity
At the Monument Hill BR/DUA, the annual and recreation season mean perceived crowding scores were 3.1 and 3.4, respectively (DWR 2004e). These scores were developed primarily from BR visitors, as a very small number (less than 5) of completed surveys were collected at the day use area. The crowding scores at this site are relatively low and indicate that visitors feel slightly crowded. The Monument Hill BR/DUA is approaching its social capacity based on these crowding scores. However, social capacity is not considered a limiting factor at this time.
Overall Site Capacity Conclusion
Overall, existing recreation use at the Monument Hill BR/DUA is considered to be approaching capacity. Currently, both ecological and facility capacities are below capacity, while spatial and social capacities are approaching capacity. Only facility capacity is considered a limiting factor at this time, though both spatial and social capacities may be limiting factors in the future. Facility capacity is a limiting factor because of potential parking constraints. Considering these capacity indicator variables in aggregate, capacity-related decisions at the Monument Hill BR/DUA should be regarded as a moderate management priority at this time. Relicensing Study R-7 – Reservoir Boating discusses additional capacity concerns at this site.

Final Recreation Carrying Capacity (R-8) Oroville Facilities P-2100 Relicensing
Proposed Final Report – For Distribution to Collaborative
Oroville Facilities Relicensing Team 5-72 June 2004
5.5.2.5 North Thermalito Forebay BR/DUA
The North Thermalito Forebay BR/DUA is located on the northern shoreline of the Thermalito Forebay (Figure 1.2-1). There is a staffed visitor information/fee collection booth at the entrance and two boat ramps, one with two lanes and the other with three lanes. Parking at the boat ramp and day use area consists of 25 spaces for vehicles-with-trailers, 59 spaces for single vehicles, and an unpaved overflow area. The site also has 6 flush toilets, a swimming beach, a large picnic area with 117 picnic tables, shared barbecues grills, shade trees, drinking faucets, a pay telephone, and 15 parking spaces reserved for RV “en route” camping (see Section 5.2.2.5—North Thermalito Forebay RV “En Route” Campground).
Ecological Capacity
All of the ecological variables, except soil erosion (moderate concern), were characterized as low concerns at the North Thermalito Forebay BR/DUA during both the winter and summer field observations. Overall, the site’s level of ecological impact is characterized as being of low concern. Ecological capacity at the North Thermalito Forebay BR/DUA is considered to be below capacity and not a limiting factor based on the low level of concern regarding ecological impacts at the site.
Spatial Capacity
The potential exists to physically expand the North Thermalito Forebay developed recreation site, including the boat ramp and day use area. The existing site could be expanded to increase the physical area available for recreation. Also, most existing site lands, as well as some adjacent lands to the southeast, are categorized as high in terms of future recreation development (DWR 2004f). The potential exists to provide some additional site facilities that could be used to increase use/facility density at the North Thermalito Forebay BR/DUA.
On average, 37 PAOT were observed on weekdays and 337 PAOT were observed on weekends during the recreation season at the North Thermalito Forebay BR/DUA. The maximum number of PAOT observed during the recreation season on weekdays was 90 and on weekends was 423. On average, 11 VAOT were observed on weekdays and 143 VAOT were observed on weekends during the recreation season at this site. The maximum number of VAOT observed during the recreation season was 20 on weekdays and 192 on weekends (DWR 2004b). Relicensing Study R-7 – ReservoirBoating also investigated VAOT at this site. On average, 4 vehicles with trailers were observed at this site during recreation season weekends and holidays (single vehicle counts were not reported). Additionally, a maximum of 11 vehicles with trailers were observed during recreation season weekends and holidays.

Final Recreation Carrying Capacity (R-8) Oroville Facilities P-2100 Relicensing
Proposed Final Report – For Distribution to Collaborative
Oroville Facilities Relicensing Team 5-73 June 2004
Overall, spatial capacity is considered to be below capacity at the entire North Thermalito Forebay developed recreation site, including the boat ramp and day use area. Spatial capacity is not considered a limiting factor at this time, as the potential exists to physically expand the site into adjacent areas and the existing area could be redesigned to accommodate more site facilities.
Facility Capacity
Existing recreation use at the North Thermalito Forebay BR/DUA is estimated to be approximately 86,000 RD annually (DWR 2004b), with slightly more than half (about 46,200 RD) this use occurring during the recreation season. Weekday use during the recreation season accounted for more than 18,200 RD, while weekend use accounted for almost 28,000 RD. By 2050, annual recreation use is estimated to increase by about 76 percent to more than 151,000 RD (DWR 2004d). During recreation season weekends, projected recreation use at this site is anticipated to be nearly 49,150 RD by 2050.
Percent occupancy at the North Thermalito Forebay BR/DUA was investigated as a component of the Relicensing Study R-7 – Reservoir Boating, though only for vehicles with trailers. During recreation season weekends and holidays, percent occupancy was only 15 percent of capacity for vehicles with trailers. Overall parking occupancy (single vehicles and vehicles-with-trailers) during recreation season weekdays and weekends is approximately 4 and 47 percent of capacity, respectively. During holiday weekends, percent occupancy is currently about 99 percent of capacity (DWR 2004b).
Existing recreational use is considered to be below capacity based on percent occupancy, though facility capacity is over 80 percent occupancy on recreation season holidays. However, as noted in the Relicensing Study R-7 – Reservoir Boating,utilization of vehicle-with-trailer parking spaces is very low, even during recreation season weekends. Recreation season weekend capacity is predicted to reach and/or exceed 80 percent occupancy by 2050. As such, while existing percent occupancy is relatively low, facility capacity is considered a limiting factor at this time due to potential future parking capacity constraints.
Social Capacity
Perceived crowding at the North Thermalito Forebay BR/DUA site was not investigated separately (DWR 2004e) from the other site facilities (Aquatic Center and the “En Route” Campground). The annual perceived crowding score of visitors to the North Thermalito Forebay recreation site was 3.4, while the recreation season crowding score was about 3.7. These scores are relatively low and indicate that visitors feel slightly crowded at this site. Based on these perceived crowding scores, this site is considered to be approaching its social capacity; however, spatial capacity is not considered a limiting factor at this time.

Final Recreation Carrying Capacity (R-8) Oroville Facilities P-2100 Relicensing
Proposed Final Report – For Distribution to Collaborative
Oroville Facilities Relicensing Team 5-74 June 2004
Overall Site Capacity Conclusion
Overall, existing recreation use at the North Thermalito Forebay BR/DUA is considered to be below capacity. Currently, ecological, spatial, and facility capacities are below capacity, while ecological capacity is approaching capacity. Only facility capacity is considered a limiting factor at this time, though ecological capacity may be a limiting factor in the future. Facility capacity is a limiting factor because of potential parking constraints in the future. Considering these capacity indicator variables in aggregate, capacity-related decisions at this site should be regarded as a low management priority at this time. Relicensing Study R-7 – Reservoir Boating discusses additional capacity concerns at this site.
5.5.2.6 South Thermalito Forebay BR/DUA
The South Thermalito Forebay BR/DUA is located on the southern shoreline of the Thermalito Forebay (Figure 1.2-1). The site consists of a self-registration pay station, a two-lane boat ramp, 10 picnic tables, 10 barbecues, shade trees, a vault toilet building, a fish-cleaning station, and a large gravel parking area with room for approximately 50 vehicles.
Ecological Capacity
During both the winter and summer field observations, soil erosion and soil compaction were the only concerns characterized as moderate at the South Thermalito Forebay BR/DUA; all other variables were described as low. Overall, the site’s level of ecological impact is characterized as being of low concern. Ecological capacity at the South Thermalito Forebay BR/DUA is considered to be below capacity and not a limiting factor based on the low level of concern regarding ecological impacts at the site.
Spatial Capacity
The potential exists to physically expand the South Thermalito Forebay BR/DUA. The existing site could be expanded to the south in order to increase the physical area available for recreation. The Forebay itself limits additional development to the north of the existing site. Also, most existing site lands, as well as most adjacent lands to the south, are categorized as high in terms of future recreation development (DWR 2004f).Additional facilities could also likely be added to the existing footprint of this site.
On average during the recreation season, 6 PAOT were observed on weekdays and 12 PAOT were observed on weekends at the South Thermalito Forebay BR/DUA. The maximum number of PAOT observed during the recreation season on weekdays was 16 and on weekends was 21. On average during the recreation season, 6 VAOT were observed on weekdays and weekends at this site. The maximum number of VAOT

Final Recreation Carrying Capacity (R-8) Oroville Facilities P-2100 Relicensing
Proposed Final Report – For Distribution to Collaborative
Oroville Facilities Relicensing Team 5-75 June 2004
observed during the recreation season was 11 on weekdays and 10 on weekends (DWR 2004b).
Overall, spatial capacity at the South Thermalito Forebay BR/DUA is considered to be below capacity. Spatial capacity is not considered a limiting factor at this time, as the potential exists to physically expand the site into adjacent areas and the existing area could be redesigned to accommodate more facilities.
Facility Capacity
Annually, existing recreation use at the South Thermalito Forebay BR/DUA is estimated to be slightly less than 50,000 RD (DWR 2004b), with more than 32,000 RD occurring during the recreation season at this site. During the recreation season, weekday use accounted for nearly 19,000 RD and weekend use accounted for more than 13,000 RD.By 2050, an increase in recreational use of approximately 73 percent is projected at this site. It is estimated that annual recreation use will account for nearly 86,000 RD by 2050, of which approximately 22,700 will be attributable to recreation season weekends (DWR 2004d).
Existing utilization of this site was approximately 12 percent of capacity during both recreation season weekdays and weekends. During holidays, percent occupancy at this site increased to 30 percent of capacity (DWR 2004b). These percent occupancies are considered below capacity for the recreation season. These lower levels of percent occupancy are likely due to the existing large, undefined gravel parking area that can accommodate a large amount of existing use. By 2050, it is anticipated that percent occupancy will only reach and/or slightly exceed 20 percent during recreation season weekends.
Existing recreational use of this site is considered below capacity based on percent occupancy. Additionally, recreation season weekend capacity is not expected to reach and/or exceed the 80 percent occupancy threshold by 2050. As such, facility capacity is not considered a limiting factor at this time.
Social Capacity
At the boat ramp portion of this site, the annual and recreation season mean perceived crowding scores were 1.8 and 1.9, respectively. The crowding score at the day use area was 2.9 annually and during the recreation season (DWR 2004e). Crowding scores at the South Thermalito Forebay BR/DUA are low and indicate that visitors generally do not feel crowded. Because of these low perceived crowding scores, social capacity is considered to be below capacity at this site and not a limiting factor at this time.
Final Recreation Carrying Capacity (R-8) Oroville Facilities P-2100 Relicensing
Proposed Final Report – For Distribution to Collaborative
Oroville Facilities Relicensing Team 5-76 June 2004
Overall Site Capacity Conclusion
Overall, existing recreation use at the South Thermalito Forebay BR/DUA is considered below capacity. Currently, all of the capacity indicators are below capacity and none are anticipated to be limiting factors in the future. This does not mean that there is no existing and/or future limiting factor at this site; rather, the lack of a limiting factor indicates that the capacity indicators employed during this analysis may not be appropriate at this site and other indicators should be considered for future monitoring. Considering the capacity indicator variables in aggregate, capacity-related decisions at the South Thermalito Forebay BR/DUA should be regarded as a low management priority at this time.
5.5.2.7 Spillway BR/DUA
Located adjacent to the north abutment of Oroville Dam, the Spillway BR/DUA has two boat ramps and is the largest boat ramp facility at the reservoir (Figure 1.2-1). One of the ramps has 12 lanes and can be used during medium to higher pool elevations, while the second ramp has 8 lanes and can be used at lower to medium pool elevations. The parking area associated with the 8-lane boat ramp has 200 vehicle-with-trailer parking spaces, but is submerged at higher pool elevations. The main parking area has 350 vehicle-with-trailer spaces, 40 of which are set aside for “en route” RV camping (Section 5.2.2.6), and 118 single-vehicle parking spaces. Additionally, even at higher pool elevations, there is parking for approximately 75 vehicles-with-trailers on the boat ramp.The day use portion of the site consists of a seasonally-staffed visitor information and fee collection booth, six flush toilets, potable water, a fish-cleaning station, and five picnic tables with shade structures and trees.
Ecological Capacity
At the Spillway BR/DUA, soil erosion and fugitive dust were described as moderate concerns during the winter field observation. All of the other ecological variables were characterized as low concerns. During the summer field observation, all of the ecological variables were described as low concerns. Overall, the site’s level of ecological impact is characterized as being of low concern. Ecological capacity at the Spillway BR/DUA is considered to be below capacity and not a limiting factor based on the low level of concern regarding ecological impacts at the site.
Spatial Capacity
The potential to physically expand the developed recreation site at the Spillway, including the boat ramp and day use area, is limited. Expansion is primarily constrained by unfavorable slopes and adjacent project facilities. Additionally, most adjacent lands are categorized as moderate to low suitability in terms of future recreation development (DWR 2004f). However, some adjacent areas to the west of the existing site could be

Final Recreation Carrying Capacity (R-8) Oroville Facilities P-2100 Relicensing
Proposed Final Report – For Distribution to Collaborative
Oroville Facilities Relicensing Team 5-77 June 2004
used to slightly increase the physical area or use/facility density at this site. In general, a few additional facilities could also likely be added to this site, though large increases in the number of site facilities are not feasible.
On average, 36 VAOT and 106 VAOT were observed respectively on weekdays and weekends during the recreation season at this site. The maximum number of VAOT observed during the recreation season was 46 on weekdays and 184 on weekends (DWR 2004b). Relicensing Study R-7 – Reservoir Boating also investigated VAOT at this site, but differentiated between single-vehicle and vehicle-with-trailer counts. On average, 33 single vehicles and 100 vehicles with trailers were observed at this site during recreation season weekends and holidays. Additionally, a maximum of 79 single vehicles and 211 vehicles with trailers were observed during recreation season weekends and holidays.
Overall, spatial capacity is considered to be at capacity at this site. The potential exists to slightly expand the physical area of the site into adjacent areas and to add a few additional site facilities, though both options are limited. As such, spatial capacity is considered a limiting factor at this time at the Spillway BR/DUA.
Facility Capacity
Existing recreation use of the Spillway BR/DUA accounted for more than 80,000 RD annually (DWR 2004b). Slightly more than half (approximately 41,000 RD) of the annual use of this site occurred during the recreation season. Weekday use during the recreation season accounted for almost 19,500 RD, while weekend use accounted for more than 21,500 RD. By 2050, annual recreation use is estimated to increase by about 120 percent to more than 177,000 RD (DWR 2004d). During recreation season weekends, projected recreation use at this site is anticipated to be nearly 43,000 RD by 2050.
Percent occupancy at the Spillway BR/DUA was investigated as a component of Relicensing Study R-7 – Reservoir Boating. Individually, recreation season weekend percent occupancy for vehicles was 28 percent of capacity, while vehicles-with-trailers occupancy was 29 percent of capacity (only including the main parking area). Similar to other developed BRs in the study area, single-vehicle and vehicle-with-trailersoccupancies were calculated separately as parking spaces are not specifically signed either way at this site. Combined, overall parking occupancy during recreation season weekdays and weekends is approximately 7 and 23 percent of capacity, respectively (including the overflow parking capacity). During holiday weekends, percent occupancy is currently about 25 percent of capacity (DWR 2004b).
The Spillway BR/DUA provides the largest ramp on the reservoir, has the greatest number of parking spaces, and is usable at all pool elevations (down to 695 feet above msl). Additionally, more parking areas become available as the pool level drops,

Final Recreation Carrying Capacity (R-8) Oroville Facilities P-2100 Relicensing
Proposed Final Report – For Distribution to Collaborative
Oroville Facilities Relicensing Team 5-78 June 2004
increasing the total parking capacity of this site. Even during higher pool levels, however, existing percent occupancy indicates that the main parking area does not fill to 100 percent capacity during the recreation season. Additionally, percent occupancy is not anticipated to reach and/or exceed the 80 percent recreation season weekend occupancy threshold by 2050. As such, existing recreational use at this site is considered below capacity, though may be approaching capacity by 2050.
While existing percent occupancy is relatively low, facility capacity is considered a limiting factor at this time because of potential access constraints to the Spillway BR/DUA. Visitors must cross the top of the dam to access this site. In the event of heightened security, the potential exists to close visitor access across the top of the dam, thus prohibiting access to the Spillway BR/DUA. While this potential may be unlikely, it nonetheless represents a facility capacity constraint. As such, while facility capacity is currently below capacity based on existing percent occupancy, this capacity type is considered a limiting factor at this time due to potential access constraints.
Social Capacity
Perceived crowding at the Spillway BR/DUA developed recreation site was not investigated separately from the “en route” campground (DWR 2004e). The annual perceived crowding score of visitors to the Spillway Recreation Area was 2.9. During the recreation season, the perceived crowding score was about 3.2. These scores are relatively low and indicate that visitors only feel slightly crowded at this site. Based on the recreation season perceived crowding score, this site is considered to be approaching its social capacity; however, social capacity is not considered a limiting factor at this time. The recreation season crowding score was used to estimate social capacity at this site because this is the timeframe when most recreation sites tend to receive higher levels of use.
Overall Site Capacity Conclusion
Overall, existing recreation use at the Spillway BR/DUA is considered to be approaching capacity. Currently, both ecological and facility capacities are considered below capacity, while social capacity is approaching capacity and spatial capacity is at capacity. Both spatial and facility capacities are the primary limiting factors at this time, though social capacity may be a limiting factor in the future. Spatial capacity is currently a limiting factor due to the lack of large areas to physically expand the existing footprint of the site, though site redesign and some limited expansion could likely be accommodated. Facility capacity is a limiting factor because of potential access constraints related to dam security. Considering the capacity indicator variables in aggregate, capacity-related decisions at the Spillway BR/DUA should be regarded as a moderate management priority at this time. Relicensing Study R-7 – Reservoir Boating discusses additional capacity concerns at this site.

Final Recreation Carrying Capacity (R-8) Oroville Facilities P-2100 Relicensing
Proposed Final Report – For Distribution to Collaborative
Oroville Facilities Relicensing Team 5-79 June 2004
5.5.2.8 Afterbay Outlet BR
The Afterbay Outlet BR is located within the OWA, adjacent to the primitive designated camping area. The gravel/dirt boat ramp can be used to launch boats using a trailer or by hand. There are no other facilities (e.g., restrooms, picnic tables, etc.) at the boat ramp, though a vault restroom is provided at the adjacent camping area (Section 5.2.2.4). Additionally, there is no designated parking area at the site, but approximately 5 vehicles can park along the roadside. Additionally, a large gravel parking area is provided near the top of the ramp. The existing gravel/dirt ramp is scheduled to be upgraded (i.e., paved) within the next few years. There are several other unimproved BRs within the OWA, but none were investigated in detail.
Ecological Capacity
During the winter field observation, three ecological variables (soil erosion, soil compaction, and sanitation issues) were described as being of high concern at the OWA, including the Afterbay Outlet BR. Additionally, trash accumulation, vegetation damage, user-defined trails, riparian impact, and water/shoreline impact were described as being of moderate concern. The remaining three ecological variables were low concerns during the winter field observation. During the summer field observation, four ecological variables (soil erosion, soil compaction, trash accumulation, and sanitation issues) were high concerns, while four ecological variables (vegetation damage, user-defined trails, riparian impact, and water/shoreline impact) were moderate concerns.The remaining three ecological variables were low concerns during the summer field observation. Overall, the site’s level of ecological impact is characterized as being of high concern. Ecological capacity at the OWA, including the Afterbay Outlet BR, is considered to be at capacity based on the high level of concern regarding ecological impacts at the site, and is considered a limiting factor at this time.
Spatial Capacity
The potential to physically expand the developed recreation site at the Afterbay outlet, including the boat ramp, is somewhat limited. This site could be slightly expanded to the north. Additionally, most adjacent lands are categorized as high to moderate suitability in terms of future recreation development (DWR 2004f). However, while the potential exists to expand this site, ecological constraints throughout the OWA limit any additional recreation development.
At the Afterbay Outlet BR, an average of 29 PAOT and 42 PAOT were observed on weekdays and weekends respectively during the recreation season. The maximum number of PAOT observed during the recreation season was 41 and during weekends was 63. Significantly larger numbers of anglers are known to be present at the height of the salmon fishing season (variable between May and August). On average, 20 VAOT were observed on weekdays and 33 VAOT were observed on weekends during the

Final Recreation Carrying Capacity (R-8) Oroville Facilities P-2100 Relicensing
Proposed Final Report – For Distribution to Collaborative
Oroville Facilities Relicensing Team 5-80 June 2004
recreation season at this site. The maximum number of VAOT observed during the recreation season was 28 on weekdays and 50 on weekends (DWR 2004b). Some additional facilities could likely be added to this site in order to potentially increase use density.
Overall, spatial capacity is considered to be approaching capacity at the Afterbay Outlet BR. The potential exists to slightly expand the physical area of the site into adjacent areas and to add some additional site facilities, though both options are limited by ecological concerns in the OWA. Nonetheless, spatial capacity is not considered a limiting factor at this time.
Facility Capacity
Annually, existing recreation use at the Afterbay Outlet BR is estimated to account for nearly 85,000 RD (DWR 2004b). Approximately 55,000 RD occurred during the recreation season at this site. Weekday use during the recreation season accounted for more than 33,600 RD, while weekend use accounted for nearly 21,500 RD at this site.By 2050, an increase in recreational use of approximately 70 percent is projected at this site. It is estimated that annual recreation use will account for over 144,800 RD by 2050, of which approximately 36,650 would be attributable to recreation season weekends (DWR 2004d).
Existing utilization of this site was approximately 67 percent of capacity during recreation season weekdays and rose to over 100 percent of capacity on weekends.During holidays, percent occupancy at this site was also at or exceeding 100 percent of capacity (DWR 2004b). Because this site does not have delineated parking areas, these percent occupancies were calculated based on a reasonable estimated available parking capacity (i.e., only parking available at the ramp and not including the adjacent gravel parking area). These weekday, weekend, and holiday percent occupancies are very high and indicate that this site currently and will likely continue to receive high levels of use in the future. It should be noted that use of the informal boat ramp at this site is likely not the primary use of this site; rather, fishing, sightseeing, and camping appear to be the primary activities (DWR 2004b).
Existing recreational use of the Afterbay Outlet BR is considered to be exceeding capacity based on high levels of percent occupancy. As such, facility capacity is considered a limiting factor at this time.
Social Capacity
The annual and recreation season mean perceived crowding score was 6.4 at the Afterbay Outlet BR (DWR 2004e). This is the highest crowding score of all recreation sites in the study area and indicates that visitors feel moderately crowded at this site.

Final Recreation Carrying Capacity (R-8) Oroville Facilities P-2100 Relicensing
Proposed Final Report – For Distribution to Collaborative
Oroville Facilities Relicensing Team 5-81 June 2004
The Afterbay Outlet BR is currently exceeding its social capacity based on this high crowding score. As a result, social capacity is considered a limiting factor at this time.
Overall Site Capacity Conclusion
Overall, existing recreation use at the Afterbay Outlet BR is considered to be at capacity. Currently, both facility and social capacities are considered exceeding capacity, while ecological capacity is at capacity and spatial capacity is approaching capacity. Ecological, facility, and social capacities are the primary limiting factors at this time, though spatial capacity may be a limiting factor in the future. Ecological capacity is currently a limiting factor due to the number and severity of observed ecological impacts at this site. Facility capacity is a limiting factor because of very high levels of existing and future anticipated use. Social capacity is also a limiting factor at this site due to the high mean perceived crowding score. Considering the capacity indicator variables in aggregate, capacity-related decisions at the Afterbay Outlet BR should be regarded as a high management priority at this time. Relicensing Study R-7 – Reservoir Boating discusses additional capacity concerns at this site.
5.5.2.9 Enterprise BR
Enterprise BR is located on the northern shoreline of the South Fork arm of Lake Oroville (Figure 1.2-1). The boat ramp has two lanes that provide access to the reservoir at medium to higher pool elevations. The site also consists of a parking lot with 40 vehicle-with-trailer spaces, a vault toilet building, and three trash receptacles.
Ecological Capacity
At the Enterprise BR, soil erosion, soil compaction, and trash accumulation were considered moderate concerns during both the winter and summer field observations.All of the other ecological variables were described as low concerns during both field observations. Overall, the site’s level of ecological impact is characterized as being of moderate concern. Ecological capacity at the Enterprise BR is considered to be approaching capacity based on the moderate level of concern regarding ecological impacts at the site, but is not considered a limiting factor at this time. It should be noted that when the reservoir is below 830 feet above msl, this site is closed to protect sensitive shoreline resources.
Spatial Capacity
The potential to physically expand the Enterprise BR is limited. This site is generally constrained by adjoining private property. Sensitive resource concerns in the vicinity also likely limit any potential expansion to increase the physical area of the site. Additionally, most adjacent lands are categorized as low to moderate suitability in terms of future recreation development (DWR 2004f).

Final Recreation Carrying Capacity (R-8) Oroville Facilities P-2100 Relicensing
Proposed Final Report – For Distribution to Collaborative
Oroville Facilities Relicensing Team 5-82 June 2004
On average, 8 PAOT were observed on weekdays and 7 PAOT were observed on weekends during the recreation season at the Enterprise BR. The maximum number of PAOT observed during the recreation season on weekdays was 29 and on weekends was 17. On average, 3 VAOT were observed on weekdays and 6 VAOT were observed on weekends during the recreation season at this site. The maximum number of VAOT observed during the recreation season was 6 on weekdays and 9 on weekends (DWR 2004b). In general, a few additional facilities could likely be added to this site, though large increases in the number of site facilities are not feasible.
Overall, spatial capacity is considered to be at capacity at this site. The potential exists to add a few additional site facilities, but increasing the physical area of the site is not feasible. As such, spatial capacity is considered a limiting factor at this time at the Enterprise BR.
Facility Capacity
Existing recreation use at the Enterprise BR accounted for nearly 9,500 RD annually (DWR 2004b). Approximately 65 percent (6,100 RD) of annual use occurred during the recreation season, with most use occurring on weekends (4,000 RD). By 2050, an increase in recreational use of approximately 104 percent is projected at this site. It is estimated that annual recreation use will account for over 19,250 RD by 2050, of which nearly 8,200 will be attributable to recreation season weekends (DWR 2004d).
Existing utilization of this site was approximately 8 percent of capacity during recreation season weekdays and rose slightly to 15 percent of capacity on weekends (DWR 2004b). Both of these existing percent occupancies are low and indicate that facility capacity is below capacity. Also, recreation season weekend percent occupancy is only projected to be approximately 30 percent by 2050. However, despite existing and potential future low percent occupancy, facility capacity is considered a limiting factor at this time because of ramp constraints caused by low reservoir pool levels. During lower pool levels, this boat ramp is unusable, and this site is closed due to sensitive shoreline resources when the reservoir is below 830 msl.
Social Capacity
At the Enterprise BR, the annual and recreation season mean perceived crowding score was 3.4 (DWR 2004e). This score is relatively low, but indicates that visitors feel slightly crowded at this site. Based on this crowding score, the Enterprise BR is characterized as approaching its social capacity. Correspondingly, social capacity is not considered a limiting factor at this time.

Final Recreation Carrying Capacity (R-8) Oroville Facilities P-2100 Relicensing
Proposed Final Report – For Distribution to Collaborative
Oroville Facilities Relicensing Team 5-83 June 2004
Overall Site Capacity Conclusion
Overall, existing recreation use at the Enterprise BR is considered to be approaching capacity. Currently, spatial capacity is considered at capacity, while both ecological and social capacities are approaching capacity. Additionally, facility capacity is considered below capacity. However, both spatial and facilities capacities are limiting factors at this time. Spatial capacity is a limiting factor because of the lack of potential expansion areas adjacent to the existing site. While percent occupancy is relatively low at this site, facility capacity is a limiting factor based on constraints related to ramp length. Considering the capacity indicator variables in aggregate, capacity-related decisions at this site should be regarded as a moderate management priority at this time.Relicensing Study R-7 – Reservoir Boating discusses additional capacity concerns at this site.
5.5.2.10 Wilbur Road BR
The Wilbur Road BR is located on the northeastern shoreline of the Thermalito Afterbay (Figure 1.2-1), and consists of two paved lanes. The site also has a parking area with 14 vehicle-with-trailer spaces, a portable toilet, and a trash receptacle. In addition to the designated boat ramp, there are several informal, user-defined shoreline areas that are used for boat launching at this site.
Ecological Capacity
During the winter field observation, seven ecological variables (soil erosion, soil compaction, trash accumulation, sanitation issues, wetland impact, riparian impact, and water/shoreline impact) were described as being of moderate concern at the Wilbur Road BR. The remaining ecological variables were described as low concerns during the winter field observation. During the summer field observation, six ecological variables (soil erosion, soil compaction, sanitation issues, wetland impact, riparian impact, and water/shoreline impact) were considered moderate concerns; the other ecological variables were described as low. Overall, the site’s level of ecological impact is characterized as being of moderate concern. Ecological capacity at the Wilbur Road BR is considered to be approaching capacity based on the moderate level of concern regarding ecological impacts, but is not considered a limiting factor at this time.
Spatial Capacity
The potential exists to slightly expand the physical area of the Wilbur Road BR.Expansion is somewhat constrained by sensitive habitat and public access limitations related to the adjacent tailrace (canal) from Thermalito Forebay, though some expansion may be possible to the southwest. Most adjacent lands to the west of this site are categorized as low suitability, while adjacent lands to the south and east are categorized as high suitability in terms of future recreation development (DWR 2004f).

Final Recreation Carrying Capacity (R-8) Oroville Facilities P-2100 Relicensing
Proposed Final Report – For Distribution to Collaborative
Oroville Facilities Relicensing Team 5-84 June 2004
The Thermalito Afterbay prohibits any further development to the north of the existing site. Additionally, this site primarily consists of a parking area and siting additional facilities is not readily feasible.
On average, 5 VAOT were observed on weekdays and 9 VAOT were observed on weekends during the recreation season at this site. The maximum number of VAOT observed during the recreation season was 15 on weekdays and 14 on weekends.Relicensing Study R-7 – Reservoir Boating also investigated VAOT at this site, but differentiated between single-vehicle and vehicle-with-trailer counts. On average, 2 single vehicles and 8 vehicles-with-trailers were observed at this site during recreation season weekends and holidays. The maximum observed was 4 single vehicles and 15 vehicles-with-trailers during recreation season weekends and holidays.
Overall, spatial capacity is considered to be approaching capacity at the Wilbur Road BR. While providing additional site facilities is not readily feasible, some potential exists to increase the physical area of the site by expanding into adjacent areas. As such, spatial capacity is not considered a limiting factor at this time.
Facility Capacity
Annually, existing recreation use at the Wilbur Road Car-top BR accounted for slightly more than 12,600 RD (DWR 2004b). Approximately 7,900 RD are attributable to the recreation season at this site. During the recreation season, more than 4,200 RD occurred during weekdays and more than 3,600 RD occurred during weekends at this site. By 2050, annual recreation use is estimated to increase by approximately 116 percent to nearly 27,350 RD (DWR 2004d). During recreation season weekends in 2050, recreational use is projected to account for nearly 7,800 RD.
Percent occupancy at the Wilbur Road BR was investigated as a component of Relicensing Study R-7 – Reservoir Boating. Individually, recreation season weekend percent occupancy for vehicles-with-trailers was 57 percent of capacity. Single-vehicle occupancy was not calculated separately at this site. However, combined overall parking occupancy (single vehicle and vehicle-with-trailer) during recreation season weekdays and weekends is approximately 21 and 64 percent of capacity, respectively.During holiday weekends, percent occupancy is currently over 100 percent of capacity (DWR 2004b). By 2020, percent occupancy at this site is projected to exceed the 80 percent weekend capacity threshold.
Currently, recreational use is considered to be approaching capacity based on percent occupancy, though facility capacity is likely being exceeded on recreation season holidays. Additionally, by 2020 recreation season percent occupancy is predicted to exceed 80 percent during weekends. As such, while facility capacity is currently considered to be approaching capacity, this capacity type is considered a limiting factor because of existing holiday and future weekend percent occupancy constraints.
Final Recreation Carrying Capacity (R-8) Oroville Facilities P-2100 Relicensing
Proposed Final Report – For Distribution to Collaborative
Oroville Facilities Relicensing Team 5-85 June 2004
Social Capacity
The annual mean perceived crowding score at the Wilbur Road Car-top BR was 3.7.Perceived crowding increased slightly during the recreation season to 3.8 (DWR 2004e). These crowding scores indicate that visitors generally feel slightly crowded while at this site. As such, this site is approaching its social capacity; however, social capacity is not considered a limiting factor at this time.
Overall Site Capacity Conclusion
Overall, existing recreation use at the Wilbur Road BR is considered to be approaching capacity. Currently, all four capacity types are considered to be approaching capacity.However, only facility capacity is a limiting factor at this time. Facility capacity is a limiting factor because of existing holiday and projected future percent occupancy constraints. Considering the capacity indicator variables in aggregate, capacity-related decisions at this site should be regarded as a moderate management priority at this time. Relicensing Study R-7 – Reservoir Boating discusses additional capacity concerns at this site.
5.5.2.11 Dark Canyon Car-top BR
Dark Canyon Car-top BR is located on the West Branch of the North Fork arm of Lake Oroville (Figure 1.2-1). The boat ramp consists of an old asphalt road that provides access to the reservoir. There are three pull-out areas (at medium to lower pool elevations) along the narrow road between the parking area and the toe of the ramp. The site also has a vault toilet building, three trash receptacles, and paved parking areas that can accommodate approximately 15 to 30 vehicles total.
Ecological Capacity
During the winter field observation, soil erosion was described as being of moderate concern at this site, while all other ecological variables were described as being of low concern. During the summer field observation, all of the ecological variables were described as being of low concern, except fugitive dust (moderate concern). Overall, the site’s level of ecological impact is characterized as being of low concern. Ecological capacity at the Dark Canyon Car-top BR is considered to be below capacity and not a limiting factor based on the low level of concern regarding ecological impacts at the site.
Spatial Capacity
The Dark Canyon Car-top BR provides a very narrow public access point to the reservoir. This site primarily consists of an old road that provides access to the reservoir. Very steep slopes on both sides of this narrow use area highly constrain any

Final Recreation Carrying Capacity (R-8) Oroville Facilities P-2100 Relicensing
Proposed Final Report – For Distribution to Collaborative
Oroville Facilities Relicensing Team 5-86 June 2004
potential expansion in physical area at this site. Additionally, all adjacent lands are categorized as low suitability in terms of future recreation development (DWR 2004f). For these collective reasons, facilities could likely not be readily provided at this site.
On average, 2 PAOT were observed on weekdays and 6 PAOT were observed on weekends during the recreation season at the Dark Canyon Car-top BR. The maximum number of PAOT observed during the recreation season during weekdays was 15 and during weekends was 8. On average, 4 VAOT were observed on weekdays and 2 VAOT were observed on weekends during the recreation season at this site. The maximum number of VAOT observed during the recreation season was 6 on weekdays and 2 on weekends (DWR 2004b).
Overall, spatial capacity is considered to be exceeding capacity at the Dark Canyon Car-top BR. Steep slopes prohibit expansion into adjacent areas and new facilities are likely not practical. As such, spatial capacity is considered a limiting factor at this time.
Facility Capacity
Existing recreation use of the Dark Canyon Car-top BR is estimated at just over 7,000 RD annually (DWR 2004b). Approximately 60 percent (about 4,250 RD) of annual recreation use occurred during the recreation season at this site. During the recreation season, about 2,400 RD are attributable to weekdays and slightly more than 1,850 RD are attributable to weekends. By 2050, annual recreation use is estimated to increase by about 111 percent to about 14,820 RD (DWR 2004d). During recreation season weekends, projected recreation use at this site is anticipated to be over 3,900 RD by 2050.
Existing utilization of this site was approximately 27 percent of capacity during recreation season weekdays and decreased to 13 percent of capacity on weekends (assuming a minimum of 15 parking space are available based on reservoir pool elevation) (DWR 2004b). By 2050, it is projected that recreation season weekend percent occupancy will be about 30 percent. Both of these percent occupancies (existing and future) are low and indicate that facility capacity is below capacity. Additionally, more parking capacity is available at lower pool elevations. As a result, facility capacity is not considered a limiting factor at this time.
Social Capacity
Few completed surveys (6) were collected at the Dark Canyon Car-top BR (DWR 2004e). Based on this limited number of collected surveys, the annual and recreation season mean perceived crowding scores were 1.7. However, because only 6 completed surveys were collected at this site, site-specific results lack statistical validity.As such, the aggregate perceived crowding score for car-top boat ramps in the study area was also considered at this site. The mean perceived crowding score across all

Final Recreation Carrying Capacity (R-8) Oroville Facilities P-2100 Relicensing
Proposed Final Report – For Distribution to Collaborative
Oroville Facilities Relicensing Team 5-87 June 2004
car-top boat ramps in the study area was 2.9 (annual and recreation season). This score, as well as the site-specific crowding score, are low and indicate that visitors generally do not feel crowded at car-top boat ramps in the study area. Social capacity is thus considered to be below capacity at the Dark Canyon Car-top BR and is not a limiting factor at this time.
Overall Site Capacity Conclusion
Overall, existing recreation use at this site is considered to be approaching capacity. Currently, only spatial capacity is considered to be exceeding capacity and a limiting factor. Ecological, facility, and social capacities are all considered below capacity at this time. Spatial capacity is a limiting factor because of the lack of potential areas of expansion adjacent to this site and the lack of potential new facilities within the existing footprint of the site. Considering the capacity indicator variables in aggregate, capacity-related decisions at the Dark Canyon Car-top BR should be regarded as a low management priority at this time, despite overall capacity being characterized as approaching capacity. Capacity related decisions should be regarded as a low priority because additional spatial capacity will likely not be needed to potentially expand the site, as exiting and future facility capacities are considered relatively low. Relicensing Study R-7 – Reservoir Boating discusses additional capacity concerns at this site.
5.5.2.12 Foreman Creek Car-top BR
The Foreman Creek Car-top BR is located on the northern shoreline of the main basin of Lake Oroville (Figure 1.2-1). The two-lane boat ramp at this site, an old asphalt road, can be used at all reservoir pool elevations. At higher pool elevations, there is roadside parking for approximately 15 vehicles at this site; during lower pool elevations designated gravel parking areas provide space for approximately 15 to 30 vehicles.The site also has a trash receptacle.
Ecological Capacity
When the reservoir level is below 830 feet above msl, this site is closed at night and additional security is present during the day to protect sensitive shoreline resources. During the winter field observation, two ecological variables (soil erosion and water/shoreline impact) were described as being of high concern at the Foreman Creek Car-top BR. Additionally, trash accumulation was a moderate concern. The remaining eight ecological variables were low concerns during the winter field observation. During the summer field observation, three ecological variables (soil erosion, trash accumulation, and water/shoreline impact) were high concerns. Fugitive dust was a moderate concern during the summer field observation, while the remaining seven ecological variables were low concerns. Overall, the site’s level of ecological impact is characterized as being of high concern, so ecological capacity at the Foreman Creek

Final Recreation Carrying Capacity (R-8) Oroville Facilities P-2100 Relicensing
Proposed Final Report – For Distribution to Collaborative
Oroville Facilities Relicensing Team 5-88 June 2004
Car-top BR is considered to be at capacity and is considered a limiting factor at this time.
Spatial Capacity
The potential to physically expand the Foreman Creek Car-top BR exists, but is limited.A small area to the northeast could potentially be used to physically expand the footprint of this site. However, sensitive resources in the vicinity may limit any potential expansion. Also, most adjacent lands are categorized as moderate suitability in terms of future recreation development (DWR 2004f). A few additional site facilities could be added to the existing developed recreation site in order to increase PAOT and or VAOT capacity at this site, though a large increase in the number of site facilities is likely not feasible.
On average, 6 PAOT were observed on weekdays and 20 PAOT were observed on weekends during the recreation season at the Foreman Creek Car-top BR. The maximum number of PAOT observed during the recreation season on weekdays was 16 and on weekends was 21. On average, 4 VAOT were observed on weekdays and 15 VAOT were observed on weekends during the recreation season at this site. The maximum number of VAOT observed during the recreation season was 9 on weekdays and 19 on weekends (DWR 2004b).
Overall, spatial capacity is considered to be at capacity at the Foreman Creek Car-top BR. While some adjacent areas may be used to physically expand the site, sensitive resources in the vicinity likely limit this potential. Additionally, only a small number of new facilities could potentially be added to the existing footprint of this site. As such, spatial capacity is considered a limiting factor at this time.
Facility Capacity
Annually, existing recreation use at the Foreman Creek Car-top BR is estimated at approximately 14,400 RD (DWR 2004b), with slightly more than 8,650 RD occurring during the recreation season. Weekday use during the recreation season accounted for nearly 5,000 RD, while weekend use accounted for slightly less than 3,700 RD. By 2050, annual recreation use is estimated to increase by about 101 percent to about 29,200 RD (DWR 2004d). During recreation season weekends, projected recreation use at this site is anticipated to be approximately 7,500 RD by 2050.
Existing utilization of this site was approximately 27 percent of capacity during recreation season weekdays and over 100 percent of capacity on weekends (assuming only higher pool elevation parking is available) (DWR 2004b). Including all available parking capacity at this site is likely more indicative of actual percent occupancy during field studies, given the fact that most counts were completed during lower pool elevations. Assuming lower pool level parking capacity, existing utilization was

Final Recreation Carrying Capacity (R-8) Oroville Facilities P-2100 Relicensing
Proposed Final Report – For Distribution to Collaborative
Oroville Facilities Relicensing Team 5-89 June 2004
approximately 13 percent of capacity during recreation season weekdays and about 50 percent of capacity on weekends. However, when planning for capacity-related decision making, it should be assumed that the reservoir pool elevation will be higher; as such, existing utilization is considered to be exceeding capacity at this time. Facility capacity is also considered a limiting factor at this time.
Social Capacity
At the Foreman Creek Car-top BR, the annual mean perceived crowding sore was 2.4.Perceived crowding increased slightly during the recreation season to 2.5 at this site (DWR 2004e). These crowding scores indicate that visitors to this site do not generally feel crowded. As such, social capacity is considered to be below capacity at the Foreman Creek Car-top BR and is not a limiting factor at this time.
Overall Site Capacity Conclusion
Overall, existing recreation use at the Foreman Creek Car-top BR is considered to be at capacity. Currently, facility capacity is considered to be exceeding capacity, while both ecological and spatial capacities are at capacity. Only social capacity is considered below capacity at this site. Additionally, there are multiple limiting factors at the Foreman Creek Car-top BR. Ecological capacity is a limiting factor due to the number and severity of observed ecological impacts related to recreation and public use. Spatial capacity is a limiting factor due to the lack of adjacent potential expansion areas.Facility capacity is also considered a limiting factor based on existing percent occupancy constraints. Considering the capacity indicator variables in aggregate, capacity-related decisions at this site should be regarded as a high management priority at this time. Relicensing Study R-7 – Reservoir Boating discusses additional capacity concerns at this site.
5.5.2.13 Larkin Road Car-top BR
The Larkin Road Car-top BR, a former asphalt road, is located on the eastern shoreline of the Thermalito Afterbay (Figure 1.2-1). The site has a graded and graveled car-top boat ramp, a paved parking lot (with space for approximately 30 vehicles), an ADA-accessible vault toilet building, and a trash dumpster. There is space for four ramp lanes at the site.
Ecological Capacity
During the winter field observation, six ecological variables (soil erosion, soil compaction, trash accumulation, user-defined trails, wetland impact, and water/shoreline impact) were described as being of moderate concern at the Larkin Road Car-top BR; the remaining five ecological variables were described as low concerns. During the summer field observation, five ecological variables (soil erosion,

Final Recreation Carrying Capacity (R-8) Oroville Facilities P-2100 Relicensing
Proposed Final Report – For Distribution to Collaborative
Oroville Facilities Relicensing Team 5-90 June 2004
soil compaction, user-defined trails, wetland impact, and water/shoreline impact) were considered moderate concerns at this site; the other ecological variables were described as low concerns. Overall, the site’s level of ecological impact is characterized as being of moderate concern. Ecological capacity at the Larkin Road Car-top BR is considered to be approaching capacity based on the moderate level of concern regarding ecological impacts, but is not considered a limiting factor at this time.
Spatial Capacity
The potential exists to expand the physical area of the Larkin Road Car-top BR somewhat. Expansion is constrained by sensitive habitat at the Afterbay, although some expansion is possible to the north of the existing site. Additionally, while most adjacent land to the south of this site are categorized as low suitability, adjacent lands to the north are categorized as high suitability in terms of future recreation development (DWR 2004f). This site consists primarily of a large parking lot. Adding new facilities within the existing footprint of the site may be possible.
At the Larkin Road Car-top BR, an average of 7 PAOT and 17 PAOT were observed respectively on weekdays and weekends during the recreation season. The maximum number of PAOT observed during this period on weekdays was 21 and on weekends was 39. An average of 5 VAOT and 13 VAOT were observed respectively on weekdays and weekends during this season at this site. The maximum number of VAOT observed during the recreation season was 9 on weekdays and 26 on weekends (DWR 2004b).
Overall, spatial capacity is considered to be approaching capacity at the Larkin Road Car-top BR. Providing additional site facilities would require increasing the physical area of the site by expanding into adjacent areas. As such, spatial capacity is not considered a limiting factor at this time.
Facility Capacity
Existing recreation use at the Larkin Road Car-top BR is estimated to account for more than 23,000 RD annually (DWR 2004b). Nearly 70 percent (about 15,850 RD) of annual use occurred during the recreation season at this site. During the recreation season, weekday use accounted for slightly less than 8,200 RD, while weekend use accounted for more than 7,650 RD at this site. By 2050, annual recreation use is estimated to increase by approximately 95 percent to about 29,200 RD (DWR 2004d).During recreation season weekends, projected recreation use at this site is anticipated to be around 14,900 RD by 2050.
Existing utilization of this site was approximately 17 percent of capacity during recreation season weekdays and 43 percent of capacity on weekends (DWR 2004b).By 2050, it is projected that recreation season weekend percent occupancy will exceed 80 percent occupancy. As a result, while facility capacity is currently considered to be

Final Recreation Carrying Capacity (R-8) Oroville Facilities P-2100 Relicensing
Proposed Final Report – For Distribution to Collaborative
Oroville Facilities Relicensing Team 5-91 June 2004
below capacity, this capacity type is considered a limiting factor due to future parking capacity constraints.
Social Capacity
The mean perceived crowding score (annual and recreation season) at the Larkin Road Car-top BR was 3.2 (DWR 2004e). This score indicates that visitors tend to feel slightly crowded while at this site. As such, social capacity is considered to be approaching capacity at this site, but is not considered a limiting factor at this time.
Overall Site Capacity Conclusion
Overall, existing recreation use at this site is considered to be approaching capacity. Ecological, spatial, and social capacities are currently considered to be approaching capacity, while facility capacity is below capacity. However, facility capacity is considered a limiting factor based on anticipated future parking constraints.Considering the capacity indicator variables in aggregate, capacity-related decisions at the Larkin Road Car-top BR should be regarded as a low management priority at this time, despite overall capacity being characterized as approaching capacity. Existing capacity related decisions should be a low priority because additional facility capacity will likely not be needed until about 2050. Relicensing Study R-7 – Reservoir Boatingdiscusses additional capacity concerns at this site.
5.5.2.14 Nelson Bar Car-top BR
Nelson Bar Car-top BR is located on the West Branch of the North Fork arm of Lake Oroville (Figure 1.2-1). The boat ramp consists of an old asphalt road that provides access to the reservoir. There are three pull-out areas along the narrow road between the parking area and the toe of the ramp; however, the lower portion of the road is in poor condition, requiring visitors to carry their boats to the shoreline. The site also has a vault toilet building, 2 trash receptacles, and a paved parking area that can accommodate approximately 30 vehicles.
Ecological Capacity
During both the winter and summer field observations, soil erosion and riparian impacts were both considered moderate concerns at the Nelson Bar Car-top BR; all of the remaining ecological variables were described as being of low concern. Overall, the site’s level of ecological impact is characterized as being of low concern. Therefore, ecological capacity at the Nelson Bar Car-top BR is considered to be below capacity and not a limiting factor.

Final Recreation Carrying Capacity (R-8) Oroville Facilities P-2100 Relicensing
Proposed Final Report – For Distribution to Collaborative
Oroville Facilities Relicensing Team 5-92 June 2004
Spatial Capacity
There is very little potential to physically expand the Nelson Bar Car-top BR. Very steep slopes constrain any potential expansion at this site. Additionally, all existing site lands, as well as adjacent lands, are categorized as low to moderate suitability in terms of future recreation development (DWR 2004f). This site is also considered built-out and no new facilities could readily be added to the existing footprint. As it is, infill was required to provide many of the facilities already located at the Nelson Bar Car-top BR.
On average, 17 PAOT were observed on weekdays and 6 PAOT were observed on weekends during the recreation season. The maximum number of PAOT observed during the recreation season on weekdays was 30 and on weekends was 9. On average, 11 VAOT were observed on weekdays and 3 VAOT were observed on weekends during the recreation season at this site. The maximum number of VAOT observed during the recreation season was 17 on weekdays and 3 on weekends (DWR 2004b).
Overall, spatial capacity is considered to be exceeding capacity at the Nelson Bar Car-top BR. Steep slopes prohibit expansion into adjacent areas and new facilities are likely not practical. As such, spatial capacity is considered a limiting factor at this time.
Facility Capacity
Existing recreation use at the Nelson Bar Car-top BR is estimated to account for nearly 24,000 RD annually (DWR 2004b), approximately 60 percent (14,400 RD) of which occurred during the recreation season. Weekday use during the recreation season accounted for 8,400 RD, while weekend use accounted for 6,000 RD. Annual recreation use is estimated to increase about 98 percent by 2050 (DWR 2004d).Annual recreation use in 2050 is projected to account for nearly 47,500 RD, with about 11,900 RD attributable to recreation season weekends.
Existing utilization of this site was approximately 37 percent of capacity during recreation season weekdays and decreased to only 10 percent of capacity on weekends. During recreation season holidays, average utilization was 30 percent of capacity. Recreation season weekend capacity is not expected to reach nor exceed 80 percent occupancy by 2050. As such, existing utilization is considered below capacity and facility capacity is not a limiting factor at the Nelson Bar Car-top BR.
Social Capacity
At the Nelson Bar Car-top BR, both the annual and recreation season mean perceived crowding score were 3.1 (DWR 2004e). This score is relatively low, but indicates that visitors tend to feel slightly crowded at this site. Based on this crowding score, the
Final Recreation Carrying Capacity (R-8) Oroville Facilities P-2100 Relicensing
Proposed Final Report – For Distribution to Collaborative
Oroville Facilities Relicensing Team 5-93 June 2004
Nelson Bar Car-top BR is categorized as approaching its social capacity. However, social capacity is not a limiting factor at this time.
Overall Site Capacity Conclusion
Overall, existing recreation use at the Nelson Bar Car-top BR is considered to be approaching capacity. Currently, only spatial capacity is considered to be exceeding capacity and a limiting factor, though social capacity is characterized as approaching capacity and may be a limiting factor in the future. Ecological and facility capacities are both considered below capacity at this time. Spatial capacity is a limiting factor because of the lack of potential areas of expansion adjacent to this site and the lack of potential new facilities within the existing footprint of the site. Considering the capacity indicator variables in aggregate, capacity-related decisions at this site should be regarded as a low management priority at this time, despite overall capacity being characterized as approaching capacity. Capacity related decisions should be regarded as a low priority because additional spatial capacity will likely not be needed to potentially expand the site, as exiting and future facility capacities are considered relatively low. Relicensing Study R-7 – Reservoir Boating discusses additional capacity concerns at this site.
5.5.2.15 Stringtown Car-top BR
Stringtown Car-top BR is located on the southern shoreline of the South Fork arm of Lake Oroville (Figure 1.2-1). Similar to other car-top boat ramps on the reservoir, the boat ramp at this site is an old asphalt road. In addition to the boat ramp, there is undefined parking for approximately six vehicles, a vault toilet building, and a trash receptacle. Also similar to other car-top boat ramps on the reservoir, additional informal parking areas at this site become available at lower reservoir pool elevations.
Ecological Capacity
During the winter field observation, soil erosion, trash accumulation, and water/shoreline impact were described as being of moderate concern at the Stringtown Car-top BR; the remaining ecological variables were described as low concerns. During the summer field observation, soil erosion and water/shoreline impact, as well as vegetation damage, were considered moderate concerns at this site; the other ecological variables were described as low concerns. Overall, the site’s level of ecological impact is characterized as being of moderate concern. Therefore, ecological capacity at the Stringtown Car-top BR is considered to be approaching capacity, but is not considered a limiting factor at this time.
Spatial Capacity
There is very little potential to physically expand the Stringtown Car-top BR. Steep slopes highly constrain any potential expansion at this site. Additionally, most existing

Final Recreation Carrying Capacity (R-8) Oroville Facilities P-2100 Relicensing
Proposed Final Report – For Distribution to Collaborative
Oroville Facilities Relicensing Team 5-94 June 2004
site lands, as well as adjacent lands, are categorized as low to moderate suitability in terms of future recreation development (DWR 2004f). A few additional site facilities could be added to this site, though a large increase in the number of site facilities is not practical.
On average, 10 PAOT were observed on weekdays and 22 PAOT were observed on weekends during the recreation season at the Stringtown Car-top BR. The maximum number of PAOT observed during the recreation season on weekdays was 22 and on weekends was 44. On average, 6 VAOT were observed on weekdays and 15 VAOT were observed on weekends during this period. The maximum number of VAOT observed during the recreation season was 12 on weekdays and 25 on weekends (DWR 2004b).
Overall, spatial capacity is considered to be at capacity at the Stringtown Car-top BR.While a small number of new facilities could potentially be added to the existing footprint of this site, significant expansion to increase the physical area of the site is not possible.As such, spatial capacity is considered a limiting factor at this time.
Facility Capacity
Annually, existing recreation use at the Stringtown Car-top BR is estimated to account for nearly 11,650 RD (DWR 2004b). Slightly more than 8,600 RD are attributable to use during the recreation season at this site. During the recreation season, existing use accounted for 4,200 RD on weekdays and approximately 4,400 RD on weekends. By 2050, annual recreation use is estimated to increase by about 97 percent to about 23,000 RD (DWR 2004d). During recreation season weekends, projected recreation use at this site is anticipated to be approximately 8,700 RD by 2050.
Existing utilization of this site was over 100 percent of capacity during recreation season weekdays, weekends, and holidays (DWR 2004b). Utilization at the Stringtown Car-top BR is very high, though undefined parking areas at lower pool elevations provide additional parking capacity that is not considered in this estimate. However, when planning for capacity-related decision making, it should be assumed that the reservoir pool elevation will be higher. As such, existing utilization is considered to be exceeding facility capacity based on parking constraints. Facility capacity is also considered a limiting factor at this time.
Social Capacity
The mean perceived crowding score (annual and recreation season) at the Stringtown Car-top BR was 3.2 (DWR 2004e). This score indicates that visitors tend to feel slightly crowded while at this site. As such, social capacity is considered to be approaching capacity, but is not considered a limiting factor at this time.

Final Recreation Carrying Capacity (R-8) Oroville Facilities P-2100 Relicensing
Proposed Final Report – For Distribution to Collaborative
Oroville Facilities Relicensing Team 5-95 June 2004
Overall Site Capacity Conclusion
Overall, existing recreation use at the Stringtown Car-top BR is considered to be at capacity. Facility capacity is currently exceeding capacity, while spatial capacity is considered at capacity, both of which are considered limiting factors. The remaining capacity indicator variables (ecological and social) are characterized as approaching capacity, but are not limiting factors at this time. Spatial capacity is a limiting factor because of a lack of expansion potential. Facility capacity is a limiting factor because of existing and potential future high levels of utilization at this site. Considering the capacity indicator variables in aggregate, capacity-related decisions at the Stringtown Car-top BR should be regarded as a high management priority at this time. Relicensing Study R-7 – Reservoir Boating discusses additional capacity concerns at this site.
5.5.2.16 Vinton Gulch Car-top BR
Vinton Gulch Car-top BR is located on the West Branch of the North Fork arm of Lake Oroville (Figure 1.2-1). An old asphalt road forms the one ramp lane at the site, which can only be used at higher pool elevations. There is no designated parking area at the site; however, roadside parking can accommodate approximately ten vehicles. The site also has one vault toilet building and two trash receptacles.
Ecological Capacity
During the winter and summer field observations, soil erosion was described as a high concern at the Vinton Gulch Car-top BR. Two other ecological variables (soil compaction and trash accumulation) were characterized as moderate concerns during both field observations; the remaining ecological variables were described as low concerns. Overall, the site’s level of ecological impact is characterized as being of moderate concern. Ecological capacity at the Vinton Gulch Car-top BR is considered to be approaching capacity based on the moderate level of concern regarding ecological impacts, but is not considered a limiting factor at this time.
Spatial Capacity
There is little potential to physically expand the Vinton Gulch Car-top BR. Private property is the primary constraint to site expansion, though the site is also limited by the reservoir. Additionally, most existing site lands, as well as adjacent lands, are categorized as low to moderate suitability in terms of future recreation development (DWR 2004f). Available facilities at this site are currently limited and there is little potential to add new facilities in order to increase use density.
At the Vinton Gulch Car-top BR, 2 PAOT were observed on average during weekdays of the recreation season. The maximum number of PAOT observed during the recreation season on weekdays was 6. No visitors were observed on weekends at this

Final Recreation Carrying Capacity (R-8) Oroville Facilities P-2100 Relicensing
Proposed Final Report – For Distribution to Collaborative
Oroville Facilities Relicensing Team 5-96 June 2004
site. This does not mean that there is no weekend use at this site; rather, use levels are low and at the time of field observations, no users were observed. On average, 1 VAOT was observed on both weekdays and weekends during the recreation season. The maximum number of VAOT observed during the recreation season was 4 on weekdays and 1 on weekends (DWR 2004b).
Overall, spatial capacity is considered to be exceeding capacity at the Vinton Gulch Car-top BR. Adjoining private property and pool elevation limit expansion into adjacent areas and new facilities are likely not practical. As such, spatial capacity is considered a limiting factor at this time.
Facility Capacity
Existing recreation use at the Vinton Gulch Car-top BR is estimated to account for slightly more than 6,700 RD on an annual basis (DWR 2004b). Less than half (about 3,200 RD) of annual use at this site occurred during the recreation season. Weekday use accounted for less than 2,000 RD during the recreation season, while weekend use accounted for approximately 1,250 RD. Annual recreation use in 2050 is projected to account for nearly 12,000 RD, with over 2,200 RD attributable to recreation season weekends.
Existing utilization of this site was approximately 10 percent of capacity during recreation season weekdays and weekends. Recreation season weekend capacity is not expected to reach and/or exceed 80 percent occupancy by 2050. As such, existing utilization is considered below capacity and facility capacity is not a limiting factor at the Vinton Gulch Car-top BR.
Social Capacity
Only two completed visitor surveys were collected at the Vinton Gulch Car-top BR (DWR 2004e), reflecting an annual and recreation season mean perceived crowding scores of 1.0. However, because only two completed surveys were collected at this site, site-specific results lack statistical validity. As such, the aggregate perceived crowding score for car-top boat ramps in the study area was also considered at this site. The mean perceived crowding score across all car-top boat ramps in the study area was 2.9 (annual and recreation season). This score and the site-specific crowding scores are low, and indicate that visitors generally do not feel crowded at car-top boat ramps in the study area. Social capacity is thus considered to be below capacity at the Vinton Gulch Car-top BR and is not a limiting factor at this time.
Overall Site Capacity Conclusion
Overall, existing recreation use at this site is considered to be approaching capacity. Currently, only spatial capacity is considered to be exceeding capacity and a limiting

Final Recreation Carrying Capacity (R-8) Oroville Facilities P-2100 Relicensing
Proposed Final Report – For Distribution to Collaborative
Oroville Facilities Relicensing Team 5-97 June 2004
factor, though ecological capacity is characterized as approaching capacity and may be a limiting factor in the future. Facility and social capacities are both considered below capacity at this time. Spatial capacity is a limiting factor because of the lack of potential areas of expansion adjacent to this site and the lack of potential new facilities within the existing footprint of the site. Considering the capacity indicator variables in aggregate, capacity-related decisions at the Vinton Gulch Car-top BR should be regarded as a low management priority at this time, despite overall capacity being characterized as approaching capacity. Capacity related decisions should be regarded as a low priority because additional spatial capacity will likely not be needed to potentially expand the site, as exiting and future facility capacities are considered relatively low. Relicensing Study R-7 – Reservoir Boating discusses additional capacity concerns at this site.
5.6 STUDY AREA TRAILS CAPACITY SUMMARY
Unlike previous sections of this analysis, overall capacity of non-motorized trails in the study area is presented in this section because recreation capacity at the trails and trailheads generally were not investigated on an individual basis. Ecological capacity was investigated for some trails individually during Relicensing Study R-11 – Recreation and Public Use Impact Assessment. Social capacity was summarized in aggregate in Relicensing Study R-13 – Recreation Surveys. Additionally, spatial capacity (in terms of the potential for additional miles of trails) was not investigated during field observations or as a component of Relicensing Study R-15 – Recreation Suitability Analysis. Also, as noted in Section 4.0, percent occupancy is generally not a practical measure of facility capacity at trails. Due to these factors, recreation capacity is considered in aggregate for all study area trails and trailheads.
The study area’s trail system provides many miles of trails for a variety of uses including hiking, mountain biking, and horseback riding (McBride 2003). Several trails have been upgraded to enhance accessibility related to slope and surface. Facilities at most of the trailheads generally consist of roadside parking, trail access, and the trail itself.
Trails located within the study area include:
Bidwell Canyon Trail;
Brad Freeman Trail (Figure 1.2-1);
Chaparral Interpretive Trail;
Dan Beebe Trail (Figure 1.2-1);
Kelly Ridge Trail;
Lime Saddle Loop Trail (under construction);
Loafer Creek Loop Trail;
North Fork Trail (under construction);
Potter Ravine Trail;
Roy Rogers Trail; and
Wyk Island Trail.

Final Recreation Carrying Capacity (R-8) Oroville Facilities P-2100 Relicensing
Proposed Final Report – For Distribution to Collaborative
Oroville Facilities Relicensing Team 5-98 June 2004
Stand-alone trailheads located within the study area include:
East Hamilton Trailhead Access;
Lakeland Boulevard Trailhead Access;
Saddle Dam Trailhead Access;
Toland Road Trailhead Access; and
Tres Vias Road Trailhead Access.
Informal trails and trails that are outside the study area were not considered during this analysis. Other trailheads and staging points are located at other developed facilities (e.g., Loafer Creek Horse Campground, etc.). More information on the trails and trailhead listed above, as well as regional trails, can be found in Relicensing Study R-10 – Recreation Facility Inventory and Condition Report.
5.6.1 Ecological Capacity
In general, recreational use of trails in the study area does not appear to have a widespread impact on the ecological integrity of the study area. In fact, past research has found that initial trail construction generally tends to cause greater resource impacts at developed trails than subsequent trail use (Keller 1990). At trails in the study area, most observed ecological concerns tended to be minor, though all of the trails showed some signs of erosion typical of trails in semi-arid areas. Relicensing Study R-11 – Recreation and Public Use Impact Assessment specifically addressed ecological concerns at five trails in the study area including the Brad Freeman Trail, Dan Beebe Trail, Lime Saddle Loop Trail, Loafer Creek Loop Trail, and Roy Rodgers Trail. Soil erosion was the most commonly observed ecological impact along these trails, though trash accumulation was a concern along the Lime Saddle Loop Trail.
Overall, ecological capacity is considered below capacity at study area trails and not a limiting factor at this time. Potential ecological impacts may increase if use of the study area increases in the future.
5.6.2 Spatial Capacity
The spatial capacity of trails is often more difficult to define compared to larger, non-linear recreation sites, such as campgrounds and day use areas. However, the spatial capacity of trails is generally measured through the ability to add linear distance to existing trails and/or through the ability of an area to accommodate new trail development. During field observations, the potential to add mileage to the existing trails within the study area was generally not investigated, nor was the ability of the study area to accommodate new trail development.

Final Recreation Carrying Capacity (R-8) Oroville Facilities P-2100 Relicensing
Proposed Final Report – For Distribution to Collaborative
Oroville Facilities Relicensing Team 5-99 June 2004
Despite not specifically researching trail-related spatial capacity in Relicensing Study R-15—Recreation Suitability Analysis, it is likely that additional trails could physically be developed in the study area. Three levels of trail-related development opportunities likely exist in the study area, including:
Trail Extensions –Trails in the study area could potentially be extended, though many are likely already extended to their logical destinations;
Trail Linkages –New trails could potentially be developed within existing recreation sites to connect site facilities, while others could also be developed to connect individual recreation sites; and
New Trails –New trails could likely be developed in the study area including out-and-back trails to specific points of interest and loop trails.
Because of these factors, the spatial capacity of existing trails within the study area is considered to be below capacity and is not a limiting factor at this time. Additional trail routing and analysis is needed to clearly define the extent of all new trail opportunities in the study area.
5.6.3 Facility Capacity
As described in Section 4.0, facility capacity is generally not a practical measure of the recreational capacity of trails. Trailheads are limited by the number of vehicles that can park at one time, but establishing a similar numerical limiting factor for the actual trail is more problematic. Ideally, trail facility capacity should be commensurate with the ROS-type setting of the area where the trail is located (Section 5.1.4). However, in most recreation research and management, social capacity (generally measured through encounters) tends to offer more setting-specific quantitative capacity values (and thresholds) than facility capacity. For example, a trail located adjacent to an urban center may have a capacity threshold of 50 or more visitor encounters per hour, while a trail located in a wilderness area may have a capacity threshold of 1 to 2 visitor encounters per day.
While percent occupancy was not specifically investigated during Relicensing Study R-9 – Existing Recreation Use, trail counters were used to record trail use on several of the major trails in the study area: Loafer Creek Loop Trail, Roy Rodgers Trail, Dan Beebe Trail, Brad Freeman Trail, and Kelly Ridge Trail. The trail counter data indicated that overall use of most trail sections was highest during October, with about 50 to 60 people using the trails on peak days. Sixty trail users during one 12-hour daily count period is equivalent to an average of five per hour. This is a relatively low level of use considering the number and cumulative distance of trails in the study area.
According to the trail counters, the highest recorded levels of use on an individual day were recorded during November. From 100 to 160 trail users were recorded per day during an annual equestrian trail riding event during the first week of November and

Final Recreation Carrying Capacity (R-8) Oroville Facilities P-2100 Relicensing
Proposed Final Report – For Distribution to Collaborative
Oroville Facilities Relicensing Team 5-100 June 2004
then again during the Thanksgiving holiday weekend. Daily use during the remainder of November was 25 to 30 people per day.
The lowest levels of trail use were recorded during the three-month period from mid-December through mid-March. During this period, 0 to 10 users were recorded using trails in the study area. Use increased slightly during the spring (mid-March through May), with as many as 30 to 35 people using study area trails on peak days. Trail use then decreased slightly during the summer months of June and July when the typical peak use was 15 to 30 people per day. This is likely due to the high temperatures that study area experiences during the summer months.
The trails that tended to receive the highest levels of use included those trails in the vicinity of Saddle Dam and Bidwell Canyon. Access to trail opportunities is generally better and more abundant in these areas compared to other locations in the study area.Use was described as low to moderate throughout most of the year at most other locations on the trail system, including trails in the Loafer Creek area and along the northern and southern shorelines of the Diversion Pool. Use was also low on the Brad Freeman Trail, especially along the northern shoreline of the Thermalito Afterbay (DWR 2004b).
Similar to other recreation sites and facilities, visitor demand for additional trails and associated facilities was measured as a component of Relicensing Study R-13 – Recreation Surveys. Visitors were asked whether there were “too few, about right, or too many” trails and associated facilities. In general, nearly a third of survey respondents indicated there were “too few” trails and associated facilities. Specifically, survey respondents indicated there were too few trail signs (38 percent), paved bike trails (34 percent), unpaved bike trails (30 percent), hiking trails (30 percent), and equestrian trails (27 percent). While demand for these types of trails and associated facilities does not necessarily correspond to a lack of facility capacity, it may indicate that some new trail development and associated facilities are needed in order to help increase visitor satisfaction and to minimize potential capacity-related concerns.
Though percent occupancy was not specifically investigated at trails and trailheads, feedback from researchers in the field indicated that overall, the study area trails are considered below their facility capacity, though percent occupancy may be approaching and/or at capacity at some study area trailheads. While trails may be below their facility capacity, there is some visitor demand for additional trails and trail facilities in the study area. Approximately one-third of survey respondents indicated some desire for specific types of trails and/or trail amenities. Nonetheless, facility capacity is not considered a limiting factor at this time at trails in the study area.

Final Recreation Carrying Capacity (R-8) Oroville Facilities P-2100 Relicensing
Proposed Final Report – For Distribution to Collaborative
Oroville Facilities Relicensing Team 5-101 June 2004
5.6.4 Social Capacity
Per study methodologies, trail crowding was not investigated on a trail-by-trail basis, however, crowding was reported for trailheads in aggregate (DWR 2004e). On average, visitors who were contacted at trailheads in the study area had a mean perceived crowding score of 1.3 during the recreation season and 1.7 annually. These levels of perceived crowding are very low. Perceived crowding was also summarized for all survey respondents who indicated they had used a trail during their visit to the study area. This subset of visitors had a mean perceived crowding score of approximately 2.0. This is also a very low crowding score and indicates that trail users generally do not perceive significant crowding. Additionally, approximately 10 percent of trail users indicated that encounters with other trail users were a problem to some degree (combined “slight”, “moderate”, and “big problem” response categories). While trail-related conflict appears to be relatively low in the study area, trail-related conflict is a common concern on multiple-use trails and should be generally addressed in future trail-related management and planning. Overall, trails in the study area are considered below their social capacity at this time due to low perceived crowding scores and low levels of problem encounters. As a result, social capacity is not a limiting factor at this time.
5.6.5 Overall Capacity Conclusion
Overall, existing recreation use on non-motorized trails in the study area is considered to be below capacity using the methodology employed in this study. Currently, all of the capacity indicator variables appear to be below capacity and none are anticipated to be limiting factors in the future. Future comprehensive trail analysis may further refine this conclusion. Considering the capacity types in aggregate, capacity-related decisions at trails in the study area should be regarded as a low priority at this time. However, trail-related capacity may be further explored in future trail studies. Trailhead parking capacity may become a concern in the future as trail use is anticipated to increase.Also, nearly one-third of existing visitors have indicated a desire for additional trails and trail-related facilities.

Final Recreation Carrying Capacity (R-8) Oroville Facilities P-2100 Relicensing
Proposed Final Report – For Distribution to Collaborative
Oroville Facilities Relicensing Team 5-102 June 2004
This page intentionally left blank.

Final Recreation Carrying Capacity (R-8) Oroville Facilities P-2100 Relicensing
Proposed Final Report – For Distribution to Collaborative
Oroville Facilities Relicensing Team 6-1 June 2004
6.0 CONCLUSIONS
While Section 5.0 describes capacity levels at recreation sites in the study area, this section provides conclusions and recreation capacity-related observations based on the previous results presented in Section 5.0. These results should not be assumed to be protection, mitigation, or enhancement measures (PM&Es). Instead, these results and the results from the other recreation relicensing studies should be considered in aggregate and used to help formulate existing and future recreation needs for the study area, which are reported in Relicensing Study R-17 – Recreation Needs Analysis.Furthermore, this report was prepared under the general direction of DWR staff.Opinions, findings, and conclusions expressed in this report are those of the authors.This report does not express the official position of DWR unless specifically approved by the Director or his designee.
The management priority results in Tables 5.1-1 through 5.5-1 can be used as a basis for determining which sites should be considered for potential capacity-related management actions. These results are specific to the study area. Relicensing Study R-14 – Assessment of Regional Recreation and Barriers to Recreation, as well as portions of Relicensing Study R-17 –Recreation Needs Analysis, consider the regional recreation context and associated regional capacities.
A range of potential management options may be considered when making capacity-related decisions. These potential options range from “choosing to do nothing about a capacity concern” to “undertaking a major recreation resource improvement and enhancement program.” Throughout the anticipated term of the new license, a periodic capacity-related monitoring program (likely part of the proposed Oroville Facilities Recreation Management Plan) will clearly define capacity thresholds and the actions that are triggered when these thresholds are approached, reached, and/or exceeded.
Overall, recreational use in the study area is considered to be approaching capacity (Table 5.1-1). While all of the capacity indicator variables, except ecological capacity, are considered to be approaching capacity, the primary capacity-related limiting factors to recreational use in the study area are spatial and facility capacities. Spatial capacity is considered a limiting factor because of limited expansion area available at many of the existing developed recreation sites, as well as the high percentage of study area lands classified as “low” in terms of potential recreation development suitability. Facility capacity is a limiting factor because of percent occupancy constraints, as well as reservoir pool elevation variability, among other concerns. Considering the capacity indicator variables in aggregate, capacity-related decisions regarding recreation in the study area should be a moderate priority at this time. The fact that both spatial and facility capacities are considered limiting factors is important for future capacity-related decision-making, as excess spatial capacity is necessary to expand the facility capacity of a developed recreation site. In the event that facility capacity must be expanded in the future, but potential spatial capacity is not available for expansion, other capacity-

Final Recreation Carrying Capacity (R-8) Oroville Facilities P-2100 Relicensing
Proposed Final Report – For Distribution to Collaborative
Oroville Facilities Relicensing Team 6-2 June 2004
related management options will need to be considered. Additional existing and future capacity-related opportunities and constraints for the study area, as well as for each resource area (Lake Oroville, Diversion Pool, low flow channel (LFC), Thermalito Forebay, Thermalito Afterbay, and OWA), are discussed in more detail in Relicensing Study R-17 – Recreation Needs Analysis.
6.1 ECOLOGICAL CAPACITY
Potential management actions should be considered at sites where ecological capacity is considered to be at or exceeding capacity at this time. Oroville Facilities sites in this category include several OWA sites (Afterbay Outlet Boat Ramp and primitive camping area, and the Foreman Creek Car-top BR). Other sites within the study area in this category include the Rabe Road Shooting Area and the Clay Pit SVRA. Potential management actions to limit recreation and public use ecological impacts include increased operations and maintenance presence, site hardening, natural barriers, increased visitor information and education (e.g., Leave No Trace information), additional enforcement, and site closure and/or rehabilitation. A long-term recreation and public use impact monitoring program, to track potential ecological capacity concerns, will likely be part of the Oroville Facilities Recreation Management Plan.
6.2 SPATIAL CAPACITY
The study area has a limited overall spatial capacity (i.e., there is a finite amount of study area lands that could potentially be developed for recreational use). Demands to develop (not only for recreation) areas where there is currently available spatial capacity are anticipated to increase in the future. This underscores the value of preserving adequate natural open space for aesthetics and recreational use in the study area.Prior to developing new areas for recreational development, wildlife, plant, fisheries, and cultural resources will be further investigated; compliance with State and federal environmental review and permitting requirements are expected to adequately address any such site-specific impacts of future recreation development projects.
6.3 FACILITY CAPACITY
The predicted trend of increasing percent occupancy will likely limit facility capacity at many of the developed recreation sites in the study area over the term of the new license. Based on existing use levels and percent occupancy, it is estimated that up to 100 new campsites and 350 new parking spaces (not including existing overflow parking areas) at boat ramps and their associated day use areas may be needed by 2050 to meet anticipated study area demand. Other associated recreation facilities will also likely be needed by 2050, including picnic areas, floating toilets, marina slips, restrooms, boat ramp lanes, and trails, among others. It is anticipated that much of this additional facility capacity will be needed in the 10-year period from 2010 to 2020, though precise timing will depend on site-specific facility capacity factors. Constructing

Final Recreation Carrying Capacity (R-8) Oroville Facilities P-2100 Relicensing
Proposed Final Report – For Distribution to Collaborative
Oroville Facilities Relicensing Team 6-3 June 2004
these additional sites is one management option that should be considered. However, other potential management options that can address facility capacity constraints include redistributing use by providing visitors with information about alternative sites with capacity, instituting a limited entry system, implementing a reservation system, and/or enhancing under-utilized sites or off-season periods to make them more attractive to visitors, among others. Additionally, a long-term facility occupancy monitoring program will likely be part of the Oroville Facilities Recreation Management Plan, in combination with current FERC Form 80 capacity reporting requirements (every 6 years).
6.4 SOCIAL CAPACITY
As noted in Section 4.4, social capacity is a complex issue that is influenced by multiple factors including recreation setting (developed versus dispersed), demographics, and activity-type, among other variables. It is nonetheless important to consider a social capacity standard on a site-by-site basis based on specific conditions at each site.Higher levels of perceived crowding can be expected at more developed recreation sites, while the opportunity for solitude (or at least a lower level of perceived crowding) should be provided at more dispersed, primitive recreation sites. Potential management options exist to limit perceived crowding and user conflicts at both higher and lower use sites in the study area. Such management options may include providing adequate buffer between user groups and sites, creating temporal and spatial zones by activity type or user group, addressing identified visitor conflicts, and providing additional enforcement and management pressure, among others. Additionally, perceived crowding and visitor conflict are related to visitor satisfaction and periodic monitoring can help limit potential social capacity concerns.
6.5 SUMMARY
In the future, recreation management actions in the study area should be based in part on a comprehensive review of the four capacity indicator variables in aggregate, both at the site and geographic or resource area levels. Recreation managers in the study area need to be cognizant that the four capacity indicator variables are interrelated and that making a change to one variable may result in a potential change in another. To better understand these relationships and to help guide capacity-related decision-making in the future, recreation programs in the Oroville Facilities Recreation Management Plan could be aided by a well-defined, periodic recreation monitoring program.

Final Recreation Carrying Capacity (R-8) Oroville Facilities P-2100 Relicensing
Proposed Final Report – For Distribution to Collaborative
Oroville Facilities Relicensing Team 6-4 June 2004
This page intentionally left blank.

Final Recreation Carrying Capacity (R-8) Oroville Facilities P-2100 Relicensing
Proposed Final Report – For Distribution to Collaborative
Oroville Facilities Relicensing Team 7-1 June 2004
7.0 REFERENCES
Clark, R.N. and G.H. Stankey. 1979. The Recreation Opportunity Spectrum: A Framework for Planning, Management, and Research. USDA Forest Service Pacific Northwest Forest and Range Experiment Station. General Technical Report PNW-98. December 1979.
DPR (California Department of Parks and Recreation). URL = http://www.norcal.parks.ca.us/lakeoroville.htm. Site accessed December 17, 2000.
DPR. 2002. Planning Handbook. California State Parks. February 2002.
Driver, B.L., P.J. Brown, G.H. Stankey, and T.E. Gregroire. 1987. The Recreation Opportunity Spectrum Planning System: Evolution, Basic Concepts, and Research Needed. Leisure Sciences. 9:201-212.
DWR (California Department of Water Resources). 2004a. Study R-7 – ReservoirBoating. Oroville Facilities Relicensing, FERC Project No. 2100. Prepared by EDAW, Inc., Sacramento, CA.
DWR. 2004b. Study R-9 – Existing Recreation Use. Oroville Facilities Relicensing, FERC Project No. 2100. Prepared by EDAW, Inc., Sacramento, CA.
DWR. 2004c. Study R-11 – Recreation and Public Use Impact Assessment. Oroville Facilities Relicensing, FERC Project No. 2100. Prepared by EDAW, Inc., Sacramento, CA.
DWR. 2004d. Study R-12 – Projected Recreation Use. Oroville Facilities Relicensing, FERC Project No. 2100. Prepared by EDAW, Inc., Sacramento, CA.
DWR. 2004e. Study R-13 –Recreation Surveys. Oroville Facilities Relicensing, FERC Project No. 2100. Prepared by EDAW, Inc., Sacramento, CA.
DWR. 2004f. Study R-15 – Recreation Suitability Analysis. Oroville Facilities Relicensing, FERC Project No. 2100. Prepared by EDAW, Inc., Sacramento, CA.
DWR. 2004g. Study R-17 – Recreation Needs Analysis. Oroville Facilities Relicensing, FERC Project No. 2100. Prepared by EDAW, Inc., Sacramento, CA.
FERC (Federal Energy Regulatory Commission). 2004. Licensed Hydroelectric Development Recreation Report (FERC Form 80). OMB No. 1902-0106.
FRRPD (Feather River Recreation and Park District). West Park Riverbend Corridor.Site accessed March 29, 2004. URL=http://frrpd.com/westpark.shtml.

Final Recreation Carrying Capacity (R-8) Oroville Facilities P-2100 Relicensing
Proposed Final Report – For Distribution to Collaborative
Oroville Facilities Relicensing Team 7-2 June 2004
Graefe, A., F. Kuss, and J. Vaske. 1990. Visitor Impact Management: The Planning Framework. National Parks and Conservation Association. Washington, D.C. 1990.
Haas, G.E. 2001. Visitor Capacity in the National Park System. Social Science Research Review, 2(1):1-28. USDI National Park Service. Washington, D.C. Spring 2001.
Haas, G.E. 2002. Visitor Capacity on Public Lands and Waters: Making Better Decisions. A Report of the Federal Interagency Task Force on Visitor Capacity on Public Lands. Submitted to the Assistant Secretary for Fish and Wildlife and Parks, U.S. Department of the Interior, Washington, D.C. May 1, 2002. National Recreation and Parks Association, Ashburn, Virginia.
Hammitt, W.E. and D.N. Cole. 1998. Wildland Recreation: Ecology and Management. John Wiley & Sons, Inc. New York, NY. 1998.
Keller, K. 1990. Mountain Bikes on Public Lands: A Manager’s Guide to the State of Practice. Bicycle Federation of America, Washington, D.C.
Manning, R. E. 1999. Studies in Outdoor Recreation: Search and Research for Satisfaction (2nd Ed.). Oregon State University Press. Corvallis, Oregon.
Manning, R.E., P. Newman, W.A. Valliere, B. Wang, and S.R. Lawson. 2001.Respondent Self-Assessment of Research on Crowding Norms in Outdoor Recreation. Journal of Leisure Research. 33(3): 251-271.
McBride, T. DPR; e-mail communication with I. Mayes, Senior Environmental Planner, EDAW, San Francisco, California; May 19, 2003.
McCool, S.F. 1996. Limits of Acceptable Change: A Framework for Managing National Protected Areas: Experiences from the United States. Paper presented at Workshop on Impact Management in Marine Parks, sponsored by Maritime Institute of Malaysia. August 13-14, 1996. Kuala Lumpur, Malaysia.
National Park Service. 1997. VERP: The Visitor Experience and Resource Protection (VERP) Framework—A Handbook for Planners and Managers. USDI National Park Service, Denver Service Center. Denver, Colorado.
Shelby, B. and T.A. Heberlein. 1986. Carrying Capacity in Recreation Settings. Oregon State University Press. Corvallis, Oregon.
Stankey, G., D. Cole, R. Lucas, M. Peterson, and S. Frissell. 1985. The Limits of Acceptable Change (LAC) System for Wilderness Planning. USDA Forest Service, Intermountain Forest and Range Experiment Station. General Technical Report INT-176. January 1985.