recruiting trends 2019-2020 49th editionrecruiting trends 2019-2020 is published by michigan state...
TRANSCRIPT

Fall 2019
Recruiting Trends 2019-2020 49th Edition
Phil Gardner, PhD Collegiate Employment Research Institute Michigan State University

Recruiting Trends Report: 2019-2020
©2019 Collegiate Employment Research Institute, Michigan State University 2
Table of Contents
Introduction …………………………………………………………………………………………….. 3
Our Employers ……………………………………………………………………………… 4
Part I: College Labor Market Outlook and Influencers ……………………………… 5
Optimistic Outlook ………………………………………………………………………. 5
Factors Shaping Hiring Goals ……………………………………………………….. 6
Part II: Talent Acquisition Goals ………………………………………………………………. 7
College Hiring Targets …………………………………………………………………. 8
Hiring by Organizational Size ………………………………………………………. 9
Hiring by Economic Sector ………………………………………………………….. 12
Academic Discipline Outlook ………………………………………………………. 16
Locational Comparisons ……………………………………………………………… 17
Part III: Starting Salary Offers …………………………………………………………………. 25
Part IV: Are Storm Clouds Gathering? ……………………………………………………. 27
Part V: Internships and Co-ops ………………………………………………………………. 28
Part VI: Benchmarking College Recruiting ……………………………………………… 29
Recruiting Trends 2019-2020 is published by Michigan State University and the Collegiate Employment Research
Institute and copyrighted, ©2019-2020, by Michigan State University. All rights reserved. The electronic version is
for individual use only. No part of this electronic report may be reproduced in any form by any electronic and
mechanical means (including photocopying, recording, or information storage and retrieval) without written
permission from the Institute. Users cannot mount this file on any network servers or distribute this report by
email without written permission from the Institute. The Collegiate Employment Research Institute permits the
use of this report for use in the classroom and career newsletters with proper citation of Michigan State University
and the Collegiate Employment Research Institute.

Recruiting Trends Report: 2019-2020
©2019 Collegiate Employment Research Institute, Michigan State University 3
Introduction
The college labor market continues to advance for the tenth consecutive year as we
project another strong year for new graduates seeking jobs.
This year is the tenth consecutive year of expanding job opportunities for new college
graduates. Troubling signs swirl around the world’s economy in many guises, as these examples suggest:
• Institute for Supply Management’s non-manufacturing index continues to move downward but
remains above 50 indicating a slight expansion. ISM’s factory gauge, however, has plunged with
a more pessimistic outlook for manufacturing.
• Construction while sluggish moves ahead slowly because of non-residential and heavy
construction activity.
• Auto sales have slowed and short-term outlook is poor for sales to improve.
• NY Federal Reserve Bank injects over $200 billion in to money supply over past month to control
short-term money markets that banks depend upon. While this move is rather obscure,
economist disagree whether it is merely paper transactions or more troubling “glitch in the
plumbing” of the financial system.
• World trade is down to the 2009 level at the height of the recession. Tariffs are taking a toll
around the world. A recent World Trade Organization decision permits the U.S. to raise taxes on
European goods, including wine and airplanes. Tension between the U.S. and China remains
high, despite claims of recent thawing, over tariff agreement (at the time of releasing this report).
• U.S. labor market continues to grow jobs at a slower rate. Previous months projections (prior to
October) by the Department of Labor revised downward tamping down future hiring growth.
However, the unemployment rate is at historical lows. The U6 data points to concerns that many
people are stuck in part-time, low paying jobs. Salary growth that showed promise nine months
ago faltered over the past several months.
Even with these warning signs, the college labor market’s historic run appears to have plenty of
opportunities, according to this year’s group of respondents. Challenges exist as possible signs of future
trouble pop up but nothing eminent to crash the party.
.

Recruiting Trends Report: 2019-2020
©2019 Collegiate Employment Research Institute, Michigan State University 4
Our employers. In planning for this year’s Recruiting Trends project,
we shortened the survey by half to encourage participants to provide
complete information. This year approximately 2,800 employers
provided information that can be included in this report. The number
providing complete hiring information exceeded the previous three years
by 450 individuals. Seventy-two percent (1991 respondents) are
recruiters seeking full-time talent or hiring managers overseeing talent
acquisition within their organizations. Other contributors include
internship and co-op program managers (11 percent), recruiters seeking experienced talent
(10 percent), and those filling short-term assignments of six months or less (7 percent). The
results presented in this report use the information provided by full-time recruiters, hiring
managers, and internship and co-op program managers.
The respondents represent the rich diversity of companies and organizations seeking new
college talent. Sixty-five percent represented organizations with
fewer than 500 employers and thirty-five percent with more than
500 employees. The number of large organizations is down
slightly from levels reported the past several years.
Every major industrial sector
(based on major NAIC codes)
provided information for this
survey. Sectors providing the highest number of respondents
included Construction, Educational Services, Finance and
Insurance Services, Healthcare and Social Assistance,
Manufacturing, and Business, Professional, and Scientific Services
(BPSS). Even though BPSS represents a large proportion of the
respondents, their share decreased from a high of 30 percent
several years ago. Education Services and Health Care & Social
Assistance grew in the meantime. This shift mirrors the Department of Labor review of job
growth driven by these two sectors. The number of respondents for Financial and Insurance
Services has also declined, primarily from the portfolio management and personal financial
service segment.
An employer from every state and several territories appeared among the respondents. States
providing the highest number of respondents included California, Colorado, Florida, Kansas,
Massachusetts, Michigan, Texas, Utah and Wisconsin. (Employers also responded from
several foreign countries.)
2800 Survey
Responses
SIZE
< 100 employees – 39% 100 – 500 employees – 26%
500 – 4,000 employees – 20% 4,000 + employees – 15%
Sectors BPSS – 21%
Manufacturing – 12% Education – 11%
Health – 8% Non-profits – 7%
Government – 7% Construction – 6%
Finance – 6%

Recruiting Trends Report: 2019-2020
©2019 Collegiate Employment Research Institute, Michigan State University 5
Part I: College Labor Market: Outlook & Influencers
Optimistic outlook. Eighty-five percent of respondents reported that they hired at least one
new college graduate during the 2018-19 academic year. For employers who did not hire any
college graduates last year, 87 percent indicated that they expect to hire at least one graduate
this year. In examining these expectations in more detail, we find only two percent of those
who hired last year do not intend to hire any new personnel this year.
The employer outlook remains bright. Ninety-two percent (down slightly from last year)
described the overall new college labor market as good to excellent. Their
average annual rating of 3.68 is nearly the same as last year.
About 92 percent (down 2 percentage points) described the new college
labor market in their industrial or economic sector as good to excellent.
Their average rating was 3.9, placing the level of optimism at “very
good.” Obviously, employers are excited about the employment
prospects in their industrial segments, as this figure reaches an all-time
high.
Figure 1. Employer Outlook for Overall College Labor Market 2008/09 through
2018/19.
In a comparison by organization size, large companies with more than 4,000 employees rated
both the overall market (F=13.269, .000) and their industrial sector market (F=7.605, .000)
significantly higher than those organizations with fewer employees. Large organizations reported
a mean of 3.95 for the overall market and 4.1 for their industrial sector.
2.7
1.92.1
2.42.6
2.8
3.2 3.2 3.3 3.4
3.75 3.68
2008 2009 2010 2011 2012 2013 2014 2015 2016 2017 2018 2019
Ou
tlo
ok:
1=
Po
or
4 =
Ve
ry G
oo
d
Overall Average of Labor Market Outlook
Employer Optimism for College Labor Market
Employer
Optimism Very High

Recruiting Trends Report: 2019-2020
©2019 Collegiate Employment Research Institute, Michigan State University 6
Fifty-two percent expect to increase hiring across all degree levels (slightly less than last year by
2 percentage points). The increase in hires provides an additional gauge on the level of
optimism in the market. The breakdown by degree shows that 56 percent of employers seeking
associate’s degree candidates and 47 percent seeking bachelor’s degree (down for a second
year by three percentage points) will increase hiring over last year.
About 39 percent of employers recruiting MBAs (same as last year) expect
to increase hiring while 37 percent of employers seeking master will add
more positions. This latter figure is a six-point percentage drop from last
year.
For those organizations that will decrease the number of new college
hires compared to last year, the decreases generally fell in the range
from one to two positions. Organizations that plan to increase hiring will
likely add between 1 and 2 positions.
Organizations seeking associate degrees find 63% of these organizations who plan to reduce
the number of positions will likely be in the range of one to five positions. For those
organizations increasing hires, 70% will add one to five positions.
Factors shaping hiring goals for 2019-2020. We have been tracking several potential influences
on the college labor market for ten years: organizational growth, turnover and retirement. We
included two additional factors for this year: economic policy (trade and tariffs) and global
economic outlook. A modification to the wording for the organizational growth factor appeared in
this year’s survey as: organizational growth outlook for next year rather than simply organizational
growth. The survey response prompt did not specify the direction of growth. Slightly more than
seventy percent (71 percent) indicated that their organization’s growth outlook was quite to very
important in driving their hiring decisions. Turnover, another important factor, shaped the hiring
goals with 60 percent expressing that turnover was quite to very important to their hiring decisions.
While baby boomer retirements loom large across the national labor market, this factor
continues to have only a modest impact on the demand for new graduates (28 percent rated
this factor quite to very important). Sectors facing pressure from retirements are
Government, Educational Services, Transportation, Manufacturing, Construction, and
Utilities. Global growth issues affect 20 percent of respondents who rated this
factor quite to very important . Likewise, sixteen percent felt that tariffs, trade
policy and political machinations were quite to very important to their hiring
outlook this year.
Organizational growth continues to stress organizations’ workforce outlook. For growth-
oriented organizations, adding additional staff is a challenge in a competitive labor market. If
uncertainty about their growth outlook enters into an organization’s planning, plans to curtail
52% Set to increase hiring quotas
across all degrees

Recruiting Trends Report: 2019-2020
©2019 Collegiate Employment Research Institute, Michigan State University 7
hiring can also be painful. Organizations from BPSS, Education Services, Health Services and
Construction hold growth as quite to very important. Government, Non-profits and Manufacturing
appear to be less concerned about growth at this time.
Turnover continues to affect the workforce in many organizations. Sixty percent of employers
indicated that turnover was quite to very important in framing their
hiring decisions. Sectors particularly concerned about turnover (quite
to very important) included Educational Services, Health Care and Social
Assistance, Government, and, to a lesser extent, Manufacturing and
BPSS.
Large organizations with more than 500 employees reported higher
level of concern about retirements than smaller companies.
Industrial sectors where retirements are of higher concern include
Education Services, Government, and Manufacturing.
Large organizations were adjusting their hiring goals to accommodate tariffs, trade and political
disruptions. Industrial sectors with a high proportion of respondents consider tariffs and trade
policy to be quite to very important include Manufacturing, BPSS, and Construction. A very
similar comparison emerges for concern over the outlook for global growth. Smaller
organizations influenced more by global growth than with trade/tariffs.
.
Part II: Talent Acquisition Goals for 2019-2020
Since the 2008 recession bottomed out in 2010, the college labor market has experienced
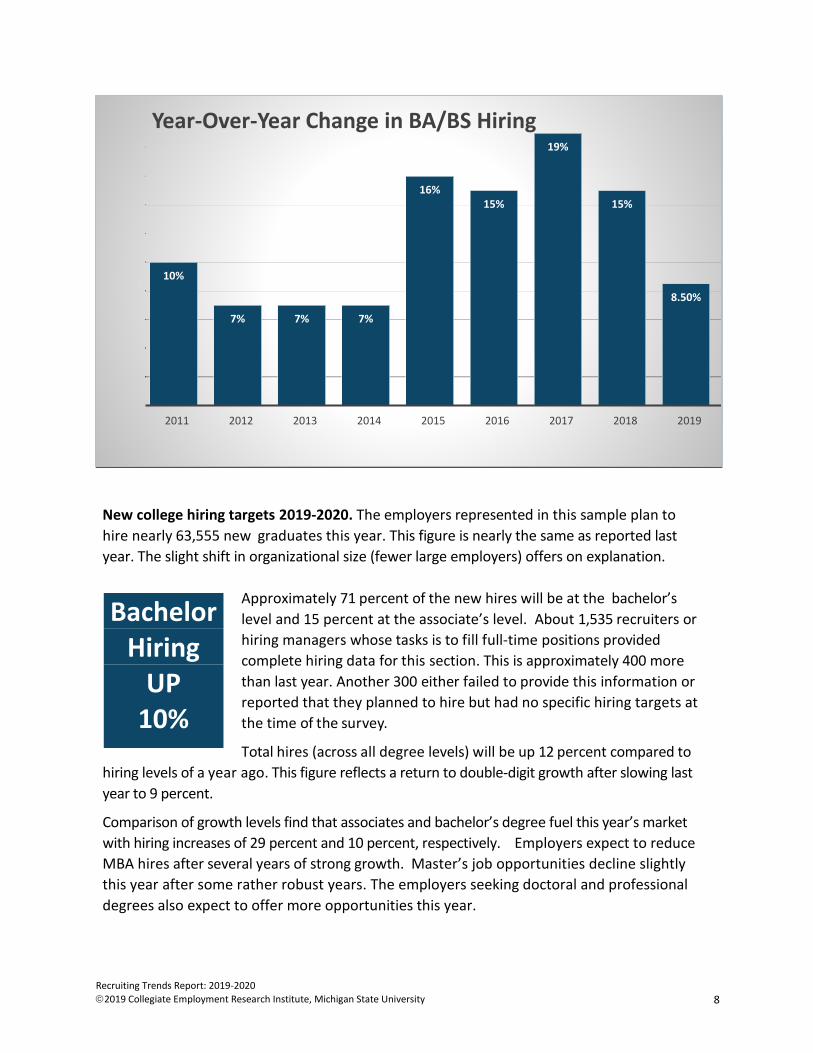
nine years of solid, if not spectacular, growth. The figure below uses the year-to-year
change for the bachelor’s labor market to illustrate the story for historical period in job
growth. From 2010-11 through 2013-14 employers slowly advanced the college labor
market by expanding opportunities at a steady growth around 7 percent. Then in 2014-15
opportunities exploded as organizations across all economic sectors began to recruit
aggressively. Growth exceeded 15 percent four consecutive years. This past year saw
growth moderate to 8.5 percent. This moderation appeared to fit the pattern of a mature
market, coupled with a slowing economy. Results from this year indicate that employers
are expanding opportunities at a faster rate than last year, especially for associates and
bachelor’s degrees. Hiring growth across all degrees expected to increase 12 percent.
Bachelor’s level opportunities increase by 10 percent.
Figure 2. Historical Overview of Change in the Bachelor Labor Market (2011-
2019)
Turnover 60% indicate shapes hiring decisions for
college grads
Recruiting Trends Report: 2019-2020
©2019 Collegiate Employment Research Institute, Michigan State University 8
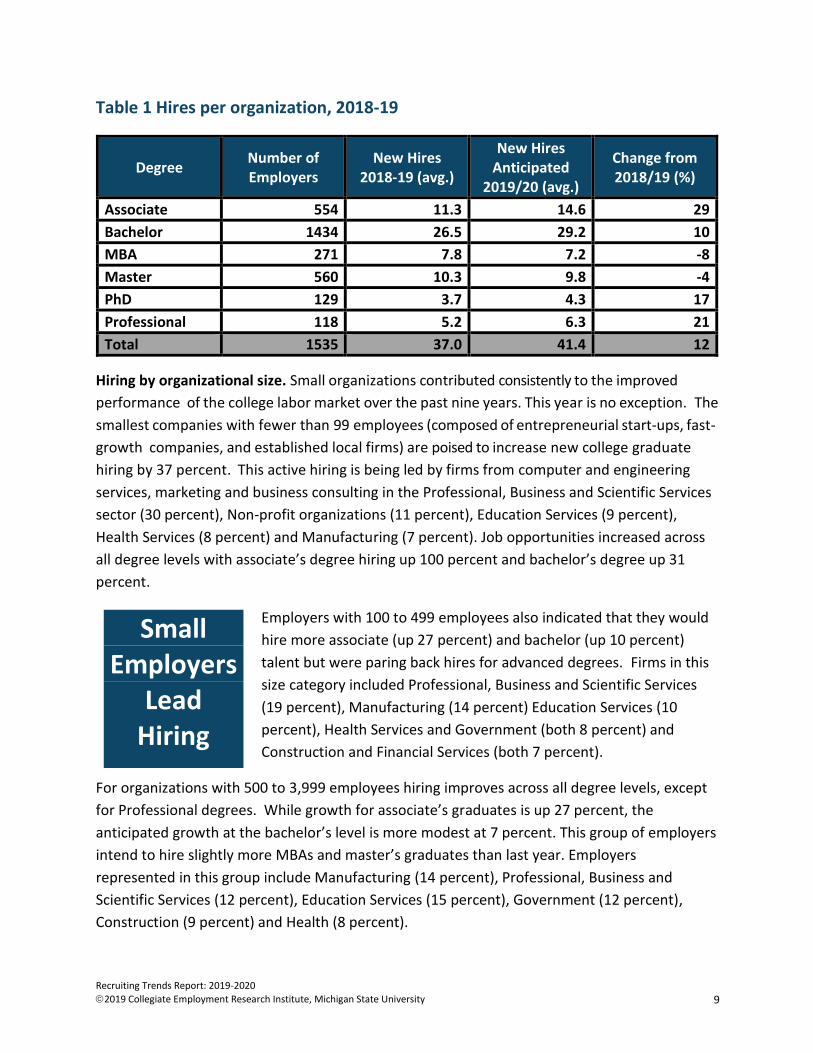
New college hiring targets 2019-2020. The employers represented in this sample plan to
hire nearly 63,555 new graduates this year. This figure is nearly the same as reported last
year. The slight shift in organizational size (fewer large employers) offers on explanation.
Approximately 71 percent of the new hires will be at the bachelor’s
level and 15 percent at the associate’s level. About 1,535 recruiters or
hiring managers whose tasks is to fill full-time positions provided
complete hiring data for this section. This is approximately 400 more
than last year. Another 300 either failed to provide this information or
reported that they planned to hire but had no specific hiring targets at
the time of the survey.
Total hires (across all degree levels) will be up 12 percent compared to
hiring levels of a year ago. This figure reflects a return to double-digit growth after slowing last
year to 9 percent.
Comparison of growth levels find that associates and bachelor’s degree fuel this year’s market
with hiring increases of 29 percent and 10 percent, respectively. Employers expect to reduce
MBA hires after several years of strong growth. Master’s job opportunities decline slightly
this year after some rather robust years. The employers seeking doctoral and professional
degrees also expect to offer more opportunities this year.
10%
7% 7% 7%
16%15%
19%
15%
8.50%
2011 2012 2013 2014 2015 2016 2017 2018 2019
Year-Over-Year Change in BA/BS Hiring
Bachelor Hiring
UP 10%
Recruiting Trends Report: 2019-2020
©2019 Collegiate Employment Research Institute, Michigan State University 9
Table 1 Hires per organization, 2018-19
Degree Number of Employers
New Hires 2018-19 (avg.)
New Hires Anticipated
2019/20 (avg.)
Change from 2018/19 (%)
Associate 554 11.3 14.6 29
Bachelor 1434 26.5 29.2 10
MBA 271 7.8 7.2 -8
Master 560 10.3 9.8 -4
PhD 129 3.7 4.3 17
Professional 118 5.2 6.3 21
Total 1535 37.0 41.4 12
Hiring by organizational size. Small organizations contributed consistently to the improved
performance of the college labor market over the past nine years. This year is no exception. The
smallest companies with fewer than 99 employees (composed of entrepreneurial start-ups, fast-
growth companies, and established local firms) are poised to increase new college graduate
hiring by 37 percent. This active hiring is being led by firms from computer and engineering
services, marketing and business consulting in the Professional, Business and Scientific Services
sector (30 percent), Non-profit organizations (11 percent), Education Services (9 percent),
Health Services (8 percent) and Manufacturing (7 percent). Job opportunities increased across
all degree levels with associate’s degree hiring up 100 percent and bachelor’s degree up 31
percent.
Employers with 100 to 499 employees also indicated that they would
hire more associate (up 27 percent) and bachelor (up 10 percent)
talent but were paring back hires for advanced degrees. Firms in this
size category included Professional, Business and Scientific Services
(19 percent), Manufacturing (14 percent) Education Services (10
percent), Health Services and Government (both 8 percent) and
Construction and Financial Services (both 7 percent).
For organizations with 500 to 3,999 employees hiring improves across all degree levels, except
for Professional degrees. While growth for associate’s graduates is up 27 percent, the
anticipated growth at the bachelor’s level is more modest at 7 percent. This group of employers
intend to hire slightly more MBAs and master’s graduates than last year. Employers
represented in this group include Manufacturing (14 percent), Professional, Business and
Scientific Services (12 percent), Education Services (15 percent), Government (12 percent),
Construction (9 percent) and Health (8 percent).
Small Employers
Lead Hiring
Recruiting Trends Report: 2019-2020
©2019 Collegiate Employment Research Institute, Michigan State University 10
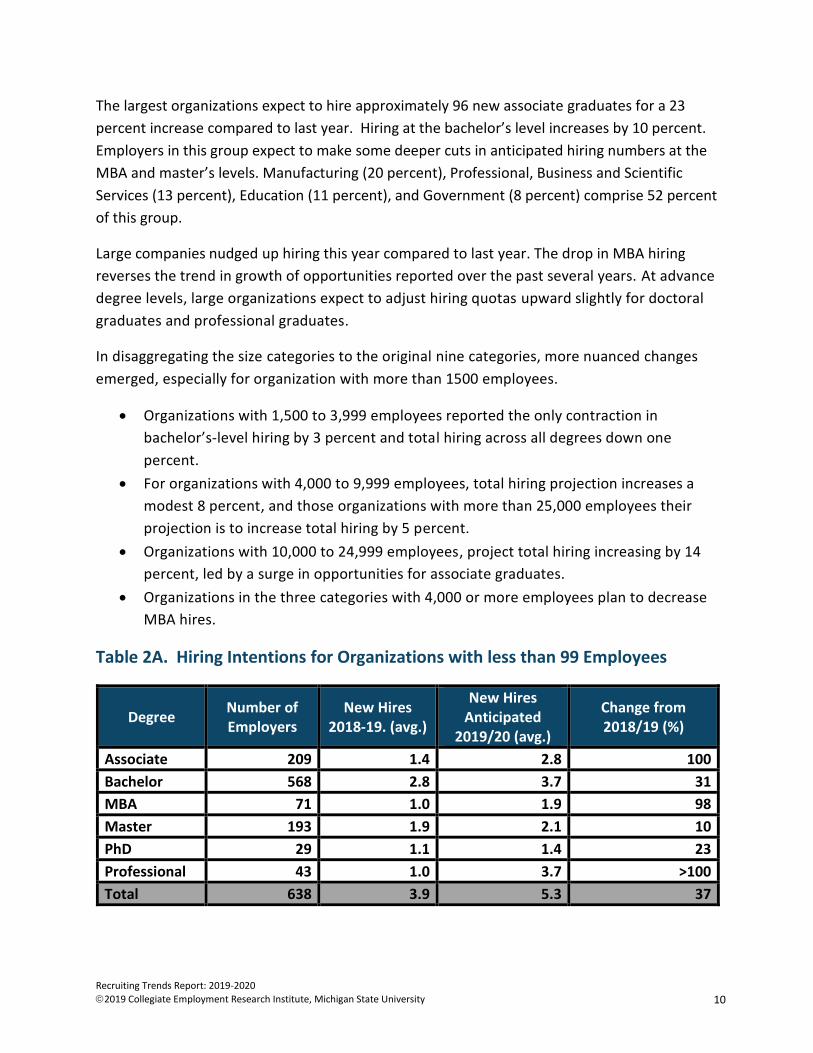
The largest organizations expect to hire approximately 96 new associate graduates for a 23
percent increase compared to last year. Hiring at the bachelor’s level increases by 10 percent.
Employers in this group expect to make some deeper cuts in anticipated hiring numbers at the
MBA and master’s levels. Manufacturing (20 percent), Professional, Business and Scientific
Services (13 percent), Education (11 percent), and Government (8 percent) comprise 52 percent
of this group.
Large companies nudged up hiring this year compared to last year. The drop in MBA hiring
reverses the trend in growth of opportunities reported over the past several years. At advance
degree levels, large organizations expect to adjust hiring quotas upward slightly for doctoral
graduates and professional graduates.
In disaggregating the size categories to the original nine categories, more nuanced changes
emerged, especially for organization with more than 1500 employees.
• Organizations with 1,500 to 3,999 employees reported the only contraction in
bachelor’s-level hiring by 3 percent and total hiring across all degrees down one
percent.
• For organizations with 4,000 to 9,999 employees, total hiring projection increases a
modest 8 percent, and those organizations with more than 25,000 employees their
projection is to increase total hiring by 5 percent.
• Organizations with 10,000 to 24,999 employees, project total hiring increasing by 14
percent, led by a surge in opportunities for associate graduates.
• Organizations in the three categories with 4,000 or more employees plan to decrease
MBA hires.
Table 2A. Hiring Intentions for Organizations with less than 99 Employees
Degree Number of Employers
New Hires 2018-19. (avg.)
New Hires Anticipated
2019/20 (avg.)
Change from 2018/19 (%)
Associate 209 1.4 2.8 100
Bachelor 568 2.8 3.7 31
MBA 71 1.0 1.9 98
Master 193 1.9 2.1 10
PhD 29 1.1 1.4 23
Professional 43 1.0 3.7 >100
Total 638 3.9 5.3 37
Recruiting Trends Report: 2019-2020
©2019 Collegiate Employment Research Institute, Michigan State University 11
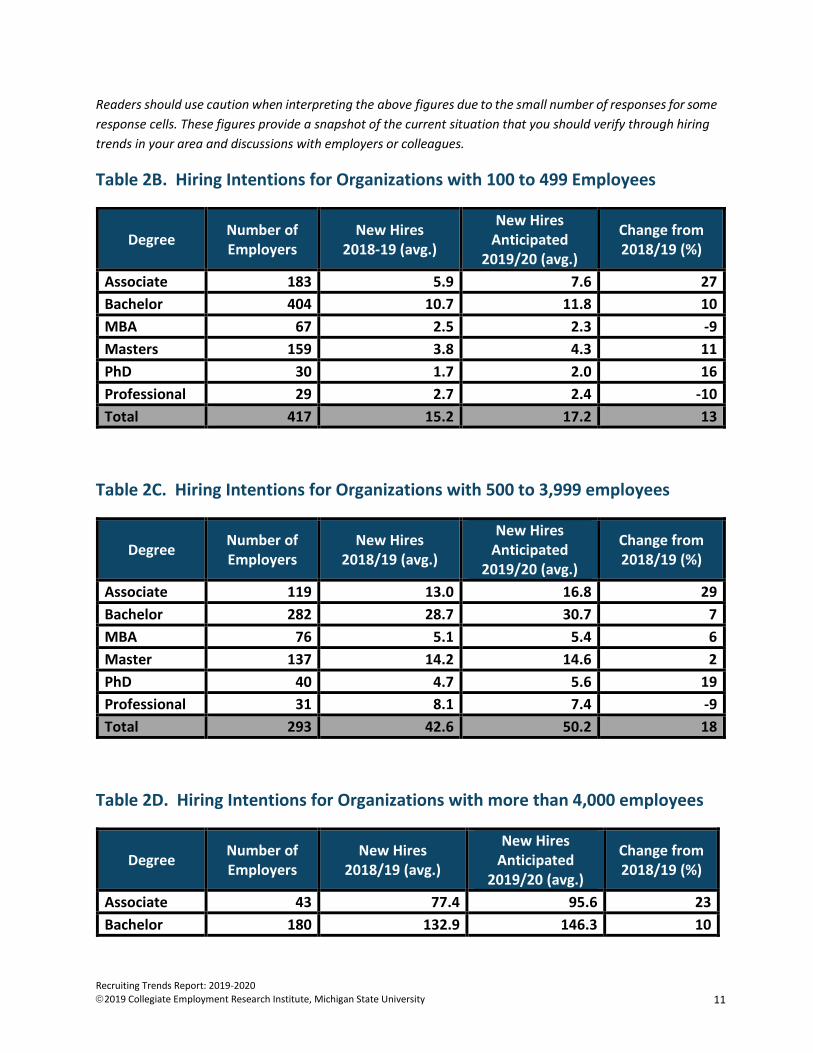
Readers should use caution when interpreting the above figures due to the small number of responses for some
response cells. These figures provide a snapshot of the current situation that you should verify through hiring
trends in your area and discussions with employers or colleagues.
Table 2B. Hiring Intentions for Organizations with 100 to 499 Employees
Degree Number of Employers
New Hires 2018-19 (avg.)
New Hires Anticipated
2019/20 (avg.)
Change from 2018/19 (%)
Associate 183 5.9 7.6 27
Bachelor 404 10.7 11.8 10
MBA 67 2.5 2.3 -9
Masters 159 3.8 4.3 11
PhD 30 1.7 2.0 16
Professional 29 2.7 2.4 -10
Total 417 15.2 17.2 13
Table 2C. Hiring Intentions for Organizations with 500 to 3,999 employees
Degree Number of Employers
New Hires 2018/19 (avg.)
New Hires Anticipated
2019/20 (avg.)
Change from 2018/19 (%)
Associate 119 13.0 16.8 29
Bachelor 282 28.7 30.7 7
MBA 76 5.1 5.4 6
Master 137 14.2 14.6 2
PhD 40 4.7 5.6 19
Professional 31 8.1 7.4 -9
Total 293 42.6 50.2 18
Table 2D. Hiring Intentions for Organizations with more than 4,000 employees
Degree Number of Employers
New Hires 2018/19 (avg.)
New Hires Anticipated
2019/20 (avg.)
Change from 2018/19 (%)
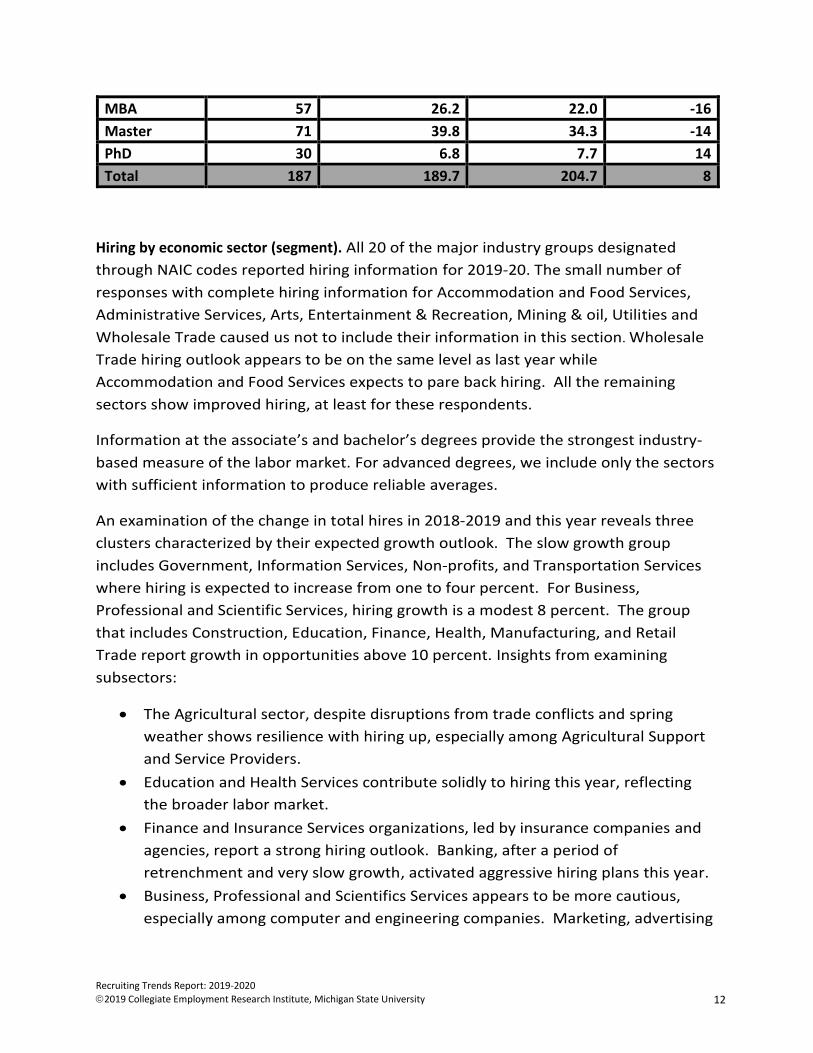
Associate 43 77.4 95.6 23
Bachelor 180 132.9 146.3 10
Recruiting Trends Report: 2019-2020
©2019 Collegiate Employment Research Institute, Michigan State University 12
MBA 57 26.2 22.0 -16
Master 71 39.8 34.3 -14
PhD 30 6.8 7.7 14
Total 187 189.7 204.7 8
Hiring by economic sector (segment). All 20 of the major industry groups designated
through NAIC codes reported hiring information for 2019-20. The small number of
responses with complete hiring information for Accommodation and Food Services,
Administrative Services, Arts, Entertainment & Recreation, Mining & oil, Utilities and
Wholesale Trade caused us not to include their information in this section. Wholesale
Trade hiring outlook appears to be on the same level as last year while
Accommodation and Food Services expects to pare back hiring. All the remaining
sectors show improved hiring, at least for these respondents.
Information at the associate’s and bachelor’s degrees provide the strongest industry-
based measure of the labor market. For advanced degrees, we include only the sectors
with sufficient information to produce reliable averages.
An examination of the change in total hires in 2018-2019 and this year reveals three
clusters characterized by their expected growth outlook. The slow growth group
includes Government, Information Services, Non-profits, and Transportation Services
where hiring is expected to increase from one to four percent. For Business,
Professional and Scientific Services, hiring growth is a modest 8 percent. The group
that includes Construction, Education, Finance, Health, Manufacturing, and Retail
Trade report growth in opportunities above 10 percent. Insights from examining
subsectors:
• The Agricultural sector, despite disruptions from trade conflicts and spring
weather shows resilience with hiring up, especially among Agricultural Support
and Service Providers.
• Education and Health Services contribute solidly to hiring this year, reflecting
the broader labor market.
• Finance and Insurance Services organizations, led by insurance companies and
agencies, report a strong hiring outlook. Banking, after a period of
retrenchment and very slow growth, activated aggressive hiring plans this year.
• Business, Professional and Scientifics Services appears to be more cautious,
especially among computer and engineering companies. Marketing, advertising

Recruiting Trends Report: 2019-2020
©2019 Collegiate Employment Research Institute, Michigan State University 13
and public relations companies have slowed their growth compared to the past
few years.
• Building Material and Clothing companies anchored hiring in the Retail Trade
sector.
• Construction hiring outlook remains strong with growth generated from non-
residential and heavy, civil engineering construction organizations.
• Manufacturing companies plan to increase hires at the associate and bachelor’s
levels reversing a recent decline in hiring activity. Several subsectors account
for most of the gains, including Food and Beverage Manufacturing; Machinery
Manufacturing; and Air, Missile, Space and Armored Vehicle Manufacturing.
Automotive hiring is more cautious with slow growth in opportunities, possibly
reflecting the recent decline in auto sales (Note: the data collection phase was
completed a month before autoworkers went on strike at GM.)
Table 3A. Total Hires at All Degree Levels for 2019-2020 by Industry Sector
Industry Segment New Hires
2018/19 (avg.)
New Hires Anticipated
2019/20 (avg.)
Change from 2018/19 (%)
Agriculture & Natural Resources
11.2 16.3 46
Business, Professional & Scientific Services
16.3 17.6 8
Construction 33.2 39.5 19
Educational Services 68.2 76.7 12
Finance and Insurance 18.1 24.2 39
Government 146.2 148.1 1
Health Care Services 35.2 40.9 16
Information Services 20.4 22.4 4
Manufacturing 36.3 46.9 25
Non-profits 22.2 22.4 1
Retail Services 47.9 54.2 13
Transportation 49.4 51.6 4
The following tables present industrial sector hiring outlooks for different degree
levels. Total hiring outlook offers a global picture of the total college labor market.
Employers hiring intentions differ by degree level. Sectors not included in the tables

Recruiting Trends Report: 2019-2020
©2019 Collegiate Employment Research Institute, Michigan State University 14
failed to meet the criteria we use for including information. Please be cautious in
interpreting the reported changes. They reflect only a small portion of each sector and
are not generalizable. Remember small numbers produce large percentage changes
that may overstate the hiring outlook for that degree.
Momentum for college hiring in 2019-20 comes from strong gains at the associate’s
and bachelor’s degrees. The associate appears particularly healthy. MBAs and
master’s degree outlook is shakier. After several years of strong growth, MBA and
master’s hiring opportunities shrink this year.
Table 3B. Hiring Targets for Associate Degree Graduates 2019-2020 by Industry
Sector
Industry Segment New Hires
2018/19 (avg.)
New Hires Anticipated
2019/20 (avg.)
Change from 2018/19 (%)
Agriculture & Natural Resources
4.0 6.7 67
Business, Professional & Scientific Services
5.9 6.1 2
Construction 25.3 37.7 49
Educational Services 11.3 12.3 9
Finance and Insurance 6.1 8.2 33
Government 27.9 31.1 11
Health Care Services 14.4 18.6 29
Manufacturing 3.0 7.7 >100
Non-profits 8.6 11.5 32
Transportation 17.0 20.3 20
Table 3C. Hiring Targets for Bachelor Degree Graduates 2018-19 by Sector
Industry Segment New Hires
2018/19 (avg.)
New Hires Anticipated
2019/20 (avg.)
Change from 2018/19 (%)
Agriculture & Natural Resources
8.2 11.8 44
Business, Professional & Scientific Services
11.8 12.9 9

Recruiting Trends Report: 2019-2020
©2019 Collegiate Employment Research Institute, Michigan State University 15
Construction 23.2 24.9 7
Educational Services 55.8 62.9 13
Finance and Insurance 13.4 19.9 48
Government 85.9 86.0 NC
Health Care Services 21.2 23.5 11
Information Services 16.3 17.5 7
Manufacturing 31.1 34.9 12
Non-profits 14.5 14.1 -3
Retail Services 39.5 46.0 16
Transportation 36.7 35.9 -2
Table 3D. Hiring Targets for Advanced Degrees for 2018-2019 by Sector
Industry Segment New Hires
2018/19 (avg.)
New Hires Anticipated
2019/20 (avg.)
Change from 2018/19 (%)
MBA
Business, Professional & Scientific Services
4.6 4.7 2
Construction 1.7 1.4 -18
Finance & Insurance 6.5 8.8 48
Government 18.0 14.7 -18
Manufacturing 11.2 8.5 -24
Masters
Business, Professional & Scientific Services
5.4 5.5 1
Education Services 16.8 18.8 12
Financial Services 5.6 3.8 -31
Government 11.1 10.0 -10
Health Services 13.6 16.2 19
Manufacturing 16.4 8.0 -51
Non-profits 6.9 6.9 NC
PhD
Business, Professional & Scientific Services
3.8 4.3 15
Education Services 3.4 3.4 NC
Government 6.3 11.7 84
Professional
Recruiting Trends Report: 2019-2020
©2019 Collegiate Employment Research Institute, Michigan State University 16
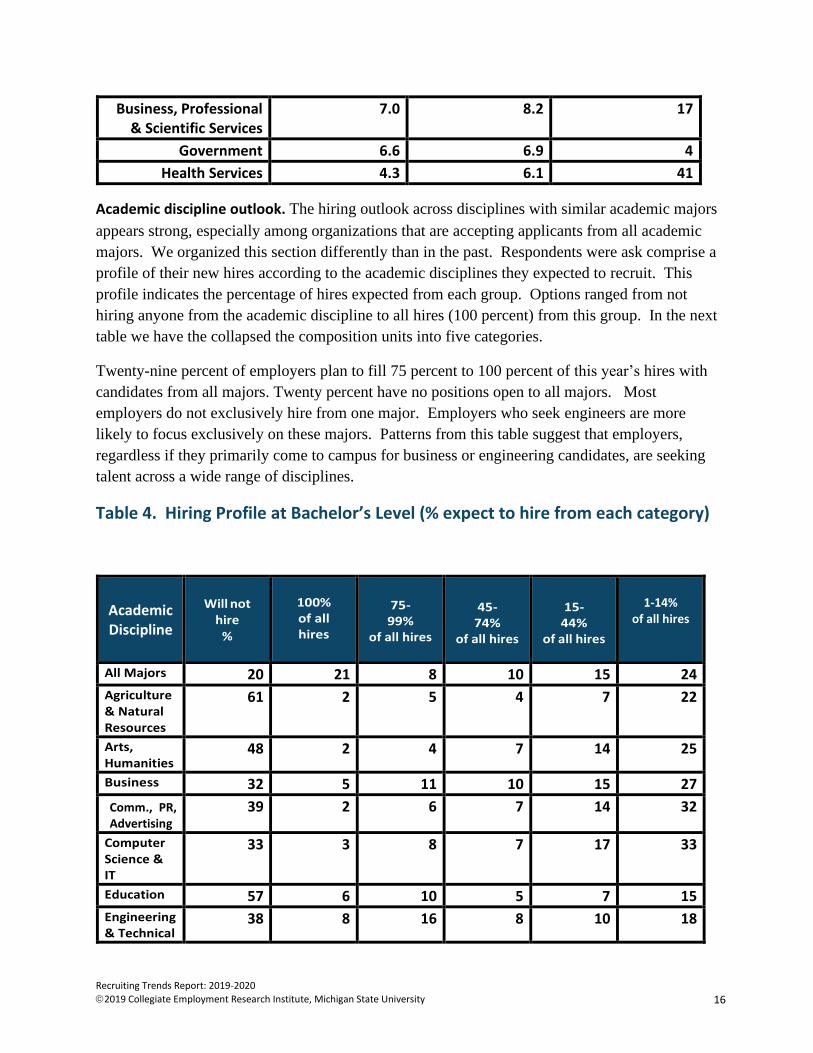
Business, Professional & Scientific Services
7.0 8.2 17
Government 6.6 6.9 4
Health Services 4.3 6.1 41
Academic discipline outlook. The hiring outlook across disciplines with similar academic majors
appears strong, especially among organizations that are accepting applicants from all academic
majors. We organized this section differently than in the past. Respondents were ask comprise a
profile of their new hires according to the academic disciplines they expected to recruit. This
profile indicates the percentage of hires expected from each group. Options ranged from not
hiring anyone from the academic discipline to all hires (100 percent) from this group. In the next
table we have the collapsed the composition units into five categories.
Twenty-nine percent of employers plan to fill 75 percent to 100 percent of this year’s hires with
candidates from all majors. Twenty percent have no positions open to all majors. Most
employers do not exclusively hire from one major. Employers who seek engineers are more
likely to focus exclusively on these majors. Patterns from this table suggest that employers,
regardless if they primarily come to campus for business or engineering candidates, are seeking
talent across a wide range of disciplines.
Table 4. Hiring Profile at Bachelor’s Level (% expect to hire from each category)
Academic Discipline
Will not hire
%
100% of all hires
75-99%
of all hires
45-74%
of all hires
15-44%
of all hires
1-14%
of all hires
All Majors 20 21 8 10 15 24
Agriculture & Natural Resources
61 2 5 4 7 22
Arts, Humanities
48 2 4 7 14 25
Business 32 5 11 10 15 27
Comm., PR, Advertising
39 2 6 7 14 32
Computer Science & IT
33 3 8 7 17 33
Education 57 6 10 5 7 15
Engineering & Technical
38 8 16 8 10 18

Recruiting Trends Report: 2019-2020
©2019 Collegiate Employment Research Institute, Michigan State University 17
Health Sciences
62 4 7 3 8 17
Sciences (physical, biological) & Math
51 2 5 7 15 21
Social Science
60 3 6 5 8 18
Construction
57 4 8 6 9 16
Calculations of the change in hiring bachelor hiring for each composition level reveals that
nearly all categories will experience growth this year. A couple exceptions found that in
engineering, organizations where engineers comprise 45 percent to 50 percent of the hiring
pool and all hires from engineering would decrease hiring this year. Those seeking exclusively
science candidates also expect to pull back their hires.
Locational comparisons in Hiring. Location plays an important role in shaping the labor market
whether globally, nationally or within specific regions of the U.S. Respondents first indicated
whether they recruited globally, nationally or within specific regions of the U.S. While regional
employers are likely to identify recruiting in only one region, some employers may recruit in
multiple regions. For the regional information presented below, keep in mind that an employer
counts in each region they designated for recruiting.
Globally oriented recruiters dropped for the second year, possibly in response to a weakened
global economy and the continuing trade disruptions from tariffs. Likewise, the number of
nationally focused employers has declined slightly from recent years. Regional employer input
remained strong. The good news reflects increased opportunities at the associate’s and
bachelor’s degree level. Organizations recruiting across the U.S. show more caution this year
with bachelor’s degree hiring up only 6 percent. Weaknesses appear for MBA among global
recruiters and master’s degrees among global and regional employers.
Table 5A. Outlook for Globally Oriented Recruiting
Degree Level New Hires
2018/19 (avg.)
New Hires Anticipated
2019/20 (avg.)
Change from 2018/19 (%)
Associate 17.9 19.2 7
Bachelor 57.1 64.5 13
MBA 24.8 17.9 -27
Master 21.5 20.4 -5
Recruiting Trends Report: 2019-2020
©2019 Collegiate Employment Research Institute, Michigan State University 18
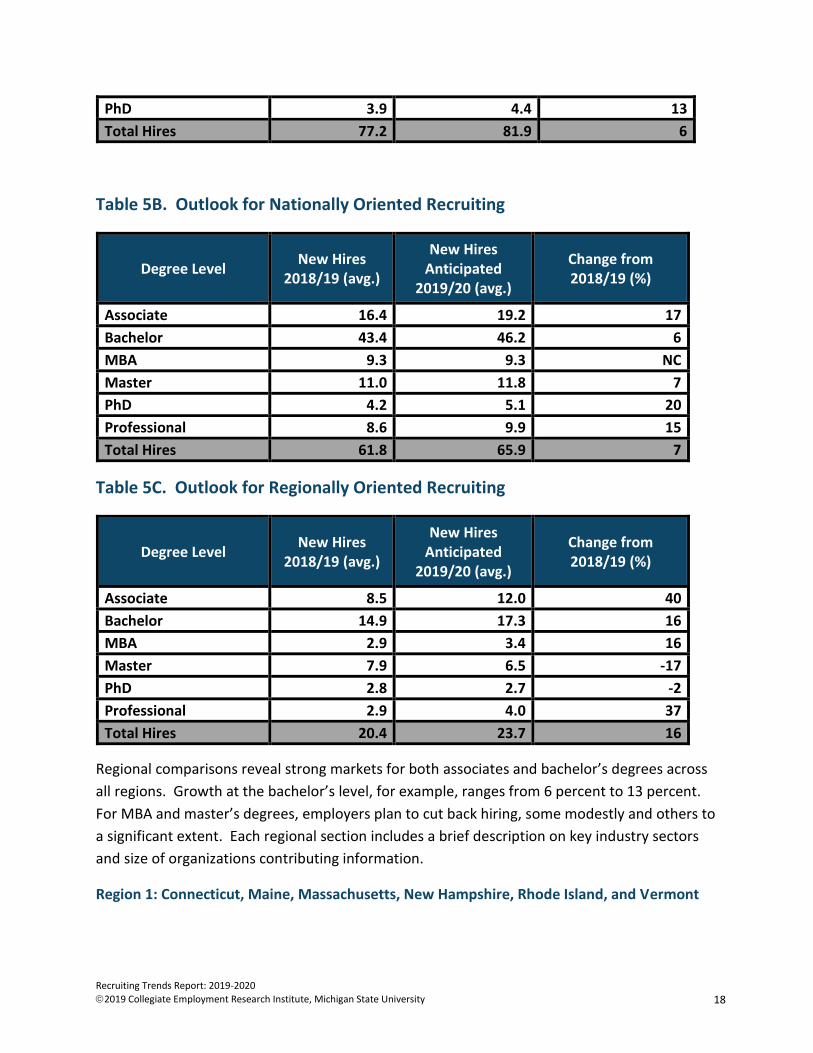
PhD 3.9 4.4 13
Total Hires 77.2 81.9 6
Table 5B. Outlook for Nationally Oriented Recruiting
Degree Level New Hires
2018/19 (avg.)
New Hires Anticipated
2019/20 (avg.)
Change from 2018/19 (%)
Associate 16.4 19.2 17
Bachelor 43.4 46.2 6
MBA 9.3 9.3 NC
Master 11.0 11.8 7
PhD 4.2 5.1 20
Professional 8.6 9.9 15
Total Hires 61.8 65.9 7
Table 5C. Outlook for Regionally Oriented Recruiting
Degree Level New Hires
2018/19 (avg.)
New Hires Anticipated
2019/20 (avg.)
Change from 2018/19 (%)
Associate 8.5 12.0 40
Bachelor 14.9 17.3 16
MBA 2.9 3.4 16
Master 7.9 6.5 -17
PhD 2.8 2.7 -2
Professional 2.9 4.0 37
Total Hires 20.4 23.7 16
Regional comparisons reveal strong markets for both associates and bachelor’s degrees across
all regions. Growth at the bachelor’s level, for example, ranges from 6 percent to 13 percent.
For MBA and master’s degrees, employers plan to cut back hiring, some modestly and others to
a significant extent. Each regional section includes a brief description on key industry sectors
and size of organizations contributing information.
Region 1: Connecticut, Maine, Massachusetts, New Hampshire, Rhode Island, and Vermont
Recruiting Trends Report: 2019-2020
©2019 Collegiate Employment Research Institute, Michigan State University 19
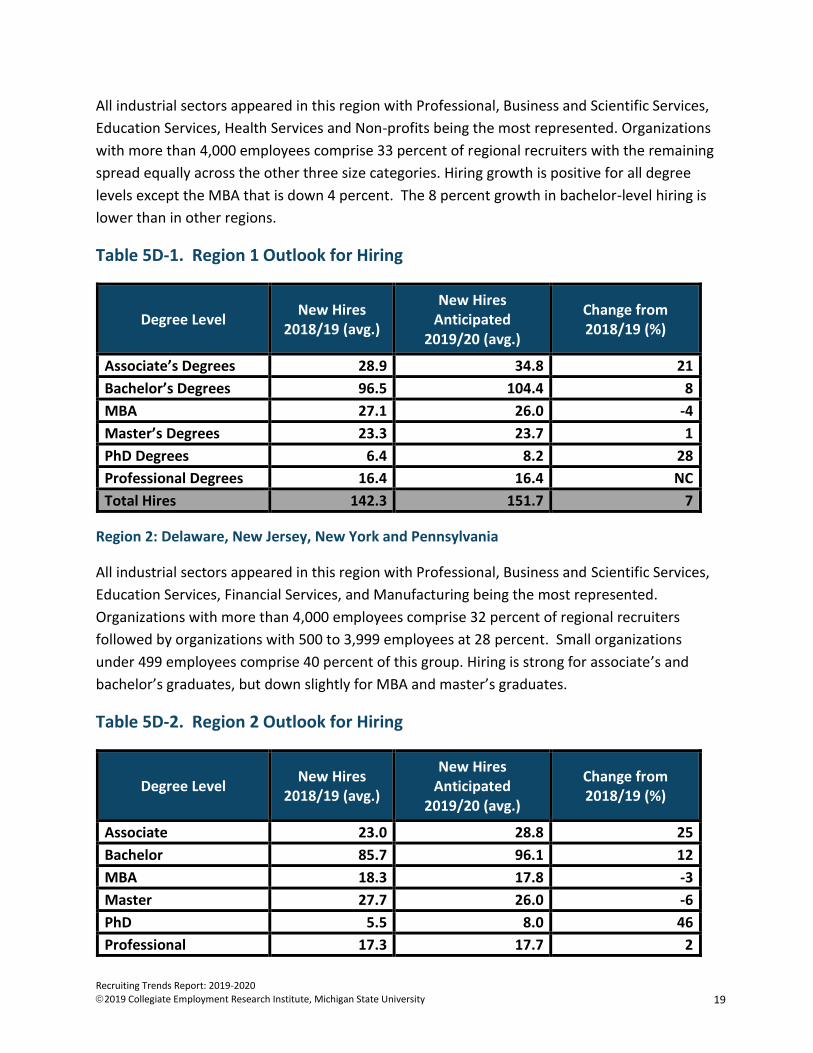
All industrial sectors appeared in this region with Professional, Business and Scientific Services,
Education Services, Health Services and Non-profits being the most represented. Organizations
with more than 4,000 employees comprise 33 percent of regional recruiters with the remaining
spread equally across the other three size categories. Hiring growth is positive for all degree
levels except the MBA that is down 4 percent. The 8 percent growth in bachelor-level hiring is
lower than in other regions.
Table 5D-1. Region 1 Outlook for Hiring
Degree Level New Hires
2018/19 (avg.)
New Hires Anticipated
2019/20 (avg.)
Change from 2018/19 (%)
Associate’s Degrees 28.9 34.8 21
Bachelor’s Degrees 96.5 104.4 8
MBA 27.1 26.0 -4
Master’s Degrees 23.3 23.7 1
PhD Degrees 6.4 8.2 28
Professional Degrees 16.4 16.4 NC
Total Hires 142.3 151.7 7
Region 2: Delaware, New Jersey, New York and Pennsylvania
All industrial sectors appeared in this region with Professional, Business and Scientific Services,
Education Services, Financial Services, and Manufacturing being the most represented.
Organizations with more than 4,000 employees comprise 32 percent of regional recruiters
followed by organizations with 500 to 3,999 employees at 28 percent. Small organizations
under 499 employees comprise 40 percent of this group. Hiring is strong for associate’s and
bachelor’s graduates, but down slightly for MBA and master’s graduates.
Table 5D-2. Region 2 Outlook for Hiring
Degree Level New Hires
2018/19 (avg.)
New Hires Anticipated
2019/20 (avg.)
Change from 2018/19 (%)
Associate 23.0 28.8 25
Bachelor 85.7 96.1 12
MBA 18.3 17.8 -3
Master 27.7 26.0 -6
PhD 5.5 8.0 46
Professional 17.3 17.7 2

Recruiting Trends Report: 2019-2020
©2019 Collegiate Employment Research Institute, Michigan State University 20
Total Hires 123.1 134.6 9
Region 3: District of Columbia, Maryland, Virginia and West Virginia
A traditionally strong region in terms of responses saw a drop in respondents this year.
Particularly noticeable was the decline in responses from government agencies. Professional,
Business and Scientific Services and Construction were leading industry sectors in Region 3.
Respondents in this region were concentrated among large employers with 63 percent with 500
or more employees. MBA and master’s degrees outlook points toward reduced opportunities.
Positive outlook for associate and bachelor graduates.
Table 5D-3. Region 3 Outlook for Hiring
Degree Level New Hires
2018/19 (avg.)
New Hires Anticipated
2019/20 (avg.)
Change from 2018/19 (%)
Associate 20.6 25.4 23
Bachelor 103.9 114.4 10
MBA 30.1 25.6 -15
Master 37.8 30.2 -20
PhD 6.3 8.6 35
Professional 10.5 21.6 11
Total Hires 151.2 161.0 6
Region 4: Florida, Georgia, North Carolina and South Carolina
Table 5D-4. Region 4 Outlook for Hiring
Region 4 maintains a balance across the four size categories with approximately 25 percent of
respondents in each category. Major contributors are from these sectors: Professional,
Business and Scientific Services, Manufacturing, Construction, Health Services, Education
Services, and Financial Services. Outlook is positive except for master’s degrees, where
employers are cutting back on their hires by 21 percent.
Degree Level New Hires
2018/19 (avg.)
New Hires Anticipated
2019/20 (avg.)
Change from 2018/19 (%)

Recruiting Trends Report: 2019-2020
©2019 Collegiate Employment Research Institute, Michigan State University 21
Associate 22.2 31.4 41
Bachelor 70.4 77.7 10
MBA 15.3 14.6 -4
Master 22.3 19.9 -21
PhD 5.2 6.9 33
Professional 12.1 12.7 5
Total Hires 98.0 107.3 9
Region 5: Alabama, Kentucky, Louisiana, Mississippi, and Tennessee
This region is tough to obtain a strong response from employers. Employers recruiting in this
region are likely to be recruiting in neighboring regions as reflected by 60 percent with more
than 500 employees. Leading industry sector contributors were Professional, Business and
Scientific Services and Education Services. As reported for other regions, Region 5 shows strong
growth for associate’s and bachelor’s degree but a reduction for MBA and master’s degrees.
Table 5D-5. Region 5 Outlook for Hiring
Degree Level New Hires
2018/19 (avg.)
New Hires Anticipated
2019/20 (avg.)
Change from 2018/19 (%)
Associate 24.5 28.2 15
Bachelor 110.7 122.2 10
MBA 24.9 22.0 -11
Master 29.0 23.9 -18
PhD 6.5 9.7 50
Professional 16.5 21.8 31
Total Hires 153.3 164.16 7
Region 6: Illinois, Indiana, Michigan and Ohio
The only disappointment within Region 6 was the lack of responses from Illinois employers.
Usually a very reliable source of input, the number of Illinois responses have fallen sharply the
last two years. Strong responses from Michigan, Ohio and Indiana helped cover this loss. Small
employers dominate in this region with 59 percent having 500 of fewer employees.
Manufacturing remains a major industrial sector along with Professional, Business and Scientific

Recruiting Trends Report: 2019-2020
©2019 Collegiate Employment Research Institute, Michigan State University 22
Services. Education Services and Government also contributed a solid number of respondents.
Employment opportunities improve for associates and bachelor’s degrees with MBA and
master’s degrees down slightly.
Table 5D-6. Region 6 Outlook for Hiring
Degree Level New Hires
2018/19 (avg.)
New Hires Anticipated
2019/20 (avg.)
Change from 2018/19 (%)
Associate 10.2 13.1 28
Bachelor 46.6 51.2 10
MBA 13.2 12.7 -3
Master 15.8 14.0 -11
PhD 5.0 6.5 30
Professional 7.7 8.7 12
Total Hires 63.1 70.3 11
Region 7: Iowa, Minnesota, North Dakota, South Dakota and Wisconsin
This region’s number of responses dropped compared to recent years. The distribution of
employers across industrial sectors achieved better balance than other regions with eight
sectors providing 8 to 12 percent each. Employers in this region tended to be large (over 500
employees) with 55 percent of total respondents. While growth in opportunities for associate’s
degrees at 42 percent, hiring at the bachelor’s degree increases by a modest 6 percent
compared to other regions.
Table 5D-7. Region 7 Outlook for Hiring
Degree Level New Hires
2018/19 (avg.)
New Hires Anticipated
2019/20 (avg.)
Change from 2018/19 (%)
Associate 11.6 16.5 42
Bachelor 60.5 64.3 6
MBA 15.2 11.8 -22
Master 11.8 13.4 13
PhD 4.1 5.6 37
Professional 5.8 5.9 2
Total Hires 84.8 90.6 7

Recruiting Trends Report: 2019-2020
©2019 Collegiate Employment Research Institute, Michigan State University 23
Region 8: Arkansas, Kansas, Oklahoma, Missouri, Nebraska and Texas
Region 8 had a strong showing by employers across the entire region. With all industry sectors
covered, the largest contributors came from Professional, Business, and Scientific Services,
Education Services, Manufacturing, Construction and Government. The majority of Agriculture
and Mining & Oil employers came from this region. Respondents across the three size
categories below 3,999 employees was approximately 26 percent each and the large
organizations comprised 21 percent. Employers in this region made cuts in hiring at the MBA
and master’s level. Growth in opportunities appear strong for associates and bachelor’s
degrees.
Table 5D-8. Region 8 Outlook for Hiring
Degree Level New Hires
2018/19 (avg.)
New Hires Anticipated
2019/20 (avg.)
Change from 2018/19 (%)
Associate 12.2 13.4 10
Bachelor 45.7 51.1 12
MBA 15.8 13.2 -17
Master 15.4 12.8 -17
PhD 4.6 6.4 38
Professional 7.7 9.6 24
Total Hires 64.6 69.2 7
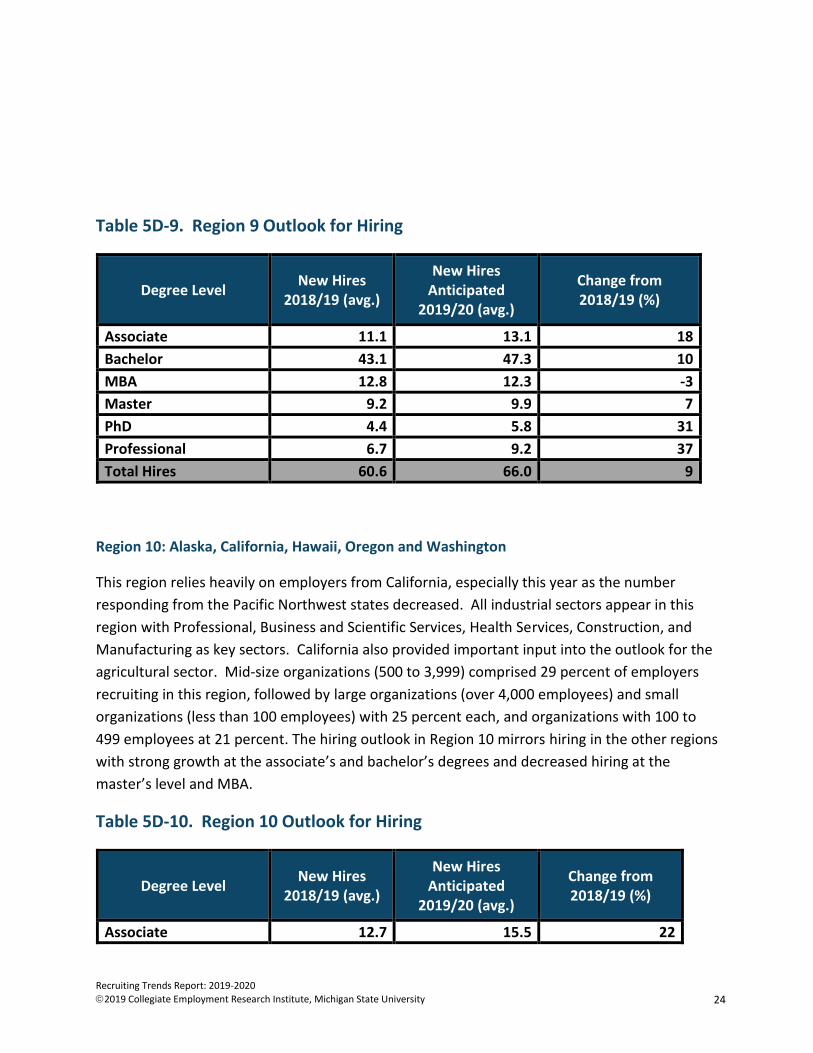
Region 9: Arizona, Colorado, Idaho, Montana, New Mexico, Nevada, Utah and Wyoming
Region 9 provided strong employer input with Professional, Business and Scientific Services,
Education Services, Manufacturing and Construction being key contributors. In this region,
Mining and Oil companies comprised approximately 40 percent of firms in this sector. Small
organizations under 100 employees made up 33 percent of employers, and those firms with
100 to 500 employees another 25 percent. Mid-size and large organizations each represented
21 percent of employers. Hiring outlook shows strong growth across all degrees with the
exception of the MBA.
Recruiting Trends Report: 2019-2020
©2019 Collegiate Employment Research Institute, Michigan State University 24
Table 5D-9. Region 9 Outlook for Hiring
Degree Level New Hires
2018/19 (avg.)
New Hires Anticipated
2019/20 (avg.)
Change from 2018/19 (%)
Associate 11.1 13.1 18
Bachelor 43.1 47.3 10
MBA 12.8 12.3 -3
Master 9.2 9.9 7
PhD 4.4 5.8 31
Professional 6.7 9.2 37
Total Hires 60.6 66.0 9
Region 10: Alaska, California, Hawaii, Oregon and Washington
This region relies heavily on employers from California, especially this year as the number
responding from the Pacific Northwest states decreased. All industrial sectors appear in this
region with Professional, Business and Scientific Services, Health Services, Construction, and
Manufacturing as key sectors. California also provided important input into the outlook for the
agricultural sector. Mid-size organizations (500 to 3,999) comprised 29 percent of employers
recruiting in this region, followed by large organizations (over 4,000 employees) and small
organizations (less than 100 employees) with 25 percent each, and organizations with 100 to
499 employees at 21 percent. The hiring outlook in Region 10 mirrors hiring in the other regions
with strong growth at the associate’s and bachelor’s degrees and decreased hiring at the
master’s level and MBA.
Table 5D-10. Region 10 Outlook for Hiring
Degree Level New Hires
2018/19 (avg.)
New Hires Anticipated
2019/20 (avg.)
Change from 2018/19 (%)
Associate 12.7 15.5 22

Recruiting Trends Report: 2019-2020
©2019 Collegiate Employment Research Institute, Michigan State University 25
Bachelor 58.4 65.8 13
MBA 16.2 15.2 -6
Master 20.9 18.3 -12
PhD 6.4 7.4 15
Professional 12.4 15.2 22
Total Hires 87.6 94.9 8
Part III: Starting Salary Offers and Other Compensation
Starting salary, commissions, and bonuses. For 42 percent of reporting organizations, starting
salary offers increase this academic year; a six-percentage point decrease from last year. Fifty-
eight percent plan to keep starting salary offers at the same level as last year.
Career advisors and students have multiple sources of information on evaluating starting salary
offers (NACE Salary Report, Glassdoor and Payscale for example). In addition, the vast
improvement in post-graduation information collected by colleges and universities offers
immediate access to a reliable source of salary information. With these available resources and
in an effort to shorten the Recruiting Trends survey, employers only reported the percentage
raise for their salary offers this year. Career advisors who assist students in assessing job offers
can use the expected level of increase to frame realistic expectations around the salary offered.
Just keep in mind that nearly 60 percent of employers will not be raising offers.
Salary offer increases for 2019-2020 range from one to 20 percent. Employers report an
average 4.3 percent increase across those organizations raising offer levels. Approximately 85
percent of organization will increase offers by two to six percent.
Salary offer increases are consistent across organizational size categories, ranging from 4.2% to
4.6%. However, the number of organizations increasing their starting salary offers vary from a
low of 37 percent for organizations with fewer than 100 employees to 49 percent for
organizations with more than 4,000 employees.
Starting salary increases vary across different sectors of the economy. One group that includes
Construction, Mining & Oil, Accommodations and Food Service (Hospitality), and Utilities expect
to raise salaries more than 5 percent. Another group with expected increases between 4
percent and 4.9 percent includes Agriculture; Business, Scientific and Professional Services;
Manufacturing; and Finance & Insurance. A third group that includes Government, Health
Services and Non-profits expect to raise offers from 2 percent to 3.9 percent. The figure
following the sectors listed below indicate the percentage of organizations in this sector that
Recruiting Trends Report: 2019-2020
©2019 Collegiate Employment Research Institute, Michigan State University 26
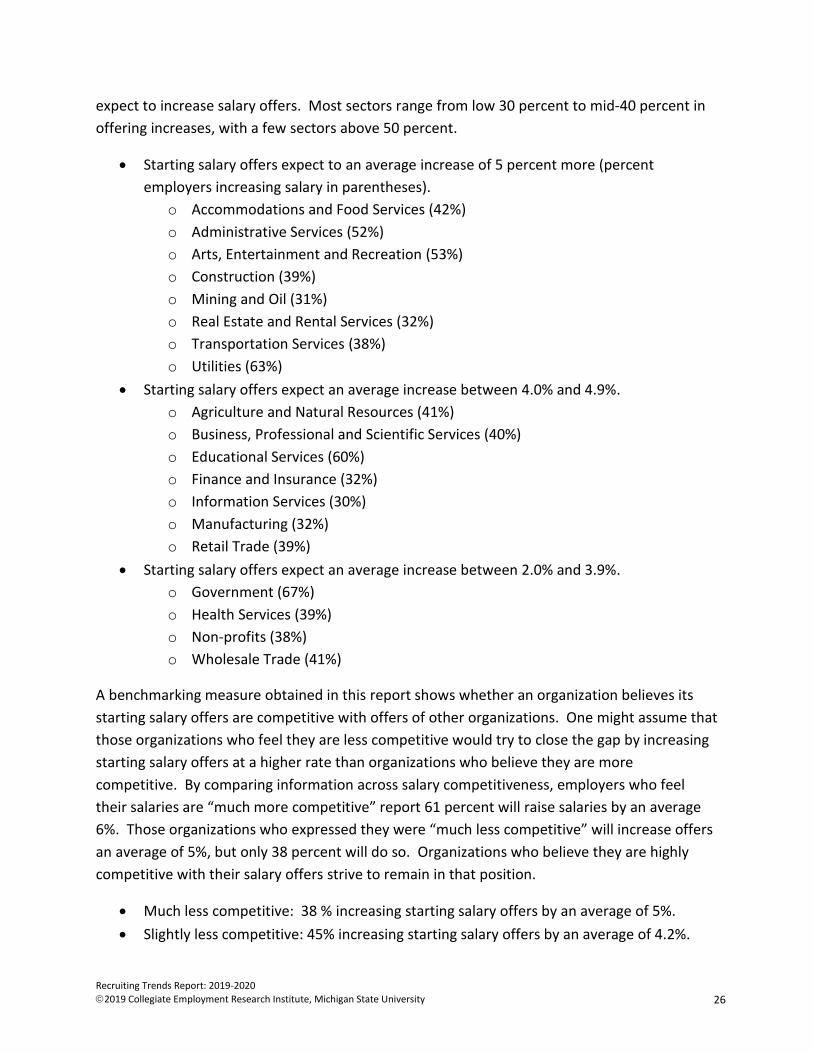
expect to increase salary offers. Most sectors range from low 30 percent to mid-40 percent in
offering increases, with a few sectors above 50 percent.
• Starting salary offers expect to an average increase of 5 percent more (percent
employers increasing salary in parentheses).
o Accommodations and Food Services (42%)
o Administrative Services (52%)
o Arts, Entertainment and Recreation (53%)
o Construction (39%)
o Mining and Oil (31%)
o Real Estate and Rental Services (32%)
o Transportation Services (38%)
o Utilities (63%)
• Starting salary offers expect an average increase between 4.0% and 4.9%.
o Agriculture and Natural Resources (41%)
o Business, Professional and Scientific Services (40%)
o Educational Services (60%)
o Finance and Insurance (32%)
o Information Services (30%)
o Manufacturing (32%)
o Retail Trade (39%)
• Starting salary offers expect an average increase between 2.0% and 3.9%.
o Government (67%)
o Health Services (39%)
o Non-profits (38%)
o Wholesale Trade (41%)
A benchmarking measure obtained in this report shows whether an organization believes its
starting salary offers are competitive with offers of other organizations. One might assume that
those organizations who feel they are less competitive would try to close the gap by increasing
starting salary offers at a higher rate than organizations who believe they are more
competitive. By comparing information across salary competitiveness, employers who feel
their salaries are “much more competitive” report 61 percent will raise salaries by an average
6%. Those organizations who expressed they were “much less competitive” will increase offers
an average of 5%, but only 38 percent will do so. Organizations who believe they are highly
competitive with their salary offers strive to remain in that position.
• Much less competitive: 38 % increasing starting salary offers by an average of 5%.
• Slightly less competitive: 45% increasing starting salary offers by an average of 4.2%.

Recruiting Trends Report: 2019-2020
©2019 Collegiate Employment Research Institute, Michigan State University 27
• Comparable salary offers: 36% increasing starting salary offers by an average of 4.1%.
• Slightly more competitive: 47% increasing starting salary offers by an average of 4.3%.
• Much more competitive: 61% increasing starting salary offers by an average of 6%.
Not all compensation will be in the form of base salary. While 83 percent of respondents avoid
commission-based compensation, 18 percent combine base salary with commission, with only a
few entirely commissioned based.
In highly competitive labor markets, employers are tempted to use signing bonuses as extra
incentive to candidates to accept the offered position. Few employers reported offering signing
bonuses over the past several years, usually less than 10 percent. Last year saw this number
double to 20 percent. This year the upward trend continues with 40 percent having some type
of additional incentive for signing an employment contract. Nearly 75 percent of organizations
extend signing bonuses up to $5,000, and another 21 percent offer $5,000 to $10,000. Six
percent offer more than $10,000 to sign, with some bonuses exceeding $25,000.
Part IV: Are Storm Clouds Gathering?
The last two recessions (2000 and 2008) occurred after the release of the Recruiting Trends
report in the respective year. Both reports indicated that employers were optimistic about the
hiring outlook, only to have their enthusiasm crushed a few months later. Is there possible
hidden indications in this survey of trouble lurking in the months ahead?
Our first step examined hiring intentions based on organizational responses to the influence of
retirement, turnovers, growth, global economic outlook and trade/tariffs. We focused on the
bachelor’s degree with more data points.
• Retirement. The direction of hiring (up, same or down) was similar across all the
response options concerning retirements. One figure did pop out in that those most
concerned about retirements intentions to decease hiring with 30 percent in this group.
Those organizations least concerned about retirements expect to increase hiring by 23
percent. For organizations with moderate concerns hiring plans expect a 5 percent
incease and for those most concerned about retirement hiring quotas increase by 9
percent.
• Turnover. The direction of hiring for fifty-two percent of organizations who rated
turnover as very important was to be up this year. However, their increase amounts to
only 6 percent over last year. Organizations who are quite concerned about turnover
plan to grow by 9 percent; those slightly concerned by 27 percent and those not
concerned by 10 percent.

Recruiting Trends Report: 2019-2020
©2019 Collegiate Employment Research Institute, Michigan State University 28
• Growth: The direction of hiring for fifty-seven percent of organizations where growth is
to be up. Among organizations who indicated that growth not important, 38 percent
indicated the direction of their hiring would be up with 32 percent reporting a decline in
hiring. Based on their hiring targets, organizations who indicated growth is not
important expect to increase three percent; organizations at moderately important by
10 percent; organizations at quite important by percent; and organizations at very
important by 12 percent.
• Adjustments to tariffs and trade policy. No differences were found in comparisons of
organizations direction of hiring. For organizations who are modestly concerned hiring
increases by six percent. Where policies are quite to very important in shaping hiring
targets, organizations do not plan to change hiring level from last year.
• Global Economics. Organizations who indicated that global economic outlook to be
quite to very important in hiring plan to decrease hiring by one percent. For all other
categories hiring plans are to increase 10 percent or more.
Modest adjustments are being made in anticipation of possible economic trouble with those
facing global forces initiating some curtainment in hiring. For those dealing with tariffs and
trade policy, they are being more cautionary by not increasing workforce above what they
need. Retirement, turnover and growth outlook produced muddled results with no clear
insight into future intentions.
From scanning the data degree substitution may be occurring. In this situation employers
maintain the same level of hiring as last year but pursue lower, less expensive degrees. For an
example, an organization that hired 10 graduates last year including three MBAs plan to hire 10
graduates this year but only one MBA, increasing bachelor hiring by two. Degree substitution
usually occurs when employers become more cautious and do not want to commit labor that is
more expensive. After some very rough calculations, it appears that for every MBA being lost
an additional 1.5 to 1.75 bachelors degrees are being added. Associate degrees may also be
benefitting from degree substitution but it is harder to calculate.
Other clues present themselves in some of the shifts in the respondent profile this year. Fewer
large organizations may suggest these organizations are being more cautious about hiring. The
loss of firms in the Business, Professional and Scientific Services, Finance and Insurance and
Manufacturing sectors may suggest areas where employers are being more cautious.
Fortunately, no change or pattern stands out to indicate possible rough patches ahead.
Part V: Internships and Co-op Outlook
Employers offer a range of work experiences for students to pursue depending on student
interest and academic requirements. These experiences include clinicals, practicums,

Recruiting Trends Report: 2019-2020
©2019 Collegiate Employment Research Institute, Michigan State University 29
professional practice, and apprenticeships, for example. The most common option is the
internship (51 percent) coupled with cooperative education (12 percent). Nearly one-quarter
of respondents provide salary-based employment in a professional setting, specifically during
the summer.
Focusing on respondents who have assignments for interns and co-ops, 93 percent indicate
they are or are likely to have positions available for interns or co-ops this year. While 57
percent plan to hire the same number of interns as last year, 38 percent will increase their
intern hiring. Only 5 percent will lower the number of intern positions. An organization plans to
hire an average 23 interns/co-ops; a figure influenced by size of the organization. Small
companies with fewer than 100 employees expect to hire six to seven interns (average) with
larger organizations employing more:
• Organizations with 100 to 499 employees: 9 interns/co-ops (average)
• Organizations with 500 to 3,999 employees: 24 interns/co-ops (average)
• Organizations with more than 4,000 employees: 82 interns/co-ops (average)
Employers will be seeking intern/co-op candidates from all academic backgrounds. For this
survey, respondents were more likely to be recruiting for Business, Engineering, Computer
Science, and Communications, especially Public Relations and Advertising. Ten percent indicate
their internships are open to all majors.
Paid internships are the norm this year with 70 percent of respondents indicating all their
internships are paid. Another 15 percent offer both paid and unpaid internships depending on
the assignment. The final 15 percent offer only unpaid experiences. Unpaid experiences appear
mostly in Education, Health Care, Non-profits and Government.
Part VI: Benchmarking College Recruiting 2018-2019
As a special section to Recruiting Trends, we present some basic benchmarks for college
recruiting for the 2018-2019 recruiting period. We responded to a request from our employer
partners to assemble some basic information on the outcomes of college talent initiatives. The
measures solicited in this report where selected by employers. When using this information be
cautious as the variation across size and industry sector can be large. For this reason, we
present both the mean and the median with a wide difference suggesting non-normal
distribution of responses. Notes will be included to clarify results.
Only one-third (32%) of organizations report they regularly evaluate their college recruiting
program. Among large organizations (more than 4,000 employees), 65 percent evaluate their
programs. For organizations with fewer than 100 employees, just 18 percent assess their
Recruiting Trends Report: 2019-2020
©2019 Collegiate Employment Research Institute, Michigan State University 30
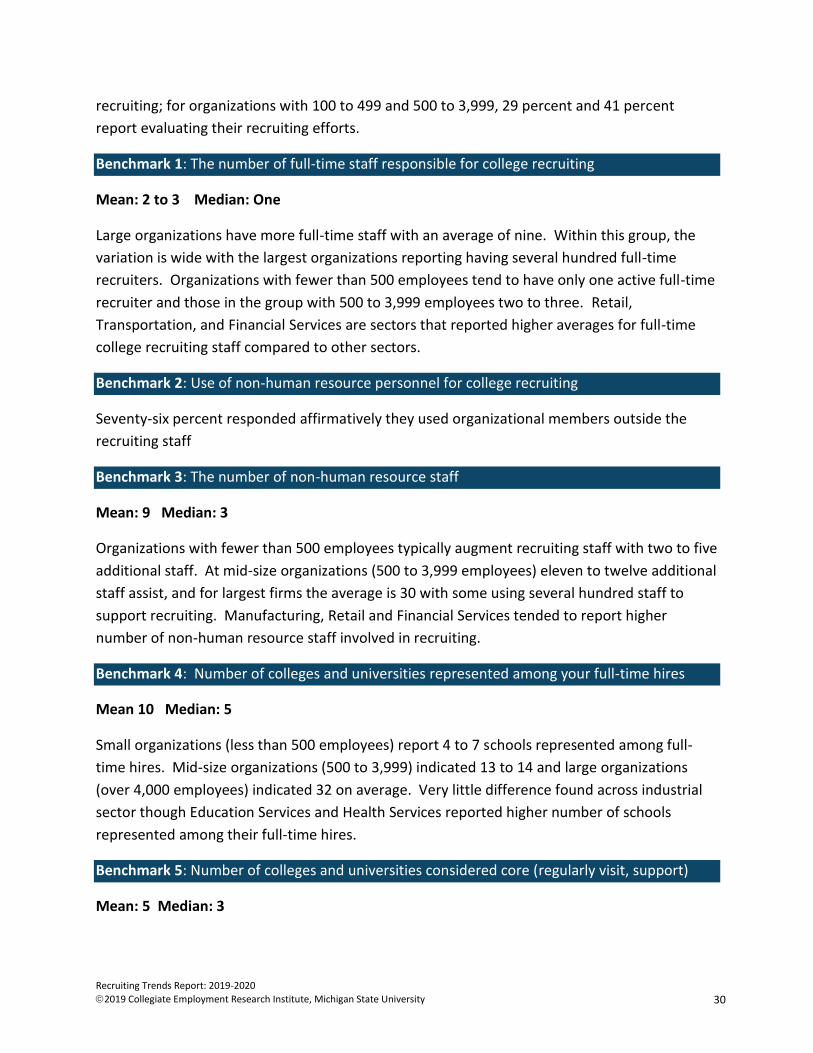
recruiting; for organizations with 100 to 499 and 500 to 3,999, 29 percent and 41 percent
report evaluating their recruiting efforts.
Benchmark 1: The number of full-time staff responsible for college recruiting
Mean: 2 to 3 Median: One
Large organizations have more full-time staff with an average of nine. Within this group, the
variation is wide with the largest organizations reporting having several hundred full-time
recruiters. Organizations with fewer than 500 employees tend to have only one active full-time
recruiter and those in the group with 500 to 3,999 employees two to three. Retail,
Transportation, and Financial Services are sectors that reported higher averages for full-time
college recruiting staff compared to other sectors.
Benchmark 2: Use of non-human resource personnel for college recruiting
Seventy-six percent responded affirmatively they used organizational members outside the
recruiting staff
Benchmark 3: The number of non-human resource staff
Mean: 9 Median: 3
Organizations with fewer than 500 employees typically augment recruiting staff with two to five
additional staff. At mid-size organizations (500 to 3,999 employees) eleven to twelve additional
staff assist, and for largest firms the average is 30 with some using several hundred staff to
support recruiting. Manufacturing, Retail and Financial Services tended to report higher
number of non-human resource staff involved in recruiting.
Benchmark 4: Number of colleges and universities represented among your full-time hires
Mean 10 Median: 5
Small organizations (less than 500 employees) report 4 to 7 schools represented among full-
time hires. Mid-size organizations (500 to 3,999) indicated 13 to 14 and large organizations
(over 4,000 employees) indicated 32 on average. Very little difference found across industrial
sector though Education Services and Health Services reported higher number of schools
represented among their full-time hires.
Benchmark 5: Number of colleges and universities considered core (regularly visit, support)
Mean: 5 Median: 3
Recruiting Trends Report: 2019-2020
©2019 Collegiate Employment Research Institute, Michigan State University 31
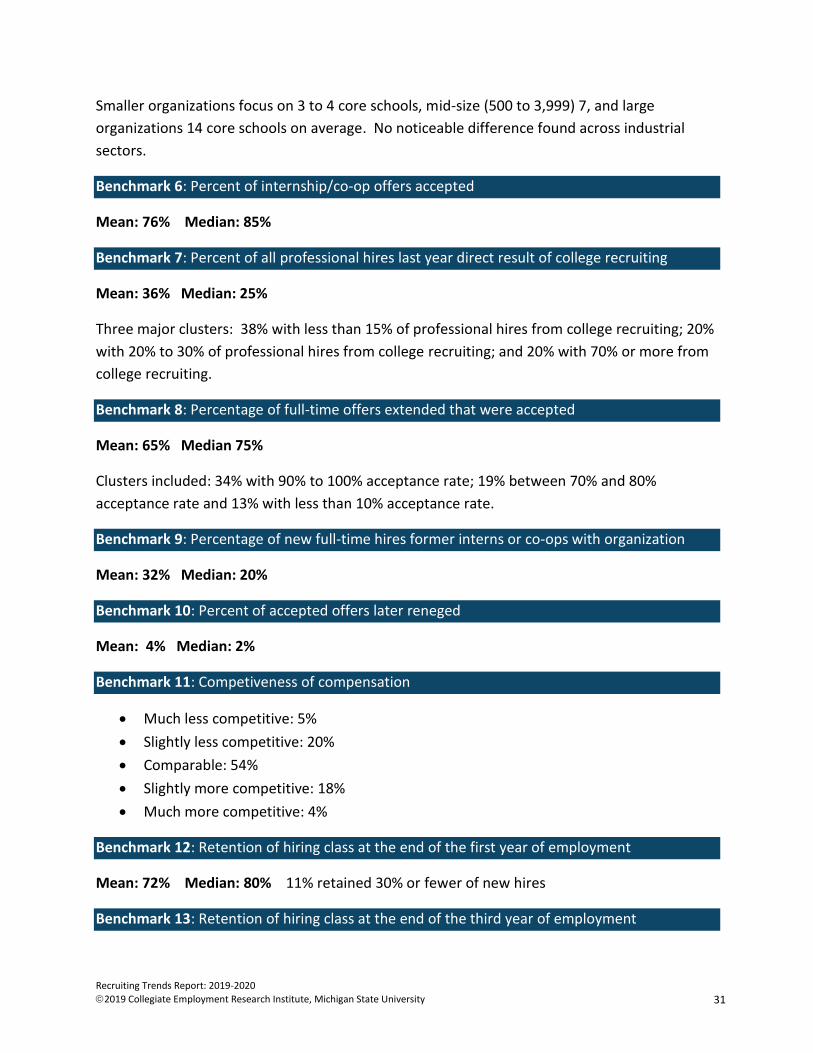
Smaller organizations focus on 3 to 4 core schools, mid-size (500 to 3,999) 7, and large
organizations 14 core schools on average. No noticeable difference found across industrial
sectors.
Benchmark 6: Percent of internship/co-op offers accepted
Mean: 76% Median: 85%
Benchmark 7: Percent of all professional hires last year direct result of college recruiting
Mean: 36% Median: 25%
Three major clusters: 38% with less than 15% of professional hires from college recruiting; 20%
with 20% to 30% of professional hires from college recruiting; and 20% with 70% or more from
college recruiting.
Benchmark 8: Percentage of full-time offers extended that were accepted
Mean: 65% Median 75%
Clusters included: 34% with 90% to 100% acceptance rate; 19% between 70% and 80%
acceptance rate and 13% with less than 10% acceptance rate.
Benchmark 9: Percentage of new full-time hires former interns or co-ops with organization
Mean: 32% Median: 20%
Benchmark 10: Percent of accepted offers later reneged
Mean: 4% Median: 2%
Benchmark 11: Competiveness of compensation
• Much less competitive: 5%
• Slightly less competitive: 20%
• Comparable: 54%
• Slightly more competitive: 18%
• Much more competitive: 4%
Benchmark 12: Retention of hiring class at the end of the first year of employment
Mean: 72% Median: 80% 11% retained 30% or fewer of new hires
Benchmark 13: Retention of hiring class at the end of the third year of employment
Recruiting Trends Report: 2019-2020
©2019 Collegiate Employment Research Institute, Michigan State University 32
Mean: 59% Median: 61% 12% retained 20% or fewer at the third year; 12% retained 30% to
40% at the end of the third year; and 46% retained 70% or more of their hires at three years.
Benchmark 14: Retention of former interns/co-ops at the end of the third year of employment
Mean: 59% Median: 70% 51% retained 70% or more of their interns/co-ops at the end of
three years; 12% retained 20% to 40% of former interns/co-ops at three years; 15% retained
10% or fewer of their interns at the end of three years.