recruitment of baltic cod and sprat stocks: identification of
TRANSCRIPT

CRITICAL EARLY LIFE STAGES AND RECRUITMENT IN COD AND SPRAT 129
INTRODUCTION
General approach and stock development
The present consensus in fisheries research isthat the success of a year class is determined pri-marily by a series of density independent stochastic
processes acting on the egg, larval and early juvenilestages. These processes, such as co-occurrence withsub-optimal habitats, overlap with predators, reducethe abundance surviving to the juvenile stage. Afterthis period of high mortality, subsequent survivalsuccess and recruitment to the fishery is primarilythe result of density dependent processes such ascompetition for optimal habitat and cannibalism(e.g. Myers and Cadigan, 1993; Leggett and
SCI. MAR., 67 (Suppl. 1): 129-154 SCIENTIA MARINA 2003
FISH STOCK ASSESSMENTS AND PREDICTIONS: INTEGRATING RELEVANT KNOWLEDGE.Ø. ULLTANG and G. BLOM (eds.)
Recruitment of Baltic cod and sprat stocks: identification of critical life stages and
incorporation of environmental variability into stock-recruitment relationships*
FRIEDRICH W. KÖSTER1, 2, HANS-HARALD HINRICHSEN1, DIETRICH SCHNACK1,MIKE A. ST. JOHN3, BRIAN R. MACKENZIE2, JONNA TOMKIEWICZ1, 2,
CHRISTIAN MÖLLMANN1, GERD KRAUS1, MARIS PLIKSHS4, ANDREJ MAKARCHOUK4 and EERO ARO5
1 Institute of Marine Sciences, Düsternbrooker Weg 20, 24105 Kiel, Germany. E-mail: [email protected] Danish Institute for Fisheries Research, Charlottenlund Castle, 2920 Charlottenlund, Denmark.
3 Institute of Hydrobiologie and Fisheries Science, Olbersweg 24, 22767 Hamburg, Germany.4 Latvian Fisheries Research Institute, Daugavgrivas Street 8, 1007 Riga, Latvia.
5 Finnish Game and Fisheries Research Institute, P.O. Box 33. 00931 Helsinki, Finland.
SUMMARY: The recruitment processes of Baltic cod and sprat were analysed and critical periods were identified byaddressing the major impact factors on individual early life history stages separately and relating observed abundance databetween successive stages. For cod, recruitment appeared to be dependent on egg survival, with low oxygen concentrationin dwelling depths and predation by clupeids as the major causes for egg mortality. Surviving egg production and larvalabundance were weakly correlated, whereas larval abundance was significantly related to year class strength. This indicat-ed that the period between the late egg and the early larval stage is critical for cod recruitment. A potential variable identi-fied to affect this life stage was prey availability for larvae. For sprat, early and late egg stage production as well as late eggstage production and larval abundance were significantly related. However, year class strength was largely independent oflarval abundance. Thus, the period between the late larval and early juvenile stage appeared to be critical for sprat recruit-ment. Potential variables identified to affect this life stage were ambient temperature and wind stress. Environmental fac-tors showing statistically significant covariance with the survival of one of these critical life stages were incorporated intostock-recruitment models for individual spawning areas separately and for the Central Baltic combined.
Key words: cod, sprat, Baltic, critical life stage, environment, stock-recruitment relationship.
*Received December 6, 2000. Accepted April 9, 2002.

Deblois, 1994; Heath and Gallego, 1997). Superim-posed on these external conditions, parental contri-butions to the quality (e.g. Trippel et al., 1997;Marteinsdottir and Steinarrson, 1998), quantity(Trippel, 1998; Lambert and Dutil, 2000) and spa-tio-temporal distribution of reproductive products(e.g. Hutchings and Myers, 1993; Begg andMarteinsdottir, 2000) affect the susceptibility ofindividuals to environmental conditions and deter-mine the environmental conditions offspring areexposed to (St. John et al., 2000; Vallin andNissling, 2000). In the present study we examine thereproductive success in two fish species, cod andsprat, characterised by differing life history strate-gies in a biologically simple but hydrographicallycomplex system, the Central Baltic Sea. The analy-ses follows the success of a year-class duringontogeny from spawner abundance through the eggand larval to the juvenile stage according to Paulik’s(1973) framework, thus considering various endoge-nous and external processes affecting reproductivesuccess.
During the last two decades, a shift has occurredin the upper trophic level of the Central Baltic SeaEcosystem, leading from a cod-dominated to asprat-dominated system. The cod stock declined,due to recruitment failure and high fishing intensity(Bagge et al., 1994). The corresponding decrease inpredation pressure on sprat, combined with low fish-ing mortality and high reproductive success for thisspecies, resulted in a pronounced increase of thesprat stock (Parmanne et al., 1994). Apart frombeing the major prey species of cod in pre-spawningand spawning periods (Bagge et al., 1994), sprat hasbeen identified as an important predator on cod eggs(Köster and Schnack, 1994). This type of biologicalinteraction may stabilise the dominance of eithercod or sprat in the system (Rudstam et al., 1994). Adestabilisation of the system or shift in the speciesdominance may be caused by unfavourable hydro-graphic conditions for reproduction and subsequentrecruitment failure of one of the species, and/or by ahigh species selective fishing mortality (Schnack,1997). Cod and sprat utilise the same deep Balticbasins as spawning areas (Fig. 1), though spratspawning is more distributed and less restricted tothe deep parts of the basins. Also, the spawningtimes are largely overlapping (Bagge et al., 1994;Parmanne et al., 1994). Nevertheless, there is a pro-nounced difference in reproductive success of thetwo species, indicating a difference in the environ-mental requirements.
In the past 10-15 years a substantial effort hasbeen made to examine the major processes assumedto affect the recruitment success of Eastern Balticcod (Bagge and Thurow,1994; MacKenzie et al.,1996). The most recent activities are addressing alsosprat, in order to adequately consider the stronginteractions evidenced between the two species(Köster and Möllmann, 2000a; Köster et al., 2001a).As a result, several new data series of potential rele-vance for these processes have become available.We utilised this material to address the questionwhether standard assessment procedures provideestimates of spawning stock biomass, which can beused as a reliable measure of egg production. Thishas recently been questioned for a number of fishstocks (MacKenzie et al., 1998; Marshall et al.,1998; Marteinsdottir and Thorarinsson, 1998). Thepresent paper presents results for Baltic cod andsprat, and summarises the information available orrequired to improve the stock-recruitment relation-ships for these two populations. Additionally, inorder to disentangle processes acting on early pelag-ic and later demersal juveniles (Ulltang, 1996), thefeasibility of estimating recruitment success beforejuveniles recruit to the fisheries was tested by com-paring estimates derived from Multispecies VirtualPopulation Analysis (MSVPA) with abundanceindices from research surveys.
The second task follows Paulik’s (1973)approach, examining the entire life history processfor critical periods and relationships between suc-cessive life stages (Rothschild, 1986). To ourknowledge, only a few attempts have been made tofollow this approach (e.g. Pacific salmon: Larkinand Hourston, 1964; walleye pollock in ShelikofStrait: Kendall et al., 1996; North Sea plaice: Bever-ton and Iles, 1992). A large amount of multi-disci-plinary information is required and in almost allcases, including the Baltic, the major problems arelack of time series data on key processes and thevariety and complexity of processes involved.
The third task aims at incorporation of environ-mental processes and species interaction into stock-recruitment relationships, as suggested by Sparholt(1996) and Jarre-Teichmann et al. (2000) for Balticcod and by Grauman and Yula (1989) for sprat.Based on exploratory statistical analysis, variableswere identified which showed significant covariancewith survival rates during critical life stages. Thesevariables were incorporated as impact factors intostock-recruitment models, which were establishedfirst for individual ICES Sub-divisions (i.e. spawn-
130 F.W. KÖSTER et al.

ing areas, Fig. 1), characterised by distinct hydro-graphic regimes (Plikshs et al., 1993; MacKenzie etal., 2000) and differences in recruitment success andstock development (Ojaveer, 1989; Sparholt andTomkiewicz, 2000). These area-specific modelswere then combined for the entire Central Baltic.
The Sub-division specific stock-recruitment rela-tionships were established on the basis of area dis-aggregated Multispecies Virtual Population Analy-sis (Köster et al., 2001a). For cod, a first approachwas presented by Köster et al. (2001b), in whichmechanisms leading to area specific differenceswere identified. The present approach is an exten-sion of the previous one, addressing the above men-tioned aspects and extending the exploratory analy-sis to data on mesozooplankton abundance as a mea-sure of prey availability for the larvae. For sprat, thepresent analysis is a new approach to explain differ-ences among areas and establish environmentallysensitive recruitment models, specifically testinghypotheses on the significance of environmental fac-tors suggested earlier (e.g. Grauman and Yula, 1989;Kalejs and Ojaveer, 1989; Raid, 1989).
Environmental factors considered to be criticalfor year class success
Due to low salinity in upper water layers of theCentral Baltic, cod eggs do not float in surfacewaters, but concentrate in a narrow depth rangewithin and below the permanent halocline (Wielandand Jarre-Teichmann, 1997). At this depth the eggs
are frequently exposed to low oxygen concentration,and survival is largely reduced in these situations(Nissling, 1994; Wieland et al., 1994). Plikshs et al.(1993) defined a “reproductive volume” (RV) as anindex for potential egg survival, i.e. the volume ofwater fulfilling minimum requirements for success-ful egg development. However, as this index doesnot consider the actual oxygen conditions inside thereproductive volume and the possibility that eggsmay float outside the RV, two modifications of thisindex were employed in the present study.
Sprat eggs have on average a higher buoyancythan cod eggs (e.g. Wieland and Zuzarte, 1991) andby floating in higher ranges of the water columnthey are less affected by oxygen depletion in thedeep water. However, they are sensitive to low tem-peratures (e.g. Thompson et al., 1981) and may beaffected when floating in the cold water layerbetween the thermo- and the halocline formed in theCentral Baltic during winter (Krenkel, 1981; Herra,1988). Additionally, there is evidence that spawningactivity and individual fecundity are affected byunfavourable temperature conditions in pre-spawn-ing periods (Elwertowski, 1960; Petrowa, 1960).According to Grauman (1965), sprat egg survival insummer depends also on the wind conditions, withhigh wind stress resulting in a high mortality of eggsdistributed during these months in upper water lay-ers. Wind conditions also impact encounter rates oflarvae and their prey as well as feeding success.
Jarre-Teichmann et al. (2000) demonstrated thatthe cumulative wind energy at peak spawning time
CRITICAL EARLY LIFE STAGES AND RECRUITMENT IN COD AND SPRAT 131
FIG. 1. – Major spawning areas of cod and sprat in the Central Baltic (BB: Bornholm Basin; GD: Gdansk Deep; GB: Gotland Basin; numbers: ICES Sub-divisions).
affects cod recruitment. The suggested process is atransport of larvae and pelagic juveniles to coastalnursery habitats during periods of high wind stressand a retention in the central basins during periodsof low wind stress of variable wind direction (Hin-richsen et al., 2001). Köster et al. (2001b) incorpo-rated these transport processes in their exploratoryanalysis on cod recruitment processes by modifyingthe wind energy index to consider explicitly thedirection of transport (larval transport index).
For sprat larvae preliminary hydrodynamic mod-elling approaches demonstrated the sensitivity ofresults from ichthyoplankton surveys to high windstress, which may lead to a rapid advection of larvaeout of the survey area (STORE, 2001). This rapidtransport is caused by a concentration of sprat larvaein the upper-most water layers after successful com-pletion of their initial vertical migration from thehatching depth. Grauman (1976) also described alarge-scale wind-driven transport of sprat larvaefrom Sub-division 25 to 26 and 28 (Fig. 1).
Consumption of cod eggs by sprat has a signifi-cant impact on cod egg survival in the BornholmBasin in spring and early summer, while later in thespawning season herring replaces sprat as a princi-pal predator of cod eggs (Köster and Möllmann,2000a). Similarly, egg cannibalism by sprat in theBornholm Basin is a potential compensatory processlimiting the reproductive success of the sprat stock(Köster and Möllmann, 2000b). Predation on codeggs by sprat decreased throughout the 1990s whilethe importance of herring predation increased, dueto a delay in spawning of cod (Wieland et al., 2000).Apart from intra- and inter-annual trends, there isalso a spatial variation apparent in the intensity ofegg predation which is considerably lower in theGdansk Deep and Gotland Basin than in the Born-holm Basin. Existing data on sprat and herring dietcomposition suggest that the ratio of cod eggs in thestomachs and in the food supply is linearly related tothe degree of overlap in their vertical distribution.The oxygen concentration in the bottom water lim-its the vertical distribution of clupeids during thedaylight-feeding period, while the density regimedetermines the vertical distribution of cod eggs(Köster and Möllmann, 2000a). This observation ledto the development of an index of vertical preda-tor/prey overlap and enabled the prediction of a rel-ative egg consumption index by the predator popu-lations (Köster et al., 2001b).
A substantial predation by adult herring on youngof the year sprat was reported by Patokina and Feld-
man (1998) in Sub-division 26 in autumn 1997. Thispredation has been related to the outstanding highabundance of young of the year sprat in the area andmight be supported by a small average size of spratdue to low growth rates (ICES, 1998).
Recent studies have demonstrated that thespecies composition in the mesozooplankton com-munity of the Central Baltic, and thus the availabili-ty of potential prey for larvae and early juveniles,have undergone substantial changes in the last twodecades. Pseudocalanus elongatus depends stronglyon high salinity (Ojaveer et al., 1998; Vuorinen etal., 1998) and on low temperature in summer (Möll-mann et al., 2000). Both factors developed in anunfavourable direction for this species and led to areduction of the standing stock throughout the stag-nation period of the 1980s. In contrast, the copepodsTemora longicornis and Acartia spp. as well ascladocerans show a strong preference for highertemperatures and an affinity for lower salinities inspring (Sidrevics, 1984, Möllmann et al., 2000), andthus developed increasing standing stocks through-out the late 1980s and early 1990s. It has beenhypothesised that the abundance of nauplii andcopepodid stages of T. longicornis and Acartia spp.is of importance for the survival of larval sprat(Grauman and Yula, 1989; Kalejs and Ojaveer,1989), while corresponding juvenile life stages of P.elongatus may be of importance for cod larvae.
MATERIAL AND METHODS
According to the availability of time-series data,the exploratory analysis for cod is mainly restrictedto Sub-division 25, comprising the Bornholm Basin(Fig. 1), currently the most important spawningground in the Central Baltic (MacKenzie et al.,2000; Köster et al., 2001b). For sprat the explorato-ry analysis was restricted to the eastern spawningareas in Sub-division 26 (Gdansk Deep) and Sub-division 28 (Gotland Basin) (Fig. 1).
Stock parameters
Stock size and spawning stock biomass
Stock abundances were obtained from spatiallydis-aggregated MSVPA runs for the period 1976-1996 (Köster et al., 2001a). Weight at age in thecatch was assumed to be equal to weight at age inthe stock, exceptions being age-groups 0 to 2 for
132 F.W. KÖSTER et al.

cod. Here, due to size selection by commercialgears, period specific (before 1989 and after 1990)average weights compiled by ICES (1999b) wereapplied in the different areas. Cod spawning stockbiomass values (SSB) were determined for the dif-ferent Sub-divisions by using area specific sex ratiosand maturity ogives (proportions of sexually matureindividuals at age) given by Tomkiewicz et al.(1997). In cases of adequate sampling, annual valueswere applied, i.e. for 1986 - 1996 in Sub-division 25and for 1993 - 1996 in Sub-division 26; otherwise 5year averages were used (Tomkiewicz et al., 1997).To demonstrate the effect of introducing year andsex specific maturity ogives on SSB estimates as ameasure of egg production, two additional optionswere tested: i) average maturity ogives utilised informer standard stock assessment (ICES, 1996),being invariate over time and ii) temporally and spa-tially resolved female SSB, based on abovedescribed information. For sprat, sex specific matu-rity ogives and sex ratios were available only for themost recent 5 years in Sub-division 26. This restrict-ed the analysis to a test on the deviation betweentotal and female SSB applying average sex specificmaturity ogives and sex ratios.
Abundance of recruits
Cod recruits to the fishery at an age of 2 andyear-class strength is difficult to assess at an earlierage due to cannibalism effects. Thus, regular singlespecies assessments of cod cover age 2 as theyoungest age-group and presentations of stock-recruitment relationships refer in general to age-group 2. In the present study, spatially dis-aggregat-ed MSVPA runs (Köster et al., 2001a) have beenutilised to estimate 0- and 1-group abundances, thusexplicitly considering cannibalism in the estimationprocedure. The cod 0-group estimate for 1996 wasomitted from further analysis, as it depended heavi-ly upon the tuning method employed. For sprat,standard stock assessment procedures estimaterecruitment at age 1 (ICES, 1999a), using predationmortalities derived from spatially aggregatedMSVPA runs (ICES, 1999b). In the present study, 0-group estimates from area dis-aggregated MSVPAruns have been utilised as a measure of reproductivesuccess, in order to dis-entangle the impact of pre-dation by cod on young of the year sprat from otherprocesses affecting recruitment.
Juvenile abundance estimates derived byMSVPA runs have been validated by area specific
survey indices. For cod age-groups 1 and 2, resultsfrom international bottom trawl surveys conductedsince the early 1980s have been applied as compiledby the EU-project CORE (1998). For sprat, esti-mates of 0- and 1-group abundances were recom-piled from international hydroacoustic surveys, per-formed since 1981, and corrected for variation inarea coverage (ICES, 1997). Results from the 1993hydroacoustic survey were excluded, due to techni-cal problems and lack of area coverage (ICES,1994). It should be noted, that data series for codage-groups 1 and 2 as well as sprat age-group 1were utilised for tuning of the MSVPA, thus notbeing strictly independent. However, the impact ismainly restricted to the later part of the time series,which makes these data valid for a comparison oftrends for the major part of the time series. A fur-ther validation of cod age 2 recruitment was per-formed using independent Latvian bottom trawlsurveys conducted in Sub-division 26 and 28 in Jan-uary and November/December. However, these sur-veys cover only a part of the time series, mainly the1980s. Independent recruitment estimates for spratwere available from the Polish young fish survey inSub-division 26 (ICES, 1999a) comprising a geo-metric mean abundance index, based on catch ratesof age-groups 0 and 1.
Potential egg production by the spawning stocks
The area-specific potential egg production hasbeen estimated for cod from female SSB per Sub-division, coupled with predicted relative individualfecundity values (Kraus et al., 2000). The relativefecundity is independent of body size and did notdiffer among areas though being variable amongyears. It was predicted as a common value for allSub-divisions from a statistical model whichincludes as impact factors: average ambient temper-ature in the 4th quarter of the year preceding theinvestigated spawning period and the anomaly ingrowth of average wet weight from the 3rd quarter ofthe preceding year to the 1st quarter of the year ofspawning (Kraus et al., 2000). As an alternativeapproach, a time series of observed relative individ-ual fecundity values was utilised (Shapiro, 1990;Bleil and Oeberst, 1996; Kraus et al., 2000), inwhich missing values were substituted by linearinterpolation.
For sprat, available information on batch fecun-dity and spawning frequency (Petrowa, 1960; Poli-vaiko, 1980; Alekseeva et al., 1997) hardly allows to
CRITICAL EARLY LIFE STAGES AND RECRUITMENT IN COD AND SPRAT 133

construct a reliable time series of potential egg pro-duction values. In this case, a proxy for the nutri-tional condition and the reproductive potential of thepopulation was obtained from the anomaly in aver-age growth rate over age-groups 2 to 4 from the 3rd
quarter of the preceding year to the 2nd quarter of theyear of spawning. In addition, the pre-spawningcondition of these fish was characterised by theanomaly in weight at age in the 1st quarter of theyear of spawning. Basin specific quarterly weight atage values of adult fish have been compiled for bothspecies by ICES (1999b), but a full analysis could beachieved for Sub-division 26 only.
Egg and larval abundance
Mean annual values for egg and larval abundancewere available for the different Sub-divisions (waterdepths > 60m) from ichthyoplankton surveys carriedout in 1976-1996. For cod, the data have been sum-marised by Köster et al. (2001b) and for sprat theywere compiled from Krenkel (1981), Grauman andKrenkel (1986), Karasiova (1999), Köster and Möll-mann (2000a). Abundance estimates for cod eggswere based on sampling during a three-month peri-od encompassing the main spawning season, aver-aging survey specific mean abundance values. Up to1989 the sampling period was April-June; thereafterit successively shifted to May-June (1990-1992) andJune-August (1993-1996), corresponding to theobserved shift in the cod spawning period in recentyears (Wieland et al., 2000).
Abundance estimates for sprat eggs refer to themain spawning period, May-June (ICES, 1976). Theperiods considered for larval abundance estimateswere the same as for eggs in the case of sprat, withfast egg development (Thompson et al., 1981), butwere shifted for cod to account for a 2 to 4 weekperiod of egg development (Wieland et al., 1994).
Realised egg production
Estimates of the average daily egg productionduring main spawning periods were based on stagespecific abundance data (see above) and temperaturerelated egg development rates (cod: Wieland et al.,1994; sprat: Thompson et al., 1981). For cod, therelevant temperatures were taken from the depth ofthe centre of mass of egg distribution and wereobtained either from direct observations, i.e. CTD-measurements taken concurrently to the verticallyresolving ichthyoplankton sampling in 1986-1996
(Wieland and Jarre-Teichmann, 1997), or from theICES hydrographic database and predicted centre ofmass values (Köster et al., 2001b).
The vertical distribution of sprat eggs has beenless intensively studied and appears to be morevariable (Müller, 1988; Wieland and Zuzarte,1991), with a typical deep distribution in springand early summer and a more surface-oriented dis-tribution in summer (Herra and Grimm, 1983;Herra, 1988). As the main spawning season forsprat was May/June it was assumed that the aver-age temperature in the 60-80 m depths layer wasmost relevant for estimating developmental peri-ods. Finally, stage specific daily egg productionrates were calculated by dividing the abundancevalues for individual egg stages by the develop-ment time of the respective stage.
Environmental factors
Oxygen concentration
The relevance of the oxygen condition for cod eggsurvival was tested by including the reproductive vol-ume (RV), defined by Plikshs et al. (1993), in theanalysis as an index of potential cod egg survival. RV-values for the different Sub-divisions and for peakspawning periods were derived from MacKenzie etal. (2000). As this index is based on minimum oxy-gen requirements only, two alternative indices weredefined and tested in addition for a more completeutilisation of the given information about ambientoxygen conditions in the Bornholm Basin. The firstone, the integrated oxygen content in the RV (ORV),is based on an integration of the mean oxygen con-centrations per 1 metre depth interval throughout thethickness of the RV (MacKenzie et al., 2000).
The second alternative, the oxygen related eggsurvival (OES) is based on the fraction of the eggproduction expected to survive each year when alaboratory established relation of egg survival isapplied to oxygen concentration (Rohlf, 1999),using observed oxygen profiles during spawningtime and depth stratified abundance data of codeggs. The depth distribution of eggs was predictedfrom the observed water density profiles (Köster etal., 2001b).
Temperature
The impact of temperature on survival of sprateggs and larvae was tested on the basis of average
134 F.W. KÖSTER et al.

water temperatures at main spawning time in Mayderived from the ICES hydrographic database. Forthe Bornholm Basin (Sub-division 25) and theGdansk Deep (Sub-division 26) a depth range of 40-60 m was considered, and for the Gotland Basin(Sub-division 28) a range of 40-80 m was consid-ered, corresponding to the deeper location of thepermanent halocline. Temperature conditions in theintermediate water and the upper halocline in Maywere chosen, as they comprise the water layer withlowest temperatures and are closely related to wintertemperature in the upper water column, thus repre-senting also an index for the severity of the wintercondition that potentially affects sprat condition,maturation and fecundity.
Wind
The impact of wind conditions on transport of codlarvae into suitable nursery areas or retention withinthe spawning areas has been examined by Köster etal. (2001b), who developed a larval transport index asa proxy for this effect. To test whether wind-inducedtransport affects the sprat larval abundance estimatesfrom ichthyoplankton surveys, a larval transportindex was developed corresponding to the onedescribed for cod (Köster et al., 2001b), but adjustedto the differences in vertical distribution and mainspawning season of the two species. A potentialimpact on sprat egg mortality and the effect of turbu-lence on feeding success of sprat larvae was testedusing the anomalies in weekly-averaged wind speedin May/June 1977-1994 recorded at Christiansø (10nm northeast of the main island of Bornholm).
Predation
Predation pressure on cod eggs was introducedinto the analysis as a relative egg predation index,expressing consumption per standing stock of eggsscaled to the potential egg production according toKöster et al. (2001b). Predation on sprat by herringduring the development from the larval to the 0-groupstage was tested in Sub-division 26 for size-depen-dent effects by relating mortality rates to weight atage anomalies of 0-group sprat during the 4th quarterof the year, using data compiled by ICES (1999b).
Prey availability
The relevance of long term changes in zooplank-ton species composition for larval and 0-group sur-
vival of cod and sprat was tested by utilising stage-specific data on abundance of major mesozooplank-ton species in Sub-division 26 and 28 during themain spawning periods, compiled by the LatvianFisheries Research Institute (LATFRI). For adescription of the sampling and analyses proceduressee Möllmann et al. (2000). Selection of an appro-priate prey spectrum according to prey species andstage was conducted on the basis of diet composi-tions described in Zuzarte et al. (1996). For cod, thetest was restricted to Sub-division 26, as the numberof years in which cod larvae were encountered inSub-division 28 was too low to conduct any statisti-cal analysis.
Construction and validation of stock-recruitment models
Our stock-recruitment relationships explicitlyconsider environmental and spatial heterogeneityincorporating causal relationships between survivalrates of different critical life stages, environmentalfactors and species interactions. For cod we testedexisting environmentally sensitive stock-recruit-ment relationships (Köster et al., 2001b) by pre-dicting year-class strength 1996-1999, which wasnot considered in the parameter estimation, andsubsequently comparing it to updated MSVPAresults and trawl survey derived recruitmentindices. Input data were: i) potential egg produc-tion by the spawning stock derived from updatedarea dis-aggregated MSVPA runs (ICES, 2001a),sex ratios and maturity ogives (ICES, 1998), andrelative fecundity values (STORE, 2001), ii) RVand ORV calculated from hydrographic datarecorded on ichthyoplankton surveys (STORE,2000), iii) predation on cod eggs estimated on thebasis of the vertical overlap index (Köster et al.,2001b) determined from the above hydrographicdata, egg abundance from ichthyoplankton surveysand predator abundance from updated MSVPAaccording to Köster and Möllmann (2000a), and iv)the updated larval transport index (STORE, 2001).A similar test was conducted for stock-recruitmentrelationships established for sprat utilising alsoarea disaggregated MSVPA output to determine theSSB (ICES, 2001a) and temperature conditions inthe intermediate water in May extracted from theICES hydrographic database. Predicted recruit-ment at age 0 was compared to MSVPA output andautumn hydroacoustic survey results (ICES, 1998,1999a, 2000).
CRITICAL EARLY LIFE STAGES AND RECRUITMENT IN COD AND SPRAT 135

RESULTS
Significance of linear stock-recruitment relationships
Linear regression analyses revealed significantrelationships between spawning stock biomass andrecruitment of cod and sprat as determined by thestandard stock assessment for the eastern and theentire Baltic respectively (Fig. 2). However, theexplained variance in recruitment at age 2 and 1 islow, with a significant intercept for cod and highoutlying recruitment values for both species. Fur-thermore, there is a clear time trend in the residualsfor cod with a high number of positive residuals atthe beginning of the time series up to 1981 and onlynegative residuals afterwards (Fig. 2). The stock-recruitment relationships derived by the area disag-gregated MSVPA runs show a corresponding patternfor cod with a significant linear relationship in Sub-
divisions 26 and 28, but not in Sub-division 25(Table 1). Again, high recruitment success originat-ed from intermediate SSB at the beginning of thetime series. Recruitment declined despite high SSBin the early 1980s. This pattern resulted in a signifi-cant auto-correlation in the residuals. For sprat a sig-nificant linear relationship was obtained only forSub-division 25 (Table 1), while in the other areasan outstanding high recruitment of the 1982 year-class originating from a low SSB did not coincidewith a linear relationship (Fig. 2).
Validation and improvement of stock-recruitment relationships
Spawning stock biomass as a measure of egg production
When using constant maturity ogives over time,the SSB calculated for cod in Sub-division 25 was
136 F.W. KÖSTER et al.
FIG. 2. – Linearity of stock-recruitment relationships of eastern Baltic cod (Sub-division 25-32) (a) and Baltic sprat (Sub-division 22-32) (c) and corresponding residuals (b and d), data source: standard stock assessment (ICES 1999a).

not linearly related to the daily egg production atpeak spawning time, but it was significantly relatedif based on yearly or periodically adapted maturityogives (Table 2). The relationship was furtherenhanced when only the female part of the SSB orthe predicted potential egg production were used.The largest deviations between potential andrealised egg production were apparent for the mostrecent years of the time series. Utilising observedinstead of predicted relative fecundity values, whichincluded a linear interpolation procedure for missingdata, also resulted in a significant relation to the
realised egg production, but with a slightly higherunexplained variance (r2 = 0.39, p = 0.001).
For sprat in Sub-divisions 26 and 28, the resultswere different: the SSB was significantly related tothe realised egg production even when it was basedon constant maturity ogives over time (Table 2).Utilising an age-specific sex ratio invariate withtime to compute the female SSB in Sub-division 26did not further enhance the relationship (r2 = 0.42, p= 0.003). Female and total SSB were closely related(r2 = 0.98), although the sex ratio was rather skewedto female dominance with increasing age.
CRITICAL EARLY LIFE STAGES AND RECRUITMENT IN COD AND SPRAT 137
TABLE 1. – Linear regressions of cod and sprat recruitment (in numbers) on SSB (in t) derived by area dis-aggregated MSVPA for differentSub-divisions (SSB in t): parameter estimates and their significance level, r2-values and Durbin Watson (DW) statistics indicating serial
correlation in the residuals if significant (* =significant at 5% level).
Dependent variableSub-division Time series Parameter Parameter estimates p r2 DW statistics
Cod age 2 25 1976-96slope 815.0 0.091
0.16 0.61*intercept 7.521*107 0.101
Cod age 2 26 1976-96slope 869.5 0.037
0.23 0.43*intercept 2.825*107 0.037
Cod age 2 28 1976-94slope 1097.1 0.003
0.41 0.49*intercept 3.612*106 0.810
Sprat age 1 25 1977-96slope 67645 0.003
0.43 1.44intercept 1.167*1010 0.043
Sprat age 1 26 1977-96slope 43017 0.198
0.10 1.93intercept 7.547*109 0.163
Sprat age 1 28 1977-96slope 29529 0.197
0.10 2.19intercept -4.309*109 0.197
TABLE 2. – Linear regressions of realised egg production of cod and sprat on different measures of potential egg production. Realised eggproduction = average production of stage I eggs (n*day-1) during the main spawning season derived from ichthyoplankton surveys. Measuresof potential egg production are based on alternative estimates for SSB (in t) and include fecundity information in one option. The table pre-sents parameter estimates and their significance levels, r2-values and Durbin Watson (DW) statistics indicating serial correlation in the
residuals if significant (* = significant at 5% level).
Independent variable Sub-division Time series Parameter Parameter estimates p r2 DW statistics
cod SSB based on maturity25
1976-96 slope 344.74 0.4880.03 0.63*ogive invariate with time without 1979-82 & 19841) intercept 4.6970*1010 <0.414
cod SSB based on yearly or25
1976-96 slope 1.256.9 0.0270.30 0.62*period specific maturity ogives without 1979-82& 19841) intercept -1.4979*1010 <0.734
female cod SSB25
1976-96 Slope 3315.5 <0.0010.61 1.04*without 1979-82& 19841) Intercept -8.2145*1010 0.048
predicted potential egg25
1976-96 Slope 4.6471**10-3 <0.0010.63 1.40production of cod without 1979-82& 19841) Intercept -7.1663*1010 0.054
sprat SSB26
1977-96 Slope 1.3710*10-4 0.0020.44 2.16without 19921) Intercept 12.334 0.201
sprat SSB28
1977-96 Slope 1.9014*10-4 0.0040.39 1.36without 19921) Intercept 5.9692 0.492
1) No reliable egg production rates from ichthyoplankton surveys available.

Abundance of recruits as a measure of reproductive success
Cod abundances at age 1 and 2, as calculated byMSVPA, were significantly related to abundanceindices from the international bottom trawl survey(BITS) in all areas with the highest variability inSub-division 25 (Table 3). In this area especially the1979 year-class showed a low abundance index asone-year-old in the 1980 survey, which did not coin-cide with a high recruitment estimated by theMSVPA. In Sub-divisions 26 and 28 survey datawere available only since 1981 and 1982 respective-ly. Thus, a validation of the MSVPA derived 1979year-class strength was not possible for age-group 1.However, as two-year-old the year-class was cov-ered by the 1981 survey in Sub-division 26, againindicating that the MSVPA resulted in a substantialoverestimation of the 1979 year class size. Indepen-dent abundance indices for age-group 2 from Lat-vian bottom trawl surveys, conducted in Sub-divi-sions 26 and 28 in the 1st and 4th quarter, alsorevealed a significant relationship with MSVPAresults, with the exception of the 1st quarter series inSub-division 26 (Table 3).
For sprat, MSVPA derived recruitment estimatesat age 0 were highly correlated to abundance esti-mates from international autumn hydroacoustic sur-veys in Sub-division 25, but not in the two other Sub-divisions (Table 4). Here outstanding high recruit-ment values were determined by MSVPA for the1982 year class, while hydroacoustic survey estimatesindicated a low year-class strength. Omitting this oneyear-class from the analysis resulted in significantrelationships for both areas (Table 4). Concerningrecruitment at age 1, the MSVPA estimated again anoutstanding strength for the 1982 year-class in Sub-divisions 26 and 28. Apart from this, all regressionswith survey indices were statistically significant(Table 4). A comparison with independent Polishyoung fish survey estimates in Sub-division 26revealed a significant correlation to MSVPA derivedestimates (Table 4), but with again considerable resid-ual variability and individual outstanding differencesfrom MSVPA estimates for the 1982 year class.
Identification of critical early life history stages
Regression analyses of daily production rates ofearly developmental stages on later stages during the
138 F.W. KÖSTER et al.
TABLE 3. – Linear regressions of MSVPA based cod recruitment at age 1 and 2 (in numbers) on survey based recruitment estimates for dif-ferent Sub-divisions (BITS: indices, Latvian survey: n*h-1). The table presents parameter estimates and their significance levels, r2-values and
Durbin Watson (DW) statistics indicating serial correlation in the residuals if significant (* = significant at 5% level).
Independent variable Sub-division year-class Parameter Parameter estimates p r2 DW statistics
age 1 BITS 25 1979-95Slope 6.2329*106 0.015
0.34 0.68*Intercept 1.4396*108 <0.001
age 1 BITS 26 1980-95Slope 3.2003*106 <0.001
0.73 1.12*Intercept 9.1831*107 <0.001
age 1 BITS 28 1981-95Slope 8.3191*106 <0.001
0.88 0.68*Intercept 98953 <0.001
age 2 BITS 25 1980-94Slope 2.0996*106 0.001
0.52 1.54Intercept 7.5276*107 0.002
age 2 BITS 26 1979-94Slope 1.2887*106 <0.001
0.64 1.82Intercept 5.6251*107 <0.001
age 2 BITS 28 1980-94Slope 234797 <0.001
0.79 1.31Intercept 1.3360*107 0.011
age 2 Latvian trawl26
1976-89 without Slope 47181 0.0300.30 0.68*survey 1st quarter 1978-79 & 841) Intercept 8.0621*107 0.080
age 2 Latvian trawl28
1976-90 without Slope 54798 <0.0010.74 1.15*survey 1st quarter 1978 & 891) Intercept 2.8730*107 0.008
age 2 Latvian trawl26
1976 & 1980-87 Slope 125256 0.0230.61 2.23survey 4th quarter without 19851) Intercept 6.5177*107 0.076
age 2 Latvian trawl28
1979-87 Slope 50352 0.0010.79 1.23survey 4th quarter Intercept 3.1662*107 0.005
1) No surveys performed.

egg to juvenile development (Table 5) indicated thatin Sub-division 25 cod recruitment at age 1 (derivedfrom MSVPA) was closely related to age 0 (r2 =0.98), and age 0 recruitment was significantly relat-ed to larval abundance (r2 = 0.64). Critical periodsappeared to be the late egg to larval stage (r2 = 0.13)and somewhat less the egg stage I to III (r2 = 0.26).The oldest egg stage IV was not considered as itsabundance is highly variable due to a relatively shortstage duration and the hatching process, which inBaltic cod commences during this stage (Wieland etal., 1994). The lowest egg survival rates were esti-mated for the first half of the 1980s (i.e. 1983 and1985), though this is a period in which the amountof missing data was greatest. Larval abundance peregg stage III production was lowest in the period1992 to 1996, indicating extremely low viable hatchor larval survival in these years.
For sprat, the relations between production esti-mates of early and late egg stages as well as betweenlate egg stage production and larval abundance werehighly significant for Sub-divisions 26 and 28. Thisindicates that mortality during the egg and early lar-val stage is less critical for the reproductive success
of sprat compared to cod (Table 5). In contrast tocod the 0-group abundance of sprat was hardly relat-ed to the larval abundance, even when the 1982year-class, which was most likely overestimated bythe MSVPA (Sub-division 26: r2 = 0.16, 28: r2 =0.08) was excluded from the analysis. But similar tocod, recruitment at age 0 and age 1 estimated byMSVPA were closely related.
Processes affecting critical early life historystages
Cod survival during the egg stage
The daily production of stage III cod eggs duringthe main spawning time divided by the total poten-tial egg production from SSB was used as the bestestimate of the actual egg survival rate in Sub-divi-sion 25. A statistically significant linear regressionof this “actual survival rate” on the oxygen relatedegg survival (OES) index was obtained (p = 0.005),and explained 44% of the variance encountered (Fig.3); however, pronounced negative residuals wereapparent for 1983 and 1985 and positive residuals in
CRITICAL EARLY LIFE STAGES AND RECRUITMENT IN COD AND SPRAT 139
TABLE 4. – Linear regressions of MSVPA based sprat recruitment at age 0 and 1 on survey based recruitment estimates (in numbers) for dif-ferent Sub-divisions. The table presents parameter estimates and their significance levels, r2-values and Durbin Watson (DW) statistics
indicating serial correlation in the residuals if significant (* = significant at 5% level).
Independent variable Sub-division year-class Parameter Parameter estimates p r2 DW statistics
age 0 international25 1981-96
slope 8.6295 <0.0010.80 2.06hydroacoustic survey intercept 2.6510*1010 <0.001
age 0 international26 1981-96
slope 0.7143 0.3490.07 2.04hydroacoustic survey intercept 2.8611*1010 0.011
age 0 international26
1981-96 slope 1.0505 0.0370.31 2.19hydroacoustic survey without 1982 intercept 1.9886*109 0.007
age 0 international28 1981-96
slope 0.8379 0.2930.08 1.92hydroacoustic survey intercept 1.3592*1010 0.005
age 0 international28
1981-96 slope 1.1563 0.0160.40 1.90hydroacoustic survey without 1982 intercept 9.9201*109 <0.001
age 1 international25 1981-95
slope 5.4102 <0.0010.68 1.38hydroacoustic survey intercept 2.1162*1010 <0.001
age 1 international26 1981-95
slope 1.3676 0.0120.42 2.42hydroacoustic survey intercept 1.1497*1010 0.146
age 1 international26
1981-95 slope 1.2488 0.0010.65 2.54hydroacoustic survey without 1982 intercept 9.1156*109 0.062
age 1 international28 1981-95
slope 0.2798 0.0020.35 2.12hydroacoustic survey intercept 9.8700*1010 0.024
age 1 international28
1981-95 slope 0.2925 <0.0010.79 1.91hydroacoustic survey without 1982 intercept 7.8830*109 <0.001
year-class index from28
1976-96 slope 3.0927*1010 0.0090.34 2.03polish young fish survey without 1995 intercept 1.2398*1010 0.141

1976, 1978 and 1994. Utilising the egg consumptionindex to explain variability in actual egg survivalrevealed a negative linear relationship explaining21% of the variance, but it was not statistically sig-nificant (p = 0.078). A high scatter in egg survivalwas obvious for low consumption indices with thehighest residuals in the outlying years identifiedabove (Fig. 3). When both processes were applied asimpact factors on the potential egg production, i.e.subtracting the consumed from the potential eggproduction and multiplying by the OES similar tothe procedure in Köster et al. (2001b), the observeddaily stage III egg production was significantlyrelated to this combined predictive index (r2 = 0.60,p < 0.001, Fig 3). The potential egg productionalone explained 30% of the variance in stage III codegg production. Again, difficulties in explaining thelow stage III egg production in 1983 were encoun-tered. Utilisation of the alternative time series ofpotential egg production based on actual fecunditymeasurements confirmed the significant impact ofoxygen conditions in deep water layers on egg sur-vival (r2 = 0.30, p = 0.027), but the impact of eggpredation (r2 = 0.16, p = 0.122) was less clear.Applying both processes as impact factors on thepotential egg production as above, but based onactually measured fecundity values instead of pre-
dicted ones, resulted in the same quality of linearrelationship to the observed egg production at stageIII (r2 = 0.61, p < 0.001).
Cod survival to larval stage
The potential egg production, based on predictedrelative fecundity values, was linearly related to lar-val abundance (Fig. 4a) only if the three most recentyears were removed from the regression analysis (r2
= 0.29, p = 0.022). Compared to the high potentialegg production in these years, the observed larvalabundance was much lower than expected. Utilisingthe averaged daily production of stage III eggsinstead of the potential egg production did improvethe above relationships somewhat, but again onlybeing significant if 1994 to 1996 were omitted fromthe analysis (r2 = 0.32, p = 0.043).
When the ratio of larval abundance to the pre-dicted potential egg production was used as a mea-sure of survival to the larval stage, no significant lin-ear relation of this survival to the OES index or tothe egg consumption index was obtained, regardlessof whether the most recent three years were consid-ered or not (r2 between 0.04 to 0.10). Using the ORVprovided a better but still insignificant relationship(r2 = 0.16, p = 0.073). Pronounced negative residu-
140 F.W. KÖSTER et al.
TABLE 5. – Linear regression of abundance or production estimates of individual life stages on the abundance or production of the succeeding life stage of cod and sprat. The table presents r2-values and significance levels.
Independent variable Dependent variable Sub-division Time series r2 p
cod
realised egg production (stage I) late egg production (stage III) 25 1976-96 without 0.26 0.0441979-82 & 19841)
late egg production (stage III) larval abundance 25 1976-96 without 0.13 0.1731979-82 & 19841)
larval abundance 0-group recruitment 25 1976-95 0.64 <0.001
0-group recruitment 1-group recruitment 25 1976-95 0.98 <0.001
sprat
realised egg production (stage I) late egg production (stage III) 26 1973-96 0.67 <0.001without 19921)
late egg production (stage III) larval abundance 26 1973-96 0.66 <0.001without 19921)
larval abundance 0-group recruitment 26 1977-96 0.01 0.617
0-group recruitment 1-group recruitment 26 1977-95 0.98 <0.001
realised egg production (stage I) late egg production (stage III) 28 1973-96 0.80 <0.001without 19921)
late egg production (stage III) larval abundance 28 1973-96 0.23 0.020without 19921)
larval abundance 0-group recruitment 28 1977-96 <0.01 0.824
0-group recruitment 1-group recruitment 28 1977-95 0.96 <0.001
1) No reliable egg production rates from ichthyoplankton surveys available.

als were apparent in 1992 and 1993 and high posi-tive residuals in 1980 and 1981 (Fig. 4b). Replacingthe potential egg production by the late egg stageproduction did not improve the relationships.
In order to test the impact of food availabilityfor first feeding cod larvae in combination withhydrographic conditions, i.e. oxygen content in thebottom water, Sub-division 26 was used as a testcase. The ratio of larval abundance to the potentialegg production (based on observed relative fecun-dity) was significantly related to nauplii abundancein May/June (r2 = 0.33, p = 0.020). However, since1988 larval abundance values were zero indepen-
CRITICAL EARLY LIFE STAGES AND RECRUITMENT IN COD AND SPRAT 141
FIG. 3. – Linear regressions of daily cod egg production at stage IIIin Sub-division 25 per unit of egg production by SSB (as a measureof egg survival) on oxygen related relative egg survival (a) and onan index of cod egg consumption (b); linear regression of daily eggproduction at stage III on potential egg production corrected for
oxygen related mortality and egg consumption (c).
FIG. 4. – Linear regressions of cod larval abundance on potentialegg production by SSB in Sub-division 25 (a), indicated data for1994-1996 removed; linear regression of larval abundance per unitof potential egg production by SSB on oxygen content in the
reproductive volume (ORV) (b).

dent of the prey availability, probably due tounfavourable hydrographic conditions. To considerthe impact of hydrography, the reproductive vol-ume in Sub-division 26 was incorporated into amultiple linear regression analysis. This exerciseresulted in 65% explained variance in the ratio oflarval abundance to the potential egg production(Fig. 5), with both independent variables being sig-nificant (p = 0.002 for the RV and p = 0.027 fornauplii abundance).
Sprat egg production
The relationships between realised egg produc-tion and sprat SSB described above did not explainmajor parts of the variance. Thus, we made anattempt to identify processes influencing the eggproduction of sprat. For Sub-division 26, the aver-age weight at age anomaly in pre-spawning timesand growth rate anomalies covering the period dur-ing autumn and winter months were tested as prox-ies for the nutritional condition of the adults. Addi-tionally, the impact of low temperatures in theintermediate water in May/June was tested. Theegg production was not significantly related to anyone of these factors alone. However, incorporatedinto a multiple regression, the SSB, the tempera-ture in the intermediate water and either growth orweight at age anomaly resulted in significant sta-tistical models (Fig. 6). A major proportion (63%)of the variation was explained by the followingcombination of variables: SSB (p = 0.003), tem-
perature (p = 0.021) and weight at age anomaly (p= 0.053). Also, 69% was explained by SSB (p <0.001), temperature (p = 0.013) and growth anom-aly (p = 0.018). The Durbin-Watson statistics didnot indicate serial correlation in residuals, and theintercepts in both statistical models were insignifi-cant. For Sub-division 28, weight at age prior to1985 was assumed to be invariate with time andconsequently corresponding tests could be con-ducted with a shorter time series only. No signifi-cant relations to temperature and condition proxieswere obtained in this case.
142 F.W. KÖSTER et al.
FIG. 6. – Realised egg production of sprat in Sub-division 26 fromichthyoplankton surveys versus predicted by a multiple linearregression model utilising spawning stock biomass, weight at ageanomaly in the 1st quarter (age-groups 2-4) and temperature in theintermediate water layer in May/June as independent variables (a);realised egg production by sprat in Sub-division 26 versus predict-ed by a multiple linear regression model using spawning stock bio-mass, growth anomaly (increase in weight at age 2-4 from 3rd to 2nd
quarter) and temperature in the intermediate water in May/June as independent variables (b).
FIG. 5. – Cod larval abundance per unit of potential egg productionby SSB in Sub-division 26 and predicted by a multiple linear regres-sion model utilising nauplii abundance and reproductive volume
during main spawning time as independent variables.

Sprat survival from the larval to the 0-group stage
The ratio of 0-group recruitment to larval abun-dance was used as a measure of survival to the juve-nile stage. This index appeared to be related neitherto temperature (intermediate water at spawning time)and oxygen (average oxygen concentration in andbelow the halocline) in a biologically sensitive waynor with prey availability for sprat larvae (Acartiaspp. nauplii and copepodids). In Sub-division 28, asignificant negative linear relationship was identifiedbetween this index and wind speed anomaly inMay/June (r2 = – 0.26), whereas in Sub-division 26(r2 < – 0.01) a high scatter in survival occurred atintermediate wind speed, suggesting rather a para-bolic than a linear function. In contrast, multiple lin-
ear regressions with late egg stage production valuesand wind speed anomalies in May/June as indepen-dent variables explained 73 and 46% of the variancein larval abundance in Sub-divisions 26 and 28,respectively (Fig. 7). Wind speed had a statisticallysignificant impact in both areas (Sub-division 26: p =0.011 and 28: p = 0.006). The larval transport indexdeveloped for Sub-division 25, on the other hand, didnot show a significant effect on larval abundance inSub-divisions 26 (p = 0.242) or 28 (p = 0.491). Thus,from the available data a significant impact of winddriven transport on larval abundance was not obvi-ous, but the wind speed obviously had an effect onsurvival from the late egg to the larval stage.
Stepwise multiple linear regression of year classstrength on larval abundance and the above-men-tioned physical variables revealed a significanteffect only for temperature in Sub-division 26 (lar-val abundance: p = 0.065, temperature: p = 0.028).The explained variance in 0-group recruitment wasrather limited (31%), with the observed recruitmentin 1994 being largely underestimated by the model(Fig. 8). Adding further prey availability of Acartiaspp. or Temora longicornis or all copepod juvenilelife stages in May/June or July/August as a variabledid not enhance the statistical model. Also, incorpo-ration of the weight anomaly of 0-group sprat didnot increase the explained variance.
In Sub-division 28, a multiple linear regressionwith larval abundance and temperature as indepen-
CRITICAL EARLY LIFE STAGES AND RECRUITMENT IN COD AND SPRAT 143
FIG. 7. – Larval abundance of sprat in Sub-division 26 from ichthy-oplankton surveys versus predicted by a multiple linear regressionmodel utilising daily egg production of stage III and wind-speed
anomaly in May/June as independent variables.
FIG. 8. – Sprat recruitment at age 0 in Sub-division 26 determinedby MSVPA versus predicted by a multiple linear regression modelutilising larval abundance and temperature in the intermediate water
in May/June as independent variables.
dent variables only explained a small part of thevariance in 0-group recruitment. Here the only sig-nificant physical variable was the larval transportindex, which together with the larval abundance
explained 26% of the recruitment variability (larvalabundance: p = 0.104, temperature: p = 0.032).However, recruitment was negatively related to thetransport index, suggesting lower recruitment in sit-
144 F.W. KÖSTER et al.
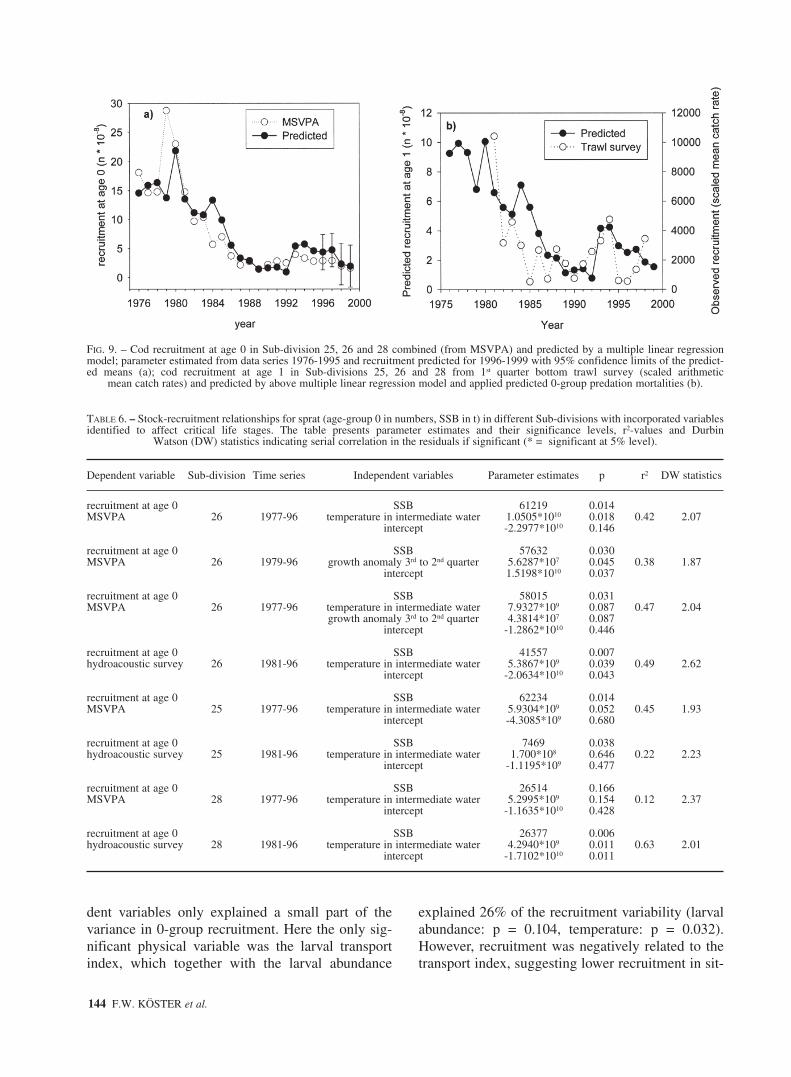
TABLE 6. – Stock-recruitment relationships for sprat (age-group 0 in numbers, SSB in t) in different Sub-divisions with incorporated variablesidentified to affect critical life stages. The table presents parameter estimates and their significance levels, r2-values and Durbin
Watson (DW) statistics indicating serial correlation in the residuals if significant (* = significant at 5% level).
Dependent variable Sub-division Time series Independent variables Parameter estimates p r2 DW statistics
recruitment at age 0 SSB 61219 0.014MSVPA 26 1977-96 temperature in intermediate water 1.0505*1010 0.018 0.42 2.07
intercept -2.2977*1010 0.146
recruitment at age 0 SSB 57632 0.030MSVPA 26 1979-96 growth anomaly 3rd to 2nd quarter 5.6287*107 0.045 0.38 1.87
intercept 1.5198*1010 0.037
recruitment at age 0 SSB 58015 0.031MSVPA 26 1977-96 temperature in intermediate water 7.9327*109 0.087 0.47 2.04
growth anomaly 3rd to 2nd quarter 4.3814*107 0.087intercept -1.2862*1010 0.446
recruitment at age 0 SSB 41557 0.007hydroacoustic survey 26 1981-96 temperature in intermediate water 5.3867*109 0.039 0.49 2.62
intercept -2.0634*1010 0.043
recruitment at age 0 SSB 62234 0.014MSVPA 25 1977-96 temperature in intermediate water 5.9304*109 0.052 0.45 1.93
intercept -4.3085*109 0.680
recruitment at age 0 SSB 7469 0.038hydroacoustic survey 25 1981-96 temperature in intermediate water 1.700*108 0.646 0.22 2.23
intercept -1.1195*109 0.477
recruitment at age 0 SSB 26514 0.166MSVPA 28 1977-96 temperature in intermediate water 5.2995*109 0.154 0.12 2.37
intercept -1.1635*1010 0.428
recruitment at age 0 SSB 26377 0.006hydroacoustic survey 28 1981-96 temperature in intermediate water 4.2940*109 0.011 0.63 2.01
intercept -1.7102*1010 0.011
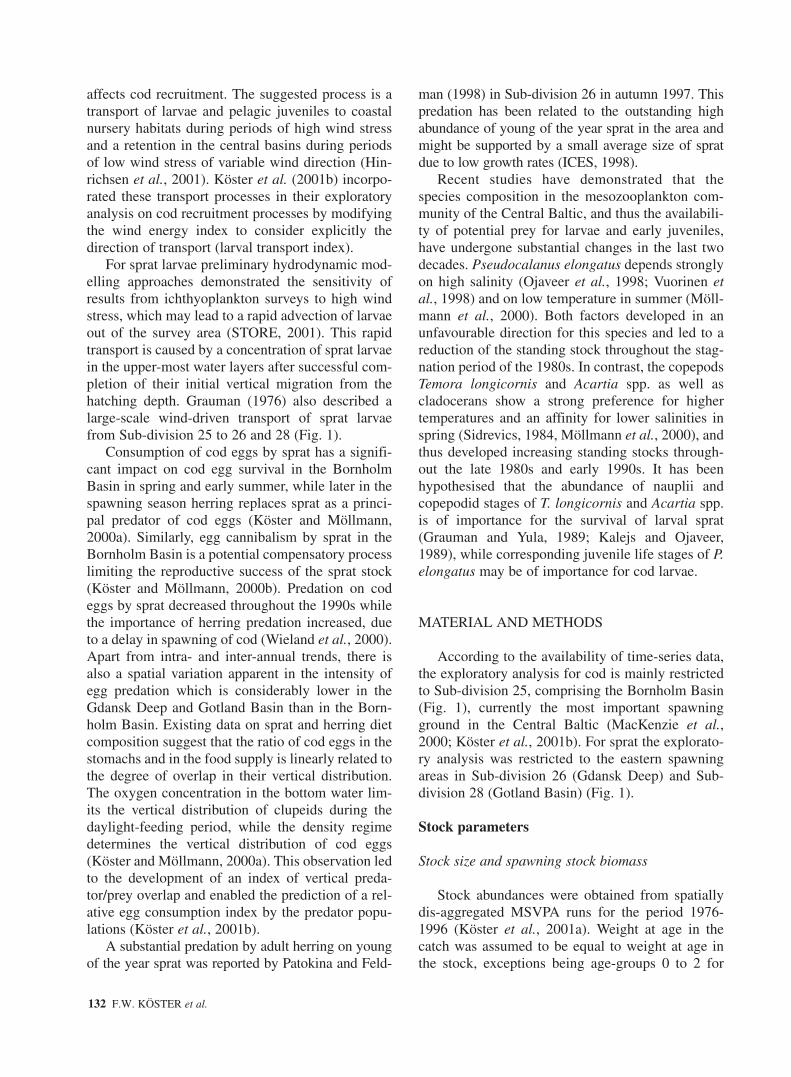
FIG. 9. – Cod recruitment at age 0 in Sub-division 25, 26 and 28 combined (from MSVPA) and predicted by a multiple linear regressionmodel; parameter estimated from data series 1976-1995 and recruitment predicted for 1996-1999 with 95% confidence limits of the predict-ed means (a); cod recruitment at age 1 in Sub-divisions 25, 26 and 28 from 1st quarter bottom trawl survey (scaled arithmetic
mean catch rates) and predicted by above multiple linear regression model and applied predicted 0-group predation mortalities (b).

uations of transport from Sub-division 25 to easternbasins, which appeared to be biologically not sensi-ble. If recruitment from the hydroacoustic surveywas utilised in the above multiple regression analy-ses instead of MSVPA derived estimates, the windspeed anomaly and the transport index wereinsignificant while the temperature in the intermedi-ate water became significant; the model explained,however, only 27% of the variance in 0-group abun-dance (larval abundance: p = 0.274, temperature: p= 0.041). Regardless of the method for estimating 0-group recruitment, prey availability or weight anom-alies did not explain a significant part of the variancein sprat recruitment in Sub-division 28.
Environmentally sensitive stock-recruitmentrelationships
The conducted exploratory analysis on process-es affecting critical early life stages of cod con-firmed the results of an earlier analysis (Köster etal., 2001b), and additionally revealed new evidencethat food availability affects cod larval survival,which was shown only for one Sub-division due tothe lack of suitable data. On this basis, a revision ofthe multiple regression based cod stock-recruit-ment model established by Köster et al. (2001b)was not indicated. However, we performed a test ofthe models developed for the different Sub-divi-sions which included the potential egg productioncorrected for egg predation, the ORV and the larvaltransport index for Sub-division 25, while relative-ly simple models for both other Sub-divisionsincluded the potential egg production and the RV.Based on these area specific models, we predictedcod recruitment for the period 1996-1999 and com-pared the prediction for the entire Central Balticwith 0-group abundance data from updatedMSVPA runs (ICES, 2001a) and 1-group abun-dance indices from the international bottom trawlsurvey (STORE, 2000). MSVPA derived and pre-dicted recruitment were in good agreement (Fig.9a), both indicating a decline in the reproductivesuccess in most recent years. The comparison withthe survey index showed considerably more vari-ability (Fig. 9b), with a similar declining trend atthe beginning of the time series, low year-classstrength at the end of the 1980s and beginning ofthe 1990s followed by an increase up to year-class1994. However, in most recent years, there was anopposite trend in the observed and predictedrecruitment.
For sprat, the multiple regression analysisrevealed that the spawning stock biomass had a sig-nificant effect on 0-group recruitment in almost allareas and combinations of variables. Consideringeither growth anomaly (p = 0.045) or temperature(p = 0.018) in addition led to 38% or 42%explained variance in Sub-division 26 respectively,when recruitment estimates were based onMSVPA; both variables added in combinationresulted in 47% explained variance (Table 6).When utilising recruitment estimates from hydroa-coustic surveys, the combination of spawning stockand temperature as independent variablesexplained 49% of the variance with the temperatureeffect (p = 0.039). In Sub-division 25, temperaturewas the only variable improving stock-recruitmentrelationships (p = 0.051), but the effect wasinsignificant when recruitment estimates werederived from hydroacoustic surveys (p = 0.646). InSub-division 28, the opposite occurred: the temper-ature effect was statistically significant in ahydroacoustic based stock recruitment relationship(p = 0.011) but not in the MSVPA-based relation-ship (p = 0.154). Other variables, such as windspeed or growth anomaly were insignificant in anyother variable/area combination, regardless ofwhether recruitment from MSVPA or hydroa-coustic survey was utilised.
The best recruitment predictions are presented inFigure 10 for Sub-divisions separately and in Fig-ure 11 for the entire Central Baltic. They are basedon multiple regression models including SSB andtemperature as independent variables in all threeareas, and growth anomalies in addition for Sub-division 26. These statistical models were able topredict the general trends in recruitment successfairly well (Fig. 10), but failed to mirror the largefluctuation in the observed recruitment values inmost recent years, with a considerable overestima-tion of recruitment in 1996 and a significant under-estimation in 1994 when compared to MSVPA esti-mates. This was also obvious for the area aggregat-ed model output (Fig. 11a). Similarly the modelpredicted recruitment too low in 1997 and too highin 1998, both MSVPA derived recruitment esti-mates being outside the 95% confidence limit of thepredicted means. Comparing the model with inde-pendent recruitment estimates from hydroacousticsurveys showed agreement in both time trends (Fig.11b), but with substantially lower recruitmentindices from the survey in 1990 and again in 1996and 1998, but not in 1994.
CRITICAL EARLY LIFE STAGES AND RECRUITMENT IN COD AND SPRAT 145

146 F.W. KÖSTER et al.
FIG. 10. – Sprat recruitment at age 0 determined by MSVPA and predicted by a multiple linear regression model utilising SSB and tempera-ture in the intermediate water as independent variables for Sub-division 25 (a); sprat recruitment as above adding growth anomaly (availablesince 1979) as further independent variable for Sub-division 26 (b); sprat recruitment predicted as in Sub-division 25 for Sub-division 28 (c);including time trends of observed (dotted lines and open circles) and predicted values (solid lines and circles) for all three statistical models
(right panels).

DISCUSSION
The present study investigated whether aprocess-oriented approach based on the resultsof extensive field, laboratory and modellingstudies can be used to develop environmentallysensitive stock-recruitment models, and tried toidentify what information might be lacking tomake such models as reliable as possible. Ourapproach attempts to follow the success of ayear-class during ontogeny from spawner abun-dance through the egg and larval to the juvenilestage according to Paulik’s (1973) framework forexamining the entire life history process, a con-cept broadly accepted but not really implement-ed yet (Rothschild, 2000). Investigation of thelink between environmental factors, spawningstock features and reproductive success of Balticcod (e.g. Plikshs et al., 1993; Sparholt, 1996;Jarre-Teichmann et al., 2000) and to a lesserextent also sprat (Grauman and Yula, 1989),have previously been performed by severalinvestigators. However, these studies did notconsider the problems inherent in the estimatesof egg production based on spawning stock bio-mass and in the recruitment estimates. Also, theydid not attempt to identify specific critical peri-ods within the recruitment process, and apartfrom Plikshs et al. (1993) did not consider spa-tial heterogeneity within the Central Baltic. Theearlier findings were utilised in the present studyto generate the working hypotheses for theprocess oriented work (for an overview seeSchnack and Köster, 1998).
Validation and improvement of stock-recruit-ment relationships
The comparison of cod SSB and realised eggproduction clearly demonstrated that spawningstock biomass is no reliable measure of realised eggproduction, even if yearly or periodically updatedmaturity ogives are used. It turned out that thefemale SSB and the predicted potential egg produc-tion determined on the basis of the female spawningstock and relative fecundity estimates provide sig-nificantly better measures of the realised egg pro-duction. They explain 61 and 63% of the variance indaily production of the youngest egg stage duringpeak spawning time. The largest deviations betweenpotential and realised egg production, apparent inthe most recent year 1996, can be explained by anoverestimation of the adult stock size by theMSVPA for Sub-division 25 due to tuning problems(Köster et al., 2001a). Apart from methodologicalproblems, the remaining variability may be relatedto atresia due to unfavourable environmental condi-tions during spawning (Kjesbu et al., 1991), vari-able fertilisation success in relation to salinitychanges (Westin and Nissling, 1991) and variationin egg mortality already during the first develop-mental stage.
For sprat, however, the total spawning stock bio-mass appeared to be a better measure of realisedegg production, indicating that inter-annual vari-ability in maturation processes, age-dependent sexratios and individual fecundity are of less impor-tance. Although the sex ratio becomes increasinglyskewed to female dominance with increasing age in
CRITICAL EARLY LIFE STAGES AND RECRUITMENT IN COD AND SPRAT 147
FIG. 11. – Sprat recruitment at age 0 in Sub-divisions 25, 26 and 28 combined, predicted by multiple linear regression models established for separate Sub-divisions and observed recruitment from MSVPA (a) and from autumn hydroacoustic surveys (b).
sprat (ICES, 2001b), similar to cod (e.g.Tomkiewicz et al., 1997), the observed variabilityin age-structure of the spawning stock had no majorimpact on the proportion of females in the stock asthe generally dominating age-groups 2 and 3 haverather balanced sex ratios. Variation in sexual matu-rity of age-group 1 (ICES, 2001b) in combinationwith high fluctuations in the abundance of this age-group (Köster et al., 2001a) will, however, result indeviations in SSB estimates derived from yearlymaturity ogives as compared to constant standardassessment ogives for individual years. It has beenshown that the relationship between SSB and poten-tial egg production of sprat can be improved sub-stantially by incorporating ambient temperature inthe intermediate water during spawning time andgrowth anomaly from the 3rd to the 2nd quarter in amultiple linear regression. The effect of tempera-ture on realised egg production may be due to sev-eral reasons: i) low winter temperatures may affectthe nutritional condition and growth of sprat (posi-tive relationships between May/June temperatureand the growth/nutrition proxies are indicated, butare not statistically significant), ii) low temperaturein pre-spawning periods may reduce the batchfecundity as well as the batch number (Petrowa,1960), and thus the total seasonal egg production,and iii) low temperatures before and during thespawning season may cause a delay in the onset andthe peak of spawning activity (e.g. Elwertowski,1960; Grimm and Herra, 1984). This effect has notbeen corrected for in the present time series of eggproduction. The largest deviations between SSB asa measure of egg production and realised egg pro-duction occurred in 1996. In this year, specificallylow winter temperatures at the surface (0-50 m)were not fully represented by the May/June temper-atures in the intermediate water considered in themodel. This may underline the importance of thepre-spawning period for the above mentionedprocesses.
MSVPA derived cod recruitment at age 1 and 2compared in general fairly well to trawl surveyindices, especially in Sub-divisions 26 and 28. How-ever, the residuals of the linear regression showed asignificant auto-correlation over time and the veryhigh year-class strength 1979 estimated by theMSVPA was not confirmed by the trawl surveys. Incontrast, most recent year-class estimates fromMSVPA fitted well to the surveys indices, which forage-group 2 may be explained by the fact that thesurvey abundance was been to tune the MSVPA.
MSVPA derived sprat recruitment at age 0 and 1was highly correlated to corresponding abundanceestimates from international hydroacoustic surveys.An exception was the strength of the 1982 year-classin Sub-divisions 26 and 28 being substantially high-er in the MSVPA than indicated by the surveys. Asimilar tendency was obvious from a comparisonwith an independent sprat recruitment index fromthe Polish young fish survey in Sub-division 26.Thus, it was concluded that the 1982 recruitmentwas substantially overestimated by the MSVPA andwas consequently removed from the furtherexploratory analysis.
Identification of critical early life stages
Difference in the covariance of abundance esti-mates for successive developmental stages indicat-ed that critical periods for cod recruitment in theBaltic are mainly passed from the egg to the larvalstage. The importance of hydrographic conditionswithin and below the halocline for cod egg survivalis well known (e.g. Nissling, 1994; Wieland et al.,1994; MacKenzie et al., 1996), while a poor corre-lation between late egg stage production and larvalabundance has been reported only recently (Kösteret al., 2001b). However, Plikshs et al. (1993) point-ed out that egg survival is correlated to the repro-ductive volume but not to year-class strength, indi-cating that unidentified processes acting on otherlife stages are important as well. Egg quality char-acteristics (Petersen et al., 1997; Nissling et al.,1998), low but not lethal oxygen concentrationsduring egg incubation (Rohlf, 1999), food supplyduring initial feeding (Plikshs et al., 1993) andtransport to favourable nursery areas (Hinrichsen etal., 2001) have been suggested as additional vari-ables with substantial impact on the larval and earlyjuvenile survival. The close correlation between lar-val abundance and 0-group recruitment suggested,however, that a major part of the remaining vari-ability in reproductive success is already introducedin the egg and early larval stage.
Recruitment at age 0 and 1 determined byMSVPA was very closely related. Increased vari-ability at the beginning of the 1980s, i.e. a time peri-od with the highest intensity of cannibalism (Kösteret al., 2001a). This may indicate that cannibalism isusually of minor importance for the recruitment suc-cess of Baltic cod. However, the limited variabilityin cannibalism rates was to a certain extent artifi-cially created by the estimation procedure imple-
148 F.W. KÖSTER et al.

mented in the MSVPA, which uses constant suit-ability coefficients over the whole time series,regardless of the size and distribution of the adultand juvenile stock (Neuenfeldt and Köster, 2000).
For sprat, studies on processes affecting thereproductive success in the Baltic are scarce com-pared to cod. The strong positive linear relationshipsbetween production values of early and late eggstages as well as between the late egg stage and lar-val abundance were unexpected. Given the higherbuoyancy of sprat eggs compared to cod (e.g.Wieland and Zuzarte, 1991), a considerable impactof low temperature on egg survival could be expect-ed. Thompson et al. (1981) demonstrated that sprategg survival decreases at temperatures below 6°C,which is seldom reached in intermediate water lay-ers of the Baltic. Furthermore, it could be expectedthat egg predation by clupeids is dependent on thevertical overlap between eggs and predators forcedby salinity and oxygen concentrations (Köster andMöllmann, 2000b); this should result in additionalvariability of egg survival. However, in the givenrange of variation both temperature and predator-prey overlap seem to have only a limited regulatoryimpact on egg survival.
The larval stage has earlier been identified ascritical for sprat recruitment (Grauman and Yula,1989; Kalejs and Ojaveer, 1989), suggesting thatfood supply could be a major impact factor, withtemperature being a co-variate, as meso-zooplank-ton production depends on the temperature condi-tions, especially in spring (e.g. Möllmann et al.,2000). However, the close relation identified in thepresent study between the production of the late eggstage and larval abundance in Sub-division 26 sug-gests that food supply may not vary to a large extentfor first feeding larvae in this area, but may do so inSub-division 28 where a large portion of the vari-ance in larval abundance remains unexplained(77%). However, it was possible to improve therelationship in both areas considerably by includingthe wind speed anomaly as an additional variable.The significant positive impact of wind speed mayin principal be caused by a wind induced drift oflarvae from the Bornholm Basin into the easternBaltic basins (Grauman, 1976). However, the spratlarval transport index specifically designed to testthis hypothesis did not confirm a significant trans-port. Thus, other processes like enhanced preyencounter rates at increased turbulence may beinvolved. The present results also did not confirmthe hypothesis that high wind stress has a negative
effect on egg survival in surface layers (Gauman,1965). It should be noted, however, that in thisanalysis only the main spawning period inMay/June was considered, in which typically adeeper distribution of sprat eggs is encountered(Wieland and Zuzarte, 1991).
Processes affecting critical early life stages
The exploratory regression analysis confirmed asignificant impact of oxygen and predation on codegg survival for Sub-division 25. However, theseregressions were not specifically convincing. Mostobserved egg survival rates vary within a certainrange, rather independently of the oxygen relatedsurvival factor (OES) and the predation index. Therewere three years (1976, 1978, 1994) in which theegg survival rates ranged at an obviously higherlevel. These years were in fact characterised byfavourable oxygen supply and low predation rate,but under the same conditions low survival rateswere also obtained. By including the information onoxygen and predation in the recruitment model, thepotential for a high egg survival is considered butsome causal relation is still missing, so estimates forindividual years remain uncertain though trends maybe represented reasonably well.
The average annual abundance values for cod lar-vae were to some extent related to the potential eggproduction, and a part of the remaining variancecould be explained by an impact of oxygen on thesurvival from spawning to the larval stage. Bothregressions were statistically significant, butexplained only a very limited part of the observedvariance in larval abundance. The high residual vari-ance may be due to some additional major impactfactor affecting survival during the larval phase orpart of it, but it may also be due to sampling prob-lems leading to high variation or bias in larval abun-dance estimates. As in the most recent years of thetime series a delay in cod spawning occurred(Wieland et al., 2000), this may have caused a mis-match in the timing of the plankton surveys and theoccurrence of peak larval abundance, and thus mayhave led to an underestimation of larval abundance(Köster et al., 2001b).
Behavioural studies of cod larvae demonstratedthat low oxygen concentration has an impact on lar-val mortality (Nissling, 1994) and that egg incuba-tion at low oxygen concentration also has an affecton larval activity (Rohlf, 1999). Furthermore, theseexperiments revealed that vertical migration into
CRITICAL EARLY LIFE STAGES AND RECRUITMENT IN COD AND SPRAT 149

upper water layers is not started before day 4 afterhatch. Hence, a significant impact of the environ-ment within and below the halocline on larval sur-vival can be expected. Due to differences in buoyan-cy and in the minimum lethal oxygen concentrationsin the egg and larval stage (Rohlf, 1999), it appearsto be unlikely that the OES is a suitable measure ofoxygen related survival probability of larvae. In fact,the ORV performed better in the exploratory analy-sis and was therefore included in the final modelconfiguration in Sub-division 25.
In the more eastern spawning areas, variability inlarval abundance was more easily explained as ahighly significant impact of the hydrography is obvi-ous (Köster et al., 2001b). This result was expected asthe environmental conditions were less favourable forsuccessful cod egg survival in these areas comparedto the Bornholm Basin (MacKenzie et al., 2000).However, a large reproductive volume does not nec-essarily result in high survival of early life stages. In1994, an extremely large reproductive volume wasencountered in the Gotland Basin due to an inflowinto this basin. This inflow displaced the anoxic bot-tom water upwards (Plikshs et al., 1999), resulting inan intermediate layer with insufficient oxygen con-centration but densities sufficient to keep cod eggsfloating, and hence creating conditions detrimental tothe development of cod eggs. Situations like theseclearly demonstrate the potential for index improve-ment through the development of models for predict-ing the vertical distribution of cod eggs in all spawn-ing areas relative to oxygen conditions.
One additional factor to be considered for larvalsurvival may be the food supply. Information on theabundance of zooplankton, suitable as prey for codlarvae and early juveniles, has been reviewed byMacKenzie et al. (1996), suggesting that the CentralBaltic provides at least similar if not better feedingconditions compared to other spawning areas. Also,from a detailed study based on extensive verticallyresolving sampling of zooplankton in different areasof the Central Baltic at various times of the year,Krajewska-Soltys and Linkowski (1994) concludedthat the abundance of nauplii and copepoditesshould be sufficient to ensure that starvation is not amajor source of larval and juvenile cod mortality.However, our preliminary test on the impact of thesupply of nauplii as suitable prey for first feedingcod larvae (Zuzarte et al., 1996) revealed a signifi-cant influence on the apparent survival from egg tolarval stage in Sub-division 26. Multiple linearregression including food abundance and reproduc-
tive volume (RV) as independent variables explainedthe variance in larval abundance reasonably well(65%). Zooplankton data were not available for theperiod 1992 to 1995. Thus, most of the years inwhich larval surveys were potentially affected by theshift in spawning time (see above) were excludedfrom this analysis.
For sprat survival from the larval to the 0-groupstage, the exploratory analysis identified the temper-ature in the intermediate water as the only biologi-cally sensible factor with a marked influence. Nei-ther physical/chemical variables such as the oxygencondition in deep water layers, wind speed anomalyand larval transport index nor biological variablessuch as food availability or 0-group weight anomalyexplained a significant part of the variance encoun-tered in 0-group recruitment. This may lead to thequestion of the reliability of larval abundance and 0-group recruitment data series used in the analysis.As the late egg stage production was significantlyrelated to larval abundance, with a significantimprovement when incorporating the wind speedanomaly, it appears to be unlikely that the larval dataare grossly erroneous. Using larval abundance dataaveraged from May to July instead of May to Junedid not improve the relationship between sprat larvalabundance and 0-group recruitment either. Thus, theexclusion of late born cohorts from the analysis didnot explain the deviation in abundance estimatesbetween the two life stages. Similarly, significantrelationships between MSVPA based recruitmentand hydroacoustic survey abundance estimates indi-cated an acceptable quality of the data series weused in this analysis.
The impact of winter and spring temperature onsprat larval abundance has been described earlier byGrauman and Yula (1989). They identified the solaractivity and the spawning stock biomass (as a mea-sure of egg production) as additional significant fac-tors regulating larval abundance. Other variablessuch as deep water temperature, salinity and oxygenconcentration had an effect of intermediate strengthon larval abundance. Similar to our results, the avail-ability of nauplii in May did not explain any majorportion of the variability (Grauman and Yula, 1989).The impact of temperature on larval abundance wasnevertheless explained by a temperature relateddevelopment of the Temora longicornis populationas a thermophil prey species for sprat larvae (Grau-man et al., 1986; Kalejs and Ojaveer, 1989).
Also, there was no indication that low weight atage of survivors is coupled to high larval or early
150 F.W. KÖSTER et al.
juvenile mortality, which could be caused by a size-dependent predation of adult herring reported byPatokina and Feldman (1998). It should, however,be noted that the weight anomaly is significantlycorrelated with the juvenile Acartia spp. abundancein May/June, but not with temperature in the inter-mediate water.
Applicability of recruitment models
In Sub-division 25, a significant linear relation-ship between cod larval abundance and recruitmentat age 0 has been described (Köster et al., 2001b),which could not be enhanced by the inclusion ofany additional variable. Thus, the simple modelappears to be applicable for predicting recruitment.The corresponding relationship in Sub-division 26was also statistically significant, but the fit of themodel was less satisfactory, while for Sub-division28 no significant relationship could be established.Recruitment success occurred in the latter area in aseries of years despite an absolute lack of larvae inthe plankton. The occurrence of recruitment esti-mated by the MSVPA was also confirmed by bot-tom trawl surveys catching age-group 1 cod. Thus,the lack of larvae indicates either i) a problem insampling efficiency of the gear at low larval abun-dance, or ii) a transport of larvae and pelagic 0-group out of the Bornholm area into the more east-ern Baltic basins. The latter hypothesis is support-ed by hydrodynamic modelling (Hinrichsen et al.,2001), comparison of trawl survey results andMSVPA output (Köster et al., 2001a), and also bythe fact that the parameter estimate for the larvaltransport index in the recruitment model is negativein Sub-division 25 (Köster et al., 2001b).
The close linear relation between 0- and 1group recruitment of cod as well as sprat is to acertain extent artificially created by the estimationprocedure implemented in the MSVPA (seeabove), considering only predation by cod as anadditional cause of natural mortality. In fact, oninspecting the cod year-class strength at age 1 and2, as derived from the international bottom trawlsurvey, it appeared that regressions were signifi-cant only for Sub-division 26 and 28, but not forSub-division 25, which was the only area allowingregular reproductive success. For sprat, a regres-sion of 1-group on 0-group estimates, derivedfrom the international hydroacoustic survey, wassignificant in Sub-division 25 but not in the othertwo areas. Even assuming that survey estimates
are noisy, especially for pre-recruits not targetedby the survey, this considerably decoupled varia-tion in the abundance estimates of 1 and 2-groupcod and 0- and 1-group sprat may indicate thatsurvival during the first years of life is not onlydependent on cod predation, but that otherprocesses also may modify recruitment successsubstantially.
The recruitment models established here explaina considerable part of the variability encountered insurvival to the juvenile stage with a considerably bet-ter performance for cod than for sprat. Sprat exhibit-ed high recruitment fluctuations in the most recentyears, which the established recruitment model wasnot able to predict. Remaining variability may be dueto a number of processes not included in the presentanalyses such as egg fertilisation (e.g. Westin andNissling, 1991) and the influence of parental charac-teristics (age/size structure, condition) on egg andlarval characteristics (buoyancy, survival probability,e.g. Marshall et al., 1998; Trippel, 1998; Vallin andNissling, 2000), but also uncertainties in the wayvariables are assumed to represent processes of inter-est (e.g. reproductive volume effect on cod egg sur-vival, temperature effect on sprat larval survival).Results on these topics have recently become avail-able (e.g. MacKenzie et al., 1998; Nissling et al.,1998; Vallin and Nissling, 2000), and potentiallythey can be incorporated into new generations ofrecruitment models (Vallin et al., 1999).
Apart from this potential for improvements,major difficulties in establishing environmentallysensitive stock-recruitment models are i) to incorpo-rate various factors affecting different early lifestages (Paulik, 1973) in one linear model relatingegg production to subsequent recruitment, and ii) toresolve the potential non-linearity and interdepen-dent effects of different factors on subsequent earlylife stages. The first problem has been described indetail before (Rothschild, 1986; Ulltang, 1996). Bai-ley et al. (1996) and Campana et al. (1989) consid-ered it explicitly when constructing survival curvesof walleye pollock as well as Nova Scotia cod andhaddock cohorts relative to their physical and bio-logical environment. For the Baltic, however, thistype of approach has not yet been conducted.
Despite the remaining shortcomings and uncer-tainties also with respect to the second problem, thestock-recruitment models presented for cod may beutilised for improving short-term recruitment pre-dictions. They could be based on: i) most recentfemale spawning stock biomass and relative fecun-
CRITICAL EARLY LIFE STAGES AND RECRUITMENT IN COD AND SPRAT 151

dity estimates (Kraus et al., 2000), ii) hydrographicconditions during spawning periods and at spawningsites, which would enable prediction of the egg andlarval survival in relation to ambient oxygen con-centrations and larval transport from spawningareas, and iii) predator population sizes as well asspatial overlap between predator/prey, both forcedby hydrographic processes. For sprat, the presentedanalysis should be taken as a first step resolvingtowards key variables regulating recruitment suc-cess, and generating new work hypotheses to betested in specifically designed process studies and tobe validated by subsequent analysis of furtherextended long-term data bases.
ACKNOWLEDGEMENTS
This study was carried out within the frame ofthe EU-projects SAP (FAIR 97 3805) and BalticSTORE (FAIR-98-3959), using process-orientedresults and databases built up within the former EU-projects Baltic CORE (AIR-94-1226) and BASYS(MAS3-96-0058). All participants of the projectshave contributed their experience, knowledge andresults to the present study, which was a prerequisitefor this analysis and is thus gratefully acknowl-edged here.
REFERENCES
Alekseeva, E.I., M.M. Baranova, M.A., Dmitrieva and E.F.Ryazantseva. – 1997. Ovaries maturation, batch eggs forming,batch fecundity and distribution during sex cycle of Baltic spratSprattus sprattus Balticus. C.M. 1997/U:02.
Bagge, O., and F. Thurow. – 1993. The Baltic cod stock: Fluctua-tions and possible causes. ICES Mar. Sci. Symp., 198: 254-268.
Bagge, O., F. Thurow, E. Steffensen and J. Bay. – 1994. The Balticcod. Dana, 10: 1-28.
Bailey, K.M., R.D. Brodeur and A.B. Hollowed. – 1996. Cohortsurvival patterns of walleye pollock Theragra calcogramma, inShelikof Strait, Alaska: a critical factor analysis. Fish.Oceanogr., 5(Suppl. 1): 179-188.
Begg, G.A. and G. Marteinsdottir. – 2000. Spawning origins ofpelagic juvenile cod Gadus morhua inferred from spatiallyexplicit age distributions: potential influences on year-classstrength and recruitment. Mar. Ecol. Progr. Ser., 202: 193-217.
Beverton, R.J.H. and T.C. Iles. – 1992. Mortality rates of 0-groupplaice (Platessa platessa L.), dab (Limanda limanda L.) andturbot (Scophthalmus maximus L.) in European waters. III.Density dependence of mortality rates of 0-group plaice andsome demographic implications. Neth. J. Sea Res., 29: 61-79.
Bleil, M., and R. Oeberst. – 1996. The fecundity of cod in ICESSub-divisions 22, 24 and 25 in the years 1992 to 1995 (prelim-inary results). ICES C.M. 1996/J:8.
Campana, S.F., K.T. Frank, P.C.F. Hurley, P.A. Koeller, F.H. Pageand P.C. Smith. – 1989. Survival and abundance of youngAtlantic cod (Gadus morhua) and haddock (Melanogrammusaeglefinus) as indicators of year class strength. Can. J. Fish.Aquat. Sci., 46(Suppl. 1): 171-182.
CORE - 1998. Mechanisms influencing long term trend in repro-
ductive success and recruitment of Baltic cod: Implications forfisheries management. Final Report to the EU Commission,AIR 94 1226.
Elwertowski, J. – 1960. Biologische Grundlagen der Sprottenfis-cherei in der östlichen und mittleren Ostsee. Fisch. Forsch.,3(4): 1-19.
Grauman, G.B. – 1965: Some data on the reproduction of sprat inthe southern part of the Baltic Sea in the period 1958-1964.ICES C.M. 1965/Baltic-Belt Seas Committee Paper, No. 121.
Grauman, G.B. – 1976. On the distribution and passive migration ofBaltic sprat eggs and larvae in Bornholm-Slupsk spawningground. ICES C.M. 1976/P:8.
Grauman, G.B., and K. Krenkel. – 1986. Investigations about thedynamic of spawning processes of the Baltic sprat in 1984.ICES C.M. 1986/J:17.
Grauman, G.B., and E. Yula. – 1989. The importance of abiotic andbiotic factors in early ontogenesis of cod and sprat. Rapp. P.-v.Réun. Cons. Int. Explor. Mer, 190: 207-210.
Grauman, G.B., R.J. Line, and L.L. Sidrevics. – 1986. On the fac-tors determining abundance of Baltic sprat. ICES C.M.1986/J:8.
Grimm, S.K., and T. Herra. – 1984. Spawning cycles of southernBaltic fishes based on surveys of eggs and larvae. ICES CM1984/J:30.
Heath, M. and A. Gallego. – 1997. From the biology of the individ-ual to the dynamics of the population: bridging the gap in fishearly life studies. J. Fish Biol., 51 (Suppl. A): 1-30.
Herra, T. – 1988. Ichthyoplankton survey in the southern Baltic inAugust 1987. ICES C.M. 1988/L:23.
Herra, T., and S.K. Grimm. – 1983. Preliminary results of ichthy-oplankton surveys of the southern Baltic Sea in May 1983.ICES C.M. 1983/L:15.
Hinrichsen, H.-H., M.A. St. John, E. Aro, P. Grønkjær and R. Voss.– 2000. Testing the larval drift hypothesis in the Baltic Sea:Retention vs. dispersion due to the influence of the wind drivencirculation. ICES J. Mar. Sci., 58: 973-984.
Hutchings, J.A. and R.A. Myers. – 1993. Effect of age on the sea-sonality of maturation and spawning of Atlantic cod, Gadusmorhua, in the Northwest Atlantic. Can. J. Fish. Aquat. Sci.,50: 2468-2474.
ICES. – 1976. Report of the Working Group on Surveys of FishEggs and Larvae in the Baltic. ICES C.M. 1976/P:10.
ICES. – 1994. Report of the Planning Group for Hydroacoustic Sur-veys in the Baltic. ICES C.M. 1994/J:4.
ICES. – 1996. Report of the Baltic Fisheries Assessment WorkingGroup. ICES C.M. 1996/Assess:13.
ICES. – 1997. Report of the Baltic Fisheries Assessment WorkingGroup. ICES C.M. 1997/Assess:12.
ICES. – 1998. Report of the Baltic Fisheries Assessment WorkingGroup. ICES C.M. 1998/ACFM:16.
ICES. – 1999a. Report of the Baltic Fisheries Assessment WorkingGroup. ICES C.M. 1999/ACFM:15.
ICES. – 1999b. Report of the Study Group on Multispecies ModelImplementation in the Baltic. ICES C.M. 1999/H:5.
ICES. – 2000. Report of the Baltic Fisheries Assessment WorkingGroup. ICES C.M. 2000/ACFM:14.
ICES. – 2001a. Report of the Study Group on Multispecies Predic-tions in the Baltic. ICES C.M. 2001/H:5.
ICES. – 2001b. Report of the Study Group on Baltic herring andsprat maturity. ICES 2001/ACFM:24.
Jarre-Teichmann, A., K. Wieland, B.R. MacKenzie, H.-H. Hinrich-sen, M. Plikshs and E. Aro. – 2000. Stock-recruitment relation-ships for cod (Gadus morhua callarias L.) in the central BalticSea incorporating environmental variability. Arch. Fish. Mar.Res., 48: 97-123.
Kalejs, M., and E. Ojaveer. – 1989. Long-term fluctuations in envi-ronmental conditions and fish stocks in the Baltic. Rapp. P-vRéun. Cons. Int. Explor. Mer, 190: 153-158.
Karasiova, E. – 1999. On the possible relation of the cod peakspawning timing with the environmental conditions in theGdansk Deep of the Baltic Sea. ICES CM 1999/Y:29.
Kendall, A.W., Schumacher, J.D., and S. Kim. – 1996. Walleye pol-lock recruitment in Shelikof Strait, Alaska. Fish. Oceanogr.,5(Suppl. 1): 4-18.
Kjesbu, O.S., J. Klungsoyr, H. Kryvi, P.R. Witthames and M. GreerWalker. – 1991: Fecundity, atresia and egg size of captiveAtlantic cod (Gadus morhua) in relation to proximate bodycomposition. Can. J. Fish. Aquat. Sci., 48: 2333-2343.
152 F.W. KÖSTER et al.

Köster, F.W., and D. Schnack. – 1994. The role of predation onearly life stages of cod in the Baltic. Dana, 10: 179-201.
Köster, F.W., and C. Möllmann. – 2000a. Trophodynamic controlby clupeid predators on recruitment success in Baltic cod ?ICES J. Mar. Sci., 57: 310-323.
Köster, F.W., and C. Möllmann. – 2000b. Egg cannibalism in Balticsprat Sprattus sprattus. Mar. Ecol. Progr. Ser., 196: 269-277.
Köster, F.W., C. Möllmann, M.A. St. John, S. Neuenfeldt, M.Plikshs and R. Voss. – 2001a. Developing Baltic cod recruit-ment models I: Resolving spatial and temporal dynamics ofspawning stock and recruitment. Can. J. Fish. Aquat. Sci., 58:1516-1533.
Köster, F.W., H.H. Hinrichsen, M.A. St. John, D. Schnack, B.R.MacKenzie, J. Tomkiewicz and M. Plikshs. – 2001b. Develop-ing Baltic cod recruitment models II: Incorporation of environ-mental variability and species interaction. Can. J. Fish. Aquat.Sci., 58: 1535-1557.
Krajewska-Soltys, A. and T.B. Linkowski. – 1994. Densities ofpotential prey for cod larvae in deep-water basins of the south-ern Baltic. ICES CM 1994/J:17.
Kraus, G., A. Müller, K. Trella and F.W. Köster. – 2000. Fecundi-ty of Baltic cod: temporal and spatial variation. J. Fish Biol.,56: 1327-1341.
Krenkel, K. 1981: Über das Vorkommen der Eier und Larven vonSprott (Sprattus sprattus) und Dorsch (Gadus morhua) in derOstsee in den Jahren 1977-1980. Fisch.-Forsch., 19: 31-36.
Lambert, Y. and J.-D. Dutil. – 2000. Energetic consequences ofreproduction in Atlantic cod (Gadus morhua) in relation tospawning level of somatic energy reserves. Can. J. Fish. Aquat.Sci., 57: 815-825.
Larkin, P.A. and A.S. Hourston. – 1964. A model for simulation ofthe population biology of Pacific salmon. J. Fish. Res. Bd Can.,21: 1245-1265.
Leggett, W.C. and E. DeBlois. – 1994. Recruitment in marine fish-es: is it regulated by starvation and predation in the egg and lar-val stages?. Neth. J. Sea Res., 32: 119-134.
Line, R.J. 1979. Some observations on fecundity and developmentcycles of the main zooplankton species in the Baltic sea and theGulf of Riga. In: Fisheries investigations in the basins of theBaltic sea. Riga, Zvaigzne, 14: 3-10 (in Russian).
MacKenzie, B.R., M.A. St. John and K. Wieland. – 1996. EasternBaltic cod: perspectives from existing data on processes affect-ing growth and survival of eggs and larvae. Mar. Ecol. Prog.Ser., 134: 265-281.
MacKenzie, B.R., J. Tomkiewicz, F.W. Köster and A. Nissling. –1998. Quantifying and disaggregating the ‘spawner’ effect:incorporating stock structure, spatial distribution and femaleinfluence into estimates of annual population egg production.ICES C.M. 1998/BB:11.
MacKenzie, B.R., H.-H. Hinrichsen, M. Plikshs, K. Wieland and A.S.Zezera. – 2000. Quantifying environmental heterogeneity: habitatsize necessary for successful development of cod Gadus morhuaeggs in the Baltic Sea. Mar. Ecol. Progr. Ser., 193: 143-156.
Marshall, T.C., O.S. Kjesbu, N.A. Yaragina, P. Solemdal and Ø.Ulltang. – 1998. Is spawner biomass a sensitive measure of thereproductive and recruitment potential of Northeast Arctic cod.Can. J. Fish. Aquat. Sci., 55: 1766-1783.
Marteinsdottir, G. and A. Steinarsson. – 1998. Maternal influenceon the size and viability of Iceland cod Gadus morhua eggs andlarvae. J. Fish Biol. 52, 1241-1258.
Marteinsdottir, G., and K. Thorarinsson. – 1998. Improving thestock-recruitment relationship in Icelandic cod (Gadus morhuaL.) by including age diversity of spawners. Can. J. Fish. Aquat.Sci., 55: 1372-1377.
Möllmann, C., G. Kornilovs and L. Sidrevics. – 2000. Long-termdynamics of main mesozooplankton species in the centralBaltic Sea. J. Plank. Res., 22: 2015-2038.
Müller, A. – 1988. Vertical distribution of ichthyoplankton in theBornholm Basin. Kieler Meeresforsch. Sonderh., 6: 341-347.
Myers R.A. and N.C. Cadigan. – 1993. Density-dependent juvenilemortality in marine demersal fish. Can. J. Fish. Aquat. Sci., 50:1576-1590.
Neuenfeldt, S., and F.W. Köster. – 2000. Trophodynamic control onrecruitment success in Baltic cod: the influence of cannibalism.ICES J. Mar Sci., 57: 300-309.
Nissling, A. – 1994. Survival of eggs and yolk-sac larvae of Balticcod (Gadus morhua L.) at low oxygen levels in different salin-ites. ICES Mar. Sci. Symp., 198: 626-631.
Nissling, A., R. Larsson, L. Vallin and K. Frohlund. – 1998. Assess-ment of egg and larval viability in cod, Gadus morhua - methodsand results from an experimental study. Fish. Res., 38: 169-186.
Ojaveer, E. – 1989. Population structure of pelagic fishes in theBaltic. Rapp. P-v Réun. Cons. Int. Explor. Mer, 190: 17-21.
Ojaveer, E., A. Lumberg, and H. Ojaveer. – 1998. Highlights ofzooplankton dynamics in Estonian waters (Baltic Sea). ICES J.Mar. Sci., 55: 748-755.
Parmanne, R., O. Rechlin and B. Sjöstrand. – 1994. Status andfuture of herring and sprat stocks in the Baltic Sea. Dana, 10:29-59.
Patokina, F.A. and V.N. Feldman. – 1998. Peculiarities of trophicrelations between Baltic herring (Clupea harengus membras L.)and sprat in the south eastern Baltic Sea in 1995-1997. ICESCM 1998/CC:7.
Paulik, G.J. – 1973. Studies of the possible form of the stock-recruitment curve. Rapp. P.-v. Réun. Cons. int. Explor. Mer,164: 302-315.
Petersen, G.I., J. Gerup, L. Nilsson, J.R. Larsen and R. Schneider. –1997. Body burdens of lipophilic xenobiotics and reproductivesuccess in Baltic cod (Gadus morhua). ICES C.M. 1997/U:10.
Petrowa; E.G. – 1960. Fecundity and maturation of sprat in theBaltic. VNIRO, 42: 99-108.
Polivaiko, A.G. – 1980. Some data on maturation, spawning andfecundity of sprat. Fisch. Forsch., 18: 69-72.
Plikshs, M., M. Kalejs and G. Graumann. – 1993. The influence ofenvironmental conditions and spawning stock size on the year-class strength of the eastern Baltic cod. ICES C.M. 1993/J:22.
Plikshs, M., H.-H. Hinrichsen, F.W. Köster, J. Tomkiewicz and V.Berzins. – 1999. Baltic cod reproduction in the Gotland Basin:annual variability and possible causes. ICES C.M. 1999/Y:31.
Raid, T. – 1989. The influence of hydrodynamic conditions on thespatial distribution of young fish and their prey organisms.Rapp. P-v Réun. Cons. Int. Explor. Mer, 190: 166-172.
Rohlf, N. – 1999. Aktivität und Vertikalwanderung der Larven desOstseedorsches (Gadus morhua callarias) während der Dotter-sackphase. PhD. thesis, University Kiel, Ber. Inst. fürMeereskunde, 312, 62pp.
Rothschild, B.J. – 1986. Dynamics of Marine Populations. HarvardUniversity Press, Cambridge, USA.
Rothschild, B.J. – 2000. “Fish stock and recruitment”: the past thir-ty years. ICES J. Mar Sci., 57: 191-201.
Rudstam, L.G., G. Aneer and M. Hildén. – 1994. Top-down controlin the pelagic Baltic ecosystem. Dana, 10: 105-129.
Schnack, D. – 1997. Influence of hydrographic gradients and fish-ery on the biological interaction and balance between sprat andcod stocks in the Baltic Sea. Commented review. ICES CM1997/S:10.
Schnack, D., and F.W. Köster. – 1998. Baltic Cod Recruitment Pro-ject: Summary of results 1994-97. ICES CM 1998/R:21.
Shapiro, L.A. – 1990. Correlation between the quantity and qualityof the gonads in the Baltic cod. Can. Transl. Fish. Aquat. Sci.,no. 5515.
Sidrevics, L.L. – 1984. The main peculiarities of zooplankton dis-tribution in the south-eastern, eastern and north-eastern Baltic.Articles on biological productivity of the Baltic Sea, 2: 172-187(in Russian).
Sparholt, H. – 1996. Causal correlation between recruitment andspawning stock size of central Baltic cod? ICES J. Mar. Sci.,53: 771-779.
Sparholt, H., and J. Tomkiewicz. – 2000. A robust method to com-pile trawl survey data applied in assessment of Central Balticcod. Arch. Fish. Mar. Res., 48: 125-151.
St. John, M.A., H. Mosegaard, H.-H. Hinrichsen, P. Grønkjær, F.W.Köster, K. Hüssy and R. Nielsen. – 2000. Baltic Cod: Resolv-ing processes determining spatial and temporal windows of sur-vival. ICES C.M. 2000/N:27.
STORE. – 2000. Environmental and fisheries influences on fishstock recruitment in the Baltic Sea. Consolidated ProgressReport 01.01.-31.12.1999 to the EU Commission, FAIR-98-3959 Part 1 &2.
STORE. – 2001. Environmental and fisheries influences on fishstock recruitment in the Baltic Sea. Consolidated ProgressReport 01.01.-31.12.2000 to the EU Commission, FAIR-98-3959 Part 1 & 2.
Thompson, B.M., S.P. Milligan and J.H. Nichols. – 1981. Thedevelopment rates of sprat (Sprattus sprattus L.) eggs over arange of temperatures. ICES C.M. 1981/H:15.
CRITICAL EARLY LIFE STAGES AND RECRUITMENT IN COD AND SPRAT 153

Tomkiewicz, J., M. Eriksson, T. Baranova, V. Feldman and H.Müller. – 1997. Maturity ogives and sex ratios for Baltic cod:establishment of a database and time series. ICES CM1997/CC:20.
Trippel, E.A. – 1998. Egg size and viability and seasonal offspringproduction of young Atlantic cod. Am. Fish. Soc., 127: 339-359.
Trippel, E., O.S. Kjesbu and P. Solemdal. – 1997. Effects of adultage and size structure on reproductive output in marine fishes.In: Chambers, C.R. and Trippel. E.A. (eds.), Early Life Historyand Recruitment in Fish Populations, pp. 29-62. Chapman andHall Fish and Fisheries Series, London.
Ulltang, Ø. – 1996. Stock assessment and biological knowledge:can prediction uncertainty be reduced. ICES J. Mar. Sci., 53:659-675.
Vallin, L., and A. Nissling. – 2000. Maternal effects on egg size andegg buoyancy of Baltic cod, Gadus morhua. Implications forstock structure effects on recruitment. Fish. Res., 49: 21-37.
Vallin, L., A. Nissling and L. Westin. – 1999. Potential factorsinfluencing reproductive success of Baltic cod, Gadus morhua:a review. Ambio, 28: 92-99.
Vuorinen,I., J. Hänninen, M. Viitasalo, U. Helminen and H. Kuosa.
– 1998. Proportion of copepod biomass declines with decreas-ing salinity in the Baltic Sea. ICES J. Mar. Sci., 55: 767-774.
Westin, L., and A. Nissling. – 1991. Effects of salinity on sperma-tozoa motility, percentage of fertilized eggs and egg develop-ment of Baltic cod Gadus morhua, and implications for codstock fluctuations in the Baltic. Mar. Biol., 108: 5-9.
Wieland, K. and F. Zuzarte. – 1991. Vertical distribution of cod andsprat eggs and larvae in the Bornholm Basin (Baltic Sea) 1987-1990. ICES CM 1991/J:37.
Wieland, K., and A. Jarre-Teichmann. – 1997. Prediction of verti-cal distribution and ambient development temperature of Balticcod (Gadus morhua L.) eggs. Fish. Oceanogr., 6: 172-187.
Wieland, K., U. Waller and D. Schnack. – 1994. Development ofBaltic cod eggs at different levels of temperature and oxygencontent. Dana, 10: 163-177.
Wieland, K., A. Jarre-Teichmann and K. Horbowa. – 2000. Changesin the timing of spawning of Baltic cod: possible causes andimplications for recruitment. ICES J. Mar. Sci., 57: 452-464.
Zuzarte, F., F.W. Köster, C. Möllmann, R. Voss and P. Grønkjær. –1996. Diet composition of cod larvae in the Bornholm Basin.ICES C.M. 1996/J:19.
154 F.W. KÖSTER et al.