redes energÉticas do futuro - azores · target renewable energy share: ~80% example configuration...
TRANSCRIPT

REDES ENERGÉTICAS DO FUTURO
12./13. Dez. 2011
Clemens Triebel, Younicos

Younicos develops applications
of storage & grid management
technologies
6 Wh 1 kWh 100 kWh 6 MWh

VISION: Future energy supply
shall rely on Renewable Energy
(RE) worldwide
Example: European RE targets (20% in 2020, 30% in
2030, ….)
European Renewable Energy Goals
0%
20%
40%
60%
80%
100%
2010 2020 2030 2040 2050 2060 2070 2080 2090 2100
Year
Re
ne
wa
ble
En
erg
y F
rac
tio
n
European Renewable Energy Goals
0%
20%
40%
60%
80%
100%
2010 2020 2030 2040 2050 2060 2070 2080 2090 2100
Year
Re
ne
wa
ble
En
erg
y F
rac
tio
n
For a stable grid
based on renewable
energies
• Storage
Technologies
• New Control
strategies
are required
Stable
Instab
le
The ISLAND case
While in the mainland grid, instability
due to major contribution to renewables is
a challenge of TOMORROW
Islands experience these future challenges
of the European grid already TODAY
Therefore, they are the ideal platform to
develop TODAY the energy concepts of
TOMORROW
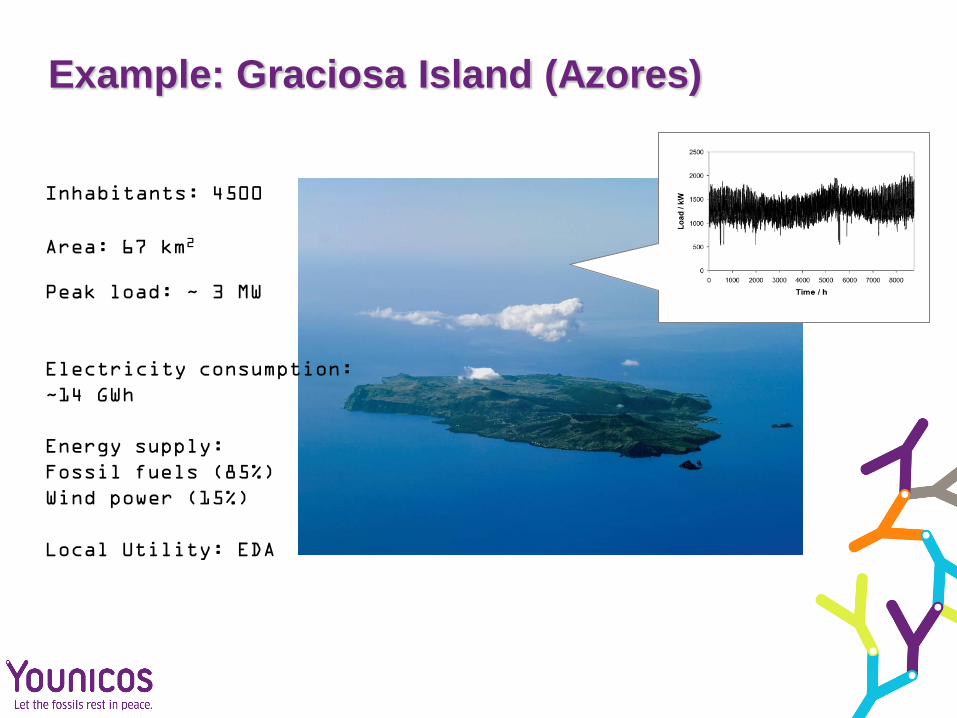
Example: Graciosa Island (Azores)
Inhabitants: 4500
Area: 67 km2
Peak load: ~ 3 MW
Electricity consumption:
~14 GWh
Energy supply:
Fossil fuels (85%)
Wind power (15%)
Local Utility: EDA

Graciosa Today’s Power System
Power Station 4200 kW
(Fuel consumption ~ 4 Mio.
l/a)

Pilot Project Graciosa: 70-80% Renewables

Potential for wind and solar energy
daily average 3.3
kWh/m2d
estim. yield 1.3 MWh/kW
Wind speed @ 15 m > 9 m/s
estim.
yield 3.0 MWh/kW
8
0
2
4
6
8
10
12
14
J F M A M J J A S O N D
Month
m/s
0
1
2
3
4
5
6
J F M A M J J A S O N D
Month
kW
h/m
2-d
ay Solar radiation
Wind
Strategy / Products & Projects / R&D / Holdings

Graciosa Renewable Energy System
Layout
9
•Database: Load, irradiation and wind data from EDA
• Tool: HOMER – a simulation tool from NREL for
the design and optimization of renewable energy
systems
• Simulation: Hour by hour energy balance for the
energy various possible supply system
layouts
• Result: Cost of electriciy for various possible
supply system layouts
Wind
€ economic data
Solar
Load
• size of wind and
PV power plant
and battery
• cost of electricity for
hybrid system

Target Renewable Energy Supply System
Layout
Load
70-90 % 10-30 %

Assumptions - Technical
Target Renewable energy share: ~80%
Example Configuration
•Wind: 7 MW
•PV (fix tilt): 1 MW
•NaS Battery: 3 MW / 18
MWh
(15 years life expectancy)
•Dieselgenerators: 4,2 MW
(existing Diesel as back-up)
•SCADA System and Project Development
Total Investment: ~36 Mio. €

Assumptions - Economic
•Interest (term loan): 5%
•Equity Ratio: 20%
•Equity IRR: 10%
•Project Life time: 20 years
•Fuel Price (2012) 0.65 €/l
•Fuel price Increase Rate: 7%
(based on the past 20 years, see next slide)
•Administration Cost included
•Maintenance Cost included
•Battery exchanged after 12 years
•Exisiting Stuff trained employed for
maintenance of the new equipment

Historic fuel price development
Fuel Price Increase
Statistics
Increase Rate Based
on exponential fit
Geometric Mean
Anual Fuel Price
Increase Rate
from to WORLD AZORES WORLD AZORES
1987 2009 7.5% - 7.0% -
1995 2009 13.7% 10.2% 10.1% 7.9%
World market fuel Price Development 1987 - 2009
0.0
10.0
20.0
30.0
40.0
50.0
60.0
1987 1988 1989 1990 1991 1992 1993 1994 1995 1996 1997 1998 1999 2000 2001 2002 2003 2004 2005 2006 2007 2008 2009
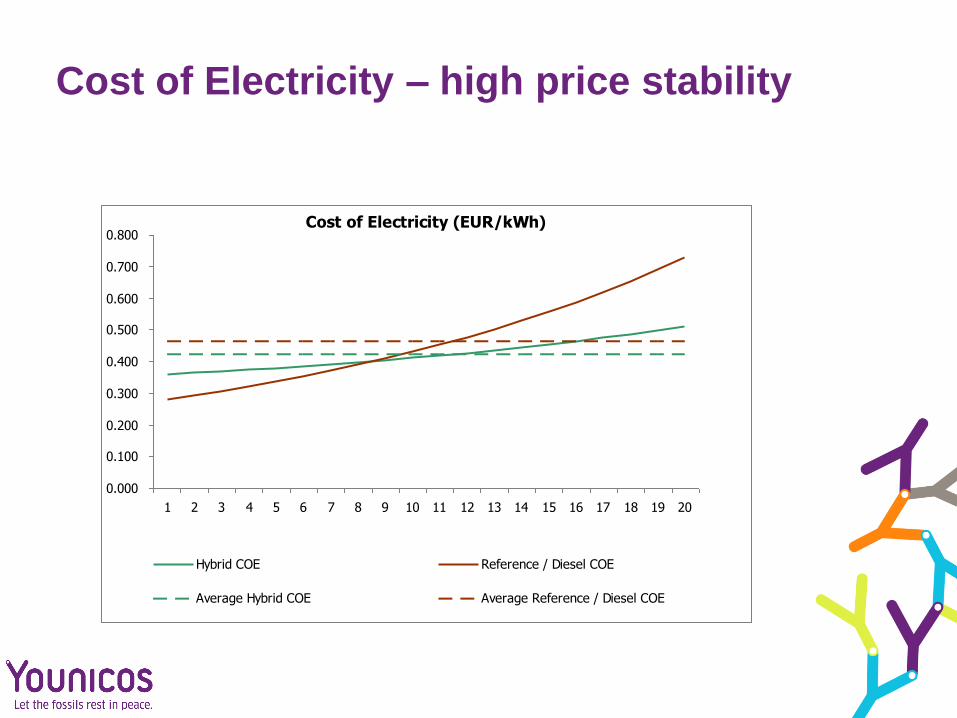
Cost of Electricity – high price stability
Cost of Electricity (EUR/kWh)
0.000
0.100
0.200
0.300
0.400
0.500
0.600
0.700
0.800
1 2 3 4 5 6 7 8 9 10 11 12 13 14 15 16 17 18 19 20
Hybrid COE Reference / Diesel COE
Average Hybrid COE Average Reference / Diesel COE

Challenges to be addressed on the
way towards 100% renewable energy
1. Application of reliable large scale storage solutions for the
compensation of renewable energies
2. Development of fast inverter control schemes to assure the same
stability as provided by conventional rotating generators
3. Assurence of reliable transport of information between the distributed
sources
4. Development of disptach and optimization schemes taking into
account also the new players in the game (cars, smart load,
storage,…)
5. Development of standardized communication interfaces
6. Assure safe grid operation in fault conditions
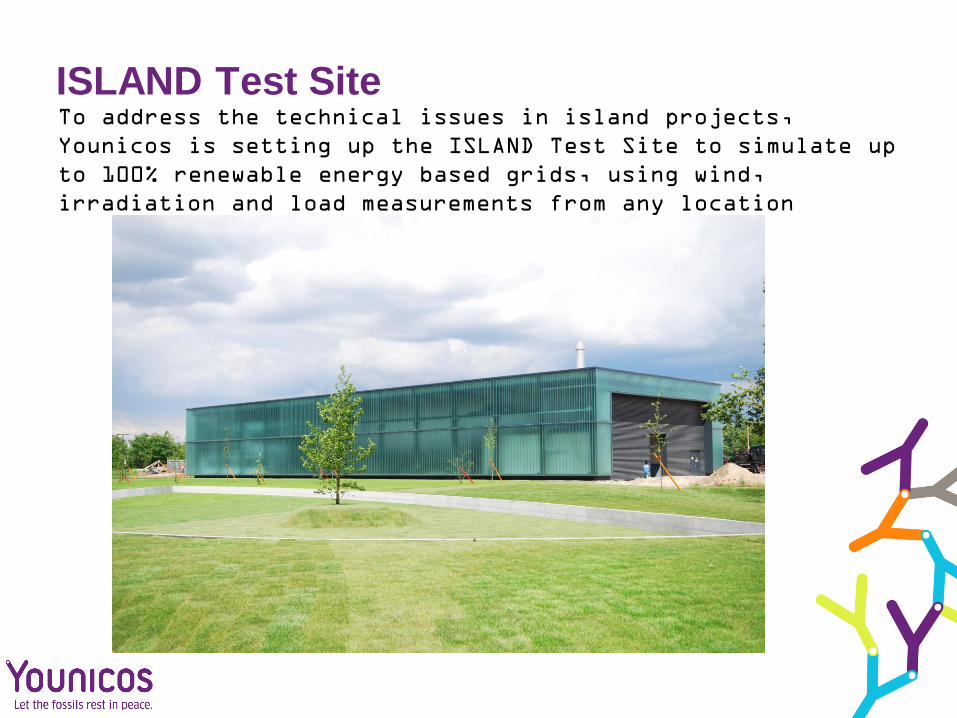
ISLAND Test Site To address the technical issues in island projects,
Younicos is setting up the ISLAND Test Site to simulate up
to 100% renewable energy based grids, using wind,
irradiation and load measurements from any location

Inside View
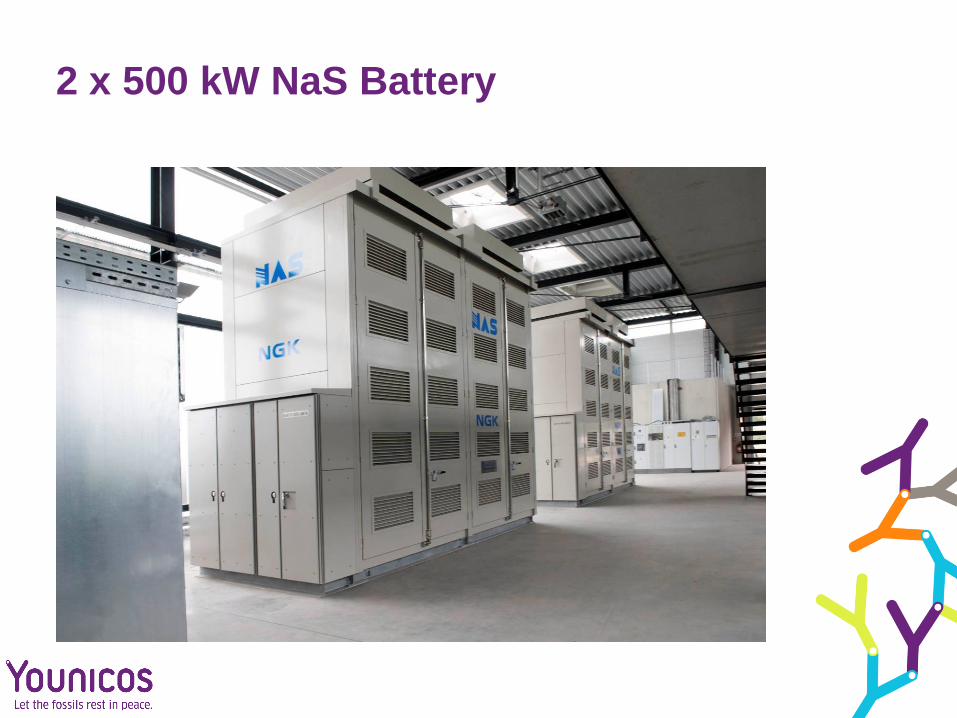
2 x 500 kW NaS Battery

Electrochemistry Cell
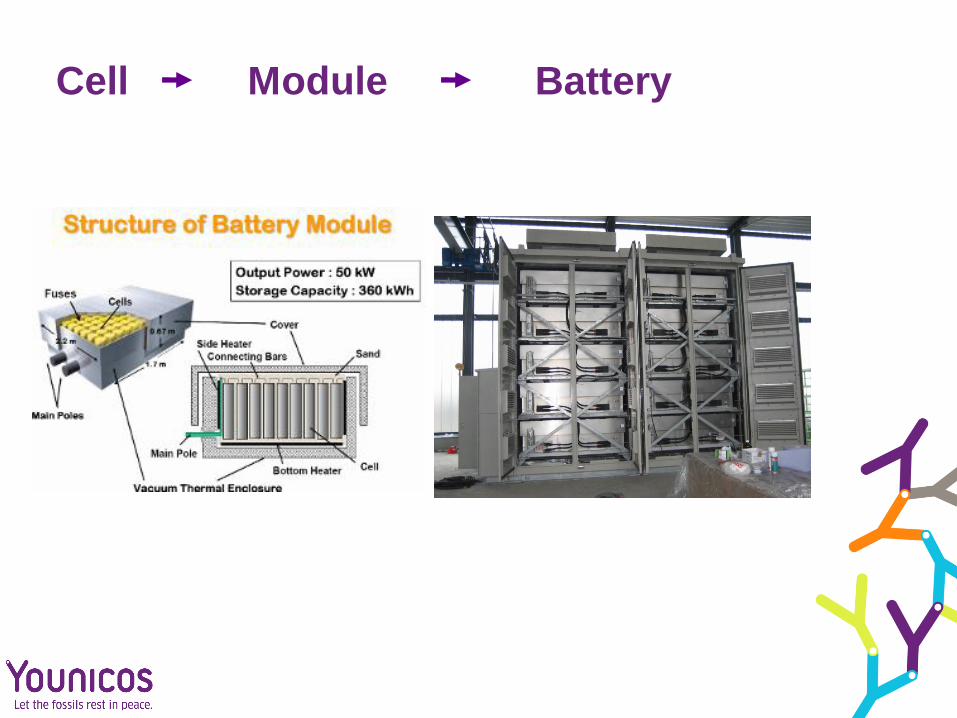
Cell Module Battery

NaS Battery Features
High Energy Density About 3 x that of Lead-Acid
High Capacity Up to 6 Hours continuous
discharging
Long Expected Life Up to15 years, 4500 cycles
High Energy Efficiency 85% DC Efficiency
No Self Discharge
No Memory Effect
Proven Technology 270 MW installation records
Easy Maintenance Inspection every 3 years only
Fast Response 2 ms
Operating Temperature 300 °C

Conventional Market - Reverences

1 MW Diesel Generator

210 kW PV power plant (SOLON SE)

Copyright · Younicos Präsenation Inselteststand · 27. März 2009
Artificial island grid
based on NaS battery
Test
facility
Island Grid Test Site
(Graciosa x 0.3)
=
~
Battery system
~ 1 MW
Load ~ 1 MW
Wind park Simulator ~2 MW
=
~
=
~
10 kV
Backup Diesel
Generator
~ 1 MW G
~
=
PV roof ~ 200
~
=
Solon*
Medium voltage
grid
simulation*
15 kV
Utility

ISLAND Test Site – for tests of grid
stability and security of supply

Prediction based Energy Management
ΔP
time power flow
balance
forecast
t0 t0+ fc t0+ min
power safety
margin ±Pmin
energy safety margin
Pmin=∫Pmin dt
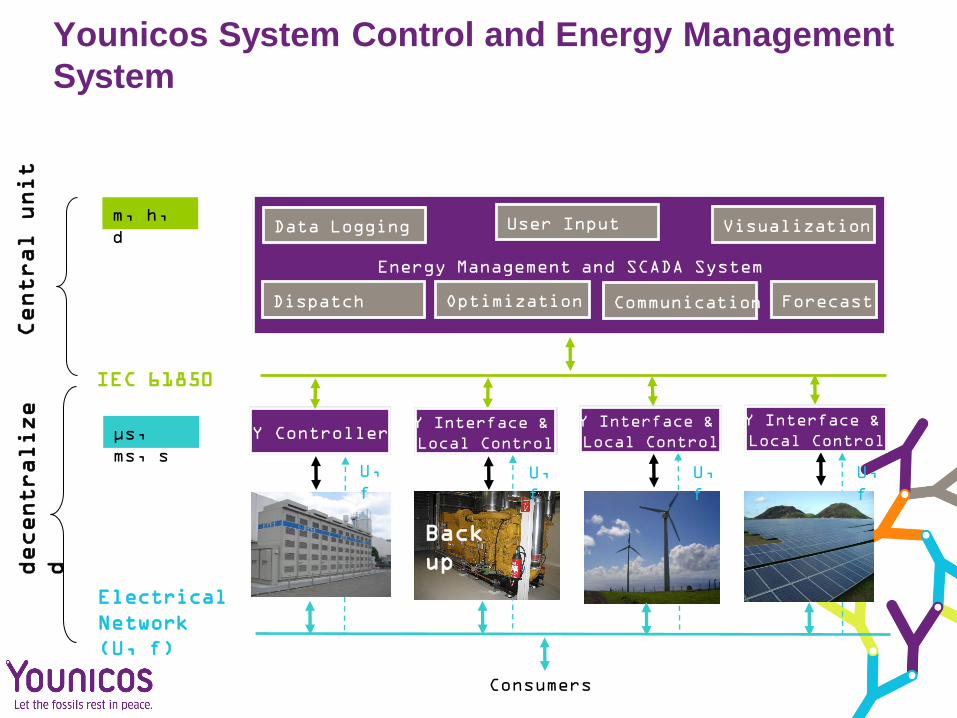
Younicos System Control and Energy Management
System
Energy Management and SCADA System
Communication Forecast Dispatch
Data Logging Visualization
Consumers
User Input
U,
f
U,
f
U,
f
U,
f
Y Controller Y Interface &
Local Control
Y Interface &
Local Control
Y Interface &
Local Control
Back
up
Optimization
Electrical
Network
(U, f)
Central unit
decentralize
d
m, h,
d
µs,
ms, s
IEC 61850

Aktuelles Layout der Energieversorgung
EDA
Diesel Capital remuneration & depreciation costs
EEG
2 x E33
+
2 x E33
(new in 2013)
Customers
ERSE
14.7 GWh
PPA
€/a
2.4
GW
h
„Mainland costs“
12 €Cent/kwh
Cost
Difference
to Mainland
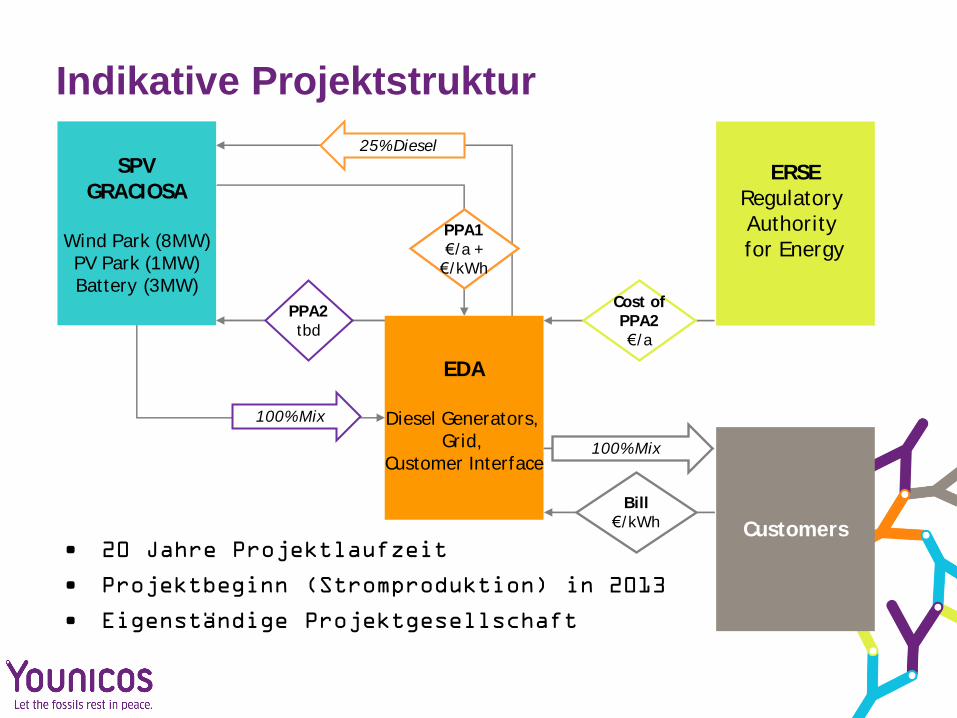
Indikative Projektstruktur
EDA
Diesel Generators,
Grid,
Customer Interface
Customers
Cost of
PPA2
€/a
PPA2
tbd
PPA1
€/a +
€/ kWh
25% Diesel
ERSE
Regulatory
Authority
for Energy
SPV
GRACIOSA
Wind Park (8MW)
PV Park (1MW)
Battery (3MW)
100% Mix
100% Mix
Bill
€/ kWh
• 20 Jahre Projektlaufzeit
• Projektbeginn (Stromproduktion) in 2013
• Eigenständige Projektgesellschaft
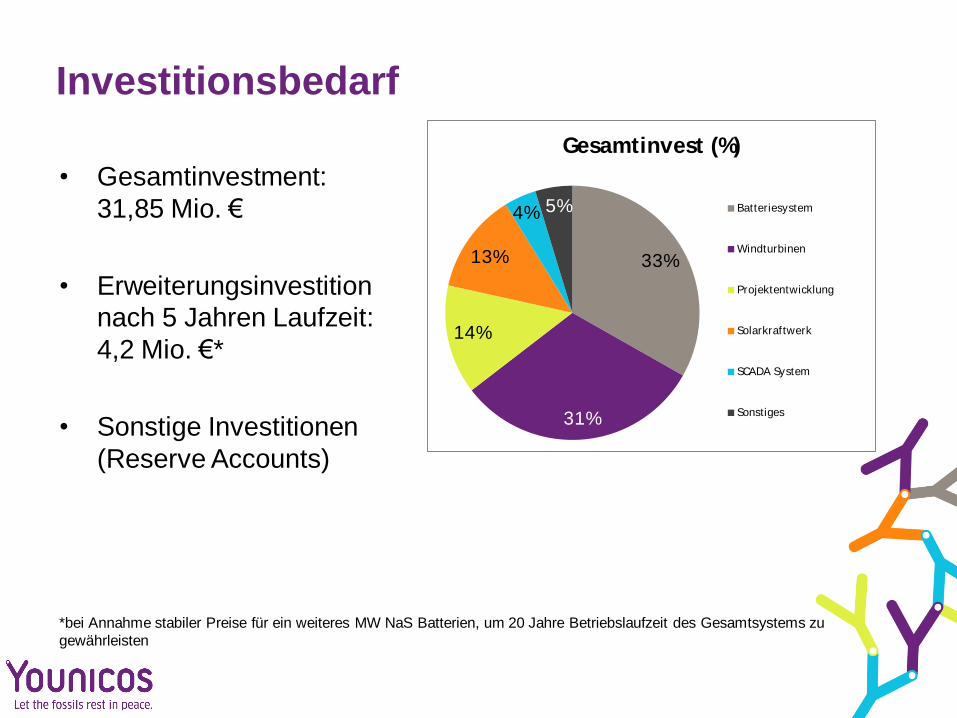
Investitionsbedarf
33%
31%
14%
13%
4% 5%
Gesamtinvest (%)
Batteriesystem
Windturbinen
Projektentwicklung
Solarkraftwerk
SCADA System
Sonstiges
• Gesamtinvestment:
31,85 Mio. €
• Erweiterungsinvestition
nach 5 Jahren Laufzeit:
4,2 Mio. €*
• Sonstige Investitionen
(Reserve Accounts)
*bei Annahme stabiler Preise für ein weiteres MW NaS Batterien, um 20 Jahre Betriebslaufzeit des Gesamtsystems zu
gewährleisten

Profiles used for the Demonstration
(1s resolution)

Expected Results:

Expected Results:

Short Circuit at substation

With proper Dimensioning of the Inverters and fast
Control, the Batteries are capable of Supplying
Enough Short Circuit Power to Substitute the
Convenional Generators
3.5 x
nominal
current

2010 - LOI with EDA (October 20th 2010)
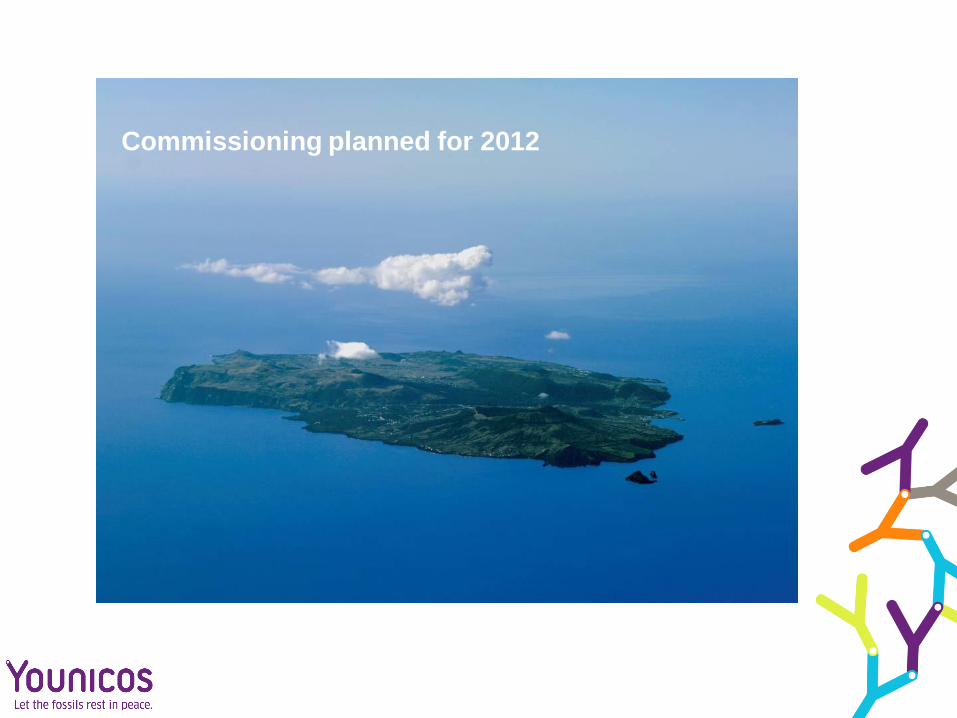
Commissioning planned for 2012

Obrigado!